seawater integrated desalination plant without brine discharge and powered by renewable energy...
TRANSCRIPT
Abstract
doi:10.1016/j.desal.2007. .010 41
7

1. Introduction

2. Proposed desalination system layout


185
Table 1Parametric analysis as a function of the condensation temperature
cond (°C)
cond(bar) (ºC)
Energy cost (kW-h/m3) (W/m2 C) (m2)/(m3/h)
70 0.31 14.54 52.49 2746.70 16.16 68 0.28 12.54 47.46 2558.37 20.12 66 0.26 10.54 42.44 2333.07 26.25 64 0.24 8.54 37.42 2055.83 36.77 62 0.22 6.54 32.39 1702.93 57.96 60 0.20 4.54 27.37 1237.61 114.88 58 0.18 2.54 22.35 624.22 407.07
salt (%) 19.87 boil (ºC) 55.46sat (bar) 0.14
ference has to be fixed at 7ºC, which correspondsto boiling temperatures of approximately 62.5ºC.These temperatures will optimize the operatingcycle for a typical seawater concentration. If thewater concentration rises, the temperature differ-ence will have to be increased. With the valueproposed, the fresh water energy cost associatedis of 33.5kW-h per m3 of fresh water.
It was verified that with reasonable energylosses, the cycle would be energy self-sufficient;the total vapour heat (sensible plus latent heat) atthe compressor outlet is higher than that neededin the evaporation process and to preheat the sea-water input.
In order to study the influence of the recircu-lation in the functioning of the system, a diagramindicating the mass flows of fresh water, brineand dry salt is first shown (Fig. 4).
Concentrations are defined as the mass of saltdivided by the mass of fresh water:
salt
water(1)
Fig. 4. Mass flow diagram.
A recirculating coefficient ( ) is defined bythe following expression:
in 1 2
1 1(2)
where represents the water mass flow whichcirculates in the evaporator divided by , theevaporated water mass flow.
1m

186
As a preliminary assumption, the percentageof salt in the crystallizer is considered to be thatof saturation, since the solid salt which is draggedalong as microcrystals does not affect the follow-ing mathematical formulation. The percentage ofdissolved salt at the evaporator entrance is:
1 1 2 satin
1 2(3)
In the evaporator, when the input mass flowpartially evaporates, in the remaining liquid, anoversaturation occurs that can be estimated by:
11
2
(4)
Substituting in Eqs. (3) and (4) the mass flowterms as a function of the defined recirculatingcoefficient, the following equations are obtained:
in 1 sat1 11 (5)
11
1 (6)
Fig. 5. Influence of on the concentrations.
0
5
10
15
20
25
30
35
40
1 1,5 2 2,5 3 3,5
CR
Xou
t and
^X
out (
%)
Oversaturation
X salt evaporator inlet
When 2 increases (recirculating value), theevaporator concentration also does, increasing theboiling temperature and thereby lowering the en-ergy efficiency. On the other hand, when the re-circulating mass flow is diminished, as mentioned,there is an oversaturation of salt in the liquid (Δ )which flows from the evaporator to the crystal-lizer. This fact is very important in order to pre-vent fouling in the evaporator.
By plotting against out and Δ out (%) (Fig. 5),the system proposed for desalinating seawater hasa wide operating range to reduce the recircula-tion in comparison with real installation valuessince, with a value of 1.1, the correspondingoversaturation would be 35% (real plant workingpoint).
Fig. 6 shows the influence of the recirculatingcoefficient on the condensation temperature. Thecondensation temperature is modified in order toachieve constant thermal differences of 7 and 8ºC,respectively. The condensation temperature is re-duced if the recirculation is also reduced becausethe lesser recirculation lowers the input salinityand therefore the boiling temperature. In terms ofenergy cost, although a constant thermal differ-ence is considered, there is a reduction with therecirculating coefficient decrease.

C. Fernández-López et al. / Desalination 235 (2009) 179–198 187
The condensation temperature diminishes withrecirculation (Fig. 6), because a lower recircula-tion reduces the salinity of the water entering theevaporator and, consequently, the boiling tempera-ture. The energy cost also diminishes with the re-circulation, even though the difference of tempera-tures is kept constant in the evaporator.
Fig. 7 represents the effect on the heat ex-changer size that the recirculating coefficient andcondensation temperature have. When CR rises,the salt concentration in the evaporator also does,therefore the boiling temperature is incremented
Fig. 6. Influence of CR on the condensation temperature.
59606162636465666768
1 1,5 2 2,5 3 3,5
CR
Con
dens
atio
n T
(C)
T=7CT=8C
and thus the temperature difference decreases,causing the reduction of the heat transfer coeffi-cient and increasing the heat exchanger areaneeded as shown in the figure.
This fact has a notable effect at lower conden-sation temperatures. Setting the condensation tem-perature at 59ºC and the recirculating coefficientat 1.1, results in an optimum exchange area of100 m2 per m3/h of fresh water. By increasing therecirculating coefficient to 1.85 the area consid-ered significantly rises to reach a level at which10,000 m2 per m3/h of fresh water are needed.
Fig. 7. Evaporator area vs. Tcond and CR.
10
100
1000
10000
56 58 60 62 64 66 68 70 72
T cond (C)
Evap
orat
or A
rea
(m2)
/(m3/
h) CR: 2.2 CR:1.85CR:1.5 CR:1.1

188 C. Fernández-López et al. / Desalination 235 (2009) 179–198
2.1.3. Design operating point
The parametric analysis performed allows theselection of the design operating point that has tobe defined taking into account the following fac-tors:• The MVC energy cost must be minimized,
which means the choice of the lowest thermaldifference working conditions by adjusting anadequate condensation temperature.
• A realistic heat-transfer area must be obtained.The heat to be exchanged is fixed by the evapo-rated water flow, which is decreased by meansof reducing the thermal difference and as a con-sequence the heat transfer coefficient dimin-ishes, and thus an increase in the size of theexchanger is needed.
• Furthermore, the boiling temperatures shouldbe fixed at under 60ºC to prevent corrosionand/or fouling.
• The selection is also based on real operatingconditions from the Jumilla plant. Special at-tention has to be paid to the flow characteris-tics inside the pipes of the exchanger.
The main working parameters are summarized:• Evaporation mass flow: 27.0 kg/s• Heat exchanger mass flow: 31.7 kg/s• Recirculating coefficient (CR): 1.1• Evaporator salt concentration: Xsal = 6.7%• Evaporation conditions: Tboil = 52.5ºC
Pboil = 0.14 bar• Condensation conditions: Tcond = 60.6ºC
Pcond = 0.27 bar• Thermal difference: ΔT = 8ºC• Fresh water energy cost: 30.4 kWh/m2
• Heat exchanger specific area: 50 m2/(m3/h)
2.2. MED system integration as a first step to MVC
The MED plant, while producing fresh water,also gives rise to brine, which enters the MVCcycle with a higher salt concentration than that ofseawater. This change of salinity causes a modi-fication of the thermal difference or induces a
variation of the condensation temperature. Somecalculations have been made in which the con-densation temperature has been modified in sucha way that a thermal difference of 8ºC was al-ways maintained. The recirculation was also modi-fied so that oversaturation was kept constant atthe evaporator exit.
The standard MED model has been developedunder the following assumptions: [13]• MED unit is composed of fourteen effects con-
nected in series,• Distillate product is salt free, heat and mass
losses in the vacuum system are neglected,• Vapour and liquid phase temperature in the
evaporator are related by using the boilingpoint elevation correlations,
• Heat losses are neglected because of insula-tion and relatively low-temperature operation,
• Perfect mixing for water and vapour stream,• Specic heat at constant pressure is tempera-
ture dependent only.
Basic data given by the PSA SOL Project havebeen used to develop the thermodynamic model.The associated PR (performance ratio) was over 9.
If the MED is considered as the first step orpreliminary phase for the complete desalinationat the MVC system, the question would be to findout whether it is better to pass the seawater flowthrough the MED, obtaining the maximum freshwater and producing a brine with the maximumconcentration, or whether it would be better topass through the MED only a part of the flow andmix the brine obtained with the rest of the flow toreduce the concentration entering the MVC.
The water production in each subsystem, itsenergy consumption and the inlet MVC salt con-centration can be found in Table 2 depending onthe percentage of seawater input, mass flow en-tering the MED system.
In the previous table the consumptions are ac-counted for every m3 produced in the whole sys-tem. For this reason, the electrical consumptionper m3 of produced water diminishes to 33% when

C. Fernández-López et al. / Desalination 235 (2009) 179–198 189
Table 2MVC + MED behaviour for different flow values at the MED entrance
MED% volume
MVC production (m3/h)
MED production (m3/h)
Electrical consumption (kW)
Thermal consumption (kW)
% TC MVC Xsalt inlet
0.00 100.00 0.00 3031.18 0.00 0.00 3.50 20.00 92.47 7.50 2821.68 473.00 14.36 3.92 40.00 85.00 15.00 2595.59 945.00 26.69 4.34 60.00 77.49 22.50 2381.61 1418.00 37.32 4.76 80.00 69.98 30.00 2164.44 1890.00 46.62 5.18
100.00 62.50 37.50 1944.19 2362.00 54.85 5.60
100% of the original flow passes through the MEDcycle. In the same table it can also be seen howan increased flow in the MED system increasesthe salinity.
3. Energy supply with renewable energies
3.1. Thermal energy supply with solar collectors
The object of this section is to discuss the pre-liminary design of a solar installation that is ca-pable of providing the thermal energy demandedby the MED plant.
The energy demand for completely desalinat-ing 100 m3/h of seawater has been calculated at2,362 kW of thermal power. Considering that theinstallation would work continuously for 24 h/d,the annual energy demand would rise to a total of74,488,032 MJ/y (20,691,120 kWh/y).
The layout of the installation is shown in Fig. 8.This system has to provide 100 m3/h seawater
at 67ºC to be operational. To achieve this, seawa-ter which has been warmed to 49ºC as coolingfluid in the MED steps is further heated in theexchanger by heat transfer from another watercircuit that has been warmed by the solar collec-tor and stored in the accumulator tank.
As solar irradiation is discontinuous, the solarpower to be captured during the hours of maxi-mum solar irradiation will exceed the require-ments of the plant. The excess of thermal energy
will remain stored in the accumulator tank for lateruse in hours when solar irradiation drops. Addi-tionally, provided that the desalination plant hasto work in a continuous regime, and in order toforesee the shortage or absence of solar irradia-tion, a back-up system able to guarantee the op-erational needs (100 m3/h — 67ºC) is included.
The number of collectors to be installed willdepend on the type of collector, especially theperformance curve, and on the geographical zone(i.e. the average solar power available in thatzone).
The installation will be located in Murcia(Spain) and all the data refers to Murcia. In Table 3,the average daily irradiation is shown and alsothe data are corrected by the coefficients k1 andk2, which take into account the clarity of the skyand the lack of perpendicularity of the sunrays inrelation to the solar collector, respectively.
To estimate the solar collector needed, a studybased on the collector performance was carriedout. Three different models were studied. Due tothe variability of the disposable energy in sum-mer and winter conditions a monthly energy cal-culation is required.
There are two different criteria for estimatingthe area of the solar collectors:• Maximum surface (so that the energy needed
is covered even in December, the month withleast disposable energy).

190 C. Fernández-López et al. / Desalination 235 (2009) 179–198
• Average surface (so that average disposableenergy is covered. In the corresponding monthswith lower energy than the average, a gas boilerwill supply the extra need). This solution wasconsidered in the thermoeconomic analysisperformed.
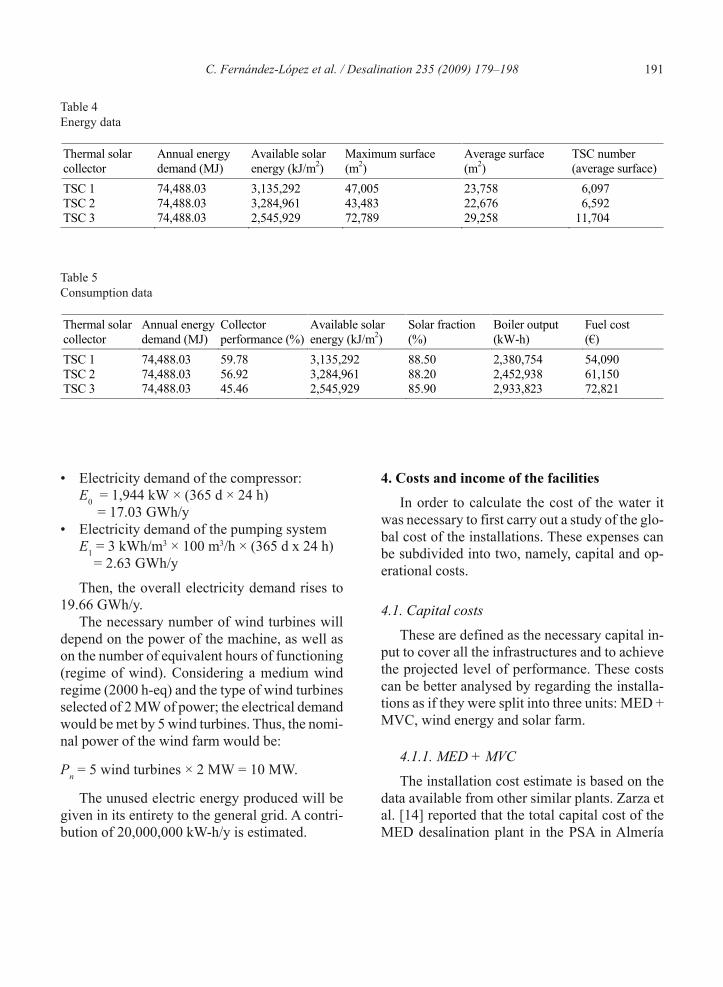
In Table 4, the energy demanded, the energyobtained by the TSC, the maximum area obtained(criteria 1), the average area (criteria 2) and thefinal number of collectors are shown. In Table 5,the boiler outputs are calculated and the associ-ated costs of the fuel.
Fig. 8. Layout of the solar installation.
100 m3/h49 C
100 m3/h67 C
Auxiliary system
Solar accumulator
ExchangerSolar collector
100 m3/h49 C
100 m3/h67 C
Auxiliary system
Solar accumulator
ExchangerSolar collector
Table 3Solar data referred to Murcia (Spain)
Months H(kJ/m2)
k2 E= k1·k2·H(kJ/m2)
Number of solar hours
Average irradiation (W/m2)
January 10,100 1.33 11,995.67 7.0 476.02 February 14,800 1.24 16,388.34 7.5 606.98 March 16,600 1.14 16,899.13 8.5 552.26 April 20,400 1.03 18,763.72 10.0 521.21 May 24,200 0.96 20,746.18 11.0 523.89 June 25,600 0.93 21,260.54 11.5 513.54 July 27,700 0.96 23,746.66 11.5 573.59 August 23,500 1.04 21,824.92 10.5 577.38 September 18,600 1.17 19,433.47 9.0 599.80 October 13,900 1.32 16,384.76 8.0 568.92 November 9,800 1.42 12,426.99 7.0 493.13 December 8,100 1.41 10,198.95 6.5 435.85
3.2. Electrical supply with wind energy
The electricity consumption in the MVC sys-tem, which is calculated at 1,944 kW, would haveto be completely provided by the wind installa-tion. For the rest of the plant, namely the pump-ing system, the solar plant and the desalinationstation, the wind-generated energy needed topump a cubic meter of fresh water is estimated tobe 3 kWh. Thus, the minimal energy productionof the wind farm to cover the annual electricitydemand of the desalination plant would be:
E = electrical power × working time (7)
C. Fernández-López et al. / Desalination 235 (2009) 179–198 191
Table 4Energy data
Thermal solar collector
Annual energy demand (MJ)
Available solar energy (kJ/m2)
Maximum surface (m2)
Average surface (m2)
TSC number (average surface)
TSC 1 74,488.03 3,135,292 47,005 23,758 6,097 TSC 2 74,488.03 3,284,961 43,483 22,676 6,592 TSC 3 74,488.03 2,545,929 72,789 29,258 11,704
Table 5Consumption data
Thermal solar collector
Annual energy demand (MJ)
Collector performance (%)
Available solar energy (kJ/m2)
Solar fraction (%)
Boiler output (kW-h)
Fuel cost (€)
TSC 1 74,488.03 59.78 3,135,292 88.50 2,380,754 54,090 TSC 2 74,488.03 56.92 3,284,961 88.20 2,452,938 61,150 TSC 3 74,488.03 45.46 2,545,929 85.90 2,933,823 72,821
• Electricity demand of the compressor:E0 = 1,944 kW × (365 d × 24 h) = 17.03 GWh/y
• Electricity demand of the pumping systemE1 = 3 kWh/m3 × 100 m3/h × (365 d x 24 h) = 2.63 GWh/y
Then, the overall electricity demand rises to19.66 GWh/y.
The necessary number of wind turbines willdepend on the power of the machine, as well ason the number of equivalent hours of functioning(regime of wind). Considering a medium windregime (2000 h-eq) and the type of wind turbinesselected of 2 MW of power; the electrical demandwould be met by 5 wind turbines. Thus, the nomi-nal power of the wind farm would be:
Pn = 5 wind turbines × 2 MW = 10 MW.
The unused electric energy produced will begiven in its entirety to the general grid. A contri-bution of 20,000,000 kW-h/y is estimated.
4. Costs and income of the facilities
In order to calculate the cost of the water itwas necessary to first carry out a study of the glo-bal cost of the installations. These expenses canbe subdivided into two, namely, capital and op-erational costs.
4.1. Capital costs
These are defined as the necessary capital in-put to cover all the infrastructures and to achievethe projected level of performance. These costscan be better analysed by regarding the installa-tions as if they were split into three units: MED +MVC, wind energy and solar farm.
4.1.1. MED + MVC
The installation cost estimate is based on thedata available from other similar plants. Zarza etal. [14] reported that the total capital cost of theMED desalination plant in the PSA in Almería

192 C. Fernández-López et al. / Desalination 235 (2009) 179–198
was ca. 1,000,000 €. This figure was scaled toour dimensions.
The MVC system cost information given di-rectly to us by the company Jumsal SA, whichexploits the salt mine in Jumilla, has been in-creased by 50% to adapt these cost appraisals toour particular case, which would run with a big-ger MVC machine.
The data available from IDE TechnologiesLtd., a pioneer and world leader in the delivery ofsophisticated water solutions in Israel, concludedthat the total capital investment for MED plantsdesigned for production levels of 14,400 and25,000 m3/d were 14,486,000 and 22,100,000USD respectively. [15]
Using the information provided by the afore-mentioned companies the economic balance in-cluded in the Annexe I has been calculated. Tak-ing into consideration all these data, the invest-ment costs for the MED + MVC plant proposedrise to 4,500,000 €.
4.1.2. Wind farm
Essentially, these costs consist of the purchaseof the wind turbines, this accounting for 71% ofthe total investment cost. An estimate of capitalcost for a wind farm developing 10,000 kW ofwind potential is shown in Annexe II [16].
4.1.3. Solar farm
The cost per solar collector unit ranges between1,200–1,800 € (300–450 €/m2) depending on thecollector type. The average cost for an evacuatedtube collector is between 2.30–3.10 €/Wt includ-ing installation, as shown in detail in Annexe III[17].
4.2. Operation costs
These other expenses derive from the opera-tional regime of the plant. These include staffcosts, maintenance costs, consumables costs andenergy costs.
4.2.1. Staff costs
The plant staff would consist of a managerialboard, operational staff and maintenance staff. Foran optimal plant operating regime, three workshifts for the operational and maintenance staffwould have to be considered.
4.2.2. Maintenance costs
These would include repairs and installationupkeep, and maintenance-related materials (i.e.lubricants and spares). The maintenance costs areassumed to vary during the installation workinglife, due to that fact, the averaged annual amountsare considered here. In the first years, the mainte-nance costs will be at their lowest, but are ex-pected to gradually rise due to breakdowns. Themedium annual maintenance cost of the MED +MVC system is estimated as 2% of the total valueof the investment of the unit. As to the solar plantand the wind farm, the medium annual mainte-nance costs are respectively envisaged to be 3%and 4% of the total value of the unit investment.These costs are expected to increase due to theinflation rate.
4.2.3. Consumables costs
These are the costs incurred in buying allchemicals to be used in the desalination process,particularly in the conditioning of seawater andfresh water. Essentially, these chemicals are: dis-infectants, coagulants, flocculants and pH-control-lers. The needed amounts of these chemicals willdepend on the magnitude of the fresh waterthroughput.
4.2.4. Energy cost
The current analysis is based on the followingpremises and assumptions. One is that regulationsof the electricity rates in Spain allow differenttypes of contracting so that costs can be mini-mized. The present calculations are based on tar-iff 3.3, way 2, and type 4 of the electricity power

C. Fernández-López et al. / Desalination 235 (2009) 179–198 193
tariff system. The calculated price for kW, in-stalled and contracted, and for a functioning re-gime of 8,760 h/y, is of 5.26 cent €/kWh.
The energy cost associated to the boiler in-stalled in the solar farm to guarantee the supplyof energy in the months of low solar radiation is50,090 €, raising the total energy cost for the in-stallation to 1,088,048 €.
In order to consider all the above-mentionedfactors, a summary of the global costs incurredfor the installation of the plant is shown in Table 6.
4.3. Energy and salt sale incomes
Calculations of benefits as a result of the saleof salt and energy are made according to the stipu-lations of the “Real Decreto” (RD, Royal Decree)436/2004 of March 12. It is stated that the remu-neration that the producers will obtain in exchangefor transferring electric power to the grid fromfacilities of production and under a special regimewill be:
P = Pm + B ± EP (8)
where P — payment in €/kW; Pm — market priceas specified in Article 24 of the RD 436/2004; B— bonus; is a percentage of the average electrictariff or of the reference. The values of this willbe fixed depending on the group and subgroup towhich the installation belongs. EP — extra pay-ment, or a complement for reactive energy whichis applied to the sum of Pm and B, and is fixed asa percentage of the reference electric tariff.
Table 6Summary of the global costs for the installation of the plant
Operating costs Subsystems Capital costs Staff Maintenance Consumables Energy Total (€/y)
MED+CMV 4,500,000 191,685.83 90,000.00 56,940.00 1,033,958.00 1,372,583.83 Solar 6,105,770 95,842.91 183,173.10 0.00 54,090.00 333,106.01 Wind 9,930,000 95,842.91 397,200.00 0.00 0.00 493,042.91 Total 20,535,770 383,371.65 670,373.10 56,940.00 1,088,048.00 2,198,732.75
The electric tariffs for 2006 are establishedaccording to the “Real Decreto” RD 1556/2005of December 23. This decree also establishes therated increment of the reference electric tariff forthe sale of electricity during 2006. This incrementwas set at 4.48 % of the tariff that had come intoeffect on January 1st, 2005. In summary, the ref-erence average electricity tariff for 2006 is7.66 cent €/kW.
The production of salt in the desalination plantis calculated at 0.987 kg/s. If a commercial priceof salt of 0.04 €/kg is considered, an annual in-come for the sale of the salt of 1,233,700 € willbe obtained. The above mentioned price of salthas been calculated by averaging the referredprices of several producers.
The general methodology for estimating thecost of the produced fresh water, after the studyof the initial investment and the annual costs, isbased on capitalizing at a certain interest rate (4%)the payments made during the investment. Capi-talization would last for a period equal to that ofthe operating system-life. For the calculation ofthe amortization quota, a general equation of fi-nancial amortization is used.
1
1 1
t
t
i ia I
i(9)
where I — capital investment; t — number ofyears of useful life of the investment (20 y); i —interest rate (4%).

194 C. Fernández-López et al. / Desalination 235 (2009) 179–198
The total water cost is calculated by means ofthe expression:
Total water cost (m3) = (FC + OC)/(Q × t) (10)
where FC — financial cost; OC — operation cost;Q × t — annual water production; 365 d × 24 h ×100 m3/h = 876,000 m3/y.
The water cost without any fee would be4.22 €/m3. If income from the sale of salt and en-ergy is included, the total cost of water is 0.59 €/m3
(Table 7).The Order of September 26, 2006, of the Min-
istry of Industry and Environment must also betaken into account. By that order, the legal basesfor subsidies for the execution and exploitationof projects related to sustainable energy manage-ment in rural and urban areas are regulated. Ar-ticle 7 of this order states that the variable-quan-tity subsidies for each project cannot exceed 37%of the cost of investment.
Considering a 35% subsidy, the cost of waterwithout any fee would be of 4.04 €/m3, whereasthe total cost including fees from the sale of saltand wind power is only 0.41 €/m3. This is in agree-ment with previous data reported by Reddy andGhaffour, who estimated the unit water cost ofMED plants as 0.55–0.7 [18] (Table 8).
5. Conclusions
In this study a high-throughput seawater de-salination plant is described. The design is basedon the feasible combination of a solar-driven,multi-effect distillation seawater plant and the fi-nal separation of salt and water by mechanicalcompression of the vapour. The environmentalinterest of this plant should be emphasized, as theMCV step is powered by wind-generated elec-tricity and no brine is discharged into the sea.
The system proposed is designed to produceup to 100 m3/h of fresh water in which the salt iscompletely separated. Water is produced with anenergy consumption estimated at 2,362 kWt-h and1,944 kWe-h, which is higher than other more
Table 7Total water cost (k€)
Initial capital cost (k€) 20,536 Amortization (k€/y) 1,499 Operating costs (k€/y) 2,199 Staff 383 Maintenance 670 Consumables 57 Energy 1,088 Total amortization +operation costs (k€) 3,698 Total water cost (€/m3) (excluding incomes)
4.22
Incomes (k€/y) Salt 1,234 Energy 1,946 Clear balance costs and incomes (k€) 518 Total water cost (€/m3) (with incomes) 0.59
Table 8Total water cost considering a 35% subsidy (k€)
Initial capital cost (k€) 18,399 Amortization (k€/y) 1,343 Operating costs (k€/y) 2,199 Staff 383 Maintenance 670 Consumables 57 Energy 1,088 Total amortization + operating costs (k€) 3,542 Total water cost (€/m3) (excluding incomes)
4.04
Incomes (k€/y) Salt 1,234 Energy 1,946 Clear balance costs and incomes (k€) 362 Total water cost (€/m3) (with incomes) 0.41
conventional desalination systems which arebased on reverse osmosis (RO). Nevertheless, thehigh energy input demanded by the MVC stepcan be partially compensated by the economicprofits from selling the dry salt resulting from thisprocess and the electricity generated by the windturbines. Additionally, resorting to sources of re-newable energy reduces the cost of exploitation

C. Fernández-López et al. / Desalination 235 (2009) 179–198 195
and allows one to take advantage of subsidies re-lating to the use of these technologies.
In summary, the total cost per m3 of desaltedwater is calculated at 0.59 €, but if a 35% subsidyfor the initial investment is also considered, thefinal price drops to 0.41 €.
Abbreviations
RES — Renewable energy systemsMED — Multi-effect distillationMVC — Mechanical vapour compressionRO — Reverse osmosisMSF — Multistage flashVC — Vapour compressionPSA — Almería solar platformWT — Wind turbinesTSC — Thermal solar collectorpsu — Practical salinity units
References[1] A.J. Morton, I.K. Callister and N.M. Wade, Envi-
ronmental impacts of seawater distillation and re-verse osmosis processes. Desalination, 108 (1997)1–10.
[2] R. Einav, K. Harussi and D. Perry, The footprint ofthe desalination processes on the environment. De-salination, 152 (2003) 141–154.
[3] M. Latorre, Environmental impact of brine disposalon Posidonia seagrasses. Desalination, 182 (2005)517–524.
[4] J.L. Buceta, Y. Fernández-Torquemada, E. García,O. Invers, J. Mas, J. Romero, J.M. Ruiz, A. Ruiz-Mateo, S.C. Sabah Mazzetta and J.L. Sánchez-Lizaso, Estudio de los efectos de incrementos desalinidad sobre la fanerogama marina PosidoniaOceanica y su ecosistema, con el fin de prever yminimizar los impactos que pudieran causar losvertidos de aguas de rechazo de plantas desaladoras.Ingenieria Civil, 132 (2003).
[5] S.A. Kalogirou, Seawater desalination using renew-
able energy sources. Progress Energy CombustionSci., 31(3) (2005) 242–281.
[6] S. Ebrahim, M. Abdel-Jawad, S. Bou-Hamad andM. Safar, Fifteen years of R&D program in seawa-ter desalination at KISR. Part I. Pretreatment tech-nologies for RO systems. Desalination, 135 (2001)141–153.
[7] O. Miyatake, Y. Koito, K. Tagawa and Y. Maruta,Transient characteristics and performance of a noveldesalination system based on heat storage and sprayflashing. Desalination, 137 (2001) 157–166.
[8] J.I. Ajona, ACE-20 Spanish parabolic trough col-lector. Proc. 6th International Symposium on SolarThermal Concentrating Technologies, Ministerio deIndustria y Energía, CIEMAT, Madrid, September28–October 2, 1992, vol. I.
[9] A. Hanafi, Desalination using renewable energysources. Desalination, 97 (1994) 339–352.
[10] A. Karameldin, A. Lotfy and S. Mekhemar, The RedSea area wind-driven mechanical vapor compres-sion desalination system. Desalination, 153 (2003)47–53.
[11] E. Zarza, Solar Thermal Desalination Project. FirstPhase Results and Second Phase Description.Ciemat, Madrid, 1991.
[12] M.A.R. Eisa, R. Best and F.A. Holland, Open andclosed-cycle mechanical vapour-compression heat-pump assisted sea-water purification systems. Appl.Energy, 27(3) (1987) 203–228.
[13] T. Rensonnet, Simulation and thermoeconomicanalysis of a combined power and desalination plant.Diploma thesis, University of Zaragoza, 2004.
[14] E. Zarza, Solar Thermal Desalination Project. PhaseII Results and Final Project Report Description.Ciemat, Madrid, 1995.
[15] A. Ophir and A. Gendel, High performance MEDplants. 8th IDS Annual Conference, 2006, Haifa,Israel.
[16] J.M. Escudero López, Manual de energía eólica.Mundi-Prensa, 2004.
[17] J.P. Delgado Marín, A.S.J. Energía solar térmica,ARGEM, 2002.
[18] K.V. Reddy and N. Ghaffour, Overview of the costof desalinated water and costing methodologies.Desalination, 205 (2007) 340–353.

196 C. Fernández-López et al. / Desalination 235 (2009) 179–198
Annexe I
MED +MVC (costs and investments)
Phases Specific cost / investment × €/m3
Total cost / investment × €
Percentage (%)
Location study Preliminary analysis 0.01 4,500 0.10 Site location 0.01 9,000 0.20 Measurements and other analyses 0.05 42,750 0.95 Total 0.06 56,250 1.25 Project promotion Projects 0.13 112,500 2.50 Environmental study 0.01 4,500 0.10 Other studies 0.01 4,500 0.10 Follow-up and management 0.03 22,500 0.50 Total 0.16 144,000 3.20 Licenses, taxes and permits 0.10 90,000 2.00 Construction Regulation reservoirs 0.10 90,000 2.00 Compressors 0.82 720,000 16.00 Plates exchanger 0.69 607,000 13.49 Centrifuge and exchanger 0.49 425,500 9.46 MED system 1.71 1,500,000 33.33 Measuring instrumentation 0.21 180,000 4.00 Piping, valves and fittings 0.26 225,000 5.00 Seawater collection 0.15 135,000 3.00 Civil engineering 0.35 304,650 6.77 Total 4.78 4,187,150 93.05 Control engineering 0.03 22,500 0.50 Total phases 5.14 4,500,000 100.00 Maintenance (2%) 90,000

C. Fernández-López et al. / Desalination 235 (2009) 179–198 197
Annexe II
Wind farm (costs and investments)Nominal electric power: 10000 kW (medium wind regime)
Phases Specific cost / investment × €/m3
Total cost / investment × €
Percentage (%)
Location study Preliminary analysis 1 10,000 0.10 Site location 2 20,000 0.20 Measurements and other analyses 12 120,000 1.21 Total 15 150,000 1.51 Project promotion Projects 24 240,000 2.42 Environmental study 1 10,000 0.10 Other studies 1 10,000 0.10 Follow-up and management 10 100,000 1.01 Total 36 360,000 3.63 Licenses, taxes and permits 2 20,000 0.20 Construction Wind turbines 700 7,000,000 70.49 Wind farm electrical infrastructure 70 700,000 7.05 Grid connection electrical infrastructure 80 800,000 8.06 Civil engineering 85 850,000 8.56 Total 935 9,350,000 94.16 Control engineering 5 50,000 0.50 Total phases 993 9,930,000 100.00 Maintenance (3%) 397,200

198 C. Fernández-López et al. / Desalination 235 (2009) 179–198
Annexe III
Solar farm (costs and investments)Thermal power: 2362 kW
Phases Specific cost / investment × €/m3
Total cost / investment × €
Percentage (%)
Location study Preliminary analysis 2 4,724 0.08 Site location 10 23,620 0.39 Measurements and other analyses 20 47,240 0.77 Total 32 75,584 1.24 Project promotion Projects 50 118,100 1.93 Environmental study 2 4,724 0.08 Other studies 1 2,362 0.04 Follow-up and management 10 23,620 0.39 Total 63 148,806 2.44 Licenses, taxes and permits 5 11,810 0.19 Construction Captation and accumulation systems 1800 4,251,600 69.63 Exchangers, pumps and expansion vessel 400 944,800 15.47 Piping, valves and fittings 70 165,340 2.71 Measuring instrumentation 10 23,620 0.39 Civil engineering 200 472,400 7.74 Total 2480 5,857,760 95.94 Control engineering 5 11,810 0.19 Total phases 2585 6,105,770 100.00 Maintenance (2%) 78 183,173