seasonal variations in diurnal concentrations of trace elements in atmospheric aerosols in chicago
TRANSCRIPT
Analytica Chimica Acta 496 (2003) 315–323
Seasonal variations in diurnal concentrations oftrace elements in atmospheric aerosols in Chicago
Martina Schmeling∗Department of Chemistry, Loyola University Chicago, 6525 North Sheridan Rd, Chicago, IL 60626, USA
Received 12 November 2002; accepted 12 November 2002
Abstract
Atmospheric aerosols are solid or liquid particles dissolved in air, which can change their chemical composition frequentlydepending on various parameters such as wind speed and direction. In this study, diurnal atmospheric aerosol filter samples,taken at Loyola University Chicago’s Air Monitoring Station, are discussed with respect to variations in trace elementalcomposition at different seasons. The samples collected, were digested in a microwave oven and analyzed by total reflectionX-ray fluorescence (TXRF) spectrometry. To aid interpretation of the samples, meteorological parameters were recorded andback trajectory analysis was employed. Four days, based on average meteorological conditions, were selected for each seasonas example to obtain preliminary insight into trace elemental variations. The results indicate that elemental concentrationsvary during seasons and depend on major wind patterns (speed and direction). The differences were most pronounced insummer, where most elemental concentrations were found to be lowest of all seasons due to onshore (east) wind from LakeMichigan, depriving the air parcel of larger particles by deposition into the lake. In spring and fall the elemental concentrationsdetermined were much higher, which can be attributed to the prevailing and often stronger westerly winds and associatedhigher particle freight. In winter the situation can be described as intermediate between summer and spring/fall with moderateelemental concentrations due to weaker winds and less stable wind directions.© 2003 Elsevier B.V. All rights reserved.
Keywords: Atmospheric aerosols; TXRF; High temporal resolution
1. Introduction
Atmospheric aerosols are solid or liquid particlesdissolved in air and important contributors to the earthclimate by scattering and absorption of sunlight as wellas acting as cloud condensation nuclei in the forma-tion of clouds[1,2]. Their chemical composition playsa major role with respect to their climate effect andalters fast and frequent due to new particle formation,scavenging of particles, chemical reactions and/or re-moval by deposition[1,2]. In addition, the chemical
∗ Fax: +1-773-508-3086.E-mail address: [email protected] (M. Schmeling).
composition provides valuable information about ori-gin and fate of the aerosol and its adjoining air massor air parcel[3,4]. The presence of certain elementalspecies in an air parcel can be attributed to specificsources[5,6]. High amounts of Al, Fe and Ca, for in-stance, suggests a source in an exposed soil area or atravel path across such region. S, Cr, Ni and Pb, onthe other hand, are typical tracers for anthropogenicactivities like metal processing and fuel combustionand indicate urban and/or industrial sources.
Whereas trace gases are routinely monitored on aminute or even shorter time scale[7,8], most of thestate-of-the-art analytical measurements on trace met-als in aerosols require collection times of at least
0003-2670/$ – see front matter © 2003 Elsevier B.V. All rights reserved.doi:10.1016/j.aca.2002.11.001
316 M. Schmeling / Analytica Chimica Acta 496 (2003) 315–323
6–12 h, most often even more than 24 h, to gain ma-terial sufficient for a subsequent quantitative analy-sis [9–11]. Such long sampling periods, however, donot capture variations in elemental composition andconcentrations associated with rapid changes in me-teorological conditions (wind speed, wind direction,temperature etc.). These changes often happen on anhourly or even faster time scale and influence transportpatterns of air masses, air pollution inventories, andthe contribution and strength of aerosol sources in adefined region. It is therefore important to develop andapply procedures permitting short sampling times, butstill meeting analytical instrumentation requirementsand providing reliable results with respect to elemen-tal composition of aerosol samples. Presently, only afew studies can be found in the literature that dealtwith short-term aerosol collection of less than 1 dayand also discuss the results in an environmental con-text [9,11]. Most of these studies, however, are dedi-cated to short field campaigns and do not monitor anddiscuss longer term or seasonal trends in a selectedregion[12,13].
The intention of the study presented here was toobtain information about diurnal changes in chemi-cal composition of atmospheric aerosols at differentseasons. The results are an extension of a previousstudy in which it could be shown that high temporalresolution (2 h or less) in sampling time allows quan-titative “fingerprint analysis” of air masses arrivingfrom different source regions at Loyola UniversityChicago’s Air Monitoring station[14]. Here, the pro-cedure established, is applied to identify seasonalchanges in chemical patterns. For this, one diurnalvariation was selected for each season from a set ofcollections and meteorological data taken during theyear (2000/2001). The days chosen represent dayswith local meteorological data considered as aver-age[15]. Seasonal changes are important to study asaerosol properties can vary strongly for each seasondepending on meteorology, source regions and localcontributions. Also, when carried out over a longertime period, shifts in meteorological and associatedelemental patterns might aid understanding of lo-cal climate variability and air pollution from yearto year.
The samples were taken at Loyola University’s airmonitoring station located on the roof of the tallestbuilding of Loyola’s Lake Shore Campus about 100 m
above ground and 200 m away from Lake Michigan.The building is free standing and is used for housingof students and as such not perturbed by emissions ofany kind.
Chicago’s Lake front is of particular interest as airmasses vary frequently and rapidly, often even during1 day. Due to its unique location Chicago is also sub-ject to strong seasonal variability as the proximity tothe lake strongly influences meteorological parameterssuch as wind speed, wind direction, temperature andhumidity. An example is the so-called “lake breeze”,a shift in wind direction to the east—thus comingfrom the lake—during summer afternoons, often as-sociated with increased relative humidity but lesserparticle freights near the lake. The lake breeze is lesspronounced or even absent during other seasons wherewesterly winds dominate the situation[15]. Fall andspring experience often extreme weather fluctuationson short time scales of a day or less and are thereforean important subject to study, because air pollutioncan vary strongly with these fluctuations.
To record rapid changes in air masses, samples mustbe collected with high temporal resolution and theanalysis technique capable of handling small sampleamounts in the order of several nanograms. Total re-flection X-ray fluorescence (TXRF) as a multi elementmicro analytical technique requires only tiny sampleamounts for quantitative analysis and offers thereforea unique tool for short-term collections. Previous stud-ies employing TXRF as analytical method for aerosolanalysis were mostly targeted towards instrumentalimprovement and optimization[16–22] or used forcomparison with other analytical methods[10].
Currently, Loyola University Chicago owns theonly TXRF-spectrometer in the United States capa-ble for quantitative trace analysis in atmospheric andenvironmental samples. The instrument is portableand can be used during field campaigns from differ-ent platforms as well. Results obtained from previousstudies with this instrumentation were highly encour-aging and confirmed the right choice of TXRF forthis kind of application[14,23,24]. Therefore, thisstudy was undertaken to extend the results and to ob-tain closer information about seasonal changes withrespect to trace elements and their diurnal variations.The results presented here are the first ones of anongoing study to gain closer insight into seasonal airmass patterns and local pollution[25].
M. Schmeling / Analytica Chimica Acta 496 (2003) 315–323 317
2. Experimental
2.1. Sample collection
Samples were collected by filtration with openfilterholders on the roof top of Mertz Hall, thetallest building of Loyola University Chicago’s LakeShore Campus. The campus is located 200 m westof Lake Michigan, about 13 km north of DowntownChicago in Rogers Park, Chicago. The collectioninstrumentation included a diaphragm pump (GastManufacturing Inc., Benton Harbor, MI), a flowme-ter (GE700, Gilmont Instruments, Barrington, IL),a polyvinylchloride (PVC) filterholder mount and aDelrin filterholder (Pall Gelman Laboratory, Ann Ar-bor, MI). As filter material polycarbonate (Millipore,Burlington, MA) was chosen because of its excellentseparation ability and low blank values. The pore sizeof 0.8�m provides good separation properties with-
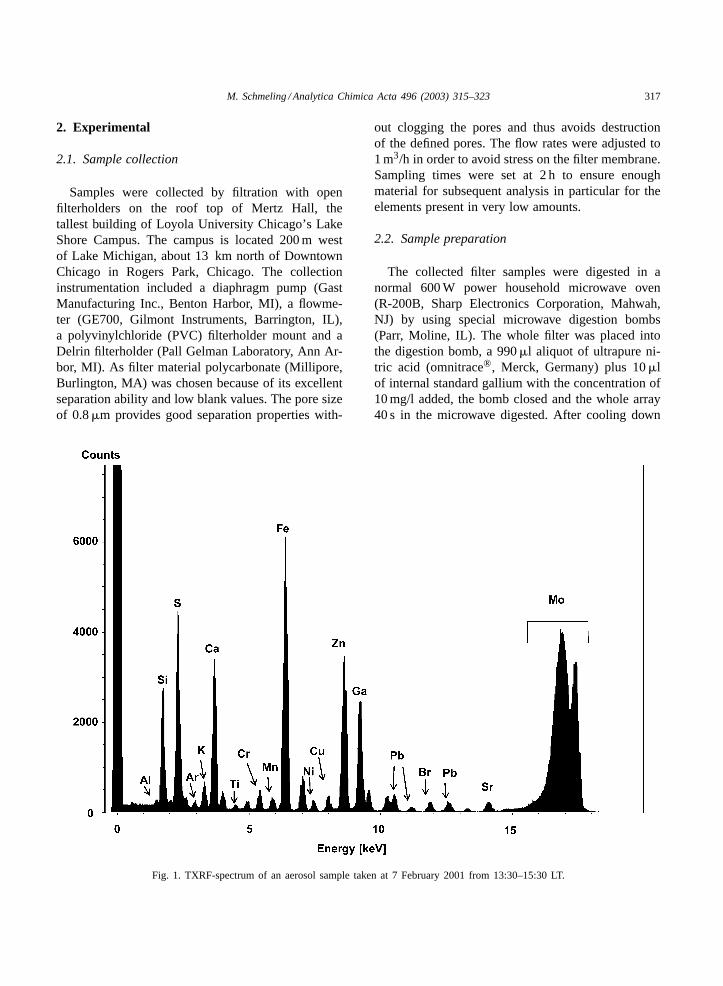
Fig. 1. TXRF-spectrum of an aerosol sample taken at 7 February 2001 from 13:30–15:30 LT.
out clogging the pores and thus avoids destructionof the defined pores. The flow rates were adjusted to1 m3/h in order to avoid stress on the filter membrane.Sampling times were set at 2 h to ensure enoughmaterial for subsequent analysis in particular for theelements present in very low amounts.
2.2. Sample preparation
The collected filter samples were digested in anormal 600 W power household microwave oven(R-200B, Sharp Electronics Corporation, Mahwah,NJ) by using special microwave digestion bombs(Parr, Moline, IL). The whole filter was placed intothe digestion bomb, a 990�l aliquot of ultrapure ni-tric acid (omnitrace®, Merck, Germany) plus 10�lof internal standard gallium with the concentration of10 mg/l added, the bomb closed and the whole array40 s in the microwave digested. After cooling down

318 M. Schmeling / Analytica Chimica Acta 496 (2003) 315–323
the sample solution was transferred into a reactionvessel and an amount of 40�l pipetted on a polishedquartz glass carrier for analysis. The sample was driedunder IR-light to obtain a solid residue.
To avoid contamination, sample preparation andhandling was always carried out in a class 100 cleanbench.
2.3. Analysis of atmospheric aerosol samples
The aerosol samples processed as described abovewere placed in the TXRF-spectrometer (PicoTax®, In-tax Berlin, Germany) and irradiated for 2000 s withMo excitation and a beam energy of 40 keV and 1 mA.The sample support material consists of SiO2 andthe internal standard was Ga with a concentration of100�g/l 100 ppb. Several blank samples were mea-sured to determine the blank of the method. For thispurpose the filterholder was installed to collect air in
IL
IA
MN
WI MI
IN
IN
IL
WI
MI
MN
IL IN
MI
WI
IA
(a)
(c)
(b)
(d)
MO
IA
IN
MN WI
MI
IL
Fig. 2. Back trajectories calculated for (a) 24 August 2000 at 13:00 LT, (b) 20 October 2000 at 13:00 LT, (c) 7 February 2001 at 13:00LT and (d) 19 April 2001 at 13:00 LT[26].
Table 1Detection limits of TXRF in ng/g ppb calculated for atmosphericaerosol samples
Element Detection limit (ng/g)
Al 271S 35K 8.46Ca 6.17Ti 3.66Cr 2.34Mn 1.91Fe 1.53Ni 1.06Cu 0.93Zn 0.79Br 0.61Sr 0.64Ba 6.97Pb 0.84
M. Schmeling / Analytica Chimica Acta 496 (2003) 315–323 319
a class 100 clean bench for 1 h and then treated identi-cally to the actual aerosol samples. Only minor blankvalues of Ca, Fe and Zn were recorded and theseblanks were subtracted from the sample. The blankswere for Ca 394.3± 16.8�g/l, Fe 46.0± 3.8�g/l andfor Zn 35.0 ± 3.3�g/l, respectively.
Fig. 1shows a TXRF-spectrum of an aerosol samplecollected at 7 February 2001 from 13:30–15:30 localtime (LT). InTable 1the detection limits in ng/g calcu-lated for atmospheric aerosol samples are displayed.
3. Results
3.1. Back trajectory analysis
Back trajectories (BT) are model calculationsshowing the position of an air parcel in the atmo-sphere integrated back in time under consideration ofvarious meteorological parameter, but mainly basedon atmospheric pressure, wind vectors, temperature
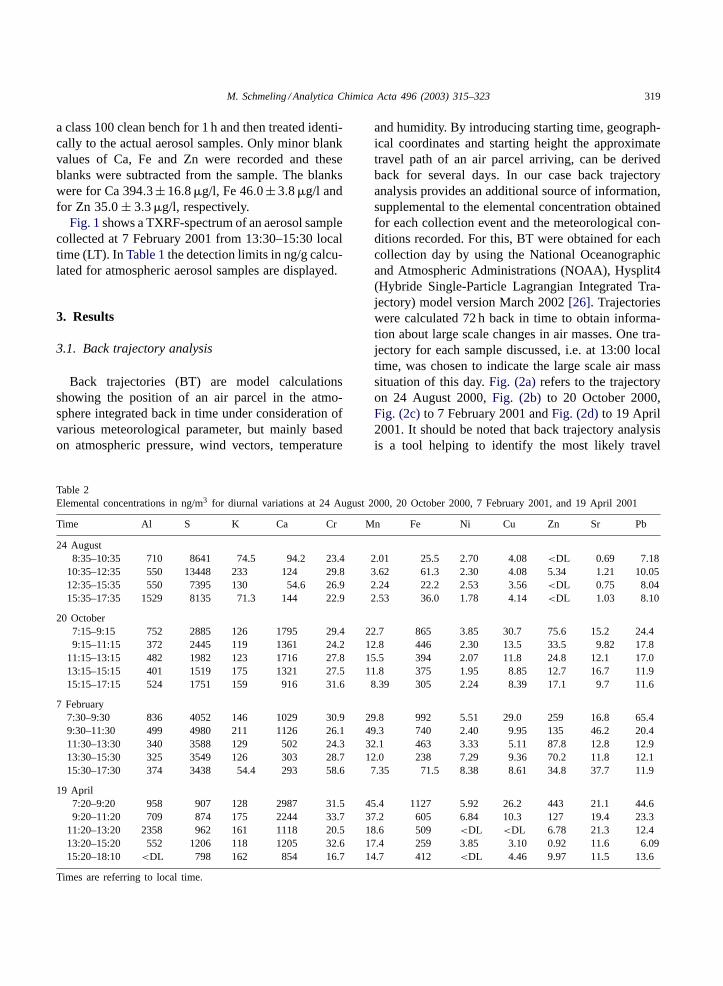
Table 2Elemental concentrations in ng/m3 for diurnal variations at 24 August 2000, 20 October 2000, 7 February 2001, and 19 April 2001
Time Al S K Ca Cr Mn Fe Ni Cu Zn Sr Pb
24 August8:35–10:35 710 8641 74.5 94.2 23.4 2.01 25.5 2.70 4.08<DL 0.69 7.18
10:35–12:35 550 13448 233 124 29.8 3.62 61.3 2.30 4.08 5.34 1.21 10.0512:35–15:35 550 7395 130 54.6 26.9 2.24 22.2 2.53 3.56<DL 0.75 8.0415:35–17:35 1529 8135 71.3 144 22.9 2.53 36.0 1.78 4.14<DL 1.03 8.10
20 October7:15–9:15 752 2885 126 1795 29.4 22.7 865 3.85 30.7 75.6 15.2 24.49:15–11:15 372 2445 119 1361 24.2 12.8 446 2.30 13.5 33.5 9.82 17.8
11:15–13:15 482 1982 123 1716 27.8 15.5 394 2.07 11.8 24.8 12.1 17.013:15–15:15 401 1519 175 1321 27.5 11.8 375 1.95 8.85 12.7 16.7 11.915:15–17:15 524 1751 159 916 31.6 8.39 305 2.24 8.39 17.1 9.7 11.6
7 February7:30–9:30 836 4052 146 1029 30.9 29.8 992 5.51 29.0 259 16.8 65.49:30–11:30 499 4980 211 1126 26.1 49.3 740 2.40 9.95 135 46.2 20.411:30–13:30 340 3588 129 502 24.3 32.1 463 3.33 5.11 87.8 12.8 12.913:30–15:30 325 3549 126 303 28.7 12.0 238 7.29 9.36 70.2 11.8 12.115:30–17:30 374 3438 54.4 293 58.6 7.35 71.5 8.38 8.61 34.8 37.7 11.9
19 April7:20–9:20 958 907 128 2987 31.5 45.4 1127 5.92 26.2 443 21.1 44.69:20–11:20 709 874 175 2244 33.7 37.2 605 6.84 10.3 127 19.4 23.3
11:20–13:20 2358 962 161 1118 20.5 18.6 509 <DL <DL 6.78 21.3 12.413:20–15:20 552 1206 118 1205 32.6 17.4 259 3.85 3.10 0.92 11.6 6.0915:20–18:10 <DL 798 162 854 16.7 14.7 412 <DL 4.46 9.97 11.5 13.6
Times are referring to local time.
and humidity. By introducing starting time, geograph-ical coordinates and starting height the approximatetravel path of an air parcel arriving, can be derivedback for several days. In our case back trajectoryanalysis provides an additional source of information,supplemental to the elemental concentration obtainedfor each collection event and the meteorological con-ditions recorded. For this, BT were obtained for eachcollection day by using the National Oceanographicand Atmospheric Administrations (NOAA), Hysplit4(Hybride Single-Particle Lagrangian Integrated Tra-jectory) model version March 2002[26]. Trajectorieswere calculated 72 h back in time to obtain informa-tion about large scale changes in air masses. One tra-jectory for each sample discussed, i.e. at 13:00 localtime, was chosen to indicate the large scale air masssituation of this day.Fig. (2a)refers to the trajectoryon 24 August 2000,Fig. (2b) to 20 October 2000,Fig. (2c)to 7 February 2001 andFig. (2d)to 19 April2001. It should be noted that back trajectory analysisis a tool helping to identify the most likely travel

320 M. Schmeling / Analytica Chimica Acta 496 (2003) 315–323
path of an air parcel on a broader scale. It is used inthis context to support the results not to replace themeaning of the meteorology present. However, sinceback trajectory analysis takes the local meteorologyinto account it represents a good approximation tothe actual path of the air mass arriving.
3.2. Seasonal variations in elementalconcentrations
Table 2 lists the diurnal elemental concentrationsobtained for the four selected days. InTable 3 thecorresponding meteorology as taken at the closeststation regularly recording (Meigs Field, Chicagodowntown lakefront) is shown on a two hourly ba-
Table 3Basic meteorological parameter on a 2 h basis for 24 August 2000,20 October 2000, 7 February 2001, and 19 April 2001[15]
Date Localtime
Temperature(◦C)
Windspeed (m/s)
Winddirection (◦)
August 247:00 21.0 4.02 0409:00 23.0 4.47 030
11:00 24.2 4.92 03013:00 24.5 4.47 05015:00 25.0 4.02 05017:00 25.5 4.02 080
October 207:00 13.9 4.47 2609:00 16.0 4.92 260
11:00 18.2 5.81 23013:00 23.9 4.92 23015:00 25.0 4.92 23017:00 25.0 5.81 240
February 77:00 −3.0 4.02 1709:00 −2.5 2.68 170
11:00 −2.0 4.02 17013:00 0.0 4.02 13015:00 1.0 7.60 09017:00 1.0 9.39 090
April 197:00 8.3 4.02 1709:00 11.0 4.92 190
11:00 15.2 4.92 16013:00 17.0 7.60 16015:00 18.9 4.02 19017:00 18.9 7.15 180
Time corresponds to local time (LT). Wind directions are: 0/360◦:north, 90◦: east, 180◦: south, 270◦: west.
sis representing the approximate starting and end-ing time of each collection[15]. Temperature, windspeed and wind direction are only listed here as theseparameters—especially the wind patterns—are themost relevant for interpretation of the results. Ele-mental concentrations of the halogens chlorine andbromine as well as the semi-volatile elements Asand Se were omitted as the samples need to be driedafter digestion to obtain a solid residue for analy-sis. The drying process most likely volatilizes someof the halogenic species as well as other elementswith high vapor pressure and therefore falsifies theresults.
The elements shown in the table can be grouped intotwo major groups: earth crust elements or soil tracersand anthropogenic tracers. With earth crust elementscomprising of Al, K, Ca, Fe, and Sr and anthropogenictracers of S, Cr, Ni, Cu and Pb. Mn, and Zn can beconsidered as partially natural of origin, partially an-thropogenic depending on the source region and travelpath of the air mass. In most cases the air mass willcontain both, elements of natural and of anthropogenicorigin, as it passes over the metropolitan Chicago areawith its various industrial and man made emissions.Only in the case of north and northeasterly wind di-rections, associated with clean Lake Michigan air, theparcel will be largely deprived in anthropogenic ele-ments. Elemental composition and concentrations ofthe two major groups already provide a first indica-tion of travel path and possible source region of theair mass. When placed together in context with lo-cal meteorology, path and origin might be rather wellidentified.
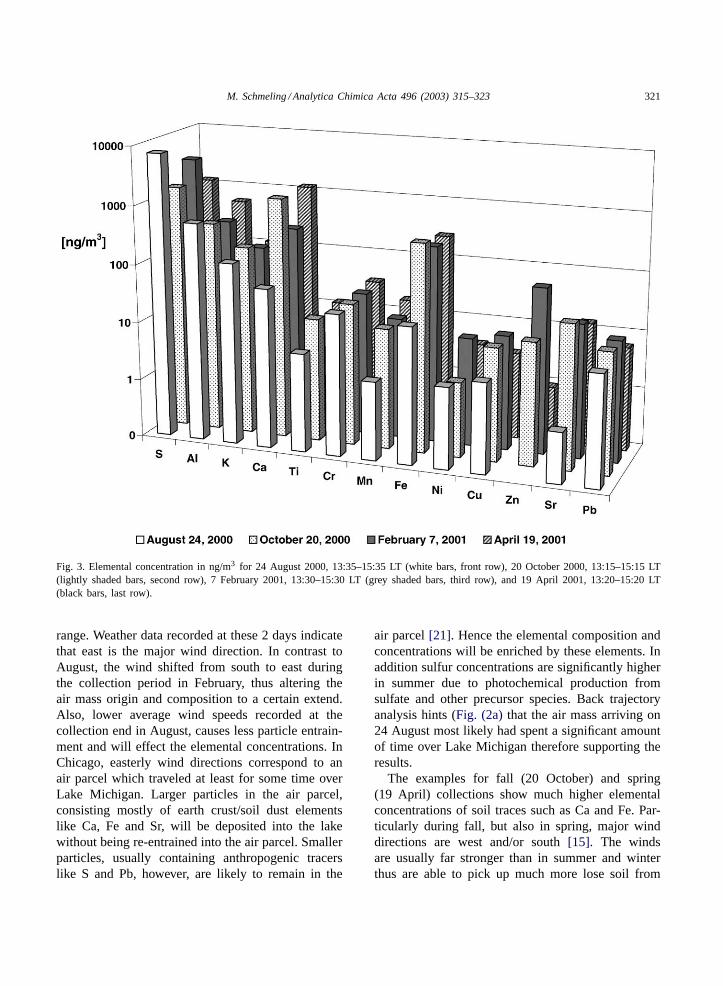
As it would be far to detailed to discuss any sin-gle pattern in the various elemental concentrationsduring the four diurnal variations, one sampling pe-riod, comprising roughly the same time, was selectedfrom each day and will be discussed here.Fig. 3shows the elemental concentrations of 24 August2000, 13:35–15:35 LT (summer), 20 October 2000,13:15–15:15 LT (fall), 7 February 2001, 13:30–15:30LT (winter) and 19 April 2001, 13:20–15:20 LT(spring). It is obvious that the August (summer)collection experiences far lower elemental concentra-tions then the other 3 days with the only exceptionof sulfur, which showed the highest concentrationof all samples. In winter (7 February), however, thesulfur concentration was found to be in a similar
M. Schmeling / Analytica Chimica Acta 496 (2003) 315–323 321
Fig. 3. Elemental concentration in ng/m3 for 24 August 2000, 13:35–15:35 LT (white bars, front row), 20 October 2000, 13:15–15:15 LT(lightly shaded bars, second row), 7 February 2001, 13:30–15:30 LT (grey shaded bars, third row), and 19 April 2001, 13:20–15:20 LT(black bars, last row).
range. Weather data recorded at these 2 days indicatethat east is the major wind direction. In contrast toAugust, the wind shifted from south to east duringthe collection period in February, thus altering theair mass origin and composition to a certain extend.Also, lower average wind speeds recorded at thecollection end in August, causes less particle entrain-ment and will effect the elemental concentrations. InChicago, easterly wind directions correspond to anair parcel which traveled at least for some time overLake Michigan. Larger particles in the air parcel,consisting mostly of earth crust/soil dust elementslike Ca, Fe and Sr, will be deposited into the lakewithout being re-entrained into the air parcel. Smallerparticles, usually containing anthropogenic tracerslike S and Pb, however, are likely to remain in the
air parcel[21]. Hence the elemental composition andconcentrations will be enriched by these elements. Inaddition sulfur concentrations are significantly higherin summer due to photochemical production fromsulfate and other precursor species. Back trajectoryanalysis hints (Fig. (2a)that the air mass arriving on24 August most likely had spent a significant amountof time over Lake Michigan therefore supporting theresults.
The examples for fall (20 October) and spring(19 April) collections show much higher elementalconcentrations of soil traces such as Ca and Fe. Par-ticularly during fall, but also in spring, major winddirections are west and/or south[15]. The windsare usually far stronger than in summer and winterthus are able to pick up much more lose soil from
322 M. Schmeling / Analytica Chimica Acta 496 (2003) 315–323
the ground and entrain it into the air parcel[15].Back trajectory analysis indicates that during springand fall collections, the air mass might have residedfor a considerable period of time over metropolitanChicago therefore incorporating some of its pollutionin addition to already present soil dust from the openranges in the Midwest—identified by high Ca, Fe, andSr concentrations. Although in winter (7 February)the air mass spent some time over Lake Michigan,explaining the slightly lower concentrations for mostof the elements compared to the fall and spring situa-tion, it also contains a significant amount of soil dust,which might be attributed to a travel path across ruralareas of the upper Midwest.
4. Conclusions
Aerosol samples collected by filtration at differentseasons with a 2 h time resolution were analyzed byTXRF. First results hint that seasonal variations inelemental concentrations are present and are mostpronounced in summer, where concentrations of al-most all elements detected were lower. Easterly windpatterns associated with clean Lake Michigan air arepossibly the reason for that. In spring and fall elemen-tal concentrations, particularly of soil dust elements(Ca, Fe) were higher and attributed to westerly windswith higher wind speeds than in summer/winter. In-fluences of anthropogenic pollution could be found inall samples. Sulfur, however, was enriched in summerdue to photochemical production and removal of largeparticles containing mostly soil dust elements by de-position into Lake Michigan (east wind). The resultsobtained in this preliminary study, based on 4 dayswith average seasonal meteorology, are very promisingand intensive measurements are currently undertakento solidify the findings and obtain more statisticalevidence.
Acknowledgements
The author would like to thank Meghan Gagliardiand Tinamarie Fosco for helping to collect the sam-ples and Charles Jenkins and Gregg Spalding for theirassistance to set up the monitoring station and provid-ing the filterholder mount.
References
[1] Panel on Aerosol Radiative Forcing and Climate Change,Aerosol Radiative Forcing and Climate Change, NationalAcademy Press, 2001.
[2] J.H. Seinfeld, S.N. Pandis, Atmospheric Chemistry andPhysics, Wiley, 1998.
[3] M. Schmeling, L.M. Russell, C. Erlick, D.R. Collins, H.Jonsson, Q. Wang, P. Kregsamer, C. Streli, Tellus 52B (2000)185.
[4] H. Horvarth, Atmos. Environ. 27A (3) (1993) 293.[5] I. Tegen, I. Fung, J. Geophys. Res. 99 (D11) (1994) 22897.[6] S. Huang, K.A. Rahn, R. Arimoto, W.C. Graustein, K.K.
Turekian, J. Geophys. Res. 104 (D23) (1999) 30309.[7] J. Reid, B.K. Garside, J. Shewchun, M. El-Sherbing, E.A.
Ballin, Appl. Opt. 17 (1978) 1806.[8] B.J. Finlayson-Pitts, J. Pitts, Chemistry of the Upper and
Lower Atmosphere, Academic Press, 2000.[9] J. Miranda, T.A. Cahill, J.R. Morales, F. Adalpe, J. Flores,
R.V. Diaz, Atmos. Environ. 28 (1994) 2299.[10] F. Francois, W. Maenhaut, J.L. Colin, R. Losno, M. Schulz,
T. Stahlschmidt, L. Spokes, T. Jickells, Atmos. Environ. 29(1995) 837.
[11] I. Borbely-Kiss, E. Koltay, G.Y. Szabo, L. Bozo, K. Tar, J.Aerosol Sci. 30 (1999) 369.
[12] R.D. Paode, S.C. Sofuoglu, J. Sivadechathep, K. Noll, T.M.Holson, Environ. Sci. Technol. 32 (1998) 1623.
[13] R.L. Siefert, A.M. Johansen, M.R. Hoffmann, J. Geophys.Res. 104 (D2) (1999) 3511.
[14] M. Schmeling, Spectrochim. Acta 56B (2001) 2127.[15] National Climate Data Center, National Oceanographic and
Atmospheric Administration, 2000,http://www.ncdc.noaa.gov/.
[16] D.J. Leland, D.B. Bilbrey, D.E. Leyden, P. Wobrauschek, H.Aiginger, H. Puxbaum, Anal. Chem. 59 (1987) 1911.
[17] B. Schneider, Spectrochim. Acta 44B (1989) 519.[18] J. Injuk, R. Van Grieken, Spectrochim. Acta 50B (1995) 1787.[19] R. Klockenkämper, H. Bayer, A. von Bohlen, M. Schmeling,
D. Klockow, Anal. Sci. 11 (1995) 495.[20] M. Schmeling, R. Klockenkämper, D. Klockow, Spectrochim.
Acta 52B (1997) 985.[21] M. Schmeling, D. Klockow, Anal. Chim. Acta 346 (1997)
121.[22] M. Theisen, R. Niessner, Fresenius J. Anal. Chem. 365 (1999)
332.[23] M. Schmeling, American Meteorological Society, in: A
Millenium Symposium on Atmospheric Chemistry: Past,Present and Future of Atmospheric Chemistry, Proceedingsof the 81st Annual Meeting, Albuquerque, 14–18 January,2001, p. 34.
[24] M. Schmeling, J. Aerosol Sci. 32 (2001) S1101.[25] M. Schmeling, P. Doskey, R. Kotamarthy, personal commu-
nications, 2002.[26] National Oceanographic and Atmospheric Administration
(NOAA), HYSPLIT (HYbrid Single-Particle LangrangianIntegrated Trajectory) model, Air Resources Laboratory,Silver Spring, MD, 1997 andhttp://www.arl.noaa.gov/ready/hysplit4.html.
M. Schmeling / Analytica Chimica Acta 496 (2003) 315–323 323
Martina Schmeling has been an assistantprofessor in analytical and environmentalchemistry at Loyola University Chicagosince 1999. She is interested in thecollection and analysis of atmosphericaerosols (organic and inorganic species)with different techniques, air monitoringand source apportionment studies, climateand health influence of aerosols, studyof environmental samples in general, and
development of new analytical techniques for environmentalsamples especially atmospheric particles. She was previously apost-doctoral researcher at Princeton University in the Departmentof Chemical Engineering from 1998 to 1999 and a visiting pro-fessor in the Micro-and Trace Analysis Centre at the Universityof Antwerp, Belgium from 1997 to 1998. Martina
received a Dr. rer. nat. in Chemistry at the University of Dortmundand Institute for Spectrochemistry and Applied SpectroscopyDortmund under the direction of Prof. D. Klockow and Prof.J.A.C. Broekaert in 1997 and a Diploma in Chemistry at West-fälische Wilhelms Universität Münster, Germany in 1992. Shehas been involved in numerous professional activities includinga measuring campaign with the research vessel “RV Belgica” inthe North Sea (1997), AEROSOLS/INDOEX research campaignwith the NOAA research vessel “Ronald H. Brown” across theAtlantic Ocean from Norfolk, VA to Cape Town, ZA (1999),co-chairing the working group ‘Atmospheric Aerosols—ElementalAnalysis‘ within the European Aerosol Assembly (1999/2000),the PHOENIX Sunrise 2001 research campaign in Phoenix,AZ (2001), and chief scientist and organizer of the ChicagoLand–Lake Breeze 2002/3 campaign at Loyola University(2002).