seasonal soil loss and erodibility variation on a miamian silt loam soil
TRANSCRIPT

DIVISION S-6-SOIL & WATER MANAGEMENT& CONSERVATION
Seasonal Soil Loss and Erodibility Variation on a MiamianSilt Loam Soil
R. M. Bajracharya and R. Lal*
ABSTRACTThe importance of temporal soil credibility variation is a subject of
growing awareness but relatively little investigation. The aim of thisstudy was to make a preliminary assessment of the trend and mag-nitude of seasonal variations in erosion and credibility (factor K ofthe Universal Soil Loss Equation, USLE) for a soil in central Ohio.Three replicate runoff plots (22 by 4 m) were established at The OhioState University Agronomy Farm, Columbus, and monitored for run-off and soil loss from autumn 1989 through summer 1991. Sojl lossand credibility varied significantly among seasons. Erodibility washigh under wet, thawing soil conditions during the winter and springdue to low soil strength and greater susceptibility to detachment. Sum-mer credibilities were lowest in each year despite high soil loss fromerosive rains. A measured 2-yr mean K factor of 0.0391 h MJ~* mm-1
was in close agreement with the Wischmeier nomograph predictedvalue of 0.041 t h MJ~' mm*'. Both, however, were lower than thepublished value (0.049 t h MJ~> mm-1) for Miamian silt loam soil(fine, mixed, mesic Typic Hapludalf). Seasonal credibility coefficientdata exhibited a periodicity during the year, which could be approx-imated by a cosine-type function. Further, a lack of correlation be-tween soil credibility and seasonal rainfall erosivity was supported bythe fact that highest per-event K did not correspond with storms ofhigh erosivity factor It (EIM), erosivity and vice versa.
SOIL ERODIBILITY, the susceptibility of soil to ero-sive forces of raindrop impact and overland flow
(Lal, 1988), is generally considered an inherent soilproperty with a constant value. On the contrary, sea-sonal and temporal variations in several other soilproperties (e.g., organic C content, soil strength, andaggregate stability) are widely recognized (Coote etal., 1988; Kok and McCool, 1990; Young and Mutch-ler, 1977). Because credibility is closely related tothese dynamic soil properties (Coote et al., 1988; Youngand Mutchler, 1977; Vanelslande et al., 1987), it islogical to expect that soil credibility also varies amongseasons. Some researchers suggest that credibility alsoexhibits temporal variations both during a storm eventand among seasons (Alberts et al., 1987; Kirby andMehuys, 1987b; Mutchler and Carter, 1983; Zanchi,1988).
Mutchler and Carter (1983) reported seasonal var-iation of K, the soil credibility factor of the USLE,for two soils from Minnesota and Mississippi. Valuesof K calculated on a monthly basis during 6 yr indi-cated large differences between winter-early spring(February-March) and summer-early fall (July-Sep-
Dep. of Agronomy, Ohio State Univ., Columbus, OH 43210.Received 28 May 1991. "Corresponding author.
Published in Soil Sci. Soc. Am. J. 56:1560-1565 (1992).
tember) values. The monthly K values were observedto fit a cosine function. Similar results were reportedby Zanchi (1988) for two soils from Italy. For soilloss measurements made from 1978 to 1983, monthlyK values were found to be highest between Decemberand March and lowest between May and September.Variations in credibility values for these two Italiansoils also could be described by a cosine function.
In southwestern Quebec, Canada, Kirby and Me-huys (1987a) observed the variation of soil loss duringdifferent times of the year for four soils of differenttextural composition. Mean per-event erodibilities cal-culated using a modified form of the USLE were foundto be highest for partially frozen soil conditions (Kirbyand Mehuys, 1987b). Similar results were reported byWall et al. (1988) for some soils of southwestern On-tario. Furthermore, results of laboratory studies cor-roborated field plot experiments, indicating that thehighest K values occurred during winter-spring thawconditions (March), and the lowest during summer(June- September). The magnitude of seasonal vari-ation in K depended on soil texture, being more forsilty than sandy soils and intermediate for clays andloams.
Both long-term changes in soil characteristics (or-ganic matter, chemical, and textural — due to erosionor disturbance) and seasonal fluctuations (as in strengthand aggregate stability) result in changes in soil ero-dibility. Information regarding how credibility, andhence soil loss, varies temporally would be of benefitto successful management and sustained use of landresources. The purpose of this study was to make apreliminary evaluation of the magnitude of seasonalvariations in soil loss and credibility (K factor of theUSLE) for a Miamian soil in central Ohio.
METHODOLOGYField plots for the study were located at the Agronomy
Farm of the Ohio State University (40°N, 83°W). The sitehas a mean annual precipitation of 943 mm (Ruffner andBair, 1985, p. 838-841). Based on mean monthly temper-atures, four seasons can be distinguished: spring (late March-May); summer (June-early September); autumn (Septem-ber-early November); and winter (November-mid-March).The data of Table 1 show mean monthly and annual tem-peratures and precipitation for Columbus, OH.
Three replicate USLE-type runoff plots (22 by 4 m) with4.5% average slope steepness were established in August1988 on a Miamian silt loam soil. These plots were estab-lished on land that had been cultivated for two to threedecades preceding 12 to 15 yr of grass cover prior to thisstudy (P. Henderlong, 1991, personal communication). Soilat the upper end of the plots (near the summit position)appeared to be slightly eroded. The lower end was near a
1560

BAJRACHARYA & LAL: SEASONAL SOIL LOSS AND ERODIBILITY VARIATION 1561
Table 1. Mean monthly and annual temperature andprecipitation for Columbus, OH, based on a 40-yr record(1944~1983).t
Month
JanuaryFebruaryMarchAprilMayJuneJulyAugustSeptemberOctoberNovemberDecemberMean annual
Meantemperature
op\s-1.72-0.78
4.SO10.6116.6121.5623.7822.7219.1712.675.720.22
11.22
Meanprecipitation—————— mm -
74.262.2
101.181.093.795.394.283.166.856.468.866.0
942.8
Meansnowfall
216.0152.4114.320.3Tt..TT
68.6142.0713.6
f Data from Ruffner and Bair (1985, p. 838-841.).t T = trace.
Table 2. Classification of soil at the study site (Ohio StateUniversity Agronomy Farm, Columbus, OH).t
Soil type
Miamiansilt loamCelinasilt loamCrosbysilt loam
Classification
Fine, mixed, mesicTypic Hapludalf
Fine, mixed, mesicAquic Hapludalf
Fine, mixed, mesicAerie Ochraqualf
Parent material
Glacial till
Glacial till
Glacial till
Ktt h MJ-1 mm-1
0.049
0.057
0.049
t McLoda and Parkinson (1980).i The Universal Soil Loss Equation soil erodibility factor.
small creek causing a seasonally fluctuating water table thatprobably affected the amount of water capable of movinginto the profile, and hence runoff, particularly in the spring.The soil was mostly well drained with the exception of thelower 4- to 6-m portion of the plots that could be a differentsoil type such as Crosby (fine, mixed, mesic Aerie Ochra-qualf) or Celina (fine, mixed, mesic Aquic Hapludalf; G.F.Hall, 1991, personal communication) with a possibly dif-ferent erosion potential. Soil classification information andK values for these soil types are shown in Table 2. Differ-ences in erodibility between these soil types are small andhence the effect on soil loss was considered to be negligible.
The plots were kept bare (after initial plowing in autumn1988) with periodic tillage performed up and down the slopeusing a field cultivator when visible crusting or rilling andweeds occurred. Typically, this involved four to five tillageoperations annually, mainly during the period from latespring through fall. Grassed earthen dikes were used todelineate each plot, with tapered concrete barriers at thelower ends leading into the 0.3-m H-flumes (Fig. 1). Thedikes were »30 cm high, 30 cm wide, and sown to tallfescue grass (Festuca antndinacea Schreber). The H- flumeswere fitted with FW-1 water level recorders and Coshoctonwheel-samplers (U.S. Department of Agriculture, 1979, p.250-251; Fig. 1) for monitoring runoff rates and amounts,and obtaining runoff samples for determination of sedimentload and computing erosion.
The soil erodibility factor K was calculated using theUSLE, taking P (conservation practice factor) = 1 and LS(slope and length) = 0.4, determined according to Wis-chmeier and Smith (1978). Thus:
K = A/[R(LS)C] [1]
Fig. 1. USLE-type runoff plot equipped with H-flume andCoshocton wheel-sampler for runoff and soil loss collection.
where A was the soil loss on a seasonal or annual basis (tha~*), R = SEI30, EI30 computed for each storm duringseasonal or annual periods, and C, the crop factor, wasadjusted for grass residue (Table 5D of Wischmeier andSmith, 1978) during the period from autumn 1989 to sum-mer 1990, as the plots had been under bare fallow only 1yr prior to data collection.
Runoff charts and samples were collected following rain-fall events of sufficient magnitude (mostly >10 mm) togenerate measurable runoff. Occasionally groups of stormsoccurred, in which case storms separated by < 6 h, with 10mm or less of rain, were treated as part of the same event.Runoff and soil loss from each plot were monitored fromAugust 1989 through September 1991.
Erodibility values were also estimated by the nomographmethod for comparison with measured erodibility (Wis-chmeier et al., 1971). Silt plus very fine sand (58%), sand(21%), and organic matter (2.1%) were determined fromlaboratory analyses of soil samples. A soil structure codeof 2, i.e., fine granular, and profile permeability class of3 (moderate) were used to obtain a nomograph value of0.041 t h MJ-1 mm-1.
RESULTS AND DISCUSSIONLarge variations in runoff, infiltration, and amount
of soil eroded were observed among seasons (Table3). Total soil loss was least during the winter seasonand highest in the spring, indicating the latter to bethe period of greatest vulnerability of soil to erosion,as also reported by other researchers (Kirby and Me-huys, 1987a; Mutchler and Carter, 1983; Zanchi, 1988).The most soil eroded on a per-event basis, despiteconsiderably lower erodibility (Tables 3 and 4), oc-curred for summer storms, reflecting generally highererosivity during this time of the year.

1562 SOIL SCI. SOC. AM. J., VOL. 56, SEPTEMBER-OCTOBER 1992
Table 3. Rainfall amounts, erosivity factor, runoff, infiltration and erosion from the study plots.
Season
Autumn1989
Winter1989-1990Spring
1990
Summer1990
Autumn1990
Winter1990-1991Spring
1991
Summer1991
Stormno.
12345678§9
1011#121314151617181920§2122
23124§
Totalrainfall
33.026.738.16.4
15.525.417.836.817.830.553.333.049.514.011.430.518.031.015.225.434.315.2
16.58.9
Totaltrunoff
————— mm ———25.2 ± 13.814.1 ± 5.533.8 ± 2.41.3 ± 0.35.0 ± 1.3
10.4 ± 0.74.2 ± 1.3
21.2 ± 12.516.7 ± 1.026.0 ± 0.9
__
8.3 ± 2.944.9 ± 3.92.1 ± 0.72.8 ± 0.73.2 ± 0.73.4 ± 0.85.4 ± 0.65.1 ± 2.15.8 ± 2.44.3 ± 1.17.5 ± 3.4
2.12.0 ± 1.0
Infiltration
7.812.64.35.1
11.515.013.614.61.1
14.5__
24.74.6
11.98.6
27.314.625.610.119.630.07.7
14.46.9
EUMI mm ha^1 h-1
212330364
1314765860
116317
144125070557538512383417
165107
10038
Soilfloss
tha-1
2.59 ± 0.734.00 ± 1.638.51 ± 1.930.05 ± 0.020.27 ± 0.221.90 ± 0.041.15 ± 0.463.53 ± 1.465.62 ± 0.727.87 ± 2.499.61 ± 2.521.68 ± 0.39
10.07 ± 1.000.52 ± 0.170.42 ± 0.120.72 ± 0.270.55 ± 0.210.77 ± 0.272.10 ± 0.810.18 ± 0.161.2810.721
0.420.34 ± 0.26
t Means ± one standard deviation of replicate plots.t Storm erosivity determined according to Wischmeier and Smith (1978).§ Data from only two plots obtained.11 Data from only one plot obtained.# Total runoff exceeded total rainfall amount.
Table 4. Seasonal soil credibility factors (K,) and credibilitycoefficients (KJ for the Miamian silt loam soil.
Table 5. Statistical analysis using SAS GLM proceduref on 2-yr erodibility data of soil at the study site.
Season
AutumnWinterSpringSummer1-yr avg.H2-yr avg.1
1989-1990K,,t Kc,t
0.0430.0300.0890.023
0.046
1.100.772.280.59
± 0.03
1990-1991K* K*t
-1 mm-1
0.021 0.540.056 1.440.034 0.870.014 0.36
0.031 ± 0.02
AverageK. «c§
0.0320.0430.0610.019
0.039
0.821.101.560.49
± 0.02f K,, values corrected for residue during the second year of bare fallow
according to Table 5D of Wischmeier and Smith (1978).t Kd and Krf are ratios of K,, and K& to the 2-yr average K.§ Erodibility coefficient, K,. = K,+ + +/K; using 2-yr average K.11 Means ± one standard deviation.
Storm rainfall erosivity varied by as much as twoorders of magnitude from one season to the next (Ta-ble 3). Low values occurred in the winter (<14 MJmm ha-1 h-1 during 1989- 1990), while a maximumexceeding 1400 MJ mm ha-1 h-1 was observed for astorm during summer 1990. Maximum single-stormEI30 were within the range of values exceeded oncein 10 to 20 yr for the region (Wischmeier and Smith,1978). The 1-yr R values fell at the extreme ends ofthe 22-yr range of annual R of Wischmeier and Smith(1978; 766-3881 MJ mm ha-1 h-1), with the 1989-1990 value just exceeding the 22-yr high and 1990-1991 value slightly under the low (the annual R valueis obtained by summation of storm EI30s for each year).The difference in R values between the 2 yr was at-
SourcePlotSeasonYearSeason x yearErrorCorrected total
df2313
5463§
Sum ofsquares:):0.00150.03820.00340.00780.07980.1307
Meansquares0.000750.012740.003410.002600.00148
F value0.518.62***2.301.76
*** p > F = 0.001t General linear model procedure of SAS Institute (1979).i Type I sum of squares.§ Number of observations = 72 — 8 missing data points = 64.
tributed to 1989-1990 being especially wet, while 1991was dry, having fewer and gentler rain events. Forthe region, defined by Wischmeier and Smith (1978),in which this study was located, typically =90% ofannual R value occurs during spring and summer, i.e.,between April and October. In 1991, however, =35%of R occurred in the winter and fall (Table 3). Also,some events were missed as a result of problems withthe gauges and the collection system. Expectedly,though, a general trend of low winter and high sum-mer EI30 was noted for both single-storm values andseason totals.
Soil erodibility factors showed marked variationamong seasons as well as between years (Table 4).Highest per-event erodibilities and seasonal erodibility(Ks) values occurred during the spring in 1990 andduring the winter in 1991. The value of Ks was small-

BAJRACHARYA & LAL: SEASONAL SOIL LOSS AND ERODIBILITY VARIATION 1563
est during summer, being 25% that of spring in thefirst year and 40% that in the second. Variance analy-sis was performed using the Statistical Analysis Sys-tem (SAS Institute, 1979) General Linear Model (GLM)procedure, which has the capability to analyze datasets with missing values. Occasionally data was lostfor one or more plots, particularly in 1991. Differ-ences in K were highly significant (P = 0.001) amongseasons (Table 5). Although considerable variation wasnoted between years, statistical difference was notfound. The season x year interaction was also non-significant at the 0.05 level, indicating that similartrends in K occurred for seasons in each year.
Soil loss varied significantly (P = 0.001) both amongseasons (Table 6) and between years, the latter re-flecting the large between-year differences in rainfallerosivity and amounts. Also, a significant (P = 0.01)season x year interaction revealed that mean soil losseswere dissimilar for seasons in the 2 yr.
Seasonal soil credibility exhibited a general trendof low to moderate values during the summer and falland moderate to high values during the winter andspring (Table 4). The comparatively low Ks values inthe second year of the study (40-62% less than thatof 1989-1990) was attributed to untypically low- en-ergy rainstorms and very low soil losses (Table 3) dueto a high degree of surface roughness and infiltration.Correspondingly low runoff transported less materialand resulted in some deposition at the bottom ends ofthe plots.
High credibility in the winter and spring agreedwith observations made by numerous scientists (Kirbyand Mehuys, 1987b; Wall et al., 1988) indicating vul-nerability of soil to erosion at this time of the yeardue to reduced infiltration from excessively wet con-ditions and low soil strength. Kok and McCool (1990)and Coote et al. (1988) noted that soil shear strengthis inversely related to moisture content, implying thatcredibility would increase with wetter, low-strength,soil conditions under which susceptibility to detach-ment by runoff and drop impact increase (Al-Durrahand Bradford, 1981; Luk, 1979). Moreover, partiallyfrozen or thawing conditions lead to higher surfacesoil moisture contents, rendering bare soil especiallyvulnerable to erosion (Kok and McCool, 1990; Benoitet al., 1988).
Aggregate stability, which influences erodibility, isalso recognized to be generally adversely affected byfrost action (Coote et al., 1988; Mostaghimi et al.,1988), although in some instances freeze-thaw cycles
Table 6. Statistical analysistt for 2-yr soil loss data from thestudy site.
SourcePlotSeasonYearSeason x yearErrorCorrected total
df2313
5463§
Sum ofsquares}
0.674147.310162.44583.503
342.236736.168
Meansquares
0.336849.1034
162.444727.83446.3377
F value0.057.75***
25.63***4.39
»** p > F = 0.001t General linear model procedure of SAS Institute (1979).i Type I sum of squares.§ Number of observations = 72-8 missing data points =
improved aggregation (Mostaghimi,et al. 1988). Op-timum moisture levels (usually in the mid range) werenoted in each soil examined by Mostaghimi et al. (1988)for which aggregate disruption was minimized or re-versed. Higher erodibility during winter 1989-1990than for winter 1990-1991 could be due to differencesin moisture and degree or nature of freeze-thaw, therebyresulting in differences in aggregate stability and soilstrength. Rainfall in winter 1989-1990 occurred in thelatter part of the season (January-February), but ear-lier (November- December) and on drier soil condi-tions in winter 1990-1991. Therefore, in the lattercase, more aggregate slaking could have led to highersoil losses and erodiblity than during the first winter.
Relatively low values of K during summer and au-tumn may reflect soil consolidation resulting in in-creased strength and reduced detachability (Al-Durrahand Bradford, 1981; Watson and Laflen, 1986; Near-ing and West, 1988; Nearing et al., 1988). Nonethe-less, development of surface crust led to high soil lossdue to runoff and rilling by concentrated flow, causinghighest soil losses during autumn 1989 and summer1990. Very small amounts of erosion in the secondsummer (1991) were attributed to nonerosive rains andvirtually no crusting or rilling.
As seen in Fig. 2, there was no correlation betweenseasonal erodibility and rainfall erosivity. Highest per-event K values did not correspond with storms of highEI30, nor were high Ks always observed for seasonshaving high R values. These results suggest that ero-dibility is, therefore, a complex function of both rain-fall and soil factors, as noted by others (Luk, 1979;Lal, 1988; Wischmeier et al., 1971). The lack of cor-relation between K and R values also imply that sea-sonal differences in erodibility can be attributed moreto changes in soil properties and surface conditionsthan rainfall erosivity, which is accounted for by thecorresponding seasonal R factors.
The 2-yr average measured K value of 0.039 t hMJ"1 mm"1 was similar to the mean annual K of0.041 t h MJ"1 mm"1 estimated using the nomographmethod of Wischmeier et al. (1971). Both values were,however, lower than those published (0.049 t h MJ"1
0.20
£ 0.15 -E
12 0.10
0.05
0.00
Autumn 1989 Autumn 1990a •
Winter 1989-1990 Winter 1990-1991A A
Spring 1990 Spring 1991o •
Summer 1990 Summer 1991
on
500 1000Storm EI30 MJ mm ha~1 h~1
1500
64.
Fig. 2. Seasonal storm erodibility factors plotted against stormerosivity indices for 24 events during the study period. Lineindicates the mean 2-yr erodibility factor.
1564 SOIL SCI. SOC. AM. J., VOL. 56, SEPTEMBER-OCTOBER 1992
mm-1) for Miamian silt loam (Bone et al., 1979). Thelow credibility values observed in this study may beattributed to: (i) eroded surface soil and an exposedsubsoil with a low lvalue, (ii) local variability in soiltypes, particularly at the low end of plots, and (iii)short observation period of 2 yr.
An credibility coefficient (Kc) was defined as theratio of seasonal Ks to annual average K:
Kc = KM [2]
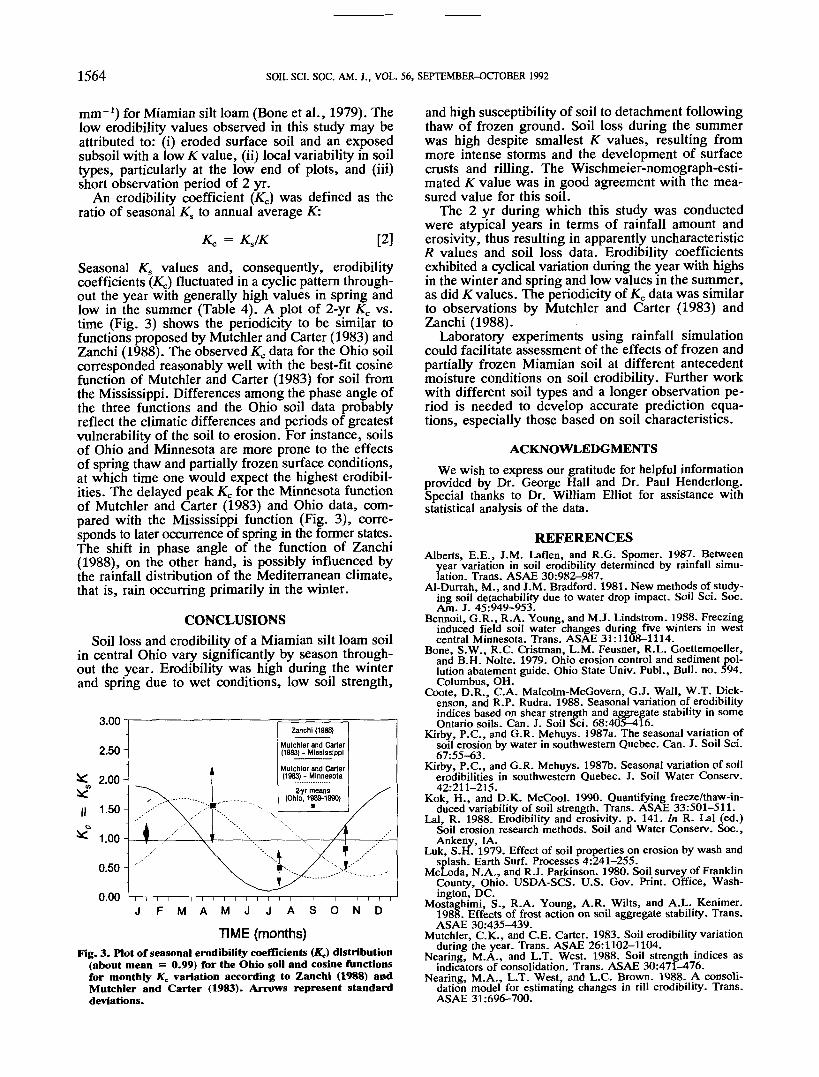
Seasonal Ks values and, consequently, credibilitycoefficients (ATC) fluctuated in a cyclic pattern through-out the year with generally high values in spring andlow in the summer (Table 4). A plot of 2-yr Kc vs.time (Fig. 3) shows the periodicity to be similar tofunctions proposed by Mutchler and Carter (1983) andZanchi (1988). The observed Kc data for the Ohio soilcorresponded reasonably well with the best-fit cosinefunction of Mutchler and Carter (1983) for soil fromthe Mississippi. Differences among the phase angle ofthe three functions and the Ohio soil data probablyreflect the climatic differences and periods of greatestvulnerability of the soil to erosion. For instance, soilsof Ohio and Minnesota are more prone to the effectsof spring thaw and partially frozen surface conditions,at which time one would expect the highest credibil-ities. The delayed peak Kc for the Minnesota functionof Mutchler and Carter (1983) and Ohio data, com-pared with the Mississippi function (Fig. 3), corre-sponds to later occurrence of spring in the former states.The shift in phase angle of the function of Zanchi(1988), on the other hand, is possibly influenced bythe rainfall distribution of the Mediterranean climate,that is, rain occurring primarily in the winter.
CONCLUSIONSSoil loss and credibility of a Miamian silt loam soil
in central Ohio vary significantly by season through-out the year. Erodibility was high during the winterand spring due to wet conditions, low soil strength,
0.00O N D
TIME (months)Fig. 3. Plot of seasonal credibility coefficients (A"c) distribution
(about mean = 0.99) for the Ohio soil and cosine functionsfor monthly Kc variation according to Zanchi (1988) andMutchler and Carter (1983). Arrows represent standarddeviations.
and high susceptibility of soil to detachment followingthaw of frozen ground. Soil loss during the summerwas high despite smallest K values, resulting frommore intense storms and the development of surfacecrusts and rilling. The Wischmeier-nomograph-esti-mated K value was in good agreement with the mea-sured value for this soil.
The 2 yr during which this study was conductedwere atypical years in terms of rainfall amount anderosivity, thus resulting in apparently uncharacteristicR values and soil loss data. Erodibility coefficientsexhibited a cyclical variation during the year with highsin the winter and spring and low values in the summer,as did lvalues. The periodicity of Kc data was similarto observations by Mutchler and Carter (1983) andZanchi(1988).
Laboratory experiments using rainfall simulationcould facilitate assessment of the effects of frozen andpartially frozen Miamian soil at different antecedentmoisture conditions on soil credibility. Further workwith different soil types and a longer observation pe-riod is needed to develop accurate prediction equa-tions, especially those based on soil characteristics.
ACKNOWLEDGMENTSWe wish to express our gratitude for helpful information
provided by Dr. George Hall and Dr. Paul Henderlong.Special thanks to Dr. William Elliot for assistance withstatistical analysis of the data.

BRESSON & CADOT: ILLUVIATION AND STRUCTURAL CRUST FORMATION 1565