sea surface temperature variability over north indian ocean — a study of two contrasting monsoon...
TRANSCRIPT

Proe. Indian Acad. Sci. (Earth Planet. Sci.), Vol. 95. No. 3. November 1986. pp. 435-446. O Printed in India.
Sea surface temperature variability over North Indian Ocean A study of two contrasting monsoon seasons
M R R A M E S H K U M A R , S S A T H Y E N D R A N A T H , N K V I S W A M B H A R A N and L V G A N G A D H A R A RAO National Institute of Oceanography, Dona Paula 403 004, India
MS received 14 November 1985; revised 19 July 1986
Abstract. Using the satellite derived sea surface temperature (SST) data for 1979 (bad monsoon) and 1983 (good monsoon), the SST variability for two contrasting monsoon seasons is studied. The study indicates that large negative anomalies off the Somali and Arabian coasts are associated with good monsoon rainfall over India. The strong monsoonal cooling in these regions can be attributed to strong low level winds and intense upwelling. The reappearance of 27"C isotherm off Somali coast in May/June coincides with the onset of southwest monsoon over India. Further, the influence of zonal anomaly of SST off Somalia Coast (SCZASST) and Central Indian Ocean Zonal Anomaly of SST (CIOZASST) with monsoon rainfall over India is brought out. The former is negatively related to the monsoon rainfall over western and central parts of India, whilst CIOZASST is positively related.
Keywords. North Indian Ocean; zonal anomaly; sea surface temperature; south equatorial trough.
1. Introduction
In recent years, considerable attention has been paid to the relationships between SST distribution over the Indian Ocean and the monsoon activity over India and adjoining areas (Ellis 1952; Saha 1970; Shukla 1975; Shukla and Misra 1977; Washington et al 1977; Raghavan et al 1978; Weare 1979; Pisharoty 1981; Mishra 1981; Joseph 1981; Joseph and Pillai 1984). However , considerable uncertainty still exists as to the exact nature of the relationship between SST patterns and monsoon activity. Different hypotheses have been put forth regarding these interactions by Shukla (1975), Saha (1970, 1974), Washington et al (1977) and Joseph and Pillai (1984).
These theoretical and empirical models need verification by extensive testing with observed data. Conventional ship observations over the Indian Ocean are sparse, and as such, not ideally suited for the above purpose.
It is now possible to get SST data on a routine basis through satellites. Though uncertainties still exist as to the accuracies of this data, especially for tropical areas (Pichel and Banks 1983), it has the advantages of large area coverage and real time accessibility, which are important attributes from the prediction point of view. Mishra (1981) studied SST variability over the North Indian Ocean during the southwest monsoon season for the years 1977, 1978 and 1979, using the satellite derived SST data. His study revealed that the beginning of cooling of surface waters over the Arabian Sea is associated with the advance of the southwest monsoon, and that the formation of the Somali and Monsoon currents and
435

436 M R Ramesh Kumar et al
spreading of cold upwelled waters over the Arabian Sea are more pronounced in good monsoon years.
In this paper, we have analyzed satellite-derived SST data over the Indian Occan during the pre-monsoon and monsoon period for 1979 and 1983. The results are discussed in the light of various hypotheses regarding the ocean-atmosphere interaction and its possible effect on monsoon rainfall over India.
2. Data and methodology
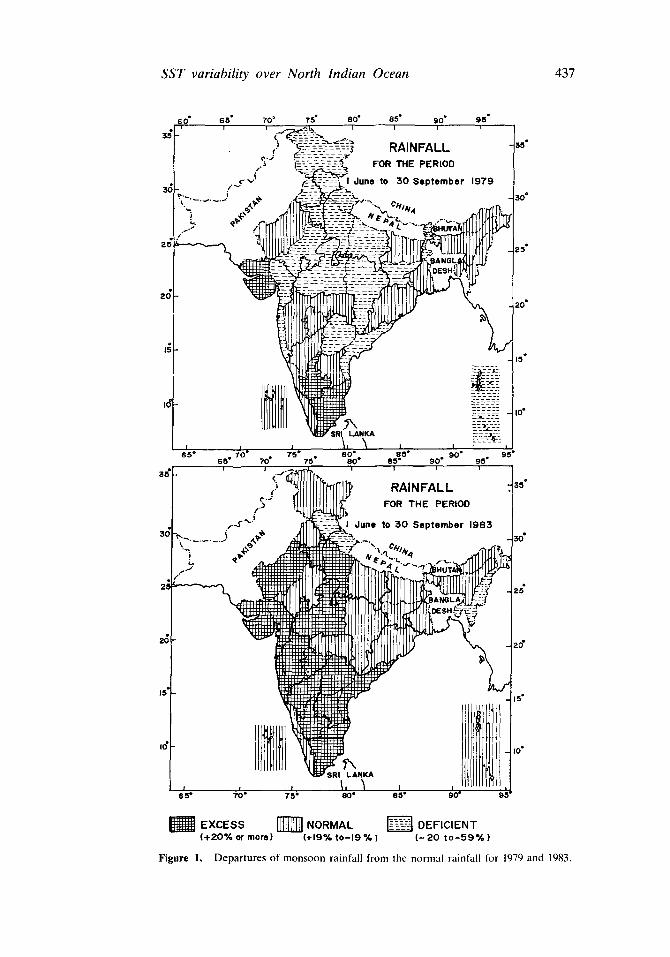
The years 1979 and 1983 were chosen because of contrasting features of monsoon rainfall over the Indian subcontinent. Figure 1 shows the departures of seasonal rainfall (1 June to 30 September) from the normal for 1979 and 1983 for various meteorological sub-divisions (Weekly Weather Report, India Meteorological Department). In general, over most parts of the country the rainfall was deficient in 1979, and normal to excess during 1983. In both the years the advance of monsoon over Kerala was delayed by about two weeks (the normal onset data being 1st June).
SST data for 1979 and 1983 were taken from the Global Operational Sea Surface Temperature Computation (GOSSTCOMP) charts (derived from NOAA satel- lites), for the period May to September. These charts give temperature contours at I~ interval for the area from 30~ to 30~ and 40~ to 100~ at weekly intervals. Pichal and Banks (1983) found that the root mean square (RMS) differences between satellite and in situ data were generally less than I~ However, in the latitude belt from 10~ to 30~ RMS differences of 1.6~ and biases of - I ~ to -3~ were observed for 1982. These lower quality observations were attributed to the effect of EI-Chichon volcanic eruption in late March 1982. We have assumed that the effect of this contamination would have decreased substantially by May 1983, and that the data would have an accuracy of I~ which corresponds to the contouring interval on the charts. The climatological SST data were taken from Hastenrath and Lamb (1979).
The SST values for every two degree latitude-longitude grid points were estimated by visual interpolation (for both GOSSTCOMP as well as climatological charts). The SST anomalies (Tz) were then calculated as follows.
rz--r'--L
where T and ir are the observed grid point and zonal mean SSTs respectively.
3. Results and discussion
3.1 Monthly variation of SST
The weekly averaged SSTs obtained from the GOSSTCOMP charts have been further averaged to give the monthly mean SST. Figure 2 gives the monthly variation of mean SST for three representative stations A, B and C in the sea off the Somali coast (10~ and 52~ South Central Arabian Sea (10~ and 60~ and South Central Bay of Bengal (10~ and 90~ respectively, from May to September for the years 1979 and 1983.
SST variability over North Indian Ocean 437
80" 85 ~ 70 ~ 75" 80" 85" 90" 95"
r ~----~ . . . . . . . ~ RAINFALL ! . , ~\~-__:~_~_ FOR THE PERIOD
�9 / ~..~.i ~ " ~ 1 dune to 30 September 1979 3o . ~ 7L~ ~_~-'~..
~ - ~
t :i
t ~ SRI LANKA
I 8 5 ~ /o" ,5" 8o' . .5" ,o" 98"
65" 70" 75* 80 85 ~ 9 0 " 95 ~
t 35"
30 ~
25"
20"
o 15
Io"
35
3o"
25"
2o"
15"
i0 ~
EXCESS . O R M A . DEF,ClENT (+20% or morel (+19% to-19 % ) ( - 20 t o - 5 9 % )
Figure !. Depar tures of monsoon rainfall from the normal rainfall for 1979 and 1983.

438 M R Ramesh K u m a r et a/
,g
I
.|
~176
Z
~ . .
/ 1
o~
~
t.~ Z 0
Z
o~ u1
t ~ Z
<o=
I
I I i I
i I , i i
\
I I J i
( 3o ) ~ J n 4 e a o d w a / a : )e j JnS e a s
Z
I
,e~ I,./1
" t -
I"'-
Z .
0
s
oz
o ~
z "
<
;,-.
e",
0

SST variability over North Indian Ocean 439
At station A, the climatological values of SST drop sharply from May onwards, whereas in 1979 and 1983, the decrease of SST from May to June is comparatively less. Correspondingly, the Indian Daily Weather Report ( IDWR) data show that the monsoon onset was delayed by about 2 weeks in both 1979 and 1983 from the normal onset date. However , the May to June cooling is more (less) pronounced in 1983 (1979), the year of excess (deficit) rainfall. The rate of cooling can be taken as indicative of the intensity of upwelling in this area. The climatological values as well as the 1979 values show increasing temperatures from August to September, while in 1983, the temperature continues to decrease during this period. This may be due to the late withdrawal of southwest monsoon in 1983 and the persistence of stronger winds off Somali coast and consequent upwelling for a longer period. However, the climatological temperatures in this area are lower than the corresponding values for both 1979 and 1983.
At station B there is little difference in the monthly mean SST variation between 1979 and 1983 and the values for both the years compare well with the climatological data, though here also climatological values are generally lower. However, the differences ~re not as high as at station A.
At station C, in 1983 the monthly mean SST values were greater than normal from May to July, and less than normal from August to September. The values were nearly normal in 1979.
3.2 Reappearance o f 27~ isotherm
An analysis of the behaviour of the 27~ isotherm in the Arabian sea for the years 1979, 1981, 1982 and 1983 shows that this isotherm was absent throughout the premonsoon month of May off Somalia coast and appeared with the onset of southwest monsoon over Kerala coast (table 1). Geostat ionary satellite wind data (Young et al 1980) for 1979 showed that the appearance of the 27~ isotherm coincides with the establishment of the low level jet over the central Arabian Sea.
Table 1. Relationship between the appearance of the 27~ isotherm off the Somali coast and the advance of the Northern Limit of Monsoon/Southwest monsoon over Kerala.
Year
Week in which the 27"C isotherm appears off Advance of Northern Limit
Somali coast in of Monsoon/Southwest GOSSTCOMP chart Monsoon over Kerala
1979 12th June l l th June 1981 2nd June 30th May 1982 1st June 30th May 1983 14th June 13th June
The date referred to in the GOSSTCOMP chart is the middle day of that particular week.

440 M R Ramesh Kumar et al
3.3 Longitudinal variation of SST in July
Figure 3 gives the longitudinal variation of SSTs in July for the years 1979, 1983 along with the climatological mean values for the latitudes 20~ 10~ and Equator. The figure clearly shows that there is larger temperature difference between the western and eastern portions of the Indian ocean during a good monsoon (1983) than in a poor monsoon season (1979). This east-west temperature gradient is greater at 20~ and 10~ as compared to the equator. At 20~ the maximum SSTs are observed around 66-70~ and the minimum values are observed at 58~ near the Arabian coast. The range of SST is 3~ (2~ in 1983 (1979). At 10~ the maximum SSTs are observed from 68--72~ and the minimum around 52~ near the
2. c
2~
27
22
3J o
3r
= 2 9
O
~ 2e E
~ as o ~ 2~
24
L A T I T U D E 2 0 ~ N
: = C l i r n a t o / o g i c o l o v e r a g e
1 9 8 3
1 9 7 9
I I I r L ~ i i I I I I J I t
L A T I T U D E IO~
I l l l l l l l l l l ,
2~
30r L A T I T U D E ( E Q U A T O R )
29;- ~ 28F 27~ 26P 251- 24P
2~Y-
22F
48" 82" 5 82" 84" 66" 88" to" 7~ 7E ;'8" re" 8o" es 4" ~ ' 9~ ~4" 96" 88" 9d 99
LONG ITUOE (DEGREES EAST1
Figure 3. Longitudinal variation of mean SST for July at 20~ 10~ and Equator from 48~ to 98~

SST variability over North Indian Ocean 441
Somalia coast. The range of SST is 3~ (2~ in 1983 (1979). At the equator, in the region west of 60~ there is strong (weak) temperature gradient during the good (bad) monsoon year. The temperature gradient in the western part of the equator during 1983 may be due to the strong winds (ORV Sagar Kanya 1st Cruise data) and strong cross equatorial flow. The weak temperature gradient during 1979 was due to weak surface winds and weak cross equatorial flow (Geostationary satellite data).
Saha (1970) showed that at the equator, pressure and SST are negatively correlated. We assume that this relationship holds good for the Arabian Sea also. Thus the large east-west temperature gradient observed during 1983 was favourable for strong low level westerly winds and intense evoporation over Arabian Sea.
3.4 Zonal anomaly of SST
Weekly zonal anomaly of SST charts were prepared for the period May to September for both the years and representative charts depicting the onset and active conditions for 1979 and 1983 are presented in figures 4A to 4D.
3.4a Zonal anomalies during 1979: Figure 4A represents actual onset conditions during 1979 and no significant SST anomaly features are present. Thc weak zonal
•jo" �9 ~" ~,~ s~ ~'
~"~"/~ N EG ATIV E
l 0 :4-1 E ~ POSITIVE
20" 0 0 o
+t
I1~- o
4o" ~ dc; -tb' a~ dd
IO(J'E. oO N
$
Figure 4A. Zonal anomaly chart of SST depicting the onset conditions (12 June 1979).

M R Ramesh Kumar et al 442
Figure 4B. Zonal anomaly chart of SST depicting the active monsoon conditions (24 July 1979).
anomaly observed during June appears to be associated with weak surface winds (Geostationary satellite data) and weak rainfall activity over India. The July conditions (active monsoon conditions, figure 4B) clearly reveal the beginning of upwelling along Somalia and Arabian coasts by negative zonal anomalies in this region, and these features get.more pronounced by August. By the beginning of September, these features have already begun to disappear. The maximum negative zonal anomalies of the order of 2~C were observed during August in the western Arabian Sea.
3.4b Zonal anomalies during 1983. Figure 4C shows the actual onset conditions during 1983. Strong negative anomalies indicative of intense upwelling off Somali coast can be seen. The negative anomalies become more pronounced by July (active monsoon conditions, figure 4D) and the features persist throughout August and September. The maximum negative anomalies of the order of 4~ were observed during July off Somali. Upwelling off Arabian coast is also considerably stronger in 1983 than in 1979.
Our present study is in agreement with the study of Joseph and Pillai (1984) in that the SST anomalies in the North Indian Ocean influence the monsoon activity over India.

SST variability over North Indian Ocean 443
�9 ~ u ~ - ~ - r u - u o - 90 ~ l O O T
Figure 4C. Zonal anomaly chart of SST depicting the onset conditions (14 June 1983).
3.5 Relationships between SCZASST , C I O Z A S S T and the monsoon rainfall over India
Studies by Shukla and Misra (1977), Goswami (1983) and Ramesh Babu et al (1985) have shown a positive correlation between SST and monsoon rainfall over different parts of India. In the present study we have chosen two regions which were not studied earlier namely, Somalia coast (4-10~ and 48-52~ and Central Indian Ocean area (4~176 and 64-84~ for correlating with the monsoon rainfall of about 15 meteorological subdivisions representing various parts of the country.
We have chosen the SCZASST as the average zonal anomaly between 4~ and 10~ 48~ and 52~ for correlating with the monsoon rainfall for the following reasons: It is believed that strong low level winds known as Somali Jet, transport significant amount of moisture to the Indian subcontinent. Thus a relationship between the intensity of Somali Jet and monsoon activity over India can be inferred to exist (Raghavan et al 1975). Shukla and Misra (1977) obtained a negative correlation between SST and pressure. Thus the existence of strong negative zonal winds are associated with low SSTs. Saha (1970) had shown the negative correlation between SST and pressure. Thus the exsistence of strong negative zonal anomalies can be linked to strong surface winds and intense upwelling off Somalia coast. These strong surface winds cause intense evaporation over the Arabian Sea. The net effect of the above mentioned factors would be to produce good monsoon over the Indian subcontinent.

M R Ramesh Kumar et al 444
Figure 4D. Zonal anomaly chart of SST depicting the active monsoon conditions (19 July 1983). The chart also indicates pronounced upwelling off Somali and Arabian coasts as compared to the year 1979.
We have found out the correlation coefficients between weekly values of SCZASST and the weekly monsoon rainfall of various meteorological subdivisions for the years 1979, 1983 and the combination of both years. Those values which are statistically significant at 95 and 99% level for the combined data (1979 + 1983) are presented in table 2. It is observed that the SCZASST is negatively and significantly correlated with rainfall over western and central parts of India for the same week. The correlation coefficients in general were found to decrease when analyzed for lags upto three weeks. However, they were still significant for west and east Madhya Pradesh upto lag 1 and lag 3 respectively (95% level).
The CIOZASST is taken as the average of the zonal anomalies between 4~ and 4~ 64~ to 84~ The reason for choosing this area for correlating with monsoon rainfall is as follows. Washington et al (1977) have shown that the SST anomalies in this region are under the influence of South Equatorial Trough (SET). Further, studies of Cadet and Olory-Togbe (1981) and Prasad et al (1983) have shown that there exists a negative correlation between the strengthening of SET activity and monsoon rainfall over India. Table 2 gives the statistically significant correlation coefficients between CIOZASST and monsoon rainfall over different meteoro-

SST variability over North Indian Ocean 445
Table 2. Statistically significant correlation coefficients (95 and 99% level) between SCZASST and weekly subdivisional monsoon rainfall over India for 1979 and 1983 (combined analysis).
1979 + 1983 Subdivision 0 1 2 3
Kerala . . . . 0.565* Konkan & Goa - 0 . 5 5 1 " - - - West Ra jas than - 0 - 4 2 1 " - - - East Ra jas than - 0-559* - - - West Madhya Pradesh - 0-602* - 0.454 - - East Madhya Pradesh - 0-635* - 0.545 - 0.477* - 0.381 Marathwada - - - 0-444 - Vidarbha - 0.537* - - - Coastal A n d h r a Pradesh - - - 0 . 4 4 0 -
* Refers to the correlation coefficients which are significant at 99% confidence level. There are 15 data samples each in 1979 and 1983.
Table 3. Statistically significant correlation coefficients (95 and 99% level) between C I O Z A S S T and weekly subdivisional monsoon rainfall over India for 1979 and 1983 (combined analysis).
Subdivision 0 1 2 3
Kerala 0-431 - - - Konkan & Goa 0.543* 0.378 - - East Ra jas than 0-435 - - - West M adhya Pradesh 0.634* 0.486* - - East Madhya Pradesh 0.660* 0.519" - - Mara thwada 0-507* 0.472* - - Vidarbha 0-558* 0.521 * - - Coastal A n d h r a Pradesh . . . . 0.538*
* Refers to the correlation coefficients which are significant at 99% confidence level. There are 15 data samples each in 1979 and 1983.
l o g i c a l s u b d i v i s i o n s . I t is o b s e r v e d t h a t t h e C I O Z A S S T is p o s i t i v e l y a n d
s i g n i f i c a n t l y c o r r e l a t e d w i t h t h e m o n s o o n r a i n f a l l o v e r m o s t o f t h e s u b d i v i s i o n s f o r
w h i c h S C Z A S S T s h o w e d n e g a t i v e c o r r e l a t i o n .
4. Conclusions
( a ) T h e d e c r e a s e i n S S T in w e s t e r n A r a b i a n S e a ( o f f S o m a l i a n d A r a b i a n c o a s t s )
d u r i n g t h e m o n s o o n m o n t h s ( J u n e t o S e p t e m b e r ) is m o r e p r o n o u n c e d d u r i n g a
g o o d m o n s o o n y e a r ( 1 9 8 3 ) t h a n d u r i n g a b a d m o n s o o n y e a r ( 1 9 7 9 ) .
( b ) L a r g e n e g a t i v e z o n a l S S T a n o m a l i e s e x i s t o f f t h e A r a b i a n a n d S o m a l i a c o a s t s
d u r i n g g o o d m o n s o o n y e a r . T h i s m a y b e d u e t o t h e c o m b i n e d e f f e c t o f s t r o n g l o w
l e v e l w i n d s a n d i n t e n s e u p w e l l i n g .
(c ) T h e r e a p p e a r a n c e o f 2 7 ~ i s o t h e r m n e a r ' t h e S o m a l i a c o a s t a r e a in M a y - J u n e
c o i n c i d e s w i t h t h e o n s e t o f s o u t h w e s t m o n s o o n o v e r I n d i a .

446 M R Ramesh Kumar et al
(d) The SCZASST is negatively and significantly correlated with the monsoon rainfall over western and central parts of India. The correlation is maximum for the same week (zero lag) and falls of with time lag from 0 to 3 weeks. (e) The CIOZASST is positively and significantly correlated with the monsoon rainfall over the western and central parts of the country, and the correlation is maximum with zero lag.
These preliminary results, which are encouraging need to be verified with sufficiently large data set consisting of good, bad and normal monsoon years.
Acknowledgements
The authors are thankful to Dr H N Siddiquie for his keen interest and encouragement in this study. They are grateful to Dr J S Sastry, Dr R Ananthakrishnan, Indian Institute of Tropical Meteorology, Pune and Dr J Shukla, Director, Center for Ocean-Land-Atmosphere Interactions, University of Mary- land, U.S.A for their valuable suggestions and to Dr P V Joseph, Director of Training, IMD, Pune for critically going through the manuscript.
References
Cadet D and Olory-Togbe P 1981 Monsoon dynamics (eds) Sir J Lighthill and R P Pearce (Cambridge: Cambridge University Press) p 287
Ellis R S 1952 Unpublished Master's thesis (Tallhassee: Florida State University) Goswami B N 1983 Lecture notes on IISc-ISRO Workshop on Satellite Meteorology and one day
Symposium on Sea Surface Temperature. Hastenrath S and Lamb 1 a J 1979 Climatic Atlas of North Indian Ocean. Part-l: Surface climate and
atmospheric circulation (Madison: Wisconsin University Press) Joseph P V 1981 Mausam 32 237 Joseph P V and Pillai 1984 Mausam 35 323 Mishra D K i981 Mausam 32 59 Pichel W G and Barbara A B 1983 NOAA Technical Note, US Dept. of Commerce, NOAA, NESS,
Washington, DC 20233. Pisharoty P R 1981 Monsoon dynamics (eds) Sir J Lighthill and R P Pearce (Cambridge: Cambridge
University Press) p 237 Prasad O, Mishra D K and Jain R K 1983 Mausam 34 449 Raghavan K, Sikka D R and Gujar S V 1975 Q.J.R. Meteor. Soc. 101 1003 Raghavan K, Puranik P V, Mujumdar V R, lsmail P M M and Paul D K 1978 Mon. Weather Rev. 106
719 Ramesh Babu V, Rao M V and Sadhuram Y 1985 Trop. Ocean - - Atmos. Newsl. 31 6 Saha K R 1970 Tellus 22 403 Saha K R 1974 Tellus 26 464 Shukla J 1975 J. Atmos. Sci. 32 503 Shukla J and Misra B M 1977 Mon. Weather Rev. 105 998 Washington W M Chervin R M and G V Rao 1977 Pageoph !15 1335 Weare B C 1979 J. Atmos. Sci. 36 2279 Young J A, Hassan V, Donald P and Wylie C L 1980 Summer Monsoon windsets from Geostationary
satellite data, Summer Monex: 1 May-31 July, 1979 (Madison: Wisconsin University)