scribner associates, inc. nace corrosion conference 2006 ... · scribner associates, inc. nace...
TRANSCRIPT
Scribner Associates, Inc. NACE Corrosion Conference 2006 – Paper No. 00674
DEVELOPMENT OF A MULTIELECTRODE ARRAY IMPEDANCE ANALYZER FOR CORROSION SCIENCE AND SENSORS
K.R. Cooper Scribner Associates, Inc. 150 E. Connecticut Ave
Southern Pines, NC, USA 28387
M. Smith Scribner Associates, Inc. 150 E. Connecticut Ave
Southern Pines, NC, USA 28387
J.R. Scully Dept. Materials Science & Engineering
University of Virginia 116 Engineer’s Way
Charlottesville, VA, USA 22904
N.D. Budiansky Dept. Materials Science & Engineering
University of Virginia 116 Engineer’s Way
Charlottesville, VA, USA 22904
ABSTRACT We describe recent advances in the development of instrumentation designed for electrochemical
impedance spectroscopy of microelectrode assemblies and arrays. The bench-top device provides the capability to perform DC and electrochemical impedance spectroscopy (EIS) measurements on up to 100 working electrodes. The system allows real-time measurement and data logging of the DC electrochemical and EIS behavior of each microelectrode from the computer-controlled analytical instrument. An overview of the operating principles, system performance, and testing with electronic component test modules and a model electrochemical system (10x10 nickel wire array in 5% sulfuric acid) are presented. Potential applications of the multi-channel microelectrode impedance analyzer include fundamental corrosion science studies, corrosion sensors and other sensor applications, and combinatorial electrochemistry and high-throughput screening for accelerated materials development such as multi-component corrosion inhibitors.
Keywords: instrumentation, array, microelectrode, electrochemistry, electrochemical impedance spectroscopy, sensor
INTRODUCTION
The use of microelectrode assemblies (MEAs) in corrosion science and sensor applications is
rapidly growing. For the purposes of this discussion, we define a MEA as an array of electrically
© NACE 2006 1
Scribner Associates, Inc. NACE Corrosion Conference 2006 – Paper No. 00674 isolated electrodes that can be electrically coupled through zero resistance ammeters (ZRA).† There are numerous MEA configurations that can be designed and adapted for various applications. For example, a microelectrode array composed of coupled wires of the same material arranged in a flush-mounted, close-pack configuration such that the ends of the wires simulate a planar electrode and have been used to examine interactions during localized pitting of stainless steel 1. In this case, electrodes are coupled through potential and chemical interactions in solution as well as electrically through the ZRAs. Current may flow between electrodes in the array and also be supplied from the remote counter electrode. Figure 1 illustrates a coupled electrode array configuration using a common counter electrode (CE) and reference electrode (RE). Similarly, an MEA composed of electrodes spaced far apart (i.e., where the distance between electrodes >> characteristic dimension of the electrode) have been used for investigations where chemical isolation was desired. Details are discussed elsewhere, but suffice to say that under most circumstances interactions due to chemical effects are minimal when x2/D >> t where x is the spacing between electrodes, D is the diffusion coefficient of relevant ions in the electrolyte and t is the time period over which the experiment is conducted 2.
The primary advantage of MEAs over planar electrodes is that each electrode is separately
addressable, enabling spatial and temporal information to be obtained simultaneously. For example, Budiansky et. al. 1 investigated the source and mechanism of persistent interaction in pitting corrosion susceptibility of AISI 316 (UNS S31600) stainless steel in chloride solutions. They examined the influence of pitting of a subset of array elements on future pitting susceptibility of neighboring electrodes by comparing pitting potential (Epit) distributions as a function of distance from the active pit sites under a range of environmental, surface pretreatment, and exposure conditions. Similarly, Wall and Martinez 3 used wire electrode arrays to examine pit initiation in high purity aluminum alloys by measuring Epit distributions as a function of electrode area, scan rate, and chloride concentration. Wall and coworkers also used MEAs to investigate second-phase particle influences in localized corrosion of Al-Cu alloys 4. Buchhiet and co-workers examined chromate conversion coating (CCC) formation and breakdown on an array of aluminum electrodes 5. The use of coupled electrode arrays revealed that local anodes and cathodes responded differently to the CCC treatment. For example, it was found that electrodes that behaved predominately as strong cathodes benefited from an increase in CCC formation time in terms of subsequent pitting resistance. In contrast, predominately anodic sites did not exhibit enhanced pitting resistance with longer CCC treatment time.
These works relied on the ability to control the DC potential and measure the corresponding DC
current of each electrode within the MEA in order to statistically characterize a key indicator of localized corrosion susceptibility, such as Epit, of the particular material-environment system. It is also possible to interrogate the electrochemical characteristics of individual electrodes through the separately addressable system. For instance, electrodes that behave as persistent anodes or cathodes can be tested via a cyclic voltammetry, impedance spectroscopy, or assessment of local cathodic kinetics.
Multi-channel electrochemical instrumentation was also used in the development of a
microelectrode array microscope for corrosion mapping 6. The device is an extension of the scanning electrochemical microscope 7 except that instead of single sensing electrode, an array of sensing electrodes, connected to the multi-channel instrument, was designed for enhanced spatial and time-resolved chemical concentration mapping.
† Hereafter, coupled refers to electrical coupling through ZRAs; the electrodes are electrical isolated from one
another at the surface.
© NACE 2006 2

Scribner Associates, Inc. NACE Corrosion Conference 2006 – Paper No. 00674
Analytical instrumentation for combinatorial electrochemical research and development (R&D)
has also been applied to materials discovery in the areas of corrosion inhibitors 8, electrochemical energy devices such as fuel cell catalysts 9-11, and Li-ion battery electrodes 12-15. Also referred to as high-throughput screening, combinatorial techniques depend on and take advantage of the ability to generate meaningful data by performing large numbers of experiments in concert. Until very recently these methods have been applied primarily in the electronics, pharmaceutical and biotechnology industries. Combinatorial approaches are recommended when small changes in input conditions produce large changes in performance or properties. These special circumstances might be missed if only a few tests can be conducted. Reddington et. al. 16 introduced the concept of combinatorial electrode arrays in a paper describing fluorescence-based detection of methanol electroxidation catalytic activity. Their method relied on the use of a single potentiostat and the incorporation of proton-sensitive fluorescent dyes to indicate regions of high ionic current corresponding to high electrochemical reaction rates on a nearby array electrode composed of combinatorial-derived binary, ternary and quaternary element mixtures. Although fluorescence detection was able to distinguish active from inactive catalysts, this method did not allow for recording of the current produced by the electrode reaction and this method was not able to quantify the catalytic activity or even rank active catalysts. Subsequent reports described serial analysis methods that utilize a movable electrode probe 17 or electronic contact 18 to perform electrochemical experiments in series on electrode arrays.
The recent development of cost-effective analytical instrumentation for combinatorial
electrochemistry - that is, instrumentation that can accommodate a large number of electrodes – has facilitated application of these techniques to the field of corrosion. Taylor and Kendig 8 recently reported preliminary development of rapid high-throughput screening methods in an attempt to identify synergistic combinations of corrosion inhibitors for aluminum alloys. The described method was based on DC measurement of the pseudo-corrosion resistance (Rc) which was taken as an indicator of the effectiveness and synergy (or lack-therefore) of a large number of iso-concentration inhibitor-pair combinations. The development of chromate-free corrosion inhibitor packages that are based on synergistic interactions of combinations of moderately effective compounds could be very time-consuming and costly without the advent of high-throughput screening methodologies.
Electrochemical impedance spectroscopy (EIS) is a powerful diagnostic technique based on
measurement of the AC voltage-to-current ratio and phase-relation of an electrochemical system over a broad range of frequencies due to its stimulation with a small-amplitude AC signal. EIS applied to corrosion science and engineering in principle can non-destructively obtain information on a number of fundamental parameters of the electrochemical cell including solution resistance, electrode/electrolyte interfacial properties such that the charge transfer kinetics and double layer capacitance, and transport phenomenon. Interest in impedance based sensors is also growing in part because multiple properties of the electrochemical system can be probed in a single diagnostic technique which expands the usefulness of sensor materials. However, EIS requires an impedance analyzer and for this reason it is typically restricted to a relatively limited number of electrodes because of the additional cost of the instrumentation. Reports of impedance analysis of electrode assemblies or arrays with large numbers of electrodes are essentially non-existent. There appears to be much to be gained by being able to measure the electrochemical impedance of an array of electrodes or large number of electrode/environment systems from the perspective of enhancing the tools available to corrosion and materials scientists and the sensor community.
© NACE 2006 3

Scribner Associates, Inc. NACE Corrosion Conference 2006 – Paper No. 00674
This work describes recent advances in the development of instrumentation designed for electrochemical impedance spectroscopy of electrode arrays and for combinatorial electrochemistry approaches. The bench-top device provides the capability to perform impedance-based measurements on up to 100 microelectrodes. The system allows real-time measurement and data logging of the microelectrode array elements from the computer-controlled instrument. An overview of the operating principles and preliminary data on model electrical and electrochemical systems are presented.
EXPERIMENTAL
Figure 1 illustrates the typical set-up for electrochemical testing of a microelectrode assembly in
a common electrolyte. The set-up is similar to a traditional 3-electrode configuration consisting of a working electrode (WE), counter electrode (CE) and reference electrode (RE) with the exception that the single WE is replaced with N working electrodes (i.e., an N + 2 electrode configuration). The electrodes are electrically coupled through the ZRAs. Both inter-electrode and polarized cell currents can exist within the cell depending on the relative potentials imposed on the array elements. For example, when the MEA is at the mixed potential open circuit (OCPMEA), inter-electrode currents between net anode and net cathode elements exist but the polarized cell current is zero. However, consider the case where the electrode array is polarized above the open circuit potential of some electrodes but below that of others. In this case there is a current balance between electrodes behaving as anodes, those acting as cathodes and the difference in current supplied by the potentiostat and counter electrode.
Instrumentation
The impedance-capable instrument was based on Scribner Associates Model 900† multichannel microelectrode analyzer (MMA). The MMA is capable of DC electrochemistry; the impedance-capable instrument will be referred to as the MMA-Z throughout this work. A schematic of a typical multi-electrode set-up consisting of the analytical instrument, the array and electrochemical cell is shown in Figure 1. The MMA/MMA-Z measures the current of up to 100 separate working electrodes simultaneously with in-line ZRAs. In the configuration used here, the measured OCP is the mixed potential of all N working electrodes (i.e., the electrode are galvanically coupled together). A DC polarization (bias) can be applied to all or a subset of working electrodes with respect to a reference electrode and/or other electrode groups.
The MMA-Z is a bench-top device capable of DC and EIS measurements. This instrument
incorporates a digital signal processor (DSP)-based impedance analyzer with a frequency range of 3 kHz to 1 mHz and a measurable impedance range of 500 to 107 Ω. The impedance measurement is based on the single-sine digital correlation technique used in many commercial impedance analyzers. Synchronization of the generator and analyzer is critical to ensure that signals of frequency not being generated are strongly rejected by the analyzer as noise.
For impedance measurements with the MMA-Z, a small AC voltage (or current) signal is
simultaneously imposed on each electrode of the MEA for which the impedance is to be measured and the AC voltage and current response of each electrode sequentially evaluated by the impedance analyzer. Impedance measurement is performed sequentially from highest to lowest frequency. In other words, the instrument sequentially interrogates the impedance response of each electrode at a single
† Trade name.
© NACE 2006 4

Scribner Associates, Inc. NACE Corrosion Conference 2006 – Paper No. 00674 frequency before stepping to the next lower frequency. In this way, the majority of the data is obtained for each electrode over a relative short period of time (i.e., at high frequency). Alternatives for more rapid data acquisition at low frequency are under consideration. These include parallel, real-time collection of low frequency current response simultaneously from each electrode and/or application of a pseudo-white noise excitation signal followed by Fourier Transform analysis of the current response to obtain the current response over a range of frequencies.
Electrical Testing
Evaluation of the accuracy of the impedance measurement using dummy cells comprised of electronic components (resistors and capacitors) was performed to verify the single channel and multi-channel measurement capability of the MMA-Z instrument. Figure 2 shows two of the three dummy cells that were used: a resistor array and a Randles equivalent circuit. The resistor array was made up of one hundred 100 kΩ resistors (±1% rated accuracy) and was connected to the instrument such that there was a single 100 kΩ resistor between each working electrode input channel and the common counter electrode (CE) and reference electrode (RE) inputs. The second dummy cell was a simple Randles equivalent circuit (Figure 2(b)) commonly used to represent an electrochemical cell 19. This R-C circuit consisted of a 1 kΩ resistor in series (Rs) with a parallel R-C combination consisting of a 0.5 MΩ resistor (Rp) and a 0.5 µF capacitor (Cp). Rs represents the ohmic resistance of the cell, Rp the charge transfer resistance at the electrochemical interface, and Cp the capacitance of the electrochemical double layer. The values of these electrical components are representative of a typical electrochemical cell. The impedance response of this Randles equivalent circuit was measured with a single channel of the MMA-Z instrument and using a traditional electrochemical set-up consisting of a Solartron Analytical 1250 FRA† (Ametek Inc.) and a PAR 273 potentiostat† (Ametek Inc.). For these tests, the AC voltage amplitude was 100 mV and measurements were made at a DC bias of 0, 0.1 and 1.0 VDC vs. CE/RE. In addition, the individual resistors and capacitor used for the Randles circuit were independently measured with an HP 4262A† (Hewlett-Packard) inductor-capacitor-resistor (LCR) meter.
An additional electrical circuit pertinent to the case of local electrochemically active sites was
investigated (e.g., passivity breakdown in the case of localized corrosion or another spatially-discrete electrochemically active site in an array of less reactive sites). To conduct this experiment, ten Randles equivalent circuits were used to represent ten electrically-isolated electrochemical interfaces. Each R-C circuit consisted of a 1.5 kΩ resistor in series (Rs) with a parallel R-C combination where the parallel capacitor was 100 µF. For nine of equivalent circuits, Rp was 0.75 MΩ but for circuit the parallel resistor was much smaller, only 0.5 kΩ. This latter circuit simulated an electrochemically active site such as might exist for an array of electrodes containing a single pit in an otherwise passive surface, a highly reactive phase, or local region of high concentration of a reducible or oxidizable species.
Other resistive dummy cells were used to verify accurate measurement capability within the
instrument’s impedance range rating. Pure capacitor dummy cells were used to determine the instrument’s maximum measurable impedance. Results of these tests are not reported here.
† Trade name.
© NACE 2006 5
Scribner Associates, Inc. NACE Corrosion Conference 2006 – Paper No. 00674
© NACE 2006 6
Electrochemical Testing
Impedance measurements of an electrochemical system with the MMA-Z were also performed. These tests used a 10x10 array of 1 mm (0.04 in.) diameter 99.95% nickel wires (center-to-center electrode spacing = 3 mm) immersed in quiescent 5% H2SO4 at ca. 22°C. The MEA was aligned face-down in the solution. A platinum-coated niobium mesh was used as the common CE and the saturated calomel reference electrode (SCE) was introduced into the cell through a Luggin probe, the tip of which was approximately centrally-located with respect to the MEA. Ribbon cables were used to mate the array to the analyzer instrument. The MEA and cell set-up are shown in Figure 3.
DC and impedance measurements of the MEA in the strong acid environment were performed.
An anodic polarization scan of a subset of elements was performed to characterize the DC behavior of the Ni in the H2SO4 solution. The potential of the electrodes was scanned in the anodic direction at 1 mV/sec from the mixed OCPMEA to +1 VSCE. It should be recognized that the voltage-current (E-I) response of 100 Ni electrodes will each be slightly different. Impedance measurements were acquired at the mixed open circuit potential of the MEA (OCPMEA = -0.27 VSCE) with a 15 mV AC voltage perturbation from 3 kHz to 0.5 Hz. Because of the sequential nature of the impedance measurement, interrogating all 100 electrodes to this sub-Hz frequency required approximately 45 min to complete the impedance experiment.
RESULTS AND DISCUSSION
Electrical Testing
The measured impedance of the array of 100 resistors is shown in Figure 4. The magnitude of the impedance (|Z| in ohm) and phase angle (theta in degrees) are plotted vs. the logarithm of frequency (Hz). Recall that each resistor was 100 kΩ with a manufacturer’s rated accuracy of ±1% (±1,000 Ω). Although it is not evident in the plots because of overlapping data, each graph contains 100 plots (i.e., 100 channels of impedance data).
The impedance of a pure resistor is independent of frequency and because its imaginary
component (Z″) is zero, |Z| should equal the resistance of the resistor, i.e., |Z| = R and θ = 0°. For all 100 channels, the measured |Z| was 100 kΩ ± 0.5 kΩ, independent of frequency ω, and clearly within the ±1% accuracy range of the resistors used in the resistor array test module. The phase angle was ±0.25° over the frequency range used and also frequency-independent.
The impedance of the simple R-C circuit that mimics a typical electrochemical cell is shown in
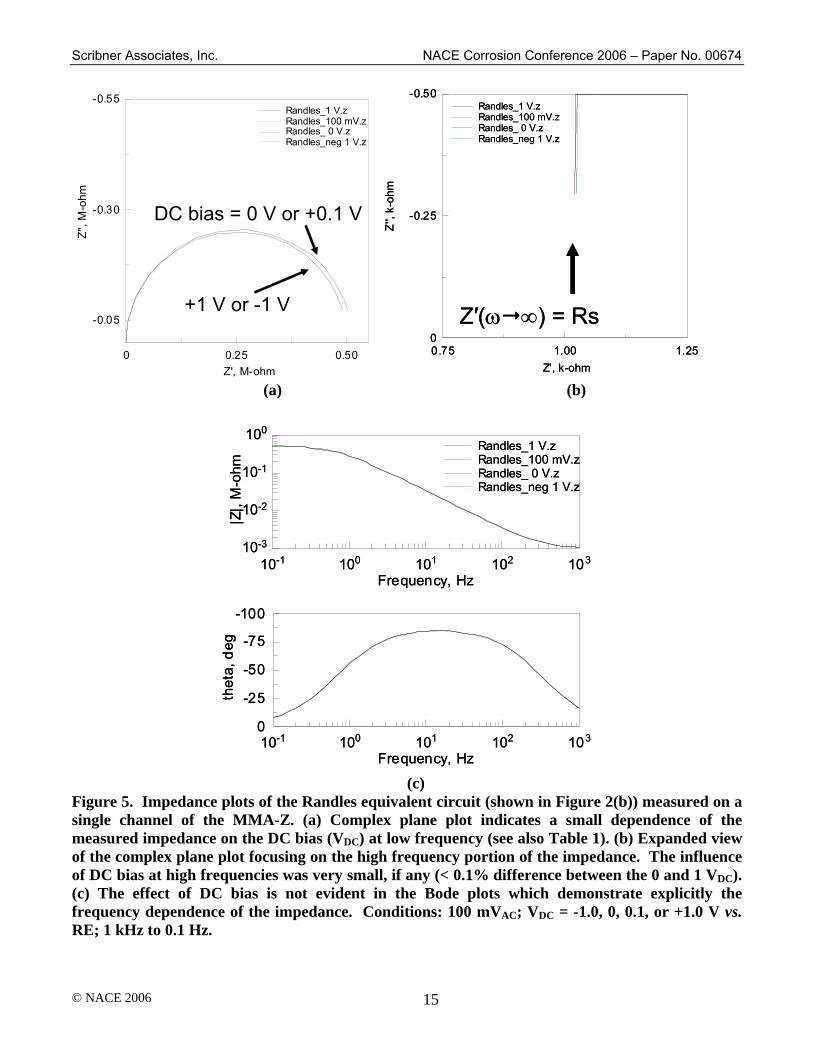
Figure 5. For these tests, the impedance of the Randles circuit (Figure 2(b)) was measured on a single channel of the MMA-Z as a function of DC bias. The complex plane plots (Z″ vs. Z′) indicate a small dependence of the measured impedance on the DC bias voltage (VDC) at low frequency. There was no effect of the DC voltage at high frequencies as indicated by the overlapping data in Figure 5(b) which shows an expanded view of the high-frequency portion of the complex plane impedance. The influence of DC bias at high frequencies was very small, if any, i.e., < 0.1% difference between the 0 and 1 VDC. Finally, the Bode plots explicitly demonstrate the expected frequency dependence of the impedance.

Scribner Associates, Inc. NACE Corrosion Conference 2006 – Paper No. 00674
© NACE 2006 7
The measured impedance data were modeled using ZView† (Scribner Associates) with an equivalent circuit consisting of a series resistor and a parallel resistor-capacitor combination. A circuit that used a constant phase element (CPE) in place of the Cp did not result in significantly different predictions; furthermore, the exponent of the CPE was within 0.3% of unity indicating that the capacitor behaved as a near-ideal component. As such, the results of the equivalent circuit modeling that employed a capacitor are reported here. The predicted values of the circuit components are summarized in Table 1. For comparison, also presented in are the predicted values based on the impedance spectra obtained using a traditional, high-performance single-channel FRA + potentiostat combination. Lastly, the values of the components used to fabricate the Randles circuit obtained with the LCR meter are reported.
The DC bias-dependency of the low frequency impedance evident in Figure 5(a) is borne out in
the model predictions of the component values. For example, equivalent circuit modeling predicted Rp = 0.511 and 0.501 MΩ at 0 and 1.0 VDC, respectively (2% difference). For comparison, the estimated value of Rp based on the equivalent circuit model of the commercial FRA + potentiostat impedance results were 0.493 and 0.495 MΩ at 0 and 1.0 VDC, respectively (0.4% difference). If we assume the value obtained using the LCR meter to be most accurate, then in both cases, the error in the measurement of the Rp was less than 2% for both the MMA-Z and the single-channel FRA + potentiostat set-up.
For all DC bias conditions, the predicted value of Rs was 1.024 kΩ using the MMA-Z impedance
data, which represents a 2% deviation from the independently-measured value of the series resistor using the LCR meter. Similarly, the difference between the predicted values of Rs based on the impedance data of the single-channel FRA + potentiostat set-up was 1.2%. Finally, the predicted values of the capacitor element Cp differed by < 1% for the MMA-Z and 1.8% for the FRA + potentiostat when compared to the value measured with the LCR meter.
The third simulated electrode system used in this work employed 10 simple Randles equivalent
circuits as described in the experimental section. The results are shown in Figure 6. When interrogated using EIS, the nine electrodes with high Rp value yielded a high frequency impedance of 1.5 kΩ and a low frequency impedance of 0.751 MΩ. Both results are consistent with the anticipated results based on the magnitude of the resistors.‡ The simulated electrode with the small parallel resistor (Rp = 0.5 kΩ) yielded a high frequency impedance of 1.5 kΩ and a low frequency impedance of 2.0 kΩ as expected. These results were identical to those expected if the impedance measurements were conducted on individual electrodes isolated from one another but, in this case, were extracted from an array of coupled electrodes. Thus the array analyzer instrument yielded the correct interfacial impedance of each array element. Described another way, each site on a spatially heterogeneous electrode was correctly interrogated for its individual properties.
The experiments conducted with these three test modules comprised of electronic components
demonstrate the general measurement capability and accuracy of the MMA-Z instrument.
† Trade name. ‡ For a simple Randles equivalent circuit, the high frequency impedance response should equal Rs and the low
frequency response the sum of Rs and Rp.
Scribner Associates, Inc. NACE Corrosion Conference 2006 – Paper No. 00674
© NACE 2006 8
Electrochemical Testing
Figure 7 shows the current map of the 10x10 Ni wire MEA acquired just prior to the impedance measurement. For convenience, we use the following labeling scheme to identify individual electrodes within the MEA: rows are labeled A through J and columns are labeled 1 through 10, starting in the upper left. Microelectrode A3 was faulty, probably due to a broken electrical connection in this electrode; data associated with this electrode was ignored in the results presented below.
In general, some electrodes tended to be persistent, strong net anodes (shown in red, e.g., E4)
where as other electrodes were strong net cathodes (shown as blue, e.g., E5). Some electrodes tended to fluctuate between acting as net anodic and net cathodic sites. The anodic polarization behavior of array element A1, which was generally a net cathode when coupled to the rest of the MEA, is shown in Figure 8. Indicated in this figure is the OCP of the coupled MEA (ca. -0.27 VSCE). From the potentiodynamic scan, we see that the OCP of electrode A1 was ca. -0.10 VSCE. The net cathodic behavior of this electrode was consistent with the observed mixed-potential OCP of the MEA of -0.27 VSCE. That is, electrode A1 was cathodically polarized when coupled to the other 98 electrodes when at the OCP of the coupled array.
The impedance spectra of 99 WEs in the 10x10 Ni wire MEA in 5% H2SO4 are shown in Figure
9. This data demonstrates the range of impedance response observed. There was a relatively large range in the impedance of the nominally identical electrodes as expected from the exponential relationship between potential and current along with the reciprocal relationship between current and polarization resistance. In general, net anodes exhibited small impedance arcs, indicating smaller resistance to charge transfer, where as net cathodes had larger loops reflecting a greater resistance to the charge transfer process. This makes sense from inspection of Figure 8 where the anodic reaction rate increases more strongly as a function of potential compared to the cathodic reaction rate which increases more slowly with cathodic polarization. If each electrode exhibited similar polarization (E-I) characteristics but displaced relative to each other in the anodic or cathodic direction, one anticipates a distribution in impedance spectra based on the Rp value that describes the interfacial reaction rate at each electrode at the mixed-potential OCP.
The real component of the high frequency impedance (3 kHz), which is indicative of the
uncompensated solution resistance, varied by a factor of 3.3x (115 to 382 Ω). There did not appear to be a relationship between the high frequency impedance and the relative distance of the microelectrodes to the reference Luggin probe tip. One might expect that the high frequency impedance measured at electrodes closer to the tip of the RE Luggin probe might be less than that measured with microelectrodes far from the RE. A map analogous to the current map but depicting the real component of the impedance at 3 kHz did not reveal any relationship with the position of the electrode within the array. In addition, such an “ohmic-resistance map” did not appear to correlate with the current map in that high resistance values did not correlate with either strong or weak anodes or cathodes. The cause of the variation on observed solution resistance is unclear. One hypothesis is that it may be due to crevice corrosion, although one would then anticipate that the crevice sites, which would presumably be persistent net anodes, would correlate with high ohmic resistance. Again, this was not observed.
We now examine the impedance spectrum of selected electrodes and compare it to the observed DC electrochemical behavior as indicated by the current map. Figure 10 shows the complex plane impedance for five microelectrodes from the MEA. For convenience, the current map show in Figure 7

Scribner Associates, Inc. NACE Corrosion Conference 2006 – Paper No. 00674
© NACE 2006 9
is repeated in Figure 10. These five electrodes were selected for further examination because their impedance behavior is representative of the range of observed impedance response of the MEA. There is strong correlation between the impedance of the individual microelectrode and the net DC condition of the electrode just before impedance experiment. For example, the current map indicated that array element E4 was a strong net anode (iE4 ~ 1x10⁻⁴ A/cm2) and element E5 was a strong net cathode (iE5 ~ -1x10⁻⁴ A/cm2). Element E4 exhibited the smallest polarization resistance (smallest diameter impedance loop) whereas element E5 had the largest polarization resistance (largest loop diameter). (More precisely, the diameter of a perfect semi-circular impedance loop is the charge transfer resistance; the polarization resistance is the sum of solution resistance and charge transfer resistance). Microelectrodes with DC current between these two extremes generally exhibited impedance arcs that were also between these two extremes, as exemplified by elements E3 (weak net anode, iE3 ~ 2.5x10⁻⁵ A/cm2), C4 (iC4 0 A/cm2), and D4 (weak net cathode, iD4 ~ -2.5x10⁻⁵ A/cm2).
These results indicate that one can distinguish via its impedance spectrum the general tendency
for the microelectrode to behave either as a net anode or cathode when coupled with the other microelectrodes and at the mixed-potential OCP of the MEA.
CONCLUSIONS
The performance of specialized analytical instrument for DC and EIS of microelectrode
assemblies and arrays was demonstrated. The computer-controlled bench-top instrument provides the capability to perform DC and EIS measurements on up to 100 working microelectrodes.
The impedance measurement capability of the multi-channel microelectrode analyzer was
demonstrated with three test modules and a typical corrosion system. Impedance testing with three dummy modules - an array of one hundred resistors, a Randles equivalent circuit examined at various DC bias levels and 10 Randles equivalent circuits representative of a single active site in an otherwise non-reactive interface - demonstrated that the instrument was capable of accurate impedance measurement on up to 100 channels over a broad range of frequencies (> 1 kHz to < 0.01 Hz) and electrical devices analogous to a typical electrochemical cells.
Measurement of the DC behavior and EIS characteristics of a 10x10 Ni wire microelectrode
assembly in sulfuric acid was also demonstrated. A correlation between the polarization resistance as determine by EIS and the DC electrochemical condition was observed. In general, array elements that were persistently net anodes exhibited smaller polarization resistance (and therefore charge transfer resistance) than electrodes that behaved as net cathodes. Furthermore, stronger anodes (as defined by a larger anodic current density) exhibited smaller polarization resistance than weak anodes; strong cathodes (more negative current density) exhibited larger polarization resistance than weak cathodes. The ability to differentiate between the DC electrochemical conditions (net anode vs. net cathode) via impedance spectroscopy was demonstrated.
Potential applications of the multi-channel microelectrode impedance analyzer include
fundamental corrosion science studies, corrosion sensors and other sensor applications, and combinatorial electrochemistry and high-throughput screening for accelerated materials development such as multi-component corrosion inhibitors.

Scribner Associates, Inc. NACE Corrosion Conference 2006 – Paper No. 00674
© NACE 2006 10
ACKNOWLEDGEMENTS The assistance of Derek Johnson is gratefully acknowledged. The nickel array electrode used in
this work was courtesy of Prof. R. Hudson, Department of Chemical Engineering at the University of Virginia.
REFERENCES
1. N. Budiansky, J. L. Hudson, J. R. Scully, "Origins of Persistent Interaction among Localized Corrosion Sites on Stainless Steel," J Electrochem Soc 151, 4 (2004) p. B233-B243. 2. N. D. Budiansky, F. Bocher, H. Cong, M. F. Hurley, J. R. Scully, "Use of Coupled Multi-Electrode Arrays to Advance the Understanding of Selected Corrosion Phenomena - Paper No. 06677," Corrosion/2006 (NACE: Houston, TX, 2006). 3. F. D. Wall, M. A. Martinez, "A Statistics-Based Approach to Studying Aluminum Pit Initiation. Intrinsic and Defect-Driven Pit Initiation Phenomena," J Electrochem Soc 150, 4 (2003) p. B146-B157. 4. F. D. Wall, M. A. Martinez, C. M. Johnson, J. C. Barbour, N. Missert, R. G. Copeland, "Does anything pin the pitting behavior of aluminum?" Symposium on Corrosion and Protection of Light Metal Alloys held at 204th Meeting of the Electrochemical Society, Vol. PV2003-23 (The Electrochemical Society, 2004), p. 1-11. 5. W. Zhang, B. Hurley, R. G. Buchheit, "Characterization of Chromate Conversion Coating Formation and Breakdown Using Electrode Arrays," J Electrochem Soc 149, 8 (2002) p. B357-B356. 6. T. E. Lister, A. W. Glenn, P. J. Pinhero, "Mapping Corrosion in Real-Time, Development of the Microelectrode Array Microscope - Paper No. 04445," Corrosion/2004 (NACE International: Houston, TX, 2004). 7. A. J. Bard, F.-R. F. Fan, J. Kwak, O. Lev, "Scanning Electrochemical Microscopy: Introduction and Principles," Anal Chem 61 (1989) p. 132. 8. B. D. Chambers, S. R. Taylor, M. W. Kendig, "Rapid Discovery of Corrosion Inhibitors and Synergistic Combinations Using High-Throughput Screening Methods," Corr 61, 5 (2005) p. 480-489. 9. T. E. Mallouk, E. S. Smotkin, "Combinatorial Catalyst Development Methods," in Handbook of Fuel Cells - Fundamentals, Technology and Applications, Vol. Volume 2, Part 3, eds. W. Vielstich, A. Lamm and H. A. Gasteiger (Chichester: John Wiley & Sons, Ltd., 2003), p. 334-347. 10. E. S. Smotkin, R. R. Diaz-Morales, "New Electrocatalysts by Combinatorial Methods," Annual Review of Materials Research 33 (2003) p. 557-579. 11. R. Liu, E. S. Smotkin, "Array membrane electrode assemblies for high throughput screening of direct methanol fuel cell anode catalysts," J of Electroanal Chem 535, 1-2 (2002) p. 49-55.
Scribner Associates, Inc. NACE Corrosion Conference 2006 – Paper No. 00674
© NACE 2006 11
12. M. D. Fleischauer, T. D. Hatchard, G. P. Rockwell, J. M. Topple, S. Trussler, S. K. Jericho, M. H. Jericho, J. R. Dahn, "Design and Testing of a 64-Channel Combinatorial Electrochemical Cell," J Electrochem Soc 150, 11 (2003) p. A1465-A1469. 13. M. D. Fleischauer, J. R. Dahn, "Combinatorial Investigations of the Si-Al-Mn System for Li-Ion Battery Applications," J Electrochem Soc 151, 8 (2004) p. A1216-A1221. 14. T. D. Hatchard, J. R. Dahn, "Study of the Electrochemical Performance of Sputtered Si1-xSnx Films," J Electrochem Soc 151, 10 (2004) p. A1628-A1635. 15. M. D. Fleischauer, J. M. Topple, J. R. Dahn, "Combinatorial Investigation of Si-M (M = Cr + Ni, Fe, Mn) Thin Film Negative Electrode Materials," Electrochem and Solid-State Lett 8, 2 (2005) p. A137-A140. 16. E. Reddington, A. Sapienza, B. Gurau, R. Viswanathan, S. Sarangapani, E. S. Smotkin, T. E. Mallouk, "Combinatorial Electrochemistry: A highly Parallel, Optical Screening Method for Discovery of Better Electrocatalysts," Sci 280 (1998) p. 1735-1737. 17. R. Jiang, D. Chu, "A Combinatorial Approach Toward Electrochemical Analysis," J of Electroanal Chem 527, 1-2 (2002) p. 137-142. 18. M. G. Sullivan, H. Utomo, P. J. Fagan, M. D. Ward, "Automated Electrochemical Analysis with Combinatorial Electrode Arrays," Anal Chem 71 (1999) p. 4369-4375. 19. A. J. Bard, L. Faulkner, Electrochemical Methods: Fundamentals and Applications, 2nd ed. (New York, NY: John Wiley & Sons, 2001).
TABLES
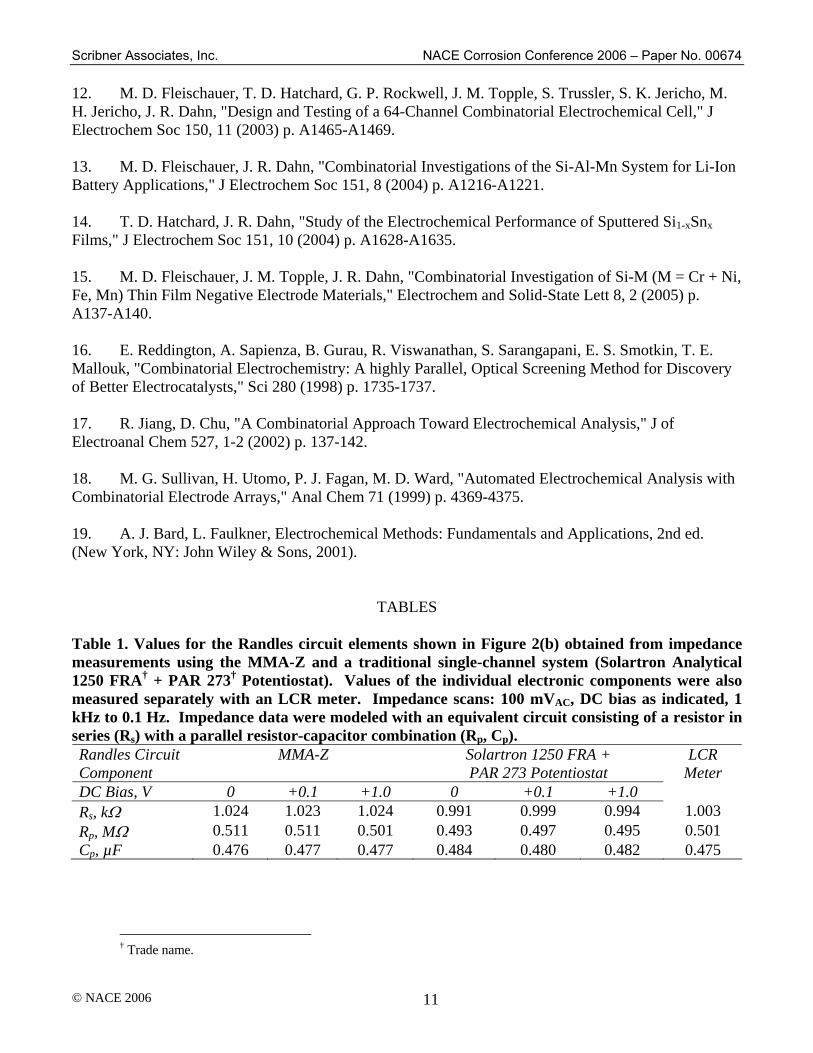
Table 1. Values for the Randles circuit elements shown in Figure 2(b) obtained from impedance measurements using the MMA-Z and a traditional single-channel system (Solartron Analytical 1250 FRA† + PAR 273† Potentiostat). Values of the individual electronic components were also measured separately with an LCR meter. Impedance scans: 100 mVAC, DC bias as indicated, 1 kHz to 0.1 Hz. Impedance data were modeled with an equivalent circuit consisting of a resistor in series (Rs) with a parallel resistor-capacitor combination (Rp, Cp). Randles Circuit Component
MMA-Z Solartron 1250 FRA + PAR 273 Potentiostat
DC Bias, V 0 +0.1 +1.0 0 +0.1 +1.0
LCR Meter
Rs, kΩ 1.024 1.023 1.024 0.991 0.999 0.994 1.003 Rp, MΩ 0.511 0.511 0.501 0.493 0.497 0.495 0.501 Cp, µF 0.476 0.477 0.477 0.484 0.480 0.482 0.475
† Trade name.
Scribner Associates, Inc. NACE Corrosion Conference 2006 – Paper No. 00674
© NACE 2006 12
FIGURES
WE1
A A A A A
2 3 N-1 N
CE
RE
Inter-electrode Current FlowPolarized Cell Current Flow
Potentiostat
Impedance Analyzer
GEN IV
MMA-Z Instrument
WE1
AA AA AA AA AA
2 3 N-1 N
CE
RE
Inter-electrode Current FlowPolarized Cell Current FlowInter-electrode Current FlowInter-electrode Current FlowPolarized Cell Current FlowPolarized Cell Current Flow
Potentiostat
Impedance Analyzer
GEN IV
MMA-Z Instrument
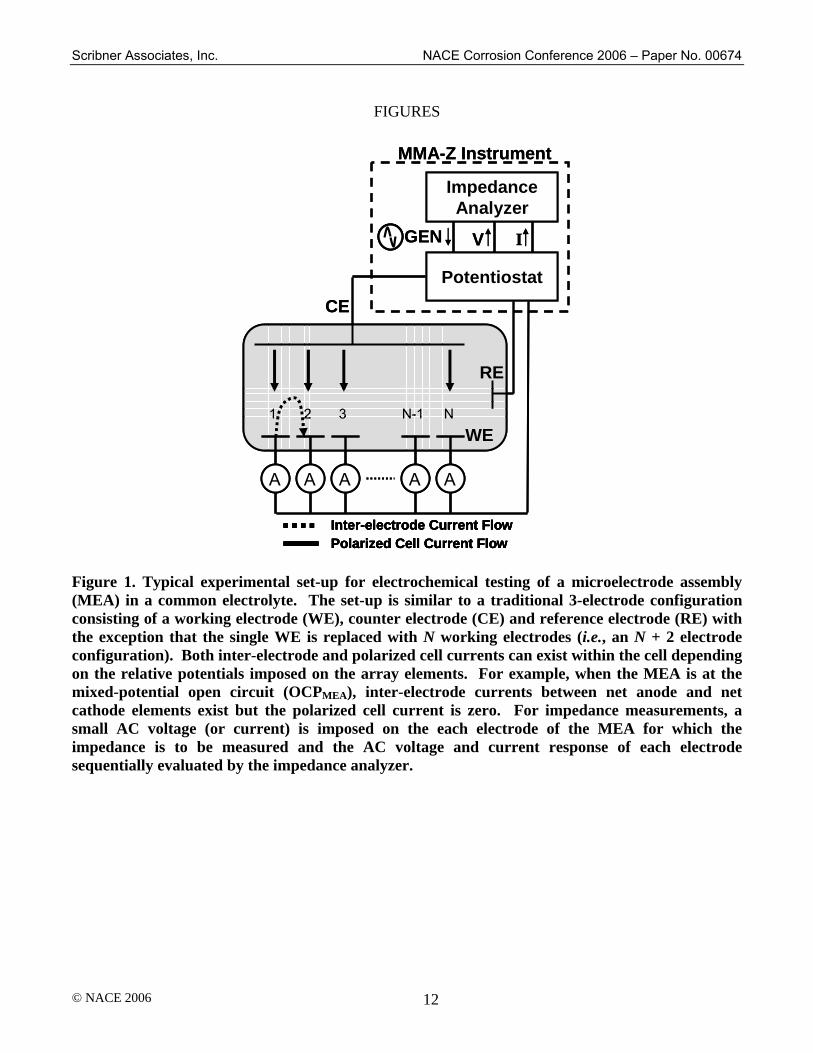
Figure 1. Typical experimental set-up for electrochemical testing of a microelectrode assembly (MEA) in a common electrolyte. The set-up is similar to a traditional 3-electrode configuration consisting of a working electrode (WE), counter electrode (CE) and reference electrode (RE) with the exception that the single WE is replaced with N working electrodes (i.e., an N + 2 electrode configuration). Both inter-electrode and polarized cell currents can exist within the cell depending on the relative potentials imposed on the array elements. For example, when the MEA is at the mixed-potential open circuit (OCPMEA), inter-electrode currents between net anode and net cathode elements exist but the polarized cell current is zero. For impedance measurements, a small AC voltage (or current) is imposed on the each electrode of the MEA for which the impedance is to be measured and the AC voltage and current response of each electrode sequentially evaluated by the impedance analyzer.

Scribner Associates, Inc. NACE Corrosion Conference 2006 – Paper No. 00674
© NACE 2006 13
Rs Rp
Cp
1 kΩ 0.5 MΩ
0.5 µF
Rs Rp
Cp
1 kΩ 0.5 MΩ
0.5 µF
(a) (b)
Figure 2. Electrical test modules used for testing of the MMA-Z instrument. (a) Resistor array consisting of one hundred 100 kΩ resistors (±1%). (b) Randles circuit to simulate an electrochemical cell consisting of a 1 kΩ resistor representing the electrolyte resistance (Rs) in series with a parallel R-C combination consisting of a 0.5 MΩ resistor representing the charge transfer resistance (Rp) and 0.5 µF capacitor representing the double layer capacitance (Cp).
(a) (b)
Figure 3. (a) Microelectrode assembly (MEA) composed of a 10x10 array of 1 mm (0.04 in) diameter nickel wires (inter-electrode spacing = 2 mm) used for the electrochemical impedance testing in quiescent 5% H2SO4 at ca. 22 °C. (b) Experimental set-up consisted of the 100 working electrode MEA aligned face-down in the solution, a common Pt-mesh counter electrode, and a saturated calomel reference electrode (SCE) in a Luggin capillary the tip of which was approximately centrally-located with respect to the MEA.

Scribner Associates, Inc. NACE Corrosion Conference 2006 – Paper No. 00674
© NACE 2006 14
100 101 102 103
-0.50
-0.25
0
0.25
Frequency, Hz
thet
a, d
eg
100 101 102 10398000
99000
100000
101000
102000
Frequency, Hz
|Z|,
ohm
±1%
100 101 102 103
-0.50
-0.25
0
0.25
Frequency, Hz
thet
a, d
eg
100 101 102 10398000
99000
100000
101000
102000
Frequency, Hz
|Z|,
ohm
±1%
Figure 4. Bode plots of the impedance response of the MMAZ using the resistor array described in Figure 2. Shown are 100 channels of measured impedance magnitude (|Z|) and phase angle (θ) as a function of frequency for 100 channels. The impedance of a pure resistor is independent of frequency and because its imaginary component (Z″) is zero, |Z| should equal the resistance of the resistor, |Z| = R and θ = 0°. For all 100 channels, the measured |Z| was within the rated ±1% accuracy of the resistors used to fabricate the resistor array (i.e., 100 kΩ ± 1 kΩ). 100 mVAC, 1 VDC, 1 Hz to 1 kHz.
Scribner Associates, Inc. NACE Corrosion Conference 2006 – Paper No. 00674
© NACE 2006 15
0 0.25 0.50
-0.55
-0.30
-0.05
Z', M-ohm
Z'',
M-o
hm
Randles_1 V.zRandles_100 mV.zRandles_ 0 V.zRandles_neg 1 V.z
+1 V or -1 V
DC bias = 0 V or +0.1 V
0.75 1.00 1.25
-0.50
-0.25
0
Z', k-ohm
Z'',
k-oh
m
Randles_1 V.zRandles_100 mV.zRandles_ 0 V.zRandles_neg 1 V.z
Z′(ω ∞) = Rs0.75 1.00 1.25
-0.50
-0.25
0
Z', k-ohm
Z'',
k-oh
m
Randles_1 V.zRandles_100 mV.zRandles_ 0 V.zRandles_neg 1 V.z
Z′(ω ∞) = Rs
(a) (b)
10-1 100 101 102 10310-3
10-2
10-1
100
Frequency, Hz
|Z|,
M-o
hm
Randles_1 V.zRandles_100 mV.zRandles_ 0 V.zRandles_neg 1 V.z
10-1 100 101 102 103
-100
-75
-50
-25
0
Frequency, Hz
thet
a, d
eg
10-1 100 101 102 10310-3
10-2
10-1
100
Frequency, Hz
|Z|,
M-o
hm
Randles_1 V.zRandles_100 mV.zRandles_ 0 V.zRandles_neg 1 V.z
10-1 100 101 102 103
-100
-75
-50
-25
0
Frequency, Hz
thet
a, d
eg
(c)
Figure 5. Impedance plots of the Randles equivalent circuit (shown in Figure 2(b)) measured on a single channel of the MMA-Z. (a) Complex plane plot indicates a small dependence of the measured impedance on the DC bias (VDC) at low frequency (see also Table 1). (b) Expanded view of the complex plane plot focusing on the high frequency portion of the impedance. The influence of DC bias at high frequencies was very small, if any (< 0.1% difference between the 0 and 1 VDC). (c) The effect of DC bias is not evident in the Bode plots which demonstrate explicitly the frequency dependence of the impedance. Conditions: 100 mVAC; VDC = -1.0, 0, 0.1, or +1.0 V vs. RE; 1 kHz to 0.1 Hz.

Scribner Associates, Inc. NACE Corrosion Conference 2006 – Paper No. 00674
© NACE 2006 16
0 100000 200000 300000 400000 500000
-400000
-300000
-200000
-100000
0
100000
Z'
Z''
1000 1500 2000 2500 3000
-1000
-500
0
500
1000
Z'
Z''
0 100000 200000 300000 400000 500000
-400000
-300000
-200000
-100000
0
100000
Z'
Z''
1000 1500 2000 2500 3000
-1000
-500
0
500
1000
Z'
Z''
10-3 10-2 10-1 100 101 102 103 104103
104
105
106
Frequency (Hz)
|Z|
10-3 10-2 10-1 100 101 102 103 104
-100
-50
0
50
Frequency (Hz)
thet
a
(a) (b) Figure 6. (a) Complex and (b) Bode plots of impedance spectra for a series of Randles equivalent circuits intended to simulate a local electrochemically active site in a passive surface. Ten equivalent circuits were used in these measurements: nine circuits consisted of a 1500 Ω resistor in series with a 100 µF capacitor that was in parallel with a 750 kΩ resistor; the tenth circuit consisted of a 1500 Ω resistor in series with a 100 µF capacitor in that was in parallel with a 499 Ω resistor. The inset in part (a) highlights the impedance response of the latter R-C circuit which simulated a locally active site among more passive electrodes. Units: Z′, Z″, and |Z| in ohms and theta in degrees.
1 2 103AB
J
CD
IH
E
GF
4 5 6 7 8 91 2 103AB
J
CD
IH
E
GF
4 5 6 7 8 9
Anodic
Cathodic
1x10⁻⁴
-1x10⁻⁴
0
0.5x10⁻⁴
-0.5x10⁻⁴
Current density, A/cm2
Anodic
Cathodic
1x10⁻⁴
-1x10⁻⁴
0
0.5x10⁻⁴
-0.5x10⁻⁴
Current density, A/cm2
Figure 7. Current map of the 10x10 Ni wire MEA acquired just prior to the impedance measurement. Some electrodes were persistently strong net anodes (red, e.g., E4) where as other electrodes were strongly cathodic (blue, e.g., E5). Microelectrodes are labeled with the following convention: rows are labeled A through J and columns are labeled 1 through 10, starting in the upper left.

Scribner Associates, Inc. NACE Corrosion Conference 2006 – Paper No. 00674
© NACE 2006 17
-0.5 -0.3 -0.1 0.1 0.3 0.5 0.7 0.910-9
10-8
10-7
10-6
10-5
10-4
E, VSCE
Cur
rent
Den
sity
, A/c
m2
OCPMEA
-0.5 -0.3 -0.1 0.1 0.3 0.5 0.7 0.910-9
10-8
10-7
10-6
10-5
10-4
E, VSCE
Cur
rent
Den
sity
, A/c
m2
OCPMEA
Figure 8. Polarization behavior of microelectrode array element A1. The OCP of array element A1 was -0.10 VSCE; the measured mixed-potential OCP of the MEA was -0.27 VSCE. The results are consistent with the current map in Figure 7 which indicated that array element A1 was cathodically polarized when coupled with the other electrodes in the MEA and at the mixed-potential OCP. Scan rate = 1 mV/s.
0 500 1000 1500
-1500
-1000
-500
0
Z', ohm-cm2
Z'',
ohm
-cm
2
10-1 100 101 102 103 104100
101
102
103
104
Frequency, Hz
|Z|,
ohm
-cm
2
10-1 100 101 102 103 104
-75
-50
-25
0
Frequency, Hz
thet
a, d
eg.
(a) (b)
Figure 9. (a) Complex plot and (b) Bode plots of the impedance spectra of 99 electrodes in the 10x10 Ni wire MEA in 5% H2SO4. There was a large range in the impedance response of the electrodes. Conditions: OCPMEA, ~ -027 VSCE, 15 mVAC, 3 kHz to 0.5 Hz.

Scribner Associates, Inc. NACE Corrosion Conference 2006 – Paper No. 00674
© NACE 2006 18
C4
D4
E5
E4
E3
0 500 1000 1500
-1500
-1000
-500
0
Z', ohm-cm2
Z'',
ohm
-cm
2
1 2 103AB
J
CD
IH
E
GF
4 5 6 7 8 91 2 103AB
J
CD
IH
E
GF
4 5 6 7 8 9
(a) (b)
Figure 10. (a) Complex plane impedance of five microelectrodes from the MEA representative of the range of observed impedance response. There is a strong correlation between the impedance of the individual microelectrode and the net DC condition of the electrode just before impedance experiment indicated by the current density in (b). For example, the current map indicated hat array element E4 was a strong net anode (iE4 ~ 1x10⁻⁴ A/cm2) and element E5 was a strong net cathode (iE5 ~ -1x10⁻⁴ A/cm2). Element E4 exhibited the smallest polarization resistance (smallest diameter impedance loop) whereas element E5 had the largest polarization resistance (largest loop diameter). Microelectrodes with DC current between these two extremes demonstrate generally exhibited impedance arcs that were also between these to extremes, as exemplified by elements E3 (weak net anode, iE3 ~ 2.5x10⁻⁵ A/cm2), C4 (iC4 0 A/cm2), and D4 (weak net cathode, iD4 ~ -2.5x10⁻⁵ A/cm2).