screening for viral hemorrhagic septicemia virus in lumpfish ( ) …½rslafinal.pdf · lykilorð:...
TRANSCRIPT
viðskipta- og raunvísindasvið
Lokaverkefni til BS gráðu í líftækni
Birta Líf Fjölnisdóttir
AuðlindadeildApríl 2016
Iceland with real-time RT-qPCR ( ) from Eyjafjörður,septicemia virus in lumpfish Screening for viral hemorrhagic
Cyclopterus lumpus

i
Háskólinn á Akureyri
Viðskipta- og Raunvísindasvið Námskeið LOK1126 og LOK1226
Heiti verkefnis Screening for viral hemorrhagic
septicemia virus in lumpfish
(Cyclopterus lumpus) from
Eyjafjörður, Iceland with real-time
RT-qPCR
Verktími Janúar 2016 – Apríl 2016
Nemandi Birta Líf Fjölnisdóttir
Leiðbeinandi Kristinn P. Magnússon
Upplag Rafrænt auk 3 prentaðra eintaka
Blaðsíðufjöldi 21
Fjöldi viðauka Einn
Fylgigögn Engin
Útgáfu- og notkunarréttur Opið verkefni. Verkefnið má ekki
fjölfalda, hvorki í heild né að hluta
til nema með leyfi höfundar

ii
Yfirlýsingar
Ég lýsi því hér yfir að ég er ein höfundur þessa verkefnis og að það sé afrakstur
eigin rannsókna.
Birta Líf Fjölnisdóttir, kt. 081190-2919
Það staðfestist hér að verkefni þetta fullnægir að mínum dómi kröfum til prófs í
námskeiðunum LOK1126 og LOK1226.
Kristinn P. Magnússon, leiðbeinandi

iii
Útdráttur Árið 2015 greindist viral hemorrhagic septicemia veiran (VHSV) í fyrsta skipti
á Íslandi. Veiran var greind í hrognkelsum (Cyclopterus lumpus) úr Breiðafirði,
með aðferðum þar sem frumulínur voru notaðar. Tilgangurinn með þessu
verkefni var að kanna hvort veiruna væri að finna í hrognkelsum úr Eyjafirði.
Til þess var notuð sameindaerfðafræðileg RT-qPCR aðferð sem hefur ekki
verið notuð hér á landi í þeim mæli, er æskilegt gæti talist, til slíkrar skimunar.
Tuttugu og þrír fiskar voru veiddir, krufðir og ástandsgreindir. Við krufningu
sýndu þrír fiskar svipuð einkenni og VHS veirusýktir fiskar. Eftir skimun með
RT-qPCR aðferðinni á RNA úr fiskunum, reyndust allir fiskarnir vera
neikvæðir fyrir VHSV.
Í ritgerðinni er rætt mikilvægi þess að skima eftir veirunni í hrognkelsum og
öðrum fisktegundum við Ísland í ljósi þess að veiran hefur greinst í
nágrannalöndum þar sem hún hefur breiðst hratt út síðustu ár, sér í lagi í
fiskeldum þar sem hún hefur valdið miklu tjóni. Í dag eru gerðar tilraunir með
að nota hrognkelsi við að hreinsa lýs af eldisfiski og þykir sú aðferð
umhverfisvæn og árangursrík. Hins vegar gæti stafað ógn af þeirri aðferð þar
sem að VHSV gæti mögulega borist inn í fiskeldin þegar notaðar eru aðrar
fisktegundir til hreinsunar á þennan máta. Real-time RT-qPCR aðferðin er því
kjörin aðferð til þess að skima eftir veirunni hér á landi sem og annars staðar.
Lykilorð: Viral hemorrhagic septicemia virus, real-time RT-qPCR, hrognkelsi
(Cyclopterus lumpus), fiskisjúkdómar, aflúsun

iv
Þakkarorð Ég vil byrja á því að þakka leiðbeinanda mínum Kristni P. Magnússyni fyrir
viðeigandi leiðsögn og leiðbeiningar er varðaði þetta verkefni. Mig langar líka
að þakka Rannveigu Björnsdóttir fyrir aðstoð við að koma verkefninu af stað
og stuðningi á meðan á því stóð. Auk þess vil ég þakka þeim Helga og Baldri
fyrir grásleppuna sem þeir veiddu og gáfu mér til þess að skima fyrir veirunni.
Að auki vil ég þakka stelpunum í umhverfisfræðistofunni fyrir stuðning, hlátur
og grátur, og þá sérstaklega Pálínu Haraldsdóttir fyrir að fylgja mér í gegnum
þetta allt saman.
En fyrst og fremst vil ég þakka sambýlismanni mínum og barnsföður, Gunnari
Rafni, fyrir ómælda þolinmæði, stuðning og hvatningu, ekki bara í gegnum
þetta verkefni heldur í gegnum allt BSc námið eins og það leggur sig. Á sama
tíma vil ég þakka dætrum mínum, Ninju Dögun og Yrju Lind, fyrir að umbera
mig og elska þrátt fyrir mikla álagstíma.
Takk öll sömul!
Akureyri, 7. Apríl, 2016
Birta Líf Fjölnisdóttir

v
Abstract Late last year, in 2015, the viral hemorrhagic septicemia virus (VHSV) was
detected for the first time in Iceland whereas the virus was discovered in
lumpfish (Cyclopterus lumpus) in Breiðafjörður, Western Iceland, with cell
culture methods.
The purpose of this study was to find out if the VHS virus was present
in lumpfish collected in Eyjafjörður, Northern Iceland. The screening was
carried out with real-time RT-qPCR, a molecular genetic method, which has
not ben used frequently in Iceland for that matter. Twenty-three specimens of
lumpfish were collected in nets, dissected and analyzed, of which, three
showed similar symptoms as found in VHSV infected fish. The results from
RT-qPCR screening proved all specimens to be negative for VHSV.
In this thesis, the importance of screening for VHSV is discussed due
to the fact that it is present in neighbouring countries and has been spreading
out fast, particularly within aquaculture where it is responsible for serious
commercial losses. Currently, delousing experiments within fish farming,
which include the use of lumpfish as cleaner fish, has gained a lot of interest,
and has shown great potential since this method is considered to be
environmentally friendly and effective. However, with this method the risk of
transmitting VHSV could increase and therefore be a big threat to the
aquaculture industry. Real-time RT-qPCR method is considered efficient and
accurate to screen for VHSV in Iceland, as well as other countries.
Keywords: Viral hemorrhagic septicemia virus, real-time RT-qPCR, lumpfish
(Cyclopterus lumpus), fish diseases, delousing

vi
Table of Contents 1. Introduction .................................................................................................. 1
1.1 Salmon louse (Lepeophtheirus salmonis) ............................................................ 21.1.1 Biological control of the Salmon louse ......................................................... 3
1.2 Viral hemorrhagic septicemia virus ................................................................... 41.2.1 VHSV control and prevention ....................................................................... 51.2.2 Detecting VHSV ............................................................................................ 5
1.3 Real-time RT-PCR method ................................................................................. 61.3.1 Real-time RT-PCR detection chemistries ...................................................... 91.3.2 Quantification methods ................................................................................ 10
1.4 Purpose ............................................................................................................... 11
2. Materials and Methods .............................................................................. 122.1 Sampling ............................................................................................................. 122.2 RNA extraction .................................................................................................. 122.3 Real-time RT-qPCR .......................................................................................... 132.4 Data analysis ....................................................................................................... 13
3. Results .......................................................................................................... 143.1 RNA integrity and quality ................................................................................. 143.2 Absolute quantification results ......................................................................... 143.3 Copy number determination ............................................................................. 163.4 Endogenous control results ............................................................................... 17
4. Discussions .................................................................................................. 18
5. Conclusions ................................................................................................. 21
6. References ................................................................................................... 22
7. Appendix I ................................................................................................... 26
vii
Table of Figures Figure 1. Reverse transcription .......................................................................... 7Figure 2. Reaction phases of real-time qPCR .................................................... 9Figure 3. Detection chemistries of real-time PCR ............................................. 9Figure 4. Merged image of RNA samples on 1.2% agarose gels taken with
GeneSnap software ........................................................................................... 14Figure 5. Amplification plots and standard curves of analyzed samples ......... 15Figure 6. Comparison of copy numbers between positive control and screened
samples ............................................................................................................. 17Figure 7. Amplification plots for endogenous control. .................................... 17
Table of Tables Table 1. Slope, y-intercept and CT values with R2 obtained from StepOne™
software for each standard curve ...................................................................... 16Table 2. Plate setup for run A ........................................................................... 26Table 3. Table setup for run B .......................................................................... 26

viii
Abbreviations OIE – World organization for animal health
DNA – Deoxyribonucleic acid
RNA – Ribonucleic acid
rRNA – Ribosomal RNA
cDNA – Complementary DNA
ssDNA – Single stranded DNA
dsDNA – Double stranded DNA
PCR – Polymerase chain reaction
RT-qPCR – Reverse transcription quantitative polymerase chain reaction
VHS – Viral hemorrhagic septicemia
VHSV – Viral hemorrhagic septicemia virus
EEU – Eurasian economic union
ESA – European free trade association (EFTA) surveillance authority
TBE buffer – Tris/Borate/EDTA buffer
EDTA – Ethylenediaminetetraacetic acid
FRET – Fluorescence resonance energy transfer
GOIs – Genes of interest
CT – Cycle threshold
ELISA – Enzyme-linked immunosorbent assay
DEPC – Diethylpyrocarbonate
DSMO – Dymethyl sulfoxide

1
1. Introduction In Iceland, fisheries have been one of the largest industries for decades, and
with fish as the main export product, covering approximately 40% of exports in
2014, there seems to be no retreat in that business whatsoever (Hagstofa
Íslands, n.d.)
Subsequently, with increased demand and globalization, the Icelandic
aquaculture industry has grown significantly, whereas employment within fish
farming has increased for about 20% since 2014 (Rúnarsson, CEO of the
National federation of Icelandic aquaculture, e-mail communications,
22.March 2016).
However, in aquaculture, as well as other industries, there can be
problems affecting the production where the most common problem within
fish farming is the salmon louse (Lepeophtheirus salmonis). However, there is
another problem that has been causing serious disease outbreaks all over the
world for the last decades, the viral hemorrhagic septicemia virus. Together
these problems in their different ways, hold responsibility for serious
commercial losses within the industry all over the world each year (Hamre et
al., 2013; Anna A. Schönherz, Lorenzen, Guldbrandtsen, Buitenhuis, & Einer-
Jensen, 2016)
Screening for VHSV is obligatory since it is a reportable pathogen according
to the world organization for animal health (OIE), and it has been done every
year in Iceland since 1985. The screening has been performed at Keldur,
research center for the Icelandic food and veterinary authority whereas it has
mainly been carried out with two types of cell culture methods (Árni
Kristmundsson, head of fish diseases at Keldur research center, e-mail
communications, 12.january, 2016).
However, the virus had never been detected until October last year
where it was found in wild lumpfish that was caught in Breiðafjörður, Western
Iceland. This caused a bit of a turmoil in the management of Icelandic fisheries
industry, since this indicated the loss of an EEU/ESA certification as well as

2
the loss of an aquaculture nations award that stated that Iceland was free of
reportable pathogens (Matvælastofnun Íslands, 2016a, 2016b).
The fact that VHS has now been detected in lumpfish in Iceland could
be a major problem and could mark the beginning of a synergy between
biological control of salmon louse and the implantation of serious infections in
fish farming. This synergy could occur because recent methods used to
eliminate the salmon louse in aquaculture trays have consisted of the use of
other fish species, namely, lumpfish as “cleaner fish”, which could therefore
increase the risk of VHS in aquaculture due to the fact that the virus can
transmit rather easily. Besides that, this could also indicate that VHSV is
spreading further around the world, which can be a huge threat to the
aquaculture industry as well as the commercial fishing industry in Iceland
(Imsland et al., 2014; Matvælastofnun Íslands, 2016b).
1.1 Salmon louse (Lepeophtheirus salmonis) The salmon louse, an ectoparasitic copepod of the family Caligidae, is one of
the major problems within fish farming in Northern Europe whereas the first
outbreak was observed at salmon farms in Norway in 1960s (Pike &
Wadsworth, 1999). However, it is also responsible for serious commercial and
economical losses all over the world, each year (Roth, Richards, &
Sommerville, 1993; Skern-Mauritzen, Torrissen, & Glover, 2014).
Although the louse is extremely ubiquitous, their growth rate, fertility
and evolution rely heavily on environmental factors such as temperature, host
distribution and adequacy as well as the competition between and within
species. For the salmon louse the temperature seems to be the most important
factor where they appear to thrive better at colder environments while their
generation time can decrease significantly at warmer areas (Costello, 2006).
Many researchers have described the developmental cycle of L.
salmonis as five different phases with either ten or eight different stages
depending on the author, when in fact the number of stages has been
controversial since the ecdysis steps can be hard to separate. However, the five
phases are called nauplius, copepodid (infectious stage), chalimus, preadult
and adult stage, where the mature adult females produce eggs for life after the
final molt of ecdysis. This constant production makes elimination of the louse

3
extremely hard since they can produce up to 11 pairs of egg strings during
their life span (Eichner et al., 2008; Hamre et al., 2013; Heuch, Nordhagen, &
Schram, 2000; Kabata, 1972).
As reviewed by K. Whelan, the louse attaches to a host fish, namely
salmon and fresh sea trout, and scrape their skin, mucus and other tissue
resulting in problems such as tissue necrosis, epithelium loss, bleeding and
other skin related manifestations. This can lead to an increase of the risk of
bacterial infections as well as the loss of innate immunity protections. Another
consequence is that the host can lose appetite, resulting in reduced growth and
physical functions. However, injuries caused by the salmon louse is usually not
fatal for the host unless it reaches a level that the host can not fix the damage
by itself with their natural defenses (Pike & Wadsworth, 1999; Whelan, 2010)
1.1.1 Biological control of the Salmon louse
Multiple methods, such as chemotherapeutic control with various chemicals
such as hydrogen peroxide and organophosphates, have been used in
aquaculture to get rid of the salmon louse as well as in-feed treatments and
synthetic pyrethroids (Imsland et al., 2015; Roth et al., 1993).
However, most of these methods have not been thoroughly successful,
which can be due to the fact that the lice is becoming resistant to some of
them. Because of that, a recent biological control method has gained a lot of
interest, which is sustainable and effective and therefore interesting for the
sake of public acceptance. This new method indicates the use of “cleaner fish”,
where other fish species, such as the Ballan wrasse (Labrus bergylta) and
lumpfish (Cyclopterus lumpus) are put into the aquaculture trays where they
feed on the lice and therefore serve as biological cleaners. However, the wrasse
is more sensitive to temperature since it thrives better at higher temperatures
(>8°C), while the lumpfish can resist colder environments and thus the
lumpfish is more feasible for biological delousing control in aquacultures
located at the northern hemisphere (Imsland et al., 2014).
As described by Imsland et al., the use of lumpfish as biological control
can decrease the lice infestations significantly with a mature female delousing
efficiency over 90%, and adult male delousing over 50% after merely three

4
months. However, the size of the lice seems to matter whereas it looks like it is
harder for the lumpfish to feed on smaller louses (Imsland et al., 2014).
1.2 Viral hemorrhagic septicemia virus Viral hemorrhagic septicemia (VHS) is a serious disease, with mortality rate of
up to 90%, caused by the viral hemorrhagic septicemia virus (VHSV), a
reportable fish pathogen with four different genotypes. It was first identified in
Danish rainbow trout around 1950 in Egtved, Denmark. Since then it has been
detected in over 80 freshwater and marine fish species in Europe, North
America and Northeast Asia, indicating that the virus is capable of adapting to
new host species and environments (Ito, Kurita, Mori, & Olesen, 2016; Jensen,
1965; Olesen, N.J. & Skall, 2015).
Wilhelm Schäperclaus first described VHS in 1954, where he noted that the
disease had the same symptoms as he had detected in trout at a fish farm in
Germany, several years before. Schäperclaus examined many rainbow trout
which all seemed to have the same or similar symptoms, that were, in most
cases, protruded eyes, fluid in stomach cavity, excessive fat around intestines,
dark spots on the pancreas as well as that the rear part of the kidneys were
swollen (Jensen, 1965; Schäperclaus, 1954). However, after multiple
experiments the symptoms have been described as clinical and/or behavioral
where the clinical symptoms can be inactivity, brisk mortality, hemorrhages
and other visual manifestations while the behavioral symptoms can be weird
swimming, such as spiraling, as well as that the fish will not try to escape
when put in net as usual (Olesen, N.J. & Skall, 2015).
Transmission of the virus can occur in various ways and seems to
affect fish at all ages, but the most known transmission pathway is by urine or
sexual fluids, such as eggs, whereas it seems to be a great possibility of
infection between wild fish and farmed fish (Garver et al., 2013; McAllister,
n.d.). However, it has been examined that the virus can be transmitted quite
easily by applications such as muscle and peritoneum injection, feeding,
coupling as well as brushing it on gills (Castric & Kinkelin, 1980; McAllister,
n.d.; A. A. Schönherz et al., 2012).

5
Therefore, there seems to be an urgent need for VHSV prevention or control
methods, since the virus has great potential of being one of the major problems
within the aquaculture industry because of its adaption potential and fast
spreading. Because of that, it is essential to rapidly identify the virus with
efficient and accurate methods.
1.2.1 VHSV control and prevention
Multiple methods have been tried to control or prevent VHS within fish
farming, whereas just few of them turned out to be successful. Those methods
consist mainly of aquaculture fallowing, reinfection or destruction of fish farms
and therefore not considered beneficial for the industry (Olesen & Korsholm,
1997; Olesen, 1998).
Other methods have been tried such as vaccination,
immunostimulation, resistance breeding, restocking with resistant species and
disinfection of eggs and larvae. However, none of these methods have been
reported efficient enough in the direct control or prevention of VHS except
disinfection of eggs and larvae, which is very expensive. Although, resistance
breeding and vaccination show a great potential but need further experiments
(Giuseppe Bovo, Barry Hill, Asbjørn Husby, Tore Håstein, Christian Michel,
Niels J. Olesen, 2005; Lorenzen & LaPatra, 2005; Olesen, N.J. & Skall, 2015;
Peddie, McLauchlan, Ellis, & Secombes, 2003).
1.2.2 Detecting VHSV
Since VHSV is a reportable fish pathogen that is spreading fast around the
world, it is essential to be able to detect it rapidly and accurately as fast as
possible. Researchers have mainly used direct methods to detect and identify
the virus, such as microscopic histological examination, agent isolation and
identification with cell cultures or artificial media. Other applications such as
antibody-based antigen methods such as enzyme-linked immunosorbent assay
(ELISA) and fluorescent tests, as well as serological tests have also been used
to detect VHSV (Olesen, N.J. & Skall, 2015).
However, to detect VHSV, molecular techniques such as RT-PCR and
real-time RT-PCR have gained a lot of interest over the last years because of
its accuracy in detecting all viral strains of VHSV, as well as it is more time
6
efficient than the conventional methods. With these molecular methods there is
no need for cell cultures, and the results are available in real time with high
accuracy. Therefore these methods are extremely convenient since the virus is
reportable and it can spread fast, and thus, cause a serious loss for those who it
may concern (Garver et al., 2011; Jonstrup, Kahns, Skall, Boutrup, & Olesen,
2013; Snow et al., 2004).
1.3 Real-time RT-PCR method Over the last decades molecular experiments have been used extensively where
methods such as the polymerase chain reaction (PCR), and real-time
polymerase chain reaction (real-time PCR) have been one of the leading
experimental applications used (Klug, Cummings, Spencer, & Palladino,
2010).
Kary Mullis was the first to describe the PCR in 1986, whereas it
marked a major breakthrough in molecular studies all over the world. With this
method researchers were able to investigate genetic material in a brand new
way that required just small amounts of DNA. They were now able to clone
without the use of host cells, determine mutations and genetic defects, identify
viruses and bacterial species and they were also able to fix and amplify
damaged DNA fractions by using the correct primers (Klug et al., 2010).
Polymerase chain reaction has been divided into three steps:
• Denaturation: Double DNA strands are denatured into two single
strands. This is done by increasing the temperature to 92-95°C
for about 1 minute.
• Hybridization/Annealing: Temperature is decreased slowly to 45-
65°C so primers can bind to the single stranded DNA. Keep in
mind at this stage the length of the primers, base composition and
the primer/single strand match when choosing the temperature.
• Extension: Temperature is increased to 65-75°C, DNA polymerase
starts making new DNA strands by adding bases at the end of the
primers in 5’ – 3’ direction. Keep in mind here which polymerase
is used, since not all proteins can handle the temperature changes
like in this reaction. In most cases Taq polymerase is used, a
polymerase derived from the bacteria Thermus aquaticus.
7
In each cycle of the reaction, which takes about 2-5 minutes, DNA strands are
doubled so after less than 3 hours the yields are over million-fold. For this
reaction, the DNA sequence needs to be rather short and it has to be known so
it is possible to design suitable primers (Klug et al., 2010).
Another method that was derived from PCR is the real-time RT-PCR (real-time
reverse transcription polymerase chain reaction). This method was also a
breakthrough since it made it possible to watch the polymerase chain reaction
in real time, as well as it was also possible to quantify the products with
specific methods such as absolute and relative quantification where specific
chemistries are applied. Real-time RT-PCR is highly sensitive but extremely
flexible with multiple different aspects (Bustin, 2000; Fleige & Pfaffl, 2006).
An important step before carrying out the reaction is to have high quality, non-
degraded RNA from tissue or cells. Quality, inhibitory components in sample
and storage condition may also have impact on the results (Bustin, 2000).
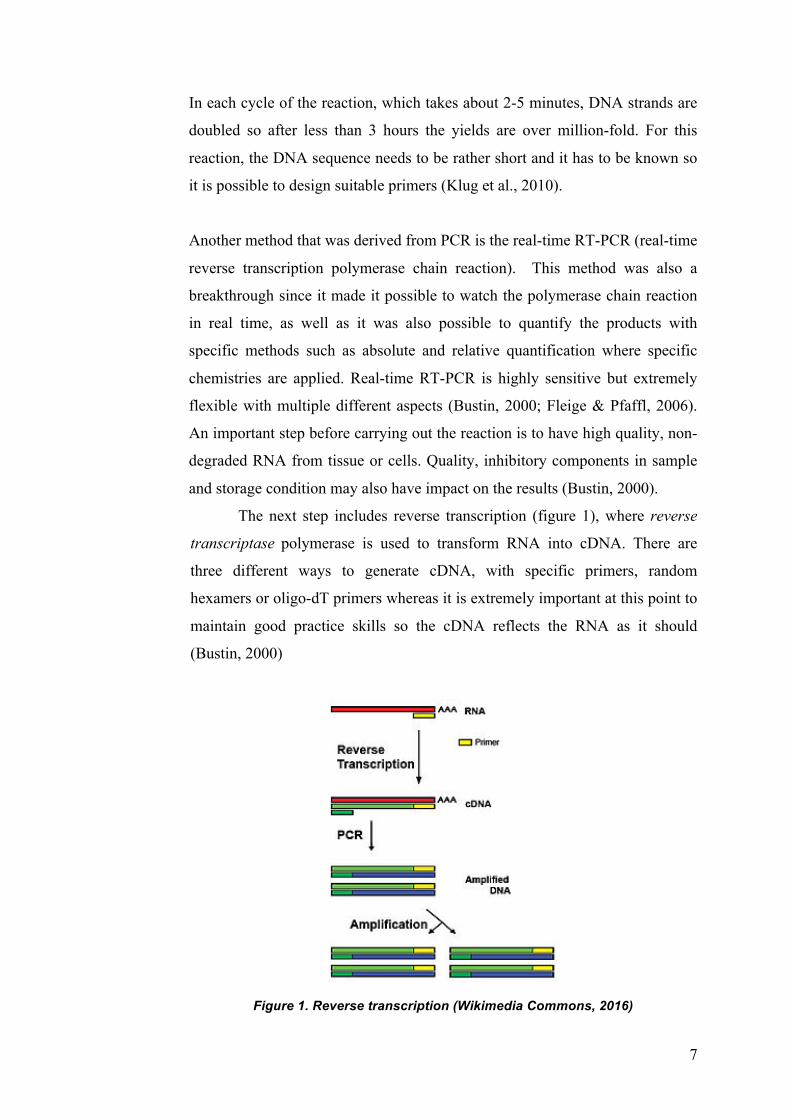
The next step includes reverse transcription (figure 1), where reverse
transcriptase polymerase is used to transform RNA into cDNA. There are
three different ways to generate cDNA, with specific primers, random
hexamers or oligo-dT primers whereas it is extremely important at this point to
maintain good practice skills so the cDNA reflects the RNA as it should
(Bustin, 2000)
Figure 1. Reverse transcription (Wikimedia Commons, 2016)
8
After cDNA synthesis, the real-time qPCR can be carried out with the
preferred fluorescent chemistry application, where fluorescent dyes are used.
The dyes bind specifically to double stranded DNA (dsDNA), not single
stranded DNA (ssDNA), resulting in fluorescent signals that specific
instruments detect from the surface of each sample tube. The light that reflects
from the surface indicates the quantity of the PCR amplified product after each
cycle. It also indicates an accurate number of molecules per sample since the
fluorescent signal increases at the same time as the molecules. The collected
results are imported to appropriate software at real time so the results can be
read at the same time that they occur. (Bustin, 2000).
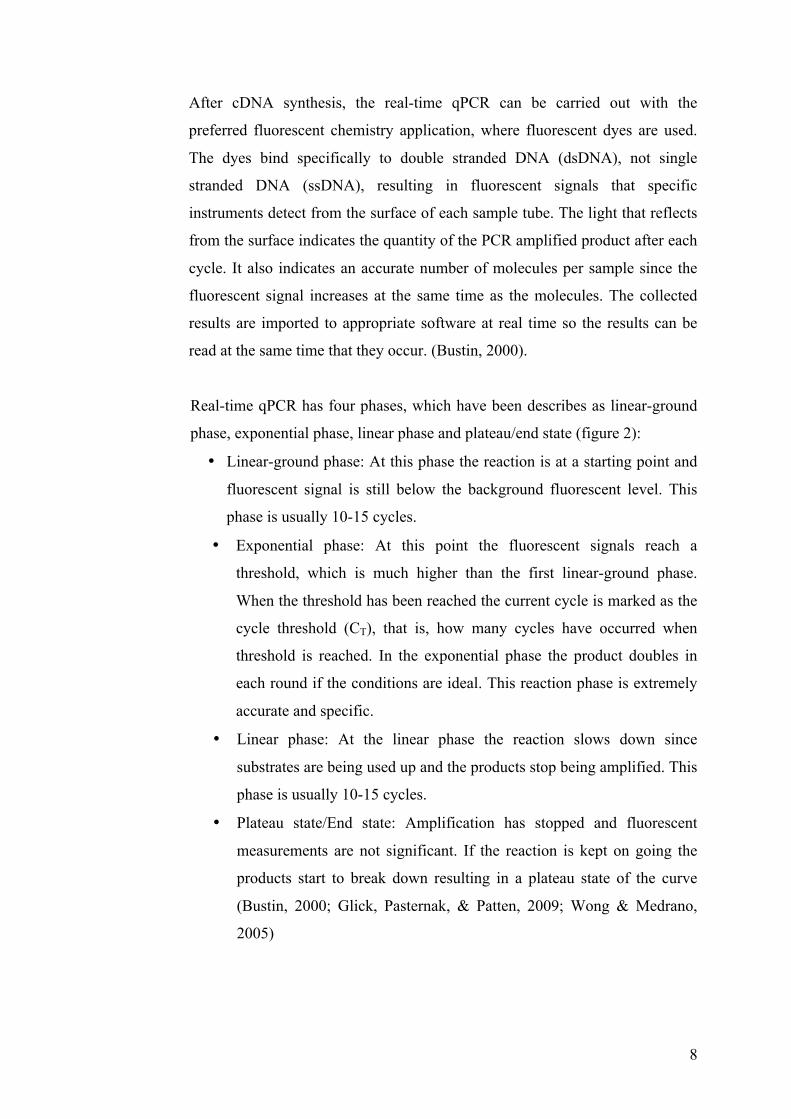
Real-time qPCR has four phases, which have been describes as linear-ground
phase, exponential phase, linear phase and plateau/end state (figure 2):
• Linear-ground phase: At this phase the reaction is at a starting point and
fluorescent signal is still below the background fluorescent level. This
phase is usually 10-15 cycles.
• Exponential phase: At this point the fluorescent signals reach a
threshold, which is much higher than the first linear-ground phase.
When the threshold has been reached the current cycle is marked as the
cycle threshold (CT), that is, how many cycles have occurred when
threshold is reached. In the exponential phase the product doubles in
each round if the conditions are ideal. This reaction phase is extremely
accurate and specific.
• Linear phase: At the linear phase the reaction slows down since
substrates are being used up and the products stop being amplified. This
phase is usually 10-15 cycles.
• Plateau state/End state: Amplification has stopped and fluorescent
measurements are not significant. If the reaction is kept on going the
products start to break down resulting in a plateau state of the curve
(Bustin, 2000; Glick, Pasternak, & Patten, 2009; Wong & Medrano,
2005)
9
Figure 2. Reaction phases of real-time qPCR (Source Molecular, n.d.)
However it is also an option to perform the reaction at the same time as the
reverse transcription in a single tube, and then it is referred to as one-step
reaction, while the traditional way is a two-step procedure where cDNA is
synthesized separately prior to the real-time reaction (Bustin, 2000)
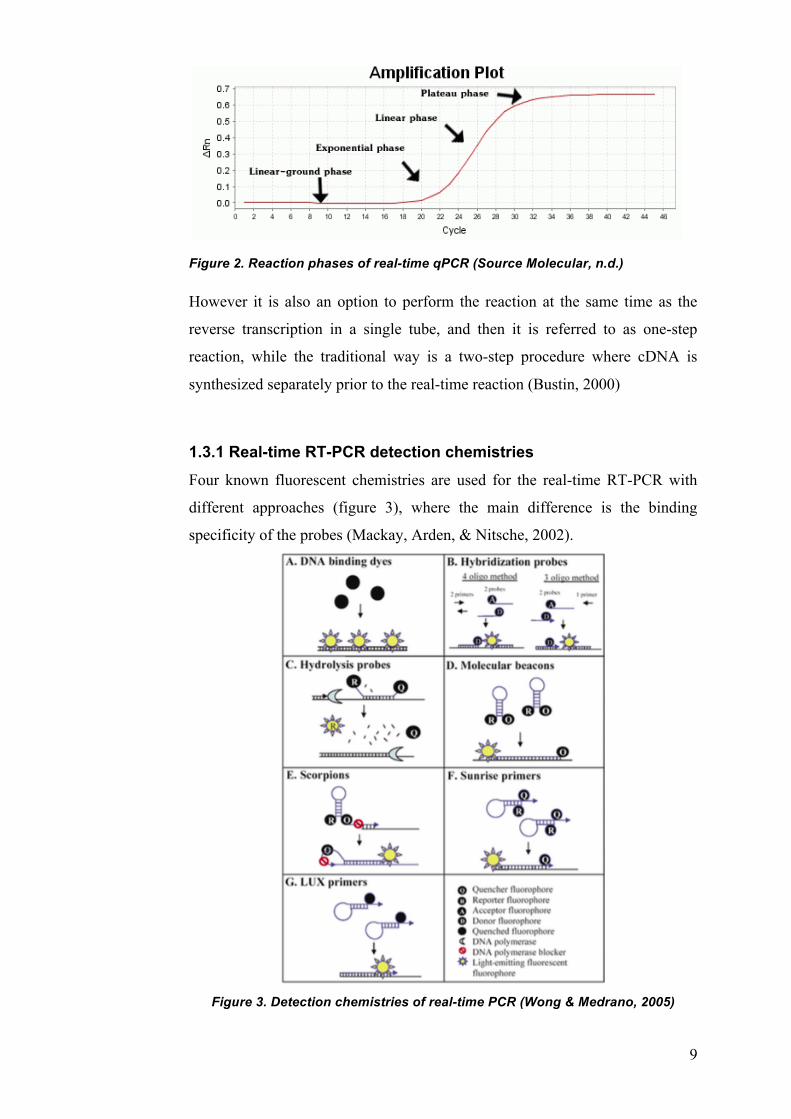
1.3.1 Real-time RT-PCR detection chemistries
Four known fluorescent chemistries are used for the real-time RT-PCR with
different approaches (figure 3), where the main difference is the binding
specificity of the probes (Mackay, Arden, & Nitsche, 2002).
Figure 3. Detection chemistries of real-time PCR (Wong & Medrano, 2005)

10
At first it is worth to mention the use of unspecific binding dyes, such as
SYBR® green I and ethidium bromide, where the dyes bind non-specifically to
dsDNA, resulting in the emission of fluorescent signal regardless of what
sequence is being amplified. When using binding dyes it is essential to perform
a melt curve analysis to determine the primer efficiency (Wong & Medrano,
2005).
The other three methods consist of fluorescence resonance energy
transfer (FRET), where hybridization, hydrolysis and hairpin probes are used
for the specific binding of fluorescent probes to the correct, distinct dsDNA
fragments. The hybridization probe chemistry includes the binding of labeled
primers and probes at each end of the strand so the background fluorophore on
the dsDNA excites the donor fluorophore when they come across each other,
resulting in a fluorescent signal of the amplicons. Hydrolysis probe chemistry
on the other hand, namely TaqMan® chemistry, includes the use of probes
consisting of a 25-30 nucleotide sequence, that is labeled at the 5’ end with a
reporter fluorochrome and a quencher at the 3’ end, which is degraded by
DNA polymerase when annealed to the specific sequence, resulting in high
emission of fluorescent signal. The third FRET chemistry consist of hairpin
probes such as molecular beacons and scorpion primers as well as Sunrise™
and LUX™ primers as reviewed by Wong and Medrano (Schaad & Frederick,
2002; Wong & Medrano, 2005).
1.3.2 Quantification methods
Real-time PCR can be used in three ways, that is, quantitatively (quantitative
real-time PCR) which is frequently used in gene expression studies, semi-
quantitatively where certain amount of DNA (above/below) is observed (semi
quantitative real-time PCR) or qualitatively (qualitative real-time PCR) where
quality is determined as well as it is used to observe which genes are present or
not (Glick et al., 2009)
Two known methods are used for quantification determination,
absolute quantification and relative quantification where it is often a question
which method is convenient whereas the type of the observed sample is what
eventually matters. With absolute quantification a standard curve is used to
calculate the total copy number of the PCR amplicons, which is good for
11
absolute results, such as viral screenings. This is done by plotting the
logarithm of dilution series of known samples, which indicate an initial
quantity, versus the cycle threshold. With this plot it is possible to generate a
derivate from the linear regression equation and therefore quantify the copy
number for each screened sample. However it is important to run standards for
each run to keep the data reliable and in contrast, although that may often not
be the case where many scientists use the same standard for multiple
experiments which can affect their accuracy (Bio-Rad Laboratories, 2006;
Boulter et al., 2016; Ferre, 1992)
With relative quantification on the other hand, one or more
householding or reference genes are used as calibrators or controls, whereas it
is essential that they have a gene expression on similar or same levels as the
genes of interest (GOIs). This method is convenient when the aim is to explore
physiological changes such as gene expression and thus quantify it with
specific mathematical applications. With relative quantification the aim is to
get a PCR efficiency at about 1 where the efficiency, CT and sample difference
are the key parameters when exploring gene expression of a GOI that is
normalized to a reference gene (Boulter et al., 2016; Pfaffl, Horgan, &
Dempfle, 2002)
1.4 Purpose The aim of this study was to screen for viral hemorrhagic septicemia virus in
lumpfish from selected areas in Eyjafjörður, Northern Iceland. For that
purpose, real-time RT-qPCR VHSV specific detection method was used since
current methods used for VHSV detection in Iceland is mainly cell culture
based methods and enzyme-linked immunosorbent assay (ELISA).
The following research questions were proposed:
• Is VHSV present in Eyjafjörður. Iceland?
• How efficient and accurate is real-time RT-qPCR to detect all
genotypes of VHSV?
• Are current methods used in Iceland to detect VHSV outdated?
12
2. Materials and Methods
2.1 Sampling Lumpfish were collected in nets at two different locations (66° 12.52”N, 018°
39.3“W and 66° 24.37”N, 018° 24.37”W) by fishermen in Eyjafjörður,
Northern Iceland between 18-25. February, 2016. The fish was kept on ice
before it was dissected. To prevent RNA degradation, spleen and kidney
samples were collected in eppendorf tubes from each fish and either put
straight into -20°C freezer, or freezed in liquid nitrogen and stored on dry ice
until it was stored in -20°C freezer.
2.2 RNA extraction Diethylpyrocarbonate (DEPC) treated water was prepared for RNA extraction
by adding 0.1mL of DEPC in 100mL MilliQ water (0,1% v/v) and mixed
vigorously, then it was incubated at 37°C for 12 hours, and at last, autoclaved
for 1 hour before it was used.
After sample collection, total RNA was extracted with TRizol reagent
(ThermoFisher, #15596026) according to manufacturer’s protocol with the
following modifications; 4!L of RNA extraction control from VHSV kit
(Techne, #TKIT12087M) was added to the extraction buffer before
homogenizing the samples to determine if the extraction was successful since
the VHSV kit included separate primers and probes to detect the exogenous
RNA. RNA integrity was also observed by gel electrophoresis on 1.2%
agarose gel. This was done by dissolving 1.2g of agarose in 100mL TBE
buffer (Tris/Borate/EDTA buffer) in a microwave oven. 2!L of SYBR® safe,
10.000X DSMO concentrate (Thermo Fisher, #S33102), was added into 75mL
of the 1.2% heated liquid gel and poured in a tray until it was solid.
Meanwhile, the samples were prepped by adding 2!L of RNA sample
with 8!L of DEPC treated water and 2!L of 6X concentrate gel loading
solution type I (New England Biolabs, #B7021S) in a 0.2mL MicroAmp™
reaction tubes (ThermoFisher, #N8011540). The tubes were then incubated in
a PCR machine at 65°C for 5min before added into wells. At last, 2!L of 1KB
13
DNA ladder (New England Biolabs, #N3232L) was put into one well and
10!L of each RNA sample was put in separate wells on the 1.2% agarose gel.
The gel was run for 35min at 115V and then analyzed under an UV light with
Syngene InGenius LHR gel documentation system (Synoptics, Ltd.,
Cambridge, England). Pictures were taken with GeneSnap software for further
examination.
2.3 Real-time RT-qPCR One-step quantitative real-time RT-PCR was performed with StepOne™ real-
time PCR system (Applied Biosystems, Foster City, USA) in a 0.1mL
MicroAmp fast optical 48-well reaction plate (ThermoFisher, #4375816). Viral
hemorrhagic septicemia virus kit was used according to manufacturer’s
protocol (Techne, #TKIT12087M) with TaqMan® chemistry. To determine the
absolute quantification a standard curve was included and performed according
to manufacturer’s protocol. Endogenous and exogenous controls were also
included and run at the same time (see appendix I for plate setup).
2.4 Data analysis RNA integrity was determined by examining the 1.2% agarose gel runs, as
well as observation of amplification curves from the exogenous control
included in the VHSV kit (Techne, #TKIT12087M). Real-time RT-qPCR Data
was collected and analyzed with StepOne™ real-time PCR system (Applied
Biosystems, Foster City, USA), where a standard curve method was used to
determine the absolute quantity of VHSV and if it was present or absent in the
collected samples.
14
3. Results
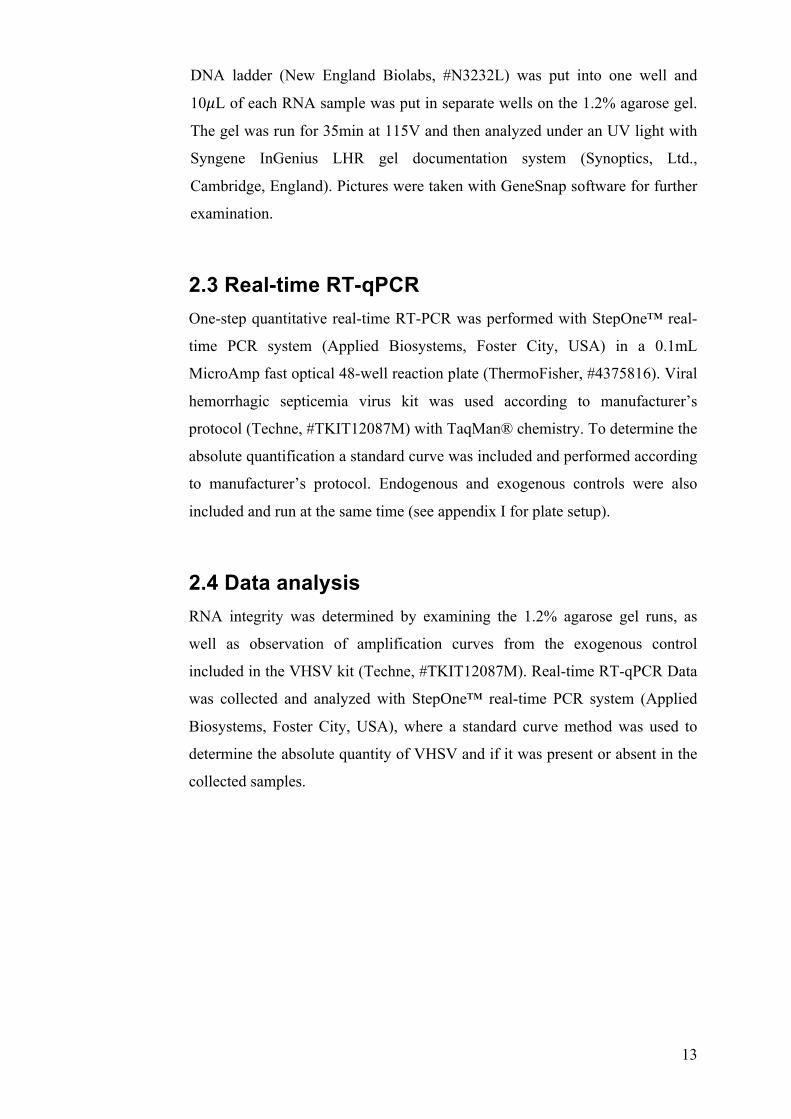
3.1 RNA integrity and quality Figure 4 indicates all of the extracted RNA samples where each band indicates
total RNA of that concentration. A 1KB DNA ladder was used for the analysis
where the significant top bands at approximately 1.0KB should be 28S rRNA
while the significant bands at about 0.5kb should be the 18S rRNA, the third
significant band below that should indicate 5S rRNA.
Figure 4. Merged image of RNA samples on 1.2% agarose gels taken with
GeneSnap software
Most of the samples did not degrade below 5S rRNA and therefore considered
to give reliable results when carried out in a real-time RT-PCR reaction.
Amplification plots from the RNA extraction control from the VHSV kit was
not considered reliable to detect the quality of the extraction due to a mistake
when mixing the materials provided by manufacturer. Therefore the results
obtained from the StepOne™ system were omitted from this study.
3.2 Absolute quantification results All of the 23 samples were run and analyzed with StepOne™ real-time PCR
software where all of the absolute negative samples were omitted to make the
figures clearer for analysis. Each sample was run in a single tube, and since
none of them turned out to be positive it was decided to make that count as
definite results without repetition.

15
Like the standard curves on figure 5 indicate, all of the samples turned out to
be negative, that is, there was no significant amplification. The one point
(green) within the standards on both of the curves is the positive control.
On the right standard curve some of the sample seem to reach the threshold
after more than 35 cycles, which indicates late amplification, and thus not
considered significant results.
Figure 5. Amplification plots and standard curves of analyzed samples

16
3.3 Copy number determination To determine with a fair certainty that the late amplicons (figure 5, right
standard curve) were negative, even though they reached the threshold before
the last cycle of the reaction, a copy number quantification was performed by
using a derivation of the linear regression equation, y = mx + b. Determination
of quantity for these samples was done by plotting the logarithm of the initial
copy numbers versus the CT values so:
CT = m(log quantity) + b
And thus, the quantity of the unknown samples could be calculated with the
following equation:
Quantity = 10(!!!!! )
The quantity could then be calculated based on the given slope, CT and y-
intercept values, as shown in table 1, that was obtained from the StepOne™
software.
Table 1. Slope, y-intercept and CT values with R2 obtained from StepOne™
software for each standard curve
A BSlope -3.477 -3.443Y-intercept 36.344 34.502CT 18.62 16.76R2 0.997 0.999
When copy number had been calculated the samples were compared with the
positive controls by a column graph (figure 6).

17
As figure 6 indicates, none of the samples had a significant number of copies
per !L (<0.5) if compared with the positive controls and therefore not
considered to have the viral hemorrhagic septicemia virus.
Figure 6. Comparison of copy numbers between positive control and screened
samples
3.4 Endogenous control results Endogenous control reaction was run in a separate tube, at the same time as the
VHSV reaction, to determine if the extraction of valid biological template was
successful whereas an endogenous specific primer and probe mix was included
in the VHSV kit to detect an endogenous gene. All of the samples had
significant amplification curves for that matter except five samples, which
were omitted from the amplification plot in figure 7.
Figure 7. Amplification plots for endogenous control. Left: run A, Right: run B
020,00040,00060,00080,000100,000120,000140,000160,000Copynum
berperμL
Sample
Copynumbercomparison
18
4. Discussions With this study, 23 kidneys in total, from 23 separate lumpfishes, were
screened for VHSV with real-time RT-qPCR method. This was done to prove,
with a sensitive and an accurate method, that the detection of VHSV late last
year in Breiðafjörður is not an unique incident, but to prove that the virus has
become prevalent in Iceland, and therefore a significant threat to the Icelandic
aquaculture- and commercial fishing industry (Matvælastofnun Íslands,
2016a).
At first, RNA integrity and quality was determined with gel electrophoresis to
ensure it was possible to use it for further steps. Gel images taken with
GeneSnap software indicated that the RNA was not degraded and therefore
usable for next steps. However, it would have been preferred to have more
significant bands on the gels with better contrast on 28S, 16S and 5S. It would
also have been preferred to compare the agarose gels with the RNA exogenous
control, which failed, for accurate final conclusion.
All of the screened samples were analyzed with StepOne™ software with a
standard curve method, where the copy number was calculated for the absolute
quantification of all genotypes of VHSV. Results obtained from these analyses
indicated that all of the specimens turned out to be negative, that is, none of the
samples were amplified when carried out with real-time PCR.
However, some of the amplicons seemed to have reached late cycle threshold
and hence the copy number was calculated for those samples. Copy number
calculations however, showed no significant results where all of the amplicons
had copy number per !L below 0.5 and therefore not considered to be positive
due to the fact that the positive controls had copy numbers above 120.000 per
!L.
However, after consideration it was estimated that these results do not
indicate in a significant matter that the virus is really not prevalent in Iceland.
This is due to the fact that the sample size for this study was extremely small,
as well as the fact that the samples were just collected at two different times in
Eyjafjörður alone. To get reliable results it would be necessary to collect
samples of a greater size at multiple various places, not to mention, at those

19
areas that the virus has already been detected. Thus, it is considered essential
to precisely screen for VHSV all around Iceland in a much greater manner that
it has already been done over the last decades.
This study however, turned out to be in contrast with other studies and showed
that the real-time RT-qPCR method is extremely good to screen for the virus
because of its sensitivity and rapidity (Jonstrup et al., 2013). For a study like
this it is good to be able to detect the absolute quantity whereas the standard
curve method is also very “user friendly” and easy to apply on data such as
obtained for virus studies like this one. The detection kit that was purchased
from Techne for this study, turned out to be extremely specific, supposedly
able to detect all genotypes of VHSV, which is a great advantage for virus
screening where the virus has multiple strains. Current methods used to detect
the virus in Iceland consist mainly of cell culture based methods as well as
ELISA, based on this study as well as other studies it is recommended to
update the detection methods since these methods are more time consuming
and less accurate (Árni Kristmundsson, head of fish diseases at Keldur research
center, e-mail communications, 12.january; 2016; Jonstrup et al., 2013)
For this study, TaqMan® chemistry was applied because of its specificity,
however it would have been nice to apply other real-time RT-PCR chemistries
such as SYBR® green chemistry to compare the specificity of the primers and
the amplification obtained from both chemistries.
If the virus however, would turn out to be prevalent in Iceland, namely in
lumpfish, it could have serious consequences like previously mentioned since
recent experiments in aquacultures have focused on using lumpfish as
biological control for the salmon louse, a serious occurring fish farming
problem all over the world. Since the virus seems to be spreading fast, as OIE
report indicates, the use of different fish species as a biological control for the
salmon louse could cause the transmission of VHSV into aquaculture trays not
to mention since the transmission seems to occur via multiple pathways. This is
something that has to be taken into consideration when applying “cleaner fish”
to the trays where it is essential to screen for the virus prior to the insertion of
them to prevent a synergy between the biological control and virus

20
transmission, especially in colder environments since the virus optimal
temperature is 2-20°C and the salmon louse thrives better in colder
environments as previously mentioned (Costello, 2006; Olesen, N.J. & Skall,
2015).
Prevalence of VHSV in Iceland could also be a major threat to the
Icelandic aquaculture- and commercial fishing industry since it had never been
a problem in Iceland before it was detected in Octobers last year, as reported
by Matvælastofnun Íslands (Matvælastofnun Íslands, 2016a). With that said,
there is no reason to believe that the virus is not capable of adapting to
Icelandic environments and it is quite easy to estimate that it already has or at
least is close to it because of its rapid spreading and serious outbreaks all over
the world (Olesen, N.J. & Skall, 2015).
21
5. Conclusions Twenty-three samples from lumpfish in Eyjafjörður were screened for VHSV,
where all specimens turned out to be negative for VHSV. However, it is
essential to have samples that reflect the reality for a study like this, that is, a
greater sample size collected at multiple different areas around Iceland. There
is no reason to believe that the virus is not present in Iceland since it has been
detected all over the world whereas it seems to adapt to various environments
as reported by OIE (Costello, 2006; Olesen, N.J. & Skall, 2015)
It is also essential to screen for VHSV before applying other fish species into
aquaculture trays for biological control since that could increase the risk of
VHSV within fish farming, making a major problem a worse. Therefore, the
detection and data analysis of the virus should be rather easy but at the same
time, sensitive, accurate and rapid, which real-time RT-qPCR is and thus it is a
feasible option as VHSV detection method.
The use of other fish species as biological control, in fish farming, is extremely
smart, and not to mention supporting the increase in environmental awareness
with a lot of interest in “white” biotechnology. With that said it would be
seriously harming if this application marked the beginning of a synergy
between biological control and transmitting viral diseases.

22
6. References Bio-Rad Laboratories. (2006). Real-time PCR Applications Guide. Retrieved
April 7, 2016, from http://www.bio-rad.com/webroot/web/pdf/lsr/literature/Bulletin_5279.pdf
Boulter, N., Suarez, F. G., Schibeci, S., Sunderland, T., Tolhurst, O., Hunter, T., … Duggan, K. (2016). A simple, accurate and universal method for quantification of PCR. BMC Biotechnology, 16(1), 27. doi:10.1186/s12896-016-0256-y
Bustin, S. A. (2000). Absolute quantification of mRNA using real-time reverse transcription polymerase chain reaction assays. Journal of Molecular Endocrinology, 25(2), 169–193. doi:JME00927 [pii]
Castric, J., & Kinkelin, D. P. (1980). Occurrence of viral haemorrhagic septicaemia in rainbow trout Salmo gairdneri Richardson reared in sea-water. Journal of Fish Diseases, 3(1), 21–27. doi:10.1111/j.1365-2761.1980.tb00180.x
Costello, M. J. (2006). Ecology of sea lice parasitic on farmed and wild fish. Trends in Parasitology, 22(10), 475–483. doi:10.1016/j.pt.2006.08.006
Eichner, C., Frost, P., Dysvik, B., Jonassen, I., Kristiansen, B., & Nilsen, F. (2008). Salmon louse (Lepeophtheirus salmonis) transcriptomes during post molting maturation and egg production, revealed using EST-sequencing and microarray analysis. BMC Genomics, 9, 126. doi:10.1186/1471-2164-9-126
Ferre, F. (1992). Quantitative or semi-quantitative PCR:Reality versus myth. PCR Methods Appl., ?, 1–9. doi:10.1101/gr.2.1.1
Fleige, S., & Pfaffl, M. W. (2006). RNA integrity and the effect on the real-time qRT-PCR performance. Molecular Aspects of Medicine, 27(2-3), 126–139. doi:10.1016/j.mam.2005.12.003
Garver, K. A., Hawley, L. M., McClure, C. A., Schroeder, T., Aldous, S., Doig, F., … Richard, J. (2011). Development and validation of a reverse transcription quantitative PCR for universal detection of viral hemorrhagic septicemia virus. Diseases of Aquatic Organisms, 95(2), 97–112. doi:10.3354/dao02344
Garver, K. A., Traxler, G. S., Hawley, L. M., Richard, J., Ross, J. P., & Lovy, J. (2013). Molecular epidemiology of viral haemorrhagic septicaemia virus (VHSV) in British Columbia, Canada, reveals transmission from wild to farmed fish. Diseases of Aquatic Organisms, 104(2), 93–104. doi:10.3354/dao02588
Giuseppe Bovo, Barry Hill, Asbjørn Husby, Tore Håstein, Christian Michel, Niels J. Olesen, A. S. and P. J. M. (2005). Pathogen survival outside the host, and susceptibility to disinfection. Veterinærmedisinsk Oppdragssenter AS. doi:10.2307/3440160
Glick, B. R., Pasternak, J. J., & Patten, C. L. (2009). Molecular Biotechnology: Principles and Applications of Recombinant RNA (4th ed.). Washington DC, USA: AMS Press.
Hagstofa Íslands. (n.d.). Útflutningur eftir vöruflokkum (Hagstofuflokkun)
23
1999-2014. Retrieved March 9, 2016, from http://px.hagstofa.is/pxis/pxweb/is/Efnahagur/Efnahagur__utanrikisverslun__1_voruvidskipti__04_utflutningur/UTA02105.px/table/tableViewLayout1/?rxid=1cc3eb23-8d3a-4662-ae57-b6a2c187de24
Hamre, L. A., Eichner, C., Caipang, C. M. A., Dalvin, S. T., Bron, J. E., Nilsen, F., … Skern-Mauritzen, R. (2013). The Salmon Louse Lepeophtheirus salmonis (Copepoda: Caligidae) Life Cycle Has Only Two Chalimus Stages. PLoS ONE, 8(9), 1–9. doi:10.1371/journal.pone.0073539
Heuch, P. A., Nordhagen, J. R., & Schram, T. A. (2000). Egg production in the salmon louse [Lepeophtheirus salmonis (Kroyer)] in relation to origin and water temperature. Aquaculture Research, 31(11), 805–814. doi:10.1046/j.1365-2109.2000.00512.x
Imsland, A. K., Reynolds, P., Eliassen, G., Hangstad, T. A., Foss, A., Vikingstad, E., & Elvegård, T. A. (2014). The use of lumpfish (Cyclopterus lumpus L.) to control sea lice (Lepeophtheirus salmonis Krøyer) infestations in intensively farmed Atlantic salmon (Salmo salar L.). Aquaculture, 424-425, 18–23. doi:10.1016/j.aquaculture.2013.12.033
Imsland, A. K., Reynolds, P., Eliassen, G., Hangstad, T. A., Nytrø, A. V., Foss, A., … Elvegård, T. A. (2015). Assessment of suitable substrates for lumpfish in sea pens. Aquaculture International, 23(2), 639–645. doi:10.1007/s10499-014-9840-0
Ito, T., Kurita, J., Mori, K. I., & Olesen, N. J. (2016). Virulence of viral haemorrhagic septicaemia virus (VHSV) genotype III in rainbow trout. Veterinary Research, 47(1), 1–13. doi:10.1186/s13567-015-0303-z
Jensen, M. H. (1965). Research on the virus of Egtved disease. Annals of the New York Academy of Sciences, 126(1), 422–426. doi:10.1111/j.1749-6632.1965.tb14292.x
Jonstrup, S. P., Kahns, S., Skall, H. F., Boutrup, T. S., & Olesen, N. J. (2013). Development and validation of a novel Taqman-based real-time RT-PCR assay suitable for demonstrating freedom from viral haemorrhagic septicaemia virus. Journal of Fish Diseases, 36(1), 9–23. doi:10.1111/j.1365-2761.2012.01416.x
Kabata, Z. (1972). Developmental Stages of Caligus clemensi (Copepoda: Caligidae). J. Fish. Res. Bd. Canad, 29(11), 1571–159. doi:10.1139/f72-245
Klug, W. S., Cummings, M. R., Spencer, C. A., & Palladino, M. A. (2010). Concepts of genetics. (B. Wilbur, Ed.) (10th ed.). United States of America: Pearson Benjamin Cummings. doi:10.1017/CBO9781107415324.004
Lorenzen, N., & LaPatra, S. E. (2005). DNA vaccines for aquacultured fish. Revue Scientifique et Technique (International Office of Epizootics), 24(1), 201–213. doi:10.3354/dao056031
Mackay, I. M., Arden, K. E., & Nitsche, A. (2002). Real-time PCR in virology. Nucleic Acids Research, 30(6), 1292–1305. doi:10.1093/nar/30.6.1292
24
Matvælastofnun Íslands. (2016a). Ársskýrsla Dýralæknis Fiskisjúkdóma 2015. Retrieved from http://www.mast.is/library/Sk?rslur/Arsskyrsladyralaeknisfisksjukdoma2015.pdf
Matvælastofnun Íslands. (2016b). Skimanir vegna smitsjúkdóma í dýrum. Retrieved from http://www.mast.is/library/Eftirlitsni?urst??ur/EftirlitsnidurstodurDyrasjukdomaskimun160315AA.pdf
McAllister, P. E. (n.d.). Viral Hemorrhagic Septicemia of Fishes. Retrieved March 27, 2016, from http://www.aquatext.com/images/diseases/vhs.htm#intro
Olesen, N. J. (1998). Sanitation of viral haemorrhagic septicaemia (VHS). Journal of Applied Ichthyology, 14(3-4), 173–177. doi:10.1111/j.1439-0426.1998.tb00638.x
Olesen, N. J., & Korsholm, H. (1997). Control measures for viral diseases in aquaculture: Eradication of VHS and IHN. Bulletin of the European Association of Fish Pathologists.
Olesen, N.J. & Skall, H. F. (2015). Viral Haemorrhagic Septicaemia. In Manual of Diagnostic Tests for Aquatic Animals (6th ed.). OIE - World Organisation for Animal Health. Retrieved from http://www.oie.int/index.php?id=2439&L=0&htmfile=chapitre_vhs.htm#BAAFAGFD
Peddie, S., McLauchlan, P. E., Ellis, A. E., & Secombes, C. J. (2003). Effect of intraperitoneally administered IL-1beta-derived peptides on resistance to viral haemorrhagic septicaemia in rainbow trout Oncorhynchus mykiss. Diseases of Aquatic Organisms, 56(3), 195–200. doi:10.3354/dao056195
Pfaffl, M. W., Horgan, G. W., & Dempfle, L. (2002). Relative expression software tool (REST) for group-wise comparison and statistical analysis of relative expression results in real-time PCR. Nucleic Acids Research, 30(9), e36. doi:10.1093/nar/30.9.e36
Pike, A. W., & Wadsworth, S. L. (1999). Sealice on salmonids: their biology and control. Advances in parasitology (Vol. 44). doi:10.1016/S0065-308X(08)60233-X
Roth, M., Richards, R., & Sommerville, C. (1993). Current practices in the chemotherapeutic control of sea lice infestations in aquaculture : a review. Journal of Fish Diseases, 16(APRIL 2006), 1–26. doi:10.1111/j.1365-2761.1993.tb00844.x
Rúnarsson, G. (2016). Summary for Policymakers. (Intergovernmental Panel on Climate Change, Ed.)Fiskistofa. Cambridge: Cambridge University Press. doi:10.1017/CBO9781107415324.004
Schaad, N. W., & Frederick, R. D. (2002). Real-time PCR and its application for rapid plant disease diagnostics. Can. J. Plant Pathol., 24, 250–258.
Schäperclaus, W. (1954). Undersøgelse af sygdom hos ørrederne i danske ørreddambrug og forslag til bekæmpelse heraf. Ferskvandsfiskeribladet, 52(10), 145–149.
Schönherz, A. A., Hansen, M. H. H., Jørgensen, H. B. H., Berg, P., Lorenzen,

25
N., & Einer-Jensen, K. (2012). Oral transmission as a route of infection for viral haemorrhagic septicaemia virus in rainbow trout, Oncorhynchus mykiss (Walbaum). Journal of Fish Diseases, 35(6), 395–406. doi:10.1111/j.1365-2761.2012.01358.x
Schönherz, A. A., Lorenzen, N., Guldbrandtsen, B., Buitenhuis, B., & Einer-Jensen, K. (2016). Ultra-deep sequencing of VHSV isolates contributes to understanding the role of viral quasispecies. Veterinary Research, 47(1), 1–12. doi:10.1186/s13567-015-0298-5
Skern-Mauritzen, R., Torrissen, O., & Glover, K. A. (2014). Pacific and Atlantic Lepeophtheirus salmonis (Krøyer, 1838) are allopatric subspecies: Lepeophtheirus salmonis salmonis and L. salmonis oncorhynchi subspecies novo. BMC Genetics, 15, 32. doi:10.1186/1471-2156-15-32
Snow, M., Bain, N., Black, J., Taupin, V., Cunningham, C. O., King, J. A., … Raynard, R. S. (2004). Genetic population structure of marine viral haemorrhagic septicaemia virus (VHSV). Diseases of Aquatic Organisms, 61(1-2), 11–21. doi:10.3354/dao061011
Source Molecular. (n.d.). Quantification of fecal sources: Microbial Source Tracking qPCR. Retrieved April 4, 2016, from http://www.sourcemolecular.com/microbial-source-tracking/quantification.html
Whelan, K. (2010). A Review of the Impacts of the Salmon Louse , Lepeophtheirus salmonis ( Krøyer , 1837 ) on Wild Salmonids, (August), 27.
Wong, M. L., & Medrano, J. F. (2005). Real-time PCR for mRNA quantitation. BioTechniques, 39(1), 75–85. doi:10.2144/05391RV01
26
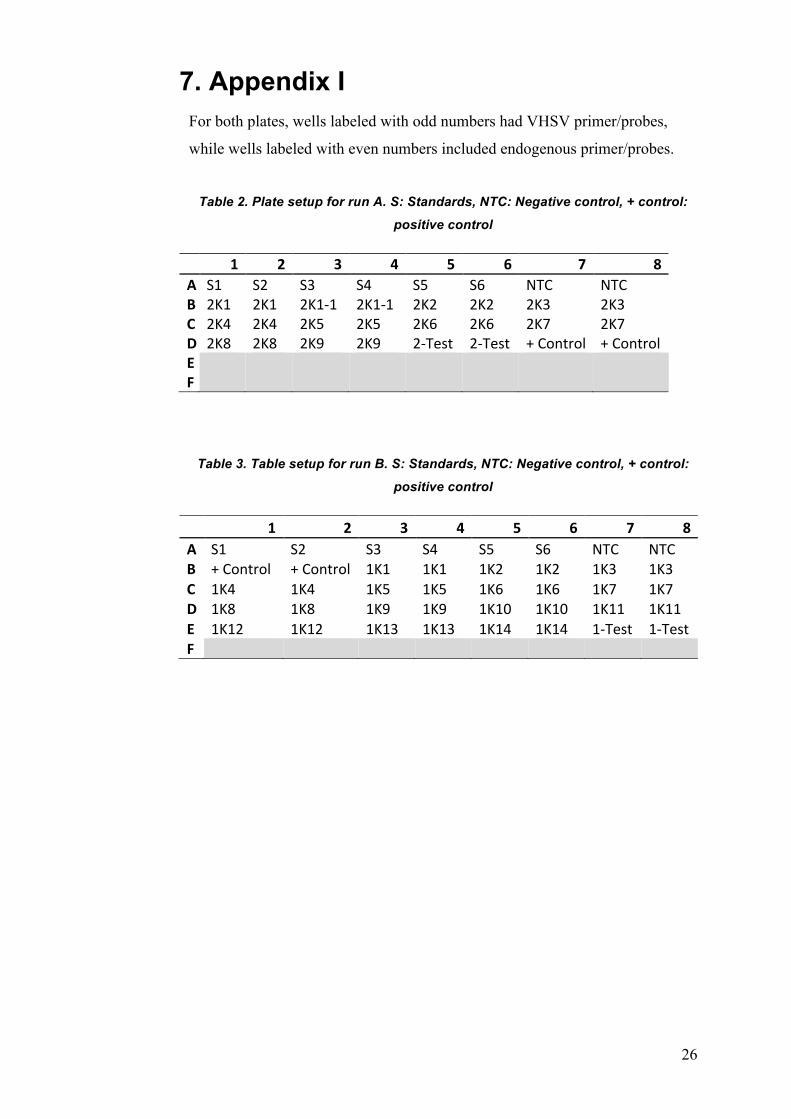
7. Appendix I For both plates, wells labeled with odd numbers had VHSV primer/probes,
while wells labeled with even numbers included endogenous primer/probes.
Table 2. Plate setup for run A. S: Standards, NTC: Negative control, + control:
positive control
1 2 3 4 5 6 7 8A S1 S2 S3 S4 S5 S6 NTC NTCB 2K1 2K1 2K1-1 2K1-1 2K2 2K2 2K3 2K3C 2K4 2K4 2K5 2K5 2K6 2K6 2K7 2K7D 2K8 2K8 2K9 2K9 2-Test 2-Test +Control +ControlE F
Table 3. Table setup for run B. S: Standards, NTC: Negative control, + control:
positive control
1 2 3 4 5 6 7 8A S1 S2 S3 S4 S5 S6 NTC NTCB +Control +Control 1K1 1K1 1K2 1K2 1K3 1K3C 1K4 1K4 1K5 1K5 1K6 1K6 1K7 1K7D 1K8 1K8 1K9 1K9 1K10 1K10 1K11 1K11E 1K12 1K12 1K13 1K13 1K14 1K14 1-Test 1-TestF
