screening and identification of emerging contaminants … · screening and identification of...
TRANSCRIPT

Screening and Identification of Emerging Contaminants in Wastewater Treatment Plant Effluents Using UHPLC/Q-TOF MS and an Accurate Mass Database and LibraryApplication Note
Authors
Jean Daniel Berset Water and Soil Protection Laboratory (WSPL), Bern, Switzerland
Emma Rennie Agilent Technologies, Inc., Santa Clara, CA, USA
Thomas Glauner Agilent Technologies GmbH, Waldbronn, Germany
Environmental, Emerging contaminants, Water, Accurate mass screening, pesticides, PPCPs
Abstract
This application note describes the creation of an accurate mass library for relevant environmental contaminants and its application for the screening of pesticides, pharmaceuticals and personal care products, their metabolites, and transformation products in effluents of municipal waste water treatment plants (WWTPs). An Agilent 1290 Infinity LC System coupled to an Agilent 6550 iFunnel Q-TOF LC/MS System was operated in positive and negative electrospray mode using Dual Spray Agilent Jet Stream Technology. Accurate mass spectra were acquired for a large collection of potential environmental contaminants in either one or both ionization modes, and for all relevant ion species.
Four WWTPs in central Europe were sampled over 3.5 months, and samples were analyzed using a Target Screening approach including reference standards for 390 contaminants. In addition, an extended suspect screening was done using all compounds included in the Agilent MassHunter Water Screening Personal Compound Database and Library (PCDL) as the suspect list. Samples were measured using All Ions MS/MS as well as auto MS/MS acquisition with an inclusion list. The results clearly show the value of both acquisition modes combined with an efficient data analysis workflow, as well as the inherent value of the Water Screening PCDL for the surveillance screening of potential contaminants in complex environmental samples.

2
large volume direct injection of water samples. For most of the LC/MS amenable compounds specified in the EU Water Framework Directive, the EU Drinking Water Directive, or the EPA Clean Water Act, method detection limits in the low ng/L range can be achieved with this type of Q-TOF LC/MS method [8].
Three different approaches towards substance identification are used in the environmental context in combination with accurate mass LC/MS: Target, Suspect, and Non-target Screening.
In Target screening, a reference standard is measured with the same analytical method and within the same worklist as the unknown sample, so that retention time, accurate mass, and fragment information can be directly compared, and (semi-)quantitative results are obtained.
Suspect screening describes a workflow where compound database and MS/MS library information of expected contaminants are used to screen for the suspected substances. While no reference standard is available, identification of compounds with increasing confidence is obtained by comparing accurate mass and isotope patterns, retention times, and coeluting fragments, or by a spectral MS/MS library comparison.
Non-target screening aims at the identification of all remaining components detected in a sample where no structural information is available. Often, non-target screening includes the statistical comparison of two or more samples or sample groups for data reduction. A full identification considers the accurate mass, isotope pattern, and MS/MS spectrum information, and includes spectral library comparison for known compounds, and spectral similarities and in-silico fragmentation tools such as Agilent MassHunter Molecular Structure Correlator (MSC) for unknowns.
Compound databases containing accurate mass MS/MS spectral data for all expected contaminants, as well as those theoretically predicted, and their transformation products have been proven to assist in the identification of potentially relevant compounds and support efficient data analysis in all three screening workflows. The Agilent MassHunter Water Screening Personal Compound Database and Library (PCDL) contains a relevant list of more than 1,400 environmental contaminants including pesticides, pharmaceuticals, personal care products, large volume industrial chemicals, and their transformation products. This PCDL includes all compounds currently regulated in the US, EU, and China, and further compounds that have either been previously detected in the environment or are likely to be detected due to their production amount or widespread use.
IntroductionEnvironmental regulations throughout the world currently focus on monitoring a limited number of well-known compounds that are assumed to be responsible for significant ecological and human health related risks [1]. As a consequence, there is a tendency to further reduce the maximum allowable concentrations of the environmental quality standards (EQS) for those priority pollutants. In Europe, for example, EU directive 2013/39/EU specifies EQS for 41 priority substances or substance groups amongst which are pesticides, perfluorocarbons (PFCs), nonyl- and octylphenol, polybrominated flame retardants, dioxins and PCBs, polyaromatic hydrocarbons (PAHs), and heavy metals [2]. However, these priority pollutants represent only a small fraction of the anthropogenic chemicals that are used, and consequently found in the environment. Apart from the legal requirement for surveillance screening for potential contaminants in surface waters in the EU, there is a growing interest to collect occurrence data for contaminants of emerging concern. This is reflected in a number of country-specific government regulations, such as the EPA method 1694, on the analysis of pharmaceuticals and personal care products in water, soil, and sediments [3], and in the US EPA Contaminant Candidate List (CCL) fourth edition from 2015 [4].
Most anthropogenic contaminants enter the aquatic environment as a result of incomplete removal in wastewater treatment plants (WWTPs). At the same time, degradation and transformation products are formed during biological wastewater treatment. These products are typically not monitored, and often are not even known [5,6]. Surface waters downstream of WWTPs contain innumerable anthropogenic contaminants and their transformation products at trace levels. When river water is subsequently used as the source for drinking water production, referred to as unplanned indirect potable reuse, comprehensive data on the chemical quality of the water are essential. This becomes even more important as planned indirect and direct potable reuse becomes a common practice [7] due to climate change, population growth, and water scarcity.
Targeted analytical methods are increasingly complemented by untargeted acquisition methods using high resolution accurate mass Q-TOF LC/MS due to comprehensive screening requirements in current environmental regulations as well as increasing interest in the occurrence of contaminants of emerging concern. Agilent Q-TOF LC/MS instruments allow for full spectrum acquisition with high sensitivity and at a very high data rate. This is essential to obtain information on molecular ions, isotope patterns, and fragments with a single

3
Experimental
Reagents and standardsAll reagents and solvents were HPLC or LC/MS grade. Acetonitrile, methanol, and acetic acid were purchased from Fluka (Sigma-Aldrich, Buchs, Switzerland). Ammonium acetate was purchased from VWR International (Darmstadt, Germany). Ultrapure water was produced using a Milli-Q Integral system equipped with a 0.22-µm point-of-use membrane filter cartridge (EMD Millipore, Billerica, MA, USA). For acquisition of accurate mass MS/MS spectra, most individual reference compounds were purchased from Sigma-Aldrich (Buchs, Switzerland) or from VWR International (Darmstadt, Germany). Reference standards for transformation products and residues were purchased from Ehrenstorfer (LGC Standards, Wesel, Germany). Estimation of retention times was performed using mixed standard solutions of pesticides, pharmaceuticals, and drugs of abuse, which were part of the LC/MS Pesticide Comprehensive Test Mix (p/n 5190-0551), the LC/MS Forensic Toxicology Comprehensive Test Mix (p/n 5190-0555), or were provided by research groups.
Stock standard solutions were prepared by dissolving the reference compounds in isopropanol, acetonitrile, methanol, water, or mixtures thereof, depending on the physicochemical properties of the substance. For calibration and spiking experiments, the comprehensive test mixtures for pesticides, pharmaceuticals, and drugs of abuse were combined to a multi-analyte working solution. Stock standard solutions as well as the multi-analyte working solution were stored until use at –20 °C. Calibration samples were prepared by dilution of the working solution with tap water.
Sample preparationEffluents of four different wastewater treatment plants in central Europe were collected as 14-day composite samples over 3.5 months (March to June). The catchment areas of three of the WWTPs are agriculturally dominated (AG, AI, AL), whereas the other one is located in an urban area (AZ). One of the WWTPs also receives some industrial wastewater (AL). Efficient nitrification-denitrification is observed in three of the WWTPs (AG, AL, AZ) and, thus, a better elimination of trace contaminants can be expected.
Samples were filtered using glass fiber filters, and were stored at –20 °C. Immediately before measurement, samples were thawed, and an aliquot was transferred to an HPLC vial.
Searchable fields containing compound information including compound class and regulation tags make it easy to create subsets of the Water Screening PCDL for target and suspect screening. The Water Screening PCDL contains more than 1,000 compounds with accurate mass MS/MS spectra, which directly supports the Agilent All Ions MS/MS workflow for Target and Suspect screening, and greatly increases confidence in the identification of potential contaminants [9].
This application note describes the screening and (semi-)quantification of contaminants in WWTP effluents using an Agilent 1290 Infinity UHPLC coupled to the highly sensitive Agilent 6550 iFunnel Q-TOF LC/MS system. Four WWTPs located in agricultural and rural areas in Switzerland were sampled over 3.5 months, covering the main pesticide application period from March to late June. Comprehensive screening of potential water contaminants revealed the chemical characteristics of the different treatment and different catchment areas. A subset of the Water Screening PCDL, containing roughly 390 compounds, was used for Target screening and (semi-)quantification. For Suspect screening, the entire comprehensive Water Screening PCDL was used to find and identify compounds with high confidence. Examples of the two different screening strategies used are shown. First, the Q-TOF was operated in the All Ions MS/MS mode with three collision energies. The All Ions technique features an easy setup of the acquisition method with verification of the potential contaminants using the MS/MS spectral library to produce chromatographic coelution of the precursor and product ions. An additional approach was used for compounds for which either no library spectrum was available, or which were not verified due to a low coelution score. Their precursor masses were added to an inclusion list for an Auto MS/MS method using a second injection. The obtained spectra were compared to the MS/MS library for compound identification. This workflow can also be combined with a discovery run operated in TOF mode to obtain the target list of suspects.

4
LC/Q-TOF MS analysesSeparation was carried out using an Agilent 1290 Infinity UHPLC system consisting of:
• Agilent 1290 Infinity Binary Pump (G4220A)
• Agilent 1290 Infinity High Performance Autosampler (G4226A) equipped with a large volume injection kit (G4216-68711)
• Agilent 1290 Infinity Thermostatted Column compartment (G1316C)
The UHPLC system was coupled to an Agilent G6550A iFunnel Quadrupole Time-of-Flight LC/MS System equipped with a Dual Spray Agilent Jet Stream electrospray ionization source. The Q-TOF LC/MS instrument was operated with:
• Agilent MassHunter Acquisition rev. B.06.01 in 2 GHz extended dynamic range mode with positive or negative electrospray ionization (ESI) with two different methods:
• All Ions MS/MS acquisition with 3 scans/sec with two discrete collision energies
• Auto MS/MS acquisition with a data rate of 5 scans/sec in MS and 5 scans/sec in MS/MS
The use of two collision energies in the All Ions acquisition resulted in alternating spectra with a low energy channel containing the precursor ion, and two high energy channels containing the precursor and product ions.
Reference mass ions were delivered using an Agilent Infinity 1260 Isocratic pump (G1310B) operated with a flow rate of 1.0 mL/min, and using a 1-in-100 flow splitter (G1607-60000). The final flow rate going to the reference sprayer was 10 µL/min.
Table 1 shows the chromatographic conditions, and Table 2 shows the major MS conditions.
Data were evaluated using MassHunter Qualitative Analysis software B.07.00. Positive identifications of water contaminants were reported if the compound was detected in the accurate mass MS data by the Find-by-Formula data mining algorithm with a mass error below 5 ppm, and with a sufficient score (including isotope abundance and isotope spacing). A retention time window of ±1 minute was specified for peak detection to compensate for retention time shifts due to matrix variability.
Table 1. Chromatographic Conditions
Parameter Value
UHPLC column Agilent ZORBAX RRHD SB-Aq, 2.1 × 150 mm, 1.8 μm (p/n 859700-914)
Column temperature 40 °CMobile phase A) 1 mM NH4 acetate + 0.1% acetic acid
B) 0.1% acetic acid in acetonitrile Gradient program Time (min) % B
0.0 0 2.0 0 14.0 98 16.0 98 19.0 0 19.5 0
Stop time 20.0 minutesPost time 3.0 minutesFlow rate 0.40 mL/min Injection volume 100 μL
Table 2. Major MS Conditions
Parameter Value
Gas temperature 160 °CGas flow 16 L/minNebulizer 30 psigSheath gas temperature 350 °CSheath gas flow 12 L/min Positive NegativeCapillary voltage 4,500 V 3,500 VNozzle voltage 500 V 1,000 VReference mass correction 121.05087 112.98559
922.00980 1,033.98811All ions MS/MS
Mass range 50 to 1,200 amuScan rate 3 spectra/sCollision energies 0–20–40 VAuto MS/MS
MS Mass range 100 to 1,200 amuMS/MS Mass range 50 to 1,200 amuScan rate 5 spectra/s (MS)
5 spectra/s (MS/MS)Collision energy 20 V

5
corrected to their theoretical masses. All MS/MS spectra were curated for spectral noise, and a minimum base peak threshold was applied to ensure good ion statistics for all fragment ions. The corrected spectra were included in the Agilent Water-Screening Personal Compound Database and Library (G6882CA).
The Water Screening PCDL was then used for the screening and identification of environmental contaminants in the effluents of four WWTPs. Moreover, by analyzing mixed standard solutions of pesticides, pharmaceuticals, and drugs of abuse with the given UHPLC method, retention time information was added to 390 compounds, thus adding in retention time to the identification score and increasing identification confidence.
Figure 1 shows a screen capture of the MassHunter PCDL Manager software along with the accurate mass MS/MS spectrum of the antiviral drug aciclovir acquired in negative ionization mode with a collision energy of 20 V.
Creation of the Agilent MassHunter Water Screening PCDLAccurate mass spectra of single-analyte solutions were acquired with flow injection or using a short column in targeted MS/MS mode with collision energies of 10, 20, and 40 V. If precursor ion stability required higher collision energies, additional spectra were acquired in a second run. Typically, MS/MS spectra were acquired for the [M+H]+ and [M-H]– ion species for each analyte. If highly abundant additional adduct ion species were observed, accurate mass MS/MS spectra were also acquired for the [M+NH4]+, [M+Na]+, or [M+Cl]– species. In either positive or negative ionization mode, meaningful MS/MS spectra were acquired for more than 1,000 relevant water contaminants. For many compounds, MS/MS library spectra were captured in both ionization modes, and for more than one precursor ion species. To eliminate mass assignment errors, fragment masses in the acquired spectra were compared to the theoretical fragment formulas, and all ion peaks were
Figure 1. Agilent MassHunter PCDL Manager software showing the Agilent MassHunter Water Screening PCDL and the accurate mass MS/MS spectrum of aciclovir acquired in negative ionization mode with a collision energy of 20 V.

6
MS/MS software workflow, fragment ions that show perfect coelution with the molecular ions were identified and the ideal collision energies and relative ratios were detected. This information was passed to the MassHunter Quantitative Analysis software for (semi-)quantification and batch review using accurate mass for molecular ions and fragments as well as isotope pattern matching for compound identification with high confidence.
From the 390 targeted compounds, 315 were detected in positive mode, and 75 were detected in negative mode. With a direct injection of 100 µL of water into the UHPLC Q-TOF MS system, more than 60% of the compounds could be quantified at or below 10 ng/L in the spiked tap water samples. Another 35% of the compounds were detected between 10 and 100 ng/L, and just 5% of the compounds were only detected at concentrations of 200 ng/L or higher. For most targeted compounds, one or more specific fragment ions could be used as qualifier ions, and generally mass accuracy of the molecular ions and fragments was better than 5 ppm. Figure 2 shows the extracted ion chromatograms, MS peak spectra and calibration curves for some examples from the lists of priority pollutants (EU) and US EPA method 1694.
Results and Discussion
Target screening for pesticides, pharmaceuticals, and personal care productsFor the target screening and (semi-)quantification of pesticides, pharmaceuticals, and personal care products in the WWTP effluents, samples were measured in positive and negative All Ions MS/MS mode with collision energies of 0, 20, and 40 V. A subset PCDL with 390 entries was created from the Water Screening PCDL including all compounds for which reference standards were available. Data for the calibration samples were initially evaluated in the MassHunter Qualitative Analysis Software (B.07.00) using the Find-by-Formula data mining algorithm with a mass error of ± 5 ppm and a retention time window of ± 0.5 minutes compared to the expected retention time. In positive mode, [M+H]+ and [M+NH4]+ species, and in negative mode, [M-H]– species have been considered as charge carriers since they are represented by the majority of accurate mass MS/MS spectra included in the PCDL. Identification was done by Fragment Confirmation using the Water Screening PCDL as the fragment ion source, and evaluating the five most specific ions from the MS/MS spectral library. In the All Ions

7
– Scan (12.253 – 12.385 min, 8 scans)
205 206 207 2080
0.4
0.8
1.2
1.6
2.0
2.4
2.8
3.2
3.6205.1234(M-H)–
206.1268(M-H)–
207.1294(M-H)–
Mass Match Score = 86.3 (M-H)–
Ibuprofen30 ng/L
0 500 1,000 1,500 2,000 2,500 3,000
0
1
2
3
4
5
6
Ibuprofeny = 192.666716*x – 64.061529R2 = 0.9989
12.0 12.40
0.10.20.30.40.50.60.70.80.91.01.11.21.31.4
205.1234, 161.1336Ratio = 27.6 (100.0 %)
12.0 12.4 12.80
0.5
1.0
1.5
2.0
2.5
3.0
3.5
4.0
294.0094, 250.0196, 214.0429Ratio = 44.3 (88.2 %)Ratio = 11.6 (91.7 %)
– Scan (12.386 – 12.512 min, 7 scans)
294 296 2980
0.10.20.30.40.50.60.70.80.91.01.11.2
294.0094(M-H)–
296.0067(M-H)–
295.0126(M-H)– 298.0043
(M-H)–
Mass Match Score = 83.8 (M-H)–
Diclofenac40 ng/L
0 400 800 1,200 1,600 2,000
00.10.20.30.40.50.60.70.80.91.01.1
Diclofenacy = 557.652582*x – 3028.541575R2 = 0.9995
Acquisition time (min)8.6 9.0 9.4
Cou
nts
Cou
nts
×103
×103
×103 ×105
×105×104
×104 ×106
×104 ×105
0
1
2
3
4
5
6
7
734.4685, 158.1176 , 576.3742Ratio = 95.5 (104.4 %)Ratio = 52.4 (110.1 %)
+ Scan (8.914–9.079 min, 9 scans)
Mass-to-charge (m/z)733 735 737 739
0.4
0.8
1.2
1.6
2.0
2.4
2.8
3.2
3.6734.4685(M+H)+
Mass Match Score = 88.3 (M+H)+
Erythromycin 40 ng/L
Concentration (ng/L)
Concentration (ng/L)
Acquisition time (min) Mass-to-charge (m/z)
Acquisition time (min) Mass-to-charge (m/z)
Acquisition time (min) Mass-to-charge (m/z)
Concentration (ng/L)
Concentration (ng/L)
0 400 800 1,200 1,600 2,000
Res
pons
es
Cou
nts
Cou
nts
Res
pons
es
Cou
nts
Cou
nts
Res
pons
es
Cou
nts
Cou
nts
Res
pons
es
0
0.4
0.8
1.2
1.6
2.0
2.4
2.8
3.2
Erythromycin y = 1711.201929*x – 30380.252071R2 = 0.9908
13.8 14.2 14.60
0.20.40.60.81.01.21.41.61.82.02.22.42.62.8
308.0040, 196.9789, 213.9821Ratio = 33.8 (102.7 %)Ratio = 16.0 (95.4 %)
+ Scan (14.307-14.417 min, 6 scans)
307 309 3110
0.10.20.30.40.50.60.70.80.91.01.11.2
308.0040(M+H)+
309.9996
Mass Match Score = 91.0 (M+H)+
Quinoxyfen20 ng/L
0 50 100 150 200 250 300 350 400 450 500 550
0
0.4
0.8
1.2
1.6
2.0
2.4
2.8
3.2
3.6
Quinoxyfeny = 7035.818343*x – 14860.205250R2 = 0.9998
×106
×106
Figure 2. EIC chromatograms of molecular ion and fragments, MS peak spectra and calibration curves for erythromycin (positive mode), ibuprofen (negative mode), diclofenac (negative mode), and quinoxyfen (positive mode).

8
In the effluents of all WWTPs, a total of 46 pesticides were detected. The insecticide diethyltoluamide (DEET) was found in all WWTPs with a concentration of 14 to 770 ng/L. Also present in samples of all WWTPs were the herbicides metolachlor (up to 1.1 µg/L) and isoproturon (up to 450 ng/L). The largest number of pesticides were found in the effluent of AI, which has an agriculturally-dominated catchment area. Major crops grown there include cereals, vegetables, corn, beetroot, and potatoes. The pesticides found most often, and with the highest concentrations in the effluent of this WWTP were azoxystrobin, flufenacet, linuron, metamitron, methomyl, metribuzin, propamocarb, spiroxamin, and terbuthylazine. All of these pesticides are mainly used for the above listed crops.
Figure 3 shows the normalized chromatograms for the antiepileptic drug carbamazepine and the pesticide azoxystrobin in the effluent samples from WWTP AI, spanning a time period from March to end of June. While the concentration of the pharmaceutical is more or less constant over the whole sampling period, the concentration of the pesticide increased over the growing season. This example demonstrates the different contaminant profiles for compounds that are continuously introduced, compared to those that enter the water cycle within a specific period of time.
Applying this target screening method to the samples from the WWTP effluents allowed the (semi-)quantification of a large variety of environmental contaminants in a concentration range of a few ng/L up to several µg/L. Pharmaceutical residues were found to dominate the effluents of the larger WWTPs (AG, AL, AZ), which all receive wastewater from about 50,000 population equivalents, while AI receives wastewater from 7,100 population equivalents. In all wastewater treatment plant effluents, X-ray contrast media were identified with estimated concentrations of up to 7 µg/L for iomeprol, and up to 2 µg/L for iopromide. Other common pharmaceuticals were amisulprid (up to 500 ng/L), atenolol (up to 1.7 µg/L), metoprolol (up to 470 ng/L), and tramadol (up to 2 µg/L) as well as carbamazepine, diclofenac, ibuprofen, naproxen, and sulfamethoxazole. Metabolites were identified for carbamazepine, sulfamethoxazole, and metamizole. In total, 33 pharmaceuticals and metabolites of pharmaceuticals were identified in the WWTP effluents. As expected, the largest number of these compounds were found in the effluent of AZ, which has an urban catchment area. However, concentrations were highest in effluents of AI, probably due to the limited elimination efficiency of the simple treatment.
237.1022 Area=1.1e07 194.0964 Area=1.0e07 192.0808 Area=2.2e06
237.1022 Area=1.1e07194.0964 Area=9.9e06192.0808 Area=2.0e06
237.1022 Area=9.7e06194.0964 Area=9.2e06192.0808 Area=1.8e06
237.1022 Area=1,124,201194.0964 Area=1,076612192.0808 Area=2.2e06
237.1022 Area=1,018,313194.0964 Area=971,732192.0808 Area=2.1e06
237.1022 Area=1.3e07194.0964 Area=1.2e06192.0808 Area=2.7e06
9.8 10.0 10.29.8 10.0 10.29.8 10.0 10.29.8 10.0 10.29.8 10.0 10.29.8 10.0 10.29.8 10.0 10.2 9.8 10.0 10.2 9.8 10.0 10.2
237.1022 Area=1.2e.07 194.0964 Area=1.1e07 192.0808 Area=2.5e06
237.1022 Area=1.4e07 194.0964 Area=1.4e07 192.0808 Area=2.9e06
237.1022 Area=1.4e07194.0964 Area=1.4e07192.0808 Area=2.8e06
×106
0
0.4
0.8
1.2
1.6
2.0
2.4
2.8
3.2
3.6
4.0
4.4
4.8
×105
0
0.4
0.8
1.2
1.6
2.0
2.4
2.8
3.2
3.6
AI -1 [Azoxystrobin]
AI-1 [Carbamazepine] AI-2 [Carbamazepine] AI-3 [Carbamazepine] AI-4 [Carbamazepine] AI-5 [Carbamazepine] AI-6 [Carbamazepine] AI-7 [Carbamazepine] AI-8 [Carbamazepine] AI-9 [Carbamazepine]
12.4 12.6 12.8
404.1241 Area=1.6e07372.0979 Area=1.7e07344.1030 Area=5.4e06
AI -2 [Azoxystrobin]
12.4 12.6 12.8
404.1241 Area=1.4e07372.0979 Area=1.6e07344.1030 Area=4.9e06
AI -3 [Azoxystrobin]
12.4 12.6 12.8
404.1241 Area=1.7e07372.0979 Area=1.8e07344.1030 Area=5.8e06
AI -4 [Azoxystrobin]
12.4 12.6 12.8
404.1241 Area=8.7e07 372.0979 Area=9.5e07 344.1030 Area=3.2e07
AI -5 [Azoxystrobin]
12.4 12.6 12.8
404.1241 Area=7.9e07 372.0979 Area=8.5e07 344.1030 Area=2.9e07
AI -6 [Azoxystrobin]
12.4 12.6 12.8
404.1241 Area=1.4e08 372.0979 Area=1.5e08 344.1030 Area=5.6e07
AI -7 [Azoxystrobin]
12.4 12.6 12.8
404.1241 Area=1.7e08
372.0979 Area=1.8e08
344.1030 Area=7.5e07
AI -8 [Azoxystrobin]
12.4 12.6 12.8
404.1241 Area=2.1e08372.0979 Area=2.2e08344.1030 Area=9.8e07
AI -9 [Azoxystrobin]
12.4 12.6 12.8
404.1241 Area=1.8e08372.0979 Area=2.0e08344.1030 Area=8.2e07
Figure 3. Normalized EIC chromatograms of molecular ions and fragments for the antiepileptic drug carbamazepine and the pesticide azoxystrobin over the course of the sampling period (March to end of June).

9
Virtually at the same time, using two high energy channels, compounds are fragmented with two different collision energies without precursor selection in very fast sequential steps, and accurate mass fragment data are recorded for both channels. When the data is analyzed using the Find-by-Formula algorithm, the Water Screening PCDL provides the precursor formula information, and compound chromatograms are extracted for all specified ion species. For putative identifications, chromatograms are automatically extracted from the high energy channels for a specified number of the most abundant fragments from the MS/MS spectra stored in the PCDL. As an example, Figure 4A shows the accurate mass library spectrum of valsartan from the Water Screening PCDL, compared to the cleaned high energy spectrum from an effluent sample from the WWTP AI (Figure 4B). The red triangles indicate the fragment ions that have been selected from the library spectrum for evaluation.
Extended Suspect screening using the comprehensive Agilent MassHunter Water Screening PCDLBased on the results from the target screening, the samples from the WWTPs AI and AZ were selected for an extended Suspect screening looking for all remaining compounds included in the Water Screening PCDL. The availability of accurate mass MS/MS information is key for the identification of potential candidates, and is either used in the All Ions MS/MS workflow for the extraction and alignment of EICs of the molecular ion and characteristic fragments, or for the library matching of an acquired accurate mass MS/MS spectrum against the reference spectra in the PCDL. Both workflows are shown in Figure 4 for some of the examples identified in the WWTP effluents.
All Ions MS/MS screening workflowIn the All Ions MS/MS workflow, accurate mass data is collected without fragmentation in a low energy channel.
Figure 4. Accurate mass library spectrum for valsartan at a collision energy of 20 V (A) in comparison to the acquired high energy spectrum (B) from an effluent sample of the wastewater treatment plant AI (cleaned spectrum). The red triangles in the library spectrum (A) indicate automatically selected ions for the All Ions MS/MS evaluation.
Library spectrum
Compound 898 - Valsartan
Abu
ndan
ceC
ount
s
306.1713 61.28
A
Mass-to-charge (m/z) 60
0.10.20.30.40.50.60.70.80.91.01.11.21.31.4
×106
0
0102030405060708090
100110120
80 100 120 140 160 180
180.08078
180.08081.24
180.078112.82
207.0917100.00
235.0978983.48 291.1479
90.77
362.22278.29 418.2238
1.62
207.09168
235.09514
291.14785
306.16864
(M+H)+
436.23494
(M+Na)+
458.2167
200 220 240 260 280 300 320 340 360 380 400 420 440 460 480
Mass-to-charge (m/z) 60 80 100 120 140 160 180 200 220 240 260 280 300 320 340 360 380 400 420 440
O
O
HO N NN
NNH
H3C
CH3
CH3
460 480
B

10
showed coelution with the precursor ion. This is also demonstrated in the coelution plot in Figure 5B. The detailed compound identification results, including the coelution scores, are shown in the compound table in Figure 5C.
Identification with high confidence is achieved when the EICs of the molecular ion and at least one or two fragments show perfect coelution, which is expressed by a coelution score of > 90 (out of 100), and the mass accuracy for the peak spectrum for both molecular ions and fragments is better than 5 ppm. Based on this rule, additional pharmaceuticals were identified in the effluent of WWTP AI, namely the ARBs candesartan, irbesartan, and losartan.
While the library spectrum is based on a collision energy of 20 V, the cleaned high energy spectrum combines information from both high energy channels acquired with 20 and 40 V.
By overlaying chromatograms for both precursor and fragment ions, and the calculation of a coelution score, the identity of the angiotensin receptor blocker (ARB) valsartan was confirmed. The coelution score takes into account factors such as abundance, peak shape (symmetry), peak width, and retention time. The normalized intensity ratios are plotted and made available to the user for inspection in a coelution plot. Figure 5A shows the overlay of the molecular ion chromatogram with the fragment chromatograms from the high energy channels. All five fragment chromatograms
A×106
B
C
Acquisition time (min)
11.60
0.2
0.01
0.050.1
0.51
510
50100
0.4
0.6
0.8
1.0
1.2
1.4
1.6
11.7 11.8 11.9 12.0
11.9974,684,095
12.1 12.2 12.3 12.4 12.5
Acquisition time (min)
11.6 11.7 11.8 11.9 12.0 12.1 12.2 12.3 12.4 12.5
Cou
nts
Frag
men
t ion
/pre
curs
or io
n ra
tio
Figure 5. Overlay of precursor and fragment ion traces for valsartan in an effluent sample of the wastewater treatment plant AI (A), coelution plot (B) and compound identification results including the coelution score (C).

11
for compound verification. In cases where there is no library spectrum available, for example, for newly identified compounds or suspected transformation products, accurate mass MS/MS spectra can be compared to theoretical fragmentation of a compound in the MassHunter Molecular Structure Correlator (MSC) software.
Typically, this workflow starts with an All Ions MS/MS acquisition discovery run, and the tentative identification of suspected compounds using the Find-by-Formula data mining algorithm with the fragment confirmation. In cases when no fragment ions can be identified or if only one unspecific fragment is observed, the compounds are selected from the MassHunter Qualitative Analysis software, and exported into a target list. In a consecutive run using the same chromatography, accurate mass MS/MS spectra for the targeted precursors are acquired. If utmost sensitivity is required, it might be beneficial to operate the Q-TOF in TOF mode for the discovery run. Using TOF mode results in a higher number of suspects and, therefore, more precursor masses for the consecutive targeted MS/MS or auto MS/MS run. However, in this instance, more of the low abundant contaminants will be detected. Data analysis for the targeted MS/MS or auto MS/MS run starts with data mining using the Find by MS/MS (target or auto) feature finding algorithm followed by library searching using the MassHunter Water Screening PCDL.
Other pharmaceuticals and personal care products that were not targeted in the previous workflow (target screening using a reference standard), including the compounds clarithromycin, fexofenadine, sitagliptin, celiprolol, and phenylbenzimidazole sulfonic acid were also identified. Moreover, nine further pesticides (napropamid, pyrimethanil, fenamidone, lenacil, dimethenamid, boscalid, dinoseb, fludioxonil, and penconazole) as well as perfluorooctanoic acid (PFOA) and several organophosphates (triethyl phosphate, tris(2-chloroethyl)phosphate, tributylphosphate, and triphenylphosphate) were also found. In the AZ samples, valsartan, candesartan, and irbesartan, as well as fexofenadine, clarithromycin, venlafaxine, and its metabolite desmethyl venlafaxine, citalopram, cetirizine, clopidogrel, and ritonavir were found. In addition to PFOA, perfluorononanoic acid was also found. No further pesticides were detected and confirmed in the effluent of the WWTP AZ.
Suspect screening and verification using targeted MS/MSThe verification of compounds by matching accurate mass MS/MS spectra against reference spectra from an accurate mass MS/MS library sometimes offers advantages over the All Ions MS/MS workflow. This is the case if contaminants are present only at trace concentrations and, thus, signal intensities of the fragment ions are low, or if interferences occur between the low mass fragment ions and ions from the matrix. Moreover, accurate mass MS/MS library comparison after precursor isolation is considered to be the gold standard

12
Figure 6 shows the compound chromatogram and MS1 level peak spectrum for the antidiabetic drug metformin found in the effluent of wastewater treatment plant AZ. Due to the low mass of the molecular ion and the even lower masses of the specific fragments, the compound could not be verified in the All Ions MS/MS workflow, but was confidently identified with the targeted MS/MS approach. The predominant ion species for metformin was [M+H]+, and the measured m/z was in good agreement with the calculated mass (–0.7 ppm). The red boxes around the mass signals show the expected isotope ratio. The measured intensities for the monoisotopic mass signal, and the [M+1] isotope signal are in very good agreement with the theoretical pattern. However, there was an interference observed for the [M+2] signal, and therefore the target score was only 72.7 (out of 100).
Figure 6. Compound chromatogram and cleaned peak spectrum obtained by the Find-by-Formula algorithm for the antidiabetic drug metformin found in the effluent of wastewater treatment plant AZ.
A
B
×106
Acquisition time (min)
Cou
nts
1.0
128.5 129.0 129.5 130.0 130.5 131.0 131.5 132.0 132.5 133.0 133.5
1.1 1.2 1.3 1.4 1.5 1.6
1.5396,470,857
130.10881([C
4H
11N
5]+H)+
131.11148([C
4H
11N
5]+H)+
132.10156([C
4H
11N
5]+H)+
1.7 1.8 1.9 2.0 2.1 2.20
0.1
0.2
0.3
0.4
0.5
0.6
0.7
0.8
0.9
1.0
1.1
1.2
1.3
×105
Cou
nts
0
0.2
0.4
0.6
0.8
1.0
1.2
1.4
1.6
1.8
2.0
2.4
2.8
3.2
3.0
2.6
2.2
Compound 13: Metformin+ ESI EIC (130.10872, 152.09067)
Compound 13: Metformin+ FBF spectrum
Mass-to-charge (m/z)
13
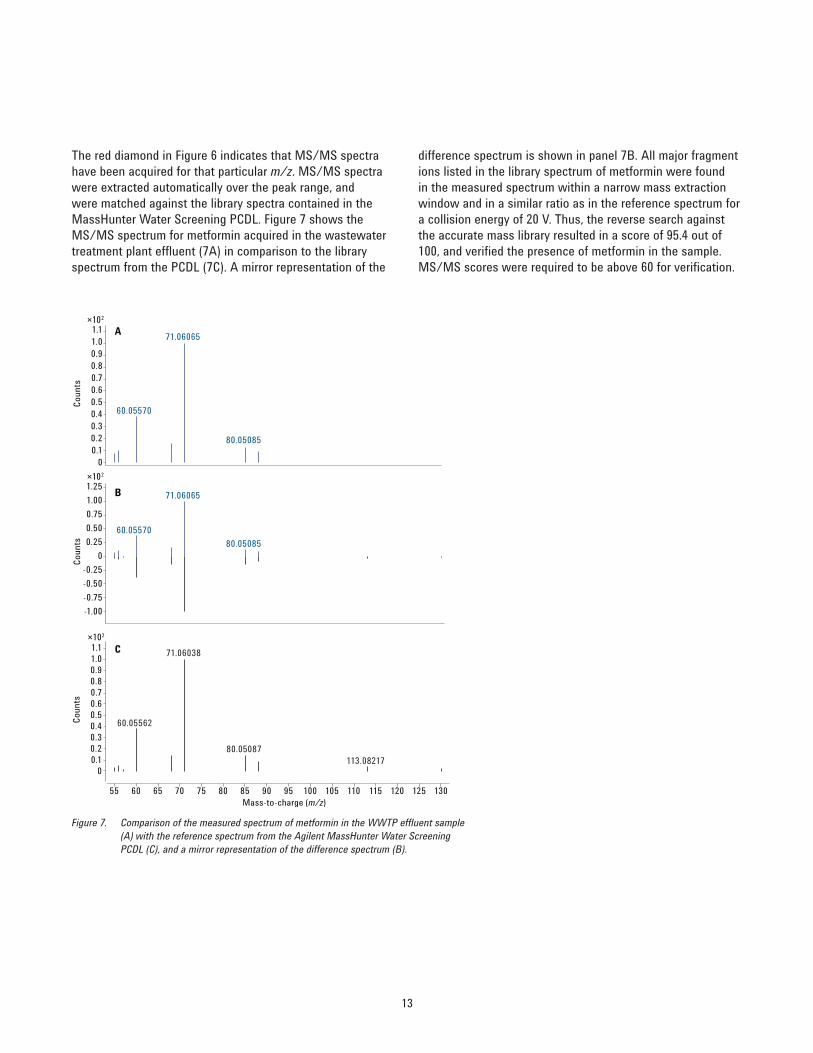
difference spectrum is shown in panel 7B. All major fragment ions listed in the library spectrum of metformin were found in the measured spectrum within a narrow mass extraction window and in a similar ratio as in the reference spectrum for a collision energy of 20 V. Thus, the reverse search against the accurate mass library resulted in a score of 95.4 out of 100, and verified the presence of metformin in the sample. MS/MS scores were required to be above 60 for verification.
The red diamond in Figure 6 indicates that MS/MS spectra have been acquired for that particular m/z. MS/MS spectra were extracted automatically over the peak range, and were matched against the library spectra contained in the MassHunter Water Screening PCDL. Figure 7 shows the MS/MS spectrum for metformin acquired in the wastewater treatment plant effluent (7A) in comparison to the library spectrum from the PCDL (7C). A mirror representation of the
Figure 7. Comparison of the measured spectrum of metformin in the WWTP effluent sample (A) with the reference spectrum from the Agilent MassHunter Water Screening PCDL (C), and a mirror representation of the difference spectrum (B).
A
B
C
×102
Cou
nts
Cou
nts
Mass-to-charge (m/z)
00.10.20.30.40.50.60.70.80.91.01.1
60.05570
71.06065
80.05085
60.05570
60.05562
71.06065
71.06038
80.05085
80.05087113.08217
×102
1.25
1.00
0.75
0.50
0.25
0
-0.25
-0.50
-0.75
-1.00
×102
Cou
nts
00.1
55 60 65 70 75 80 85 90 95 100 105 110 115 120 125 130
0.20.30.40.50.60.70.80.91.01.1

14
Figure 8 shows other compound examples that could be verified by using the targeted MS/MS workflow. Melamine was found in the effluent of AZ with a library score of 85.3. It has several industrial uses, and is formed as a metabolite of the pesticide cyromazine. Denatonium was found in the effluent of AI with a library score of 91.5. It is the most bitter compound known, and is used as bitterant in personal care products to prevent inappropriate ingestion.
00.10.20.30.40.50.60.70.80.91.01.1
85.05068
68.02406
60.05566110.04596
-1.00
-0.75
-0.50
-0.25
0
0.25
0.50
0.75
1.00
1.2585.05068
68.02406
60.05566 110.04596
00.10.20.30.40.50.60.70.80.91.01.1
Melamine C3H
6N
6
85.05087
68.02432
60.05562110.04612
Mass-to-charge (m/z) Mass-to-charge (m/z)
Cou
nts
Cou
nts
Cou
nts
50 60 70 80 90 100 110 120
00.10.20.30.40.50.60.70.80.91.01.1 86.09893
233.16877
135.04591 265.17244209.12086
-1.00
-0.75
-0.50
-0.25
0
0.25
0.50
0.75
1.00
1.2586.09893
233.16877135.04591 265.17244209.12086
00.10.20.30.40.50.60.70.80.91.01.1
Denatonium C21
H29
N2O
86.09643
233.16484
112.07569
60 80 100 120 140 160 180 200 220 240 260 280 300 320
A B×102
×102
×102
Cou
nts
Cou
nts
Cou
nts
×102
×102
×102
Figure 8. Comparison of the measured spectrum of melamine in the WWTP effluent sample AZ (A) and of denatonium in the effluent sample AI (B) with the reference MS/MS spectra from the Agilent MassHunter Water Screening PCDL.

15
References1. P. Gago-Ferrero, et al. Extended Suspect and Non-Target
Strategies to Characterize Emerging Polar Organic Contaminants in Raw Wastewater with LC-HRMS/MS. Environ. Sci. & Technol. 49(20), 12333-12341 (2015).
2. Directive 2013/39/EU of the European Parliament and of the Council of 12 August 2013 amending Directives 2000/60/EC and 2008/105/EC as regards priority substances in the field of water policy.
3. US EPA Method 1694 (2007) Pharmaceuticals and Personal Care Products in Water, Soil, Sediment, and Biosolids by HPLC/MS/MS. http://www.epa.gov/sites/production/files/2015-10/documents/method_1694_2007.pdf (accessed 14 December 2015).
4. US EPA Contaminant Candidate List (CCL) and Regulatory Determination: Draft CCL 4 Chemical Contaminants. http://www.epa.gov/ccl/chemical-contaminants-ccl-4 (accessed 14 December 2015).
5. M. J. Gómez, et al. Rapid automated screening, identification and quantification of organic micro-contaminants and their main transformation products in wastewater and river waters using liquid chromatography-quadrupole-time-of-flight mass spectrometry with an accurate-mass database. J. of Chromatog. A 1217(45), 7038-7054 (2010).
6. T. Letzel, et al. LC–MS screening techniques for wastewater analysis and analytical data handling strategies: Sartans and their transformation products as an example. Chemosphere 137, 198-206 (2015).
7. C. Rodriguez, et al. Indirect Potable Reuse: A Sustainable Water Supply Alternative. Int. J. Environ. Res. Public Health 6, 1174-1209 (2009).
8. D-H. D. Yang, et al. Sensitive Screening of Pharmaceuticals and Personal Care Products (PPCPs) in Water Using an Agilent 6545 Q-TOF LC/MS System. Agilent Technologies Application Note, publication number 5991-5954EN (2015).
9. E. L. Schymanski, et al. Non-target screening with high-resolution mass spectrometry: critical review using a collaborative trial on water analysis. Anal. Bioanal. Chem. 407(21), 6237-6255 (2015).
ConclusionsA method for the screening and (semi-)quantification of environmental contaminants in water samples was developed and applied to WWTP effluents. This method takes full advantage of the low delay volumes of the Agilent 1290 Infinity LC, and its ability to handle high backpressures in UHPLC separations to increase the chromatographic resolution. The method benefits from the sensitivity of the Agilent 6550 iFunnel Q-TOF, and from the versatile ionization capabilities of the Agilent Jet Stream ionization source.
The Agilent MassHunter Water Screening PCDL is an ideal complement for the Target and suspect screening workflows in the Agilent MassHunter Qualitative and Quantitative software. In Target Screening and (semi-)quantification, the PCDL is used to define the suite of compounds and to identify selective qualifier ions. While in suspect screening, identification with high confidence is achieved by fragment confirmation or library searching. Applying both workflows to the WWTP effluent samples revealed the characteristics of the treatment technology as well as the catchment area by the different chemical inventory of trace contaminants.
Auto MS/MS acquisition with an inclusion list and a single collision energy combined with library matching resulted in similar verification rates as the Agilent All Ions MS/MS acquisition with fragment coelution. However, it can be seen that the precursor isolation in auto MS/MS acquisition improved the identification compared to the All Ions MS/MS workflow in heavy matrix and for low mass contaminants. Conversely, All Ions MS/MS acquisition is very fast, and allows the differentiation of closely eluting isomers. Another important feature of the All Ions MS/MS workflow is that the data can be re-interrogated at a later time for compounds that were not in the scope of the analysis during measurement, allowing for retrospective data analysis for new emerging contaminants without the need to reacquire data from old samples.

www.agilent.com/chemAgilent shall not be liable for errors contained herein or for incidental or consequential damages in connection with the furnishing, performance, or use of this material.
Information, descriptions, and specifications in this publication are subject to change without notice.
© Agilent Technologies, Inc., 2016 Printed in the USA March 29, 2016 5991-6627EN
For More InformationThese data represent typical results. For more information on our products and services, visit our Web site at www.agilent.com/chem.