schlumberger limited 2003 annual · pdf filecorporate information inside back cover ... letter...
TRANSCRIPT

Schlumberger Limited2003 Annual Report
In This Report
Letter from the Chairman 2Financial and Operating Highlights 5The GeoMarket* Advantage 6Annual Report on Form 10K 13Directors and Officers Inside Back CoverCorporate Information Inside Back Cover
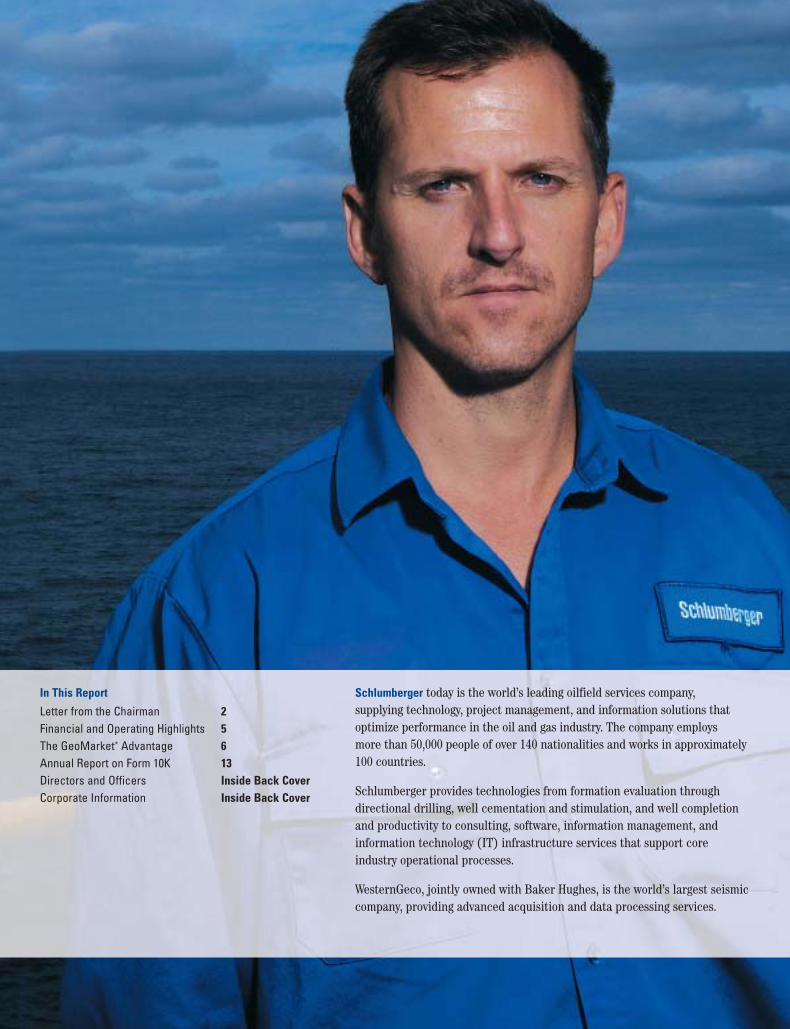
Schlumberger today is the world’s leading oilfield services company, supplying technology, project management, and information solutions thatoptimize performance in the oil and gas industry. The company employs more than 50,000 people of over 140 nationalities and works in approximately100 countries.
Schlumberger provides technologies from formation evaluation through directional drilling, well cementation and stimulation, and well completion and productivity to consulting, software, information management, and information technology (IT) infrastructure services that support core industry operational processes.
WesternGeco, jointly owned with Baker Hughes, is the world’s largest seismiccompany, providing advanced acquisition and data processing services.

Schlumberger, through its people and its technology, strives to provide globalleadership and innovation within the energy services industry.
Each and every person in Schlumberger is committed to deliver the best possibleperformance anytime, anywhere. Our culturally diverse teams endeavor to createnew standards of excellence that surpass our customers’ expectations.
At Schlumberger, what matters is getting the job done right.
1
Letter from the Chairman
2
The year 2003 marked a watershed for Schlumberger as we took the decision to focus on our core businesses in oilfield services. Our reasoning was simple. World energy needs for much of the nexthalf-century will be met mostly by carbon-based fuels produced froman aging reserves base. Substantial investment will be needed tosustain today’s production as well as to meet tomorrow’s demand,and technology will be the key to a cleaner, more cost-effectiveresponse to this challenge. I therefore believe the future forSchlumberger is exceptionally bright.
The year’s results for Oilfield Services were robust, with growth in all regions. Among the GeoMarket* regions, activity was strongest in Mexico, Indonesia, India, the Caspian, and on land in the UnitedStates. Most technology segments registered double-digit gains, with records achieved by Drilling & Measurements and Data &Consulting Services. Much of the technology that saw increasingmarket penetration was associated with boosting performance inmature fields, or “brownfields”, to stem declining production. Rotary steerable systems to accurately place well trajectories to tapbypassed hydrocarbon pockets and a range of cased-hole wirelineevaluation tools to analyze such zones were two particular successes.
A number of technical and business highlights marked the year.Integrated Project Management (IPM) continued to grow, particularly in Mexico, where our history of successful projects led to the award of the Chicontepec contract, the most significantoil development project in Mexico in the last 20 years. In Malaysia,we signed a contract with PETRONAS Carigali Sdn. Bhd. to jointlyredevelop the Bokor field that began production in the 1980s. Thisfield, comprising more than 165 stacked sands and over 100 produc-ing strings, has been modeled using the latest techniques and theredevelopment plan involves multiple technology segments. Suchprojects underline the value of our unique GeoMarket organization.
In December we announced a phased agreement to acquirePetroAlliance, Russia’s largest independent oilfield service company, beginning with a minority share in 2004. PetroAlliancewas formed in 1995 to provide a broad range of exploration anddevelopment services to international standards. The size and scopeof activity in Russia is huge, and this type of investment will benefitSchlumberger and the Russian oil industry as that industry seeksaccess to technology to be applied to its particular needs for continued growth.
3
Perhaps the most difficult challenge we set for ourselves early in2003 was to return WesternGeco to sustainable profitability.Continued overcapacity in both the land and marine and multiclientdata markets made this a daunting task. Our approach has beenthreefold: to bring capacity and cost down to appropriate levels, toreflect a proper carrying value for the data library, and to continuethe aggressive introduction of proprietary Q* technology, for whichthe market has continued to grow rapidly.
Last summer we acquired the first marine time-lapse Q survey for Statoil, 200 km from the western coast of Norway. Twenty-onemonths had elapsed between the two surveys. Initial results, produced only 11 days after acquisition, enabled Statoil to reviseplans for a new well and drill a shallower trajectory to remain clearof the oil/water contact. The well was a success and is producingwithout making water. The reliability and extremely high repeatabil-ity of Q-Marine* technology were considered critical to achievingthis result. In other applications, a Q system was commissioned inthe Middle East late in the year and Q-Seabed* underwent highlysuccessful trials in both the North Sea and Middle East.
In defining the business activities sold with SchlumbergerSema, we maintained our commitment to the growing activity in oil andgas IT solutions. The natural fusion of the Schlumberger softwareand information management activities with the SchlumbergerSemaconsulting and network infrastructure business began in October,and by year-end business managers were in place throughout the GeoMarket organization. We have chosen to retain theSchlumberger Information Solutions name for the enlarged business, and our objective is to help customers extract more value from their core operational processes through leveraging the combination of our domain knowledge in IT and in explorationand production (E&P).
Early in 2003 we stated clear financial goals. By year-end we hadmade solid progress. Return on capital employed had risen to 12.8%in the fourth quarter, double the corresponding figure in 2002 andwell in line with our intention to reach the mid-teens longer term.After-tax return on sales for Oilfield Services reached 14.2% in thesame quarter—a level much more consistent with our performancein previous cycles. Net debt fell to $4.2 billion, just shy of our $4 billion target as a result of adverse currency movements.
In January 2004, we concluded the sale of the major part ofSchlumbergerSema to Atos Origin and reduced our holding in thatcompany to 14.5%. Total proceeds from the cash and stock saleamounted to $1.1 billion. With conclusion of the sale of the NorthAmerican electricity meter business and the sales of the BusinessContinuity, Infodata, and Telecom software products businesses we expect to see net debt below the $3 billion dollar level by themiddle of 2004. Beyond that point, the only significant divestitureremaining will be the IPO of Axalto, the Schlumberger smart cardbusiness, as and when market conditions permit.
I would like to take this opportunity to emphasize the importancethat we place on a proactive QHSE culture to ensure that servicequality, health, safety, and environment are top priorities for bothmanagement and employees. Over the years, driving accidents havebeen the single largest cause of injury and even death, and we havespent much time and effort to remedy this. I am very pleased toreport that we suffered no occupational auto fatalities in 2003,despite our employees driving more than 12 million miles every month.
I have remarked elsewhere that the return of economic growth and recognition of the tightness of supply and demand in the context of accelerating production decline will need to provoke aresponse in E&P investment. In the near term, there are positivesigns that this situation is beginning to be recognized.
In conclusion, I would once again like to take this opportunity tothank our customers and employees for their continued support.
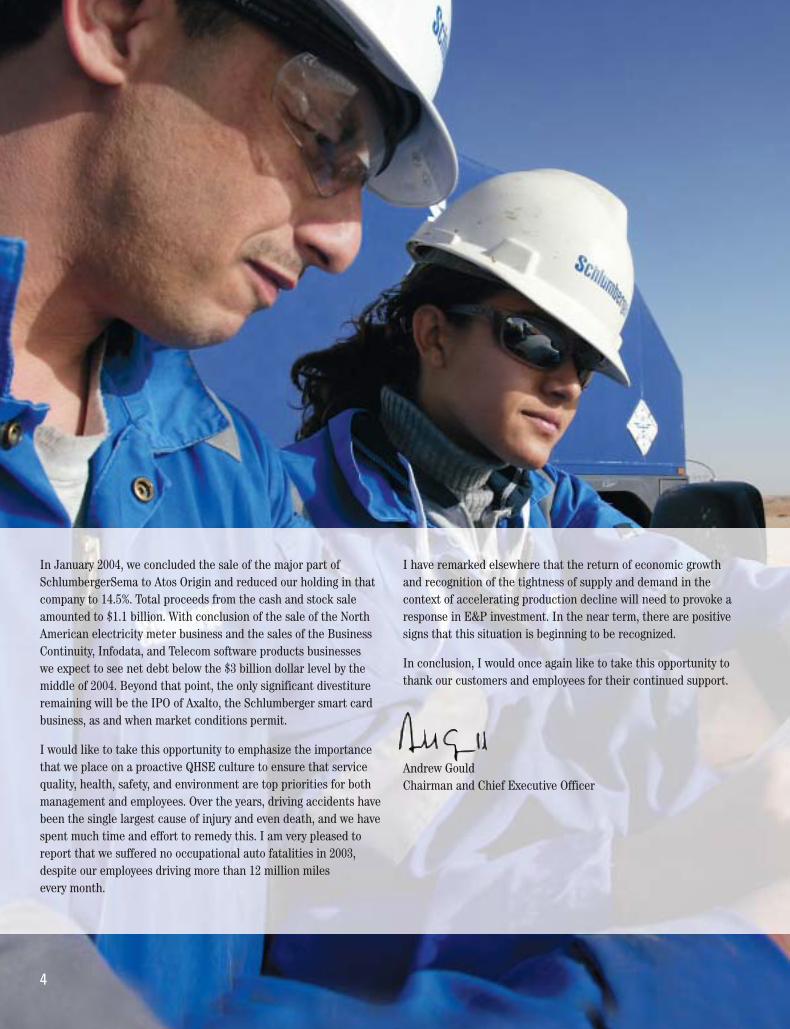
Andrew GouldChairman and Chief Executive Officer
4

5
Financial and Operating HighlightsSchlumberger Limited(Dollar amounts in millions, except per share data)
Year ended December 31 2003 2002
Operating revenue $13,893 $13,118Net income from continuing operations, excluding charges $ 913 $ 693Net income from continuing operations, including charges $ 473 $ (2,417)
Basic earnings per share from continuing operations $ 0.81 $ (4.18)Diluted earnings per share from continuing operations $ 0.81 $ (4.18)Cash dividends declared per share $ 0.75 $ 0.75
Return on capital employed from continuing operations, excluding charges 10% 6%Return on sales from continuing operations, excluding charges 7% 5%Return on equity from continuing operations, excluding charges 16% 9%Net debt $ 4,176 $ 5,021
Oilfield Services Safety PerformanceAutomotive accident rate – accidents/1,000 drivers 5.0 7.4Loss time incident rate – incidents/1,000 employees 4.6 6.2

6
The GeoMarket Advantage
Schlumberger customer needs are met through a unique network of GeoMarket units that combine deep domain knowledge with athorough understanding of the cultures, geologies, and geographiesthat mark different countries and regions. The advantages: deploy-ment of innovative solutions in the local environment backed bycentral development through worldwide technology segments and a consistent global approach to service quality, health, safety, andrespect for the environment.
Technology Development and Deployment
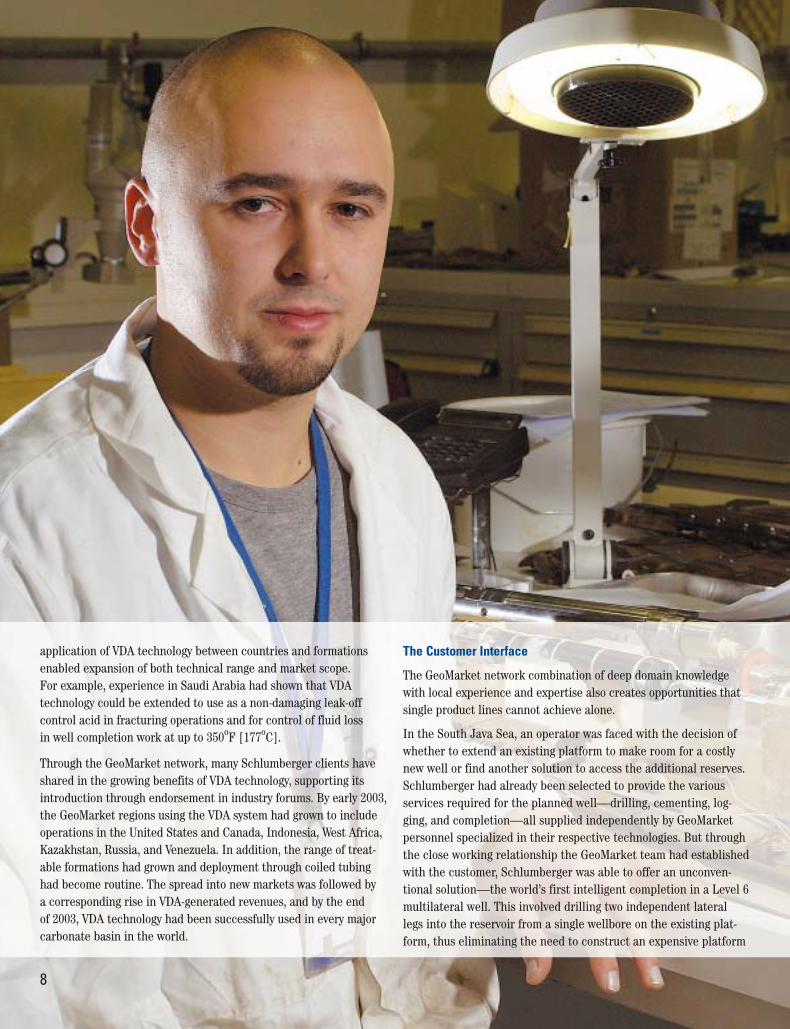
To appreciate how the GeoMarket network achieves results, considerthe success of the new Schlumberger VDA* Viscoelastic DivertingAcid. This polymer-free, self-diverting acid system increases oil production in carbonate rock formations. Technologies such as the VDA system are of growing importance in managing decliningproduction in aging fields, where increasing recovery can prolongcost-effective field life. VDA development, which required the
creation of an entirely new molecule, was the result of a collaborative effort spanning three years in the Houston ProductCenter supported by work on the fundamental chemistry atSchlumberger Cambridge Research.
Unlike all previous acidizing systems, the VDA system possessesproperties that enable it to virtually seek out zones of a well that needtreatment the most, while limiting unnecessary injection into clean,permeable zones that are wasteful sinkholes for ordinary stimulationacids. This simple but significant difference makes VDA technologyan innovative discovery for stimulation markets worldwide.
To introduce the technology, we opted for a new staged deploymentstrategy that relied heavily on the characteristics of the GeoMarketnetwork. A single GeoMarket region, covering Saudi Arabia, Kuwait,Bahrain, and Pakistan, was selected because it united the geologicaland client needs deemed most likely to favor acceptance of the newtechnology. The new system was first used in Kuwait by an operator

7
that had shown interest in testing new technologies in the past.After positive results in early 2002, reservoir experts from the client and Schlumberger identified other potential wells for VDAapplication in the same area.
Over the following months, the new system rendered outstandingperformance in more than 30 wells of all types—newly drilled wells, under-performing older wells, horizontal wells, and high-temperature, high-pressure wells. In all the treated wells, produc-tion increased by a minimum of 30%, and most wells recordedincreases of more than 300%.
Following this experience, it made sense to introduce the new systemto other clients with similar reservoir characteristics in the sameGeoMarket region. The system was tested in Saudi Arabia and resultswere immediate, with all VDA-treated wells increasing productionfar beyond expectations. Since the initial successes recorded in mid-2002, many operations in Saudi Arabia have shifted from
polymer-base stimulation fluids to the non-damaging VDA system.
VDA technology was then introduced to the neighboring GeoMarketregion covering the United Arab Emirates, Yemen, Qatar, and Oman.Further successes in these countries led to VDA introduction in theEast Africa & East Mediterranean GeoMarket unit, where VDA introduction in one area highlighted the need for global develop-ment and local deployment. A special formulation of the VDA fluidwas developed by the regionally based Client Support Laboratory toaddress the challenges presented by the rock matrix. Once testedand approved by the Houston Product Center, the formulation wasdeployed in 3 wells in a field to raise the sustainable production ofthe field by more than 8,000 barrels of oil per day.
By this time a clear pattern had developed in which similaritiesbetween GeoMarket regions enabled the spread and use of VDAproducts much faster than if they had been implemented globallywith no track record. Furthermore, experience gained in the
8
application of VDA technology between countries and formationsenabled expansion of both technical range and market scope. For example, experience in Saudi Arabia had shown that VDA technology could be extended to use as a non-damaging leak-off control acid in fracturing operations and for control of fluid loss in well completion work at up to 350oF [177oC].
Through the GeoMarket network, many Schlumberger clients haveshared in the growing benefits of VDA technology, supporting itsintroduction through endorsement in industry forums. By early 2003,the GeoMarket regions using the VDA system had grown to includeoperations in the United States and Canada, Indonesia, West Africa,Kazakhstan, Russia, and Venezuela. In addition, the range of treat-able formations had grown and deployment through coiled tubinghad become routine. The spread into new markets was followed by a corresponding rise in VDA-generated revenues, and by the end of 2003, VDA technology had been successfully used in every major carbonate basin in the world.
The Customer Interface
The GeoMarket network combination of deep domain knowledgewith local experience and expertise also creates opportunities thatsingle product lines cannot achieve alone.
In the South Java Sea, an operator was faced with the decision ofwhether to extend an existing platform to make room for a costlynew well or find another solution to access the additional reserves.Schlumberger had already been selected to provide the various services required for the planned well—drilling, cementing, log-ging, and completion—all supplied independently by GeoMarketpersonnel specialized in their respective technologies. But throughthe close working relationship the GeoMarket team had establishedwith the customer, Schlumberger was able to offer an unconven-tional solution—the world’s first intelligent completion in a Level 6multilateral well. This involved drilling two independent laterallegs into the reservoir from a single wellbore on the existing plat-form, thus eliminating the need to construct an expensive platform

9
extension. Not only was this solution cost-effective, it improvedfield net present value (NPV) and offered the possibility ofincreased hydrocarbon recovery through the proactive managementof reservoir performance.
In defining technology directions such as this, Schlumberger hasgrouped GeoMarket units around common themes. For example, a community of deepwater GeoMarket units now exists, with eachproviding input to the development of services worldwide whilesharing experience gained.
Deepwater projects are always tricky, but few are as challenging as one development that began production in the Gulf of Mexico in 2002. Virtually unprecedented in its technical and logistical complexity, the project involved the completion of 16 zones in 6 wells, 2 of which were in a world-record water depth of more than7,000 ft. All 6 wells, distributed between 2 distinct fields, were connected to the same pipeline system for delivery back to a shelfplatform facility nearly 60 miles away.
As project coordinator, Schlumberger provided a team of 35 peopleand employed a host of cutting-edge technologies that had neverbeen integrated in a single operation. Our engineers took fullresponsibility for assembling all expertise necessary to provide theoperator with seamless support and service throughout the project.The result of these efforts led to significant time-savings for the customer and greater revenue for Schlumberger. In addition, theproject clocked 70,000 labor-hours without a single health-, safety-,or environment-related lost-time incident.
So did the GeoMarket organization have anything to do with thissuccess? “No question about it,” says Graham Watson, who acted as the project coordinator. “It enabled us to provide a single point of contact in the customer’s offices to ensure a coordinatedresponse—whatever the issue at hand. We used the GeoMarketstructure to coordinate the Schlumberger segments and the resultwas a uniform response to client needs.”

10
An Integrated Approach
The markets for oilfield services are changing, and the way in whichoilfield services companies respond is also changing. The growingmarkets of Russia, some of the former Soviet republics, and moregradually China require a new approach, and nowhere is this moreevident than in the operations of Integrated Project Management.IPM is a Schlumberger service focused on combining technology,people, and process to deliver efficiency and cost-effectiveness inprojects as diverse as remote strategic exploration wells, field development and full-field rehabilitation. As well as providing technology and expertise, Schlumberger often works with local subcontractors to harness local knowledge and experience.
One example of a field development managed by IPM, the Burgosproject in the Mexico GeoMarket, is now in its seventh year.Schlumberger has delivered 237 completed wells, which include the drilling of 2.3 million ft of hole. The scope of work has, at
various times, included three-dimensional (3D) seismic, reservoircharacterization, well design, engineering and construction, stimulation, and design and installation of production facilities. The benefits to the customer have included accelerated production,reduced capital expenditures (capex), and increased efficiency,while the long-term nature of the relationship between the operatorand Schlumberger has promoted deep understanding of local needsand led to similar work in other Mexican fields.
This type of integrated solution would have been almost impossiblebefore implementation of the GeoMarket structure. Individual product lines worked independently, largely unaware of what eachother was doing. Today, Schlumberger staff are sensitive to the integrated perspective without compromising service excellence in their own specific technologies.
11
A Sustainable Advantage
The education of present and future generations of engineers andscientists of all nations is a priority in a world facing critical andexciting challenges to ensure that all our energy needs are met.There are proven advantages in having a workforce drawn from many different cultures, partly because of affinity with our diversecustomer base, and partly because diversity is itself a rich source ofinnovation and creativity. To sustain this advantage, Schlumbergeractively sponsors a number of distinct but complementary educa-tional initiatives, all with a strong emphasis on advancing scienceand engineering in economically developing nations.
Schlumberger maintains close ties with universities around theworld through the Schlumberger University Ambassador Program.GeoMarket staff form a vital part of this program and often providethe link that connects the university to Schlumberger. To increasetechnical collaboration, Schlumberger research centers and their
satellites are located close to academic centers in Boston,Cambridge, Beijing, Moscow, and Dhahran, and the companydonates software to campuses as far apart as the Bandung Instituteof Technology, Indonesia, and Imperial College, London. Exchangeswith faculty are encouraged, and Schlumberger scientists serve sabbatical postings at universities such as the UniversidadeAgostinho Neto in Luanda and the Colorado School of Mines. By way of recognition, a combination of initiatives to build local university capability in Kazakhstan led to the GeoMarket regionreceiving a Presidential Award for services to education.
The Schlumberger Foundation focuses its activities on promotingand enhancing science and technology education and careers, particularly for young people in high schools and for academics, in economically developing countries. Contributions by theFoundation build on opportunities identified and promoted by the GeoMarket units.
12
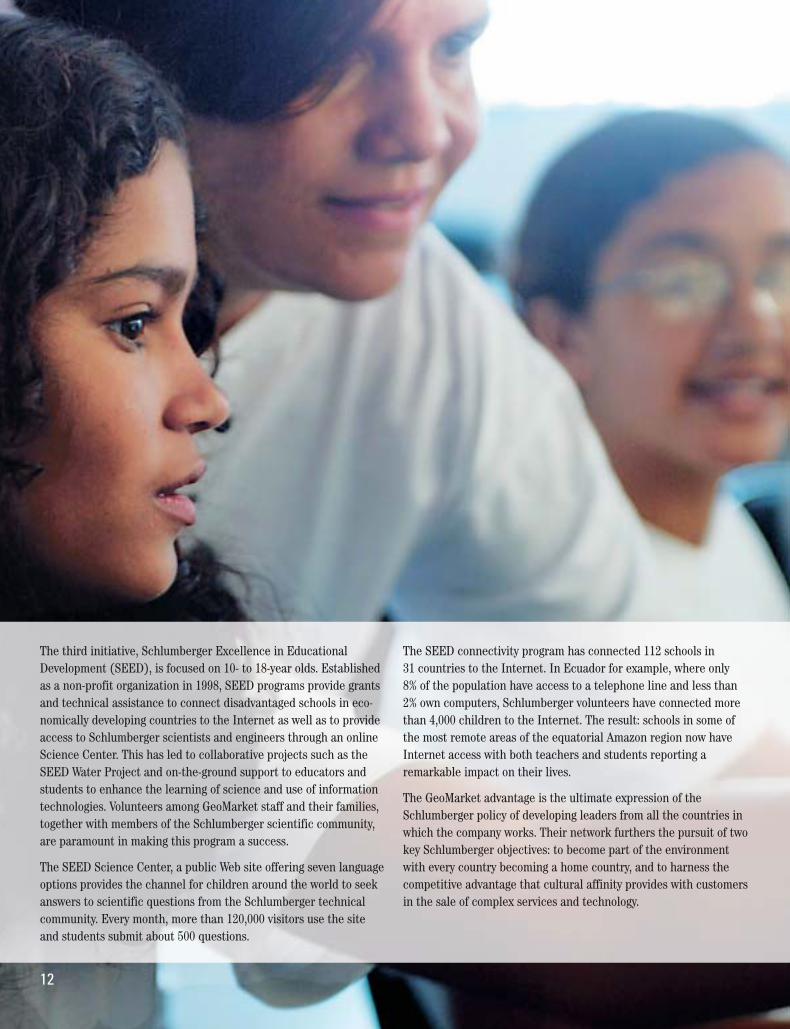
The third initiative, Schlumberger Excellence in EducationalDevelopment (SEED), is focused on 10- to 18-year olds. Establishedas a non-profit organization in 1998, SEED programs provide grantsand technical assistance to connect disadvantaged schools in eco-nomically developing countries to the Internet as well as to provideaccess to Schlumberger scientists and engineers through an onlineScience Center. This has led to collaborative projects such as theSEED Water Project and on-the-ground support to educators andstudents to enhance the learning of science and use of informationtechnologies. Volunteers among GeoMarket staff and their families,together with members of the Schlumberger scientific community,are paramount in making this program a success.
The SEED Science Center, a public Web site offering seven languageoptions provides the channel for children around the world to seekanswers to scientific questions from the Schlumberger technicalcommunity. Every month, more than 120,000 visitors use the siteand students submit about 500 questions.
The SEED connectivity program has connected 112 schools in 31 countries to the Internet. In Ecuador for example, where only 8% of the population have access to a telephone line and less than2% own computers, Schlumberger volunteers have connected morethan 4,000 children to the Internet. The result: schools in some ofthe most remote areas of the equatorial Amazon region now haveInternet access with both teachers and students reporting a remarkable impact on their lives.
The GeoMarket advantage is the ultimate expression of theSchlumberger policy of developing leaders from all the countries inwhich the company works. Their network furthers the pursuit of twokey Schlumberger objectives: to become part of the environmentwith every country becoming a home country, and to harness thecompetitive advantage that cultural affinity provides with customersin the sale of complex services and technology.
Board of Directors
John Deutch 4, 5
Institute ProfessorMassachusetts Institute of TechnologyCambridge, Massachusetts
Jamie S. Gorelick 1, 2
PartnerWilmer, Cutler Pickering LLPWashington, D.C.
Andrew Gould 3
Chairman & Chief Executive OfficerSchlumberger
Tony Isaac 1
Chief ExecutiveBOC GroupSurrey, UK
Adrian Lajous 2, 3, 4
Senior Energy AdvisorMcKinsey & CompanyHouston, TexasPresident PetrometricaMexico City
André Lévy-Lang 1, 3, 5
Independent InvestorParis
Didier Primat 1
PresidentPrimwest Holding N.V.Curaçao, Netherlands Antilles
Nicolas Seydoux 2, 4
Chairman & Chief Executive OfficerGaumontParis
Linda Gillespie Stuntz 1, 4
PartnerStuntz, Davis & Staffier, P.C.Washington, D.C.
Sven Ullring 2, 3
Independent AdvisorHovik, Norway
1 Member, Audit Committee2 Member, Compensation Committee3 Member, Finance Committee4 Member, Nominating and Governance
Committee5 Member, Technology Committee
Corporate Officers
Andrew GouldChairman & Chief Executive Officer
Jean-Marc PerraudExecutive Vice President & Chief Financial Officer
Dalton BoutteExecutive Vice President
Chakib SbitiExecutive Vice President
Ellen SummerSecretary & General Counsel
Simon AyatVice President, Controller & Business Processes
Pierre E. BismuthVice President
Mark DantonVice President
Peter GoodeVice President
Rene HuckVice President
Philippe Lacour-GayetVice President
Terje NikolaysenVice President
Satish PaiVice President
Jean-Dominique PercevaultVice President
Doug PferdehirtVice President
David TournadreVice President
Andre B. ErlichChief Information Officer
Frank SorgieChief Accounting Officer
Michel SoublinTreasurer
Janet B. GlassmacherAssistant Secretary
Corporate Information
Stockholder InformationSchlumberger common stock islisted on the New York StockExchange, ticker symbol SLB,and on the Euronext Paris,Euronext Amsterdam, Londonand the SWX Swiss StockExchanges.
For quarterly earnings, dividendannouncements and other information call 1-800-99-SLB-99 from the US and Canada and 1-703-797-1862 for callersoutside North America or visit investorcenter.slb.com and signup to receive email alerts.
Stock Transfer Agent and RegistrarEquiServeTrust Company, N.A.P.O. Box 43010Providence, Rhode Island 02940-30101-800-733-5001 or 1-781-575-3400
General stockholder informationis available on the EquiServeweb site at www.equiserve.com
Form 10-K
The Schlumberger 2003 annualreport on Form 10-K filed withthe Securities and ExchangeCommission is available withoutcharge. Call 1-800-99-SLB-99from North America and 1-703-797-1862 outside NorthAmerica. Alternatively, you can view all of our SEC filingsonline at investorcenter.slb.comor write to the Secretary,Schlumberger Limited, 153 East 53rd Street, 57th Floor,New York, NY 10022.
Duplicate MailingsWhen a stockholder owns sharesin more than one account, orwhen stockholders live at thesame address, duplicate mail-ings may result. If you receiveduplicate reports, you can helpeliminate the added expense by requesting that only one copybe sent. To eliminate duplicatemailings, contact EquiServeTrust Company, N.A., StockTransfer Agent and Registrar,listed above.
World Wide WebFor information on Schlumbergertechnology, services & solutionsand the latest industry newsvisit www.slb.com
Email AlertsTo receive Schlumberger pressreleases, headlines and dailyindustry news headlines registerat investorcenter.slb.com
RecruitmentFor more information on careers and job opportunities at Schlumberger visitwww.careers.slb.com
Schlumberger Excellence inEducational Development(SEED)To learn more about this non-profit community developmentprogram visit www.seed.slb.com
* Mark of Schlumberger
Photography by Frédérick Carnet exceptpages 2, 3, 4 and 12 by Philippe Charliat
Form 10-K
SCHLUMBERGER LTD /NV/ - SLB Filed: March 03, 2004 (period: December 31, 2003) Annual report which provides a comprehensive overview of the company for the past year
Table of Contents
PART I
Item 1 Business Item 2 Properties Item 3 Legal Proceedings Item 4 Submission of Matters to a Vote of Security Holders
PART II
Item 5 Market for Schlumberger s Common Stock and Related Stockholder Matters Item 6 Selected Financial Data Item 7 Management s Discussion and Analysis of Financial Condition and Results of Operations Item 7A Quantitative and Qualitative Disclosures About Market Risk Item 8 Financial Statements and Supplementary Data Item 9 Changes in and Disagreements with Accountants on Accounting and Financial Disclosures Item 9A Controls and Procedures
PART III
Item 10 Directors and Executive Officers of Schlumberger Item 11 Executive Compensation Item 12 Security Ownership of Certain Beneficial Owners and Management and Related Stockholder Matte Item 13 Certain Relationships and Related Transactions Item 14 Principal Accounting Fees and Services
PART IV
Item 15 Exhibits, Financial Statement Schedules and Reports on Form 8-K SIGNATURES INDEX TO EXHIBITS
EX-21 (Subsidiaries of the registrant)
EX-23 (Consents of experts and counsel)
EX-24.(A)
EX-24.(B)
EX-31.(A)
EX-31.(B)
EX-32.(A)
EX-32.(B)
EX-99 (Exhibits not specifically designated by another number and by investment companies)
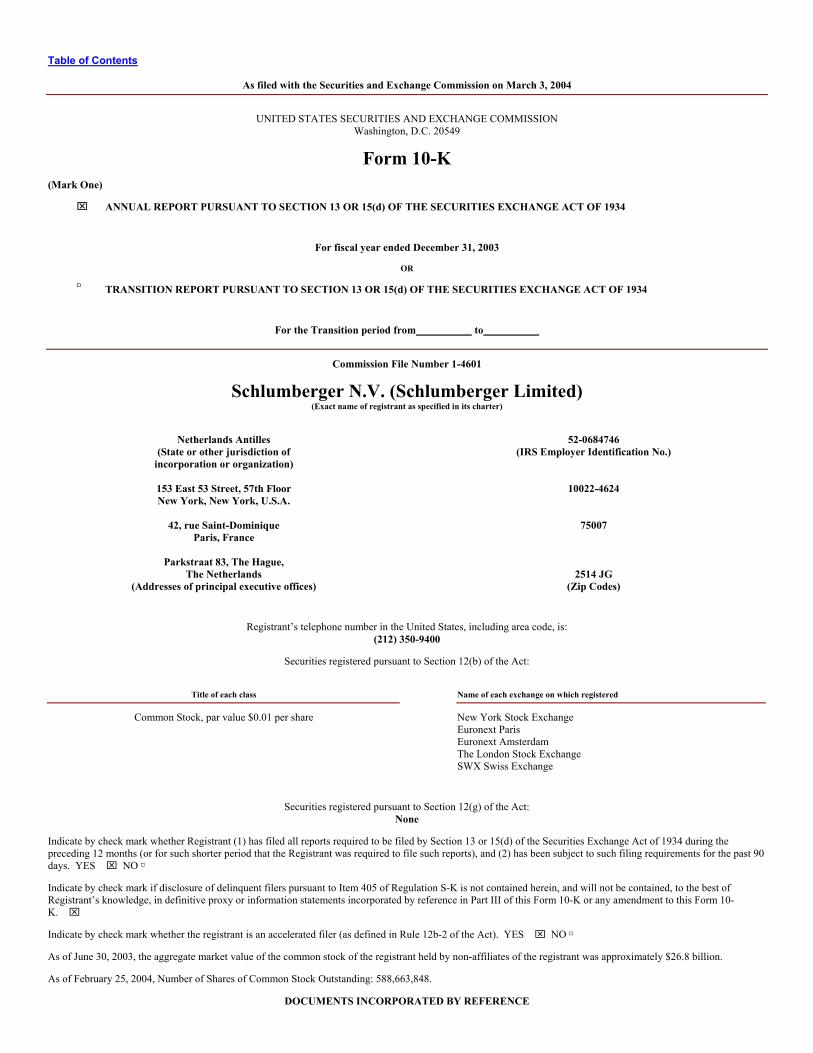
Table of Contents
As filed with the Securities and Exchange Commission on March 3, 2004
UNITED STATES SECURITIES AND EXCHANGE COMMISSION
Washington, D.C. 20549
Form 10-K (Mark One) ⌧ ANNUAL REPORT PURSUANT TO SECTION 13 OR 15(d) OF THE SECURITIES EXCHANGE ACT OF 1934
For fiscal year ended December 31, 2003
OR TRANSITION REPORT PURSUANT TO SECTION 13 OR 15(d) OF THE SECURITIES EXCHANGE ACT OF 1934
For the Transition period from to
Commission File Number 1-4601
Schlumberger N.V. (Schlumberger Limited) (Exact name of registrant as specified in its charter)
Netherlands Antilles 52-0684746 (State or other jurisdiction of
incorporation or organization) (IRS Employer Identification No.)
153 East 53 Street, 57th Floor New York, New York, U.S.A.
10022-4624
42, rue Saint-Dominique
Paris, France 75007
Parkstraat 83, The Hague,
The Netherlands 2514 JG (Addresses of principal executive offices) (Zip Codes)
Registrant’s telephone number in the United States, including area code, is: (212) 350-9400
Securities registered pursuant to Section 12(b) of the Act:
Title of each class
Name of each exchange on which registered
Common Stock, par value $0.01 per share
New York Stock Exchange Euronext Paris Euronext Amsterdam The London Stock Exchange SWX Swiss Exchange
Securities registered pursuant to Section 12(g) of the Act: None
Indicate by check mark whether Registrant (1) has filed all reports required to be filed by Section 13 or 15(d) of the Securities Exchange Act of 1934 during the preceding 12 months (or for such shorter period that the Registrant was required to file such reports), and (2) has been subject to such filing requirements for the past 90 days. YES ⌧ NO
Indicate by check mark if disclosure of delinquent filers pursuant to Item 405 of Regulation S-K is not contained herein, and will not be contained, to the best of Registrant’s knowledge, in definitive proxy or information statements incorporated by reference in Part III of this Form 10-K or any amendment to this Form 10-K. ⌧ Indicate by check mark whether the registrant is an accelerated filer (as defined in Rule 12b-2 of the Act). YES ⌧ NO
As of June 30, 2003, the aggregate market value of the common stock of the registrant held by non-affiliates of the registrant was approximately $26.8 billion. As of February 25, 2004, Number of Shares of Common Stock Outstanding: 588,663,848.
DOCUMENTS INCORPORATED BY REFERENCE

Portions of the following documents have been incorporated herein by reference into the Parts indicated: Definitive Proxy Statement for the Annual General Meeting of Stockholders to be held April 14, 2004 (“Proxy Statement”), Part III.
Table of Contents
SCHLUMBERGER LIMITED
Table of Contents
Form 10-K
Page
PART I Item 1. Business 3Item 2. Properties 7Item 3. Legal Proceedings 7Item 4. Submission of Matters to a Vote of Security Holders 7 PART II Item 5. Market for Schlumberger’s Common Stock and Related Stockholder Matters 10Item 6. Selected Financial Data 11Item 7. Management’s Discussion and Analysis of Financial Condition and Results of Operations 13Item 7A. Quantitative and Qualitative Disclosures About Market Risk 34Item 8. Financial Statements and Supplementary Data 35Item 9. Changes in and Disagreements with Accountants on Accounting and Financial Disclosures 71Item 9A. Controls and Procedures 71 PART III Item 10. Directors and Executive Officers of Schlumberger 72Item 11. Executive Compensation 72Item 12. Security Ownership of Certain Beneficial Owners and Management and Related Stockholder Matters 72Item 13. Certain Relationships and Related Transactions 72Item 14. Principal Accounting Fees and Services 72 PART IV Item 15. Exhibits, Financial Statement Schedules and Reports on Form 8-K 73 Signatures 75 Certifications 82-85
Table of Contents Part 1, Item 1
PART I Item 1 Business All references herein to “Registrant”, “Company” and “Schlumberger” refer to Schlumberger Limited and its consolidated subsidiaries. The following discussion of results should be read in conjunction with the Consolidated Financial Statements. Founded in 1927, Schlumberger is a global oilfield and information services company with major activity in the energy industry. As of December 31, 2003, the company employed 77,000 people, which included 25,000 employees of SchlumbergerSema, of more than 140 nationalities working in 100 countries, and has principal executive offices in New York, Paris and The Hague. During 2003, Schlumberger comprised three primary business segments: Schlumberger Oilfield Services is the world’s premier oilfield services company supplying a wide range of technology services and solutions to the international oil and gas industry. WesternGeco, jointly owned with Baker Hughes, is one of the world’s largest and most advanced surface seismic company. SchlumbergerSema is a leading supplier of IT consulting, systems integration, and network and infrastructure services to the energy industry, as well as to the public sector, telecommunications and finance markets. On September 22, 2003, Schlumberger announced its intention to sell the SchlumbergerSema business to Atos Origin. The sale closed on January 29, 2004. Today, Schlumberger comprises two primary business segments – Oilfield Services and WesternGeco. Active divestiture negotiations are currently ongoing for each of the remaining businesses, which are included in Other activities described below. Schlumberger Oilfield Services is the world’s leading provider of technology, project management and information solutions to the international petroleum industry. With 48,000 employees, Schlumberger Oilfield Services manages its business through 27 Oilfield Services GeoMarket* regions, which are grouped into four geographic areas: North America; Latin America; Europe/CIS/W. Africa; Middle East & Asia. The GeoMarket regions offer customers a single point of contact at the local level for field operations and bring together geographically focused teams to meet local needs and deliver customized solutions. Schlumberger invented wireline logging in 1927 as a technique for obtaining downhole data in oil and gas wells. Today, Schlumberger Oilfield Services operates in each of the major oilfield service markets covering the entire life cycle of the reservoir. These services are organized into seven technology product lines, in which Schlumberger holds a number of market leading positions, to capitalize on technical synergies and introduce innovative solutions within the GeoMarket regions.
• Wireline – services that provide the information necessary to evaluate the formation, plan and monitor well construction, and monitor and evaluate production, divided into open-hole and cased-hole wireline logging.
• Drilling & Measurements – directional drilling, measurements-while-drilling and logging-while-drilling services.
• Well Services – services to construct oil and gas wells, as well as maintain optimal production through the life of an oil and gas field. These include pressure pumping, well stimulation services, coiled tubing, cementing and engineering services.
• Well Completions & Productivity – services for testing and completing wells and producing oil and gas, ranging from well testing and perforating services, completions systems, intelligent completions to a full spectrum of artificial lift services.
• Integrated Project Management – consulting, project management and engineering services leveraging the expertise from the other technology segments for the E&P industry.
3 / SLB 2003 FORM 10-K
Table of Contents Part 1, Item 1
• Data & Consulting Services – measurements, interpretation and integration of all exploration and production data types, and expert consulting services for reservoir characterization, production enhancement, multi-disciplinary reservoir and production solutions, and field development planning.
• Schlumberger Information Solutions – consulting, software, information management and IT infrastructure services that support oil and gas industry core operational processes.
The technology product lines are also responsible for overseeing operational processes, resource allocation, personnel and quality, health, safety and environmental matters in the GeoMarket. Supporting the service technology product lines are 19 research and development (R&D) centers. Through its R&D, Schlumberger is committed to advanced technology programs that will enhance oilfield efficiency, lower finding and producing costs, improve productivity, maximize reserve recovery, increase asset value and accomplish all of these goals in a safe, environmentally sound manner. Schlumberger Oilfield Services uses its own personnel to market its products and services. The customer base, business risks and opportunities for growth are essentially uniform across all services. There is a sharing of manufacturing and engineering facilities as well as research centers; labor force is interchangeable. Technological innovation, quality of service, and price are the principal methods of competition. Competition varies geographically with respect to the different services offered. While there are numerous competitors, both large and small, Schlumberger believes that it is an industry leader in providing measurements-while-drilling and logging-while-drilling services, and fully computerized logging and geoscience software and computing services. A large proportion of the company’s offering is non-rig related; consequently, revenue does not necessarily correlate to rig count fluctuations. In December 2003, Schlumberger announced a phased agreement to acquire PetroAlliance, Russia’s largest independent oilfield services company, beginning with a minority share in 2004. PetroAlliance provides a broad range of exploration and development services, to international standards, throughout Russia and the Caspian. Schlumberger is a minority owner in M-I Drilling Fluids, a joint venture with Smith International that offers drilling and completion fluids utilized to stabilize rock strata during the drilling process and minimize formation damage during completion and workover operations. WesternGeco, which is 70% owned by Schlumberger, provides comprehensive worldwide reservoir imaging, monitoring, and development seismic services, with the most extensive seismic crews and data processing centers in the industry, as well as the world’s largest multiclient seismic library. Services range from 3D and time-lapse (4D) seismic surveys to multi-component surveys for delineating prospects and reservoir management. Seismic solutions include proprietary Q* technology for enhanced reservoir description, characterization, and monitoring throughout the life of the field – from exploration through enhanced recovery. Positioned for meeting a full range of customer needs in land, marine and shallow-water transition-zone services, WesternGeco offers a wide range of technologies and services: • Land Seismic – comprehensive resources for seismic data acquisition on land and across shallow-water transition zones.
• Marine Seismic – fully calibrated single-sensor marine seismic acquisition and processing system, delivering the seismic technology breakthrough needed for new-generation reservoir management.
• Multiclient Services – high-quality seismic data from the most prospective hydrocarbon basins with the leading multiclient data library.
• Reservoir Services – people, tools, and technology to help customers capture the benefits of a completely integrated approach to locating, defining, and monitoring the reservoir.
• Seismic Data Processing – extensive seismic data processing centers for complex processing projects.
4 / SLB 2003 FORM 10-K
Table of Contents Part 1, Item 1 SchlumbergerSema provided during 2003 IT consulting, systems integration, managed services together with network and infrastructure solutions to the global energy industry, as well as in specific regional markets spanning the telecommunications, finance, transport and public sectors. Prior to its sale, SchlumbergerSema was organized as follows:
• Network & Infrastructure Solutions that combines specialized technologies, domain experience and global infrastructure to enable the digital enterprise
through their DeXa Suite of Services and provides secure global IP infrastructure, integrated information security solutions, wireless and remote network connectivity and complete network managed services.
• Consulting & Systems Integration which offers consulting services, business systems and large-scale technical systems designed to operate to the highest levels of reliability in demanding conditions. The knowledge, skills and methods used by Schlumberger consultants around the world, combined with technical, systems integration and outsourced managed services capability within SchlumbergerSema, enable the development, implementation and management of major business and IT programs that are core to the strategic goals and long-term success of all businesses.
Other comprises of businesses which are in active divestiture negotiations. The activities included in this segment are:
• Axalto (Smart Cards and Point-of-Sale Terminals) – On September 22, 2003, Schlumberger Smart Cards & Terminals (SC&T) changed its name to Axalto
to bring more visibility and reinforce its image as a leading smart card player. The SC&T e-City parking meters business was subsequently sold to Apax in the fourth quarter of 2003.
• Business Continuity (disaster recovery services and support to ensure continuation of customers’ business-critical operations).
• Essentis (software platform for payment card issuing and merchant acquiring operations).
• Telecom Software Products (software solutions for wireless messaging applications).
• Water Services (water resource management services).
• Infodata offers a broad range of on-line database services and direct marketing services in Sweden.
• Payphones provides payphones terminals and related communication solutions.
• Electricity Meters (automated meters and meter reading technology for the North American electricity industry). In July 2003, Schlumberger entered into an
agreement to sell the Electricity Meters activity to Itron Inc.; the sale is expected to be completed in the first half of 2004 pending the successful completion of the Hart-Scott-Rodino review process and other conditions.
Acquisitions Information on acquisitions made by Schlumberger or its subsidiaries appears under the heading “Acquisitions” on page 49 of this Report within the Notes to Consolidated Financial Statements. GENERAL Research & Development Research to support the engineering and development efforts of Schlumberger’s activities is conducted at Schlumberger Doll Research, Ridgefield, Connecticut, USA; Schlumberger Cambridge Research, Cambridge, England, and at Stavanger, Norway; Moscow, Russia and Dhahran, Saudi Arabia. 5 / SLB 2003 FORM 10-K
Table of Contents Part 1, Item 1 Patents While Schlumberger seeks and holds numerous patents, no particular patent or group of patents is considered material to Schlumberger’s business. Seasonality Although weather and natural phenomena can temporarily affect delivery of oilfield services, the widespread geographic location of such services precludes the overall business from being characterized as seasonal. However, because oilfield services are provided predominantly in the Northern Hemisphere, severe weather can temporarily affect the delivery of such services and products. Customers and Backlog of Orders No single customer exceeded 10% of consolidated revenue. Oilfield Services has no backlog since it is primarily service rather than product related. SchlumbergerSema backlog at December 31, 2003 was $5.2 billion of which $1.9 billion is the subsequent twelve month backlog. At December 31, 2002, the SchlumbergerSema backlog was $4.7 billion of which $1.5 billion was the subsequent twelve month backlog. The orders are believed to be firm but there is no assurance that any of the current backlog will actually result in sales. Government Contracts No material portion of Schlumberger’s business is subject to renegotiation of profits or termination of contracts by the US or other governments. Employees As of December 31, 2003, Schlumberger had approximately 77,000 employees which included 25,000 SchlumbergerSema employees. Non-US Operations Schlumberger’s non-US operations are subject to the usual risks which may affect such operations. Such risks include unsettled political conditions in certain areas, exposure to possible expropriation or other governmental actions, exchange controls, and currency fluctuations. Although it is impossible to predict such occurrences or their effect on Schlumberger, management believes these risks are acceptable. Environmental Protection Compliance with governmental provisions relating to the protection of the environment does not materially affect Schlumberger’s capital expenditures, earnings or competitive position. Management believes that Schlumberger is currently in substantial compliance with applicable environmental laws and regulations. For more information, see Environmental Matters on page 32 of this Report. Financial Information Financial information by business segment for the years ended December 31, 2003, 2002 and 2001 is given on pages 60 to 63 of this Report, within the Notes to Consolidated Financial Statements. Internet Website Schlumberger’s Internet website can be found at www.slb.com. Schlumberger makes available free of charge, or through our internet website at investorcenter.slb.com, access to its annual report on Form 10-K, quarterly reports on Form 10-Q, current reports on Form 8-K, our proxy statement and Forms 3, 4 and 5 filed on behalf of 6 / SLB 2003 FORM 10-K
Table of Contents Part 1, Item 1, 2, 3, 4 directors and executive officers and amendments to those reports filed pursuant to Section 13(a) or 15(d) of the Exchange Act as soon as reasonably practicable after such material is filed, or furnished to the Securities and Exchange Commission (“SEC”). Additionally, Schlumberger’s corporate governance materials, including Board Committee Charters, Corporate Governance Guidelines, and Code of Ethics may also be found on investorcenter.slb.com. From time to time to time corporate governance materials on our website may be updated to comply with rules issued by the SEC and the New York Stock Exchange (“NYSE”) or as desirable to promote the effective governance of Schlumberger. Any stockholder wishing to receive, without charge, a copy of any of the SEC filings or corporate governance materials should write the Secretary, Schlumberger Limited, 153 East 53rd Street, 57th Floor, New York, New York, 10022. The reference to this website address does not constitute incorporation by reference of the information contained on the website and should not be construed as part of this report. Item 2 Properties Schlumberger owns or leases manufacturing facilities, administrative offices, service centers, research centers, sales offices and warehouses in North and South America, Europe, Africa, Asia and Australia. Some facilities are owned and some are held through long-term leases. No significant lease is scheduled to terminate in the near future, and Schlumberger believes comparable space is readily obtainable should any lease expire without renewal. Schlumberger believes all of its properties are generally well maintained and adequate for the intended use. Outside the United States the principal owned or leased facilities of Oilfield Services are located in Hassi Massoud, Algeria; Luanda, Angola; Perth, Australia; Baku, Azerbaijhan; Rio de Janeiro, Brazil; Calgary and Edmonton, Canada; Beijing, China; Bogota, Colombia; Cairo, Egypt; Clamart and Paris, France; Bombay, India; Balikpapan and Jakarta, Indonesia; Milan, Italy; Fuchinobe, Japan; Atyrau, Kazakhstan; Kuwait City, Kuwait; Kuala Lumpur, Malaysia; Mexico City and Reynosa, Mexico; Port Harcourt, Nigeria; Belfast, Northern Ireland; Stavanger, Norway; Doha, Qatar; Moscow, Russia; Al-Khobar, Saudi Arabia; Singapore; Bangkok, Thailand; Abu Dhabi and Dubai, United Arab Emirates; Aberdeen and Stonehouse, United Kingdom; and Caracas, Venezuela. Within the United States, the principal owned or leased facilities of Oilfield Services are located in Anchorage, Alaska; Lawrence, Kansas; New Orleans, Louisiana; Bartlesville, Oklahoma; and Houston, Rosharon and Sugar Land, Texas. Within the United States, the principal owned or leased facilities of WesternGeco are located in Denver, Colorado; Dead Horse, Alaska, and Houston, Texas. Outside the United States, the principal owned or leased facilities of WesternGeco are located in Hassi Mesaoud, Algeria; Luanda, Angola; Perth, Australia; Baku, Azerbaijan; Rio de Janeiro, Brazil; Calgary, Canada; Cairo, Egypt; Jakarta, Indonesia; Atyrau, Kazakhstan; Kuwait City, Kuwait; Kuala Lumpur, Malaysia; Mexico City and Poza Rica, Mexico; Lagos, Nigeria; Bergen, Oslo and Stavanger, Norway; Moscow, Russia; Al-Khobar, Saudi Arabia; Singapore; Abu Dhabi, Dubai and Jebel Ali, United Arab Emirates; Gatwick and London, United Kingdom; and Caracas, Venezuela. Other principal owned facilities were in Montrouge, France and Oconee, South Carolina. Item 3 Legal Proceedings The information with respect to Item 3 is set forth under the heading Contingencies page 60 of this Report, within the Notes to Consolidated Financial Statements. Item 4 Submission of Matters to a Vote of Security Holders No matters were submitted to a vote of Schlumberger’s security holders during the fourth quarter of the fiscal year covered by this report. 7 / SLB 2003 FORM 10-K
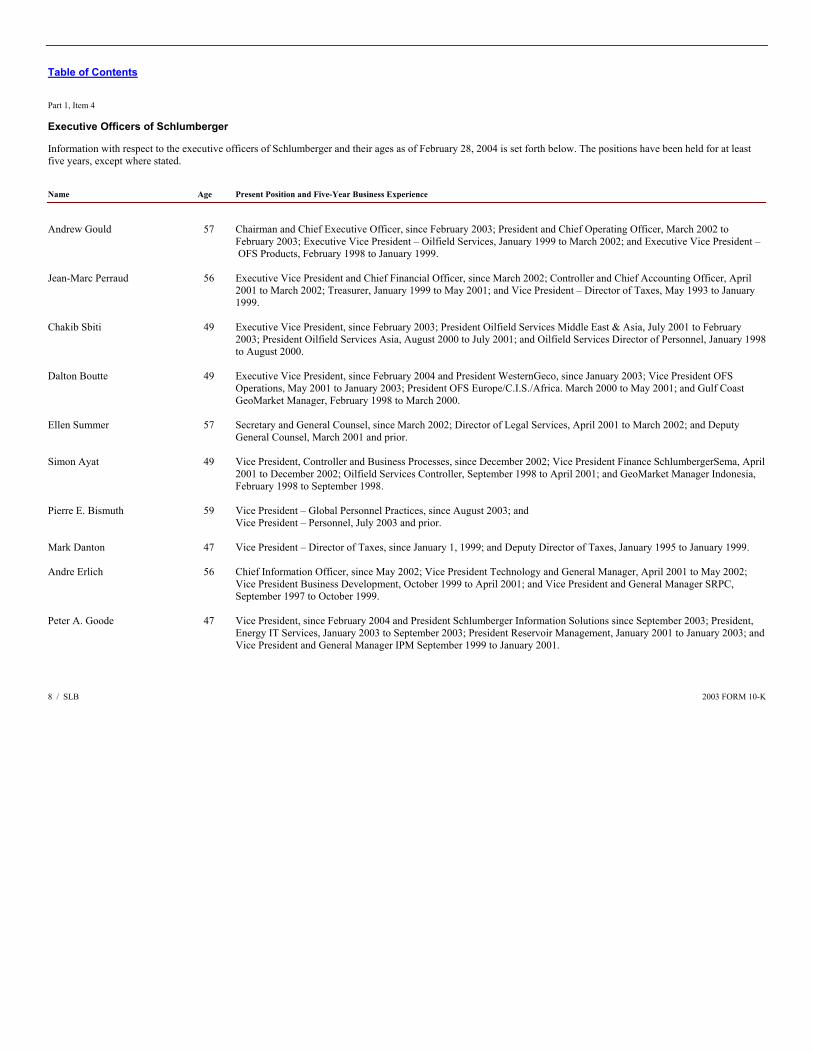
Table of Contents Part 1, Item 4 Executive Officers of Schlumberger Information with respect to the executive officers of Schlumberger and their ages as of February 28, 2004 is set forth below. The positions have been held for at least five years, except where stated. Name Age Present Position and Five-Year Business Experience
Andrew Gould
57
Chairman and Chief Executive Officer, since February 2003; President and Chief Operating Officer, March 2002 to February 2003; Executive Vice President – Oilfield Services, January 1999 to March 2002; and Executive Vice President – OFS Products, February 1998 to January 1999.
Jean-Marc Perraud
56
Executive Vice President and Chief Financial Officer, since March 2002; Controller and Chief Accounting Officer, April 2001 to March 2002; Treasurer, January 1999 to May 2001; and Vice President – Director of Taxes, May 1993 to January 1999.
Chakib Sbiti
49
Executive Vice President, since February 2003; President Oilfield Services Middle East & Asia, July 2001 to February 2003; President Oilfield Services Asia, August 2000 to July 2001; and Oilfield Services Director of Personnel, January 1998to August 2000.
Dalton Boutte
49
Executive Vice President, since February 2004 and President WesternGeco, since January 2003; Vice President OFS Operations, May 2001 to January 2003; President OFS Europe/C.I.S./Africa. March 2000 to May 2001; and Gulf Coast GeoMarket Manager, February 1998 to March 2000.
Ellen Summer
57
Secretary and General Counsel, since March 2002; Director of Legal Services, April 2001 to March 2002; and Deputy General Counsel, March 2001 and prior.
Simon Ayat
49
Vice President, Controller and Business Processes, since December 2002; Vice President Finance SchlumbergerSema, April 2001 to December 2002; Oilfield Services Controller, September 1998 to April 2001; and GeoMarket Manager Indonesia, February 1998 to September 1998.
Pierre E. Bismuth
59
Vice President – Global Personnel Practices, since August 2003; and Vice President – Personnel, July 2003 and prior.
Mark Danton 47 Vice President – Director of Taxes, since January 1, 1999; and Deputy Director of Taxes, January 1995 to January 1999. Andre Erlich
56
Chief Information Officer, since May 2002; Vice President Technology and General Manager, April 2001 to May 2002; Vice President Business Development, October 1999 to April 2001; and Vice President and General Manager SRPC, September 1997 to October 1999.
Peter A. Goode
47
Vice President, since February 2004 and President Schlumberger Information Solutions since September 2003; President, Energy IT Services, January 2003 to September 2003; President Reservoir Management, January 2001 to January 2003; and Vice President and General Manager IPM September 1999 to January 2001.
8 / SLB 2003 FORM 10-K
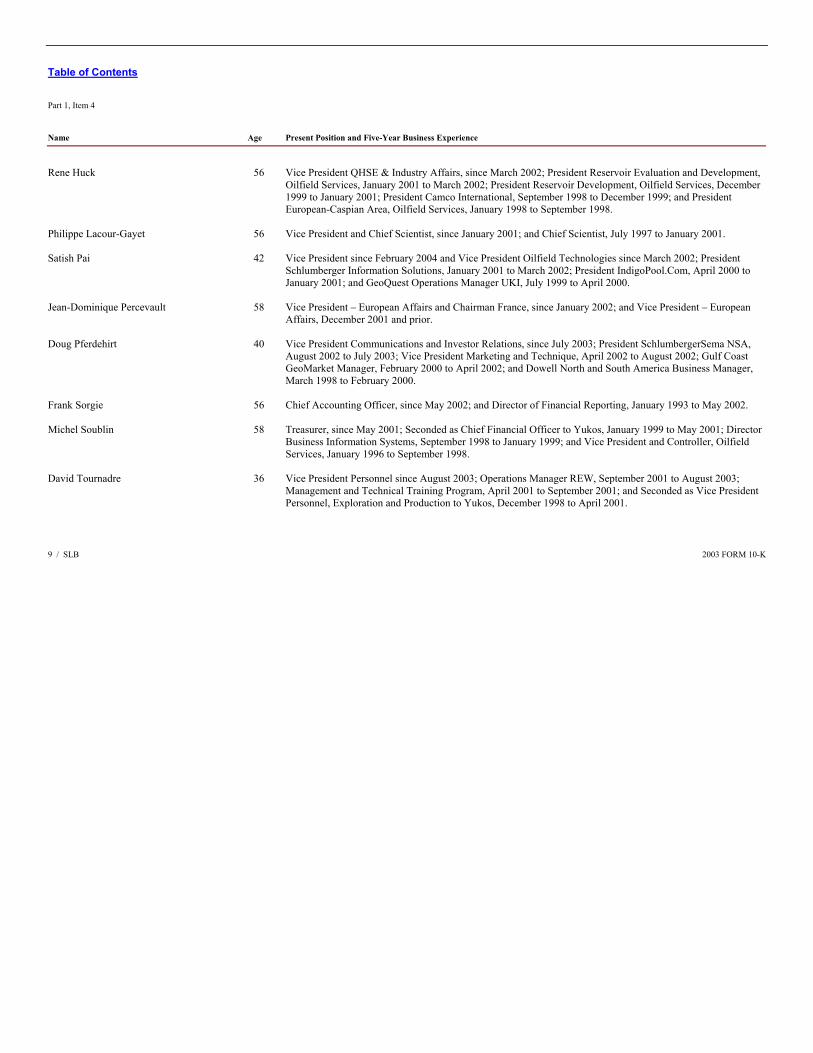
Table of Contents Part 1, Item 4 Name Age Present Position and Five-Year Business Experience
Rene Huck
56
Vice President QHSE & Industry Affairs, since March 2002; President Reservoir Evaluation and Development, Oilfield Services, January 2001 to March 2002; President Reservoir Development, Oilfield Services, December 1999 to January 2001; President Camco International, September 1998 to December 1999; and President European-Caspian Area, Oilfield Services, January 1998 to September 1998.
Philippe Lacour-Gayet 56 Vice President and Chief Scientist, since January 2001; and Chief Scientist, July 1997 to January 2001. Satish Pai
42
Vice President since February 2004 and Vice President Oilfield Technologies since March 2002; President Schlumberger Information Solutions, January 2001 to March 2002; President IndigoPool.Com, April 2000 to January 2001; and GeoQuest Operations Manager UKI, July 1999 to April 2000.
Jean-Dominique Percevault
58
Vice President – European Affairs and Chairman France, since January 2002; and Vice President – European Affairs, December 2001 and prior.
Doug Pferdehirt
40
Vice President Communications and Investor Relations, since July 2003; President SchlumbergerSema NSA, August 2002 to July 2003; Vice President Marketing and Technique, April 2002 to August 2002; Gulf Coast GeoMarket Manager, February 2000 to April 2002; and Dowell North and South America Business Manager, March 1998 to February 2000.
Frank Sorgie 56 Chief Accounting Officer, since May 2002; and Director of Financial Reporting, January 1993 to May 2002. Michel Soublin
58
Treasurer, since May 2001; Seconded as Chief Financial Officer to Yukos, January 1999 to May 2001; Director Business Information Systems, September 1998 to January 1999; and Vice President and Controller, Oilfield Services, January 1996 to September 1998.
David Tournadre
36
Vice President Personnel since August 2003; Operations Manager REW, September 2001 to August 2003; Management and Technical Training Program, April 2001 to September 2001; and Seconded as Vice President Personnel, Exploration and Production to Yukos, December 1998 to April 2001.
9 / SLB 2003 FORM 10-K
Table of Contents Part II, Item 5
PART II Item 5 Market for Schlumberger’s Common Stock and Related Stockholder Matters As of December 31, 2003, there were 585,948,328 shares of the Common Stock of Schlumberger outstanding, exclusive of 81,157,660 shares held in treasury, and approximately 24,770 stockholders of record. The principal United States market for Schlumberger’s Common Stock is the New York Stock Exchange. Schlumberger’s Common Stock is also traded on the Euronext Paris, Euronext Amsterdam, London and SWX Swiss stock exchanges. Common Stock, Market Prices and Dividends Declared per Share The information with respect to this portion of Item 5 is set forth under the heading Common Stock, Market Prices and Dividends Declared per Share on page 32 of this Report. 10 / SLB 2003 FORM 10-K
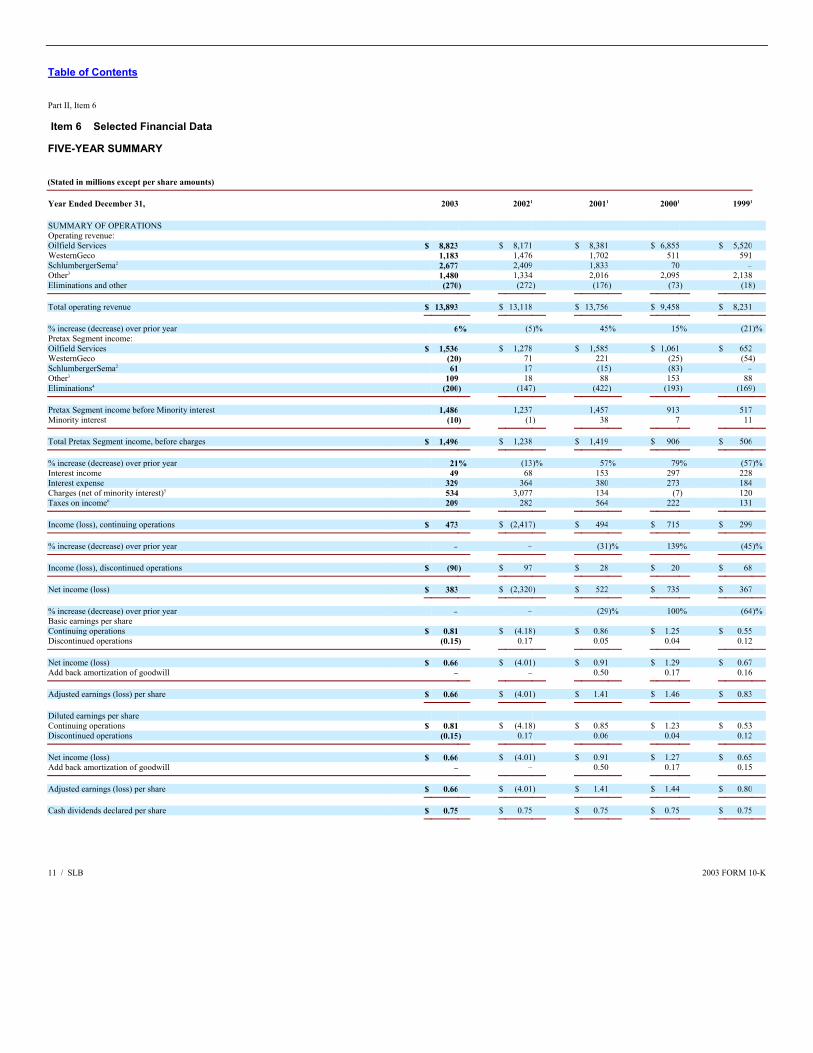
Table of Contents Part II, Item 6 Item 6 Selected Financial Data FIVE-YEAR SUMMARY (Stated in millions except per share amounts)
Year Ended December 31, 2003 20021 20011 20001 19991 SUMMARY OF OPERATIONS Operating revenue: Oilfield Services $ 8,823 $ 8,171 $ 8,381 $ 6,855 $ 5,520 WesternGeco 1,183 1,476 1,702 511 591 SchlumbergerSema2 2,677 2,409 1,833 70 – Other3 1,480 1,334 2,016 2,095 2,138 Eliminations and other (270) (272) (176) (73) (18)
Total operating revenue $ 13,893 $ 13,118 $ 13,756 $ 9,458 $ 8,231
% increase (decrease) over prior year 6% (5)% 45% 15% (21)%Pretax Segment income: Oilfield Services $ 1,536 $ 1,278 $ 1,585 $ 1,061 $ 652 WesternGeco (20) 71 221 (25) (54) SchlumbergerSema2 61 17 (15) (83) – Other3 109 18 88 153 88 Eliminations4 (200) (147) (422) (193) (169)
Pretax Segment income before Minority interest 1,486 1,237 1,457 913 517 Minority interest (10) (1) 38 7 11
Total Pretax Segment income, before charges $ 1,496 $ 1,238 $ 1,419 $ 906 $ 506
% increase (decrease) over prior year 21% (13)% 57% 79% (57)%Interest income 49 68 153 297 228 Interest expense 329 364 380 273 184 Charges (net of minority interest)5 534 3,077 134 (7) 120 Taxes on income6 209 282 564 222 131
Income (loss), continuing operations $ 473 $ (2,417) $ 494 $ 715 $ 299
% increase (decrease) over prior year – – (31)% 139% (45)%
Income (loss), discontinued operations $ (90) $ 97 $ 28 $ 20 $ 68
Net income (loss) $ 383 $ (2,320) $ 522 $ 735 $ 367
% increase (decrease) over prior year – – (29)% 100% (64)%Basic earnings per share Continuing operations $ 0.81 $ (4.18) $ 0.86 $ 1.25 $ 0.55 Discontinued operations (0.15) 0.17 0.05 0.04 0.12
Net income (loss) $ 0.66 $ (4.01) $ 0.91 $ 1.29 $ 0.67 Add back amortization of goodwill – – 0.50 0.17 0.16
Adjusted earnings (loss) per share $ 0.66 $ (4.01) $ 1.41 $ 1.46 $ 0.83
Diluted earnings per share Continuing operations $ 0.81 $ (4.18) $ 0.85 $ 1.23 $ 0.53 Discontinued operations (0.15) 0.17 0.06 0.04 0.12
Net income (loss) $ 0.66 $ (4.01) $ 0.91 $ 1.27 $ 0.65 Add back amortization of goodwill – – 0.50 0.17 0.15
Adjusted earnings (loss) per share $ 0.66 $ (4.01) $ 1.41 $ 1.44 $ 0.80
Cash dividends declared per share $ 0.75 $ 0.75 $ 0.75 $ 0.75 $ 0.75
11 / SLB 2003 FORM 10-K
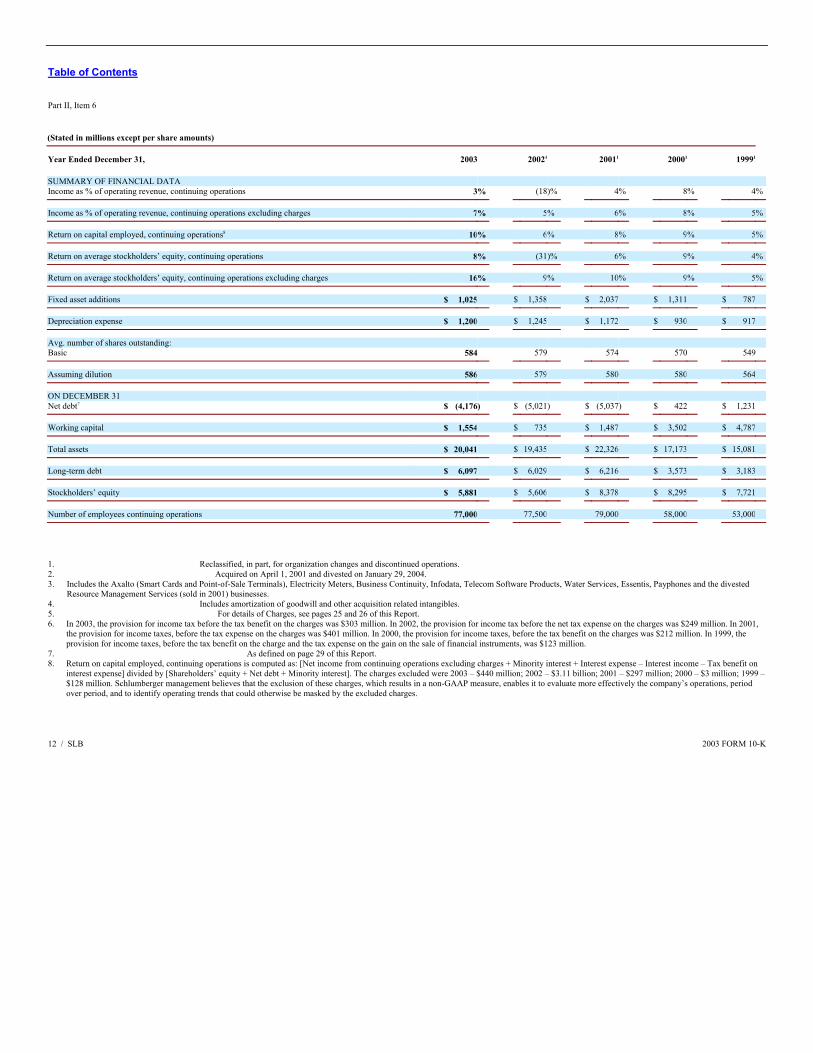
Table of Contents Part II, Item 6 (Stated in millions except per share amounts)
Year Ended December 31, 2003 20021 20011 20001 19991 SUMMARY OF FINANCIAL DATA Income as % of operating revenue, continuing operations 3% (18)% 4% 8% 4%
Income as % of operating revenue, continuing operations excluding charges 7% 5% 6% 8% 5%
Return on capital employed, continuing operations8 10% 6% 8% 9% 5%
Return on average stockholders’ equity, continuing operations 8% (31)% 6% 9% 4%
Return on average stockholders’ equity, continuing operations excluding charges 16% 9% 10% 9% 5%
Fixed asset additions $ 1,025 $ 1,358 $ 2,037 $ 1,311 $ 787
Depreciation expense $ 1,200 $ 1,245 $ 1,172 $ 930 $ 917
Avg. number of shares outstanding: Basic 584 579 574 570 549
Assuming dilution 586 579 580 580 564
ON DECEMBER 31 Net debt7 $ (4,176) $ (5,021) $ (5,037) $ 422 $ 1,231
Working capital $ 1,554 $ 735 $ 1,487 $ 3,502 $ 4,787
Total assets $ 20,041 $ 19,435 $ 22,326 $ 17,173 $ 15,081
Long-term debt $ 6,097 $ 6,029 $ 6,216 $ 3,573 $ 3,183
Stockholders’ equity $ 5,881 $ 5,606 $ 8,378 $ 8,295 $ 7,721
Number of employees continuing operations 77,000 77,500 79,000 58,000 53,000
1. Reclassified, in part, for organization changes and discontinued operations. 2. Acquired on April 1, 2001 and divested on January 29, 2004. 3. Includes the Axalto (Smart Cards and Point-of-Sale Terminals), Electricity Meters, Business Continuity, Infodata, Telecom Software Products, Water Services, Essentis, Payphones and the divested
Resource Management Services (sold in 2001) businesses. 4. Includes amortization of goodwill and other acquisition related intangibles. 5. For details of Charges, see pages 25 and 26 of this Report. 6. In 2003, the provision for income tax before the tax benefit on the charges was $303 million. In 2002, the provision for income tax before the net tax expense on the charges was $249 million. In 2001,
the provision for income taxes, before the tax expense on the charges was $401 million. In 2000, the provision for income taxes, before the tax benefit on the charges was $212 million. In 1999, the provision for income taxes, before the tax benefit on the charge and the tax expense on the gain on the sale of financial instruments, was $123 million.
7. As defined on page 29 of this Report. 8. Return on capital employed, continuing operations is computed as: [Net income from continuing operations excluding charges + Minority interest + Interest expense – Interest income – Tax benefit on
interest expense] divided by [Shareholders’ equity + Net debt + Minority interest]. The charges excluded were 2003 – $440 million; 2002 – $3.11 billion; 2001 – $297 million; 2000 – $3 million; 1999 –$128 million. Schlumberger management believes that the exclusion of these charges, which results in a non-GAAP measure, enables it to evaluate more effectively the company’s operations, period over period, and to identify operating trends that could otherwise be masked by the excluded charges.
12 / SLB 2003 FORM 10-K
Table of Contents Part II, Item 7 Item 7 Management’s Discussion and Analysis of Financial Condition and Results of Operations 2003 Summary The year 2003 marked a watershed for Schlumberger as we took the decision to focus on our core businesses in oilfield services. Our reasoning was simple. World energy needs for much of the next half-century will be met mostly by carbon-based fuels produced from an aging reserves base. Substantial investment will be needed to sustain today’s production as well as to meet tomorrow’s demand, and technology will be the key to a cleaner, more cost-effective response to this challenge. We therefore believe the future for Schlumberger is exceptionally bright. The year’s results for Oilfield Services were robust, with growth in all regions. Among the GeoMarket regions, activity was strongest in Mexico, Indonesia, India, the Caspian, and on land in the United States. Most technology segments registered double-digit gains, with records achieved by Drilling & Measurements and Data & Consulting Services. Much of the technology that saw increasing market penetration was associated with boosting performance in mature fields, or “brownfields”, to stem declining production. Rotary steerable systems to accurately place well trajectories to tap bypassed hydrocarbon pockets and a range of cased-hole wireline evaluation tools to analyze such zones were two particular successes. A number of technical and business highlights marked the year. Integrated Project Management (IPM) continued to grow, particularly in Mexico, where our history of successful projects led to the award of the Chicontepec contract, the most significant oil development project in Mexico in the last 20 years. In Malaysia, we signed a contract with PETRONAS Carigali Sdn. Bhd. to jointly redevelop the Bokor field that began production in the 1980s. This field, comprising more than 165 stacked sands and over 100 producing strings, has been modeled using the latest techniques and the redevelopment plan involves multiple technology segments. Such projects underline the value of our unique GeoMarket organization. In December we announced a phased agreement to acquire PetroAlliance, Russia’s largest independent oilfield service company, beginning with a minority share in 2004. PetroAlliance was formed in 1995 to provide a broad range of exploration and development services to international standards. The size and scope of activity in Russia is huge, and this type of investment will benefit Schlumberger and the Russian oil industry as that industry seeks access to technology to be applied to its particular needs for continued growth. Perhaps the most difficult challenge we set for ourselves early in 2003 was to return WesternGeco to sustainable profitability. Continued overcapacity in both the land and marine and multiclient data markets made this a daunting task. Our approach has been threefold: to bring capacity and cost down to appropriate levels, to reflect a proper carrying value for the data library, and to continue the aggressive introduction of proprietary Q* technology, for which the market has continued to grow rapidly. Last summer we acquired the first marine time-lapse Q survey for Statoil, 200 km from the western coast of Norway. Twenty-one months had elapsed between the two surveys. Initial results, produced only 11 days after acquisition, enabled Statoil to revise plans for a new well and drill a shallower trajectory to remain clear of the oil/water contact. The well was a success and is producing without making water. The reliability and extremely high repeatability of Q-Marine* technology were considered critical to achieving this result. In other applications, a Q system was commissioned in the Middle East late in the year and Q-Seabed* underwent highly successful trials in both the North Sea and Middle East. In defining the business activities sold with SchlumbergerSema, we maintained our commitment to the growing activity in oil and gas IT solutions. The natural fusion of the Schlumberger software and information management activities with the SchlumbergerSema oil & gas consulting and network infrastructure businesses began in October, and by year-end business managers were in place throughout the GeoMarket organization. We have chosen to retain the Schlumberger Information Solutions name for the enlarged business, and our objective is to help customers extract more value from their core operational processes through leveraging the combination of our domain knowledge in IT and in exploration and production (E&P). 13 / SLB 2003 FORM 10-K
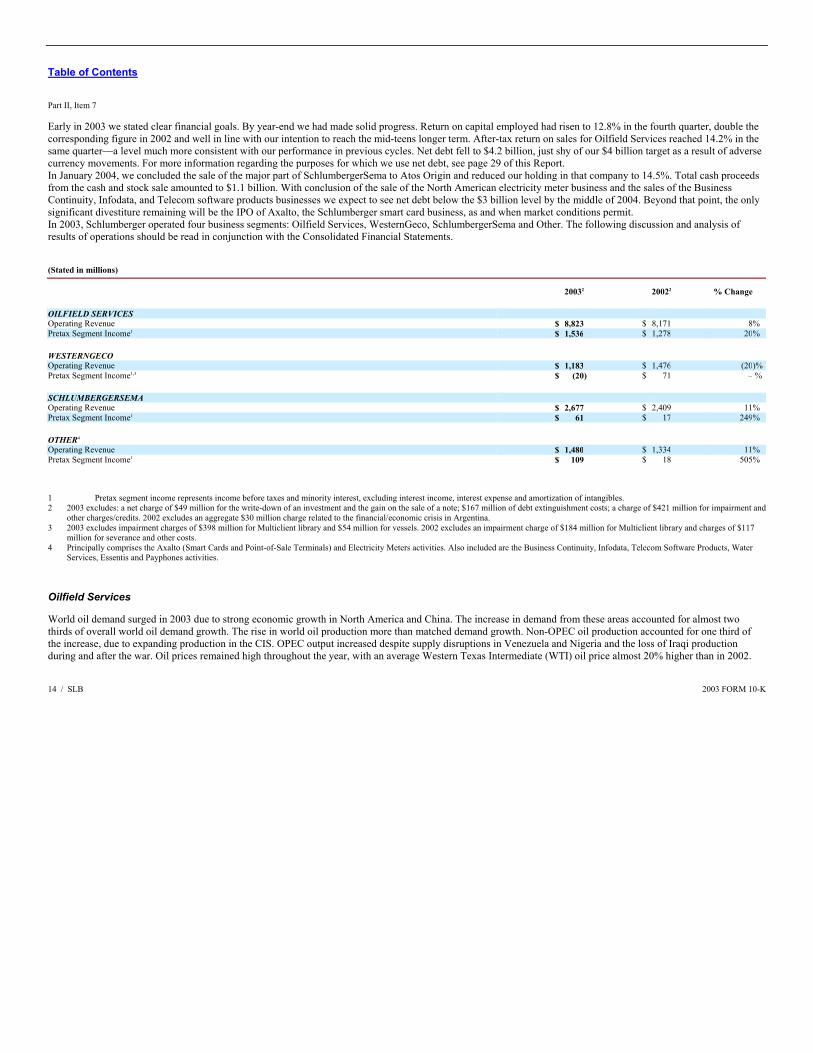
Table of Contents Part II, Item 7 Early in 2003 we stated clear financial goals. By year-end we had made solid progress. Return on capital employed had risen to 12.8% in the fourth quarter, double the corresponding figure in 2002 and well in line with our intention to reach the mid-teens longer term. After-tax return on sales for Oilfield Services reached 14.2% in the same quarter—a level much more consistent with our performance in previous cycles. Net debt fell to $4.2 billion, just shy of our $4 billion target as a result of adverse currency movements. For more information regarding the purposes for which we use net debt, see page 29 of this Report. In January 2004, we concluded the sale of the major part of SchlumbergerSema to Atos Origin and reduced our holding in that company to 14.5%. Total cash proceeds from the cash and stock sale amounted to $1.1 billion. With conclusion of the sale of the North American electricity meter business and the sales of the Business Continuity, Infodata, and Telecom software products businesses we expect to see net debt below the $3 billion level by the middle of 2004. Beyond that point, the only significant divestiture remaining will be the IPO of Axalto, the Schlumberger smart card business, as and when market conditions permit. In 2003, Schlumberger operated four business segments: Oilfield Services, WesternGeco, SchlumbergerSema and Other. The following discussion and analysis of results of operations should be read in conjunction with the Consolidated Financial Statements. (Stated in millions)
20032 20022 % Change OILFIELD SERVICES Operating Revenue $ 8,823 $ 8,171 8% Pretax Segment Income1 $ 1,536 $ 1,278 20% WESTERNGECO Operating Revenue $ 1,183 $ 1,476 (20)%Pretax Segment Income1,3 $ (20 ) $ 71 – % SCHLUMBERGERSEMA Operating Revenue $ 2,677 $ 2,409 11% Pretax Segment Income1 $ 61 $ 17 249% OTHER4 Operating Revenue $ 1,480 $ 1,334 11% Pretax Segment Income1 $ 109 $ 18 505%
1 Pretax segment income represents income before taxes and minority interest, excluding interest income, interest expense and amortization of intangibles. 2 2003 excludes: a net charge of $49 million for the write-down of an investment and the gain on the sale of a note; $167 million of debt extinguishment costs; a charge of $421 million for impairment and
other charges/credits. 2002 excludes an aggregate $30 million charge related to the financial/economic crisis in Argentina. 3 2003 excludes impairment charges of $398 million for Multiclient library and $54 million for vessels. 2002 excludes an impairment charge of $184 million for Multiclient library and charges of $117
million for severance and other costs. 4 Principally comprises the Axalto (Smart Cards and Point-of-Sale Terminals) and Electricity Meters activities. Also included are the Business Continuity, Infodata, Telecom Software Products, Water
Services, Essentis and Payphones activities.
Oilfield Services World oil demand surged in 2003 due to strong economic growth in North America and China. The increase in demand from these areas accounted for almost two thirds of overall world oil demand growth. The rise in world oil production more than matched demand growth. Non-OPEC oil production accounted for one third of the increase, due to expanding production in the CIS. OPEC output increased despite supply disruptions in Venezuela and Nigeria and the loss of Iraqi production during and after the war. Oil prices remained high throughout the year, with an average Western Texas Intermediate (WTI) oil price almost 20% higher than in 2002. 14 / SLB 2003 FORM 10-K
Table of Contents Part II, Item 7 In 2004, the rate of global oil demand growth is expected to be similar to 2003, with oil demand projected to grow strongly in developing countries and ease in OECD countries. Non-OPEC oil production is forecast to grow at roughly similar levels to 2003 although there is more uncertainty over the level of supply in the CIS and the US. OPEC production is likely to be adjusted to maintain the price of the OPEC basket of crude in the stated target price range of $22 to $28 per barrel. North American gas demand in 2003 showed little change compared to 2002, and is not expected to vary much in 2004. However, maintaining gas supply to meet demand is challenging, as production decline rates are already high and expected to increase further. The average annual US natural gas price in 2003 rose considerably compared to last year and has stimulated growth in the number of active drilling rigs in North America. Relatively high commodity prices in 2003 and increases in production have resulted in high levels of cash generation in the oil and gas industry, and a subsequent increase in the average number of active drilling rigs. Assuming demand remains strong and that OPEC manages to maintain oil prices in its target range, exploration and production (E&P) spending is expected to increase in 2004. 2003 Results Revenue of $8.8 billion increased 8% in 2003 versus 2002 led by North America with an increase of 14%, followed by Latin America and Middle East & Asia, which both increased 9%, and Europe/CIS/W. Africa, which was up 4%. Pretax operating income of $1.54 billion in 2003 was 20% higher than in 2002, primarily due to strong customer demand resulting from increased E&P expenditures and customer acceptance of new technologies, such as PowerDrive* rotary steerable systems, LiteCRETE* coalbed methane slurry system, ABC*Analysis Behind Casing suite of services, Viscoelastic Diverting Acid (VDA*) advanced acidizing system, and ClearFRAC* polymer-free fracturing fluid. Overhead cost savings of $67 million generated from restructuring and downsizing efforts, principally in Europe/CIS/W. Africa and North & South America, also contributed to the increased profitability during the year. Oilfield Services began the year with relatively flat revenue in the first quarter, then achieved modest, but continuous growth over the following three quarters due to new contracts, the introduction of new technologies, and increased demand for Integrated Project Management and Schlumberger Information Solutions (SIS) services. The results were positively impacted by an upturn in natural gas drilling in North America, and increased activity in Mexico, Russia and the Middle East, partially offset by a nationwide strike in Venezuela and ethnic unrest in Nigeria. All technology product lines helped drive revenue growth. Well Services and Drilling & Measurements’ record levels of revenue contributed to more than half of the increase in Oilfield Services revenue. Data & Consulting services drew the award of several contracts for reservoir modeling, field development planning, and production optimization. SIS experienced strong demand, particularly in Europe, Asia, and the Middle East. Integrated Project Management (IPM) experienced high activity levels principally fueled by Latin America. In December, Schlumberger announced a phased agreement to acquire PetroAlliance beginning with a minority share in 2004. PetroAlliance is Russia’s largest independent oilfield services company, and provides a broad range of exploration and development services throughout Russia and the Caspian. North America North America revenue of $2.6 billion increased 14% versus 2002. The growth in revenue was mainly due to increased activity in US Land, as well as Canada, which had a 31% increase in revenue to $410 million. Both markets were driven by strong commodity prices, which, in turn, were caused by the record low gas storage levels at the end of the 2003 drawdown season. This growth was not mirrored in the Gulf of Mexico where activity was essentially flat year-on-year. A combination of factors contributed to the sluggish performance 15 / SLB 2003 FORM 10-K
Table of Contents Part II, Item 7 offshore, including higher finding and developing cost on the shelf, lack of exploration success in deepwater and unfavorable weather conditions hampering drilling and completion efficiency on a number of deepwater projects. Pretax operating income of $365 million increased 33% over 2002 primarily due to a beneficial fall-through resulting from improved equipment utilization in US Land following asset rationalization and cost containment. Increased demand for Drilling & Measurements, cased hole wireline and hydraulic fracturing solutions, related to increased complexity in developing new gas reserves in US Land, also contributed to profitability improvement. Latin America Latin America revenue of $1.4 billion increased 9% versus 2002 primarily due to substantial increases in Mexico, Brazil and Argentina, partially offset by a significant decline in Venezuela. Large-scale project management contracts substantially accounted for the growth in activity in Mexico. Growth in Brazil was driven by a strong increase in Petrobras exploration activity, and Argentina benefited from the high oil price. The political turmoil in the early part of the year substantially impacted results in Venezuela, however the focus on restoring production favorably drove the revenue in the latter half of the year. The increase in E&P spending in Mexico was driven by the compelling need to satisfy the domestic demand for natural gas, increase the light oil production and ramp-up the oil production potential. Key contracts that contributed to revenue growth included project management of a four-year, $500 million integrated oilfield services project which represents the most significant oil development project in Mexico in the last 20 years, and a two-year, $60 million information management solution. Pretax operating income of $221 million was up 31% year-on-year with all areas excluding Venezuela contributing to improved profitability. There were record levels of Integrated Project Management contracts in Mexico and positive fall-through on incremental revenue in Argentina and Brazil. Europe/CIS/West Africa Revenue of $2.6 billion increased 4% over 2002, primarily in Russia due to growth in E&P spending and continued expansion of the addressable market, which drove increased fracturing activity, high sales of artificial lift pumps, and the adoption of more advanced drilling technologies. CIS reached a record revenue level of $629 million, 22% higher than 2002. An increase in the number of E&P companies entering the development phase of deepwater projects in the West & South Africa GeoMarket during the second half of 2003, and an offshore gas project in the Mediterranean also contributed to overall activity improvement in the Area, principally in Well Completions & Productivity and Well Services technologies. These results were partially offset by lower exploration activity by the major oil companies in the North Sea and by production shutdowns in the Western Niger delta in Nigeria due to socio-political unrest. Pretax operating income of $460 million increased 20% over 2002 primarily due to cost savings generated at the beginning of the year, as well as increased activities in West & South Africa due to deepwater activities moving into a more lucrative development phase. This was partially offset by appreciation of currencies against the US dollar negatively impacting the results by $4 million later in the year. Middle East & Asia Revenue of $2.1 billion increased 9% over 2002 with more than half the growth coming from Saudi Arabia/Kuwait, Egypt and Indonesia. Despite geopolitical uncertainty in the period leading up to the war in Iraq and relative softness in Asia principally caused by the SARS outbreak, revenue showed marked improvement primarily due to higher demand for Drilling & Measurements, Wireline and Well Completion & Productivity technologies in Egypt, Saudi Arabia/Kuwait and Indonesia partially offset by reduced activity in Malaysia/Brunei/Philippines due to the suspension of planned deepwater development work resulting from the 16 / SLB 2003 FORM 10-K
Table of Contents Part II, Item 7 deepwater acreage dispute between Malaysia and Brunei. Late in the year, strong year-on-year improvements across the region were tempered by reduced rig activity in Saudi Arabia due to customers’ accelerated spending in the first three quarters. Pretax operating income of $509 million increased 12%, primarily due to the operating leverage on increased revenue across most GeoMarkets, principally caused by increased activity in Indonesia’s East Kalimantan and stimulation activity and artificial lift sales in East Africa. 2002 Results Revenue for 2002 was $8.2 billion versus $8.4 billion in 2001 reflecting reduced activity in North America and Latin America, which was partially mitigated by higher activity in Europe/CIS/W. Africa and the Middle East & Asia. Pretax operating income of $1.3 billion decreased 19% primarily from reduced margins in Wireline and Well Services as activity declined in North America. A sharp fall in revenue at the beginning of 2002 reflected declining activity levels in North America, which remained depressed for the remainder of the year, together with political and economic uncertainty in Latin America. In the second and third quarters, robust activity in Europe/CIS/W. Africa, and signs of a possible recovery in Asia, mitigated the effects of low North American drilling levels resulting in increased revenue. However, this trend was short-lived as slower activity outside North America due mainly to seasonal influences coupled with budget cuts resulted in lower fourth quarter revenue. The Caspian, Russia and Mexico GeoMarkets posted the highest double-digit year-on-year revenue growth of 89%, 62% and 48%, respectively. From a technology standpoint, the strongest performer was Well Completions & Productivity where acquisitions, testing, advanced completions systems and artificial lift technology showed market share gains. During the year, Schlumberger acquired A. Comeau & Associates Limited, a leading provider of electrical engineering products and services for artificially lifted wells. This latest addition, combined with the successful integration of Sensa and Phoenix technologies into the Schlumberger Artificial Lift services portfolio, contributed to higher sales in 2002, particularly in the Eastern Hemisphere. The Drilling & Measurements technology segment also recorded solid revenue growth fuelled largely by the continued penetration of the PowerDrive475* rotary steerable system into new GeoMarkets. Schlumberger made two further acquisitions during the year to bolster its real-time reservoir management suite of services. In January, Schlumberger acquired Norwegian-based Inside Reality AS providing new 3D virtual reality systems that create a unique and powerful environment for interactive well planning and real-time geosteering analysis. Schlumberger also acquired the software and services business of Technoguide AS, a leader in the reservoir modeling domain. North America Revenue of $2.3 billion decreased 19% versus 2001. A steep revenue decline at the outset of the year reflected a continued lackluster drilling environment and unseasonably mild weather conditions. Throughout the remainder of the year activity levels remained depressed resulting in essentially flat revenue for 2002. Other factors contributing to reduced revenue included lower non-rig related activity resulting in lower Wireline, Well Services, and Well Completions & Productivity revenue, the effects of the tropical storms in the third quarter and a slow pick-up in Canadian activity post spring break-up. Pretax operating income of $274 million decreased from $637 million in 2001 due to pricing pressures across all services, particularly in Well Services and Well Completions & Productivity. Latin America Revenue of $1.3 billion decreased 9% versus 2001. Ongoing political and economic uncertainty in the region continued to affect business conditions, particularly in Venezuela and Argentina. This particularly impacted results in the first half of the year. In sharp contrast, the second half of 2002 saw solid growth partly as a 17 / SLB 2003 FORM 10-K
Table of Contents Part II, Item 7 result of higher demand for Drilling & Measurements and Well Completions technologies connected to contracts in the Burgos Basin. In addition, the completion of an IPM project that involved the sale of production facilities in Ecuador for $26.5 million in the fourth quarter contributed to end-of-year higher revenue. Pretax operating income of $169 million declined 8% as a result of decreased activity in Venezuela and Argentina. Europe/CIS/West Africa Revenue of $2.5 billion increased 17% versus 2001. Strong revenue growth was recorded in the first three quarters reflecting increased activity levels and market share gains particularly in the Caspian and Russia GeoMarkets in respect to artificial lift and drilling technologies. The Well Completions & Productivity technology segment recorded the strongest growth of 27% followed by Drilling & Measurements, which grew 24%. This growth was partially mitigated by a steep revenue drop in the fourth quarter due to exceptionally severe winter weather conditions in the North Sea and Russia that affected all services, particularly fracturing activities. In addition, operator budget cuts in the Nigeria GeoMarket and refocused investment decisions in the UK contributed to lower fourth quarter revenue. Pretax operating income was $383 million compared to $385 million in 2001, with the very slight decrease due to softening in pricing towards the end of the year and restructuring in the region to reduce support infrastructure to match slowing activity levels. Middle East & Asia Revenue of $1.9 billion increased 8% versus 2001. After a decline at the beginning of the year resulting from exceptional artificial lift sales at the end of 2001, the Asian market showed signs of recovery highlighted by strong revenue growth in the second quarter. Over the year, the India and Malaysia/Brunei/Philippines GeoMarkets recorded the strongest growth due to increased activity in these countries. In addition, the Wireline and Well Services technology segments posted the highest growth, up 14% and 10%, respectively. This was partly offset by a slowdown in activity in the second half of 2002 due to a number of major projects nearing completion and lower equipment sales. Pretax operating income of $453 million was up 9% versus 2001. 2001 Results Revenue of $8.4 billion increased 22% over 2000. Increased non-rig related activity and higher pricing levels contributed to the growth. First quarter results reflected continued high activity in North America and increased demand internationally, but a softening in North American drilling activity in the third quarter offset international growth. Market share gains, improved pricing levels, and the introduction of new technology contributed to strong growth in the Drilling & Measurements and Well Completions & Productivity technology segments. Three key acquisitions were made during the year: Baker Jardine (software tools, IT consulting and integrated solutions that help operators increase oil and gas production), Sensa (fiber optic sensing technologies), and Phoenix (technologies and techniques for optimizing production from artificially lifted wells). Pretax operating income of $1.59 billion increased 49% over last year. North America Revenue of $2.8 billion increased 17% versus 2000. The strong revenue growth in the first quarter of 2001 plateaued in the middle of the year. This was due to slower economic conditions and declining natural gas prices, which resulted in reduced activity towards the end of the year. The Alaska and Gulf Coast GeoMarkets recorded the strongest revenue growth due to increased demand for Drilling & Measurements, Well Services, and Wireline technologies. Pretax operating income of $637 increased 69%, primarily due to strong demand for Well Services technology. 18 / SLB 2003 FORM 10-K
Table of Contents Part II, Item 7 Latin America Revenue of $1.5 billion increased 31%, with improvements across all services contributing to double-digit growth across the GeoMarkets, which was led by Peru/Colombia/Ecuador and Latin America South as a result of increased Drilling & Measurements, Well Services, and Well Completions activity. Pretax operating income of $183 million increased 131% principally as a result of increases in Integrated Project Management and Wireline services. Europe/CIS/West Africa Revenue of $2.1 billion increased 36%. Overall moderate growth was led by high demand for Well Completions services in Nigeria, and strong growth in both Drilling & Measurements and Wireline services in Russia. Growth in the West & South Africa GeoMarket was partly due to an Early Production Facility Project for IPM during the year. Pretax operating income of $385 million increased 60% due mainly to the Well Completions & Productivity segment, which recorded strong growth across most GeoMarkets. Middle East & Asia Revenue of $1.8 billion increased 16%. Almost all GeoMarkets in the Area recorded strong double-digit growth led by Drilling & Measurements and Well Services activities in the Malaysia/Brunei/Philippines GeoMarket, and as a result of new contract wins in the Gulf GeoMarket. Pretax operating income of $416 grew 34% due to increases in the Drilling & Measurements and Well Completions & Productivity technology segments. WesternGeco 2003 Results Revenue for 2003 was $1.2 billion versus $1.5 billion in 2002, reflecting a 20% decrease year-on-year. This was primarily due to lower land crew activity following the exiting of the North American Land market combined with the completion of some contracts in the Middle East. The decrease in revenue was also due to declines in Multiclient sales principally in North & South America, partially offset by increased Marine activity in Europe, Caspian and the Middle East. Q-Marine* continued to gain customer acceptance with 75% vessel utilization on third party contracts in the third quarter, and the first Q-on-Q time lapse survey, which was performed in the North Sea with initial processing results available after 11 days. The end of the year saw a return to traditional seasonal Multiclient revenue levels partially helped by the signing of a long-term business agreement with a major energy company that included the licensing of part of the WesternGeco data library, as well as joint R&D and training on new technology for seismic data processing. Including Multiclient pre-commitments, the backlog at the end of 2003 reached $408 million, reflecting the award of a number of Land contracts in the Middle East and a material Multiclient volume agreement signed in the fourth quarter. During 2003, Q-Marine continued to command significant pricing premiums as a result of the added value obtained from the delivered product, but pricing across other business segments was flat to down for conventional marine, land and data processing activity due to continued overcapacity in the industry. The company’s decision to acquire only significantly prefunded multiclient surveys, along with lower amortization following the impairment charge in 2003, resulted in the Multiclient product line being in a much healthier condition at the end of the year. Q-Marine penetration continued strong, reflected by the doubling of Q revenue year-on-year. Pretax operating loss was $20 million versus a profit of $71 million in 2002 (excluding Multiclient impairment and other charges in both years) mainly due to significantly higher Multiclient amortization charges as a result of lower sales and a more conservative amortization policy in light of business conditions. The lower Multiclient sales were primarily due to an overall lessening in interest in the Gulf of Mexico from 19 / SLB 2003 FORM 10-K
Table of Contents Part II, Item 7 the major oil companies coupled with an average price reduction of approximately 30% during the year. The deterioration in the Multiclient results was partially offset by an improvement in Land and Marine following the fourth quarter 2002 restructuring program combined with better service delivery. In the third quarter, an impairment charge of $398 million pretax was taken against the multiclient library and there was a $54 million pretax charge on the Western Trident and Western Monarch vessels. 2002 Results WesternGeco revenue of $1.5 billion decreased 13% compared to the prior year, primarily due to decreased activity in North America and Europe/CIS/W. Africa, which were partially offset by increases in Latin America and the Middle East & Asia. The seismic downturn continued throughout 2002 resulting in significantly lower activity levels, a reduction in Multiclient sales, and extreme pricing pressures on all services due to large overcapacity in the seismic industry. Significant workforce reductions were made in the fourth quarter of 2002 as a result of the decision to stop Land acquisition activities in the US lower 48 states and Canada. Pretax operating income of $71 million fell 68%, primarily due to significantly lower Multiclient sales and decreased activities in North America coupled with Land seismic contract losses in Mexico and Marine seismic contract losses in India, both of which were related to production delays. 2001 Results The WesternGeco joint venture was formed on November 30, 2000. Revenue in 2001 was $1.7 billion and pretax operating income was $221 million. The Malaysia/Brunei/Philippines, Alaska, Gulf Coast, and West & South Africa GeoMarkets recorded the strongest results for the year. Multiclient sales of $654 million in a favorable pricing environment also contributed to the high level of activity and were the major contributor to the operating income. SchlumbergerSema 2003 Results On September 22, 2003, Schlumberger announced its intention to sell the SchlumbergerSema business to Atos Origin. The sale closed on January 29, 2004. The transaction proceeds consisted of €443 million ($550 million) in cash, which included a working capital adjustment, and 19.3 million shares of common stock of Atos Origin with a value of €1.02 billion ($1.275 billion) which represented approximately 29% of the outstanding common shares of Atos Origin. On February 2, 2004, Schlumberger sold 9.6 million shares for $630 million reducing its investment in Atos Origin to approximately 15% of the outstanding common shares. Revenue of $2.7 billion was 11% higher than 2002. The increase was mainly due to the strengthening of the European currencies against the US dollar, with a positive impact of $274 million, resulting in an underlying decrease in operating revenue of $6 million. Pretax operating income of $61 million increased $44 million versus 2002. The improvement in profitability reflected the full year benefit of indirect cost reduction programs carried out in 2002 in North America, Asia, UK, and Sweden coupled with improvement in gross margins in Asia and South America. North & South America Revenue of $350 million decreased 2% mainly due to the Salt Lake City Olympic Games revenue in 2002, partially offset by new contracts for Lee County, Florida; Dallas County, Texas; Sprint; and the city of Los Angeles, California. 20 / SLB 2003 FORM 10-K
Table of Contents Part II, Item 7 Pretax operating income of $3 million increased $57 million year-on-year. Despite the decline in revenue, operating income increased substantially mainly due to the positive impact of indirect cost reduction programs initiated in 2002, which had a full impact of $29 million in 2003. Europe/Middle East/Africa Revenue of $2.2 billion increased 14% mainly due to the appreciation of European currencies against the US dollar. Revenue from operations declined due to a depressed IT market in Italy, a more than 20% average selling price drop in France, and a sharp downturn in the telecommunications industry in Germany. These declines were substantially offset by a significant increase in revenue in the UK due to the Metropolitan Police, Department of Works and Pension, Consignia, and Department of Trade and Industry contracts, and by the award of the All Africa Games project in Nigeria. Pretax operating income of $46 million decreased 65% year-on-year reflecting the impact of lower revenue from operations due to the major downturn in the IT industry, especially in France and Germany. Profitability also decreased due to extra service delivery costs in Sweden, and higher pension costs in France. These decreases were partially offset by the benefit of indirect cost reduction programs in the UK, as well as increased profitability from the revenue growth in the UK and Nigeria. Asia Revenue of $144 million decreased 4% mainly due to a lower activity level in India and Taiwan. Pretax operating income increased from break-even in 2002 to $34 million profit in 2003, reflecting a 10% increase in gross margins, as well as lower costs following headcount reduction programs initiated in 2001 and 2002. 2002 Results Revenue of $2.4 billion increased 31% compared to 2001 mainly due to the acquisition of Sema plc whose results were consolidated with effect from April 1, 2001. The pretax operating income was $17 million compared to a loss of $15 million in 2001, reflecting the cost reductions initiatives implemented since the integration of Sema plc into Schlumberger. North & South America Revenue of $356 million decreased 7% over 2001 primarily due a declining activity level in the telecommunications and utility industries due primarily to the weak IT services spending environment as customers faced economic challenges and continued to revise budgets downwards and delay decisions on contract awards. At the 2002 Winter Olympic Games, SchlumbergerSema led a consortium of 15 technology partners in a three-year long project to deliver the IT infrastructure needed to run the Games. Pretax operating loss of $54 million improved by $4 million over 2001, mainly attributable to the cost reduction programs implemented throughout the area. Europe/Middle East/Africa Revenue of $1.9 billion increased 33% over 2002 mainly due to the inclusion of a full year’s revenue from the acquisition of Sema plc compared to nine months in 2001. Additionally, the main growth contributor was the Public Sector mainly in the UK where SchlumbergerSema won large outsourcing contracts with the Association of Train Operating Companies, the Department of Works and Pension, and the Vehicle Inspectorate, and a health and welfare services project to Consignia’s 220,000 employees. Pretax operating income of $132 million increased 33% due mainly to the cost cutting program implemented throughout the year and higher activity level in the UK. 21 / SLB 2003 FORM 10-K
Table of Contents Part II, Item 7 Asia Revenue of $150 million increased 36% mainly due to the inclusion of a full year’s revenue from the acquisition of Sema plc compared to nine months in 2001. The decreased activity in telecommunications, mainly in China and Taiwan, was offset by the increase in the finance segment on new outsourcing contracts in the insurance sector in Japan and delivery of payment systems in China. Pretax operating income decreased 94% mainly attributable to pricing pressure and economic declines in the telecommunications IT services industry. 2001 Results On April 6, 2001, Schlumberger completed the acquisition of Sema plc, an IT and technical services company with a strong European presence, for $5.15 billion. Revenue of $1.8 billion compared to $70 million in 2000 reflecting the acquisition of Sema plc. Pretax operating loss of $15 million improved $69 million over the prior year due to the addition of Sema plc. North & South America Revenue of $381 million increased from $70 million in 2000 essentially due to the inclusion of SchlumbergerSema and the full year’s activity of the Convergent Group, acquired in November 2000 and CellNet Data Systems, acquired in June 2000. Pretax operating loss of $58 million improved $12 million compared to the previous year due to the inclusion of SchlumbergerSema and the new businesses acquired the previous year. Europe/Middle East/Africa Revenue of $1.4 billion in 2001 compared to no activity in 2000 due to the inclusion of Sema plc. Main contracts included the award of multi-million dollar contracts in France for Banque de France and in the UK for Metropolitan Police. Pretax operating income was $99 million due to the inclusion of Sema plc. Asia Revenue of $110 million compared to no activity in 2000 due to the inclusion of Sema plc. Pretax operating income was $8 million due to the inclusion of Sema plc. Other The activities included in this segment are Axalto (Smart Cards and Point-of-Sale Terminals), Electricity Meters, Business Continuity, Infodata, Telecom Software Products, Payphones, and Essentis. Active divestiture negotiations are currently ongoing for each of these activities. 2003 Results In July 2003, Schlumberger entered into an agreement to sell the Electricity Meters activity to Itron Inc. for $255 million in cash. The deal is expected to be completed in the first half of 2004 depending upon the successful completion of the Hart-Scott-Rodino review process and other conditions. Revenue of $1.5 billion increased 11% over 2002. Electricity Meters had a 25% improvement on revenue of $294 million partially as a result of the transition from electro-mechanical meters to solid-state meters. Also contributing to revenue growth, Smart Cards and Point-of-Sale Terminals revenue of $776 million increased 8% principally due to strong demand for Subscriber Identity Module (SIM) cards for the mobile communications sector, particularly in North & South America and Eastern Europe. 22 / SLB 2003 FORM 10-K
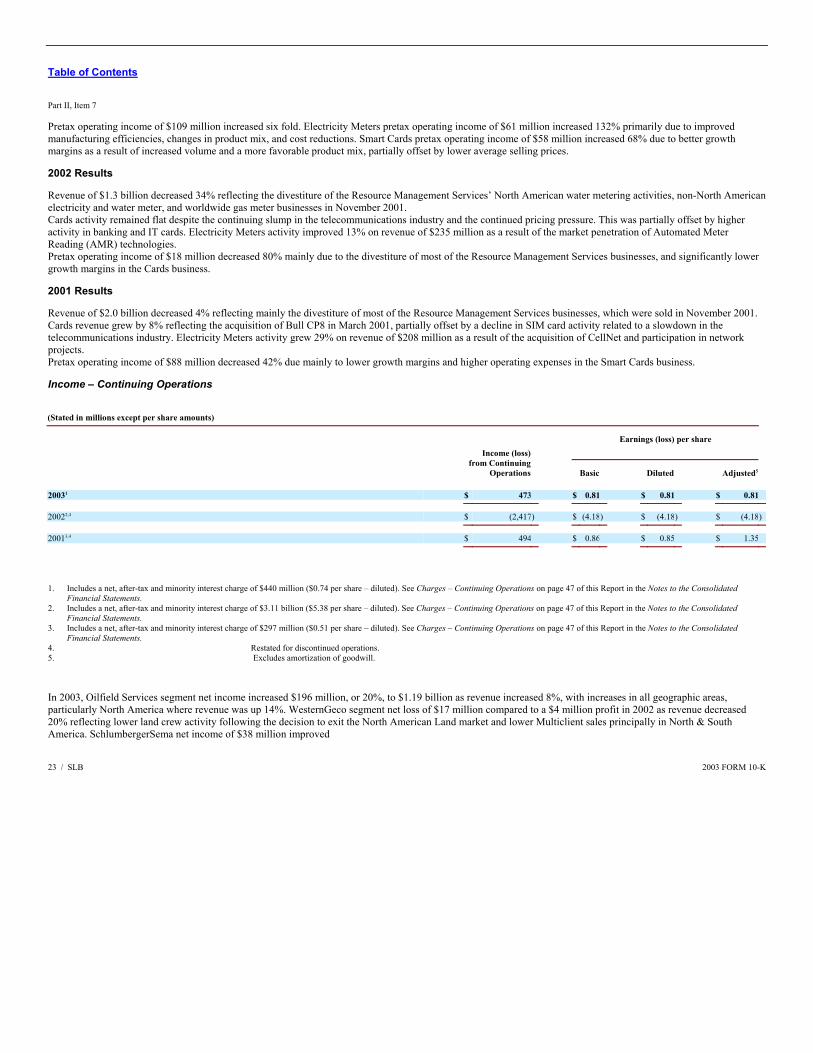
Table of Contents Part II, Item 7 Pretax operating income of $109 million increased six fold. Electricity Meters pretax operating income of $61 million increased 132% primarily due to improved manufacturing efficiencies, changes in product mix, and cost reductions. Smart Cards pretax operating income of $58 million increased 68% due to better growth margins as a result of increased volume and a more favorable product mix, partially offset by lower average selling prices. 2002 Results Revenue of $1.3 billion decreased 34% reflecting the divestiture of the Resource Management Services’ North American water metering activities, non-North American electricity and water meter, and worldwide gas meter businesses in November 2001. Cards activity remained flat despite the continuing slump in the telecommunications industry and the continued pricing pressure. This was partially offset by higher activity in banking and IT cards. Electricity Meters activity improved 13% on revenue of $235 million as a result of the market penetration of Automated Meter Reading (AMR) technologies. Pretax operating income of $18 million decreased 80% mainly due to the divestiture of most of the Resource Management Services businesses, and significantly lower growth margins in the Cards business. 2001 Results Revenue of $2.0 billion decreased 4% reflecting mainly the divestiture of most of the Resource Management Services businesses, which were sold in November 2001. Cards revenue grew by 8% reflecting the acquisition of Bull CP8 in March 2001, partially offset by a decline in SIM card activity related to a slowdown in the telecommunications industry. Electricity Meters activity grew 29% on revenue of $208 million as a result of the acquisition of CellNet and participation in network projects. Pretax operating income of $88 million decreased 42% due mainly to lower growth margins and higher operating expenses in the Smart Cards business. Income – Continuing Operations (Stated in millions except per share amounts)
Earnings (loss) per share
Income (loss)from Continuing
Operations Basic Diluted Adjusted5 20031 $ 473 $ 0.81 $ 0.81 $ 0.81
20022,4 $ (2,417) $ (4.18) $ (4.18) $ (4.18)
20013,4 $ 494 $ 0.86 $ 0.85 $ 1.35
1. Includes a net, after-tax and minority interest charge of $440 million ($0.74 per share – diluted). See Charges – Continuing Operations on page 47 of this Report in the Notes to the Consolidated
Financial Statements. 2. Includes a net, after-tax and minority interest charge of $3.11 billion ($5.38 per share – diluted). See Charges – Continuing Operations on page 47 of this Report in the Notes to the Consolidated
Financial Statements. 3. Includes a net, after-tax and minority interest charge of $297 million ($0.51 per share – diluted). See Charges – Continuing Operations on page 47 of this Report in the Notes to the Consolidated
Financial Statements. 4. Restated for discontinued operations. 5. Excludes amortization of goodwill.
In 2003, Oilfield Services segment net income increased $196 million, or 20%, to $1.19 billion as revenue increased 8%, with increases in all geographic areas, particularly North America where revenue was up 14%. WesternGeco segment net loss of $17 million compared to a $4 million profit in 2002 as revenue decreased 20% reflecting lower land crew activity following the decision to exit the North American Land market and lower Multiclient sales principally in North & South America. SchlumbergerSema net income of $38 million improved 23 / SLB 2003 FORM 10-K
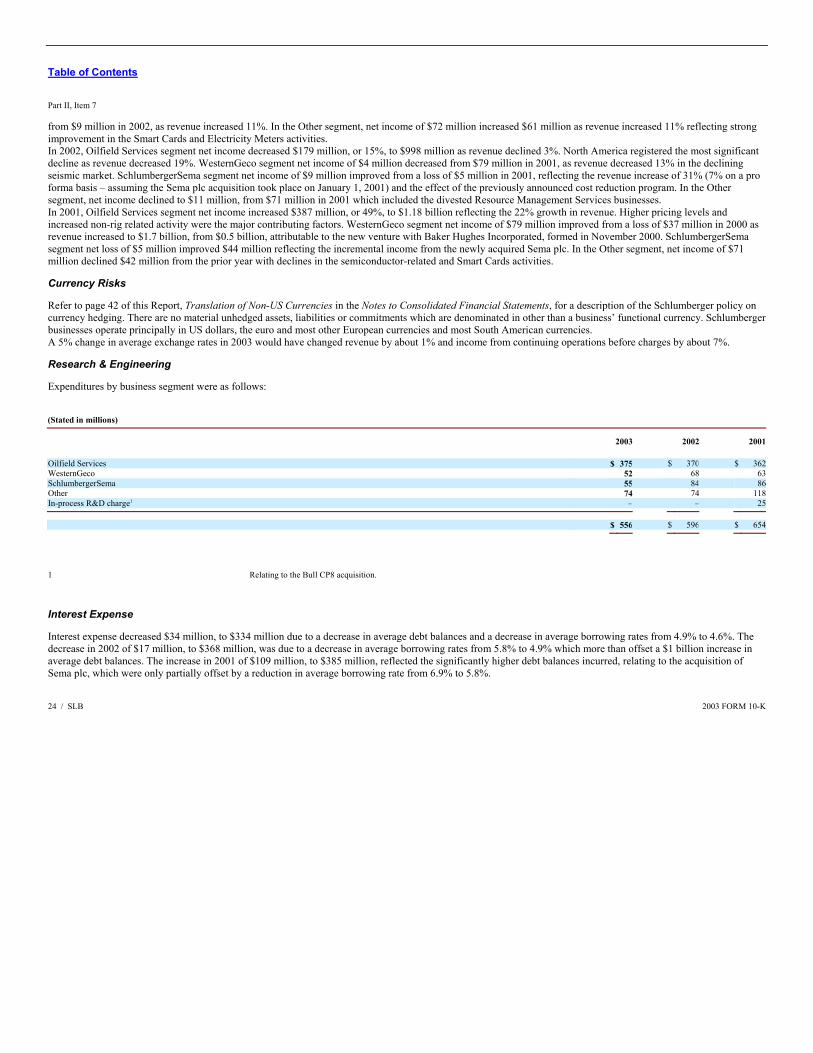
Table of Contents Part II, Item 7 from $9 million in 2002, as revenue increased 11%. In the Other segment, net income of $72 million increased $61 million as revenue increased 11% reflecting strong improvement in the Smart Cards and Electricity Meters activities. In 2002, Oilfield Services segment net income decreased $179 million, or 15%, to $998 million as revenue declined 3%. North America registered the most significant decline as revenue decreased 19%. WesternGeco segment net income of $4 million decreased from $79 million in 2001, as revenue decreased 13% in the declining seismic market. SchlumbergerSema segment net income of $9 million improved from a loss of $5 million in 2001, reflecting the revenue increase of 31% (7% on a pro forma basis – assuming the Sema plc acquisition took place on January 1, 2001) and the effect of the previously announced cost reduction program. In the Other segment, net income declined to $11 million, from $71 million in 2001 which included the divested Resource Management Services businesses. In 2001, Oilfield Services segment net income increased $387 million, or 49%, to $1.18 billion reflecting the 22% growth in revenue. Higher pricing levels and increased non-rig related activity were the major contributing factors. WesternGeco segment net income of $79 million improved from a loss of $37 million in 2000 as revenue increased to $1.7 billion, from $0.5 billion, attributable to the new venture with Baker Hughes Incorporated, formed in November 2000. SchlumbergerSema segment net loss of $5 million improved $44 million reflecting the incremental income from the newly acquired Sema plc. In the Other segment, net income of $71 million declined $42 million from the prior year with declines in the semiconductor-related and Smart Cards activities. Currency Risks Refer to page 42 of this Report, Translation of Non-US Currencies in the Notes to Consolidated Financial Statements, for a description of the Schlumberger policy on currency hedging. There are no material unhedged assets, liabilities or commitments which are denominated in other than a business’ functional currency. Schlumberger businesses operate principally in US dollars, the euro and most other European currencies and most South American currencies. A 5% change in average exchange rates in 2003 would have changed revenue by about 1% and income from continuing operations before charges by about 7%. Research & Engineering Expenditures by business segment were as follows: (Stated in millions)
2003 2002 2001 Oilfield Services $ 375 $ 370 $ 362WesternGeco 52 68 63SchlumbergerSema 55 84 86Other 74 74 118In-process R&D charge1 – – 25
$ 556 $ 596 $ 654
1 Relating to the Bull CP8 acquisition.
Interest Expense Interest expense decreased $34 million, to $334 million due to a decrease in average debt balances and a decrease in average borrowing rates from 4.9% to 4.6%. The decrease in 2002 of $17 million, to $368 million, was due to a decrease in average borrowing rates from 5.8% to 4.9% which more than offset a $1 billion increase in average debt balances. The increase in 2001 of $109 million, to $385 million, reflected the significantly higher debt balances incurred, relating to the acquisition of Sema plc, which were only partially offset by a reduction in average borrowing rate from 6.9% to 5.8%. 24 / SLB 2003 FORM 10-K
Table of Contents Part II, Item 7 Hanover Compressor Company In August 2001, Schlumberger sold its Oilfield Services worldwide gas compression activity to Hanover Compressor Company. The proceeds included 8.7 million shares of Hanover Compressor common stock, with a value at closing of $173 million, which is restricted from marketability until August 30, 2004, and a $150 million long-term subordinated note maturing December 15, 2005. In the fourth quarter of 2003, Schlumberger sold the subordinated note for $177 million and realized a pretax gain of $32 million ($20 million after-tax; $0.03 per share). At December 31, 2003, the carrying value of Schlumberger’s investment in Hanover Compressor common stock exceeded the market value. As required by generally accepted accounting principles (SFAS 115), Schlumberger wrote down its investment to the fair market value of $91.4 million at December 31, 2003 and recorded a charge of $81.2 million (before and after-tax; $0.13 per share). As part of the sale agreement, Hanover Compressor had an option to put its interest in the PIGAP II joint venture in Venezuela back to Schlumberger if certain financing conditions were not met. Hanover Compressor did not exercise this option. Charges – Continuing Operations Schlumberger recorded the following after-tax and minority interest charges/credits for continuing operations in 2003, 2002 and 2001: • In December 2003, a gain of $20 million on the sale of the Hanover Compressor note.
• In December 2003, a charge of $81 million relating to the write-down, to fair market value, of Schlumberger’s investment in Hanover Compressor common stock. The write-down was required by SFAS 115 as the decline in the market value of the stock is “other than temporary”.
• In September 2003, a $205 million multiclient library impairment charge following an evaluation of current and expected future business conditions in the seismic sector, a $38 million seismic vessel impairment charge and a $31 million gain on the sale of a drilling rig.
• Between June 12 and July 22, 2003, subsidiaries of Schlumberger launched and concluded tender offers to acquire three series of outstanding European bonds; $1.3 billion of principal was repurchased for a total cost of $1.5 billion, which included the premium, and issuing and tender costs. The total charge on the tenders was $168 million, of which $81.5 million was recorded in the second quarter of 2003, when the first tender closed, with the balance of $86.3 million recorded in the third quarter of 2003.
• On December 10, 2002, Schlumberger announced that the Board of Directors had approved an updated strategy for its SchlumbergerSema business segment. The new strategic plan outlook, current business values and the reorganization of SchlumbergerSema constitute significant events that required an impairment analysis to be performed in accordance with SFAS 142. SchlumbergerSema was ‘valued’ on a stand-alone basis; each reporting unit within SchlumbergerSema was valued using a discounted cash flow analysis based on a long-term forecast prepared by SchlumbergerSema management with the assistance of a third party valuation expert. The implied multiples yielded by the discounted cash flow analysis were compared to observed trading multiples of comparable companies and recent transactions in the IT services industry to assess the fair value of the reporting units. The fair value was below the book value. As a result, goodwill was written down to its estimated fair value based on Schlumberger’s valuation. The impairment of goodwill mainly reflected the prevailing difficulties of the telecommunications industry and the severely depressed market values of the IT companies serving SchlumbergerSema’s sector. Certain intangible assets were also identified and written down as part of this process.
25 / SLB 2003 FORM 10-K
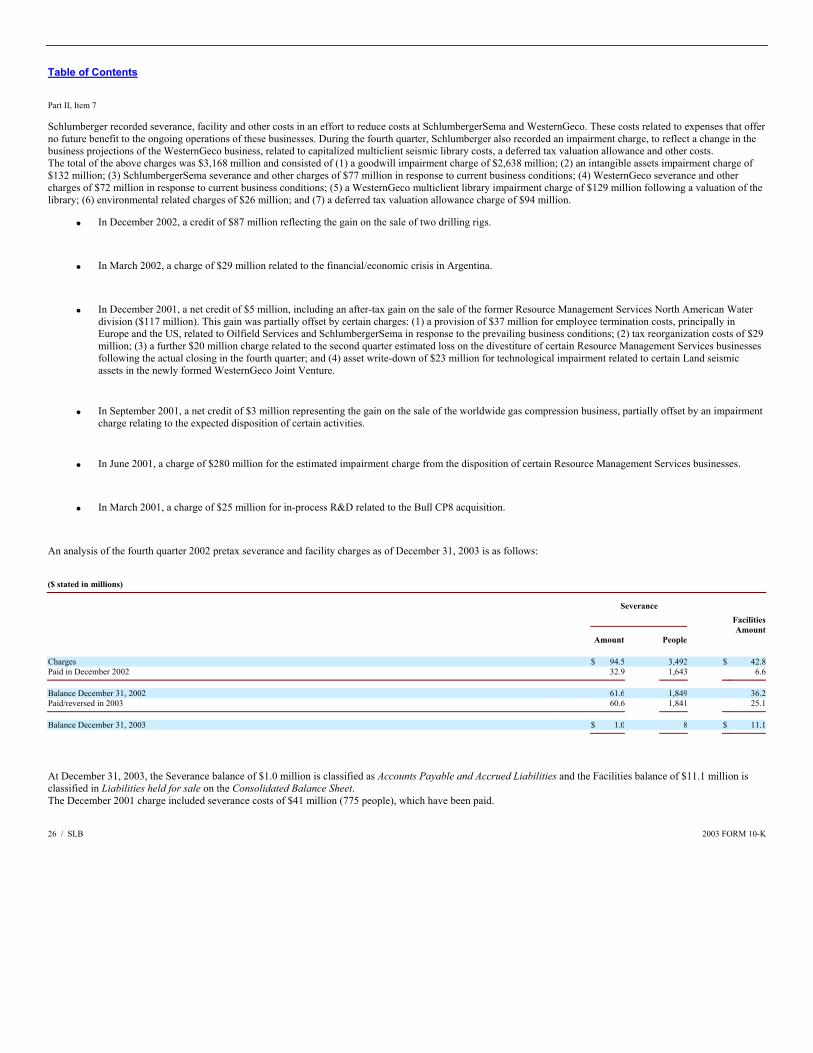
Table of Contents Part II, Item 7 Schlumberger recorded severance, facility and other costs in an effort to reduce costs at SchlumbergerSema and WesternGeco. These costs related to expenses that offer no future benefit to the ongoing operations of these businesses. During the fourth quarter, Schlumberger also recorded an impairment charge, to reflect a change in the business projections of the WesternGeco business, related to capitalized multiclient seismic library costs, a deferred tax valuation allowance and other costs. The total of the above charges was $3,168 million and consisted of (1) a goodwill impairment charge of $2,638 million; (2) an intangible assets impairment charge of $132 million; (3) SchlumbergerSema severance and other charges of $77 million in response to current business conditions; (4) WesternGeco severance and other charges of $72 million in response to current business conditions; (5) a WesternGeco multiclient library impairment charge of $129 million following a valuation of the library; (6) environmental related charges of $26 million; and (7) a deferred tax valuation allowance charge of $94 million. • In December 2002, a credit of $87 million reflecting the gain on the sale of two drilling rigs.
• In March 2002, a charge of $29 million related to the financial/economic crisis in Argentina.
• In December 2001, a net credit of $5 million, including an after-tax gain on the sale of the former Resource Management Services North American Water division ($117 million). This gain was partially offset by certain charges: (1) a provision of $37 million for employee termination costs, principally in Europe and the US, related to Oilfield Services and SchlumbergerSema in response to the prevailing business conditions; (2) tax reorganization costs of $29 million; (3) a further $20 million charge related to the second quarter estimated loss on the divestiture of certain Resource Management Services businesses following the actual closing in the fourth quarter; and (4) asset write-down of $23 million for technological impairment related to certain Land seismic assets in the newly formed WesternGeco Joint Venture.
• In September 2001, a net credit of $3 million representing the gain on the sale of the worldwide gas compression business, partially offset by an impairment charge relating to the expected disposition of certain activities.
• In June 2001, a charge of $280 million for the estimated impairment charge from the disposition of certain Resource Management Services businesses.
• In March 2001, a charge of $25 million for in-process R&D related to the Bull CP8 acquisition.
An analysis of the fourth quarter 2002 pretax severance and facility charges as of December 31, 2003 is as follows: ($ stated in millions)
Severance
FacilitiesAmount
Amount People Charges $ 94.5 3,492 $ 42.8Paid in December 2002 32.9 1,643 6.6
Balance December 31, 2002 61.6 1,849 36.2Paid/reversed in 2003 60.6 1,841 25.1
Balance December 31, 2003 $ 1.0 8 $ 11.1
At December 31, 2003, the Severance balance of $1.0 million is classified as Accounts Payable and Accrued Liabilities and the Facilities balance of $11.1 million is classified in Liabilities held for sale on the Consolidated Balance Sheet. The December 2001 charge included severance costs of $41 million (775 people), which have been paid. 26 / SLB 2003 FORM 10-K
Table of Contents Part II, Item 7 Critical Accounting Policies and Estimates Schlumberger’s discussion and analysis of its financial condition and results of operations are based upon Schlumberger’s consolidated financial statements, which have been prepared in accordance with accounting principles generally accepted in the United States. The preparation of these financial statements requires Schlumberger to make estimates and judgments that affect the reported amounts of assets, liabilities, revenues and expenses, and related disclosure of contingent assets and liabilities. On an on-going basis, Schlumberger evaluates its estimates, including those related to bad debts, valuation of inventories and investments, recoverability of long-lived assets, income tax provision and deferred taxes, profit assumptions on long-term percentage-of-completion contracts, contingencies and litigation and actuarial assumptions for employee benefit plans. Schlumberger bases its estimates on historical experience and on various other assumptions that are believed to be reasonable under the circumstances, the results of which form the basis for making judgments about the carrying values of assets and liabilities that are not readily apparent from other sources. Actual results may differ from these estimates under different assumptions or conditions. Schlumberger believes the critical accounting policies described below affect its more significant judgments and estimates used in the preparation of its consolidated financial statements. Schlumberger recognizes revenue and profit as work progresses on long-term, fixed price contracts using the percentage-of-completion method, which relies on estimates of total expected contract revenue and costs. Schlumberger follows this method since reasonably dependable estimates of the revenue and costs applicable to various stages of a contract can be made. Recognized revenue and profit are subject to revisions as the contract progresses to completion. Revisions in profit estimates are charged or credited to income in the period in which the facts that give rise to the revision become known as a change in estimate. Losses on long-term contracts are provided for when such losses are known and reasonably estimated. Schlumberger recognizes revenue from the sale of software licenses when persuasive evidence of an arrangement exists, the product has been delivered, the fee is fixed and determinable and collection of the resulting receivable is reasonably assured. Whether the fee is fixed and determinable is assessed based on the payment terms associated with the transaction. Collection is assessed based on a number of factors, including past transaction history with the customer and the credit-worthiness of the customer. Revenues from contracts with multiple element arrangements, such as those including installation and integration services, are recognized as each element is earned based on the relative fair value of each element and when the delivered elements have stand alone value to the customers. For sales, either a binding purchase order, signed license agreement or a written contract is used as evidence of an arrangement. Revenue from maintenance services is recognized ratably over the contract term. The training and consulting services (time and materials) are billed based on hourly rates, and revenue is generally recognized as these services are performed. Revenue from outsourcing services is generally recognized as services are performed. The WesternGeco segment capitalizes the cost associated with obtaining multiclient seismic data. Such costs are charged to Cost of goods sold and services based on a percentage of estimated total revenue that Schlumberger estimates that it will receive from the sales of such data. The carrying value of individual surveys is reviewed at least annually and adjustments to the value are made based upon the revised estimated revenues for the surveys. Schlumberger maintains allowances for doubtful accounts for estimated losses resulting from the inability of its customers to make required payments. If the financial condition of Schlumberger’s customers were to deteriorate, resulting in an impairment of their ability to make payments, additional allowances may be required. 27 / SLB 2003 FORM 10-K
Table of Contents Part II, Item 7 Schlumberger writes down its inventory for estimated obsolescence or unmarketable inventory equal to the difference between the cost of inventory and the estimated market value based upon assumptions about future demand and market conditions. If actual market conditions are less favorable than those projected by management, additional inventory writedowns may be required. Schlumberger assesses the impairment of identifiable intangibles, long-lived assets and related goodwill at least annually, or whenever events or changes in circumstances indicate that the carrying value may not be recoverable. Factors considered important, which could trigger an impairment review, include the following: • significant underperformance relative to expected historical or projected future operating results;
• significant changes in the manner of our use of the acquired assets or the strategy for our overall business;
• significant negative industry or economic trends;
• significant decline in Schlumberger’s stock price and our market capitalization relative to net book value, for a sustained period.
When Schlumberger determines that the carrying value of intangibles, long-lived assets and related goodwill may not be recoverable based upon the existence of one or more of the above indicators of impairment, any impairment is measured based on projected net cash flows expected to result from that asset, including eventual disposition. Schlumberger had net deferred tax assets of $632 million at December 31, 2003 which excluded $325 million relating to a certain European net operating loss for which there is a valuation allowance. In assessing the need for valuation allowances, Schlumberger considers the probable likelihood of future taxable income and available tax planning strategies. With regard to pension and postretirement benefits, Schlumberger evaluates the appropriateness of assumptions used by an independent actuary, in particular assumptions as to discount rate, return on plan assets and medical cost trend rates. The assumptions are revised at least annually as circumstances require. Cash Flow In 2003, cash provided by operations was $2.11 billion as net income plus depreciation/amortization and net charges including the extinguishment of European debt and multiclient and vessel impairments, were only partially offset by increases in customer receivables, due to higher revenue, and decrease in accounts payable and accrued liabilities. Cash used in investing activities was $1.49 billion and included investments in fixed assets ($1.03 billion) and multiclient seismic data ($150 million), the purchase of short-term investments ($1.15 billion), the net proceeds ($106 million) from the sale of Schlumberger’s investment of 9.7 million shares in Grant Prideco Inc., the proceeds from the sales of NPTest ($220 million) and e-City ($79 million) activities and the net proceeds ($177 million) from the sale of the Hanover Compressor note. Cash used by financing activities was $558 million with the proceeds from employee stock plans ($172 million) offset by the payment of dividends to shareholders ($437 million), the costs related to the extinguishment of certain European debt ($168 million) and an overall reduction in debt of $126 million. 28 / SLB 2003 FORM 10-K
Table of Contents Part II, Item 7 “Net Debt” is gross debt less cash, short-term investments and fixed income investments held to maturity. Management believes that Net Debt provides useful information regarding the level of Schlumberger’s indebtedness by reflecting cash and investments that could be used to repay debt, and that the level of net debt provides useful information as to the results of Schlumberger’s deleveraging efforts. Details of the Net Debt follows: (Stated in millions)
2003 2002 2001 Net Debt, beginning of year $ (5,021) $ (5,037) $ 422 Income/(loss) from continuing operations 473 (2,417) 494 Gain on sale of drilling rigs – (87) – Net charges 440 3,197 272 Depreciation & amortization1 1,571 1,533 1,876 (Increase) decrease in working capital (228) 165 (839) Proceeds from business divestitures 299 354 896 Fixed asset additions1 (1,175) (1,702) (2,453) Dividends paid (437) (433) (430) Proceeds from employee stock plans 172 175 122 Debt extinguishment costs (168) – – Sale of Grant Prideco stock 106 – – Sale of Hanover Compressor note 177 – – Acquisition of Sema plc – (132) (4,853) Other business acquisitions – (44) (453) Acquisition related payments – (70) – Translation effect on net debt (461) (507) (6) Other 76 (16) (85)
Net Debt, end of year $ (4,176) $ (5,021) $ (5,037)
1. Includes Multiclient seismic data costs.
Dec. 31
2003 Dec. 31
2002 Dec. 31
2001 Components of Net Debt Cash and short term investments $ 3,109 $ 1,736 $ 1,618 Fixed income investments, held to maturity 223 408 576 Bank loans and current portion of long-term debt (1,411) (1,136) (1,015)Long-term debt (6,097) (6,029) (6,216)
$ (4,176) $ (5,021) $ (5,037)
At December 31, 2003, the cash and short-term investments of $3.1 billion and the remaining facilities of $2.6 billion are sufficient to meet future business requirements. Based on forecast 2004 net income, depreciation/amortization estimates, cash from the sale of SchlumbergerSema ($550 million) and Atos Origin stock ($625 million) and other possible business and asset divestitures, and other cash flow components, Schlumberger expects to improve cash flow with an objective of reducing the net debt to $3 billion by mid-year and $2 billion by year-end 2004. This will largely be dependent upon the business segments operating results and the successful completion of certain business divestitures. In addition, Schlumberger is currently reviewing the feasibility and cost of a buyback of all, or a portion of, the remaining European long-term debt and the continued appropriateness of maintaining the effectiveness of its US interest rate derivative. A buyback of the debt and the interest rate derivative becoming ineffective would result in a charge to income from continuing operations in 2004. 29 / SLB 2003 FORM 10-K
Table of Contents Part II, Item 7 Financing On June 9, 2003, Schlumberger Limited issued $850 million aggregate principal amount of 1.5% Series A Convertible Debentures due June 1, 2023 and $450 million aggregate principal amount of 2.125% Series B Convertible Debentures due June 1, 2023. On July 2, 2003, Schlumberger Limited issued an additional $125 million aggregate principal amount of the Series A debentures pursuant to an option granted to the initial purchasers. The debentures were sold to Citigroup Global Markets Inc. and Goldman, Sachs & Co. pursuant to an exemption from registration under Section 4(2) of the Securities Act of 1933. The debentures were resold, with registration rights, by the initial purchasers in transactions exempt from registration under Rule 144A of the Securities Act. The aggregate offering price of the debentures was $1.425 billion, the initial purchasers’ discount was $25.4 million and the net proceeds to Schlumberger Limited were $1.4 billion. The Series A debentures and the Series B debentures are convertible, at the holders’ option, into shares of common stock of Schlumberger Limited. Holders of the Series A debentures may convert their debentures into common stock at a conversion rate of 13.8255 shares for each $1,000 principal amount of Series A debentures (equivalent to an initial conversion price of $72.33 per share). Holders of the Series B debentures may convert their debentures into common stock at a conversion rate of 12.5 shares for each $1,000 principal amount of Series B debentures (equivalent to an initial conversion price of $80.00 per share). Each conversion rate may be adjusted for certain events, but it will not be adjusted for accrued interest. On or after June 6, 2008 (in the case of the Series A debentures) or June 6, 2010 (in the case of the Series B debentures), Schlumberger may redeem for cash all or part of the applicable series of debentures, upon notice to the holders, at the redemption prices of 100% of the principal amount of the debentures, plus accrued and unpaid interest to the date of redemption. On June 1, 2008, June 1, 2013, and June 1, 2018, holders of Series A debentures may require Schlumberger to repurchase their Series A debentures. On June 1, 2010, June 1, 2013 and June 1, 2018, holders of Series B debentures may require Schlumberger to repurchase their Series B debentures. The repurchase price will be 100% of the principal amount of the debentures plus accrued and unpaid interest to the repurchase date. The repurchase price for repurchases on June 1, 2008 (in the case of the Series A debentures) and June 1, 2010 (in the case of the Series B debentures) will be paid in cash. On the other repurchase dates, Schlumberger may choose to pay the repurchase price in cash or common stock or any combination of cash and common stock. In addition, upon the occurrence of a Fundamental Change, holders may require Schlumberger to repurchase all or a portion of their debentures, in cash or, at Schlumberger’s election, common stock valued at 99% of its market price or any combination of cash and common stock, at a repurchase price equal to 100% of the principal amount of the debentures plus accrued and unpaid interest to the redemption date. The debentures will mature on June 1, 2023 unless earlier redeemed or repurchased. Between June 12 and July 22, 2003, certain subsidiaries of Schlumberger launched and concluded tender offers to acquire three series of their outstanding European bonds. The companies bought back $1.3 billion of principal of these bonds for a total cost of $1.5 billion, which includes the premium, and issuing and tender costs. The total charge on the tender was $168 million. Sale of SchlumbergerSema to Atos Origin On September 22, 2003, Schlumberger announced the signing of an agreement with Atos Origin for the sale of the SchlumbergerSema business. On the January 29, 2004 the sale transaction was completed. As consideration for the transaction Schlumberger received €443 million ($550 million) in cash which included a working capital adjustment, and 19.3 million shares of common stock of Atos Origin with a value of €1.02 billion ($1.275 billion), which represented approximately 29% of the outstanding common shares of Atos Origin after the transaction was completed. Schlumberger expects the result of the sale will be a gain. 30 / SLB 2003 FORM 10-K
Table of Contents Part II, Item 7 On February 2, 2004 Schlumberger sold 9.6 million of the Atos Origin shares for a net consideration of €500 million ($625 million). As a result of this sale, Schlumberger’s investment was reduced to approximately 15% of the outstanding common shares of Atos Origin. Schlumberger will account for the remaining investment in Atos Origin on the cost method. Business Divestitures During 2003, Schlumberger divested the following businesses:
• In July, the NPTest semiconductor testing business to a partnership led by Francisco Partners and Shah Management. The proceeds were $220 million in cash. Additionally, the partnership has a contingent obligation to make a further payment to Schlumberger upon a subsequent qualifying disposition or an initial public offering of NPTest by the partnership, under certain circumstances. The results of NPTest are reported as Discontinued Operations in the Consolidated Statement of Income and include a net loss of $12 million on the sale. The net assets were $202 million.
• In August, the Verification Systems business by a proceed-free management buyout. The results of Verification Systems are reported as Discontinued Operations in the Consolidated Statement of Income and include a net loss of $18 million on the sale. The net assets were $17 million.
• In October, the e-City ‘pay & display’ parking solutions business to Apax Partners. The proceeds were $84 million in cash. The results of e-City are
reported as Discontinued Operations in the Consolidated Statement of Income and include a net loss of $56 million on the sale. The net assets were $120 million, including a $65 million allocation of goodwill.
During 2002, Schlumberger divested the following businesses:
• In December, the Reed Hycalog drillbits business. The proceeds included $259 million in cash and 9.7 million shares of Grant Prideco common stock with a
value of $103 million. The after-tax gain was $66 million. The results of Reed Hycalog are reported as Discontinued Operations in the Consolidated Statement of Income.
During 2001, Schlumberger divested the following businesses:
• In August, the Oilfield Services worldwide gas compression activity primarily consisting of the Production Operators Corp. subsidiary. The proceeds
included $274 million in cash, a $150 million long-term subordinated note and newly issued Hanover Compressor Company shares with a value of $173 million. The shares have a three year marketability restriction. The after-tax gain was $52 million.
• In November, the Resource Management Services North American water metering activities. Cash proceeds were $304 million and the after-tax gain was $117 million.
• In November, the Resource Management Services non-North American electricity and water meter, and worldwide gas meter businesses. The net cash
proceeds were $256 million and the after-tax loss was $300 million, of which $280 million had been recorded as an impairment charge in June (See Charges-Continuing Operations).
• In November, the Yield Enhancement Systems division of Semiconductor Solutions. Cash proceeds were $62 million and the after-tax gain was $12 million.
31 / SLB 2003 FORM 10-K
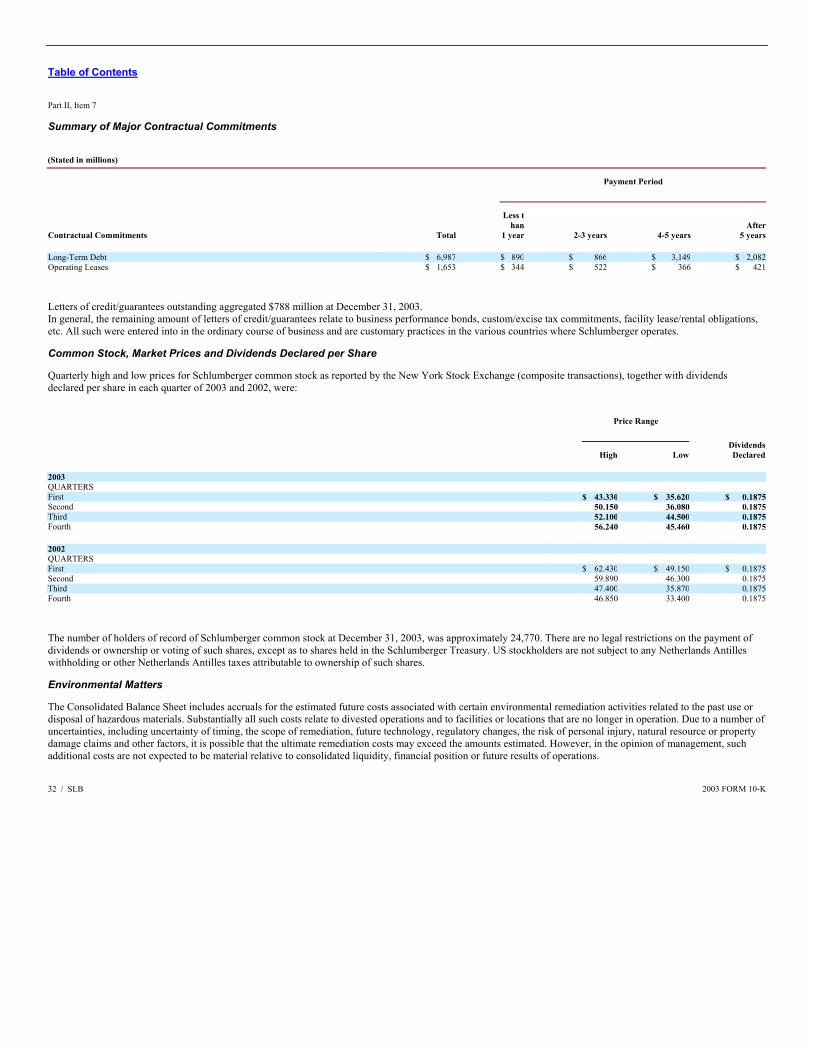
Table of Contents Part II, Item 7 Summary of Major Contractual Commitments (Stated in millions)
Payment Period
Contractual Commitments Total
Less than
1 year 2-3 years 4-5 years After
5 years Long-Term Debt $ 6,987 $ 890 $ 866 $ 3,149 $ 2,082Operating Leases $ 1,653 $ 344 $ 522 $ 366 $ 421
Letters of credit/guarantees outstanding aggregated $788 million at December 31, 2003. In general, the remaining amount of letters of credit/guarantees relate to business performance bonds, custom/excise tax commitments, facility lease/rental obligations, etc. All such were entered into in the ordinary course of business and are customary practices in the various countries where Schlumberger operates. Common Stock, Market Prices and Dividends Declared per Share Quarterly high and low prices for Schlumberger common stock as reported by the New York Stock Exchange (composite transactions), together with dividends declared per share in each quarter of 2003 and 2002, were:
Price Range
High Low DividendsDeclared
2003 QUARTERS First $ 43.330 $ 35.620 $ 0.1875Second 50.150 36.080 0.1875Third 52.100 44.500 0.1875Fourth 56.240 45.460 0.1875 2002 QUARTERS First $ 62.430 $ 49.150 $ 0.1875Second 59.890 46.300 0.1875Third 47.400 35.870 0.1875Fourth 46.850 33.400 0.1875
The number of holders of record of Schlumberger common stock at December 31, 2003, was approximately 24,770. There are no legal restrictions on the payment of dividends or ownership or voting of such shares, except as to shares held in the Schlumberger Treasury. US stockholders are not subject to any Netherlands Antilles withholding or other Netherlands Antilles taxes attributable to ownership of such shares. Environmental Matters The Consolidated Balance Sheet includes accruals for the estimated future costs associated with certain environmental remediation activities related to the past use or disposal of hazardous materials. Substantially all such costs relate to divested operations and to facilities or locations that are no longer in operation. Due to a number of uncertainties, including uncertainty of timing, the scope of remediation, future technology, regulatory changes, the risk of personal injury, natural resource or property damage claims and other factors, it is possible that the ultimate remediation costs may exceed the amounts estimated. However, in the opinion of management, such additional costs are not expected to be material relative to consolidated liquidity, financial position or future results of operations. 32 / SLB 2003 FORM 10-K
Table of Contents Part II, Item 7 New Accounting Standards In July 2002, the Financial Accounting Standards Board issued SFAS 146 (Accounting for Costs Associated with Exit or Disposal Activities). The standard required companies to recognize costs associated with exit or disposal activities when they are incurred rather than at the date of a commitment to an exit or disposal plan. Examples of costs covered by the standard include lease termination costs and certain employee severance costs that are associated with a restructuring, discontinued operation, plant closing, or other exit or disposal activity. Previous accounting guidance was provided by EITF Issue No. 94-3, (Liability Recognition for Certain Employee Termination Benefits and Other Costs to Exit an Activity [including Certain Costs Incurred in a Restructuring]). SFAS 146 replaced Issue 94-3. Schlumberger adopted SFAS 146 prospectively to exit or disposal activities initiated after December 31, 2002. In November 2002, FASB Interpretation No. 45 (Guarantor’s Accounting and Disclosure Requirements for Guarantees, Including Indirect Guarantees of Indebtedness of Others) was issued. It requires certain accounting and disclosures of guarantees to third parties including indebtedness. The interpretation is effective on a prospective basis for guarantees issued or modified after December 31, 2002. The implementation of this interpretation did not have a material effect on Schlumberger’s financial position or results of operations. In January 2003, the Emerging Issues Task Force (EITF) issued No. 00-21 (Accounting for Revenue Arrangements with Multiple Deliverables). This EITF establishes the criteria for recognizing revenue in arrangements when several deliverables are bundled into one agreement. EITF 00-21 does not allow revenue recognition unless the fair value of the undelivered element(s) is available and the element has stand-alone value to the customer. EITF 00-21 also provides guidance on allocating the total contract revenue to the individual elements based upon the available fair value of each deliverable. The implementation of this pronouncement did not have a material impact on Schlumberger’s financial position or results of operations. In January 2003, the Financial Accounting Standards Board issued FASB Interpretation No. 46, (Consolidation of Variable Interest Entities, an Interpretation of ARB No. 51). The primary objective of the interpretation is to provide guidance on the identification of, and financial reporting for entities over which control is achieved through means other than voting rights; such entities are known as variable-interest entities (VIE’s). FIN 46 provides guidance that determines (1) whether consolidation is required under the “controlling financial interest” model of Accounting Research Bulletin No. 51 (ARB 51), Consolidated Financial Statements, or other existing authoritative guidance, or, alternative, (2) whether the variable-interest model under FIN 46 should be used to account for existing and new entities. Schlumberger does not believe that the adoption of this statement will have a material effect on the financial position or results of operations. In April 2003, the Financial Accounting Standards Board issued SFAS No. 149 (Amendment of Statement 133 on Derivative Instruments and Hedging Activities) which amends and clarifies financial accounting and reporting for derivative instruments, including certain derivative instruments embedded in other contracts and for hedging activities under SFAS No. 133 (Accounting for Derivative Instruments and Hedging Activities). SFAS 149, which is to be applied prospectively, is effective for contracts entered into or modified after June 30, 2003, and for hedging relationships designated after June 30, 2003. The adoption of this new standard did not have a material impact on Schlumberger’s results of operations or financial position. In May 2003, the Financial Accounting Standards Board issued SFAS No. 150, (Accounting for Certain Financial Instruments with Characteristics of Both Liabilities and Equity). The Standard specifies that instruments within its scope embody obligations of the issues and therefore, the issuer must classify them as liabilities. The Standard was effective July 1, 2003, and had no material effect on Schlumberger’s financial position. In January 2004, the Financial Accounting Standards Board issued FSP No. FAS 106-1 (Accounting and Disclosure Requirements Related to the Medicare Prescription Drug Improvement and Modernization Act of 33 / SLB 2003 FORM 10-K
Table of Contents Part II, Item 7, 7A 2003). The statement permits the deferral of accounting related to the effects of the legislation until the earlier of issuance of final accounting guidance by the FASB or a significant plan amendment/curtailment event requiring remeasurement, occurring after January 31, 2004. Schlumberger expects the new legislation will reduce future postretirement medical costs. Forward-looking Statements This 10-K report, the fourth quarter and full year 2003 earnings release, associated web-based publications and other statements we make contain forward looking statements, which include any statements that are not historical facts, such as our expectations regarding business outlook, economic recovery, expected capex and depreciation and amortization charges, the capitalizing of multiclient survey costs and the acquisition of new multiclient surveys, the funding of pension plans and related pension expense, the likelihood and timing of and the benefits to be derived from divestitures, conditions in the oilfield service business, including activity levels during 2004 and higher E&P investment, production increases in non-OPEC areas, issues affecting the seismic industry, including sales pertaining to Q technology, continued deepwater drilling activity, benefits from contract awards, future results of operations, pricing, future effective tax rates and our expectations regarding the sale of our remaining investment in Atos Origin shares. These statements involve risks and uncertainties, including, but not limited to, the extent and timing of a rebound in the global economy; changes in exploration and production spending by major oil companies; recovery of activity levels, improved pricing and realization of cost reduction and cost savings targets associated with the seismic business; market acceptance of Q seismic technology; general economic and business conditions in key regions of the world, including Argentina; political and economic uncertainty in Venezuela and Nigeria and further socio-political unrest in the Persian Gulf and/or Asia; the market in Atos Origin shares; our ability to complete and benefits to be derived from other divestitures; our ability to achieve growth objectives in IT solutions to upstream E&P business; continued growth in the demand for smart cards and related products; our ability to meet our identified liquidity projections, including the generation of sufficient cash flow from oilfield operating results and the successful completion of certain business divestitures; potential contributions to pension plans; and other factors detailed in our fourth quarter and full year 2003 earnings release, this Report and other filings with the Securities and Exchange Commission. If one or more of these risks or uncertainties materialize (or the consequences of such a development changes), or should underlying assumptions prove incorrect, actual outcomes may vary materially from those forecasted or expected. Schlumberger disclaims any intention or obligation to update publicly or revise such statements, whether as a result of new information, future events or otherwise. Item 7A Quantitative and Qualitative Disclosures About Market Risk Schlumberger does not believe it has a material exposure to interest rate and currency market risks. Schlumberger manages the exposure to interest rate changes by using a mix of debt maturities and variable- and fixed-rate debt together with interest rate swaps, where appropriate, to fix or lower borrowing costs. With regard to foreign currency fluctuations, Schlumberger enters into various contracts, which change in value as foreign exchange rates change, to protect the value of external and intercompany transactions in foreign currencies. Schlumberger does not enter into foreign currency or interest rate transactions for speculative purposes. With respect to equity market risks, Schlumberger’s investment portfolio includes equity investments in publicly held companies that are classified as available-for-sale, or restricted from sale, and other strategic equity holdings in privately held companies. These securities are exposed to price fluctuations. As of December 31, 2003, the carrying value of the available-for-sale and restricted equity securities was $92 million (December 31, 2002: $283 million). The process of determining the fair values of the privately held equity investments inherently requires certain assumptions and subjective judgments. These valuation assumptions and judgments include 34 / SLB 2003 FORM 10-K
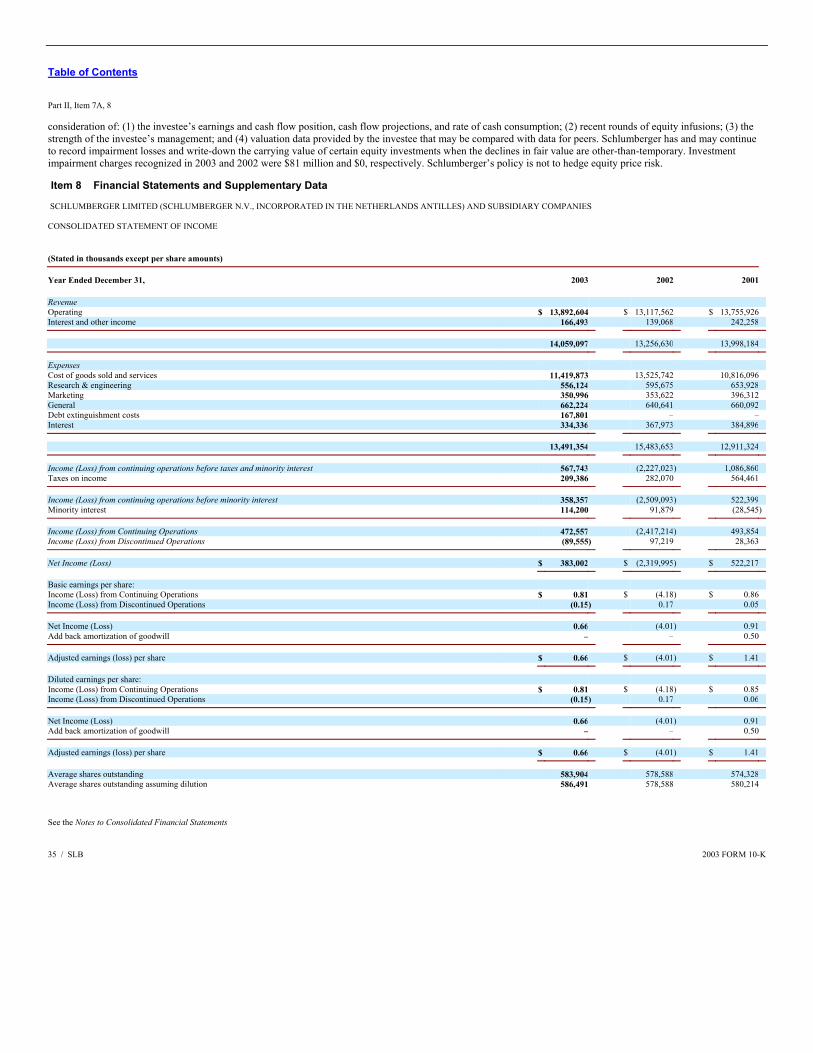
Table of Contents Part II, Item 7A, 8 consideration of: (1) the investee’s earnings and cash flow position, cash flow projections, and rate of cash consumption; (2) recent rounds of equity infusions; (3) the strength of the investee’s management; and (4) valuation data provided by the investee that may be compared with data for peers. Schlumberger has and may continue to record impairment losses and write-down the carrying value of certain equity investments when the declines in fair value are other-than-temporary. Investment impairment charges recognized in 2003 and 2002 were $81 million and $0, respectively. Schlumberger’s policy is not to hedge equity price risk. Item 8 Financial Statements and Supplementary Data SCHLUMBERGER LIMITED (SCHLUMBERGER N.V., INCORPORATED IN THE NETHERLANDS ANTILLES) AND SUBSIDIARY COMPANIES CONSOLIDATED STATEMENT OF INCOME (Stated in thousands except per share amounts)
Year Ended December 31, 2003 2002 2001 Revenue Operating $ 13,892,604 $ 13,117,562 $ 13,755,926 Interest and other income 166,493 139,068 242,258
14,059,097 13,256,630 13,998,184
Expenses Cost of goods sold and services 11,419,873 13,525,742 10,816,096 Research & engineering 556,124 595,675 653,928 Marketing 350,996 353,622 396,312 General 662,224 640,641 660,092 Debt extinguishment costs 167,801 – – Interest 334,336 367,973 384,896
13,491,354 15,483,653 12,911,324
Income (Loss) from continuing operations before taxes and minority interest 567,743 (2,227,023) 1,086,860 Taxes on income 209,386 282,070 564,461
Income (Loss) from continuing operations before minority interest 358,357 (2,509,093) 522,399 Minority interest 114,200 91,879 (28,545)
Income (Loss) from Continuing Operations 472,557 (2,417,214) 493,854 Income (Loss) from Discontinued Operations (89,555) 97,219 28,363
Net Income (Loss) $ 383,002 $ (2,319,995) $ 522,217
Basic earnings per share: Income (Loss) from Continuing Operations $ 0.81 $ (4.18) $ 0.86 Income (Loss) from Discontinued Operations (0.15) 0.17 0.05
Net Income (Loss) 0.66 (4.01) 0.91 Add back amortization of goodwill – – 0.50
Adjusted earnings (loss) per share $ 0.66 $ (4.01) $ 1.41
Diluted earnings per share: Income (Loss) from Continuing Operations $ 0.81 $ (4.18) $ 0.85 Income (Loss) from Discontinued Operations (0.15) 0.17 0.06
Net Income (Loss) 0.66 (4.01) 0.91 Add back amortization of goodwill – – 0.50
Adjusted earnings (loss) per share $ 0.66 $ (4.01) $ 1.41
Average shares outstanding 583,904 578,588 574,328 Average shares outstanding assuming dilution 586,491 578,588 580,214
See the Notes to Consolidated Financial Statements 35 / SLB 2003 FORM 10-K
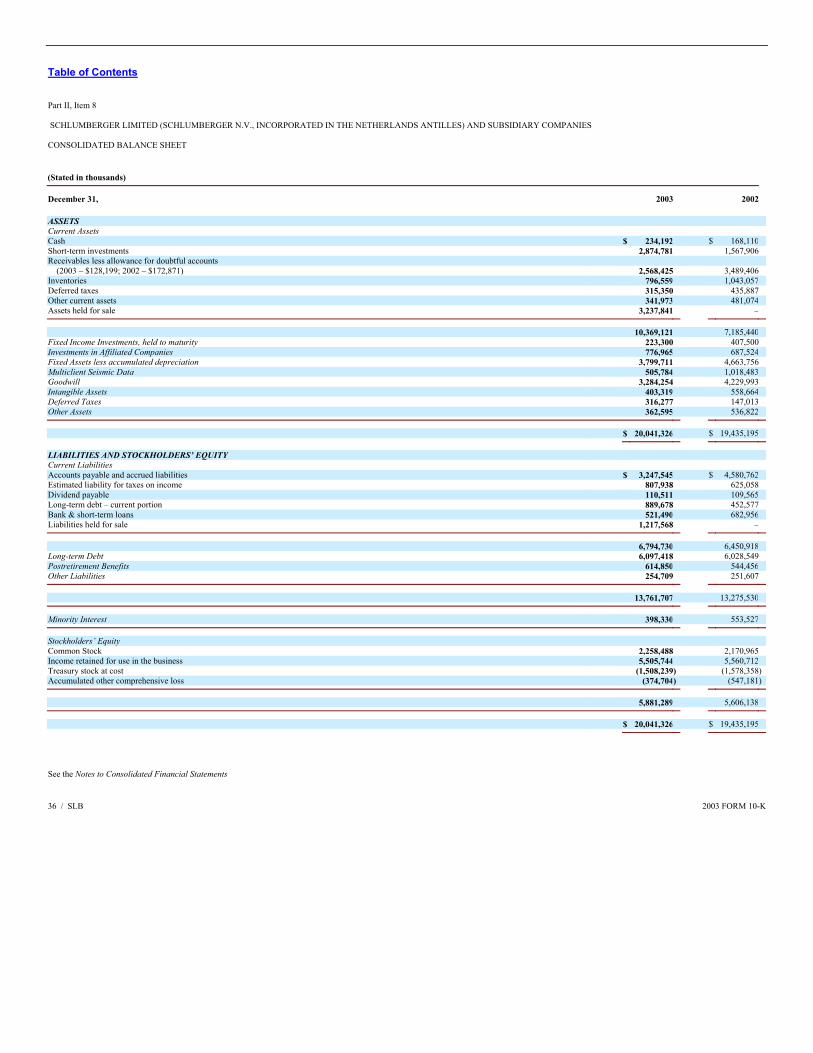
Table of Contents Part II, Item 8 SCHLUMBERGER LIMITED (SCHLUMBERGER N.V., INCORPORATED IN THE NETHERLANDS ANTILLES) AND SUBSIDIARY COMPANIES CONSOLIDATED BALANCE SHEET (Stated in thousands)
December 31, 2003 2002 ASSETS Current Assets Cash $ 234,192 $ 168,110 Short-term investments 2,874,781 1,567,906 Receivables less allowance for doubtful accounts (2003 – $128,199; 2002 – $172,871) 2,568,425 3,489,406 Inventories 796,559 1,043,057 Deferred taxes 315,350 435,887 Other current assets 341,973 481,074 Assets held for sale 3,237,841 –
10,369,121 7,185,440 Fixed Income Investments, held to maturity 223,300 407,500 Investments in Affiliated Companies 776,965 687,524 Fixed Assets less accumulated depreciation 3,799,711 4,663,756 Multiclient Seismic Data 505,784 1,018,483 Goodwill 3,284,254 4,229,993 Intangible Assets 403,319 558,664 Deferred Taxes 316,277 147,013 Other Assets 362,595 536,822
$ 20,041,326 $ 19,435,195
LIABILITIES AND STOCKHOLDERS’ EQUITY Current Liabilities Accounts payable and accrued liabilities $ 3,247,545 $ 4,580,762 Estimated liability for taxes on income 807,938 625,058 Dividend payable 110,511 109,565 Long-term debt – current portion 889,678 452,577 Bank & short-term loans 521,490 682,956 Liabilities held for sale 1,217,568 –
6,794,730 6,450,918 Long-term Debt 6,097,418 6,028,549 Postretirement Benefits 614,850 544,456 Other Liabilities 254,709 251,607
13,761,707 13,275,530
Minority Interest 398,330 553,527
Stockholders’ Equity Common Stock 2,258,488 2,170,965 Income retained for use in the business 5,505,744 5,560,712 Treasury stock at cost (1,508,239) (1,578,358) Accumulated other comprehensive loss (374,704) (547,181)
5,881,289 5,606,138
$ 20,041,326 $ 19,435,195
See the Notes to Consolidated Financial Statements 36 / SLB 2003 FORM 10-K
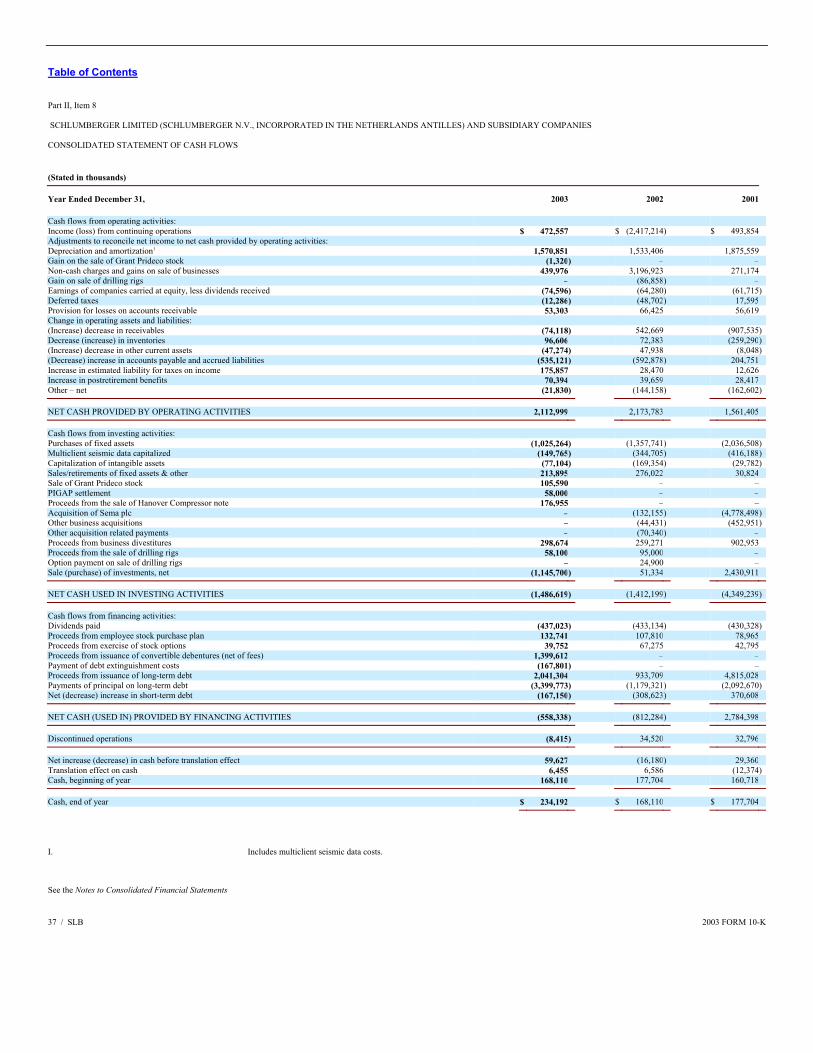
Table of Contents Part II, Item 8 SCHLUMBERGER LIMITED (SCHLUMBERGER N.V., INCORPORATED IN THE NETHERLANDS ANTILLES) AND SUBSIDIARY COMPANIES CONSOLIDATED STATEMENT OF CASH FLOWS (Stated in thousands)
Year Ended December 31, 2003 2002 2001 Cash flows from operating activities: Income (loss) from continuing operations $ 472,557 $ (2,417,214) $ 493,854 Adjustments to reconcile net income to net cash provided by operating activities: Depreciation and amortization1 1,570,851 1,533,406 1,875,559 Gain on the sale of Grant Prideco stock (1,320) – – Non-cash charges and gains on sale of businesses 439,976 3,196,923 271,174 Gain on sale of drilling rigs – (86,858) – Earnings of companies carried at equity, less dividends received (74,596) (64,280) (61,715)Deferred taxes (12,286) (48,702) 17,595 Provision for losses on accounts receivable 53,303 66,425 56,619 Change in operating assets and liabilities: (Increase) decrease in receivables (74,118) 542,669 (907,535)Decrease (increase) in inventories 96,606 72,383 (259,290)(Increase) decrease in other current assets (47,274) 47,938 (8,048)(Decrease) increase in accounts payable and accrued liabilities (535,121) (592,878) 204,751 Increase in estimated liability for taxes on income 175,857 28,470 12,626 Increase in postretirement benefits 70,394 39,659 28,417 Other – net (21,830) (144,158) (162,602)
NET CASH PROVIDED BY OPERATING ACTIVITIES 2,112,999 2,173,783 1,561,405
Cash flows from investing activities: Purchases of fixed assets (1,025,264) (1,357,741) (2,036,508)Multiclient seismic data capitalized (149,765) (344,705) (416,188)Capitalization of intangible assets (77,104) (169,354) (29,782)Sales/retirements of fixed assets & other 213,895 276,022 30,824 Sale of Grant Prideco stock 105,590 – – PIGAP settlement 58,000 – – Proceeds from the sale of Hanover Compressor note 176,955 – – Acquisition of Sema plc – (132,155) (4,778,498)Other business acquisitions – (44,431) (452,951)Other acquisition related payments – (70,340) – Proceeds from business divestitures 298,674 259,271 902,953 Proceeds from the sale of drilling rigs 58,100 95,000 – Option payment on sale of drilling rigs – 24,900 – Sale (purchase) of investments, net (1,145,700) 51,334 2,430,911
NET CASH USED IN INVESTING ACTIVITIES (1,486,619) (1,412,199) (4,349,239)
Cash flows from financing activities: Dividends paid (437,023) (433,134) (430,328)Proceeds from employee stock purchase plan 132,741 107,810 78,965 Proceeds from exercise of stock options 39,752 67,275 42,795 Proceeds from issuance of convertible debentures (net of fees) 1,399,612 – – Payment of debt extinguishment costs (167,801) – – Proceeds from issuance of long-term debt 2,041,304 933,709 4,815,028 Payments of principal on long-term debt (3,399,773) (1,179,321) (2,092,670)Net (decrease) increase in short-term debt (167,150) (308,623) 370,608
NET CASH (USED IN) PROVIDED BY FINANCING ACTIVITIES (558,338) (812,284) 2,784,398
Discontinued operations (8,415) 34,520 32,796
Net increase (decrease) in cash before translation effect 59,627 (16,180) 29,360 Translation effect on cash 6,455 6,586 (12,374)Cash, beginning of year 168,110 177,704 160,718
Cash, end of year $ 234,192 $ 168,110 $ 177,704
I. Includes multiclient seismic data costs.
See the Notes to Consolidated Financial Statements 37 / SLB 2003 FORM 10-K
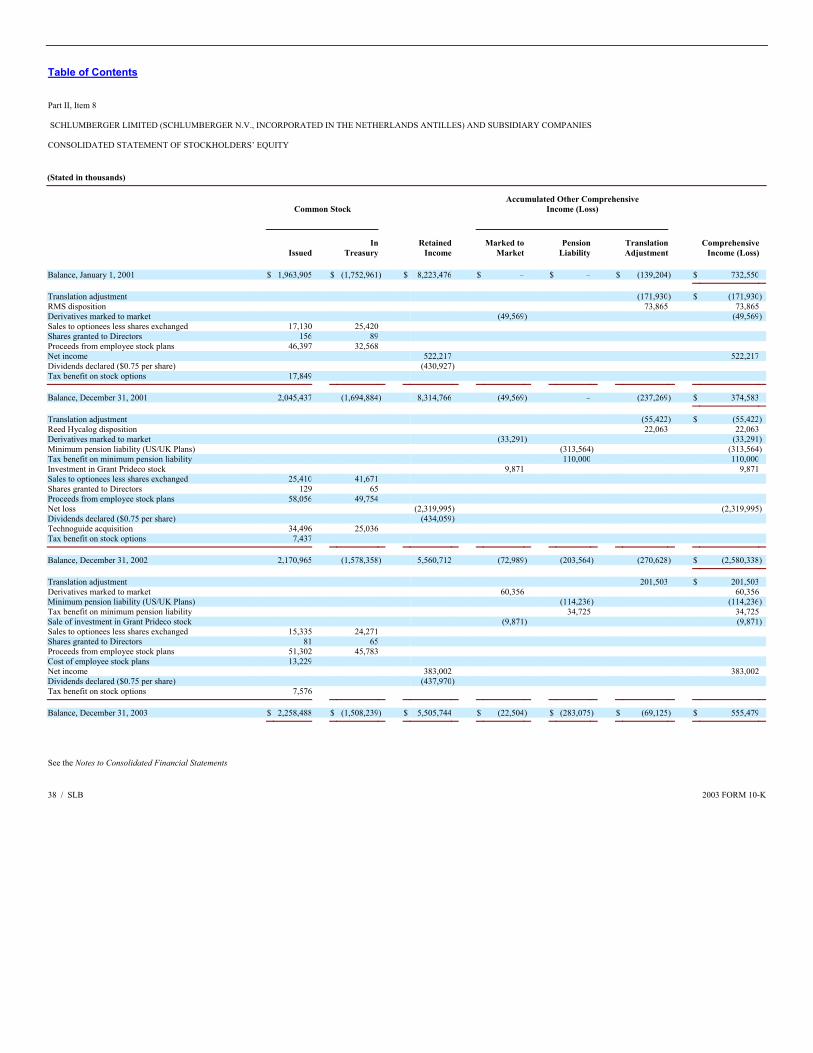
Table of Contents Part II, Item 8 SCHLUMBERGER LIMITED (SCHLUMBERGER N.V., INCORPORATED IN THE NETHERLANDS ANTILLES) AND SUBSIDIARY COMPANIES CONSOLIDATED STATEMENT OF STOCKHOLDERS’ EQUITY (Stated in thousands)
Common Stock
Accumulated Other Comprehensive Income (Loss)
Issued In
Treasury Retained
Income Marked to
Market Pension
Liability TranslationAdjustment
ComprehensiveIncome (Loss)
Balance, January 1, 2001 $ 1,963,905 $ (1,752,961) $ 8,223,476 $ – $ – $ (139,204) $ 732,550
Translation adjustment (171,930) $ (171,930)RMS disposition 73,865 73,865 Derivatives marked to market (49,569) (49,569)Sales to optionees less shares exchanged 17,130 25,420 Shares granted to Directors 156 89 Proceeds from employee stock plans 46,397 32,568 Net income 522,217 522,217 Dividends declared ($0.75 per share) (430,927) Tax benefit on stock options 17,849
Balance, December 31, 2001 2,045,437 (1,694,884) 8,314,766 (49,569) – (237,269) $ 374,583
Translation adjustment (55,422) $ (55,422)Reed Hycalog disposition 22,063 22,063 Derivatives marked to market (33,291) (33,291)Minimum pension liability (US/UK Plans) (313,564) (313,564)Tax benefit on minimum pension liability 110,000 110,000 Investment in Grant Prideco stock 9,871 9,871 Sales to optionees less shares exchanged 25,410 41,671 Shares granted to Directors 129 65 Proceeds from employee stock plans 58,056 49,754 Net loss (2,319,995) (2,319,995)Dividends declared ($0.75 per share) (434,059) Technoguide acquisition 34,496 25,036 Tax benefit on stock options 7,437
Balance, December 31, 2002 2,170,965 (1,578,358) 5,560,712 (72,989) (203,564) (270,628) $ (2,580,338)
Translation adjustment 201,503 $ 201,503 Derivatives marked to market 60,356 60,356 Minimum pension liability (US/UK Plans) (114,236) (114,236)Tax benefit on minimum pension liability 34,725 34,725 Sale of investment in Grant Prideco stock (9,871) (9,871)Sales to optionees less shares exchanged 15,335 24,271 Shares granted to Directors 81 65 Proceeds from employee stock plans 51,302 45,783 Cost of employee stock plans 13,229 Net income 383,002 383,002 Dividends declared ($0.75 per share) (437,970) Tax benefit on stock options 7,576
Balance, December 31, 2003 $ 2,258,488 $ (1,508,239) $ 5,505,744 $ (22,504) $ (283,075) $ (69,125) $ 555,479
See the Notes to Consolidated Financial Statements 38 / SLB 2003 FORM 10-K
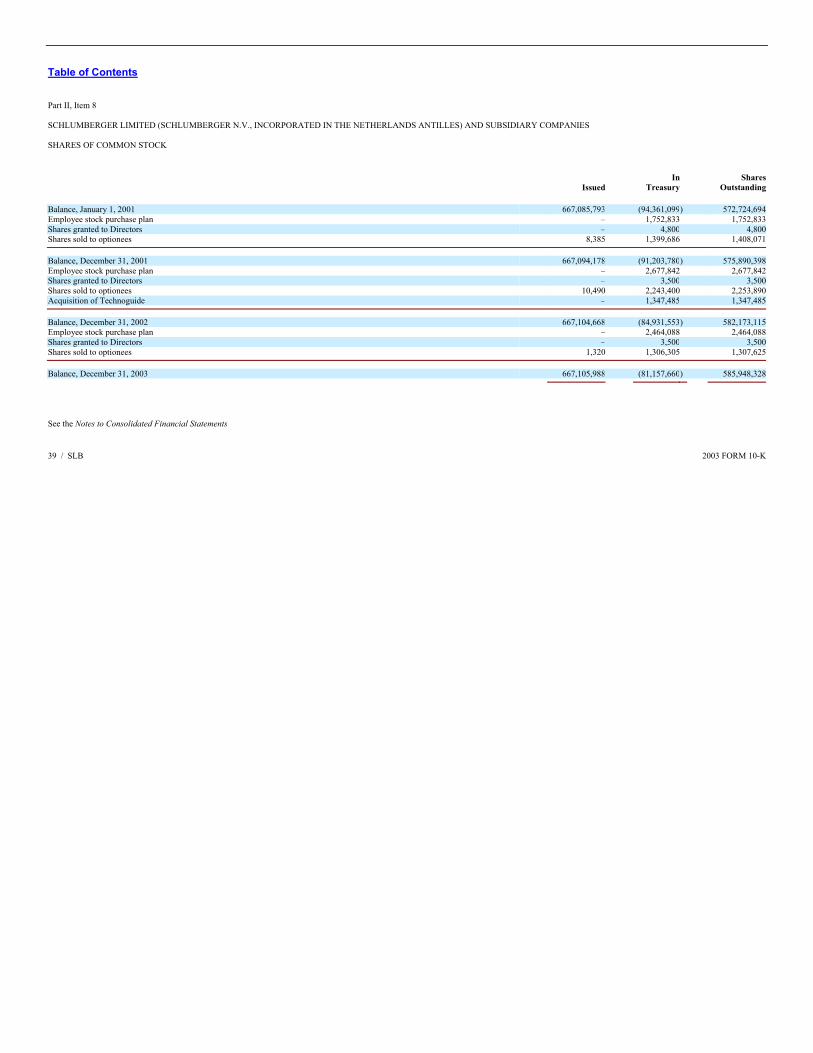
Table of Contents Part II, Item 8 SCHLUMBERGER LIMITED (SCHLUMBERGER N.V., INCORPORATED IN THE NETHERLANDS ANTILLES) AND SUBSIDIARY COMPANIES SHARES OF COMMON STOCK
Issued In
Treasury Shares
Outstanding Balance, January 1, 2001 667,085,793 (94,361,099) 572,724,694Employee stock purchase plan – 1,752,833 1,752,833Shares granted to Directors – 4,800 4,800Shares sold to optionees 8,385 1,399,686 1,408,071
Balance, December 31, 2001 667,094,178 (91,203,780) 575,890,398Employee stock purchase plan – 2,677,842 2,677,842Shares granted to Directors – 3,500 3,500Shares sold to optionees 10,490 2,243,400 2,253,890Acquisition of Technoguide – 1,347,485 1,347,485
Balance, December 31, 2002 667,104,668 (84,931,553) 582,173,115Employee stock purchase plan – 2,464,088 2,464,088Shares granted to Directors – 3,500 3,500Shares sold to optionees 1,320 1,306,305 1,307,625
Balance, December 31, 2003 667,105,988 (81,157,660) 585,948,328
See the Notes to Consolidated Financial Statements 39 / SLB 2003 FORM 10-K
Table of Contents Part II, Item 8 Notes to Consolidated Financial Statements 1. Business Description Founded in 1927, Schlumberger Limited is a global technology services company consisting of four business segments: first, Schlumberger Oilfield Services, one of the leading providers of technology services and solutions to the international petroleum industry; second, WesternGeco provides comprehensive worldwide reservoir imaging, monitoring, and development services, with extensive seismic crews and data processing centers as well as a large multiclient seismic library. Services range from 3D and time-lapse (4D) seismic surveys to multi-component surveys for delineating prospects and reservoir management; WesternGeco is 70% owned by Schlumberger and 30% owned by Baker Hughes; third, SchlumbergerSema, an IT services company providing consulting and systems integration services, and network and infrastructure solutions, primarily to the global energy sector, and other regional markets spanning the finance and public sectors and fourth, the Other business segment which principally comprises the Axalto (Smart Cards and Point-of-Sale Terminals), Electricity Meters, Business Continuity, Infodata, Telecom Software Products, Water Services, Essentis and Payphones businesses, all of which are in active divestiture negotiations. On September 22, 2003, Schlumberger announced the signing of an agreement with Atos Origin for the sale of the SchlumbergerSema business. The sale closed on January 29, 2004. 2. Summary of Accounting Policies The Consolidated Financial Statements of Schlumberger Limited and its subsidiaries have been prepared in accordance with accounting principles generally accepted in the United States of America. Discontinued Operations In July 2003, Schlumberger completed the sale of its NPTest semiconductor testing business to a partnership led by Francisco Partners and Shah Management. The proceeds were $220 million in cash. Additionally, the partnership has a contingent obligation to make a further payment to Schlumberger upon a subsequent qualifying disposition or an initial public offering of NPTest by the partnership, under certain circumstances. The results of NPTest are reported as Discontinued Operations in the Consolidated Statement of Income and include a net loss of $12 million on the sale. The net assets were $202 million. In August 2003, Schlumberger completed the sale of its Verification Systems business by a proceed-free management buyout. The results of Verification Systems are reported as Discontinued Operations in the Consolidated Statement of Income and include a net loss of $18 million on the sale. The net assets were $17 million. In October 2003, Schlumberger completed the sale of its e-City ‘pay & display’ parking solutions business to Apax Partners. The proceeds were $84 million in cash. The results of e-City are reported as Discontinued Operations in the Consolidated Statement of Income and include a net loss of $56 million on the sale. The net assets were $120 million, including a $65 million allocation of goodwill. In December, 2002, Schlumberger completed the sale of its Reed Hycalog drillbits business. The proceeds included $259 million in cash and 9.7 million shares of Grant Prideco common stock with a value of $103 million. The results for the Reed Hycalog operations are reported as Discontinued Operations in the Consolidated Statement of Income and, in 2002, include results of operations of $32 million and gain on sale of $66 million. The net assets were $185 million. 40 / SLB 2003 FORM 10-K
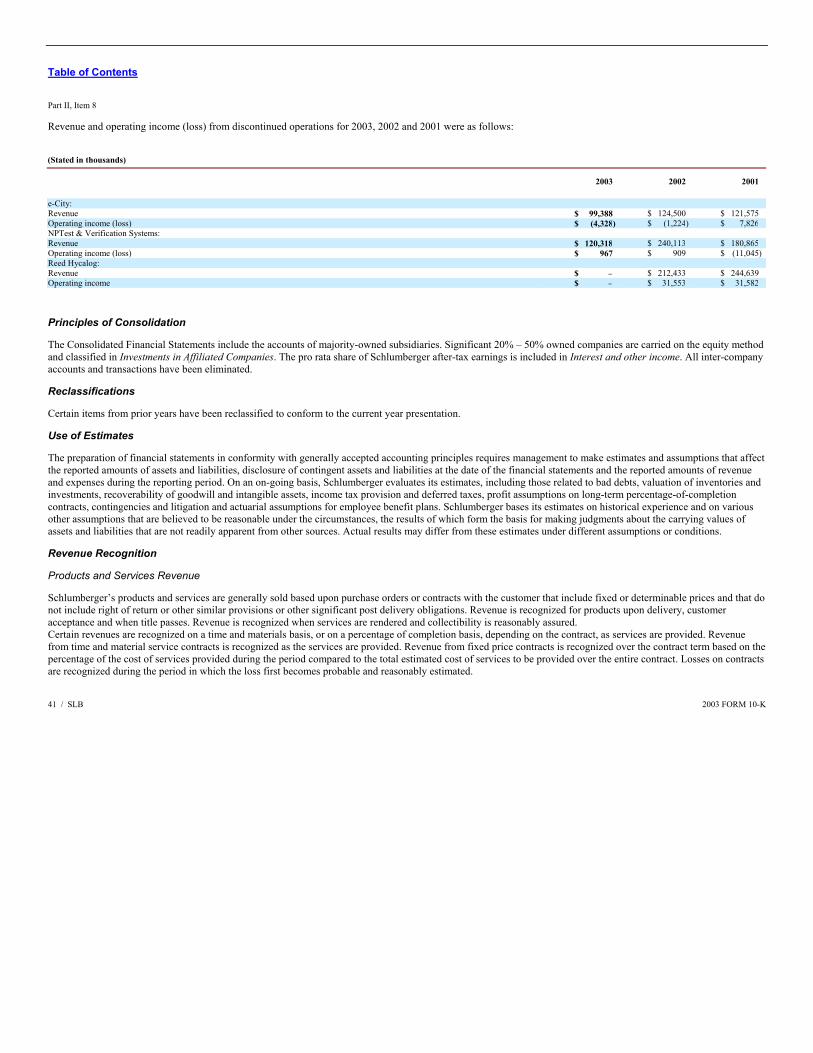
Table of Contents Part II, Item 8 Revenue and operating income (loss) from discontinued operations for 2003, 2002 and 2001 were as follows: (Stated in thousands)
2003 2002 2001 e-City: Revenue $ 99,388 $ 124,500 $ 121,575 Operating income (loss) $ (4,328) $ (1,224) $ 7,826 NPTest & Verification Systems: Revenue $ 120,318 $ 240,113 $ 180,865 Operating income (loss) $ 967 $ 909 $ (11,045) Reed Hycalog: Revenue $ – $ 212,433 $ 244,639 Operating income $ – $ 31,553 $ 31,582
Principles of Consolidation The Consolidated Financial Statements include the accounts of majority-owned subsidiaries. Significant 20% – 50% owned companies are carried on the equity method and classified in Investments in Affiliated Companies. The pro rata share of Schlumberger after-tax earnings is included in Interest and other income. All inter-company accounts and transactions have been eliminated. Reclassifications Certain items from prior years have been reclassified to conform to the current year presentation. Use of Estimates The preparation of financial statements in conformity with generally accepted accounting principles requires management to make estimates and assumptions that affect the reported amounts of assets and liabilities, disclosure of contingent assets and liabilities at the date of the financial statements and the reported amounts of revenue and expenses during the reporting period. On an on-going basis, Schlumberger evaluates its estimates, including those related to bad debts, valuation of inventories and investments, recoverability of goodwill and intangible assets, income tax provision and deferred taxes, profit assumptions on long-term percentage-of-completion contracts, contingencies and litigation and actuarial assumptions for employee benefit plans. Schlumberger bases its estimates on historical experience and on various other assumptions that are believed to be reasonable under the circumstances, the results of which form the basis for making judgments about the carrying values of assets and liabilities that are not readily apparent from other sources. Actual results may differ from these estimates under different assumptions or conditions. Revenue Recognition Products and Services Revenue Schlumberger’s products and services are generally sold based upon purchase orders or contracts with the customer that include fixed or determinable prices and that do not include right of return or other similar provisions or other significant post delivery obligations. Revenue is recognized for products upon delivery, customer acceptance and when title passes. Revenue is recognized when services are rendered and collectibility is reasonably assured. Certain revenues are recognized on a time and materials basis, or on a percentage of completion basis, depending on the contract, as services are provided. Revenue from time and material service contracts is recognized as the services are provided. Revenue from fixed price contracts is recognized over the contract term based on the percentage of the cost of services provided during the period compared to the total estimated cost of services to be provided over the entire contract. Losses on contracts are recognized during the period in which the loss first becomes probable and reasonably estimated. 41 / SLB 2003 FORM 10-K
Table of Contents Part II, Item 8 Software Revenue Revenue derived from the sale of licenses for its software, maintenance and related services may include installation, consulting and training services. If services are not essential to the functionality of the software, the revenue for each element of the contract is recognized separately based on its respective vendor specific objective evidence of fair value when all of the following conditions are met: a signed contract is obtained, delivery has occurred, fee is fixed and determinable and collectibility is probable. If an ongoing vendor obligation exists under the license arrangement, or if any uncertainties with regard to customer acceptance are significant, revenue for the related element is deferred based on its vendor specific objective evidence of fair value. Vendor specific objective evidence of fair value is determined as being the price for the element when sold separately. If vendor specific objective evidence of fair value does not exist for all undelivered elements, all revenue is deferred until sufficient evidence exists or all elements have been delivered. Multiple Element Arrangement and Collectibility Many sales are generated from complex contractual arrangements that require significant revenue recognition judgments, particularly in the areas of multiple element arrangements. Revenues from contracts with multiple element arrangements, such as those including installation and integration services, are recognized as each element is earned based on the relative fair value of each element and when the delivered elements have stand alone value to the customers. The assessment of collectibility is particularly critical in determining whether revenue should be recognized in the current market environment. As part of the revenue recognition process, Schlumberger determines whether trade and notes receivables are reasonably assured of collection based on various factors, including the ability to sell those receivables and whether there has been deterioration in the credit quality of customers that could result in the inability to sell the receivables. In situations where Schlumberger has the ability to sell the receivables without recourse, revenue is recognized to the extent of the value Schlumberger could reasonably expect to realize from the sale. Schlumberger defers revenue and related costs when it is uncertain as to whether it will be able to collect or sell the receivable. Schlumberger defers revenue but recognizes costs when it determines that the collection or sale of the receivable is unlikely. Translation of Non-US Currencies The Oilfield Services and WesternGeco segments functional currency is primarily the US dollar. The SchlumbergerSema segment and Other segment functional currencies are primarily local currencies. All assets and liabilities recorded in functional currencies other than US dollars are translated at current exchange rates. The resulting adjustments are charged or credited directly to the Stockholders’ Equity section of the Consolidated Balance Sheet. Revenue and expenses are translated at the weighted-average exchange rates for the period. All realized and unrealized transaction gains and losses are included in income in the period in which they occur. Schlumberger’s policy is to hedge against unrealized gains and losses on a monthly basis. Included in the 2003 results were transaction gains of $1 million, compared with losses of $2 million and $7 million in 2002 and 2001, respectively. Currency exchange contracts are entered into as a hedge against the effect of future settlement of assets and liabilities denominated in other than the functional currency of the individual businesses. Gains or losses on the contracts are recognized when the currency exchange rates fluctuate, and the resulting charge or credit partially offsets the unrealized currency gains or losses on those assets and liabilities. On December 31, 2003, contracts were outstanding for the US dollar equivalent of $2.2 billion in various foreign currencies. These contracts mature on various dates in 2004. 42 / SLB 2003 FORM 10-K
Table of Contents Part II, Item 8 Investments Both short-term investments and fixed income investments, held to maturity comprise primarily eurodollar time deposits, certificates of deposit and commercial paper, euronotes and eurobonds, substantially all denominated in US dollars. They are stated at cost plus accrued interest, which approximates market. Substantially all the investments designated as held to maturity that were purchased and matured during the year had original maturities of less than three months. Short-term investments that are designated as trading are stated at market. The unrealized gains/losses on such securities at December 31, 2003 were not significant. For purposes of the Consolidated Statement of Cash Flows, Schlumberger does not consider short-term investments to be cash equivalents as they generally have original maturities in excess of three months. Inventories Inventories are stated at average cost or at market, whichever is lower. Inventory consists of materials, supplies and finished goods. Fixed Assets and Depreciation Fixed assets are stated at cost less accumulated depreciation, which is provided for by charges to income over the estimated useful lives of the assets using the straight-line method. Fixed assets include the manufacturing cost (average cost) of oilfield technical equipment manufactured or assembled by subsidiaries of Schlumberger. Expenditures for renewals, replacements and improvements are capitalized. Maintenance and repairs are charged to operating expenses as incurred. Upon sale or other disposition, the applicable amounts of asset cost and accumulated depreciation are removed from the accounts and the net amount, less proceeds from disposal, is charged or credited to income. Multiclient Seismic Data Schlumberger capitalizes the cost of obtaining multiclient surveys. Such costs are charged to Cost of goods sold and services based on a percentage of estimated total revenue that Schlumberger expects to receive from the sales of such data. The carrying value of individual surveys is reviewed, at least annually, and adjustments to the value are made based upon the revised estimated revenues for the surveys. Capitalized Software The costs incurred for the development of computer software that will be sold, leased or otherwise marketed are capitalized when technological feasibility has been established, generally when all of the planning, designing, coding and testing activities that are necessary in order to establish that the product can be produced to meet its design specifications including functions, features and technical performance requirements are completed. These capitalized costs are subject to an ongoing assessment of recoverability based on anticipated future revenues and changes in hardware and software technologies. Costs that are capitalized include direct labor and related overheads. Total capitalized internally developed software costs was $47 million at December 31, 2003 of which $33 million was deferred in 2003. Amortization of capitalized software development costs begins when the product is available for general release. Amortization is provided on the greater of the straight-line method or the sales ratio method over the estimated useful life. Unamortized capitalized software development costs determined to be in excess of the net realizable value of the product are expensed immediately. Schlumberger capitalizes certain costs of internally developed software. Capitalized costs include purchased materials and services, payroll and payroll related costs and interest costs. The costs of internally developed software is amortized on a straight-line basis over the estimated useful life which is principally 6 years. 43 / SLB 2003 FORM 10-K

Table of Contents Part II, Item 8 Impairment of Long-lived Assets On an annual basis Schlumberger reviews the carrying value of its long-lived assets, including goodwill, intangible assets and investments. In addition, whenever events or changes in circumstances indicate that the historical cost-carrying value of an asset may no longer be recoverable, a review is performed. Schlumberger assesses recoverability of the carrying value of the asset by estimating the future net cash flows expected to result from the asset, including eventual disposition. If the future net cash flows are less than the carrying value of the asset, an impairment loss is recorded equal to the difference between the asset’s carrying value and fair value. In accordance with SFAS 142 (Goodwill and Other Intangible Assets), which was adopted by Schlumberger commencing January 1, 2002, goodwill ceased to be amortized. Taxes on Income Schlumberger and its subsidiaries compute taxes on income in accordance with the tax rules and regulations of the many taxing authorities where the income is earned. The income tax rates imposed by these taxing authorities vary substantially. Taxable income may differ from pretax income for financial accounting purposes. To the extent that differences are due to revenue or expense items reported in one period for tax purposes and in another period for financial accounting purposes, an appropriate provision for deferred income taxes is made. Any effect of changes in income tax rates or tax laws are included in the provision for income taxes in the period of enactment. When it is more likely than not that a portion or all of the deferred tax asset will not be realized in the future, Schlumberger provides a corresponding valuation allowance against deferred tax assets. Approximately $2.3 billion of consolidated income retained for use in the business on December 31, 2003 represented undistributed earnings of consolidated subsidiaries and the pro rata Schlumberger share of 20% –50% owned companies. No provision is made for deferred income taxes on those earnings considered to be indefinitely reinvested or earnings that would not be taxed when remitted. Concentration of Credit Risk Schlumberger’s financial instruments which potentially subject the company to concentration of credit risk consist primarily of accounts receivable. Schlumberger maintains an allowance for uncollectible accounts receivable based on expected collectibility and performs ongoing credit evaluations of its customers’ financial condition. Earnings per Share Basic earnings per share is calculated by dividing net income by the average number of common shares outstanding during the year. Diluted earnings per share is calculated by dividing net income, as adjusted for the interest on convertible debentures unless the adjustment is anti-dilutive, by the average number of common shares outstanding assuming dilution, the calculation of which assumes (i) that all stock options which are in the money are exercised at the beginning of the period and the proceeds used, by Schlumberger, to purchase shares at the average market price for the period, and (ii) the convertible debentures have been converted unless the effect is anti-dilutive. 44 / SLB 2003 FORM 10-K
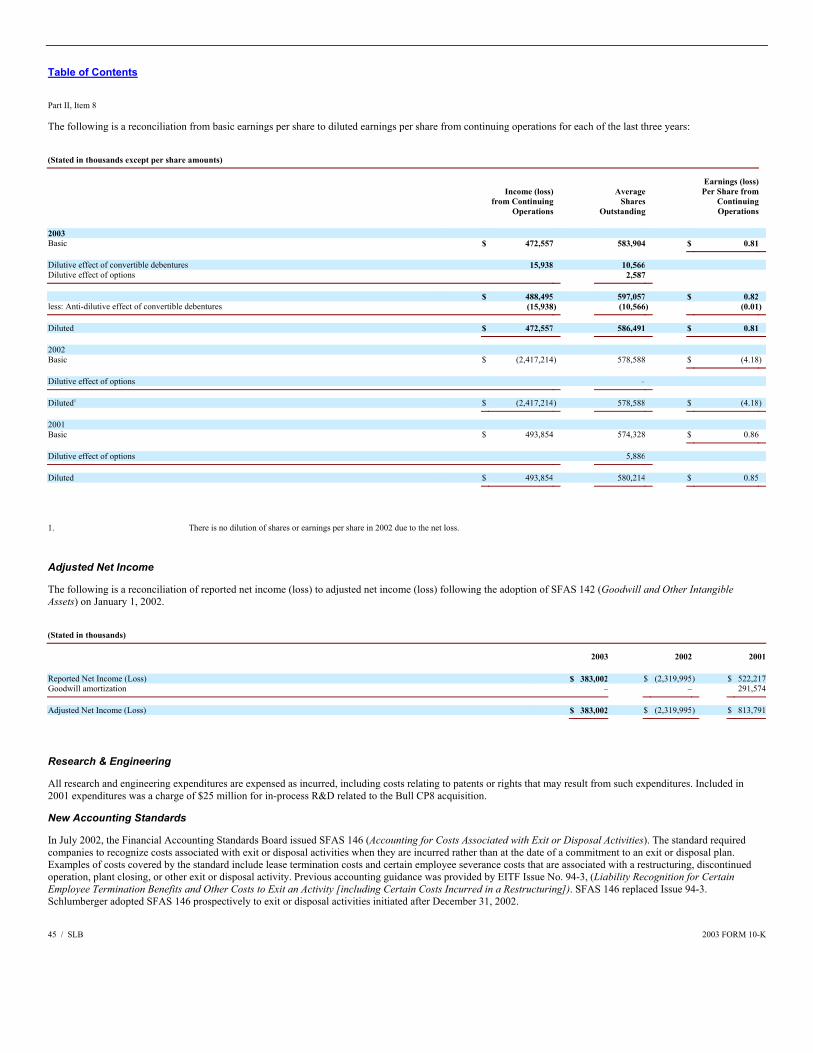
Table of Contents Part II, Item 8 The following is a reconciliation from basic earnings per share to diluted earnings per share from continuing operations for each of the last three years: (Stated in thousands except per share amounts)
Income (loss)from Continuing
Operations
AverageShares
Outstanding
Earnings (loss)Per Share from
ContinuingOperations
2003 Basic $ 472,557 583,904 $ 0.81
Dilutive effect of convertible debentures 15,938 10,566 Dilutive effect of options 2,587
$ 488,495 597,057 $ 0.82 less: Anti-dilutive effect of convertible debentures (15,938) (10,566) (0.01)
Diluted $ 472,557 586,491 $ 0.81
2002 Basic $ (2,417,214) 578,588 $ (4.18)
Dilutive effect of options –
Diluted1 $ (2,417,214) 578,588 $ (4.18)
2001 Basic $ 493,854 574,328 $ 0.86
Dilutive effect of options 5,886
Diluted $ 493,854 580,214 $ 0.85
1. There is no dilution of shares or earnings per share in 2002 due to the net loss.
Adjusted Net Income The following is a reconciliation of reported net income (loss) to adjusted net income (loss) following the adoption of SFAS 142 (Goodwill and Other Intangible Assets) on January 1, 2002. (Stated in thousands)
2003 2002 2001 Reported Net Income (Loss) $ 383,002 $ (2,319,995) $ 522,217Goodwill amortization – – 291,574
Adjusted Net Income (Loss) $ 383,002 $ (2,319,995) $ 813,791
Research & Engineering All research and engineering expenditures are expensed as incurred, including costs relating to patents or rights that may result from such expenditures. Included in 2001 expenditures was a charge of $25 million for in-process R&D related to the Bull CP8 acquisition. New Accounting Standards In July 2002, the Financial Accounting Standards Board issued SFAS 146 (Accounting for Costs Associated with Exit or Disposal Activities). The standard required companies to recognize costs associated with exit or disposal activities when they are incurred rather than at the date of a commitment to an exit or disposal plan. Examples of costs covered by the standard include lease termination costs and certain employee severance costs that are associated with a restructuring, discontinued operation, plant closing, or other exit or disposal activity. Previous accounting guidance was provided by EITF Issue No. 94-3, (Liability Recognition for Certain Employee Termination Benefits and Other Costs to Exit an Activity [including Certain Costs Incurred in a Restructuring]). SFAS 146 replaced Issue 94-3. Schlumberger adopted SFAS 146 prospectively to exit or disposal activities initiated after December 31, 2002. 45 / SLB 2003 FORM 10-K
Table of Contents Part II, Item 8 In November 2002, FASB Interpretation No. 45 (Guarantor’s Accounting and Disclosure Requirements for Guarantees, Including Indirect Guarantees of Indebtedness of Others) was issued. It requires certain accounting and disclosures of guarantees to third parties including indebtedness. The interpretation is effective on a prospective basis for guarantees issued or modified after December 31, 2002. The implementation of this interpretation did not have a material effect on Schlumberger’s financial position or results of operations. In January 2003, the Emerging Issues Task Force (EITF) issued No. 00-21 (Accounting for Revenue Arrangements with Multiple Deliverables). This EITF establishes the criteria for recognizing revenue in arrangements when several items are bundled into one agreement. EITF 00-21 does not allow revenue recognition unless the fair value of the undelivered element(s) is available and the element has stand-alone value to the customer. EITF 00-21 also provides guidance on allocating the total contract revenue to the individual elements based upon the available fair value of each deliverable. The implementation of this pronouncement did not have a material impact on Schlumberger’s financial position or results of operations. In January 2003, the Financial Accounting Standards Board issued FASB Interpretation No. 46, (Consolidation of Variable Interest Entities, an Interpretation of ARB No. 51). The primary objective of the interpretation is to provide guidance on the identification of, and financial reporting for entities over which control is achieved through means other than voting rights; such entities are known as variable-interest entities (VIE’s). FIN 46 provides guidance that determines (1) whether consolidation is required under the “controlling financial interest” model of Accounting Research Bulletin No. 51 (ARB 51), Consolidated Financial Statements, or other existing authoritative guidance, or, alternative, (2) whether the variable-interest model under FIN 46 should be used to account for existing and new entities. Schlumberger does not believe that the adoption of this statement will have a material effect on the financial position or results of operations. In April 2003, the Financial Accounting Standards Board issued SFAS No. 149 (Amendment of Statement 133 on Derivative Instruments and Hedging Activities) which amends and clarifies financial accounting and reporting for derivative instruments, including certain derivative instruments embedded in other contracts and for hedging activities under SFAS No. 133 (Accounting for Derivative Instruments and Hedging Activities). SFAS 149, which is to be applied prospectively, is effective for contracts entered into or modified after June 30, 2003, and for hedging relationships designated after June 30, 2003. The adoption of this new standard did not have a material impact on Schlumberger’s results of operations or financial position. In May 2003, the Financial Accounting Standards Board, issued SFAS No. 150, (Accounting for Certain Financial Instruments with Characteristics of Both Liabilities and Equity). The Standard specifies that instruments within its scope embody obligations of the issues and therefore, the issuer must classify them as liabilities. The Standard was effective July 1, 2003, and had no material effect on Schlumberger’s financial position. In January 2004, the Financial Accounting Standards Board issued FSP No. FAS 106-1 (Accounting and Disclosure Requirements Related to the Medicare Prescription Drug Improvement and Modernization Act of 2003). The statement permits the deferral of accounting related to the effects of the legislation until the earlier of issuance of final accounting guidance by the FASB or a significant plan amendment/curtailment event requiring remeasurement, occurring after January 31, 2004. Schlumberger expects the new legislation will significantly reduce future postretirement medical costs. 3. Hanover Compressor Company In August 2001, Schlumberger sold its Oilfield Services worldwide gas compression activity to Hanover Compressor Company. The proceeds included 8.7 million shares of Hanover Compressor common stock, with a value at closing of $173 million, which is restricted from marketability until August 30, 2004, and a $150 million long-term subordinated note maturing December 15, 2005. 46 / SLB 2003 FORM 10-K
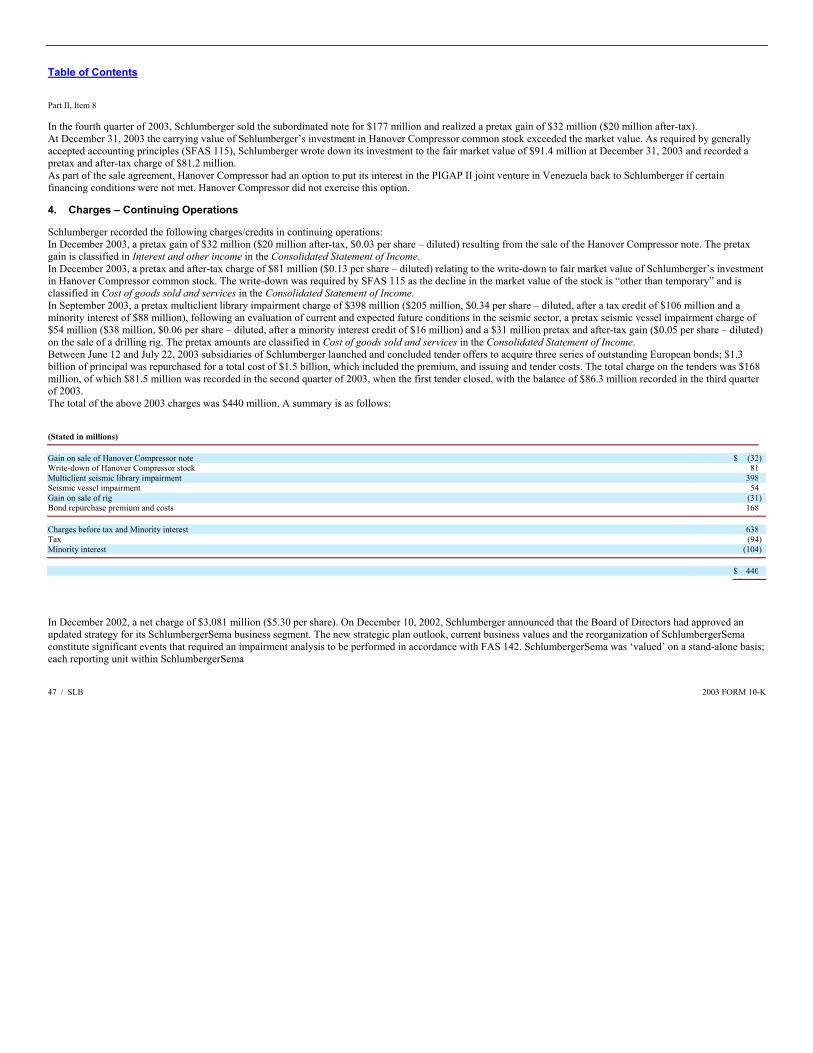
Table of Contents Part II, Item 8 In the fourth quarter of 2003, Schlumberger sold the subordinated note for $177 million and realized a pretax gain of $32 million ($20 million after-tax). At December 31, 2003 the carrying value of Schlumberger’s investment in Hanover Compressor common stock exceeded the market value. As required by generally accepted accounting principles (SFAS 115), Schlumberger wrote down its investment to the fair market value of $91.4 million at December 31, 2003 and recorded a pretax and after-tax charge of $81.2 million. As part of the sale agreement, Hanover Compressor had an option to put its interest in the PIGAP II joint venture in Venezuela back to Schlumberger if certain financing conditions were not met. Hanover Compressor did not exercise this option. 4. Charges – Continuing Operations Schlumberger recorded the following charges/credits in continuing operations: In December 2003, a pretax gain of $32 million ($20 million after-tax, $0.03 per share – diluted) resulting from the sale of the Hanover Compressor note. The pretax gain is classified in Interest and other income in the Consolidated Statement of Income. In December 2003, a pretax and after-tax charge of $81 million ($0.13 per share – diluted) relating to the write-down to fair market value of Schlumberger’s investment in Hanover Compressor common stock. The write-down was required by SFAS 115 as the decline in the market value of the stock is “other than temporary” and is classified in Cost of goods sold and services in the Consolidated Statement of Income. In September 2003, a pretax multiclient library impairment charge of $398 million ($205 million, $0.34 per share – diluted, after a tax credit of $106 million and a minority interest of $88 million), following an evaluation of current and expected future conditions in the seismic sector, a pretax seismic vessel impairment charge of $54 million ($38 million, $0.06 per share – diluted, after a minority interest credit of $16 million) and a $31 million pretax and after-tax gain ($0.05 per share – diluted) on the sale of a drilling rig. The pretax amounts are classified in Cost of goods sold and services in the Consolidated Statement of Income. Between June 12 and July 22, 2003 subsidiaries of Schlumberger launched and concluded tender offers to acquire three series of outstanding European bonds; $1.3 billion of principal was repurchased for a total cost of $1.5 billion, which included the premium, and issuing and tender costs. The total charge on the tenders was $168 million, of which $81.5 million was recorded in the second quarter of 2003, when the first tender closed, with the balance of $86.3 million recorded in the third quarter of 2003. The total of the above 2003 charges was $440 million. A summary is as follows: (Stated in millions)
Gain on sale of Hanover Compressor note $ (32)Write-down of Hanover Compressor stock 81 Multiclient seismic library impairment 398 Seismic vessel impairment 54 Gain on sale of rig (31)Bond repurchase premium and costs 168
Charges before tax and Minority interest 638 Tax (94)Minority interest (104)
$ 440
In December 2002, a net charge of $3,081 million ($5.30 per share). On December 10, 2002, Schlumberger announced that the Board of Directors had approved an updated strategy for its SchlumbergerSema business segment. The new strategic plan outlook, current business values and the reorganization of SchlumbergerSema constitute significant events that required an impairment analysis to be performed in accordance with FAS 142. SchlumbergerSema was ‘valued’ on a stand-alone basis; each reporting unit within SchlumbergerSema 47 / SLB 2003 FORM 10-K
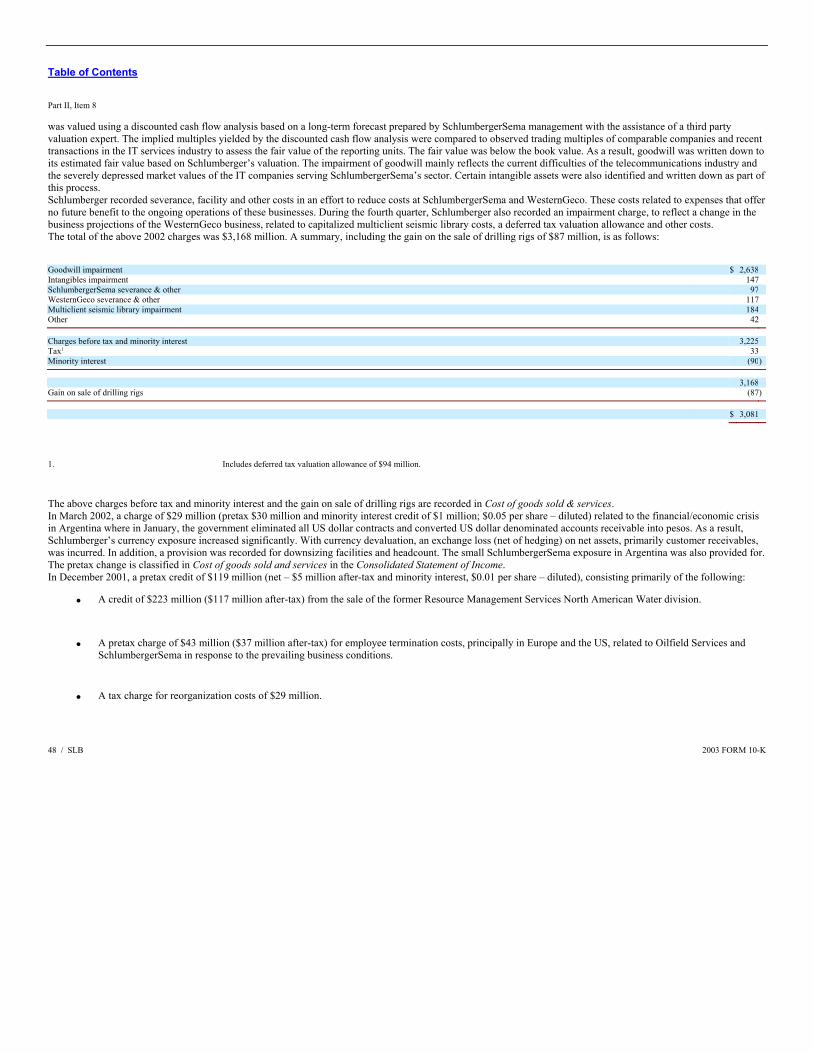
Table of Contents Part II, Item 8 was valued using a discounted cash flow analysis based on a long-term forecast prepared by SchlumbergerSema management with the assistance of a third party valuation expert. The implied multiples yielded by the discounted cash flow analysis were compared to observed trading multiples of comparable companies and recent transactions in the IT services industry to assess the fair value of the reporting units. The fair value was below the book value. As a result, goodwill was written down to its estimated fair value based on Schlumberger’s valuation. The impairment of goodwill mainly reflects the current difficulties of the telecommunications industry and the severely depressed market values of the IT companies serving SchlumbergerSema’s sector. Certain intangible assets were also identified and written down as part of this process. Schlumberger recorded severance, facility and other costs in an effort to reduce costs at SchlumbergerSema and WesternGeco. These costs related to expenses that offer no future benefit to the ongoing operations of these businesses. During the fourth quarter, Schlumberger also recorded an impairment charge, to reflect a change in the business projections of the WesternGeco business, related to capitalized multiclient seismic library costs, a deferred tax valuation allowance and other costs. The total of the above 2002 charges was $3,168 million. A summary, including the gain on the sale of drilling rigs of $87 million, is as follows: Goodwill impairment $ 2,638 Intangibles impairment 147 SchlumbergerSema severance & other 97 WesternGeco severance & other 117 Multiclient seismic library impairment 184 Other 42
Charges before tax and minority interest 3,225 Tax1 33 Minority interest (90)
3,168 Gain on sale of drilling rigs (87)
$ 3,081
1. Includes deferred tax valuation allowance of $94 million.
The above charges before tax and minority interest and the gain on sale of drilling rigs are recorded in Cost of goods sold & services. In March 2002, a charge of $29 million (pretax $30 million and minority interest credit of $1 million; $0.05 per share – diluted) related to the financial/economic crisis in Argentina where in January, the government eliminated all US dollar contracts and converted US dollar denominated accounts receivable into pesos. As a result, Schlumberger’s currency exposure increased significantly. With currency devaluation, an exchange loss (net of hedging) on net assets, primarily customer receivables, was incurred. In addition, a provision was recorded for downsizing facilities and headcount. The small SchlumbergerSema exposure in Argentina was also provided for. The pretax change is classified in Cost of goods sold and services in the Consolidated Statement of Income. In December 2001, a pretax credit of $119 million (net – $5 million after-tax and minority interest, $0.01 per share – diluted), consisting primarily of the following: • A credit of $223 million ($117 million after-tax) from the sale of the former Resource Management Services North American Water division.
• A pretax charge of $43 million ($37 million after-tax) for employee termination costs, principally in Europe and the US, related to Oilfield Services and SchlumbergerSema in response to the prevailing business conditions.
• A tax charge for reorganization costs of $29 million.
48 / SLB 2003 FORM 10-K
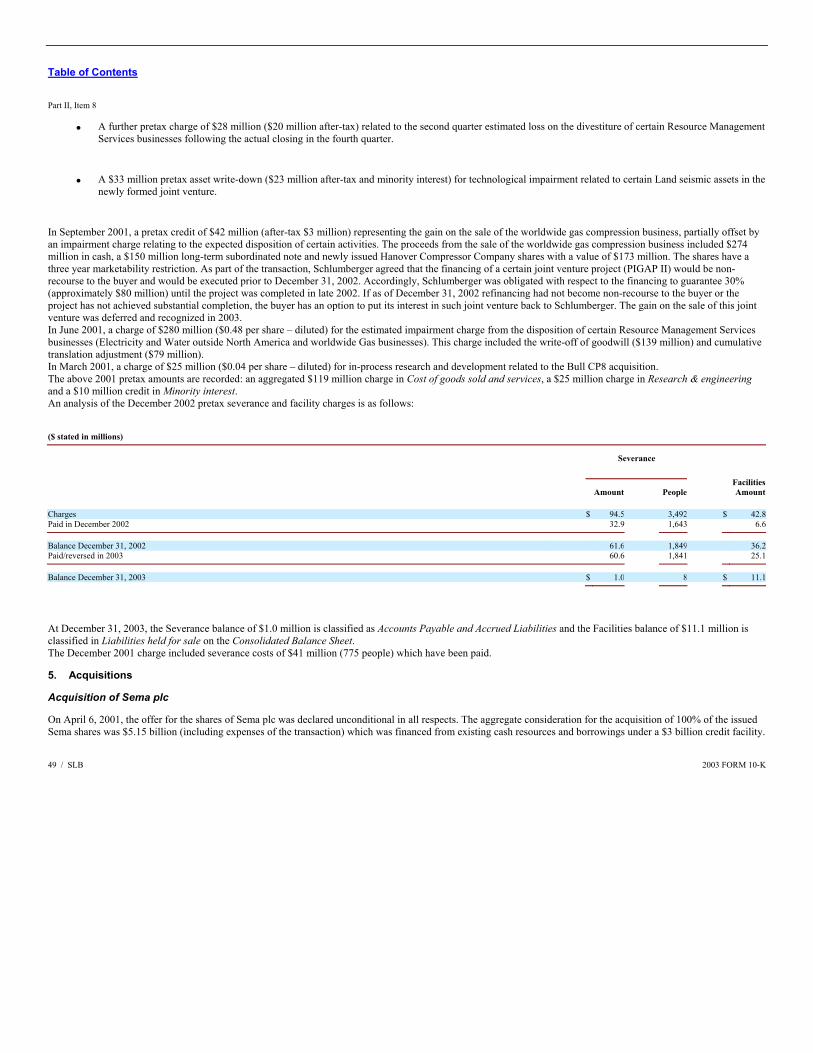
Table of Contents Part II, Item 8
• A further pretax charge of $28 million ($20 million after-tax) related to the second quarter estimated loss on the divestiture of certain Resource Management Services businesses following the actual closing in the fourth quarter.
• A $33 million pretax asset write-down ($23 million after-tax and minority interest) for technological impairment related to certain Land seismic assets in the newly formed joint venture.
In September 2001, a pretax credit of $42 million (after-tax $3 million) representing the gain on the sale of the worldwide gas compression business, partially offset by an impairment charge relating to the expected disposition of certain activities. The proceeds from the sale of the worldwide gas compression business included $274 million in cash, a $150 million long-term subordinated note and newly issued Hanover Compressor Company shares with a value of $173 million. The shares have a three year marketability restriction. As part of the transaction, Schlumberger agreed that the financing of a certain joint venture project (PIGAP II) would be non-recourse to the buyer and would be executed prior to December 31, 2002. Accordingly, Schlumberger was obligated with respect to the financing to guarantee 30% (approximately $80 million) until the project was completed in late 2002. If as of December 31, 2002 refinancing had not become non-recourse to the buyer or the project has not achieved substantial completion, the buyer has an option to put its interest in such joint venture back to Schlumberger. The gain on the sale of this joint venture was deferred and recognized in 2003. In June 2001, a charge of $280 million ($0.48 per share – diluted) for the estimated impairment charge from the disposition of certain Resource Management Services businesses (Electricity and Water outside North America and worldwide Gas businesses). This charge included the write-off of goodwill ($139 million) and cumulative translation adjustment ($79 million). In March 2001, a charge of $25 million ($0.04 per share – diluted) for in-process research and development related to the Bull CP8 acquisition. The above 2001 pretax amounts are recorded: an aggregated $119 million charge in Cost of goods sold and services, a $25 million charge in Research & engineering and a $10 million credit in Minority interest. An analysis of the December 2002 pretax severance and facility charges is as follows: ($ stated in millions)
Severance
Amount People FacilitiesAmount
Charges $ 94.5 3,492 $ 42.8Paid in December 2002 32.9 1,643 6.6
Balance December 31, 2002 61.6 1,849 36.2Paid/reversed in 2003 60.6 1,841 25.1
Balance December 31, 2003 $ 1.0 8 $ 11.1
At December 31, 2003, the Severance balance of $1.0 million is classified as Accounts Payable and Accrued Liabilities and the Facilities balance of $11.1 million is classified in Liabilities held for sale on the Consolidated Balance Sheet. The December 2001 charge included severance costs of $41 million (775 people) which have been paid. 5. Acquisitions Acquisition of Sema plc On April 6, 2001, the offer for the shares of Sema plc was declared unconditional in all respects. The aggregate consideration for the acquisition of 100% of the issued Sema shares was $5.15 billion (including expenses of the transaction) which was financed from existing cash resources and borrowings under a $3 billion credit facility. 49 / SLB 2003 FORM 10-K
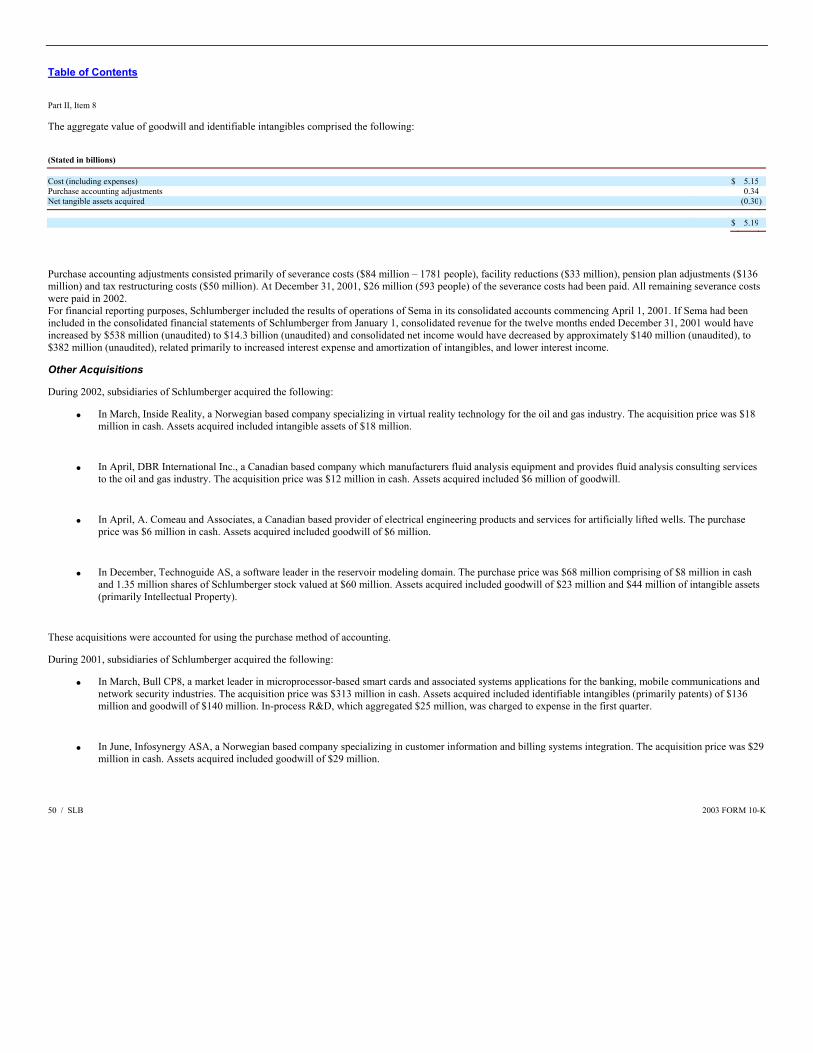
Table of Contents Part II, Item 8 The aggregate value of goodwill and identifiable intangibles comprised the following: (Stated in billions)
Cost (including expenses) $ 5.15 Purchase accounting adjustments 0.34 Net tangible assets acquired (0.30)
$ 5.19
Purchase accounting adjustments consisted primarily of severance costs ($84 million – 1781 people), facility reductions ($33 million), pension plan adjustments ($136 million) and tax restructuring costs ($50 million). At December 31, 2001, $26 million (593 people) of the severance costs had been paid. All remaining severance costs were paid in 2002. For financial reporting purposes, Schlumberger included the results of operations of Sema in its consolidated accounts commencing April 1, 2001. If Sema had been included in the consolidated financial statements of Schlumberger from January 1, consolidated revenue for the twelve months ended December 31, 2001 would have increased by $538 million (unaudited) to $14.3 billion (unaudited) and consolidated net income would have decreased by approximately $140 million (unaudited), to $382 million (unaudited), related primarily to increased interest expense and amortization of intangibles, and lower interest income. Other Acquisitions During 2002, subsidiaries of Schlumberger acquired the following:
• In March, Inside Reality, a Norwegian based company specializing in virtual reality technology for the oil and gas industry. The acquisition price was $18 million in cash. Assets acquired included intangible assets of $18 million.
• In April, DBR International Inc., a Canadian based company which manufacturers fluid analysis equipment and provides fluid analysis consulting services to the oil and gas industry. The acquisition price was $12 million in cash. Assets acquired included $6 million of goodwill.
• In April, A. Comeau and Associates, a Canadian based provider of electrical engineering products and services for artificially lifted wells. The purchase price was $6 million in cash. Assets acquired included goodwill of $6 million.
• In December, Technoguide AS, a software leader in the reservoir modeling domain. The purchase price was $68 million comprising of $8 million in cash
and 1.35 million shares of Schlumberger stock valued at $60 million. Assets acquired included goodwill of $23 million and $44 million of intangible assets (primarily Intellectual Property).
These acquisitions were accounted for using the purchase method of accounting. During 2001, subsidiaries of Schlumberger acquired the following:
• In March, Bull CP8, a market leader in microprocessor-based smart cards and associated systems applications for the banking, mobile communications and
network security industries. The acquisition price was $313 million in cash. Assets acquired included identifiable intangibles (primarily patents) of $136 million and goodwill of $140 million. In-process R&D, which aggregated $25 million, was charged to expense in the first quarter.
• In June, Infosynergy ASA, a Norwegian based company specializing in customer information and billing systems integration. The acquisition price was $29 million in cash. Assets acquired included goodwill of $29 million.
50 / SLB 2003 FORM 10-K
Table of Contents Part II, Item 8
• In September, Sensor Highways Limited, a UK based market leader in the design, manufacture and deployment of a new generation of fiber optic sensors
specializing in real-time data solutions to the oil and gas, process and power distribution industries. The acquisition price was $100 million, consisting of $70 million in cash and $30 million in notes. Assets acquired included identifiable intangibles of $48 million and goodwill of $50 million.
• In September, Phoenix Petroleum Services, a UK based leader in providing tools, technologies and techniques for optimizing production in artificially lifted wells, particularly those using submersible pumps. The acquisition price was $33 million in cash. Assets acquired included goodwill of $26 million.
These acquisitions were accounted for using the purchase method of accounting. Pro forma results pertaining to the above acquisitions are not presented as the impact was not significant. 6. Sale of SchlumbergerSema to Atos Origin On September 22, 2003, Schlumberger announced the signing of an agreement with Atos Origin for the sale of the SchlumbergerSema business. On January 29, 2004 the sale transaction was completed. As consideration for the transaction, Schlumberger received €443 million ($550 million) in cash which included a working capital adjustment, and 19.3 million shares of common stock of Atos with a value of €1.02 billion ($1.275 billion), which represented approximately 29% of the outstanding common shares of Atos Origin after the transaction was completed. Schlumberger expects the result of the sale will be a gain which will be recorded as part of Discontinued Operations in the first quarter of 2004. On February 2, 2004 Schlumberger sold 9.6 million of the Atos Origin shares for a net consideration of €500 million ($625 million). As a result of this sale, Schlumberger’s investment was reduced to approximately 15% of the outstanding common shares of Atos Origin. Schlumberger will account for the remaining investment in Atos Origin on the cost method. 7. Investments in Affiliated Companies Schlumberger and Smith International Inc. operate a drilling fluids joint venture of which Schlumberger owns a 40% interest and records income using the equity method of accounting. Schlumberger’s investment on December 31, 2003 and 2002 was $657 million and $592 million, respectively. Schlumberger’s equity income from this joint venture in 2003 was $52 million, $48 million in 2002 and $51 million in 2001. 8. Investments The Consolidated Balance Sheet reflects the Schlumberger investment portfolio separated between current and long term, based on maturity. Under normal circumstances it is the intent of Schlumberger to hold the investments until maturity, with the exception of investments which are considered trading (December 31, 2003 – $151 million; December 31, 2002 – $0). Fixed income investments of $223 million mature in 2005. On December 31, 2003, there were no interest rate swap arrangements outstanding related to investments. Interest rate swap arrangements had no material effect on consolidated interest income. 9. Securitization In September 2000, a wholly owned subsidiary of Schlumberger entered into an agreement to sell, on an ongoing basis, up to $220 million of an undivided interest in its accounts receivable, and subsequently amended up to $250 million. The amount of receivables sold under this agreement totaled $224 million at December 31, 2003 and $155 million at December 31, 2002. Unless extended by amendment, the agreement expires in September 2004. 51 / SLB 2003 FORM 10-K
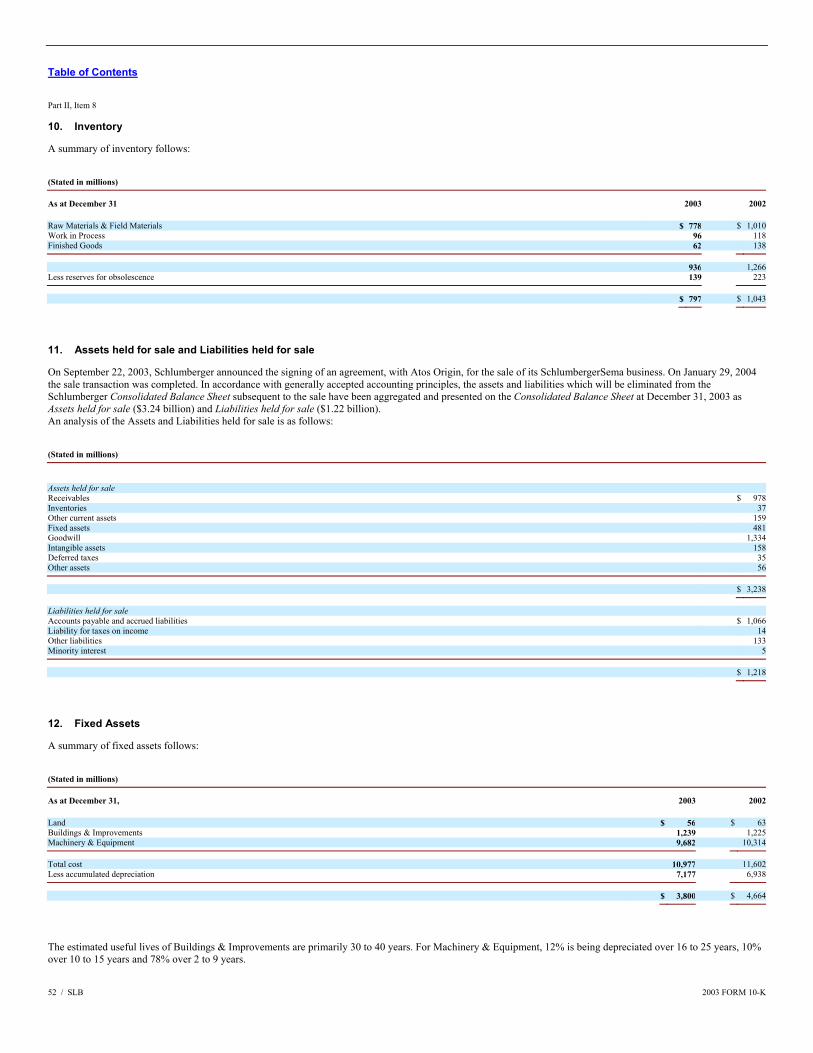
Table of Contents Part II, Item 8 10. Inventory A summary of inventory follows: (Stated in millions)
As at December 31 2003 2002 Raw Materials & Field Materials $ 778 $ 1,010Work in Process 96 118Finished Goods 62 138
936 1,266Less reserves for obsolescence 139 223
$ 797 $ 1,043
11. Assets held for sale and Liabilities held for sale On September 22, 2003, Schlumberger announced the signing of an agreement, with Atos Origin, for the sale of its SchlumbergerSema business. On January 29, 2004 the sale transaction was completed. In accordance with generally accepted accounting principles, the assets and liabilities which will be eliminated from the Schlumberger Consolidated Balance Sheet subsequent to the sale have been aggregated and presented on the Consolidated Balance Sheet at December 31, 2003 as Assets held for sale ($3.24 billion) and Liabilities held for sale ($1.22 billion). An analysis of the Assets and Liabilities held for sale is as follows: (Stated in millions)
Assets held for sale Receivables $ 978Inventories 37Other current assets 159Fixed assets 481Goodwill 1,334Intangible assets 158Deferred taxes 35Other assets 56
$ 3,238
Liabilities held for sale Accounts payable and accrued liabilities $ 1,066Liability for taxes on income 14Other liabilities 133Minority interest 5
$ 1,218
12. Fixed Assets A summary of fixed assets follows: (Stated in millions)
As at December 31, 2003 2002 Land $ 56 $ 63Buildings & Improvements 1,239 1,225Machinery & Equipment 9,682 10,314
Total cost 10,977 11,602Less accumulated depreciation 7,177 6,938
$ 3,800 $ 4,664
The estimated useful lives of Buildings & Improvements are primarily 30 to 40 years. For Machinery & Equipment, 12% is being depreciated over 16 to 25 years, 10% over 10 to 15 years and 78% over 2 to 9 years. 52 / SLB 2003 FORM 10-K
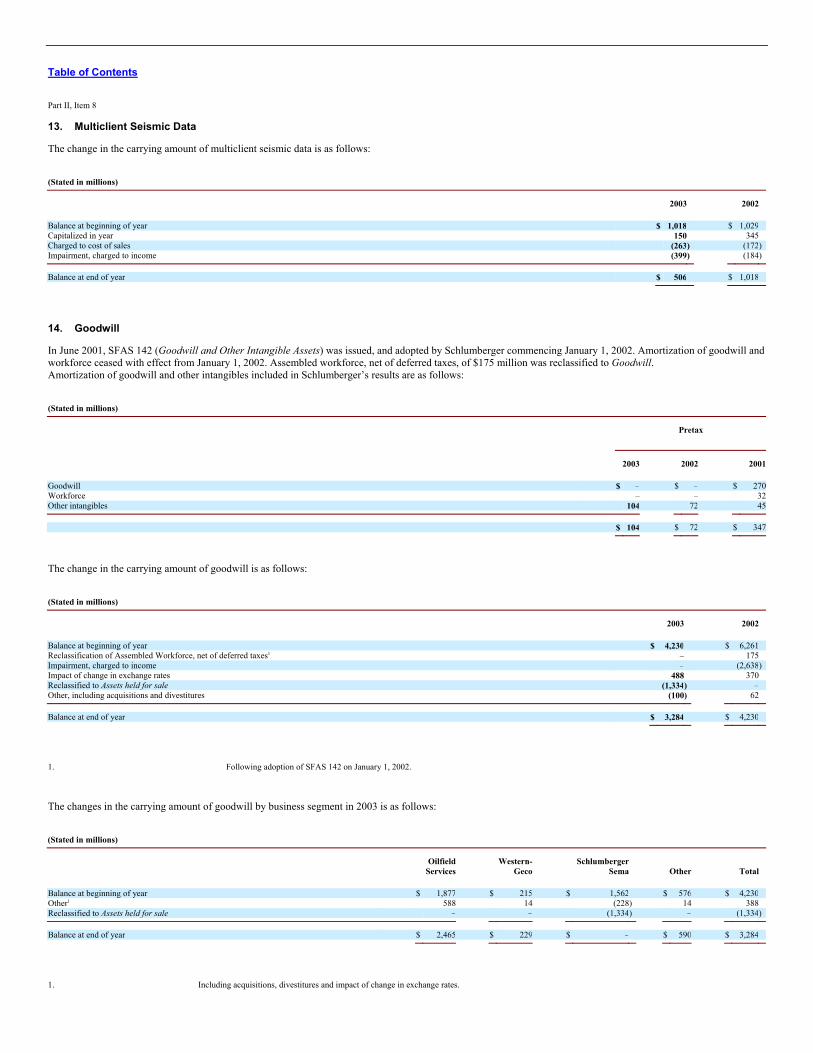
Table of Contents Part II, Item 8 13. Multiclient Seismic Data The change in the carrying amount of multiclient seismic data is as follows: (Stated in millions)
2003 2002 Balance at beginning of year $ 1,018 $ 1,029 Capitalized in year 150 345 Charged to cost of sales (263) (172) Impairment, charged to income (399) (184)
Balance at end of year $ 506 $ 1,018
14. Goodwill In June 2001, SFAS 142 (Goodwill and Other Intangible Assets) was issued, and adopted by Schlumberger commencing January 1, 2002. Amortization of goodwill and workforce ceased with effect from January 1, 2002. Assembled workforce, net of deferred taxes, of $175 million was reclassified to Goodwill. Amortization of goodwill and other intangibles included in Schlumberger’s results are as follows: (Stated in millions)
Pretax
2003 2002 2001 Goodwill $ – $ – $ 270Workforce – – 32Other intangibles 104 72 45
$ 104 $ 72 $ 347
The change in the carrying amount of goodwill is as follows: (Stated in millions)
2003 2002 Balance at beginning of year $ 4,230 $ 6,261 Reclassification of Assembled Workforce, net of deferred taxes1 – 175 Impairment, charged to income – (2,638) Impact of change in exchange rates 488 370 Reclassified to Assets held for sale (1,334) – Other, including acquisitions and divestitures (100) 62
Balance at end of year $ 3,284 $ 4,230
1. Following adoption of SFAS 142 on January 1, 2002.
The changes in the carrying amount of goodwill by business segment in 2003 is as follows: (Stated in millions)
Oilfield
Services Western-
Geco Schlumberger
Sema Other Total Balance at beginning of year $ 1,877 $ 215 $ 1,562 $ 576 $ 4,230 Other1 588 14 (228) 14 388 Reclassified to Assets held for sale – – (1,334) – (1,334)
Balance at end of year $ 2,465 $ 229 $ – $ 590 $ 3,284
1. Including acquisitions, divestitures and impact of change in exchange rates.

53 / SLB 2003 FORM 10-K
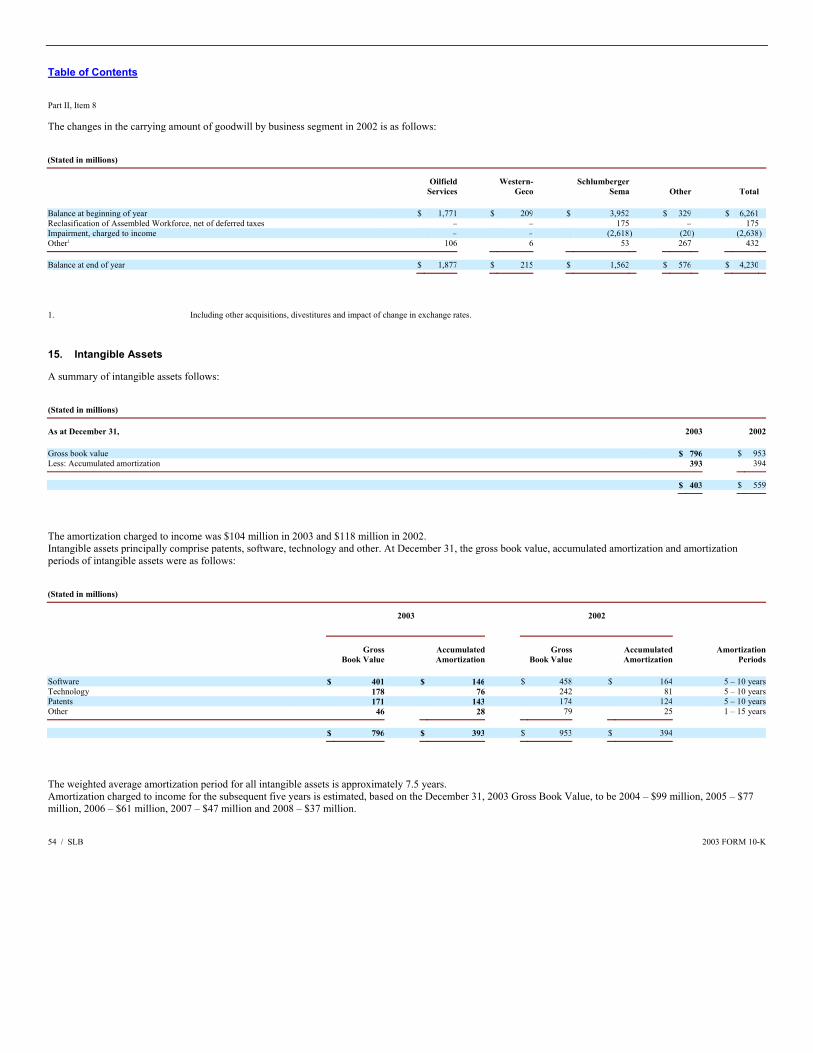
Table of Contents Part II, Item 8 The changes in the carrying amount of goodwill by business segment in 2002 is as follows: (Stated in millions)
Oilfield
Services Western-
Geco Schlumberger
Sema Other Total Balance at beginning of year $ 1,771 $ 209 $ 3,952 $ 329 $ 6,261 Reclasification of Assembled Workforce, net of deferred taxes – – 175 – 175 Impairment, charged to income – – (2,618 ) (20) (2,638)Other1 106 6 53 267 432
Balance at end of year $ 1,877 $ 215 $ 1,562 $ 576 $ 4,230
1. Including other acquisitions, divestitures and impact of change in exchange rates.
15. Intangible Assets A summary of intangible assets follows: (Stated in millions)
As at December 31, 2003 2002 Gross book value $ 796 $ 953Less: Accumulated amortization 393 394
$ 403 $ 559
The amortization charged to income was $104 million in 2003 and $118 million in 2002. Intangible assets principally comprise patents, software, technology and other. At December 31, the gross book value, accumulated amortization and amortization periods of intangible assets were as follows: (Stated in millions)
2003
2002
Gross
Book Value AccumulatedAmortization
GrossBook Value
AccumulatedAmortization
AmortizationPeriods
Software $ 401 $ 146 $ 458 $ 164 5 – 10 yearsTechnology 178 76 242 81 5 – 10 yearsPatents 171 143 174 124 5 – 10 yearsOther 46 28 79 25 1 – 15 years
$ 796 $ 393 $ 953 $ 394
The weighted average amortization period for all intangible assets is approximately 7.5 years. Amortization charged to income for the subsequent five years is estimated, based on the December 31, 2003 Gross Book Value, to be 2004 – $99 million, 2005 – $77 million, 2006 – $61 million, 2007 – $47 million and 2008 – $37 million. 54 / SLB 2003 FORM 10-K
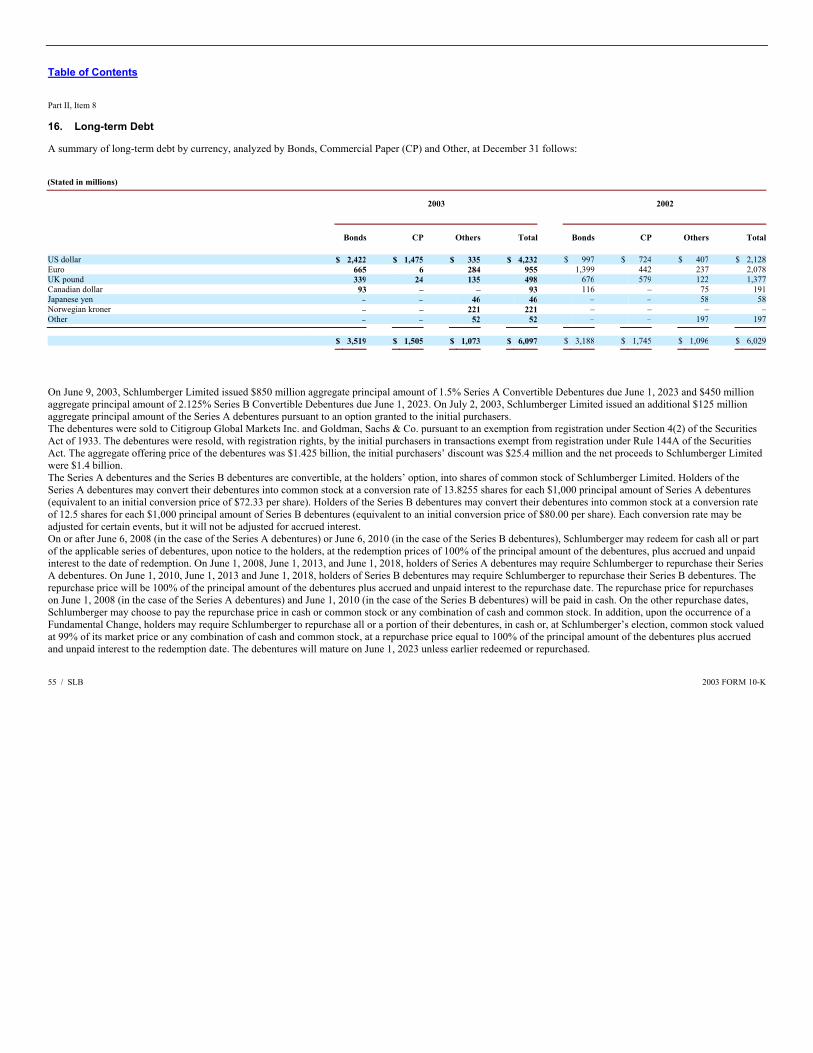
Table of Contents Part II, Item 8 16. Long-term Debt A summary of long-term debt by currency, analyzed by Bonds, Commercial Paper (CP) and Other, at December 31 follows: (Stated in millions)
2003
2002
Bonds CP Others Total Bonds CP Others Total US dollar $ 2,422 $ 1,475 $ 335 $ 4,232 $ 997 $ 724 $ 407 $ 2,128Euro 665 6 284 955 1,399 442 237 2,078UK pound 339 24 135 498 676 579 122 1,377Canadian dollar 93 – – 93 116 – 75 191Japanese yen – – 46 46 – – 58 58Norwegian kroner – – 221 221 – – – –Other – – 52 52 – – 197 197
$ 3,519 $ 1,505 $ 1,073 $ 6,097 $ 3,188 $ 1,745 $ 1,096 $ 6,029
On June 9, 2003, Schlumberger Limited issued $850 million aggregate principal amount of 1.5% Series A Convertible Debentures due June 1, 2023 and $450 million aggregate principal amount of 2.125% Series B Convertible Debentures due June 1, 2023. On July 2, 2003, Schlumberger Limited issued an additional $125 million aggregate principal amount of the Series A debentures pursuant to an option granted to the initial purchasers. The debentures were sold to Citigroup Global Markets Inc. and Goldman, Sachs & Co. pursuant to an exemption from registration under Section 4(2) of the Securities Act of 1933. The debentures were resold, with registration rights, by the initial purchasers in transactions exempt from registration under Rule 144A of the Securities Act. The aggregate offering price of the debentures was $1.425 billion, the initial purchasers’ discount was $25.4 million and the net proceeds to Schlumberger Limited were $1.4 billion. The Series A debentures and the Series B debentures are convertible, at the holders’ option, into shares of common stock of Schlumberger Limited. Holders of the Series A debentures may convert their debentures into common stock at a conversion rate of 13.8255 shares for each $1,000 principal amount of Series A debentures (equivalent to an initial conversion price of $72.33 per share). Holders of the Series B debentures may convert their debentures into common stock at a conversion rate of 12.5 shares for each $1,000 principal amount of Series B debentures (equivalent to an initial conversion price of $80.00 per share). Each conversion rate may be adjusted for certain events, but it will not be adjusted for accrued interest. On or after June 6, 2008 (in the case of the Series A debentures) or June 6, 2010 (in the case of the Series B debentures), Schlumberger may redeem for cash all or part of the applicable series of debentures, upon notice to the holders, at the redemption prices of 100% of the principal amount of the debentures, plus accrued and unpaid interest to the date of redemption. On June 1, 2008, June 1, 2013, and June 1, 2018, holders of Series A debentures may require Schlumberger to repurchase their Series A debentures. On June 1, 2010, June 1, 2013 and June 1, 2018, holders of Series B debentures may require Schlumberger to repurchase their Series B debentures. The repurchase price will be 100% of the principal amount of the debentures plus accrued and unpaid interest to the repurchase date. The repurchase price for repurchases on June 1, 2008 (in the case of the Series A debentures) and June 1, 2010 (in the case of the Series B debentures) will be paid in cash. On the other repurchase dates, Schlumberger may choose to pay the repurchase price in cash or common stock or any combination of cash and common stock. In addition, upon the occurrence of a Fundamental Change, holders may require Schlumberger to repurchase all or a portion of their debentures, in cash or, at Schlumberger’s election, common stock valued at 99% of its market price or any combination of cash and common stock, at a repurchase price equal to 100% of the principal amount of the debentures plus accrued and unpaid interest to the redemption date. The debentures will mature on June 1, 2023 unless earlier redeemed or repurchased. 55 / SLB 2003 FORM 10-K
Table of Contents Part II, Item 8 Between June 12 and July 22, 2003, certain subsidiaries of Schlumberger launched and concluded a tender offer on three of its outstanding European bonds. The companies bought back $1.3 billion of principal of these bonds for a total cost of $1.5 billion, which includes the premium, and issuing and tender costs. The total charge on the tender was $168 million. Commercial paper borrowings are classified as long-term debt to the extent of their backup by available and unused committed facilities maturing in more than one-year and the intent to maintain these obligations for longer than one year. Long-term debt on December 31, 2003, is due as follows $552 million in 2005, $314 million in 2006, $1,755 million in 2007, $1,394 million in 2008 and $2,082 million thereafter. On December 31, 2003, interest rate swap arrangements outstanding were: pay fixed/receive floating on US dollar debt of $500 million; pay fixed/receive floating on Japanese yen debt of $37 million. These arrangements mature at various dates to December 2009. Interest rate swap arrangements increased consolidated interest expense in 2003 by $30 million. 17. Lines of Credit On December 31, 2003, wholly owned subsidiaries of Schlumberger had separate lines of credit agreements aggregating $6.7 billion with commercial banks, of which $6.5 billion was committed and $2.6 billion was available and unused. It included $3.7 billion of committed facilities, which support borrowings under commercial paper programs in the United States and Europe, maturing in January 2007. On December 31, 2003 a principal subsidiary of Schlumberger in the United States canceled its $500 million 364-day backstop facility. Interest rates and other terms of borrowing under these lines of credit vary from country to country. 18. Derivative Instruments and Hedging Activities Schlumberger uses derivative instruments such as interest rate swaps, currency swaps, forward currency contracts and foreign currency options. Forward currency contracts provide a hedge against currency fluctuations on assets/liabilities denominated in other than a functional currency. Options are usually entered into as a hedge against currency variations on firm commitments generally involving the construction of long-lived assets. Schlumberger maintains a foreign-currency risk management strategy that uses derivative instruments to protect its interests from unanticipated fluctuations in earnings and cash flows caused by volatility in currency exchange rates. Movements in foreign currency exchange rates pose a risk to Schlumberger’s operations as exchange rate changes may affect profitability and cash flow. Schlumberger uses foreign currency forward exchange contracts, swaps and options. Schlumberger also maintains an interest rate risk management strategy that uses fixed rate debt and derivatives to minimize significant, unanticipated earnings fluctuations caused by interest rate volatility. Schlumberger’s specific goals are (1) to manage interest rate sensitivity by modifying the repricing or maturity characteristics of certain of its debt and (2) to lower (where possible) the cost of borrowed funds. By using derivative financial instruments to hedge exposure to changes in exchange rates and interest rates, Schlumberger exposes itself to credit risk and market risk. Schlumberger minimizes the credit risk by entering into transactions with high-quality counterparties, limiting the exposure to each counterparty and monitoring the financial condition of its counterparties. Market risk is managed through the setting and monitoring of parameters that limit the types and degree of market risk which are acceptable. At December 31, 2003, Schlumberger recognized a net $23 million charge in Stockholders’ Equity relating to derivative instruments and hedging activities. This charge was primarily due to the change in the fair market value of Schlumberger’s US interest rate swaps as a result of declining interest rates. 56 / SLB 2003 FORM 10-K
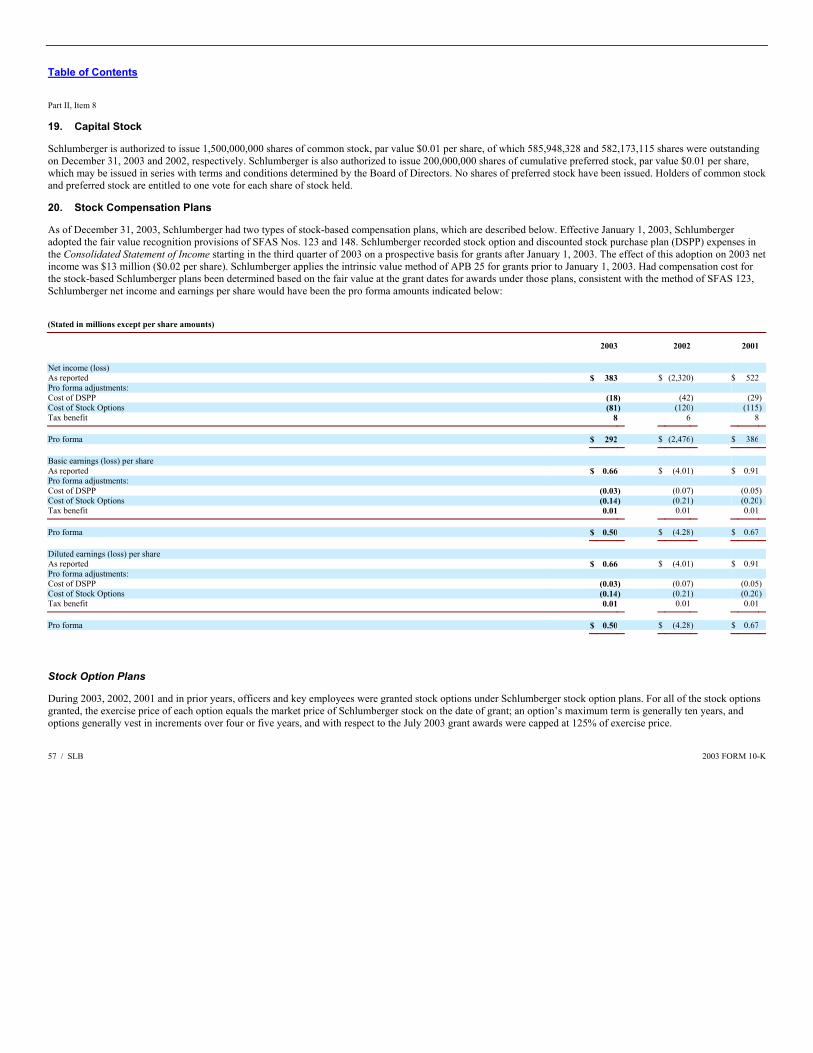
Table of Contents Part II, Item 8 19. Capital Stock Schlumberger is authorized to issue 1,500,000,000 shares of common stock, par value $0.01 per share, of which 585,948,328 and 582,173,115 shares were outstanding on December 31, 2003 and 2002, respectively. Schlumberger is also authorized to issue 200,000,000 shares of cumulative preferred stock, par value $0.01 per share, which may be issued in series with terms and conditions determined by the Board of Directors. No shares of preferred stock have been issued. Holders of common stock and preferred stock are entitled to one vote for each share of stock held. 20. Stock Compensation Plans As of December 31, 2003, Schlumberger had two types of stock-based compensation plans, which are described below. Effective January 1, 2003, Schlumberger adopted the fair value recognition provisions of SFAS Nos. 123 and 148. Schlumberger recorded stock option and discounted stock purchase plan (DSPP) expenses in the Consolidated Statement of Income starting in the third quarter of 2003 on a prospective basis for grants after January 1, 2003. The effect of this adoption on 2003 net income was $13 million ($0.02 per share). Schlumberger applies the intrinsic value method of APB 25 for grants prior to January 1, 2003. Had compensation cost for the stock-based Schlumberger plans been determined based on the fair value at the grant dates for awards under those plans, consistent with the method of SFAS 123, Schlumberger net income and earnings per share would have been the pro forma amounts indicated below: (Stated in millions except per share amounts)
2003 2002 2001 Net income (loss) As reported $ 383 $ (2,320) $ 522 Pro forma adjustments: Cost of DSPP (18) (42) (29)Cost of Stock Options (81) (120) (115)Tax benefit 8 6 8
Pro forma $ 292 $ (2,476) $ 386
Basic earnings (loss) per share As reported $ 0.66 $ (4.01) $ 0.91 Pro forma adjustments: Cost of DSPP (0.03) (0.07) (0.05)Cost of Stock Options (0.14) (0.21) (0.20)Tax benefit 0.01 0.01 0.01
Pro forma $ 0.50 $ (4.28) $ 0.67
Diluted earnings (loss) per share As reported $ 0.66 $ (4.01) $ 0.91 Pro forma adjustments: Cost of DSPP (0.03) (0.07) (0.05)Cost of Stock Options (0.14) (0.21) (0.20)Tax benefit 0.01 0.01 0.01
Pro forma $ 0.50 $ (4.28) $ 0.67
Stock Option Plans During 2003, 2002, 2001 and in prior years, officers and key employees were granted stock options under Schlumberger stock option plans. For all of the stock options granted, the exercise price of each option equals the market price of Schlumberger stock on the date of grant; an option’s maximum term is generally ten years, and options generally vest in increments over four or five years, and with respect to the July 2003 grant awards were capped at 125% of exercise price. 57 / SLB 2003 FORM 10-K
Table of Contents Part II, Item 8 As required by SFAS 123, the fair value of each grant is estimated on the date of grant using the multiple option Black-Scholes option-pricing model with the following weighted-average assumptions used for 2003, 2002 and 2001: dividend of $0.75; expected volatility of 34%-37% for 2003 grants, 32%-36% for 2002 grants and 32-35% for 2001 grants; risk-free interest rates for the 2003 grants of 2.83%-3.51% for officers and all other employees; risk-free interest rates for the 2002 grants of 4.34%-5.25% for officers and 3.04%-4.73% for the 2002 grants to all other employees; risk-free interest rates for the 2001 grants of 4.91% for officers and 3.87%-5.01% for the 2001 grants to all other employees; and expected option lives of 4.71 years for officers and other employees for 2003 grants, expected option lives of 6.6 years for officers and 5.07 years for other employees for 2002 grants, expected option lives of 5.51 years for officers and 5.02 years for other employees for 2001 grants. A summary of the status of the Schlumberger stock option plans as of December 31, 2003, 2002 and 2001, and changes during the years ending on those dates is presented below:
2003
2002
2001
Fixed Options Shares
Weighted-averageexercise
price Shares
Weighted-averageexercise
price Shares
Weighted-averageexercise
price Outstanding at beginning of year 36,869,684 $ 57.03 32,836,340 $ 55.80 31,208,321 $ 54.43Granted 3,460,150 $ 45.04 7,314,617 $ 55.14 4,110,468 $ 61.55Exercised (1,319,174) $ 30.68 (2,296,593) $ 30.02 (1,444,588) $ 31.88Forfeited (1,454,113) $ 66.92 (984,680) $ 66.69 (1,037,861) $ 71.27
Outstanding at year-end 37,556,547 $ 56.50 36,869,684 $ 57.03 32,836,340 $ 55.80
Options exercisable at year-end 23,460,758 21,142,473 19,724,680 Weighted-average fair value of options granted during the year $ 10.30 $ 20.22 $ 21.51
The following table summarizes information concerning currently outstanding and exercisable options by five ranges of exercise prices on December 31, 2003:
Options Outstanding
Options Exercisable
Range of exercise prices
Numberoutstanding
as of 12/31/03
Weighted-average
remainingcontractual life
Weighted-averageexercise
price
Numberexercisable
as of 12/31/03
Weighted-averageexercise
price $ 3.831 – $22.073 86,503 1.83 $ 19.655 86,503 $ 19.655$24.142 – $30.710 4,426,622 1.39 $ 27.624 4,426,622 $ 27.624$30.795 – $44.843 4,637,754 3.94 $ 39.620 3,671,853 $ 39.197$46.020 – $65.330 18,470,275 7.39 $ 54.843 7,326,837 $ 55.694$71.315 – $82.348 9,935,393 5.28 $ 80.636 7,948,943 $ 80.659
37,556,547 5.68 $ 56.497 23,460,758 $ 56.141
Employee Stock Purchase Plan Under the Schlumberger Discounted Stock Purchase Plan, Schlumberger is authorized to issue up to 22,012,245 shares of common stock to its employees. Under the terms of the Plan, employees can choose to have up to 10% of their annual earnings withheld to purchase Schlumberger common stock. Effective July 1, 2003 the purchase price of the stock was 92.5% of the lower of its beginning or end of the Plan year market price at six month intervals. Prior to July 1, 2003, the purchase price was 85% at one year intervals. Under the Plan, Schlumberger sold 2,464,088, 2,677,842 and 1,752,833 shares to employees in 2003, 2002 and 2001, respectively. Pro forma compensation cost has been computed for the fair value of the employees’ purchase rights, which was estimated using the Black-Scholes model with the following assumptions for 2003, 2002 and 2001: Dividend of $0.75; expected volatility of 28% for 2003, 34% for 2002 and 36% for 2001; and risk-free interest rates of 0.75% for 2003, 1.74% for 2002, 3.03% for 2001. The weighted-average fair value of those purchase rights granted in 2003, 2002 and 2001, was $7.910, $13.324 and $15.540, respectively. 58 / SLB 2003 FORM 10-K
Table of Contents Part II, Item 8 21. Income Tax Expense Schlumberger and its subsidiaries operate in more than 100 taxing jurisdictions where statutory tax rates generally vary from 0% to 50%. In 2003, the pretax loss in the US included the WesternGeco multiclient impairment charge of $283 million and a net pretax charge of $32 million related to Hanover Compressor. In 2002, pretax book income in the US included gains from a business divestiture aggregating approximately $143 million. Pretax book income from continuing operations subject to US and non-US income taxes for each of the three years ended December 31, was as follows: (Stated in millions)
2003 2002 2001 United States $ (177) $ 149 $ 714Outside United States 745 (2,376) 373
Pretax income $ 568 $ (2,227) $ 1,087
Schlumberger had net deferred tax assets at December 31, 2003 of $632 million including a valuation allowance of $325 million relating to a certain European net operating loss, and $583 million at December 31, 2002. Significant components of net deferred tax assets at December 31, 2003 included postretirement and other long-term benefits ($213 million), current employee benefits ($183 million), fixed assets, inventory and other ($194 million) and net operating losses ($367 million less a partial valuation allowance of $325 million). At December 31, 2002, it included postretirement and other long-term benefits ($200 million), current employee benefits ($225 million), fixed assets, inventory and other ($123 million) and net operating losses ($182 million less a valuation allowance of $147 million). The components of consolidated income tax expense from continuing operations were as follows: (Stated in millions)
2003 2002 2001 Current: United States – Federal $ 96 $ 25 $ 342 United States – State 19 1 43 Outside United States 191 182 179
$ 306 $ 208 $ 564
Deferred: United States – Federal $ (128) $ 28 $ 5 United States – State (22) 2 3 Outside United States (24) (103) (8) Valuation allowance 77 147 –
$ (97) $ 74 $ –
Consolidated taxes on income $ 209 $ 282 $ 564
Schlumberger reported several charges/credits in continuing operations in each of the three years. These are more fully described in the note Charges – Continuing Operations on page 48 of this Report. A reconciliation of the US statutory federal tax rate (35%) to the consolidated effective tax rate is: 2003 2002 2001 US federal statutory (benefit) rate 35 (35) 35 US state income taxes – – 2 Non US income taxed at different rates (16 ) (6) (5)Valuation allowance 6 7 – Charges and credits 12 47 20
Effective income tax rate 37 13 52
Schlumberger’s effective tax rate, excluding charges and credits, was 25%, 26% and 33% in 2003, 2002 and 2001 respectively. 59 / SLB 2003 FORM 10-K
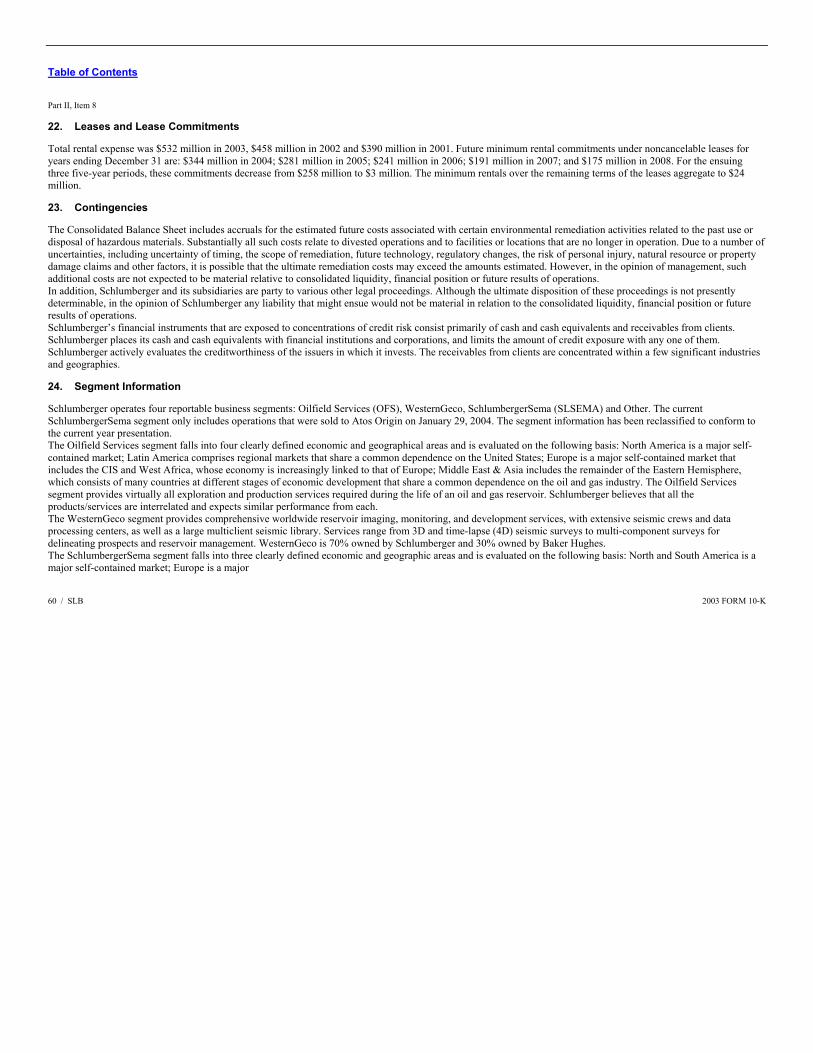
Table of Contents Part II, Item 8 22. Leases and Lease Commitments Total rental expense was $532 million in 2003, $458 million in 2002 and $390 million in 2001. Future minimum rental commitments under noncancelable leases for years ending December 31 are: $344 million in 2004; $281 million in 2005; $241 million in 2006; $191 million in 2007; and $175 million in 2008. For the ensuing three five-year periods, these commitments decrease from $258 million to $3 million. The minimum rentals over the remaining terms of the leases aggregate to $24 million. 23. Contingencies The Consolidated Balance Sheet includes accruals for the estimated future costs associated with certain environmental remediation activities related to the past use or disposal of hazardous materials. Substantially all such costs relate to divested operations and to facilities or locations that are no longer in operation. Due to a number of uncertainties, including uncertainty of timing, the scope of remediation, future technology, regulatory changes, the risk of personal injury, natural resource or property damage claims and other factors, it is possible that the ultimate remediation costs may exceed the amounts estimated. However, in the opinion of management, such additional costs are not expected to be material relative to consolidated liquidity, financial position or future results of operations. In addition, Schlumberger and its subsidiaries are party to various other legal proceedings. Although the ultimate disposition of these proceedings is not presently determinable, in the opinion of Schlumberger any liability that might ensue would not be material in relation to the consolidated liquidity, financial position or future results of operations. Schlumberger’s financial instruments that are exposed to concentrations of credit risk consist primarily of cash and cash equivalents and receivables from clients. Schlumberger places its cash and cash equivalents with financial institutions and corporations, and limits the amount of credit exposure with any one of them. Schlumberger actively evaluates the creditworthiness of the issuers in which it invests. The receivables from clients are concentrated within a few significant industries and geographies. 24. Segment Information Schlumberger operates four reportable business segments: Oilfield Services (OFS), WesternGeco, SchlumbergerSema (SLSEMA) and Other. The current SchlumbergerSema segment only includes operations that were sold to Atos Origin on January 29, 2004. The segment information has been reclassified to conform to the current year presentation. The Oilfield Services segment falls into four clearly defined economic and geographical areas and is evaluated on the following basis: North America is a major self-contained market; Latin America comprises regional markets that share a common dependence on the United States; Europe is a major self-contained market that includes the CIS and West Africa, whose economy is increasingly linked to that of Europe; Middle East & Asia includes the remainder of the Eastern Hemisphere, which consists of many countries at different stages of economic development that share a common dependence on the oil and gas industry. The Oilfield Services segment provides virtually all exploration and production services required during the life of an oil and gas reservoir. Schlumberger believes that all the products/services are interrelated and expects similar performance from each. The WesternGeco segment provides comprehensive worldwide reservoir imaging, monitoring, and development services, with extensive seismic crews and data processing centers, as well as a large multiclient seismic library. Services range from 3D and time-lapse (4D) seismic surveys to multi-component surveys for delineating prospects and reservoir management. WesternGeco is 70% owned by Schlumberger and 30% owned by Baker Hughes. The SchlumbergerSema segment falls into three clearly defined economic and geographic areas and is evaluated on the following basis: North and South America is a major self-contained market; Europe is a major 60 / SLB 2003 FORM 10-K
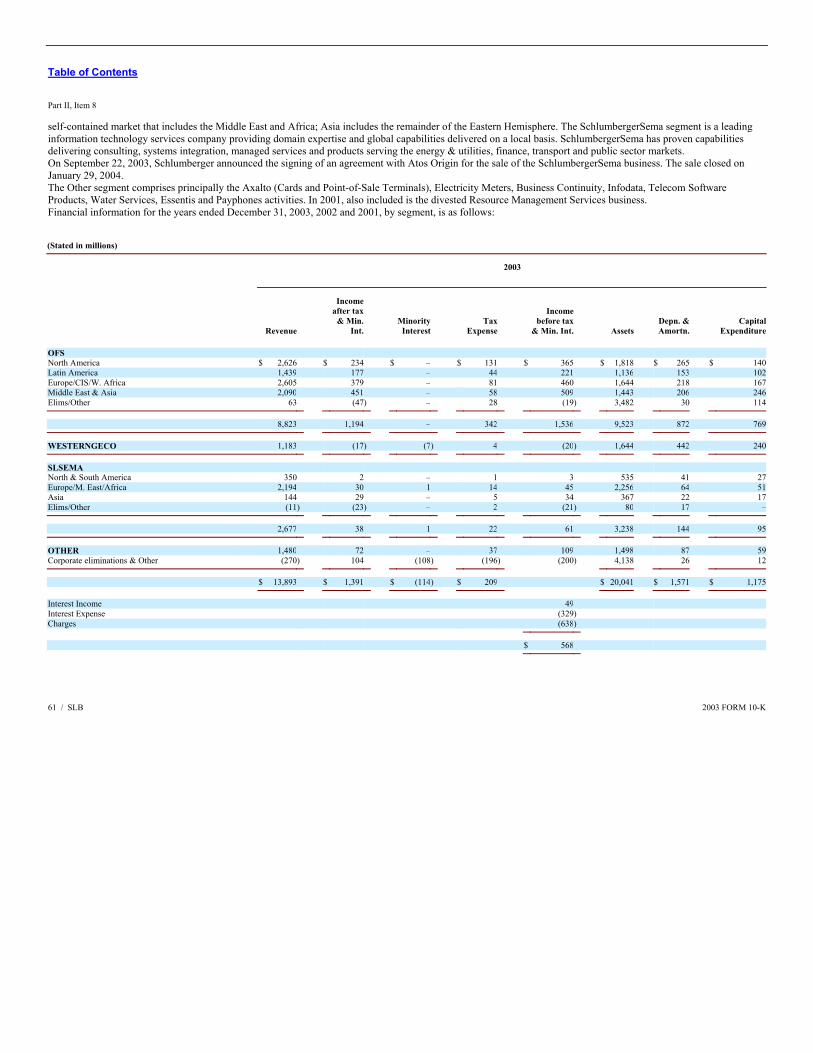
Table of Contents Part II, Item 8 self-contained market that includes the Middle East and Africa; Asia includes the remainder of the Eastern Hemisphere. The SchlumbergerSema segment is a leading information technology services company providing domain expertise and global capabilities delivered on a local basis. SchlumbergerSema has proven capabilities delivering consulting, systems integration, managed services and products serving the energy & utilities, finance, transport and public sector markets. On September 22, 2003, Schlumberger announced the signing of an agreement with Atos Origin for the sale of the SchlumbergerSema business. The sale closed on January 29, 2004. The Other segment comprises principally the Axalto (Cards and Point-of-Sale Terminals), Electricity Meters, Business Continuity, Infodata, Telecom Software Products, Water Services, Essentis and Payphones activities. In 2001, also included is the divested Resource Management Services business. Financial information for the years ended December 31, 2003, 2002 and 2001, by segment, is as follows: (Stated in millions)
2003
Revenue
Incomeafter tax
& Min.Int.
MinorityInterest
TaxExpense
Incomebefore tax
& Min. Int. Assets Depn. &Amortn.
CapitalExpenditure
OFS North America $ 2,626 $ 234 $ – $ 131 $ 365 $ 1,818 $ 265 $ 140Latin America 1,439 177 – 44 221 1,136 153 102Europe/CIS/W. Africa 2,605 379 – 81 460 1,644 218 167Middle East & Asia 2,090 451 – 58 509 1,443 206 246Elims/Other 63 (47) – 28 (19) 3,482 30 114
8,823 1,194 – 342 1,536 9,523 872 769
WESTERNGECO 1,183 (17) (7) 4 (20) 1,644 442 240
SLSEMA North & South America 350 2 – 1 3 535 41 27Europe/M. East/Africa 2,194 30 1 14 45 2,256 64 51Asia 144 29 – 5 34 367 22 17Elims/Other (11) (23) – 2 (21) 80 17 –
2,677 38 1 22 61 3,238 144 95
OTHER 1,480 72 – 37 109 1,498 87 59Corporate eliminations & Other (270) 104 (108) (196) (200) 4,138 26 12
$ 13,893 $ 1,391 $ (114) $ 209 $ 20,041 $ 1,571 $ 1,175
Interest Income 49 Interest Expense (329) Charges (638)
$ 568
61 / SLB 2003 FORM 10-K
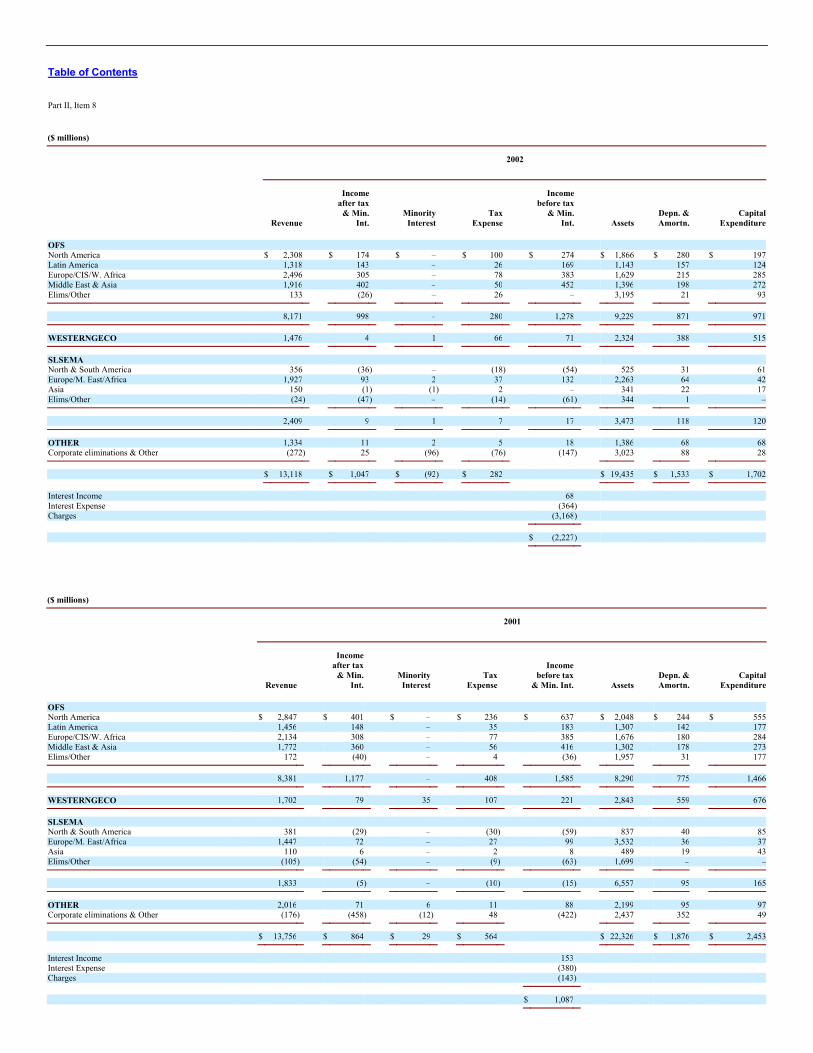
Table of Contents Part II, Item 8 ($ millions)
2002
Revenue
Incomeafter tax
& Min.Int.
MinorityInterest
TaxExpense
Incomebefore tax
& Min.Int. Assets
Depn. &Amortn.
CapitalExpenditure
OFS North America $ 2,308 $ 174 $ – $ 100 $ 274 $ 1,866 $ 280 $ 197Latin America 1,318 143 – 26 169 1,143 157 124Europe/CIS/W. Africa 2,496 305 – 78 383 1,629 215 285Middle East & Asia 1,916 402 – 50 452 1,396 198 272Elims/Other 133 (26) – 26 – 3,195 21 93
8,171 998 – 280 1,278 9,229 871 971
WESTERNGECO 1,476 4 1 66 71 2,324 388 515
SLSEMA North & South America 356 (36) – (18) (54) 525 31 61Europe/M. East/Africa 1,927 93 2 37 132 2,263 64 42Asia 150 (1) (1) 2 – 341 22 17Elims/Other (24) (47) – (14) (61) 344 1 –
2,409 9 1 7 17 3,473 118 120
OTHER 1,334 11 2 5 18 1,386 68 68Corporate eliminations & Other (272) 25 (96) (76) (147) 3,023 88 28
$ 13,118 $ 1,047 $ (92) $ 282 $ 19,435 $ 1,533 $ 1,702
Interest Income 68 Interest Expense (364) Charges (3,168)
$ (2,227)
($ millions)
2001
Revenue
Incomeafter tax
& Min.Int.
MinorityInterest
TaxExpense
Incomebefore tax
& Min. Int. Assets Depn. &Amortn.
CapitalExpenditure
OFS North America $ 2,847 $ 401 $ – $ 236 $ 637 $ 2,048 $ 244 $ 555Latin America 1,456 148 – 35 183 1,307 142 177Europe/CIS/W. Africa 2,134 308 – 77 385 1,676 180 284Middle East & Asia 1,772 360 – 56 416 1,302 178 273Elims/Other 172 (40) – 4 (36) 1,957 31 177
8,381 1,177 – 408 1,585 8,290 775 1,466
WESTERNGECO 1,702 79 35 107 221 2,843 559 676
SLSEMA North & South America 381 (29) – (30) (59) 837 40 85Europe/M. East/Africa 1,447 72 – 27 99 3,532 36 37Asia 110 6 – 2 8 489 19 43Elims/Other (105) (54) – (9) (63) 1,699 – –
1,833 (5) – (10) (15) 6,557 95 165
OTHER 2,016 71 6 11 88 2,199 95 97Corporate eliminations & Other (176) (458) (12) 48 (422) 2,437 352 49
$ 13,756 $ 864 $ 29 $ 564 $ 22,326 $ 1,876 $ 2,453
Interest Income 153 Interest Expense (380) Charges (143)
$ 1,087

62 / SLB 2003 FORM 10-K
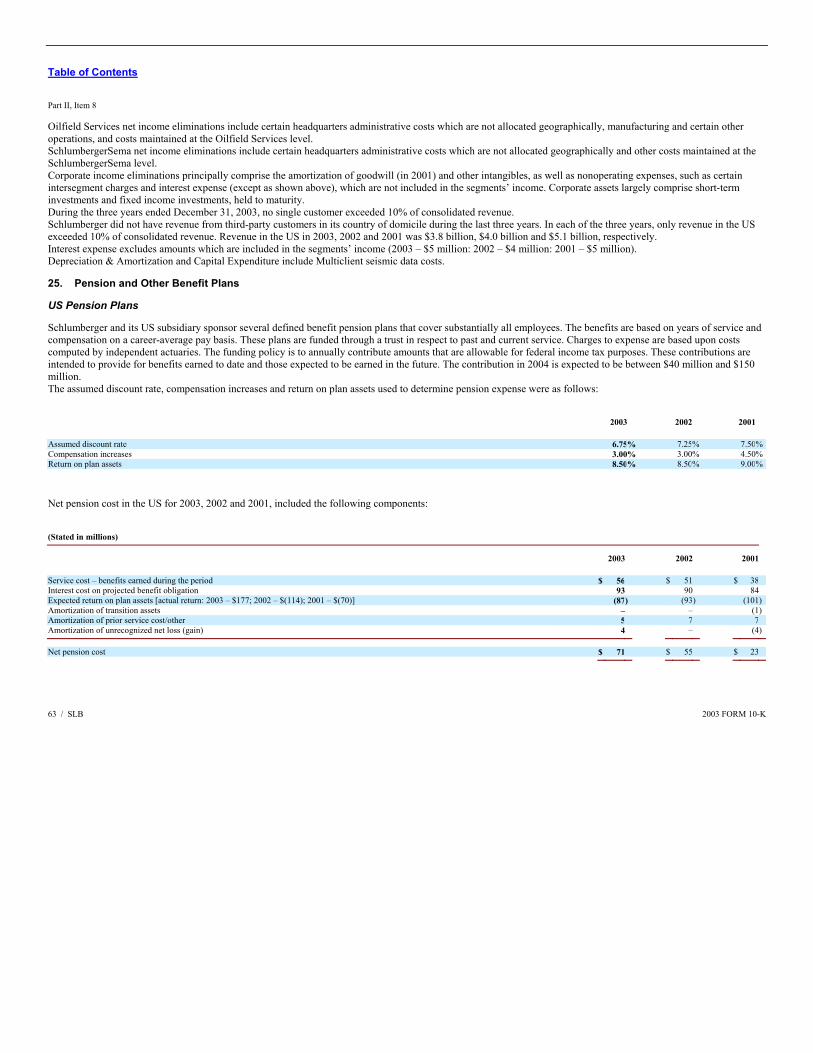
Table of Contents Part II, Item 8 Oilfield Services net income eliminations include certain headquarters administrative costs which are not allocated geographically, manufacturing and certain other operations, and costs maintained at the Oilfield Services level. SchlumbergerSema net income eliminations include certain headquarters administrative costs which are not allocated geographically and other costs maintained at the SchlumbergerSema level. Corporate income eliminations principally comprise the amortization of goodwill (in 2001) and other intangibles, as well as nonoperating expenses, such as certain intersegment charges and interest expense (except as shown above), which are not included in the segments’ income. Corporate assets largely comprise short-term investments and fixed income investments, held to maturity. During the three years ended December 31, 2003, no single customer exceeded 10% of consolidated revenue. Schlumberger did not have revenue from third-party customers in its country of domicile during the last three years. In each of the three years, only revenue in the US exceeded 10% of consolidated revenue. Revenue in the US in 2003, 2002 and 2001 was $3.8 billion, $4.0 billion and $5.1 billion, respectively. Interest expense excludes amounts which are included in the segments’ income (2003 – $5 million: 2002 – $4 million: 2001 – $5 million). Depreciation & Amortization and Capital Expenditure include Multiclient seismic data costs. 25. Pension and Other Benefit Plans US Pension Plans Schlumberger and its US subsidiary sponsor several defined benefit pension plans that cover substantially all employees. The benefits are based on years of service and compensation on a career-average pay basis. These plans are funded through a trust in respect to past and current service. Charges to expense are based upon costs computed by independent actuaries. The funding policy is to annually contribute amounts that are allowable for federal income tax purposes. These contributions are intended to provide for benefits earned to date and those expected to be earned in the future. The contribution in 2004 is expected to be between $40 million and $150 million. The assumed discount rate, compensation increases and return on plan assets used to determine pension expense were as follows: 2003 2002 2001 Assumed discount rate 6.75% 7.25% 7.50%Compensation increases 3.00% 3.00% 4.50%Return on plan assets 8.50% 8.50% 9.00%
Net pension cost in the US for 2003, 2002 and 2001, included the following components: (Stated in millions)
2003 2002 2001 Service cost – benefits earned during the period $ 56 $ 51 $ 38 Interest cost on projected benefit obligation 93 90 84 Expected return on plan assets [actual return: 2003 – $177; 2002 – $(114); 2001 – $(70)] (87) (93) (101)Amortization of transition assets – – (1)Amortization of prior service cost/other 5 7 7 Amortization of unrecognized net loss (gain) 4 – (4)
Net pension cost $ 71 $ 55 $ 23
63 / SLB 2003 FORM 10-K
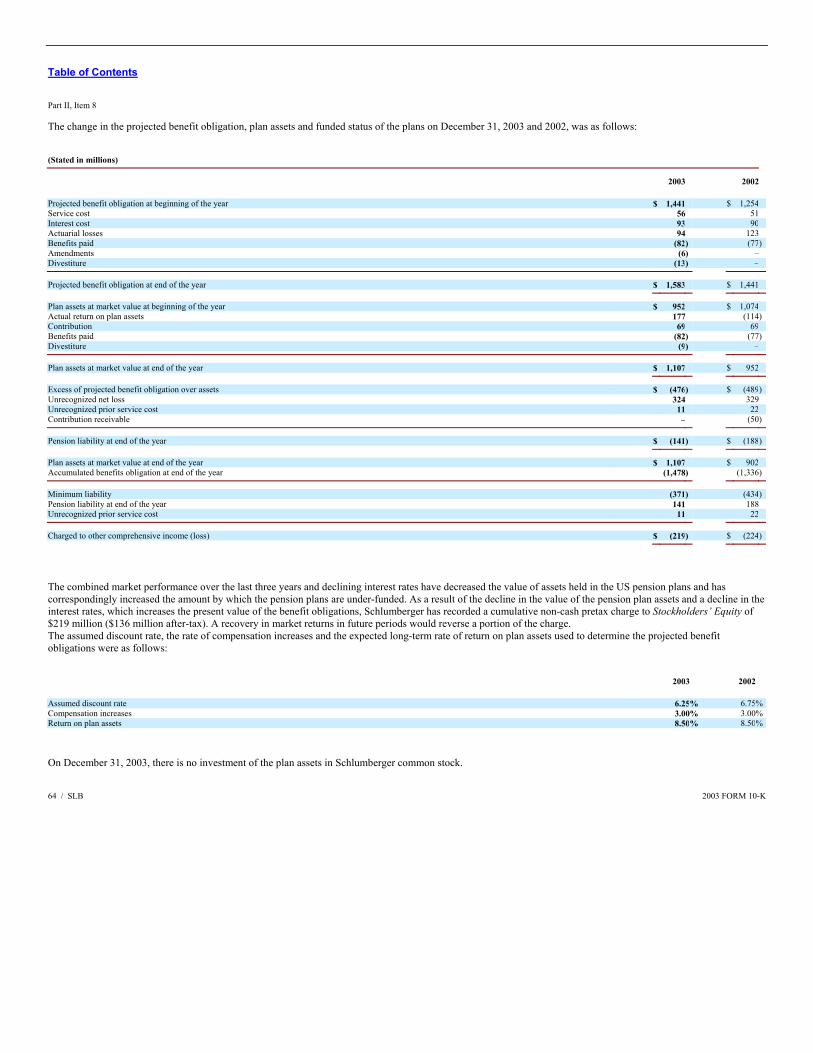
Table of Contents Part II, Item 8 The change in the projected benefit obligation, plan assets and funded status of the plans on December 31, 2003 and 2002, was as follows: (Stated in millions)
2003 2002 Projected benefit obligation at beginning of the year $ 1,441 $ 1,254 Service cost 56 51 Interest cost 93 90 Actuarial losses 94 123 Benefits paid (82) (77)Amendments (6) – Divestiture (13) –
Projected benefit obligation at end of the year $ 1,583 $ 1,441
Plan assets at market value at beginning of the year $ 952 $ 1,074 Actual return on plan assets 177 (114)Contribution 69 69 Benefits paid (82) (77)Divestiture (9) –
Plan assets at market value at end of the year $ 1,107 $ 952
Excess of projected benefit obligation over assets $ (476) $ (489)Unrecognized net loss 324 329 Unrecognized prior service cost 11 22 Contribution receivable – (50)
Pension liability at end of the year $ (141) $ (188)
Plan assets at market value at end of the year $ 1,107 $ 902 Accumulated benefits obligation at end of the year (1,478) (1,336)
Minimum liability (371) (434)Pension liability at end of the year 141 188 Unrecognized prior service cost 11 22
Charged to other comprehensive income (loss) $ (219) $ (224)
The combined market performance over the last three years and declining interest rates have decreased the value of assets held in the US pension plans and has correspondingly increased the amount by which the pension plans are under-funded. As a result of the decline in the value of the pension plan assets and a decline in the interest rates, which increases the present value of the benefit obligations, Schlumberger has recorded a cumulative non-cash pretax charge to Stockholders’ Equity of $219 million ($136 million after-tax). A recovery in market returns in future periods would reverse a portion of the charge. The assumed discount rate, the rate of compensation increases and the expected long-term rate of return on plan assets used to determine the projected benefit obligations were as follows: 2003 2002 Assumed discount rate 6.25% 6.75%Compensation increases 3.00% 3.00%Return on plan assets 8.50% 8.50%
On December 31, 2003, there is no investment of the plan assets in Schlumberger common stock. 64 / SLB 2003 FORM 10-K
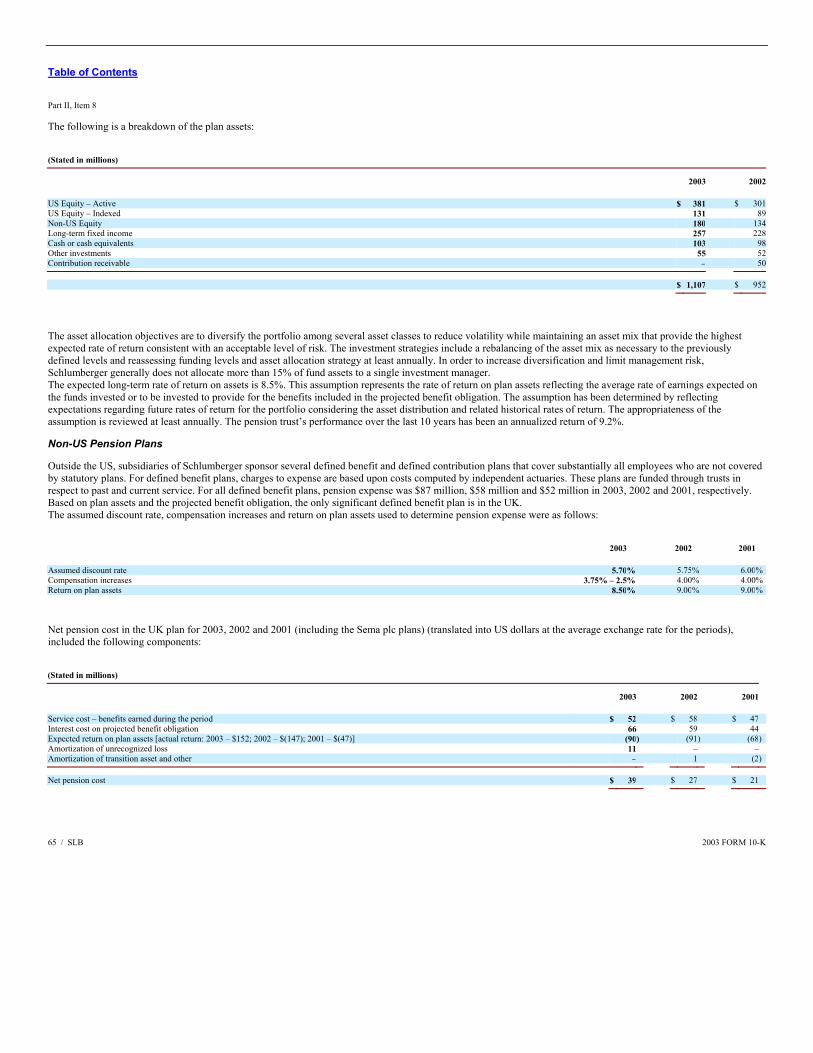
Table of Contents Part II, Item 8 The following is a breakdown of the plan assets: (Stated in millions)
2003 2002 US Equity – Active $ 381 $ 301US Equity – Indexed 131 89Non-US Equity 180 134Long-term fixed income 257 228Cash or cash equivalents 103 98Other investments 55 52Contribution receivable – 50
$ 1,107 $ 952
The asset allocation objectives are to diversify the portfolio among several asset classes to reduce volatility while maintaining an asset mix that provide the highest expected rate of return consistent with an acceptable level of risk. The investment strategies include a rebalancing of the asset mix as necessary to the previously defined levels and reassessing funding levels and asset allocation strategy at least annually. In order to increase diversification and limit management risk, Schlumberger generally does not allocate more than 15% of fund assets to a single investment manager. The expected long-term rate of return on assets is 8.5%. This assumption represents the rate of return on plan assets reflecting the average rate of earnings expected on the funds invested or to be invested to provide for the benefits included in the projected benefit obligation. The assumption has been determined by reflecting expectations regarding future rates of return for the portfolio considering the asset distribution and related historical rates of return. The appropriateness of the assumption is reviewed at least annually. The pension trust’s performance over the last 10 years has been an annualized return of 9.2%. Non-US Pension Plans Outside the US, subsidiaries of Schlumberger sponsor several defined benefit and defined contribution plans that cover substantially all employees who are not covered by statutory plans. For defined benefit plans, charges to expense are based upon costs computed by independent actuaries. These plans are funded through trusts in respect to past and current service. For all defined benefit plans, pension expense was $87 million, $58 million and $52 million in 2003, 2002 and 2001, respectively. Based on plan assets and the projected benefit obligation, the only significant defined benefit plan is in the UK. The assumed discount rate, compensation increases and return on plan assets used to determine pension expense were as follows: 2003 2002 2001 Assumed discount rate 5.70% 5.75% 6.00%Compensation increases 3.75% – 2.5% 4.00% 4.00%Return on plan assets 8.50% 9.00% 9.00%
Net pension cost in the UK plan for 2003, 2002 and 2001 (including the Sema plc plans) (translated into US dollars at the average exchange rate for the periods), included the following components: (Stated in millions)
2003 2002 2001 Service cost – benefits earned during the period $ 52 $ 58 $ 47 Interest cost on projected benefit obligation 66 59 44 Expected return on plan assets [actual return: 2003 – $152; 2002 – $(147); 2001 – $(47)] (90) (91) (68) Amortization of unrecognized loss 11 – – Amortization of transition asset and other – 1 (2)
Net pension cost $ 39 $ 27 $ 21
65 / SLB 2003 FORM 10-K
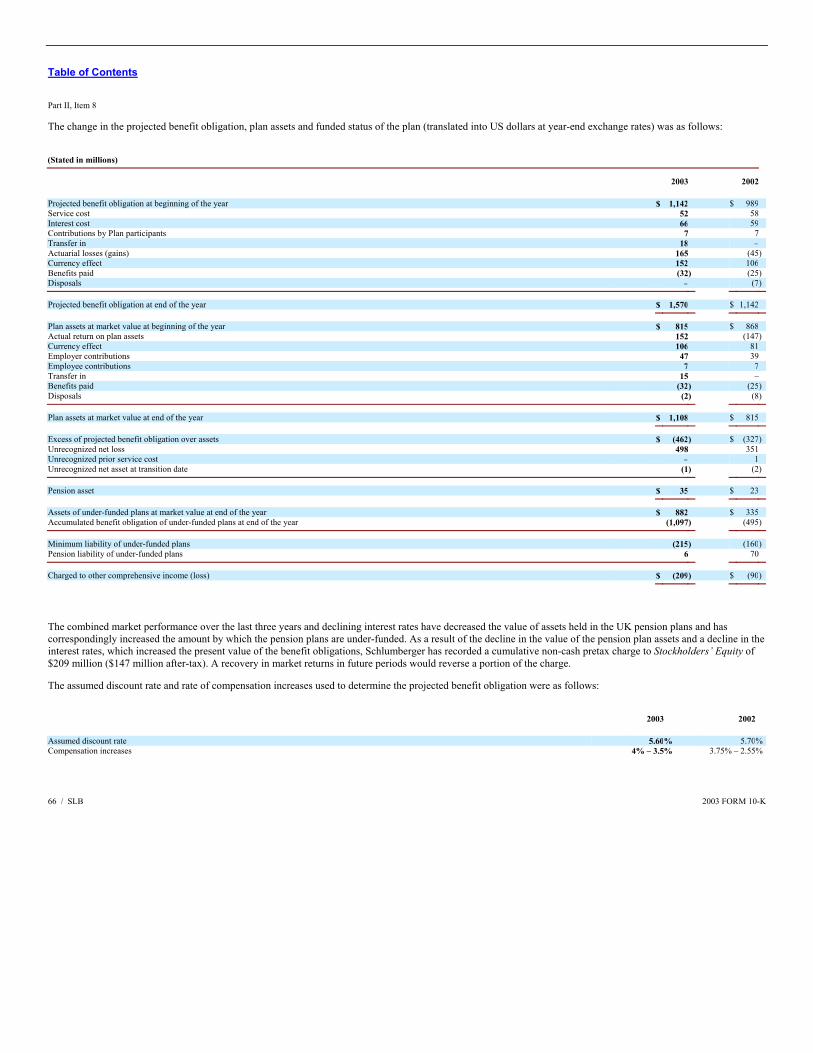
Table of Contents Part II, Item 8 The change in the projected benefit obligation, plan assets and funded status of the plan (translated into US dollars at year-end exchange rates) was as follows: (Stated in millions)
2003 2002 Projected benefit obligation at beginning of the year $ 1,142 $ 989 Service cost 52 58 Interest cost 66 59 Contributions by Plan participants 7 7 Transfer in 18 – Actuarial losses (gains) 165 (45) Currency effect 152 106 Benefits paid (32) (25) Disposals – (7)
Projected benefit obligation at end of the year $ 1,570 $ 1,142
Plan assets at market value at beginning of the year $ 815 $ 868 Actual return on plan assets 152 (147) Currency effect 106 81 Employer contributions 47 39 Employee contributions 7 7 Transfer in 15 – Benefits paid (32) (25) Disposals (2) (8)
Plan assets at market value at end of the year $ 1,108 $ 815
Excess of projected benefit obligation over assets $ (462) $ (327) Unrecognized net loss 498 351 Unrecognized prior service cost – 1 Unrecognized net asset at transition date (1) (2)
Pension asset $ 35 $ 23
Assets of under-funded plans at market value at end of the year $ 882 $ 335 Accumulated benefit obligation of under-funded plans at end of the year (1,097) (495)
Minimum liability of under-funded plans (215) (160) Pension liability of under-funded plans 6 70
Charged to other comprehensive income (loss) $ (209) $ (90)
The combined market performance over the last three years and declining interest rates have decreased the value of assets held in the UK pension plans and has correspondingly increased the amount by which the pension plans are under-funded. As a result of the decline in the value of the pension plan assets and a decline in the interest rates, which increased the present value of the benefit obligations, Schlumberger has recorded a cumulative non-cash pretax charge to Stockholders’ Equity of $209 million ($147 million after-tax). A recovery in market returns in future periods would reverse a portion of the charge. The assumed discount rate and rate of compensation increases used to determine the projected benefit obligation were as follows: 2003 2002 Assumed discount rate 5.60% 5.70%Compensation increases 4% – 3.5% 3.75% – 2.55%
66 / SLB 2003 FORM 10-K
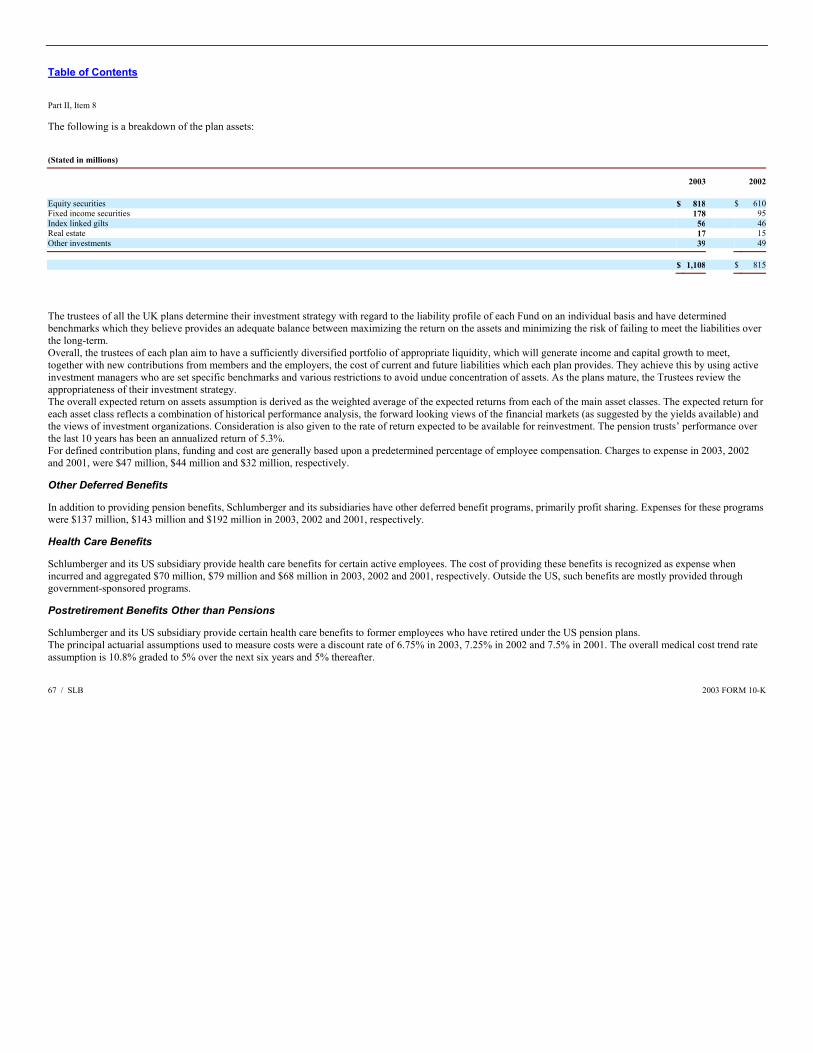
Table of Contents Part II, Item 8 The following is a breakdown of the plan assets: (Stated in millions)
2003 2002 Equity securities $ 818 $ 610Fixed income securities 178 95Index linked gilts 56 46Real estate 17 15Other investments 39 49
$ 1,108 $ 815
The trustees of all the UK plans determine their investment strategy with regard to the liability profile of each Fund on an individual basis and have determined benchmarks which they believe provides an adequate balance between maximizing the return on the assets and minimizing the risk of failing to meet the liabilities over the long-term. Overall, the trustees of each plan aim to have a sufficiently diversified portfolio of appropriate liquidity, which will generate income and capital growth to meet, together with new contributions from members and the employers, the cost of current and future liabilities which each plan provides. They achieve this by using active investment managers who are set specific benchmarks and various restrictions to avoid undue concentration of assets. As the plans mature, the Trustees review the appropriateness of their investment strategy. The overall expected return on assets assumption is derived as the weighted average of the expected returns from each of the main asset classes. The expected return for each asset class reflects a combination of historical performance analysis, the forward looking views of the financial markets (as suggested by the yields available) and the views of investment organizations. Consideration is also given to the rate of return expected to be available for reinvestment. The pension trusts’ performance over the last 10 years has been an annualized return of 5.3%. For defined contribution plans, funding and cost are generally based upon a predetermined percentage of employee compensation. Charges to expense in 2003, 2002 and 2001, were $47 million, $44 million and $32 million, respectively. Other Deferred Benefits In addition to providing pension benefits, Schlumberger and its subsidiaries have other deferred benefit programs, primarily profit sharing. Expenses for these programs were $137 million, $143 million and $192 million in 2003, 2002 and 2001, respectively. Health Care Benefits Schlumberger and its US subsidiary provide health care benefits for certain active employees. The cost of providing these benefits is recognized as expense when incurred and aggregated $70 million, $79 million and $68 million in 2003, 2002 and 2001, respectively. Outside the US, such benefits are mostly provided through government-sponsored programs. Postretirement Benefits Other than Pensions Schlumberger and its US subsidiary provide certain health care benefits to former employees who have retired under the US pension plans. The principal actuarial assumptions used to measure costs were a discount rate of 6.75% in 2003, 7.25% in 2002 and 7.5% in 2001. The overall medical cost trend rate assumption is 10.8% graded to 5% over the next six years and 5% thereafter. 67 / SLB 2003 FORM 10-K
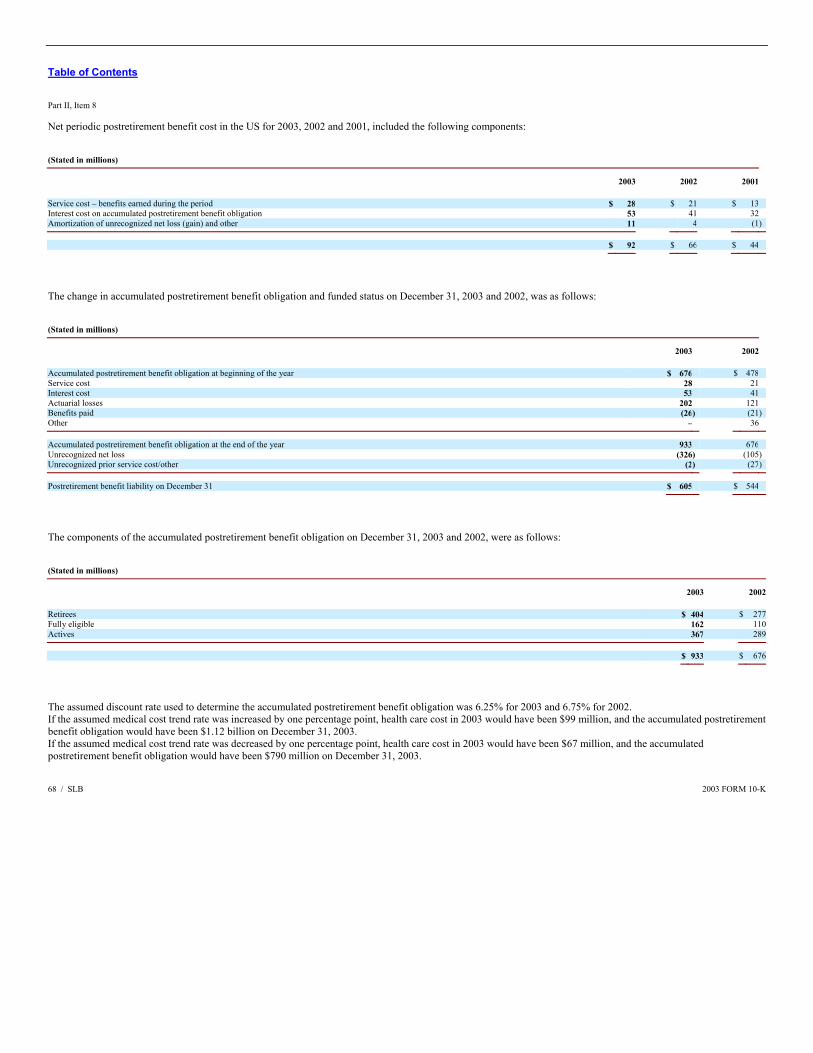
Table of Contents Part II, Item 8 Net periodic postretirement benefit cost in the US for 2003, 2002 and 2001, included the following components: (Stated in millions)
2003 2002 2001 Service cost – benefits earned during the period $ 28 $ 21 $ 13 Interest cost on accumulated postretirement benefit obligation 53 41 32 Amortization of unrecognized net loss (gain) and other 11 4 (1)
$ 92 $ 66 $ 44
The change in accumulated postretirement benefit obligation and funded status on December 31, 2003 and 2002, was as follows: (Stated in millions)
2003 2002 Accumulated postretirement benefit obligation at beginning of the year $ 676 $ 478 Service cost 28 21 Interest cost 53 41 Actuarial losses 202 121 Benefits paid (26) (21)Other – 36
Accumulated postretirement benefit obligation at the end of the year 933 676 Unrecognized net loss (326) (105)Unrecognized prior service cost/other (2) (27)
Postretirement benefit liability on December 31 $ 605 $ 544
The components of the accumulated postretirement benefit obligation on December 31, 2003 and 2002, were as follows: (Stated in millions)
2003 2002 Retirees $ 404 $ 277Fully eligible 162 110Actives 367 289
$ 933 $ 676
The assumed discount rate used to determine the accumulated postretirement benefit obligation was 6.25% for 2003 and 6.75% for 2002. If the assumed medical cost trend rate was increased by one percentage point, health care cost in 2003 would have been $99 million, and the accumulated postretirement benefit obligation would have been $1.12 billion on December 31, 2003. If the assumed medical cost trend rate was decreased by one percentage point, health care cost in 2003 would have been $67 million, and the accumulated postretirement benefit obligation would have been $790 million on December 31, 2003. 68 / SLB 2003 FORM 10-K
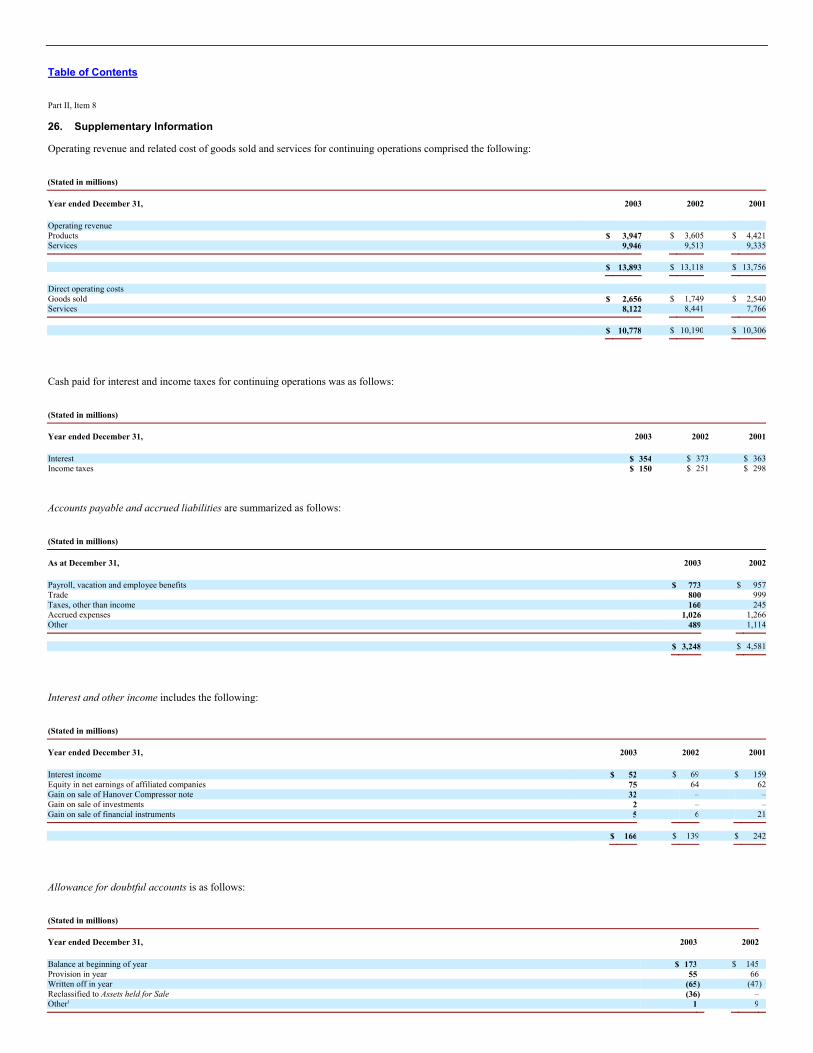
Table of Contents Part II, Item 8 26. Supplementary Information Operating revenue and related cost of goods sold and services for continuing operations comprised the following: (Stated in millions)
Year ended December 31, 2003 2002 2001 Operating revenue Products $ 3,947 $ 3,605 $ 4,421Services 9,946 9,513 9,335
$ 13,893 $ 13,118 $ 13,756
Direct operating costs Goods sold $ 2,656 $ 1,749 $ 2,540Services 8,122 8,441 7,766
$ 10,778 $ 10,190 $ 10,306
Cash paid for interest and income taxes for continuing operations was as follows: (Stated in millions)
Year ended December 31, 2003 2002 2001 Interest $ 354 $ 373 $ 363Income taxes $ 150 $ 251 $ 298
Accounts payable and accrued liabilities are summarized as follows: (Stated in millions)
As at December 31, 2003 2002 Payroll, vacation and employee benefits $ 773 $ 957Trade 800 999Taxes, other than income 160 245Accrued expenses 1,026 1,266Other 489 1,114
$ 3,248 $ 4,581
Interest and other income includes the following: (Stated in millions)
Year ended December 31, 2003 2002 2001 Interest income $ 52 $ 69 $ 159Equity in net earnings of affiliated companies 75 64 62Gain on sale of Hanover Compressor note 32 – –Gain on sale of investments 2 – –Gain on sale of financial instruments 5 6 21
$ 166 $ 139 $ 242
Allowance for doubtful accounts is as follows: (Stated in millions)
Year ended December 31, 2003 2002 Balance at beginning of year $ 173 $ 145 Provision in year 55 66 Written off in year (65) (47)Reclassified to Assets held for Sale (36) – Other1 1 9

Balance at end of year $ 128 $ 173
1. Includes business acquisitions and divestitures
69 / SLB 2003 FORM 10-K
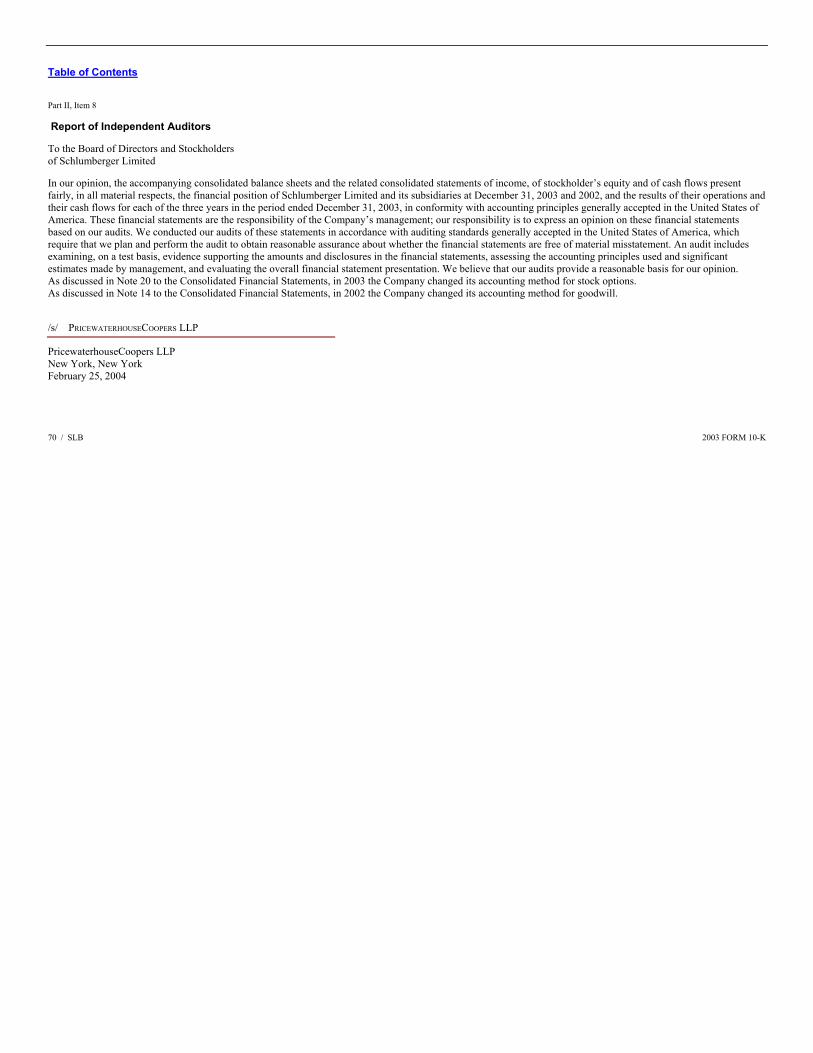
Table of Contents Part II, Item 8 Report of Independent Auditors To the Board of Directors and Stockholders of Schlumberger Limited In our opinion, the accompanying consolidated balance sheets and the related consolidated statements of income, of stockholder’s equity and of cash flows present fairly, in all material respects, the financial position of Schlumberger Limited and its subsidiaries at December 31, 2003 and 2002, and the results of their operations and their cash flows for each of the three years in the period ended December 31, 2003, in conformity with accounting principles generally accepted in the United States of America. These financial statements are the responsibility of the Company’s management; our responsibility is to express an opinion on these financial statements based on our audits. We conducted our audits of these statements in accordance with auditing standards generally accepted in the United States of America, which require that we plan and perform the audit to obtain reasonable assurance about whether the financial statements are free of material misstatement. An audit includes examining, on a test basis, evidence supporting the amounts and disclosures in the financial statements, assessing the accounting principles used and significant estimates made by management, and evaluating the overall financial statement presentation. We believe that our audits provide a reasonable basis for our opinion. As discussed in Note 20 to the Consolidated Financial Statements, in 2003 the Company changed its accounting method for stock options. As discussed in Note 14 to the Consolidated Financial Statements, in 2002 the Company changed its accounting method for goodwill. /s/ PRICEWATERHOUSECOOPERS LLP
PricewaterhouseCoopers LLP New York, New York February 25, 2004 70 / SLB 2003 FORM 10-K
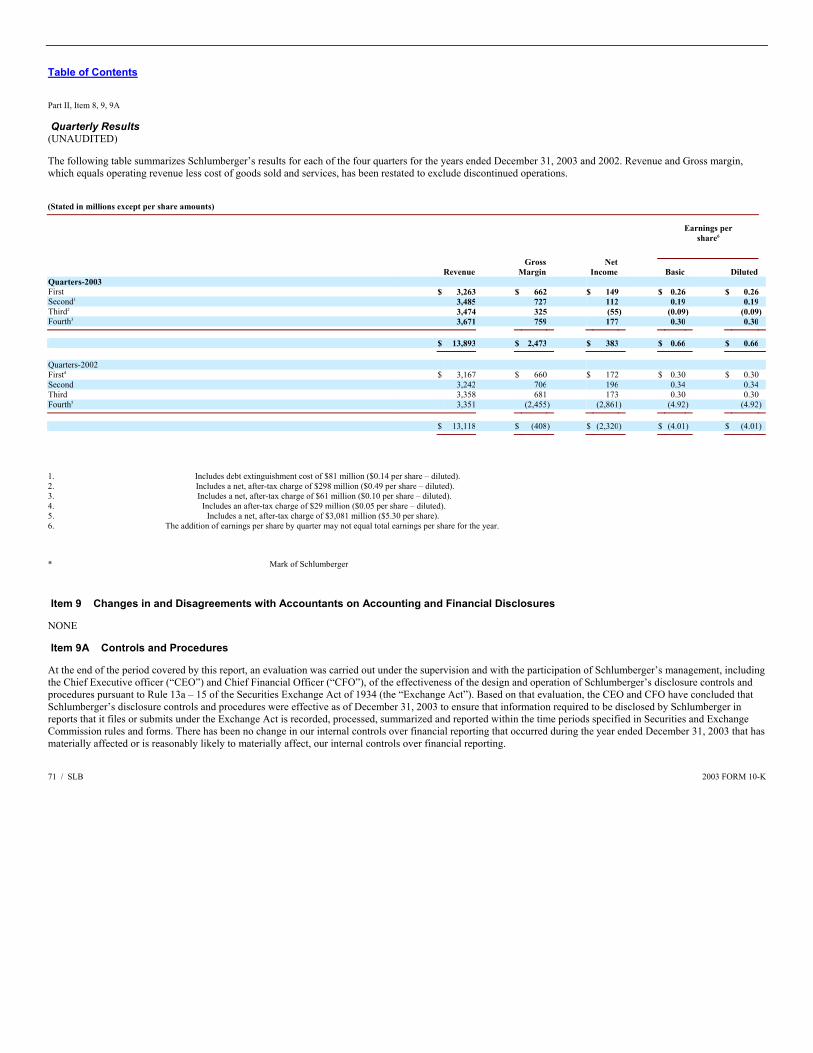
Table of Contents Part II, Item 8, 9, 9A Quarterly Results (UNAUDITED) The following table summarizes Schlumberger’s results for each of the four quarters for the years ended December 31, 2003 and 2002. Revenue and Gross margin, which equals operating revenue less cost of goods sold and services, has been restated to exclude discontinued operations. (Stated in millions except per share amounts)
Earnings per share6
Revenue Gross
Margin Net
Income Basic Diluted Quarters-2003 First $ 3,263 $ 662 $ 149 $ 0.26 $ 0.26 Second1 3,485 727 112 0.19 0.19 Third2 3,474 325 (55) (0.09) (0.09)Fourth3 3,671 759 177 0.30 0.30
$ 13,893 $ 2,473 $ 383 $ 0.66 $ 0.66
Quarters-2002 First4 $ 3,167 $ 660 $ 172 $ 0.30 $ 0.30 Second 3,242 706 196 0.34 0.34 Third 3,358 681 173 0.30 0.30 Fourth5 3,351 (2,455) (2,861) (4.92) (4.92)
$ 13,118 $ (408) $ (2,320) $ (4.01) $ (4.01)
1. Includes debt extinguishment cost of $81 million ($0.14 per share – diluted). 2. Includes a net, after-tax charge of $298 million ($0.49 per share – diluted). 3. Includes a net, after-tax charge of $61 million ($0.10 per share – diluted). 4. Includes an after-tax charge of $29 million ($0.05 per share – diluted). 5. Includes a net, after-tax charge of $3,081 million ($5.30 per share). 6. The addition of earnings per share by quarter may not equal total earnings per share for the year.
* Mark of Schlumberger
Item 9 Changes in and Disagreements with Accountants on Accounting and Financial Disclosures NONE Item 9A Controls and Procedures At the end of the period covered by this report, an evaluation was carried out under the supervision and with the participation of Schlumberger’s management, including the Chief Executive officer (“CEO”) and Chief Financial Officer (“CFO”), of the effectiveness of the design and operation of Schlumberger’s disclosure controls and procedures pursuant to Rule 13a – 15 of the Securities Exchange Act of 1934 (the “Exchange Act”). Based on that evaluation, the CEO and CFO have concluded that Schlumberger’s disclosure controls and procedures were effective as of December 31, 2003 to ensure that information required to be disclosed by Schlumberger in reports that it files or submits under the Exchange Act is recorded, processed, summarized and reported within the time periods specified in Securities and Exchange Commission rules and forms. There has been no change in our internal controls over financial reporting that occurred during the year ended December 31, 2003 that has materially affected or is reasonably likely to materially affect, our internal controls over financial reporting. 71 / SLB 2003 FORM 10-K
Table of Contents Part III, Item 10, 11, 12, 13, 14
PART III Item 10 Directors and Executive Officers of Schlumberger See Part I (on pages 8 and 9) for Item 10 information regarding Executive Officers of Schlumberger. The information with respect to the remaining portion of Item 10 is set forth in the first section under the caption, “Election of Directors”, in Schlumberger’s Proxy Statement to be filed for the April 14, 2004 Annual General Meeting, and is incorporated by reference. Item 11 Executive Compensation The information set forth under “Executive Compensation” (other than that set forth under the subcaptions “Corporate Performance Graph” and “Compensation Committee Report on Executive Compensation”) in Schlumberger’s Proxy Statement to be filed for the April 14, 2004 Annual General Meeting, is incorporated by reference. Item 12 Security Ownership of Certain Beneficial Owners and Management and Related Stockholder Matters The information with respect to Item 12 is set forth in Schlumberger’s Proxy Statement to be filed for the April 14, 2004 Annual General Meeting under the caption, “Security Ownership of Certain Beneficial Owners and Management,” and such information is incorporated herein by reference. Equity Compensation Plan Information The information with respect to “Equity Compensation Plan Information” is set forth in Schlumberger’s Proxy Statement to be filed for the April 14, 2004 Annual General Meeting under the caption “Equity Compensation Plan Information” and such information is incorporated herein by reference. Item 13 Certain Relationships and Related Transactions Information regarding this item may be found on page 1, the last two sentences of footnote 2, in Schlumberger’s Proxy Statement to be filed for the April 14, 2004 Annual General Meeting and is incorporated by reference. Item 14 Principal Accounting Fees and Services Information concerning the fees billed by our independent auditor and the nature of services comprising the fees for each of the two most recent fiscal years in each of the following categories: (i) audit fees, (ii) audit – related fees, (iii) tax fees and (iv) all other fees, is set forth in the Audit Committee Report segment of the Proxy Statement and is incorporated herein reference. Information concerning Schlumberger’s Audit Committee policies and procedures pertaining to pre-approval of audit and non-audit services rendered by our independent auditor is set forth in the Audit Committee segment of the Proxy Statement and is incorporated herein by reference. 72 / SLB 2003 FORM 10-K
Table of Contents Part IV, Item 15
PART IV Item 15 Exhibits, Financial Statement Schedules and Reports on Form 8-K The following documents are filed as part of this report: Page(s) (1) Financial Statements Consolidated Statement of Income for the three years ended December 31, 2003 35 Consolidated Balance Sheet at December 31, 2003 and 2002 36 Consolidated Statement of Cash Flows for the three years ended December 31, 2003 37 Consolidated Statement of Stockholders’ Equity for the three years ended December 31, 2003 38 and 39 Notes to Consolidated Financial Statements 40 to 69 Report of Independent Auditors 70 Quarterly Results (Unaudited) 71 Financial statements of 20% – 50% owned companies accounted for under the equity method and unconsolidated subsidiaries have been omitted because they do not meet the materiality tests for assets or income. (2) Financial Statement Schedules not required (3) The following Exhibits are filed or incorporated by reference as indicated in the Index to Exhibits: Deed of Incorporation as last amended on May 4, 2001 Exhibit 3(a) By-Laws as last amended on April 17, 2003 Exhibit 3(b) Indenture, dated as of June 9, 2003, by and between Schlumberger and Citibank N.A., as Trustee Exhibit 4.3 First Supplemental Indenture, dated as of June 9, 2003, by and between Schlumberger and Citibank, N.A., as Trustee Exhibit 4.4 Schlumberger is party to a number of other long-term debt agreements that, pursuant to Regulation S-K, Item 601(b)(4)(iii), are not filed as exhibits. Schlumberger agrees to furnish copies of these agreements to the Commission upon its request. Schlumberger 1994 Stock Option Plan* as amended on January 5, 1995 Exhibit 10 (a) Schlumberger 1994 Stock Option Plan* Second Amendment Exhibit 10(b) Schlumberger 1994 Stock Option Plan* Third Amendment Exhibit 10(c) Schlumberger Limited Supplementary Benefit Plan* as amended on January 1, 1995 Exhibit 10(d) Schlumberger 1989 Stock Incentive Plan* as amended Exhibit 10(e) Schlumberger 1989 Stock Incentive Plan* Third Amendment Exhibit 10(f) Schlumberger Restoration Savings Plan Exhibit 10(g) Schlumberger 1998 Stock Option Plan* Exhibit 10(h) Schlumberger 1998 Stock Option Plan* First Amendment Exhibit 10(i) * Compensatory plan required to be filed as an exhibit.
73 / SLB 2003 FORM 10-K
Table of Contents Part IV, Item 15
1997 Long-Term Incentive Plan of Camco International Inc.; Long-Term Incentive Plan of Camco International Inc. Production Operators Corp. 1992 Long-Term Incentive Plan; Camco 1996 Savings Related Share Option Scheme; Camco International Inc. Amended and Restated Stock Option Plan for Non-Employee Directors
Exhibit 10(j)
Schlumberger 2001 Stock Option Plan* Exhibit 10 (k) Schlumberger Stock and Deferral Plan for Non-Employee Directors* Exhibit 10 (l) Subsidiaries Exhibit 21 Consent of Independent Accountants Exhibit 23
Powers of Attorney (a) John Deutch, Jamie S. Gorlick, Andrew Gould, Adrian Lajous, André Lévy-Lang, Didier Primat, Nicolas Seydoux, Linda G. Stuntz, Sven Ullring – dated January 22, 2004
Exhibit 24(a)
(b) Tony Isaac – dated January 29, 2004 Exhibit 24(b)
Certification of Chief Executive Officer pursuant to Form of Rule 13a-14(a) as Adopted Pursuant to Section 302 of the Sarbanes-Oxley Act of 2002.
Exhibit 31(a)
Certification of Chief Financial Officer pursuant to Form of Rule 13a-14(a) as Adopted Pursuant to Section 302 of the Sarbanes-Oxley Act of 2002.
Exhibit 31(b)
Certification of Chief Executive Officer pursuant to 18 U.S.C. Section 1350, as Adopted Pursuant to Section 906 of the Sarbanes-Oxley Act of 2002
Exhibit 32(a)
Certification of Chief Financial Officer pursuant to 18 U.S.C. Section 1350, as Adopted Pursuant to Section 906 of the Sarbanes-Oxley Act of 2002
Exhibit 32(b)
Additional Exhibit: Form S-8 Undertakings Exhibit 99 (4) The following reports were filed on Form 8-K during the last quarter of the period covered by this 10-K report:
Report 8-K dated September 22, 2003, filed as of October 16, 2003 to furnish pro forma financial information with respect to (i) the sale of the SchlumbergerSema businesses and (ii) the probable sale of Atos shares to reduce the Company’s ownership in Atos to 19%.
Report 8-K dated October 21, 2003, filed as of October 22, 2003 to report Schlumberger’s Third Quarter Press Release, Question and Answer document and related non-GAAP financial measures.
Report 8-K dated December 9, 2003, filed as of December 9, 2003 to report the signing of an agreement to acquire PetroAlliance Services Company Limited.
* Compensatory plan required to be filed as an exhibit.
74 / SLB 2003 FORM 10-K
Table of Contents SIGNATURES Pursuant to the requirements of Section 13 or 15(d) of the Securities Exchange Act of 1934, the Registrant has duly caused this report to be signed on its behalf by the undersigned, thereunto duly authorized. Date: March 3, 2004 SCHLUMBERGER LIMITED
By:
/s/ FRANK A. SORGIE
Frank A. Sorgie Chief Accounting Officer
Pursuant to the requirements of the Securities Exchange Act of 1934, this report has been signed below by the following persons on behalf of the Registrant and in the capacities and on the dates indicated.
Name Title
*
Andrew Gould
Director, Chairman and Chief Executive Officer
/s/ JEAN-MARC PERRAUD
Jean-Marc Perraud Executive Vice President and Chief Financial Officer
/S/ FRANK A. SORGIE
Frank A. Sorgie Chief Accounting Officer
*
John Deutch Director
*
Jamie S. Gorelick Director
*
Tony Isaac Director
*
Adrian Lajous Director
*
André Lévy-Lang Director
*
Didier Primat Director
*
Nicolas Seydoux Director
*
Linda G. Stuntz Director
*
Sven Ullring Director
/s/ ELLEN SUMMER
*By Ellen Summer Attorney-in-Fact March 3, 2004
75 / SLB 2003 FORM 10-K
Table of Contents INDEX TO EXHIBITS Exhibit Page Deed of Incorporation as last amended on May 4, 2001 incorporated by reference to Form 10-Q for the period ended June 30, 2001 3(a) – By-Laws as last amended on April 17, 2003, incorporated by reference to Exhibit 3 to Form 8-K filed April 17, 2003 3(b) – Indenture, dated as of June 9, 2003, by and between Schlumberger and Citibank N.A., as Trustee, incorporated by reference to Exhibit 4.3 to Registration Statement S-3 filed on September 12, 2003
4.3
First Supplemental Indenture, dated as of June 9, 2003, by and between Schlumberger and Citibank, N.A., as Trustee, incorporated by reference to Exhibit 4.4 to Registration Statement S-3 filed on September 12, 2003
4.4
Schlumberger 1994 Stock Option Plan, as amended on January 5, 1995, incorporated by reference to Exhibit 10(a) to Form 10-K for year 1995
10(a)
–
Schlumberger 1994 Stock Option Plan – Second Amendment incorporated by reference to Exhibit 10(b) to Form 10-K for the year 1999 10(b) – Schlumberger 1994 Stock Option Plan – Third Amendment incorporated by reference to Exhibit 10(c) to Form 10-K for the year 1999 10(c) – Schlumberger Limited Supplementary Benefit Plan, as amended, on January 1, 1995, incorporated by reference to Exhibit 10(b) to Form 10-K for 1996
10(d)
–
Schlumberger 1989 Stock Incentive Plan, as amended, incorporated by reference to Exhibit 10(c) to Form 10-K for year 1995 10(e) – Schlumberger 1989 Stock Incentive Plan – Third Amendment incorporated by reference to Exhibit 10(f) to Form 10-K for the year 1999 10(f) – Schlumberger Restoration Savings Plan, incorporated by reference to Exhibit 10(f) to Form 10-K for year 1995 10(g) – Schlumberger 1998 Stock Option Plan, incorporated by reference to Exhibit 10(g) to Form 10-K for year 1997 10(h) – Schlumberger 1998 Stock Option Plan – First Amendment incorporated by reference to Exhibit 10(i) to Form 10-K for the year 1999 10(i) – 1997 Long-Term Incentive Plan of Camco International Inc.; Long-Term Incentive Plan of Camco International Inc.; Production Operators Corp. 1992 Long-Term Incentive Plan; Camco 1996 Savings Related Share Option Scheme; Camco International Inc. Amended and Restated Stock Option Plan for Nonemployee Directors; incorporated by reference to Exhibit 10 to Form S-8 of August 31, 1998
10(j)
–
Schlumberger 2001 Stock Option Plan, incorporated by reference to Form 10-Q for the period ended March 31, 2001 10(k) – Schlumberger Stock and Deferral Plan for Non-Employee Directors, incorporated by reference to Exhibit 10(l) to Form 10-K for the year 2001
10(l)
–
Subsidiaries 21 78 Consent of Independent Accountants 23 79 76 / SLB 2003 FORM 10-K
Table of Contents Exhibit PagePowers of Attorney John Deutch Jamie S. Gorelick Andrew Gould Adrian Lajous André Lévy-Lang Didier Primat Nicolas Seydoux Linda G. Stuntz Sven Ullring
dated: January 22, 2004
24(a)
80
Tony Issac
January 29, 2004
24(b)
81
Additional Exhibits: Certification of Chief Executive Officer pursuant to Form of Rule 13a-14(a) as Adopted Pursuant to Section 302 of the Sarbanes-Oxley Act of 2002.
31(a)
82
Certification of Chief Financial Officer pursuant to Form of Rule 13a-14(a) as Adopted Pursuant to Section 302 of the Sarbanes-Oxley Act of 2002.
31(b)
83
Certification of Chief Executive Officer pursuant to 18 U.S.C. Section 1350, as Adopted Pursuant to Section 906 of the Sarbanes-Oxley Act of 2002
32(a)
84
Certification of Chief Financial Officer pursuant to 18 U.S.C. Section 1350, as Adopted Pursuant to Section 906 of the Sarbanes-Oxley Act of 2002
32(b)
85
Form S-8 Undertakings 99 86 77 / SLB 2003 FORM 10-K
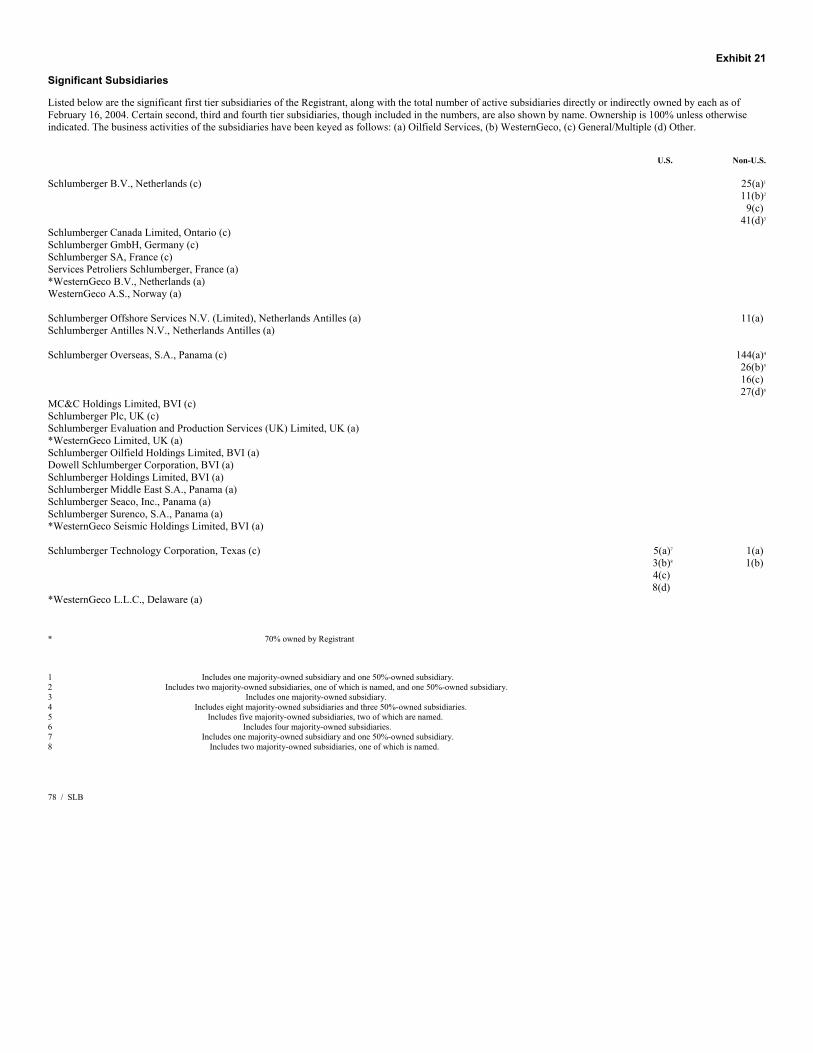
Exhibit 21 Significant Subsidiaries Listed below are the significant first tier subsidiaries of the Registrant, along with the total number of active subsidiaries directly or indirectly owned by each as of February 16, 2004. Certain second, third and fourth tier subsidiaries, though included in the numbers, are also shown by name. Ownership is 100% unless otherwise indicated. The business activities of the subsidiaries have been keyed as follows: (a) Oilfield Services, (b) WesternGeco, (c) General/Multiple (d) Other. U.S. Non-U.S. Schlumberger B.V., Netherlands (c)
25(a)1
11(b)2
9(c) 41(d)3
Schlumberger Canada Limited, Ontario (c) Schlumberger GmbH, Germany (c) Schlumberger SA, France (c) Services Petroliers Schlumberger, France (a) *WesternGeco B.V., Netherlands (a) WesternGeco A.S., Norway (a)
Schlumberger Offshore Services N.V. (Limited), Netherlands Antilles (a) Schlumberger Antilles N.V., Netherlands Antilles (a)
11(a)
Schlumberger Overseas, S.A., Panama (c)
144(a)4
26(b)5
16(c) 27(d)6
MC&C Holdings Limited, BVI (c) Schlumberger Plc, UK (c) Schlumberger Evaluation and Production Services (UK) Limited, UK (a) *WesternGeco Limited, UK (a) Schlumberger Oilfield Holdings Limited, BVI (a) Dowell Schlumberger Corporation, BVI (a) Schlumberger Holdings Limited, BVI (a) Schlumberger Middle East S.A., Panama (a) Schlumberger Seaco, Inc., Panama (a) Schlumberger Surenco, S.A., Panama (a) *WesternGeco Seismic Holdings Limited, BVI (a)
Schlumberger Technology Corporation, Texas (c)
5(a)7
3(b)8
4(c) 8(d)
1(a) 1(b)
*WesternGeco L.L.C., Delaware (a)
* 70% owned by Registrant
1 Includes one majority-owned subsidiary and one 50%-owned subsidiary. 2 Includes two majority-owned subsidiaries, one of which is named, and one 50%-owned subsidiary. 3 Includes one majority-owned subsidiary. 4 Includes eight majority-owned subsidiaries and three 50%-owned subsidiaries. 5 Includes five majority-owned subsidiaries, two of which are named. 6 Includes four majority-owned subsidiaries. 7 Includes one majority-owned subsidiary and one 50%-owned subsidiary. 8 Includes two majority-owned subsidiaries, one of which is named.
78 / SLB

Exhibit 23 Consent of Independent Accountants We hereby consent to the incorporation by reference in the Registration Statements on Forms S-8 (Nos. 33-35606; 33-47592; 33-86424; 333-40227; 333-62545; 333-36366; 333-36364; 333-67330; 333-104225), on Form S-3 (No. 333-108730) and on Form S-4 (No. 333-97899) of Schlumberger Limited, of our report dated February 25, 2004 relating to the consolidated financial statements, which appears in this Annual Report on Form 10-K. /S/ PRICEWATERHOUSECOOPERS LLP
PricewaterhouseCoopers LLP New York, New York March 3, 2004 79 / SLB
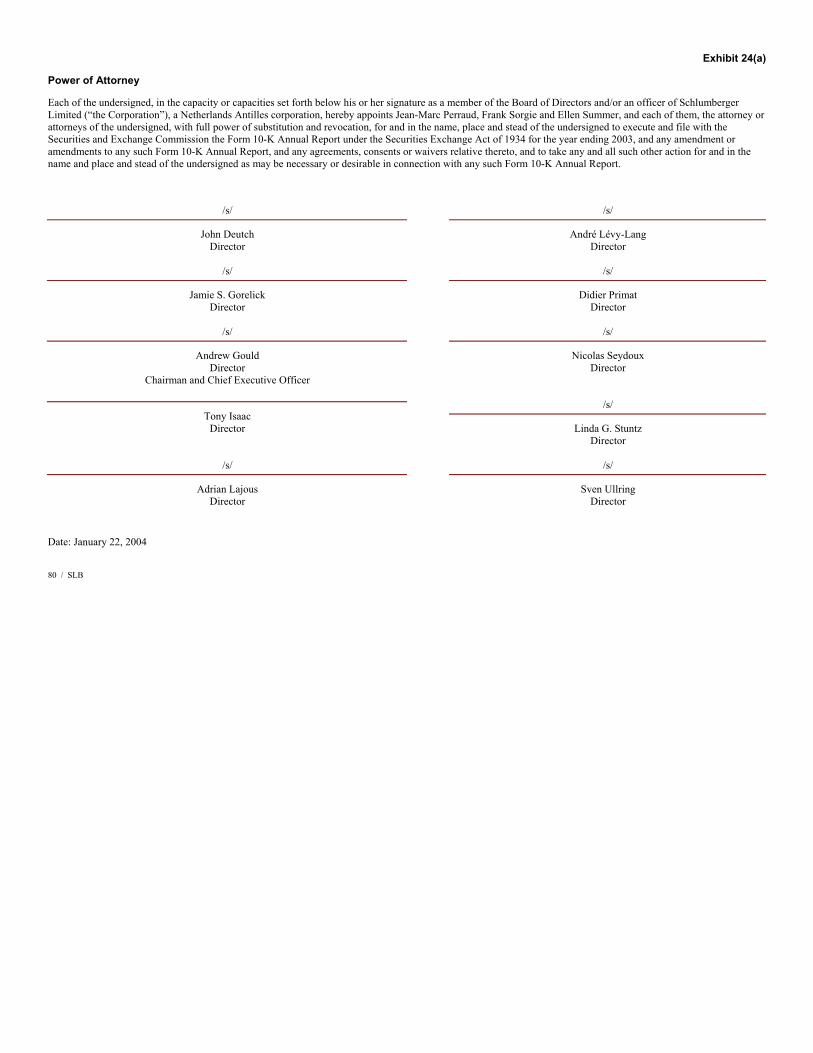
Exhibit 24(a) Power of Attorney Each of the undersigned, in the capacity or capacities set forth below his or her signature as a member of the Board of Directors and/or an officer of Schlumberger Limited (“the Corporation”), a Netherlands Antilles corporation, hereby appoints Jean-Marc Perraud, Frank Sorgie and Ellen Summer, and each of them, the attorney or attorneys of the undersigned, with full power of substitution and revocation, for and in the name, place and stead of the undersigned to execute and file with the Securities and Exchange Commission the Form 10-K Annual Report under the Securities Exchange Act of 1934 for the year ending 2003, and any amendment or amendments to any such Form 10-K Annual Report, and any agreements, consents or waivers relative thereto, and to take any and all such other action for and in the name and place and stead of the undersigned as may be necessary or desirable in connection with any such Form 10-K Annual Report.
/s/
John Deutch Director
/s/
André Lévy-Lang Director
/s/
Jamie S. Gorelick Director
/s/
Didier Primat Director
/s/
Andrew Gould Director
Chairman and Chief Executive Officer
/s/
Nicolas Seydoux Director
Tony Isaac Director
/s/
Linda G. Stuntz Director
/s/
Adrian Lajous Director
/s/
Sven Ullring Director
Date: January 22, 2004 80 / SLB
Exhibit 24(b) Power of Attorney Each of the undersigned, in the capacity or capacities set forth below his or her signature as a member of the Board of Directors and/or an officer of Schlumberger Limited (“the Corporation”), a Netherlands Antilles corporation, hereby appoints Jean-Marc Perraud, Frank Sorgie and Ellen Summer, and each of them, the attorney or attorneys of the undersigned, with full power of substitution and revocation, for and in the name, place and stead of the undersigned to execute and file with the Securities and Exchange Commission the Form 10-K Annual Report under the Securities Exchange Act of 1934 for the year ending 2003, and any amendment or amendments to any such Form 10-K Annual Report, and any agreements, consents or waivers relative thereto, and to take any and all such other action for and in the name and place and stead of the undersigned as may be necessary or desirable in connection with any such Form 10-K Annual Report.
John Deutch Director
André Lévy-Lang Director
Jamie S. Gorelick Director
Didier Primat Director
Andrew Gould Director
Chairman and Chief Executive Officer
Nicolas Seydoux Director
/s/
Tony Isaac Director
Linda G. Stuntz Director
Adrian Lajous Director
Sven Ullring Director
Date: January 29, 2004 81 / SLB
Exhibit 31(a) CERTIFICATION OF CHIEF EXECUTIVE OFFICER I, Andrew Gould, certify that: 1. I have reviewed this annual report on Form 10-K of Schlumberger Limited; 2. Based on my knowledge, this report does not contain any untrue statement of a material fact or omit to state a material fact necessary to make the statements made, in light of the circumstances under which such statements were made, not misleading with respect to the period covered by this report; 3. Based on my knowledge, the financial statements, and other financial information included in this report, fairly present in all material respects the financial condition, results of operations and cash flows of the registrant as of, and for, the periods presented in this report; 4. The registrant’s other certifying officer and I are responsible for establishing and maintaining disclosure controls and procedures (as defined in Exchange Act Rules 13a-15(e) and 15d-15(e)) for the registrant and have:
a) Designed such disclosure controls and procedures, or caused such disclosure controls and procedures to be designed under our supervision, to ensure that
material information relating to the registrant, including its consolidated subsidiaries, is made known to us by others within those entities, particularly during the period in which this report is being prepared;
b) Evaluated the effectiveness of the registrant’s disclosure controls and procedures and presented in this report our conclusions about the effectiveness of the disclosure controls and procedures, as of the end of the period covered by this report based on such evaluation; and
c) Disclosed in this report any change in the registrant’s internal control over financial reporting that occurred during the registrant’s most recent fiscal
quarter (the registrant’s fourth fiscal quarter in the case of an annual report) that has materially affected, or is reasonably likely to materially affect, the registrant’s internal control over financial reporting; and
5. The registrant’s other certifying officer and I have disclosed, based on our most recent evaluation of internal control over financial reporting, to the registrant’s auditors and the audit committee of the registrant’s board of directors (or persons fulfilling the equivalent functions);
a) All significant deficiencies and material weaknesses in the design or operation of internal control over financial reporting which are reasonably likely to adversely affect the registrant’s ability to record, process, summarize and report financial information; and
b) Any fraud, whether or not material, that involves management or other employees who have a significant role in the registrant’s internal control over financial reporting.
Date: March 3, 2004
/s/ Andrew Gould
Andrew Gould Chairman and Chief Executive Officer
82 / SLB
Exhibit 31(b) CERTIFICATION OF CHIEF FINANCIAL OFFICER I, Jean-Marc Perraud, certify that: 1. I have reviewed this annual report on Form 10-K of Schlumberger Limited; 2. Based on my knowledge, this report does not contain any untrue statement of a material fact or omit to state a material fact necessary to make the statements made, in light of the circumstances under which such statements were made, not misleading with respect to the period covered by this report; 3. Based on my knowledge, the financial statements, and other financial information included in this report, fairly present in all material respects the financial condition, results of operations and cash flows of the registrant as of, and for, the periods presented in this report; 4. The registrant’s other certifying officer and I are responsible for establishing and maintaining disclosure controls and procedures (as defined in Exchange Act Rules 13a-15(e) and 15d-15(e)) for the registrant and have:
a) Designed such disclosure controls and procedures, or caused such disclosure controls and procedures to be designed under our supervision, to ensure that
material information relating to the registrant, including its consolidated subsidiaries, is made known to us by others within those entities, particularly during the period in which this report is being prepared;
b) Evaluated the effectiveness of the registrant’s disclosure controls and procedures and presented in this report our conclusions about the effectiveness of the disclosure controls and procedures, as of the end of the period covered by this report based on such evaluation; and
c) Disclosed in this report any change in the registrant’s internal control over financial reporting that occurred during the registrant’s most recent fiscal
quarter (the registrant’s fourth fiscal quarter in the case of an annual report) that has materially affected, or is reasonably likely to materially affect, the registrant’s internal control over financial reporting; and
5. The registrant’s other certifying officer and I have disclosed, based on our most recent evaluation of internal control over financial reporting, to the registrant’s auditors and the audit committee of the registrant’s board of directors (or persons fulfilling the equivalent functions);
a) All significant deficiencies and material weaknesses in the design or operation of internal control over financial reporting which are reasonably likely to adversely affect the registrant’s ability to record, process, summarize and report financial information; and
b) Any fraud, whether or not material, that involves management or other employees who have a significant role in the registrant’s internal control over financial reporting.
Date: March 3, 2004
/s/ Jean-Marc Perraud
Jean-Marc Perraud Executive Vice President and Chief Financial Officer
83 / SLB
Exhibit 32(a) CERTIFICATION OF CHIEF EXECUTIVE OFFICER PURSUANT TO 18 U.S.C. SECTION 1350 AS ADOPTED PURSUANT TO SECTION 906 OF THE SARBANES-OXLEY ACT OF 2002 In connection with the Annual Report of Schlumberger N.V. (Schlumberger Limited) (the “Company”) on Form 10-K for the year ended December 31, 2003 as filed with the Securities and Exchange Commission on the date hereof (the “Report”), I, Andrew Gould, Chairman and Chief Executive Officer of the Company, certify, pursuant to 18 U.S.C. § 1350, as adopted pursuant to § 906 of the Sarbanes-Oxley Act of 2002, that: (1) The Report fully complies with the requirements of section 13(a) or 15(d) of the Securities Exchange Act of 1934; and (2) The information contained in the Report fairly presents, in all material respects, the financial condition and result of operations of the Company. Date: March 3, 2004
/s/ Andrew Gould
Andrew Gould Chairman and Chief Executive Officer
A signed original of this written statement required by section 906 has been provided to Schlumberger Limited and will be retained by Schlumberger Limited and furnished to the Securities and Exchange Commission or its staff upon request. This certification accompanies the report pursuant to Section 906 of the Sarbanes-Oxley Act of 2002 and shall not be deemed filed by the Company for purposes of Section 18 of the Exchange Act of 1934, as amended. 84 / SLB
Exhibit 32(b) CERTIFICATION OF CHIEF FINANCIAL OFFICER PURSUANT TO 18 U.S.C. SECTION 1350 AS ADOPTED PURSUANT TO SECTION 906 OF THE SARBANES-OXLEY ACT OF 2002 In connection with the Annual Report of Schlumberger N.V. (Schlumberger Limited) (the “Company”) on Form 10-K for the year ended December 31, 2003 as filed with the Securities and Exchange Commission on the date hereof (the “Report”), I, Jean-Marc Perraud, Executive Vice President and Chief Financial Officer of the Company, certify, pursuant to 18 U.S.C. § 1350, as adopted pursuant to § 906 of the Sarbanes-Oxley Act of 2002, that: (1) The Report fully complies with the requirements of section 13(a) or 15(d) of the Securities Exchange Act of 1934; and (2) The information contained in the Report fairly presents, in all material respects, the financial condition and result of operations of the Company. Date: March 3, 2004
/s/ Jean-Marc Perraud
Jean-Marc Perraud Executive Vice President and Chief Financial Officer
A signed original of this written statement required by section 906 has been provided to Schlumberger Limited and will be retained by Schlumberger Limited and furnished to the Securities and Exchange Commission or its staff upon request. This certification accompanies the report pursuant to Section 906 of the Sarbanes-Oxley Act of 2002 and shall not be deemed filed by the Company for purposes of Section 18 of the Exchange Act of 1934, as amended. 85 / SLB

Exhibit 99 For the purposes of complying with the amendments to the rules governing Form S-8 (effective July 13, 1990) under the Securities Act of 1933, the undersigned registrant hereby undertakes as follows, which undertaking shall be incorporated by reference into Registrant’s Registration Statements on Form S-8 Nos. 33-35606; 33-47592; 33-86424; 333-40227; 333-62545; 333-36366; 333-36364, 333-67330 and 333-104225. Insofar as indemnification for liabilities arising under the Securities Act of 1933 may be permitted to directors, officers and controlling persons of the registrant pursuant to the foregoing provisions, or otherwise, the registrant has been advised that in the opinion of the Securities and Exchange Commission such indemnification is against public policy as expressed in the Securities Act of 1933 and is, therefore, unenforceable. In the event that a claim for indemnification against such liabilities (other than the payment by the registrant of expenses incurred or paid by a director, officer or controlling person of the registrant in the successful defense of any action, suit or proceeding) is asserted by such director, officer or controlling person in connection with the securities being registered, the registrant will, unless in the opinion of its counsel the matter has been settled by controlling precedent, submit to a court of appropriate jurisdiction the question whether such indemnification by it is against public policy as expressed in the Act and will be governed by the final adjudication of such issue. 86 / SLB
_______________________________________________ Created by 10KWizard Technology www.10KWizard.com

Schlumberger Limited153 East 53rd Street, 57th Floor, New York, New York 10022
42, Rue Saint-Dominique, 75007 Paris
Parkstraat 83, 2514 JG The Hague
www.slb.com