scenarios and metrics as guides to a sustainable future: the case of energy supply
TRANSCRIPT
0957–5820/03/$23.50+0.00# Institution of Chemical Engineers
www.ingentaselect.com=titles=09575820.htm Trans IChemE, Vol 81, Part B, September 2003
SCENARIOS AND METRICS AS GUIDES TO ASUSTAINABLE FUTURE
The Case of Energy Supply
R. C. DARTONDepartment of Engineering Science, University of Oxford, Oxford, UK
W orld energy demand is expected to increase to several times its current level over thenext 50 years. Much of this energy will come from fossil fuel, a � nite resource,which moreover generates carbon dioxide, a cause of global warming. The incentive
to develop other, renewable forms of energy is therefore strong, but how can we be sure that ourexpectations for the future form a rational basis for determining energy policy? The scenarioplanning technique does not attempt to predict the future, but offers a variety of visions againstwhich current actions and policies can be tested. To guide the move towards a more sustainablefuture it is also important to be able to monitor our progress. The use of sustainability metrics,tailored to a particular purpose, and relating to resource ef� ciency, environmental protection,economic bene� ts and social development, is a way of quantifying this progress. The set ofindicators illustrates the ‘sustainability footprint’ of an enterprise.
Keywords: sustainable development; sustainability indicator; metric; scenario; energy.
INTRODUCTION
‘No man is an island’ wrote John Donne, poet, churchmanand contemporary of Shakespeare. In recent times ourmutual interdependence has become ever more apparent.Trade furnishes us with vital products from faraway places,and pollution, whether radioactive fall-out or acid rain,knows no national barriers.
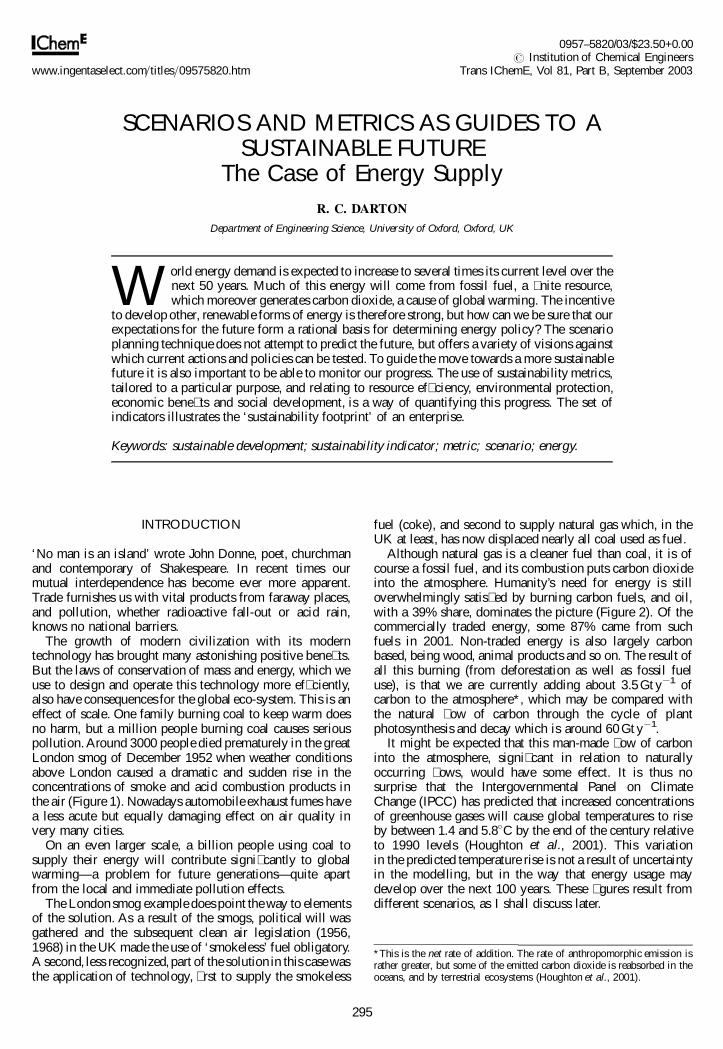
The growth of modern civilization with its moderntechnology has brought many astonishing positive bene� ts.But the laws of conservation of mass and energy, which weuse to design and operate this technology more ef� ciently,also have consequences for the global eco-system. This is aneffect of scale. One family burning coal to keep warm doesno harm, but a million people burning coal causes seriouspollution. Around 3000 people died prematurely in the greatLondon smog of December 1952 when weather conditionsabove London caused a dramatic and sudden rise in theconcentrations of smoke and acid combustion products inthe air (Figure 1). Nowadays automobile exhaust fumes havea less acute but equally damaging effect on air quality invery many cities.
On an even larger scale, a billion people using coal tosupply their energy will contribute signi� cantly to globalwarming—a problem for future generations—quite apartfrom the local and immediate pollution effects.
The London smog example does point the way to elementsof the solution. As a result of the smogs, political will wasgathered and the subsequent clean air legislation (1956,1968) in the UK made the use of ‘smokeless’ fuel obligatory.A second, less recognized, part of the solution in this case wasthe application of technology, � rst to supply the smokeless
fuel (coke), and second to supply natural gas which, in theUK at least, has now displaced nearly all coal used as fuel.
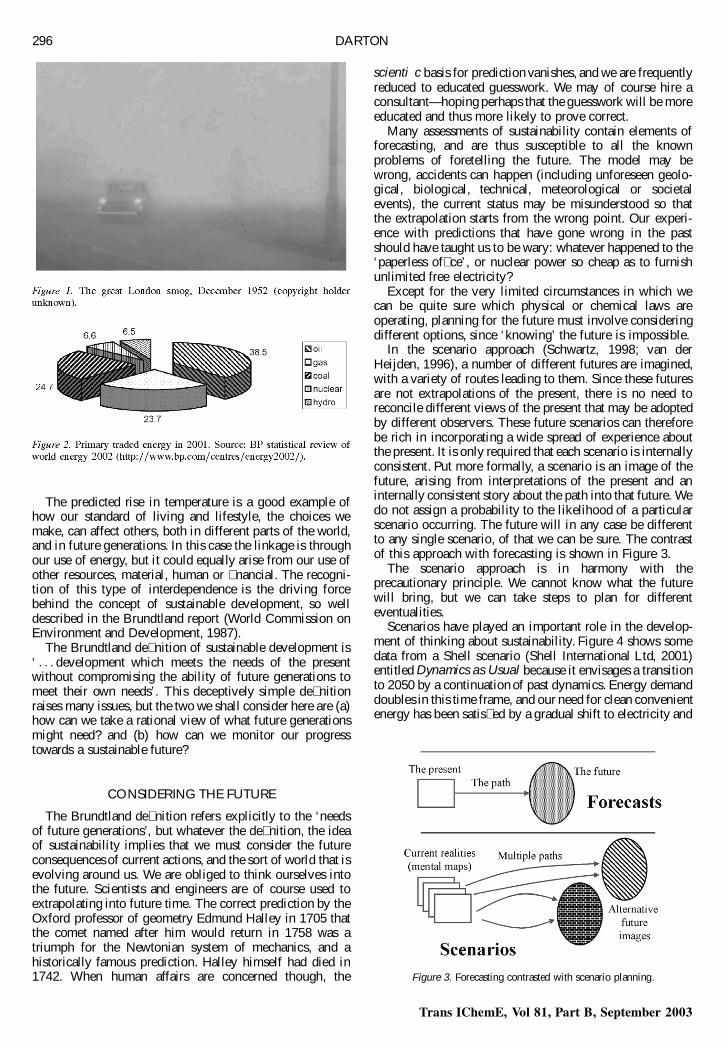
Although natural gas is a cleaner fuel than coal, it is ofcourse a fossil fuel, and its combustion puts carbon dioxideinto the atmosphere. Humanity’s need for energy is stilloverwhelmingly satis� ed by burning carbon fuels, and oil,with a 39% share, dominates the picture (Figure 2). Of thecommercially traded energy, some 87% came from suchfuels in 2001. Non-traded energy is also largely carbonbased, being wood, animal products and so on. The result ofall this burning (from deforestation as well as fossil fueluse), is that we are currently adding about 3.5 Gt y¡1 ofcarbon to the atmosphere*, which may be compared withthe natural � ow of carbon through the cycle of plantphotosynthesis and decay which is around 60 Gt y¡1.
It might be expected that this man-made � ow of carboninto the atmosphere, signi� cant in relation to naturallyoccurring � ows, would have some effect. It is thus nosurprise that the Intergovernmental Panel on ClimateChange (IPCC) has predicted that increased concentrationsof greenhouse gases will cause global temperatures to riseby between 1.4 and 5.8¯C by the end of the century relativeto 1990 levels (Houghton et al., 2001). This variationin the predicted temperature rise is not a result of uncertaintyin the modelling, but in the way that energy usage maydevelop over the next 100 years. These � gures result fromdifferent scenarios, as I shall discuss later.
295
*This is the net rate of addition. The rate of anthropomorphic emission israther greater, but some of the emitted carbon dioxide is reabsorbed in theoceans, and by terrestrial ecosystems (Houghton et al., 2001).
The predicted rise in temperature is a good example ofhow our standard of living and lifestyle, the choices wemake, can affect others, both in different parts of the world,and in future generations. In this case the linkage is throughour use of energy, but it could equally arise from our use ofother resources, material, human or � nancial. The recogni-tion of this type of interdependence is the driving forcebehind the concept of sustainable development, so welldescribed in the Brundtland report (World Commission onEnvironment and Development, 1987).
The Brundtland de� nition of sustainable development is‘ . . . development which meets the needs of the presentwithout compromising the ability of future generations tomeet their own needs’. This deceptively simple de� nitionraises many issues, but the two we shall consider here are (a)how can we take a rational view of what future generationsmight need? and (b) how can we monitor our progresstowards a sustainable future?
CONSIDERING THE FUTURE
The Brundtland de� nition refers explicitly to the ‘needsof future generations’, but whatever the de� nition, the ideaof sustainability implies that we must consider the futureconsequences of current actions, and the sort of world that isevolving around us. We are obliged to think ourselves intothe future. Scientists and engineers are of course used toextrapolating into future time. The correct prediction by theOxford professor of geometry Edmund Halley in 1705 thatthe comet named after him would return in 1758 was atriumph for the Newtonian system of mechanics, and ahistorically famous prediction. Halley himself had died in1742. When human affairs are concerned though, the
scienti�c basis for prediction vanishes, and we are frequentlyreduced to educated guesswork. We may of course hire aconsultant—hoping perhaps that the guesswork will be moreeducated and thus more likely to prove correct.
Many assessments of sustainability contain elements offorecasting, and are thus susceptible to all the knownproblems of foretelling the future. The model may bewrong, accidents can happen (including unforeseen geolo-gical, biological, technical, meteorological or societalevents), the current status may be misunderstood so thatthe extrapolation starts from the wrong point. Our experi-ence with predictions that have gone wrong in the pastshould have taught us to be wary: whatever happened to the‘paperless of� ce’, or nuclear power so cheap as to furnishunlimited free electricity?
Except for the very limited circumstances in which wecan be quite sure which physical or chemical laws areoperating, planning for the future must involve consideringdifferent options, since ‘knowing’ the future is impossible.
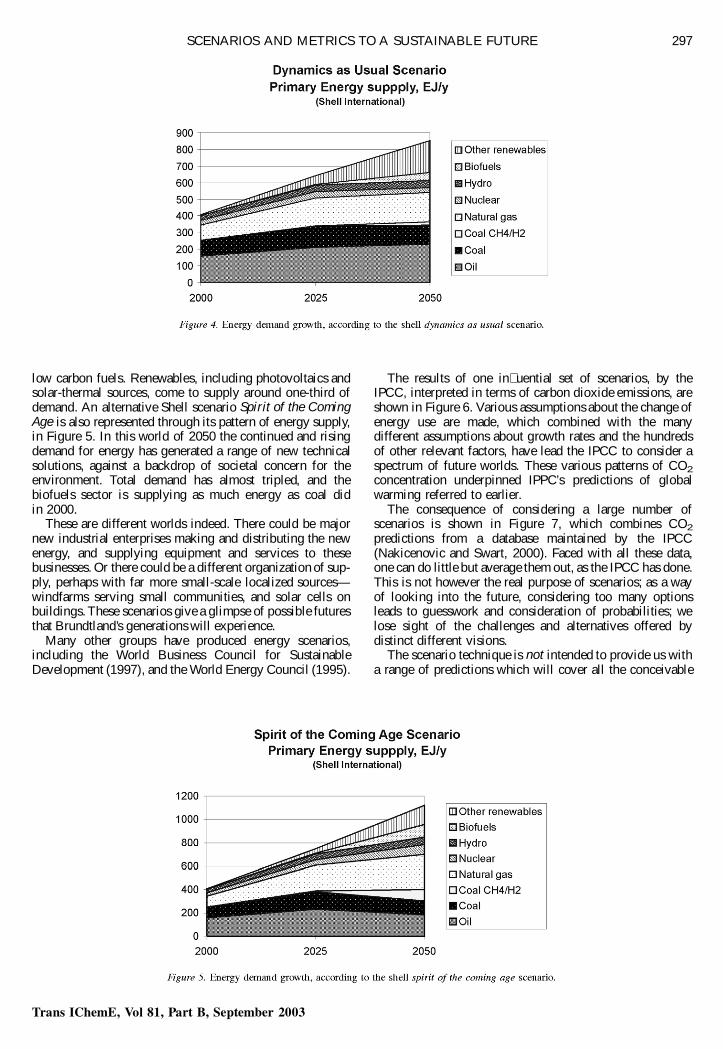
In the scenario approach (Schwartz, 1998; van derHeijden, 1996), a number of different futures are imagined,with a variety of routes leading to them. Since these futuresare not extrapolations of the present, there is no need toreconcile different views of the present that may be adoptedby different observers. These future scenarios can thereforebe rich in incorporating a wide spread of experience aboutthe present. It is only required that each scenario is internallyconsistent. Put more formally, a scenario is an image of thefuture, arising from interpretations of the present and aninternally consistent story about the path into that future. Wedo not assign a probability to the likelihood of a particularscenario occurring. The future will in any case be differentto any single scenario, of that we can be sure. The contrastof this approach with forecasting is shown in Figure 3.
The scenario approach is in harmony with theprecautionary principle. We cannot know what the futurewill bring, but we can take steps to plan for differenteventualities.
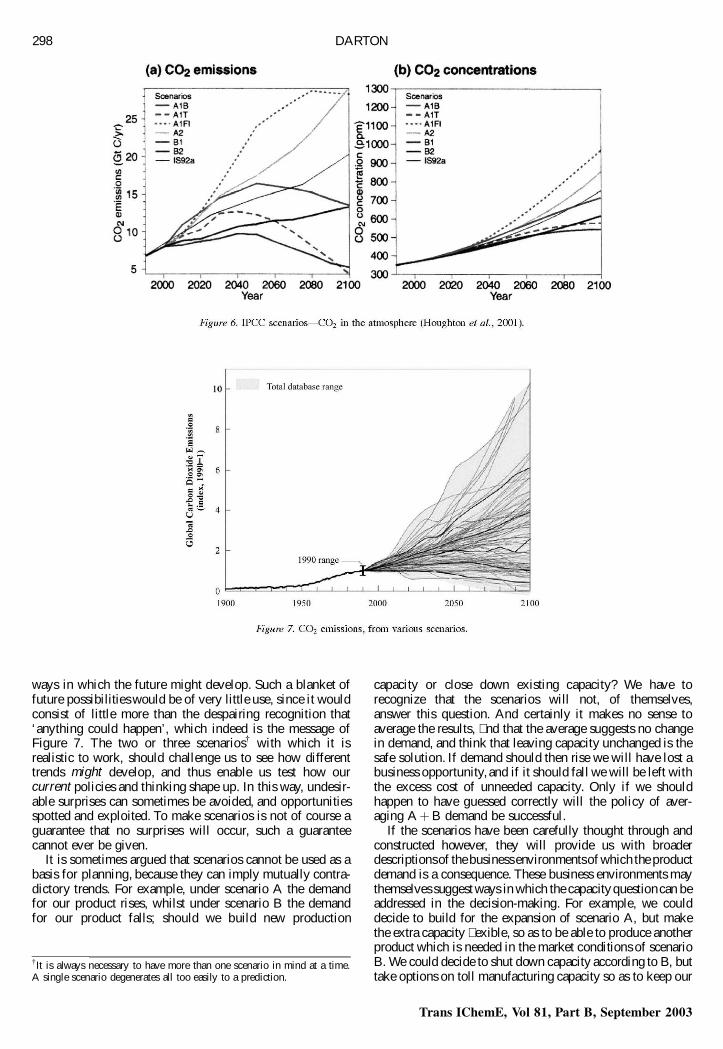
Scenarios have played an important role in the develop-ment of thinking about sustainability. Figure 4 shows somedata from a Shell scenario (Shell International Ltd, 2001)entitled Dynamics as Usual because it envisages a transitionto 2050 by a continuation of past dynamics. Energy demanddoubles in this time frame, and our need for clean convenientenergy has been satis� ed by a gradual shift to electricity and
Figure 3. Forecasting contrasted with scenario planning.
Trans IChemE, Vol 81, Part B, September 2003
296 DARTON
low carbon fuels. Renewables, including photovoltaics andsolar-thermal sources, come to supply around one-third ofdemand. An alternative Shell scenario Spirit of the ComingAge is also represented through its pattern of energy supply,in Figure 5. In this world of 2050 the continued and risingdemand for energy has generated a range of new technicalsolutions, against a backdrop of societal concern for theenvironment. Total demand has almost tripled, and thebiofuels sector is supplying as much energy as coal didin 2000.
These are different worlds indeed. There could be majornew industrial enterprises making and distributing the newenergy, and supplying equipment and services to thesebusinesses. Or there could be a different organization of sup-ply, perhaps with far more small-scale localized sources—windfarms serving small communities, and solar cells onbuildings. These scenarios give a glimpse of possible futuresthat Brundtland’s generations will experience.
Many other groups have produced energy scenarios,including the World Business Council for SustainableDevelopment (1997), and the World Energy Council (1995).
The results of one in� uential set of scenarios, by theIPCC, interpreted in terms of carbon dioxide emissions, areshown in Figure 6. Various assumptions about the change ofenergy use are made, which combined with the manydifferent assumptions about growth rates and the hundredsof other relevant factors, have lead the IPCC to consider aspectrum of future worlds. These various patterns of CO2concentration underpinned IPPC’s predictions of globalwarming referred to earlier.
The consequence of considering a large number ofscenarios is shown in Figure 7, which combines CO2
predictions from a database maintained by the IPCC(Nakicenovic and Swart, 2000). Faced with all these data,one can do little but average them out, as the IPCC has done.This is not however the real purpose of scenarios; as a wayof looking into the future, considering too many optionsleads to guesswork and consideration of probabilities; welose sight of the challenges and alternatives offered bydistinct different visions.
The scenario technique is not intended to provide us witha range of predictions which will cover all the conceivable
Trans IChemE, Vol 81, Part B, September 2003
SCENARIOS AND METRICS TO A SUSTAINABLE FUTURE 297
ways in which the future might develop. Such a blanket offuture possibilities would be of very little use, since it wouldconsist of little more than the despairing recognition that‘anything could happen’, which indeed is the message ofFigure 7. The two or three scenarios{ with which it isrealistic to work, should challenge us to see how differenttrends might develop, and thus enable us test how ourcurrent policies and thinking shape up. In this way, undesir-able surprises can sometimes be avoided, and opportunitiesspotted and exploited. To make scenarios is not of course aguarantee that no surprises will occur, such a guaranteecannot ever be given.
It is sometimes argued that scenarios cannot be used as abasis for planning, because they can imply mutually contra-dictory trends. For example, under scenario A the demandfor our product rises, whilst under scenario B the demandfor our product falls; should we build new production
capacity or close down existing capacity? We have torecognize that the scenarios will not, of themselves,answer this question. And certainly it makes no sense toaverage the results, � nd that the average suggests no changein demand, and think that leaving capacity unchanged is thesafe solution. If demand should then rise we will have lost abusiness opportunity, and if it should fall we will be left withthe excess cost of unneeded capacity. Only if we shouldhappen to have guessed correctly will the policy of aver-aging A ‡ B demand be successful.
If the scenarios have been carefully thought through andconstructed however, they will provide us with broaderdescriptionsof the businessenvironmentsof which the productdemand is a consequence. These business environments maythemselves suggest ways in which the capacityquestioncan beaddressed in the decision-making. For example, we coulddecide to build for the expansion of scenario A, but makethe extra capacity � exible, so as to be able to produce anotherproduct which is needed in the market conditions of scenarioB. We could decide to shut down capacity according to B, buttake options on toll manufacturing capacity so as to keep our
{It is always necessary to have more than one scenario in mind at a time.A single scenario degenerates all too easily to a prediction.
Trans IChemE, Vol 81, Part B, September 2003
298 DARTON
customers satis� ed in the event of an increase in demand.Other possibilities may also emerge when the decision isconsidered in a ‘what if’ light, bearing in mind that thefuture may be neither pure A nor pure B.
The recognition that the future can develop in differentways, thus challenges us to use our ingenuity to devise� exible responses, and to evaluate in advance what theconsequences of our actions will be. Clearly, the bene� t ofthe scenarios will be heavily dependent on their quality—theimagination that has been put into devising their keyfeatures and the skill with which they are woven intocoherent pictures. They must also address the issues relevantto the decisions to be made, as is the case with the energyscenarios mentioned earlier.
ASSESSING OUR PROGRESS
The wish to progress towards a more sustainable futureraises the issue of measurement. We must be able to measuresustainability in order to check whether a new policy ordecision or technical innovation is making things better orworse. All these changes might affect future generations insome way, but by how much, and are there alternativeswhich will have a lesser and perhaps negligible effect?Without some measuring system, we can neither identifyareas of concern nor direct our actions. This need formeasurement, which is common to all attempts to applysustainability thinking, has given rise to the concept ofsustainability indicators, or metrics (Bell and Morse, 1999).
A sustainability indicator is a measure of the degree ofsustainability of some particular feature of our world. Insome cases the indicator is an indirect or surrogate measure,because the feature in which we are really interested cannotbe quanti� ed. Sustainability is a holistic property involvingthe three aspects of economic, environmental and social
development, so these indicators are generally considered insets, and to be a true measure of sustainability, the set mustinclude indicators of all three aspects (otherwise you aremeasuring something else).
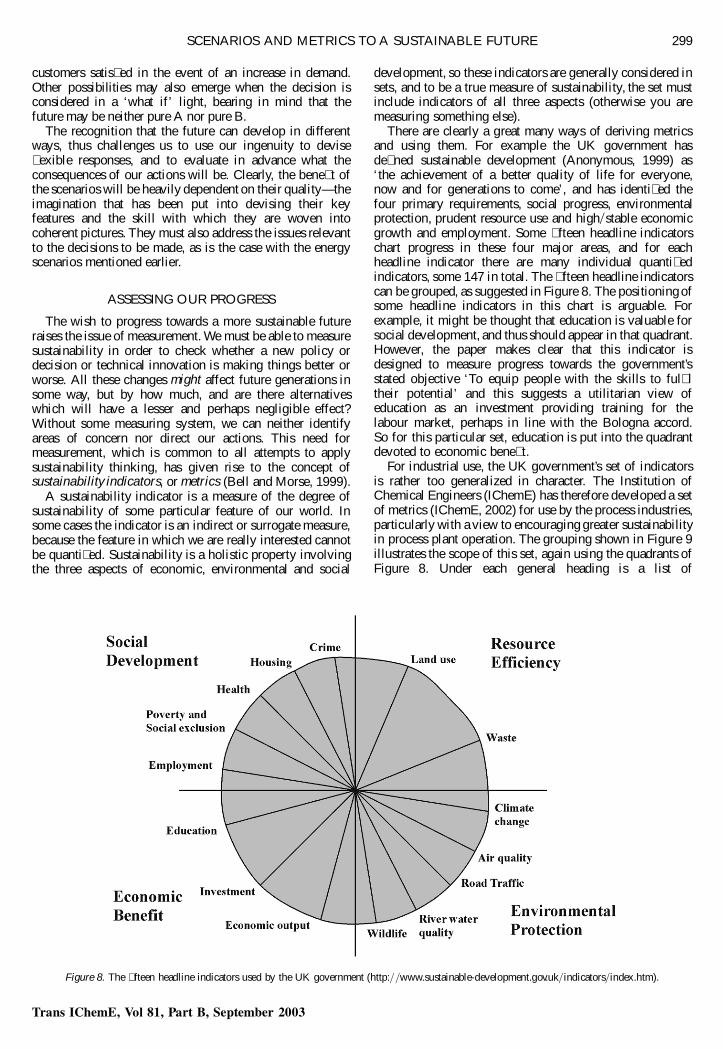
There are clearly a great many ways of deriving metricsand using them. For example the UK government hasde� ned sustainable development (Anonymous, 1999) as‘the achievement of a better quality of life for everyone,now and for generations to come’, and has identi� ed thefour primary requirements, social progress, environmentalprotection, prudent resource use and high=stable economicgrowth and employment. Some � fteen headline indicatorschart progress in these four major areas, and for eachheadline indicator there are many individual quanti� edindicators, some 147 in total. The � fteen headline indicatorscan be grouped, as suggested in Figure 8. The positioning ofsome headline indicators in this chart is arguable. Forexample, it might be thought that education is valuable forsocial development, and thus should appear in that quadrant.However, the paper makes clear that this indicator isdesigned to measure progress towards the government’sstated objective ‘To equip people with the skills to ful� ltheir potential’ and this suggests a utilitarian view ofeducation as an investment providing training for thelabour market, perhaps in line with the Bologna accord.So for this particular set, education is put into the quadrantdevoted to economic bene� t.
For industrial use, the UK government’s set of indicatorsis rather too generalized in character. The Institution ofChemical Engineers (IChemE) has therefore developed a setof metrics (IChemE, 2002) for use by the process industries,particularly with a view to encouraging greater sustainabilityin process plant operation. The grouping shown in Figure 9illustrates the scope of this set, again using the quadrants ofFigure 8. Under each general heading is a list of
Figure 8. The � fteen headline indicators used by the UK government (http:==www.sustainable-development.gov.uk=indicators=index.htm).
Trans IChemE, Vol 81, Part B, September 2003
SCENARIOS AND METRICS TO A SUSTAINABLE FUTURE 299
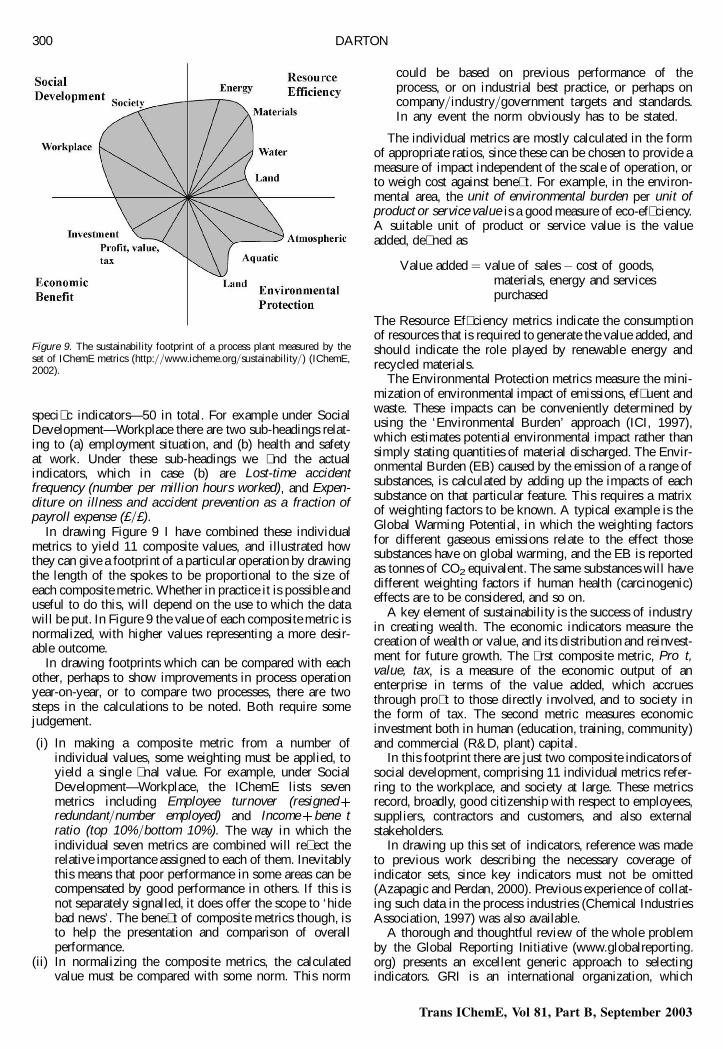
speci� c indicators—50 in total. For example under SocialDevelopment—Workplace there are two sub-headings relat-ing to (a) employment situation, and (b) health and safetyat work. Under these sub-headings we � nd the actualindicators, which in case (b) are Lost-time accidentfrequency (number per million hours worked), and Expen-diture on illness and accident prevention as a fraction ofpayroll expense (£=£).
In drawing Figure 9 I have combined these individualmetrics to yield 11 composite values, and illustrated howthey can give a footprint of a particular operation by drawingthe length of the spokes to be proportional to the size ofeach composite metric. Whether in practice it is possible anduseful to do this, will depend on the use to which the datawill be put. In Figure 9 the value of each composite metric isnormalized, with higher values representing a more desir-able outcome.
In drawing footprints which can be compared with eachother, perhaps to show improvements in process operationyear-on-year, or to compare two processes, there are twosteps in the calculations to be noted. Both require somejudgement.
(i) In making a composite metric from a number ofindividual values, some weighting must be applied, toyield a single � nal value. For example, under SocialDevelopment—Workplace, the IChemE lists sevenmetrics including Employee turnover (resignedredundant=number employed) and Income bene� tratio (top 10%=bottom 10%). The way in which theindividual seven metrics are combined will re� ect therelative importance assigned to each of them. Inevitablythis means that poor performance in some areas can becompensated by good performance in others. If this isnot separately signalled, it does offer the scope to ‘hidebad news’. The bene� t of composite metrics though, isto help the presentation and comparison of overallperformance.
(ii) In normalizing the composite metrics, the calculatedvalue must be compared with some norm. This norm
could be based on previous performance of theprocess, or on industrial best practice, or perhaps oncompany=industry=government targets and standards.In any event the norm obviously has to be stated.
The individual metrics are mostly calculated in the formof appropriate ratios, since these can be chosen to provide ameasure of impact independent of the scale of operation, orto weigh cost against bene� t. For example, in the environ-mental area, the unit of environmental burden per unit ofproduct or service value is a good measure of eco-ef� ciency.A suitable unit of product or service value is the valueadded, de� ned as
Value added ˆ value of sales ¡ cost of goods,materials, energy and servicespurchased
The Resource Ef� ciency metrics indicate the consumptionof resources that is required to generate the value added, andshould indicate the role played by renewable energy andrecycled materials.
The Environmental Protection metrics measure the mini-mization of environmental impact of emissions, ef� uent andwaste. These impacts can be conveniently determined byusing the ‘Environmental Burden’ approach (ICI, 1997),which estimates potential environmental impact rather thansimply stating quantities of material discharged. The Envir-onmental Burden (EB) caused by the emission of a range ofsubstances, is calculated by adding up the impacts of eachsubstance on that particular feature. This requires a matrixof weighting factors to be known. A typical example is theGlobal Warming Potential, in which the weighting factorsfor different gaseous emissions relate to the effect thosesubstances have on global warming, and the EB is reportedas tonnes of CO2 equivalent. The same substances will havedifferent weighting factors if human health (carcinogenic)effects are to be considered, and so on.
A key element of sustainability is the success of industryin creating wealth. The economic indicators measure thecreation of wealth or value, and its distribution and reinvest-ment for future growth. The � rst composite metric, Pro� t,value, tax, is a measure of the economic output of anenterprise in terms of the value added, which accruesthrough pro� t to those directly involved, and to society inthe form of tax. The second metric measures economicinvestment both in human (education, training, community)and commercial (R&D, plant) capital.
In this footprint there are just two composite indicators ofsocial development, comprising 11 individual metrics refer-ring to the workplace, and society at large. These metricsrecord, broadly, good citizenship with respect to employees,suppliers, contractors and customers, and also externalstakeholders.
In drawing up this set of indicators, reference was madeto previous work describing the necessary coverage ofindicator sets, since key indicators must not be omitted(Azapagic and Perdan, 2000). Previous experience of collat-ing such data in the process industries (Chemical IndustriesAssociation, 1997) was also available.
A thorough and thoughtful review of the whole problemby the Global Reporting Initiative (www.globalreporting.org) presents an excellent generic approach to selectingindicators. GRI is an international organization, which
Figure 9. The sustainability footprint of a process plant measured by theset of IChemE metrics (http:==www.icheme.org=sustainability=) (IChemE,2002).
Trans IChemE, Vol 81, Part B, September 2003
300 DARTON
has support from governments, industry, NGOs and the UN.The GRI philosophy of measuring and reporting sustain-ability owes a great deal to accounting practice, in particularits use of ratios such as ‘return on capital employed’, ‘debtto equity ratio’ and so on. GRI recommends an approach tosustainability metrics that extends this concept of key� nancial ratios into areas dealing with environmentalresponsibility and social development. GRI also points outthe bene� t of tailoring metrics to a particular situation, andIChemE recommends that, while its recommended progressmetrics form a good basic set, extra metrics should bedevised by the user to cover all additional importantfeatures.
THE DRIVE TOWARDS RENEWABLE ENERGY
The major sources of renewable energy are hydroelectricpower, conversion of biomass (if grown sustainably), windpower, solar thermal, photovoltaics, geothermal power andtidal=wave power (Boyle, 1998). At the moment only hydro-electric power plays any signi� cant role in global terms(Figure 2), though even small sources can be important innichemarkets. Geothermal power for example supplies13% ofIceland’s electricity, nearly all the rest being hydroelectricity.
The two major drivers towards the development ofsources of renewable energy are concern about the � nitenature of the reserves of fossil fuel, and concern aboutglobal warming caused by rising levels of carbon dioxide inthe atmosphere. Both these concerns are re� ected in thesustainability metrics. Consumption of � nite resources,including fossil fuel, reduces the sustainability of an opera-tion, as does the emission of CO2 and other combustionproducts. These two effects are quanti� ed by metrics in theResource Ef� ciency and Environmental Protection quad-rants of Figure 9. In these respects the use of renewableenergy in place of fossil fuels will improve sustainability.
However, sustainability is a holistic property, and itsassessment requires all aspects to be taken into account. Ifthe renewable energy is more expensive, the value added inany manufacturing operation will be reduced, other costsremaining the same. The economic bene� ts of the operationwill thus be reduced, and the resource consumption per unitadded value will rise. In fact all impacts per unit added valuewill rise, which is bad for sustainability.
In particular cases there may be other considerationsaffecting the choice of energy source—for example thesocial cost involved in closing a coal mine, or the negativeenvironmental impact of building a wind farm in a country-side location. The sustainability footprint approach suggestsa way in which a range of indicators can be presented for aparticular project or operation. Other tools, such as multi-attribute decision analysis (Golub, 1997; Hertwich andHammitt, 2001), are helpful in providing a structuredapproach to the choices to be made, and in exposing thetrade-offs between different desirable and undesirableoutcomes.
Thus it cannot be assumed that a straight switch fromfossil fuel to renewable energy will automatically improvesustainability. This will depend on the price paid for theenergy, the energy intensity of the operation, and a numberof other factors. The full set of indicators must be used tomonitor whether such a switch is desirable or not. When therelative cost of renewable energy falls, it could start to
displace fossil fuel, but this will also be in� uenced bygovernment action, perhaps in introducing subsidies onrenewable energy sources, or in restricting penalizing theuse of fossil fuels.
As governments review their commitments to reduce theemission of greenhouse gases under the Kyoto agreement,such incentives and restrictions may become quitecommon. In the UK there is the Non-Fossil Fuel Obliga-tion (NFFO), now being replaced by the RenewablesObligation, which obliges suppliers of electricity tosource a fraction of the supply from renewables, at acapped cost to the consumer. Scenarios, such as those inFigures 4 and 5, show how the cumulative effect ofgovernment action, and all the other elements drivingdevelopment, may lead to quite a different world in 50years’ time, with signi� cant amounts of energy derivingfrom renewable sources.
CONCLUSIONS
The scenario planning technique provides us with arational way of considering the future, not through theguesswork of predictions, but through testing the conse-quences of our actions and decisions in different and distinctpossible future worlds. A coherent set of sustainabilitymetrics or indicators enables us to assess the effect ofthese actions and decisions on sustainability. These indica-tors need to include measures of economic bene� t and socialdevelopment as well as ef� cient use of resources andenvironmental protection. Taken together, the indicatorsillustrate the ‘sustainability footprint’ of an enterprise.
REFERENCES
Anonymous, 1999, A Better Quality of Life: A Strategy for SustainableDevelopment for the UK, Cm 4345 (The Stationery Of� ce, London, UK).
Azapagic, A. and Perdan, S., 2000, Indicators of sustainable development forindustry: a general framework, Trans IChemE, Part B, Proc Safe Env Prot,78: 243.
Bell, S. and Morse, S., 1999, Sustainability Indicators, measuring theimmeasurable? (Earthscan, London, UK).
Boyle, G. (ed), 1998, Renewable Energy—Power for a Sustainable Future(Oxford University Press, Oxford, UK).
Chemical Industries Association, 1997, The UK Indicators of Performance1990–1996 (CIA, London, UK).
Golub, A.L., 1997, Decision Analysis: An Integrated Approach (John Wiley,New York, USA).
Hertwich, E.G. and Hammitt, J.K., 2001, A decision-analytic framework forimpact assessment—Part I: LCA and decision analysis, Int J Life CycleAss, 6(1): 5–12.
Houghton, J.T., Ding, Y., Griggs, D.J., Noguer, M., van der Linden, P.J. andXiaosu, D. (eds), 2001, Climate Change 2001: The Scienti�c Basis.Contribution of Working Group I to the Third Assessment Report of theIntergovernmental Panel on Climate Change (Cambridge UniversityPress, Cambridge, UK).
ICI, 1997, Environmental Burden: The ICI Approach (see http:==www.ici.com=download=Files=Eba.pdf).
Institution of Chemical Engineers, 2002, Sustainable DevelopmentProgress Metrics Recommended for use in the Process Industries(IChemE, Rugby, UK)
Nakicenovic, N. and Swart, R. (eds), 2000, IPCC Special Report onEmissions Scenarios (Cambridge University Press, Cambridge, UK).
Schwartz, P., 1998, The Art of the Longview: Planning for the Future in anUncertain World (John Wiley, Chichester, UK).
Shell International Limited, 2001, Energy Needs, Choices and Possibilities,Scenarios to 2050 (Shell International, London, UK).
van der Heijden, K., 1996, Scenarios (John Wiley, Chichester, UK).
Trans IChemE, Vol 81, Part B, September 2003
SCENARIOS AND METRICS TO A SUSTAINABLE FUTURE 301

World Business Council for Sustainable Development, 1997, ExploringSustainable Development WBCSD Scenarios 2000–2050 (WBCSD,London).
World Commission on Environment and Development, 1987, in Our CommonFutureChair, Brundtland,G.H. (ed) (Oxford University Press, Oxford,UK).
World Energy Council and International Institute for Applied SystemsAnalysis, 1995, Global Energy Perspectives to 2050 and Beyond(World Energy Council, London, UK).
ACKNOWLEDGEMENTS
The author is grateful to the Royal Academy of Engineering for � nancialsupport, and to Professor Roger Booth, Mr Brian Marsh and many othercolleagues who helped with the development of the ideas presented here.
This paper is based on a plenary address given at the conference CHISA2002 in Prague, September 2002.
ADDRESS
Correspondence concerning this paper should be addressed to ProfessorR. C. Darton, Department of Engineering Science, University of Oxford,Parks Road, Oxford OX1 3PJ, UK.E-mail: [email protected]
The manuscript was received 4 July 2002 and accepted for publicationafter revision 9 June 2003.
Trans IChemE, Vol 81, Part B, September 2003
302 DARTON