scanning fabry-perot filter for tera hertz spectroscopy ...rep/conf_pubs/confpubs2007/pw07fp.pdf ·...
TRANSCRIPT
Scanning Fabry-Perot filter for terahertz spectroscopy based on silicon dielectric mirrors
Justin W. Cleary, Chris J. Fredricksen, Andrei V. Muravjov, Jasen Enz, Maxim V. Dolguikh, Todd
W. Du Bosq, Robert E. Peale Department of Physics, University of Central Florida, Orlando Fl 32816
William R. Folks, Sidhartha Pandey, Glenn Boreman
CREOL, University of Central Florida, Orlando Fl 32816
Oliver Edwards Zyberwear Inc., 2114 New Victor Rd., Ocoee Fl 34761
ABSTRACT
A scanning Fabry-Perot transmission filter composed of a pair of dielectric mirrors has been demonstrated at millimeter and sub-millimeter wavelengths. The mirrors are formed by alternating quarter-wave optical thicknesses of silicon and air in the usual Bragg configuration. Detailed theoretical considerations are presented for determining the optimum design. Characterization was performed at sub-mm wavelengths using a gas laser together with a Golay cell detector and at mm-wavelengths using a backward wave oscillator and microwave power meter. High resistivity in the silicon layers was found important for achieving high transmittance and finesse, especially at the longer wavelengths. A finesse value of 411 for a scanning Fabry-Perot cavity composed of three-period Bragg mirrors was experimentally demonstrated. Finesse values of several thousand are considered to be within reach. This suggests the possibility of a compact terahertz Fabry-Perot spectrometer that can operate in low resonance order to realize high free spectral range while simultaneously achieving a high spectral resolution. Such a device is directly suitable for airborne/satellite and man-portable sensing instrumentation. Keywords: Fabry-Perot, terahertz, Bragg mirror, dielectric mirror, far-IR, millimeter wave
1. INTRODUCTION
The objective of this work was to develop the core technology for a compact scanning Fabry-Perot spectrometer, for satellite far-infrared astronomy1,2 and Earth remote sensing,3 that operates at wavelengths of λ=100 µm and longer, with a resolving power up to 10,000 and free spectral range of up to λ/2. This objective requires development of dielectric Fabry-Perot mirrors having up to 99.996% reflectance at sub-mm wavelengths to enable the unprecedented system finesse. The standard mirror used in scanning Fabry-Perots at sub-mm wavelengths has been metal mesh.4 We and others5-9 have already reported multilayer dielectric mirrors based on silicon, but without a precise measurement of achieved reflectivity and not applied to the application of a scanning Fabry-Perot. In this work, multilayer mirrors with up to three periods of Si separated by air were combined into a scanning Fabry-Perot system. The measured finesses are somewhat below those of the best mesh-based systems in this preliminary study, though calculations indicate they can be higher. This discrepancy can be attributed purely to inaccuracies in the spacing between the delicate multilayer Si filters due to technological factors. The measured finesse values give an accurate lower bound on the achieved Bragg mirror reflectivity.
A clean solid silver mirror can have a maximum reflectivity of 99.56 % at a wavelength of 100 µm, as determined by the real part of the surface impedance of the metal, which depends only on DC conductivity and frequency.10 Confocal cavity Fabry-Perot spectrometers and filters based on solid metal mirrors have achieved finesse values up to a few thousand at mm-wavelengths,11-13 but such designs appear to be impractical at sub-mm wavelengths. Standard art for the past several decades in airborne or satellite Fabry-Perot spectrometers has been flat metal mesh
Please verify that (1) all pages are present, (2) all figures are acceptable, (3) all fonts and special characters are correct, and (4) all text and figures fit within themargin lines shown on this review document. Return to your MySPIE ToDo list and approve or disapprove this submission.
6472-13 V. 2 (p.1 of 12) / Color: No / Format: Letter / Date: 12/29/2006 12:55:41 PM
SPIE USE: ____ DB Check, ____ Prod Check, Notes:
mirrors.4, 14-24 Empirical reflectivities of such mirrors at sub-mm wavelengths typically does not exceed 97%, or 99.8% for mm wavelengths, so that the finesse of Fabry-Perot cavities based on them has been < ~100 in the sub-mm range4, 14-
24 and < ~2000 at the mm wavelengths.12, 25-26 Mesh mirrors have limited spectral range compared to what might be achieved using dielectric mirrors,5-9 the approach investigated here.
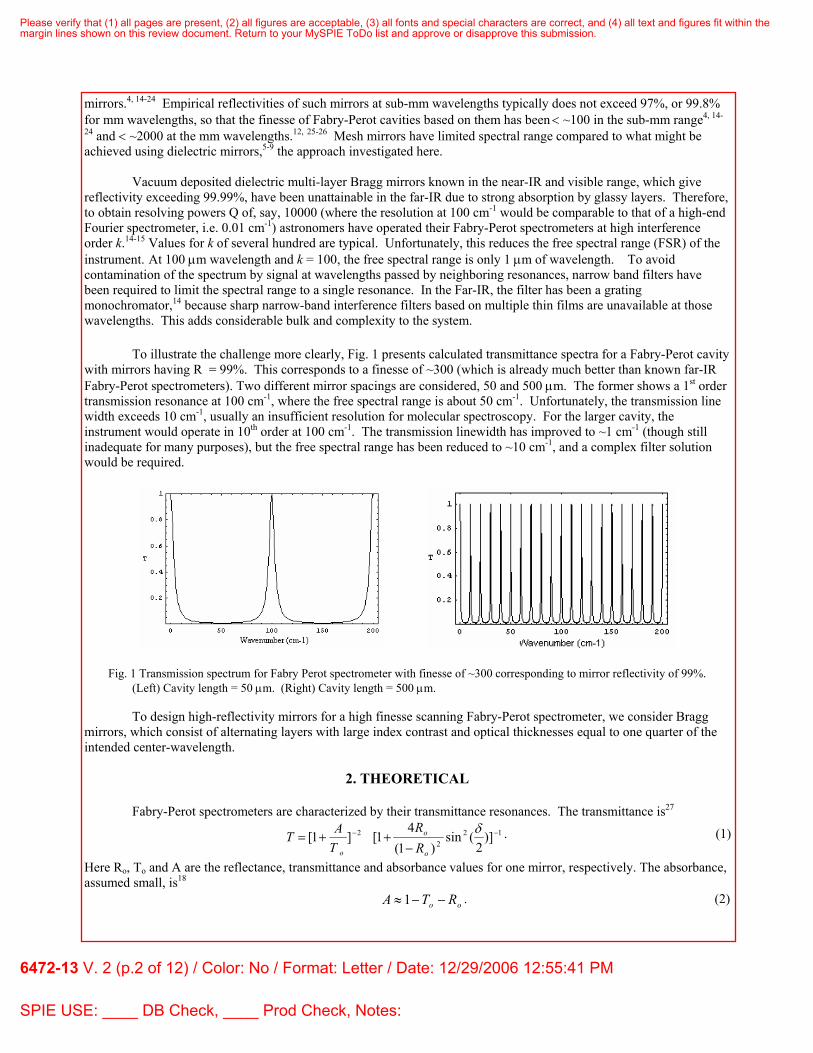
Vacuum deposited dielectric multi-layer Bragg mirrors known in the near-IR and visible range, which give reflectivity exceeding 99.99%, have been unattainable in the far-IR due to strong absorption by glassy layers. Therefore, to obtain resolving powers Q of, say, 10000 (where the resolution at 100 cm-1 would be comparable to that of a high-end Fourier spectrometer, i.e. 0.01 cm-1) astronomers have operated their Fabry-Perot spectrometers at high interference order k.14-15 Values for k of several hundred are typical. Unfortunately, this reduces the free spectral range (FSR) of the instrument. At 100 µm wavelength and k = 100, the free spectral range is only 1 µm of wavelength. To avoid contamination of the spectrum by signal at wavelengths passed by neighboring resonances, narrow band filters have been required to limit the spectral range to a single resonance. In the Far-IR, the filter has been a grating monochromator,14 because sharp narrow-band interference filters based on multiple thin films are unavailable at those wavelengths. This adds considerable bulk and complexity to the system. To illustrate the challenge more clearly, Fig. 1 presents calculated transmittance spectra for a Fabry-Perot cavity with mirrors having R = 99%. This corresponds to a finesse of ~300 (which is already much better than known far-IR Fabry-Perot spectrometers). Two different mirror spacings are considered, 50 and 500 µm. The former shows a 1st order transmission resonance at 100 cm-1, where the free spectral range is about 50 cm-1. Unfortunately, the transmission line width exceeds 10 cm-1, usually an insufficient resolution for molecular spectroscopy. For the larger cavity, the instrument would operate in 10th order at 100 cm-1. The transmission linewidth has improved to ~1 cm-1 (though still inadequate for many purposes), but the free spectral range has been reduced to ~10 cm-1, and a complex filter solution would be required.
Fig. 1 Transmission spectrum for Fabry Perot spectrometer with finesse of ~300 corresponding to mirror reflectivity of 99%. (Left) Cavity length = 50 µm. (Right) Cavity length = 500 µm.
To design high-reflectivity mirrors for a high finesse scanning Fabry-Perot spectrometer, we consider Bragg mirrors, which consist of alternating layers with large index contrast and optical thicknesses equal to one quarter of the intended center-wavelength.
2. THEORETICAL Fabry-Perot spectrometers are characterized by their transmittance resonances. The transmittance is27
122
2 )]2
(sin)1(
41[]1[ −−
−++=
δ
o
o
o RR
TAT . (1)
Here Ro, To and A are the reflectance, transmittance and absorbance values for one mirror, respectively. The absorbance, assumed small, is18
oo RTA −−≈ 1 . (2)
Please verify that (1) all pages are present, (2) all figures are acceptable, (3) all fonts and special characters are correct, and (4) all text and figures fit within themargin lines shown on this review document. Return to your MySPIE ToDo list and approve or disapprove this submission.
6472-13 V. 2 (p.2 of 12) / Color: No / Format: Letter / Date: 12/29/2006 12:55:41 PM
SPIE USE: ____ DB Check, ____ Prod Check, Notes:
The phase difference δ of a transmission resonance is related to the optical path length d for one photon round trip in the cavity27 by
πλ
πδ 22/
2 dk == , (3)
where k is the integer resonance order, with normal incidence assumed, mirrors are separated by a distance d in air, λ is the wavelength, and the phase shift on reflection from a mirror is ignored for simplicity. The distance between adjacent maxima is one half of the wavelength. The first order resonance k=1 corresponds to a mirror separation for the Fabry-Perot cavity of one half of the wavelength. The finesse for Ro greater than about 60% is
o
oR R
RF
−=
1π
. (4)
The resolving power (Q) is
kFd
kQ =∆
=)2/(λ , (5)
where the numerator is the cavity length, and ∆d is the full-width at half-maximum of transmission maxima for the scanning Fabry-Perot at fixed λ. The free spectral range is
kFSR λ
= . (6)
The reflectivity, Ro, of the Bragg mirror is determined from the standard matrix formulation of the boundary
conditions at the film interfaces found from Maxwell’s equations.28-29 The amplitude of the reflection coefficient r is
mm
mm
HEHE
r rr
rr
+
−= (7)
where
⎟⎟⎠
⎞⎜⎜⎝
⎛=⎟⎟
⎠
⎞⎜⎜⎝
⎛11
MHE
m
mr
r
r
(8)
mEr
is the electric field, mHr
the magnetic field, and Mr
is the product matrix of L layers. In our specific case both the
incident medium and the medium behind the mirror are air. Mr
is given by
121 MMMMMM jLL
rrrrrr⋅⋅⋅⋅⋅⋅= − , (9)
where jMr
represents the jth layer of the Bragg mirror and has the form
⎟⎟⎟
⎠
⎞
⎜⎜⎜
⎝
⎛=
jjj
jj
jj
i
iM
δδη
δη
δ
cossin
sincosr . (10)
In Eq. 10 the phase for normal incidence is
( )jjj dηλπδ 2
= (11)
and the complex index is jjj iηηη ′′−′= (12)
where jη′ is the index of refraction and jη ′′ the extinction coefficient of the jth layer. Values for jη′ of silicon are
tabulated for wavelengths out to 333 µm,30 and we linearly extrapolate these data for wavelengths out to 7 mm. Our method of estimating jη ′′ is discussed below. The reflectivity for one mirror to be used in Eq. 4 is
2rRo = . (13)
Please verify that (1) all pages are present, (2) all figures are acceptable, (3) all fonts and special characters are correct, and (4) all text and figures fit within themargin lines shown on this review document. Return to your MySPIE ToDo list and approve or disapprove this submission.
6472-13 V. 2 (p.3 of 12) / Color: No / Format: Letter / Date: 12/29/2006 12:55:41 PM
SPIE USE: ____ DB Check, ____ Prod Check, Notes:
At long wavelength, free carrier absorption can significantly degrade the transmittance of silicon-based
dielectric Bragg mirrors and likewise the optical performance of a Fabry-Perot spectrometer based on them. Even at sub-mm wavelengths, where multi-phonon absorption by acoustic modes dominates, free carrier absorption still can be detrimental. To appreciate this, consider the Ampere-Maxwell equation
dtEdEH or
rrrr
εεσ +=×∇ . (14)
The conductivity of the medium is σ and the relative permittivity is εr. We take ω to be the angular frequency of the plane monochromatic wave. The first term on the right side is the free current term, which is important for conductors. The second is the displacement-current term, which dominates in dielectrics. If the ratio
σωεε or (15)
is much larger than unity, the material is a dielectric with respect to electromagnetic waves. Otherwise, it is a conductor, and as such is very lossy for wave propagation. For silicon with resistivity ρ of 10 Ω-cm, expression (15) has the value 2.8 at 7 mm wavelength, and this number is of order unity. Thus, while this material is only a poor conductor, it is likewise a poor dielectric, and losses are expected to be substantial at mm wavelengths. The characteristic penetration depth ( z ) for electromagnetic waves (skin depth) is given by
( ) 21
2 1)(12 −− −+= ωερε
εω orr
cz . (16)
According to Eq. 16, the skin depth for the 10 Ω-cm Si wafers at 7 mm wavelength is 1.8 mm. Indeed, an experiment was performed for the specified conditions (with a scanning Fabry-Perot using mirrors formed from 0.5 mm thick silicon layers in quarter-wave Bragg stacks), and no transmission resonances could be detected when the number of periods in each Bragg mirror of the cavity exceeded unity. It was found necessary to use high resistivity float-zone silicon at mm-wavelengths (see optical characterization results below). Predicting the effects of losses on Fabry-Perot cavity finesse requires accurate knowledge of η ′′ . The effects of different loss mechanisms are additive in η ′′ . The contribution from lattice absorption is estimated using a fit to empirical wavelength-dependent absorption coefficients α for room-temperature silicon. The extinction coefficient is then found according to
ωαη
2c
=′′ , (17)
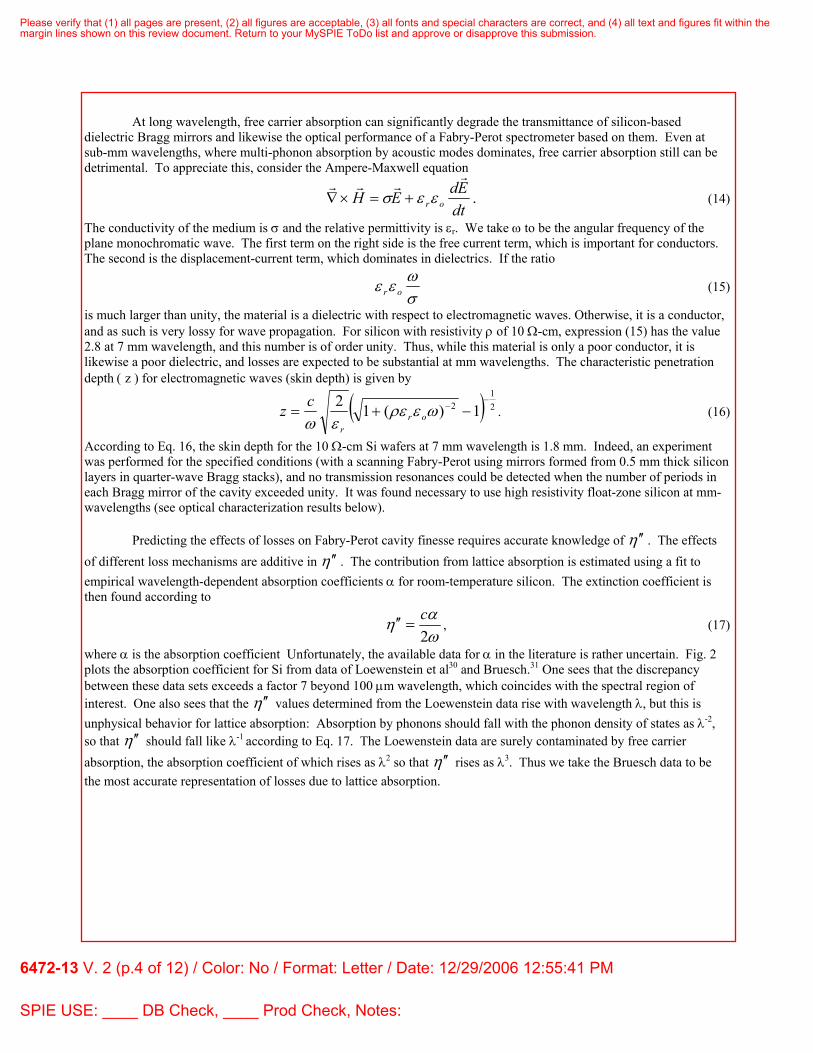
where α is the absorption coefficient Unfortunately, the available data for α in the literature is rather uncertain. Fig. 2 plots the absorption coefficient for Si from data of Loewenstein et al30 and Bruesch.31 One sees that the discrepancy between these data sets exceeds a factor 7 beyond 100 µm wavelength, which coincides with the spectral region of interest. One also sees that the η ′′ values determined from the Loewenstein data rise with wavelength λ, but this is unphysical behavior for lattice absorption: Absorption by phonons should fall with the phonon density of states as λ-2, so that η ′′ should fall like λ-1 according to Eq. 17. The Loewenstein data are surely contaminated by free carrier absorption, the absorption coefficient of which rises as λ2 so that η ′′ rises as λ3. Thus we take the Bruesch data to be the most accurate representation of losses due to lattice absorption.
Please verify that (1) all pages are present, (2) all figures are acceptable, (3) all fonts and special characters are correct, and (4) all text and figures fit within themargin lines shown on this review document. Return to your MySPIE ToDo list and approve or disapprove this submission.
6472-13 V. 2 (p.4 of 12) / Color: No / Format: Letter / Date: 12/29/2006 12:55:41 PM
SPIE USE: ____ DB Check, ____ Prod Check, Notes:
50 100 150 2000.0000
0.0003
0.0006
0.0009Ex
tinct
ion
Coe
ffici
ent
Wavelength (µm)
Loewenstein Data Bruesch Data Bruesch Fit
0.1 0.2 0.3 0.4 0.5
1E-4
1E-3
0.01
0.1
Extin
ctio
n C
oeffi
cien
t
Wavelength (mm)
10 Ω-cm 100 1,000 10,000
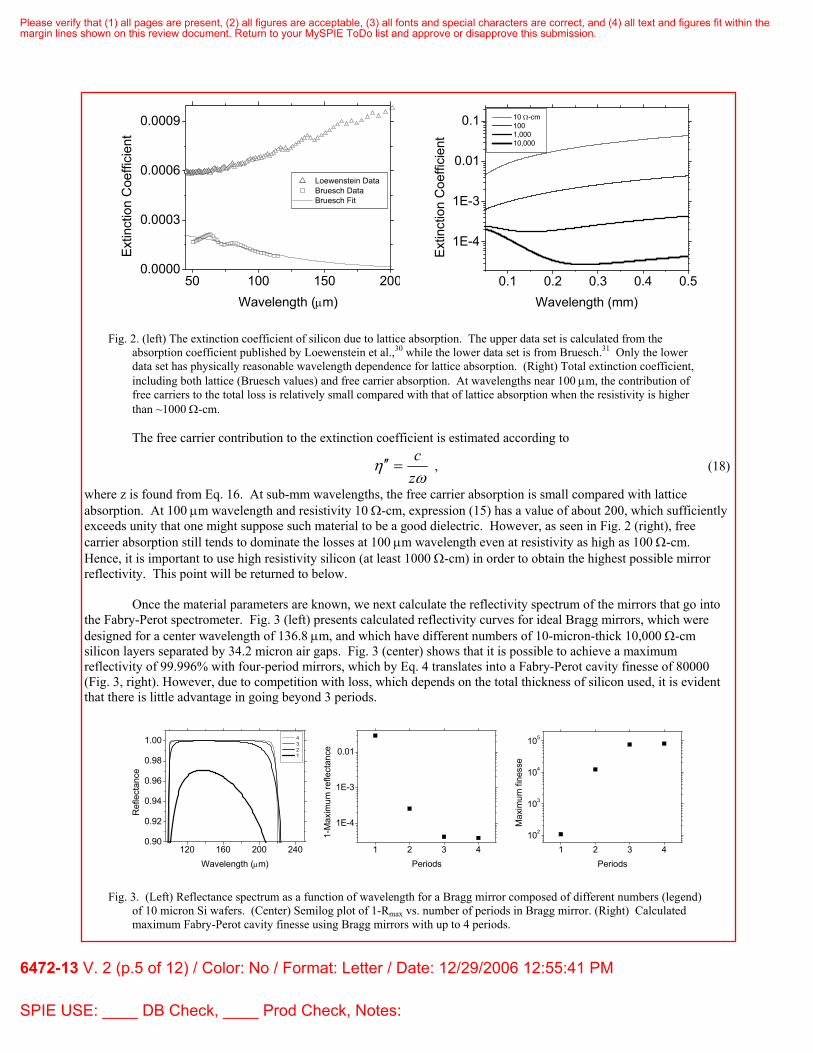
Fig. 2. (left) The extinction coefficient of silicon due to lattice absorption. The upper data set is calculated from the absorption coefficient published by Loewenstein et al.,30 while the lower data set is from Bruesch.31 Only the lower data set has physically reasonable wavelength dependence for lattice absorption. (Right) Total extinction coefficient, including both lattice (Bruesch values) and free carrier absorption. At wavelengths near 100 µm, the contribution of free carriers to the total loss is relatively small compared with that of lattice absorption when the resistivity is higher than ~1000 Ω-cm.
The free carrier contribution to the extinction coefficient is estimated according to
ωη
zc
=′′ , (18)
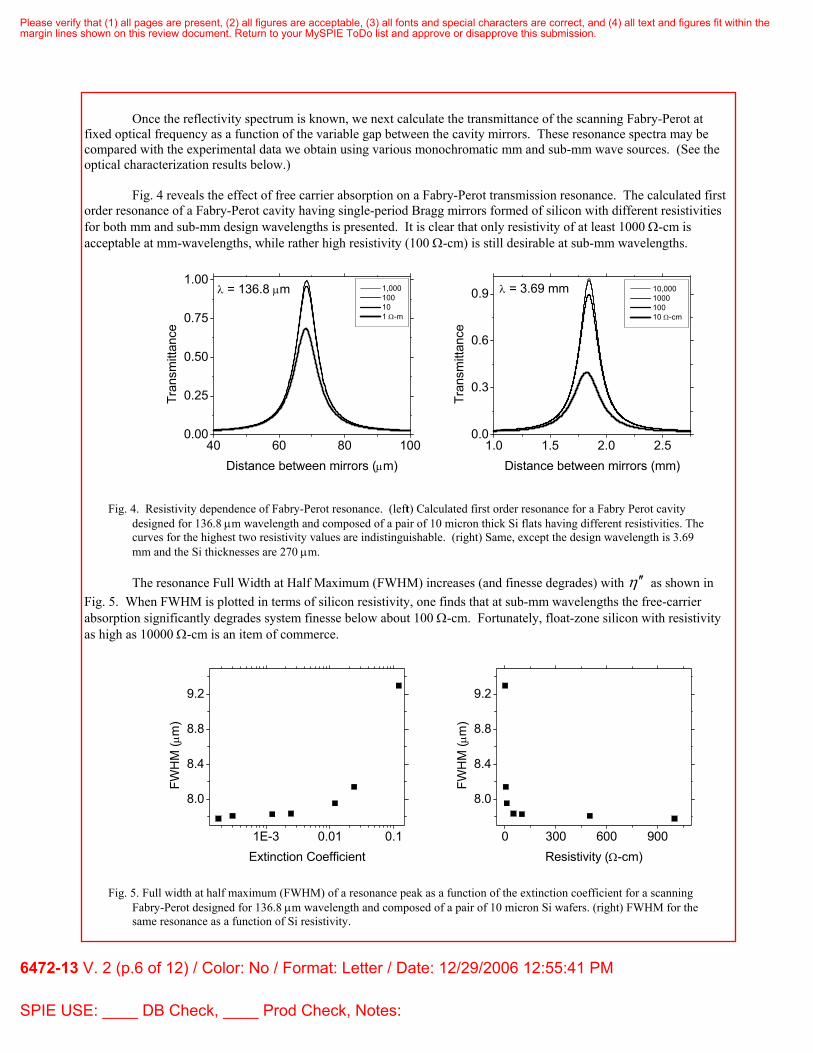
where z is found from Eq. 16. At sub-mm wavelengths, the free carrier absorption is small compared with lattice absorption. At 100 µm wavelength and resistivity 10 Ω-cm, expression (15) has a value of about 200, which sufficiently exceeds unity that one might suppose such material to be a good dielectric. However, as seen in Fig. 2 (right), free carrier absorption still tends to dominate the losses at 100 µm wavelength even at resistivity as high as 100 Ω-cm. Hence, it is important to use high resistivity silicon (at least 1000 Ω-cm) in order to obtain the highest possible mirror reflectivity. This point will be returned to below. Once the material parameters are known, we next calculate the reflectivity spectrum of the mirrors that go into the Fabry-Perot spectrometer. Fig. 3 (left) presents calculated reflectivity curves for ideal Bragg mirrors, which were designed for a center wavelength of 136.8 µm, and which have different numbers of 10-micron-thick 10,000 Ω-cm silicon layers separated by 34.2 micron air gaps. Fig. 3 (center) shows that it is possible to achieve a maximum reflectivity of 99.996% with four-period mirrors, which by Eq. 4 translates into a Fabry-Perot cavity finesse of 80000 (Fig. 3, right). However, due to competition with loss, which depends on the total thickness of silicon used, it is evident that there is little advantage in going beyond 3 periods.
120 160 200 2400.90
0.92
0.94
0.96
0.98
1.00
Ref
lect
ance
Wavelength (µm)
4 3 2 1
1 2 3 4
1E-4
1E-3
0.01
1-M
axim
um re
flect
ance
Periods 1 2 3 4
102
103
104
105
Max
imum
fine
sse
Periods
Fig. 3. (Left) Reflectance spectrum as a function of wavelength for a Bragg mirror composed of different numbers (legend) of 10 micron Si wafers. (Center) Semilog plot of 1-Rmax vs. number of periods in Bragg mirror. (Right) Calculated maximum Fabry-Perot cavity finesse using Bragg mirrors with up to 4 periods.
Please verify that (1) all pages are present, (2) all figures are acceptable, (3) all fonts and special characters are correct, and (4) all text and figures fit within themargin lines shown on this review document. Return to your MySPIE ToDo list and approve or disapprove this submission.
6472-13 V. 2 (p.5 of 12) / Color: No / Format: Letter / Date: 12/29/2006 12:55:41 PM
SPIE USE: ____ DB Check, ____ Prod Check, Notes:
Once the reflectivity spectrum is known, we next calculate the transmittance of the scanning Fabry-Perot at
fixed optical frequency as a function of the variable gap between the cavity mirrors. These resonance spectra may be compared with the experimental data we obtain using various monochromatic mm and sub-mm wave sources. (See the optical characterization results below.)
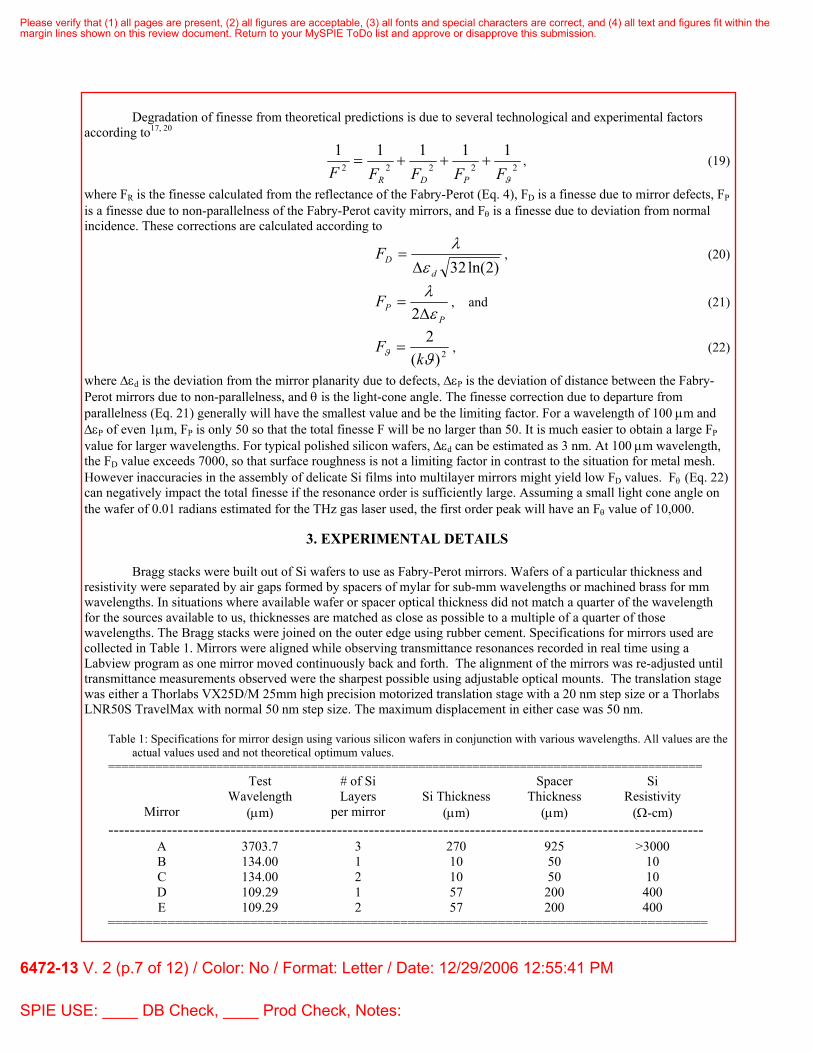
Fig. 4 reveals the effect of free carrier absorption on a Fabry-Perot transmission resonance. The calculated first order resonance of a Fabry-Perot cavity having single-period Bragg mirrors formed of silicon with different resistivities for both mm and sub-mm design wavelengths is presented. It is clear that only resistivity of at least 1000 Ω-cm is acceptable at mm-wavelengths, while rather high resistivity (100 Ω-cm) is still desirable at sub-mm wavelengths.
40 60 80 1000.00
0.25
0.50
0.75
1.00λ = 136.8 µm
Tran
smitt
ance
Distance between mirrors (µm)
1,000 100 10 1 Ω-m
1.0 1.5 2.0 2.50.0
0.3
0.6
0.9 λ = 3.69 mm
Tran
smitt
ance
Distance between mirrors (mm)
10,000 1000 100 10 Ω-cm
Fig. 4. Resistivity dependence of Fabry-Perot resonance. (left) Calculated first order resonance for a Fabry Perot cavity designed for 136.8 µm wavelength and composed of a pair of 10 micron thick Si flats having different resistivities. The curves for the highest two resistivity values are indistinguishable. (right) Same, except the design wavelength is 3.69 mm and the Si thicknesses are 270 µm.
The resonance Full Width at Half Maximum (FWHM) increases (and finesse degrades) with η ′′ as shown in Fig. 5. When FWHM is plotted in terms of silicon resistivity, one finds that at sub-mm wavelengths the free-carrier absorption significantly degrades system finesse below about 100 Ω-cm. Fortunately, float-zone silicon with resistivity as high as 10000 Ω-cm is an item of commerce.
1E-3 0.01 0.1
8.0
8.4
8.8
9.2
FWH
M (µ
m)
Extinction Coefficient
0 300 600 900
8.0
8.4
8.8
9.2
FWH
M (µ
m)
Resistivity (Ω-cm)
Fig. 5. Full width at half maximum (FWHM) of a resonance peak as a function of the extinction coefficient for a scanning Fabry-Perot designed for 136.8 µm wavelength and composed of a pair of 10 micron Si wafers. (right) FWHM for the same resonance as a function of Si resistivity.
Please verify that (1) all pages are present, (2) all figures are acceptable, (3) all fonts and special characters are correct, and (4) all text and figures fit within themargin lines shown on this review document. Return to your MySPIE ToDo list and approve or disapprove this submission.
6472-13 V. 2 (p.6 of 12) / Color: No / Format: Letter / Date: 12/29/2006 12:55:41 PM
SPIE USE: ____ DB Check, ____ Prod Check, Notes:
Degradation of finesse from theoretical predictions is due to several technological and experimental factors according to17, 20
22222
11111
ϑFFFFF PDR
+++= , (19)
where FR is the finesse calculated from the reflectance of the Fabry-Perot (Eq. 4), FD is a finesse due to mirror defects, FP is a finesse due to non-parallelness of the Fabry-Perot cavity mirrors, and Fθ is a finesse due to deviation from normal incidence. These corrections are calculated according to
)2ln(32dDF
ελ
∆= , (20)
PPF
ελ
∆=
2, and (21)
2)(2ϑϑ k
F = , (22)
where ∆εd is the deviation from the mirror planarity due to defects, ∆εP is the deviation of distance between the Fabry-Perot mirrors due to non-parallelness, and θ is the light-cone angle. The finesse correction due to departure from parallelness (Eq. 21) generally will have the smallest value and be the limiting factor. For a wavelength of 100 µm and ∆εP of even 1µm, FP is only 50 so that the total finesse F will be no larger than 50. It is much easier to obtain a large FP value for larger wavelengths. For typical polished silicon wafers, ∆εd can be estimated as 3 nm. At 100 µm wavelength, the FD value exceeds 7000, so that surface roughness is not a limiting factor in contrast to the situation for metal mesh. However inaccuracies in the assembly of delicate Si films into multilayer mirrors might yield low FD values. Fθ (Eq. 22) can negatively impact the total finesse if the resonance order is sufficiently large. Assuming a small light cone angle on the wafer of 0.01 radians estimated for the THz gas laser used, the first order peak will have an Fθ value of 10,000.
3. EXPERIMENTAL DETAILS
Bragg stacks were built out of Si wafers to use as Fabry-Perot mirrors. Wafers of a particular thickness and resistivity were separated by air gaps formed by spacers of mylar for sub-mm wavelengths or machined brass for mm wavelengths. In situations where available wafer or spacer optical thickness did not match a quarter of the wavelength for the sources available to us, thicknesses are matched as close as possible to a multiple of a quarter of those wavelengths. The Bragg stacks were joined on the outer edge using rubber cement. Specifications for mirrors used are collected in Table 1. Mirrors were aligned while observing transmittance resonances recorded in real time using a Labview program as one mirror moved continuously back and forth. The alignment of the mirrors was re-adjusted until transmittance measurements observed were the sharpest possible using adjustable optical mounts. The translation stage was either a Thorlabs VX25D/M 25mm high precision motorized translation stage with a 20 nm step size or a Thorlabs LNR50S TravelMax with normal 50 nm step size. The maximum displacement in either case was 50 nm.
Table 1: Specifications for mirror design using various silicon wafers in conjunction with various wavelengths. All values are the
actual values used and not theoretical optimum values. ========================================================================================
Mirror
Test Wavelength
(µm)
# of Si Layers
per mirror
Si Thickness
(µm)
Spacer Thickness
(µm)
Si Resistivity
(Ω-cm) ----------------------------------------------------------------------------------------------------------------
A 3703.7 3 270 925 >3000 B 134.00 1 10 50 10 C 134.00 2 10 50 10 D 109.29 1 57 200 400 E 109.29 2 57 200 400
================================================================================
Please verify that (1) all pages are present, (2) all figures are acceptable, (3) all fonts and special characters are correct, and (4) all text and figures fit within themargin lines shown on this review document. Return to your MySPIE ToDo list and approve or disapprove this submission.
6472-13 V. 2 (p.7 of 12) / Color: No / Format: Letter / Date: 12/29/2006 12:55:41 PM
SPIE USE: ____ DB Check, ____ Prod Check, Notes:
A Siemens backwards wave oscillator tunable from 75 to 110 GHz and microwave power meter were used in
the collection of data in the mm wave range. The scanning Fabry-Perot was placed between horns that coupled the waveguide beam to free space. For sub-mm wave measurements, monochromatic radiation of wavelength 134.00 µm or 109.29 µm and was provided by a coherent DEOS gas laser chopped at 20 Hz. The transmitted signal was detected with a Golay cell and synchronously amplified using a lock-in amplifier.
4. RESULTS
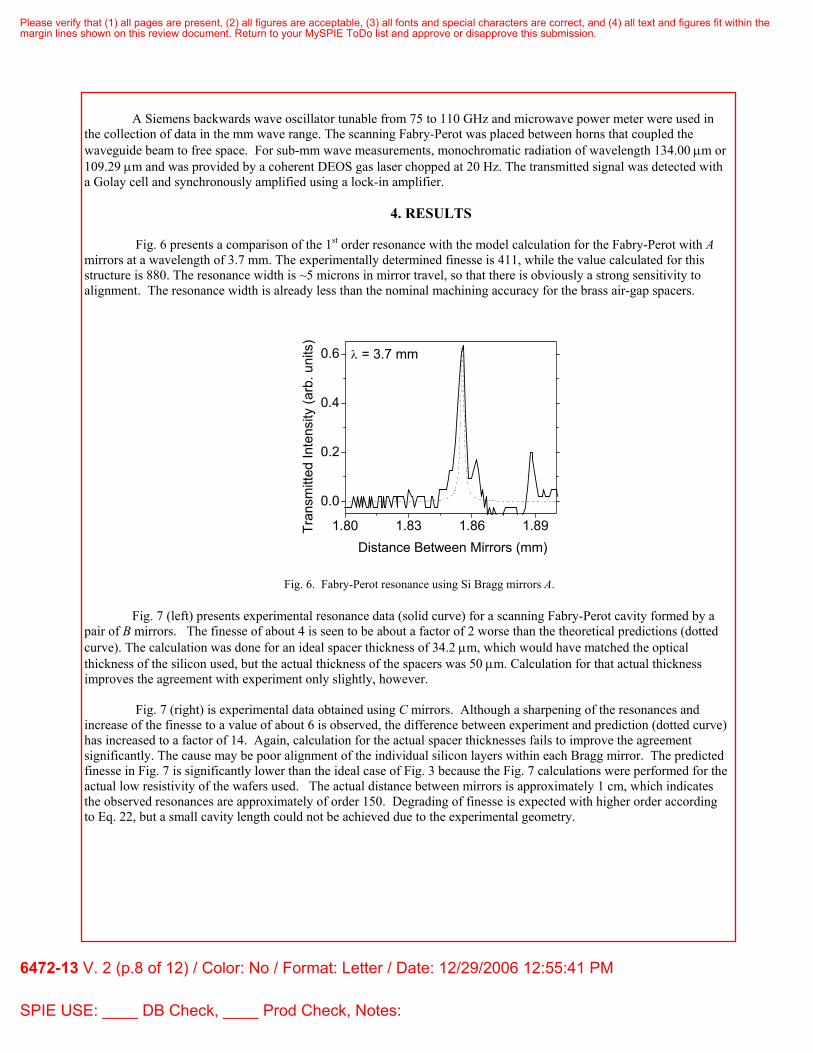
Fig. 6 presents a comparison of the 1st order resonance with the model calculation for the Fabry-Perot with A mirrors at a wavelength of 3.7 mm. The experimentally determined finesse is 411, while the value calculated for this structure is 880. The resonance width is ~5 microns in mirror travel, so that there is obviously a strong sensitivity to alignment. The resonance width is already less than the nominal machining accuracy for the brass air-gap spacers.
1.80 1.83 1.86 1.89
0.0
0.2
0.4
0.6 λ = 3.7 mm
Tran
smitt
ed In
tens
ity (a
rb. u
nits
)
Distance Between Mirrors (mm)
Fig. 6. Fabry-Perot resonance using Si Bragg mirrors A.
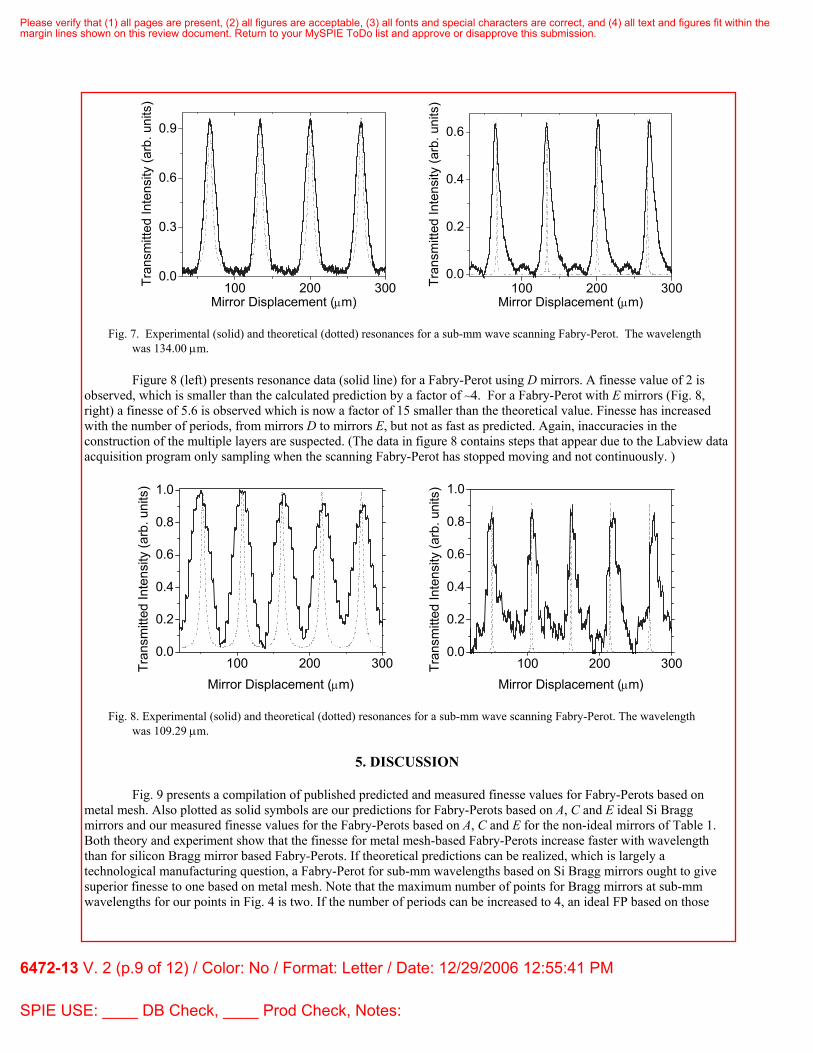
Fig. 7 (left) presents experimental resonance data (solid curve) for a scanning Fabry-Perot cavity formed by a pair of B mirrors. The finesse of about 4 is seen to be about a factor of 2 worse than the theoretical predictions (dotted curve). The calculation was done for an ideal spacer thickness of 34.2 µm, which would have matched the optical thickness of the silicon used, but the actual thickness of the spacers was 50 µm. Calculation for that actual thickness improves the agreement with experiment only slightly, however.
Fig. 7 (right) is experimental data obtained using C mirrors. Although a sharpening of the resonances and
increase of the finesse to a value of about 6 is observed, the difference between experiment and prediction (dotted curve) has increased to a factor of 14. Again, calculation for the actual spacer thicknesses fails to improve the agreement significantly. The cause may be poor alignment of the individual silicon layers within each Bragg mirror. The predicted finesse in Fig. 7 is significantly lower than the ideal case of Fig. 3 because the Fig. 7 calculations were performed for the actual low resistivity of the wafers used. The actual distance between mirrors is approximately 1 cm, which indicates the observed resonances are approximately of order 150. Degrading of finesse is expected with higher order according to Eq. 22, but a small cavity length could not be achieved due to the experimental geometry.
Please verify that (1) all pages are present, (2) all figures are acceptable, (3) all fonts and special characters are correct, and (4) all text and figures fit within themargin lines shown on this review document. Return to your MySPIE ToDo list and approve or disapprove this submission.
6472-13 V. 2 (p.8 of 12) / Color: No / Format: Letter / Date: 12/29/2006 12:55:41 PM
SPIE USE: ____ DB Check, ____ Prod Check, Notes:
100 200 3000.0
0.3
0.6
0.9
Tran
smitt
ed In
tens
ity (a
rb. u
nits
)
Mirror Displacement (µm) 100 200 300
0.0
0.2
0.4
0.6
Tran
smitt
ed In
tens
ity (a
rb. u
nits
)
Mirror Displacement (µm)
Fig. 7. Experimental (solid) and theoretical (dotted) resonances for a sub-mm wave scanning Fabry-Perot. The wavelength was 134.00 µm.
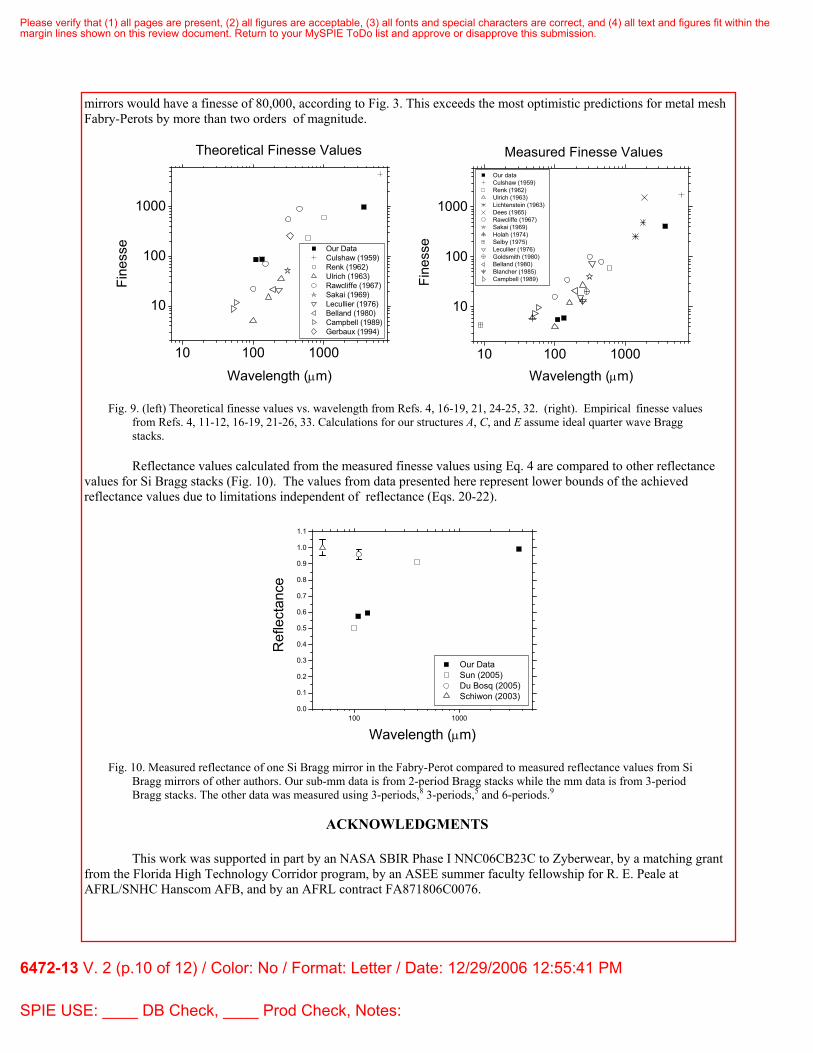
Figure 8 (left) presents resonance data (solid line) for a Fabry-Perot using D mirrors. A finesse value of 2 is
observed, which is smaller than the calculated prediction by a factor of ~4. For a Fabry-Perot with E mirrors (Fig. 8, right) a finesse of 5.6 is observed which is now a factor of 15 smaller than the theoretical value. Finesse has increased with the number of periods, from mirrors D to mirrors E, but not as fast as predicted. Again, inaccuracies in the construction of the multiple layers are suspected. (The data in figure 8 contains steps that appear due to the Labview data acquisition program only sampling when the scanning Fabry-Perot has stopped moving and not continuously. )
100 200 3000.0
0.2
0.4
0.6
0.8
1.0
Tran
smitt
ed In
tens
ity (a
rb. u
nits
)
Mirror Displacement (µm)
100 200 3000.0
0.2
0.4
0.6
0.8
1.0
Tran
smitt
ed In
tens
ity (a
rb. u
nits
)
Mirror Displacement (µm)
Fig. 8. Experimental (solid) and theoretical (dotted) resonances for a sub-mm wave scanning Fabry-Perot. The wavelength was 109.29 µm.
5. DISCUSSION
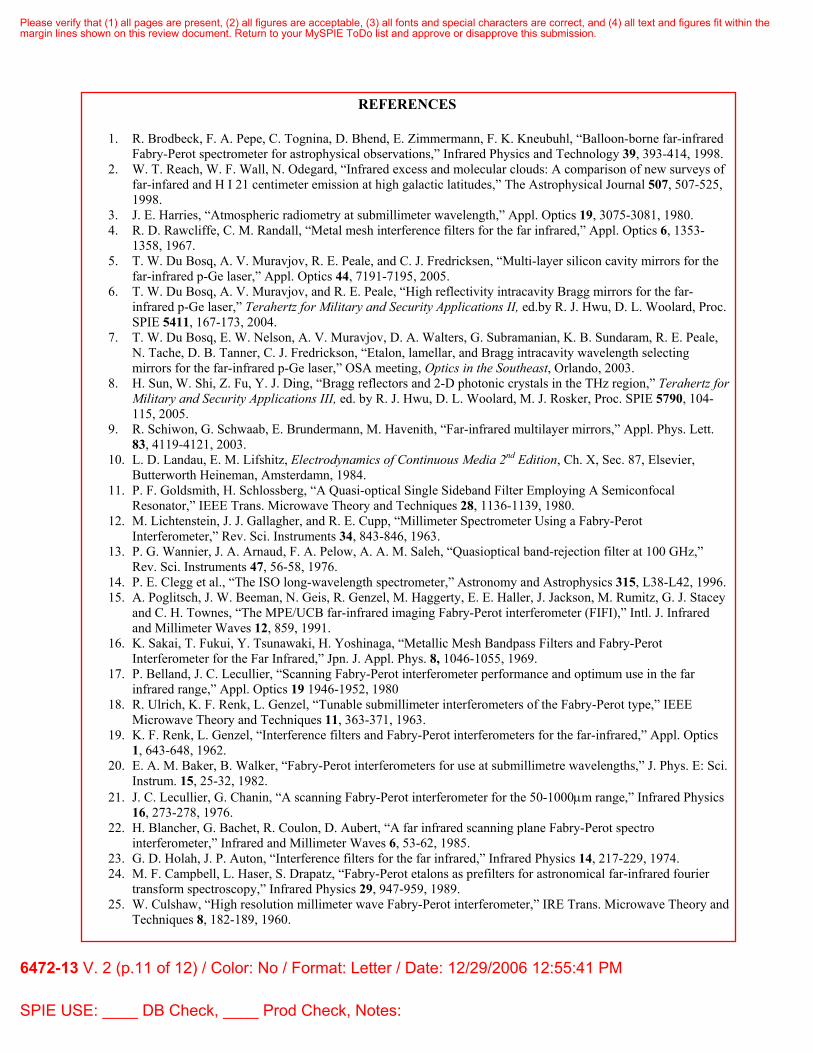
Fig. 9 presents a compilation of published predicted and measured finesse values for Fabry-Perots based on metal mesh. Also plotted as solid symbols are our predictions for Fabry-Perots based on A, C and E ideal Si Bragg mirrors and our measured finesse values for the Fabry-Perots based on A, C and E for the non-ideal mirrors of Table 1. Both theory and experiment show that the finesse for metal mesh-based Fabry-Perots increase faster with wavelength than for silicon Bragg mirror based Fabry-Perots. If theoretical predictions can be realized, which is largely a technological manufacturing question, a Fabry-Perot for sub-mm wavelengths based on Si Bragg mirrors ought to give superior finesse to one based on metal mesh. Note that the maximum number of points for Bragg mirrors at sub-mm wavelengths for our points in Fig. 4 is two. If the number of periods can be increased to 4, an ideal FP based on those
Please verify that (1) all pages are present, (2) all figures are acceptable, (3) all fonts and special characters are correct, and (4) all text and figures fit within themargin lines shown on this review document. Return to your MySPIE ToDo list and approve or disapprove this submission.
6472-13 V. 2 (p.9 of 12) / Color: No / Format: Letter / Date: 12/29/2006 12:55:41 PM
SPIE USE: ____ DB Check, ____ Prod Check, Notes:
mirrors would have a finesse of 80,000, according to Fig. 3. This exceeds the most optimistic predictions for metal mesh Fabry-Perots by more than two orders of magnitude.
10 100 1000
10
100
1000
Theoretical Finesse Values
Fine
sse
Wavelength (µm)
Our Data Culshaw (1959) Renk (1962) Ulrich (1963) Rawcliffe (1967) Sakai (1969) Lecullier (1976) Belland (1980) Campbell (1989) Gerbaux (1994)
10 100 1000
10
100
1000
Measured Finesse Values
Fin
esse
Wavelength (µm)
Our data Culshaw (1959) Renk (1962) Ulrich (1963) Lichtenstein (1963) Dees (1965) Rawcliffe (1967) Sakai (1969) Holah (1974) Selby (1975) Lecullier (1976) Goldsmith (1980) Belland (1980) Blancher (1985) Campbell (1989)
Fig. 9. (left) Theoretical finesse values vs. wavelength from Refs. 4, 16-19, 21, 24-25, 32. (right). Empirical finesse values from Refs. 4, 11-12, 16-19, 21-26, 33. Calculations for our structures A, C, and E assume ideal quarter wave Bragg stacks.
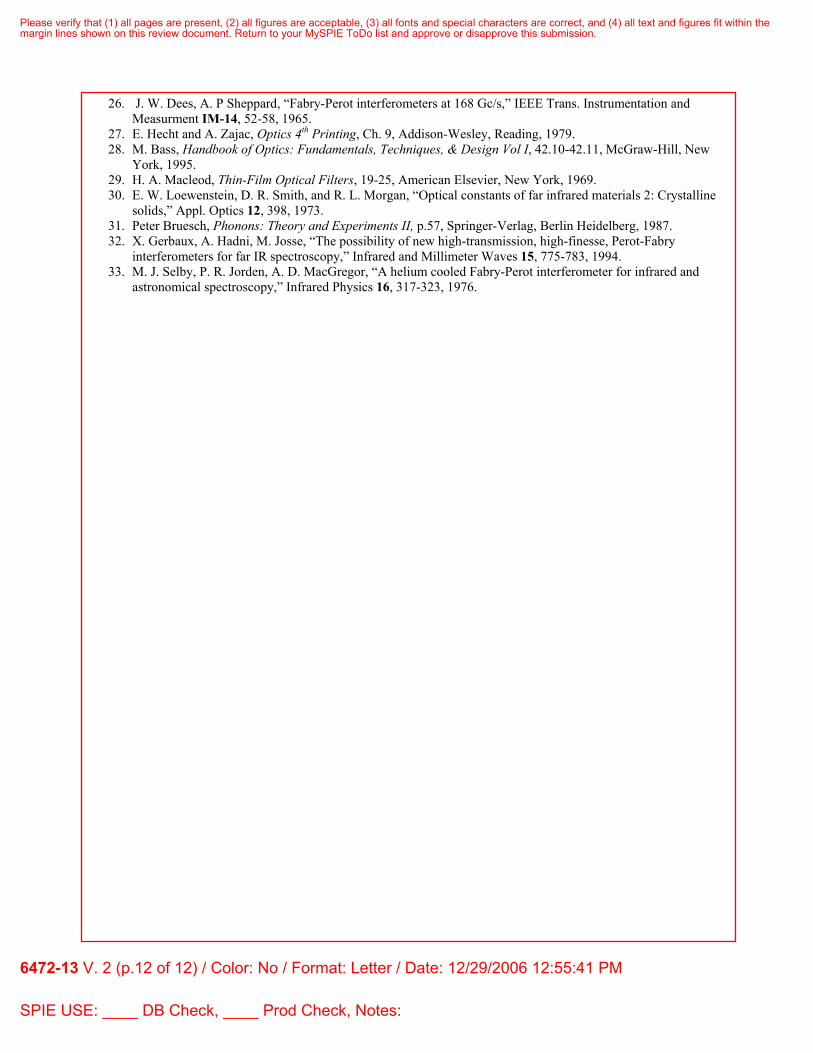
Reflectance values calculated from the measured finesse values using Eq. 4 are compared to other reflectance values for Si Bragg stacks (Fig. 10). The values from data presented here represent lower bounds of the achieved reflectance values due to limitations independent of reflectance (Eqs. 20-22).
100 10000.0
0.1
0.2
0.3
0.4
0.5
0.6
0.7
0.8
0.9
1.0
1.1
Ref
lect
ance
Wavelength (µm)
Our Data Sun (2005) Du Bosq (2005) Schiwon (2003)
Fig. 10. Measured reflectance of one Si Bragg mirror in the Fabry-Perot compared to measured reflectance values from Si Bragg mirrors of other authors. Our sub-mm data is from 2-period Bragg stacks while the mm data is from 3-period Bragg stacks. The other data was measured using 3-periods,8 3-periods,5 and 6-periods.9
ACKNOWLEDGMENTS
This work was supported in part by an NASA SBIR Phase I NNC06CB23C to Zyberwear, by a matching grant
from the Florida High Technology Corridor program, by an ASEE summer faculty fellowship for R. E. Peale at AFRL/SNHC Hanscom AFB, and by an AFRL contract FA871806C0076.
Please verify that (1) all pages are present, (2) all figures are acceptable, (3) all fonts and special characters are correct, and (4) all text and figures fit within themargin lines shown on this review document. Return to your MySPIE ToDo list and approve or disapprove this submission.
6472-13 V. 2 (p.10 of 12) / Color: No / Format: Letter / Date: 12/29/2006 12:55:41 PM
SPIE USE: ____ DB Check, ____ Prod Check, Notes:
REFERENCES
1. R. Brodbeck, F. A. Pepe, C. Tognina, D. Bhend, E. Zimmermann, F. K. Kneubuhl, “Balloon-borne far-infrared Fabry-Perot spectrometer for astrophysical observations,” Infrared Physics and Technology 39, 393-414, 1998.
2. W. T. Reach, W. F. Wall, N. Odegard, “Infrared excess and molecular clouds: A comparison of new surveys of far-infared and H I 21 centimeter emission at high galactic latitudes,” The Astrophysical Journal 507, 507-525, 1998.
3. J. E. Harries, “Atmospheric radiometry at submillimeter wavelength,” Appl. Optics 19, 3075-3081, 1980. 4. R. D. Rawcliffe, C. M. Randall, “Metal mesh interference filters for the far infrared,” Appl. Optics 6, 1353-
1358, 1967. 5. T. W. Du Bosq, A. V. Muravjov, R. E. Peale, and C. J. Fredricksen, “Multi-layer silicon cavity mirrors for the
far-infrared p-Ge laser,” Appl. Optics 44, 7191-7195, 2005. 6. T. W. Du Bosq, A. V. Muravjov, and R. E. Peale, “High reflectivity intracavity Bragg mirrors for the far-
infrared p-Ge laser,” Terahertz for Military and Security Applications II, ed.by R. J. Hwu, D. L. Woolard, Proc. SPIE 5411, 167-173, 2004.
7. T. W. Du Bosq, E. W. Nelson, A. V. Muravjov, D. A. Walters, G. Subramanian, K. B. Sundaram, R. E. Peale, N. Tache, D. B. Tanner, C. J. Fredrickson, “Etalon, lamellar, and Bragg intracavity wavelength selecting mirrors for the far-infrared p-Ge laser,” OSA meeting, Optics in the Southeast, Orlando, 2003.
8. H. Sun, W. Shi, Z. Fu, Y. J. Ding, “Bragg reflectors and 2-D photonic crystals in the THz region,” Terahertz for Military and Security Applications III, ed. by R. J. Hwu, D. L. Woolard, M. J. Rosker, Proc. SPIE 5790, 104-115, 2005.
9. R. Schiwon, G. Schwaab, E. Brundermann, M. Havenith, “Far-infrared multilayer mirrors,” Appl. Phys. Lett. 83, 4119-4121, 2003.
10. L. D. Landau, E. M. Lifshitz, Electrodynamics of Continuous Media 2nd Edition, Ch. X, Sec. 87, Elsevier, Butterworth Heineman, Amsterdamn, 1984.
11. P. F. Goldsmith, H. Schlossberg, “A Quasi-optical Single Sideband Filter Employing A Semiconfocal Resonator,” IEEE Trans. Microwave Theory and Techniques 28, 1136-1139, 1980.
12. M. Lichtenstein, J. J. Gallagher, and R. E. Cupp, “Millimeter Spectrometer Using a Fabry-Perot Interferometer,” Rev. Sci. Instruments 34, 843-846, 1963.
13. P. G. Wannier, J. A. Arnaud, F. A. Pelow, A. A. M. Saleh, “Quasioptical band-rejection filter at 100 GHz,” Rev. Sci. Instruments 47, 56-58, 1976.
14. P. E. Clegg et al., “The ISO long-wavelength spectrometer,” Astronomy and Astrophysics 315, L38-L42, 1996. 15. A. Poglitsch, J. W. Beeman, N. Geis, R. Genzel, M. Haggerty, E. E. Haller, J. Jackson, M. Rumitz, G. J. Stacey
and C. H. Townes, “The MPE/UCB far-infrared imaging Fabry-Perot interferometer (FIFI),” Intl. J. Infrared and Millimeter Waves 12, 859, 1991.
16. K. Sakai, T. Fukui, Y. Tsunawaki, H. Yoshinaga, “Metallic Mesh Bandpass Filters and Fabry-Perot Interferometer for the Far Infrared,” Jpn. J. Appl. Phys. 8, 1046-1055, 1969.
17. P. Belland, J. C. Lecullier, “Scanning Fabry-Perot interferometer performance and optimum use in the far infrared range,” Appl. Optics 19 1946-1952, 1980
18. R. Ulrich, K. F. Renk, L. Genzel, “Tunable submillimeter interferometers of the Fabry-Perot type,” IEEE Microwave Theory and Techniques 11, 363-371, 1963.
19. K. F. Renk, L. Genzel, “Interference filters and Fabry-Perot interferometers for the far-infrared,” Appl. Optics 1, 643-648, 1962.
20. E. A. M. Baker, B. Walker, “Fabry-Perot interferometers for use at submillimetre wavelengths,” J. Phys. E: Sci. Instrum. 15, 25-32, 1982.
21. J. C. Lecullier, G. Chanin, “A scanning Fabry-Perot interferometer for the 50-1000µm range,” Infrared Physics 16, 273-278, 1976.
22. H. Blancher, G. Bachet, R. Coulon, D. Aubert, “A far infrared scanning plane Fabry-Perot spectro interferometer,” Infrared and Millimeter Waves 6, 53-62, 1985.
23. G. D. Holah, J. P. Auton, “Interference filters for the far infrared,” Infrared Physics 14, 217-229, 1974. 24. M. F. Campbell, L. Haser, S. Drapatz, “Fabry-Perot etalons as prefilters for astronomical far-infrared fourier
transform spectroscopy,” Infrared Physics 29, 947-959, 1989. 25. W. Culshaw, “High resolution millimeter wave Fabry-Perot interferometer,” IRE Trans. Microwave Theory and
Techniques 8, 182-189, 1960.
Please verify that (1) all pages are present, (2) all figures are acceptable, (3) all fonts and special characters are correct, and (4) all text and figures fit within themargin lines shown on this review document. Return to your MySPIE ToDo list and approve or disapprove this submission.
6472-13 V. 2 (p.11 of 12) / Color: No / Format: Letter / Date: 12/29/2006 12:55:41 PM
SPIE USE: ____ DB Check, ____ Prod Check, Notes:
26. J. W. Dees, A. P Sheppard, “Fabry-Perot interferometers at 168 Gc/s,” IEEE Trans. Instrumentation and Measurment IM-14, 52-58, 1965.
27. E. Hecht and A. Zajac, Optics 4th Printing, Ch. 9, Addison-Wesley, Reading, 1979. 28. M. Bass, Handbook of Optics: Fundamentals, Techniques, & Design Vol I, 42.10-42.11, McGraw-Hill, New
York, 1995. 29. H. A. Macleod, Thin-Film Optical Filters, 19-25, American Elsevier, New York, 1969. 30. E. W. Loewenstein, D. R. Smith, and R. L. Morgan, “Optical constants of far infrared materials 2: Crystalline
solids,” Appl. Optics 12, 398, 1973. 31. Peter Bruesch, Phonons: Theory and Experiments II, p.57, Springer-Verlag, Berlin Heidelberg, 1987. 32. X. Gerbaux, A. Hadni, M. Josse, “The possibility of new high-transmission, high-finesse, Perot-Fabry
interferometers for far IR spectroscopy,” Infrared and Millimeter Waves 15, 775-783, 1994. 33. M. J. Selby, P. R. Jorden, A. D. MacGregor, “A helium cooled Fabry-Perot interferometer for infrared and
astronomical spectroscopy,” Infrared Physics 16, 317-323, 1976.
Please verify that (1) all pages are present, (2) all figures are acceptable, (3) all fonts and special characters are correct, and (4) all text and figures fit within themargin lines shown on this review document. Return to your MySPIE ToDo list and approve or disapprove this submission.
6472-13 V. 2 (p.12 of 12) / Color: No / Format: Letter / Date: 12/29/2006 12:55:41 PM
SPIE USE: ____ DB Check, ____ Prod Check, Notes: