scale effect of climate on soil organic carbon in the uplands of northeast china
TRANSCRIPT

SOILS, SEC 2 • GLOBAL CHANGE, ENVIRON RISK ASSESS, SUSTAINABLE LAND USE • RESEARCH ARTICLE
Scale effect of climate on soil organic carbon in the Uplandsof Northeast China
Dan-Dan Wang & Xue-Zheng Shi & Hong-Jie Wang &
David C. Weindorf & Dong-Sheng Yu & Wei-Xia Sun &
Hong-Yan Ren & Yong-Cun Zhao
Received: 26 January 2009 /Accepted: 7 July 2009 /Published online: 28 August 2009# Springer-Verlag 2009
AbstractPurpose Climate factors, considered significant factors inregulating soil organic carbon (SOC), are not equallyimportant at all spatial scales. However, the scale whichprovides the optimal relationship between climate and SOCand how that relationship varies at multiple scales are stillunclear. Thus, it is crucial to study the relationship betweenclimate factors and SOC at multiple scales when attemptingto accurately predict the SOC pool and evaluate theinfluence of climate change on global carbon cycling. Theobjective of this research is to examine the scale effect ofclimate factors on SOC content in the Uplands of NortheastChina.Materials and methods The relationship between climatefactors and SOC content at the regional, provincial, city,and county scales was evaluated at 0–20 and 0–100 cmusing correlation and regression analysis. Data for the study
in the Uplands of Northeast China were examined using1,022 profiles obtained from the Second National SoilSurvey of China. A nested sampling scheme was adopted atfour scales for this research.Results and discussion Differences exist in the degree ofcorrelation and relative importance of temperature andprecipitation at different scales. Temperature is the mainclimate factor controlling SOC content at the regionalscale. At the provincial scale, temperature is also the mainclimate factor controlling SOC content in the Uplands ofHeilongjiang and Eastern Inner Mongolia. SOC content inJilin and Liaoning is influenced jointly by temperature andprecipitation. Additionally, obvious regional differencesoccurred in the relationship between climate factors andSOC content at the provincial scale. Although this scalediffers from those by other researchers, similar results havebeen reported in China, Spain, and the USA. The reasonsmight be attributed to the differences in soil type,ecosystem, and topographic position. At both the city andcounty scales, weak or no relation was observed betweenclimate factors and SOC content. Climate factors havelimited ability to explain SOC content variability given thatSOC is affected by multiple factors which were not takeninto account by this research. Therefore, multiple scalesshould be considered when the feedback relationshipbetween global climate change and SOC content is studied.Conclusions The relationship between climate factors andSOC content weakens with decreasing scale, especiallyfrom the provincial to city scale. The main climate factorscontrolling SOC content vary with different scales. Theprovincial scale is optimal for studying the relationshipbetween climate factors and SOC content in the Uplands ofNortheast China.Recommendations and perspectives Seasonal change oftemperature and precipitation may also influence SOC.
Responsible editor: Hailong Wang
D.-D. Wang :X.-Z. Shi (*) :H.-J. Wang :D.-S. Yu :W.-X. Sun :H.-Y. Ren :Y.-C. ZhaoState Key Laboratory of Soil and Sustainable Agriculture,Institute of Soil Science, Chinese Academy of Sciences,Nanjing 210008, Chinae-mail: [email protected]
H.-J. Wange-mail: [email protected]
D. C. WeindorfLouisiana State University AgCenter,Baton Rouge, LA, USA
D.-D. WangCollege of Remote Sensing,Nanjing University of Information Science and Technology,Nanjing 210044, China
J Soils Sediments (2010) 10:1007–1017DOI 10.1007/s11368-009-0129-2

Thus, it is necessary to consider climate factors at multipletimescales. Moreover, further studies focusing on the scaleeffect of other factors (including climate) on SOC contentvariability will be carried out at different scales todetermine the main factors controlling SOC content.
Keywords Climate . Main factor . Scale effect .
Soil organic carbon (SOC) content
AbbreviationsAAT Annual accumulated temperatureMAP Mean annual precipitationMAT Mean annual temperatureP/T ratio Precipitation/temperature ratioSOC Soil organic carbon
1 Introduction
More than twice as much organic carbon is held in soils asin vegetation or the atmosphere (Batjes 1996). Because ofthe important role of soil organic carbon (SOC) in terrestrialecosystems and its large reservoir size, small changes in theSOC pool may influence global climate change. Theconcentration and content of SOC are affected by a rangeof factors such as climate (Homann et al. 2007), topography(Tan et al. 2004), biota (Finzi et al. 1998; Wu et al. 2009),parent material (Sleutel et al. 2007; Wagai et al. 2008), time(Schlesinger 1990), and management (Blumfield et al.2006; Gao et al. 2008; Xu et al. 2008; Yang et al. 2008).Many of these factors are mutually interactive (Sollins et al.1996), and not all of these factors are equally important atall spatial scales (Powers and Schlesinger 2002). To predictchanges in SOC, information on the key processescontrolling SOC is required at a range of spatial scales(Percival et al. 2000). Among these factors, it is oftenconsidered that climate, especially temperature and precip-itation, is the most important factor regulating SOC as itstrongly influences vegetation type, production, and de-composition of plant litter (Alvarez and Lavado 1998). Butdisagreement also exists regarding the effects of climatechange on global soil carbon stocks (Davidson andJanssens 2006). Furthermore, the possibility that climatechange is being reinforced by increased carbon dioxideemissions from soils due to rising temperatures is a subjectof continuing debate (Bellamy et al. 2005). Thus, a betterunderstanding of the relationship between climate factorsand SOC at different spatial scales is crucial in assessingthe possible impact of projected climate change on theglobal carbon cycle.
Research on the relationship between climate factors andSOC was reported by Jenny (1941), and more recent
progress (Burke et al. 1989; Hontoria et al. 1999; Ganuzaand Almendros 2003; Dai and Huang 2006; Homann et al.2007) had been made as well. However, contemporaryresearch was mainly carried out at a single scale. Scaleadopted here is referred to as the extent in landscapeecology, namely the size of the study area (Turner et al.1989). Based on study area size, completed research can bedivided into local, regional, continental, and global scales.Very few studies exist at the global scale and consider thatSOC density increases with increasing precipitation anddecreasing temperature (Post et al. 1982; Jobbágy andJackson 2000). Local scale studies are also rare. Forexample, Ganuza and Almendros (2003) reported thatunder Atlantic climate, SOC accumulation was regulatedmainly by climate factors. SOC budget was more sensitiveto climate change in Atlantic soils than in meso-Mediterranean and Mediterranean soils, indicating regionalinfluence of soils in relation to different climates. At theregional scale, Homann et al. (1995) found that the SOCcontent increased with increasing annual precipitation andtemperature in a forested region in western Oregon (USA).In New Zealand, both soil C content and concentrationcorrelated weakly with temperature and precipitation acrossall soils and within each soil order (Percival et al. 2000).Hontoria et al. (1999) found that SOC stocks in Spain aresensitive to slight changes in temperature and precipitationvariables. Mean annual precipitation (MAP) and meanannual temperature (MAT) together explained 37% of theSOC variability (Hontoria et al. 1999). At the continentalscale, based on generalized soil data, Guo et al. (2006)studied the effect of climate on SOC in forestland andgrassland of the USA using the State Soil GeographicDatabase (STATSGO). Results indicated that SOCdecreases as MAT increases with MAP <1,000 mm. Therelationship between SOC versus MAT varies with MAP,and SOC in the upper soil layers is most sensitive totemperature in low and moderate MAP regions. Homann etal. (2007) reported the relationship between climate andsurface mineral SOC across seven ecological regions withinthe USA using soil pedon data. They found positiverelationships to MAP, negative relationships to a tempera-ture/precipitation index in all regions, and negative relation-ships to MAT, except in the northwest temperate forestregion. In China, Wang et al. (2005) examined therelationship between MAT, precipitation, and SOC contentand found that climate controlled the spatial distribution ofSOC in both paddy and dryland soils, with SOC storageincreasing with increasing precipitation and decreasing withincreasing temperature. Dai and Huang (2006) attempted toidentify the relationship between soil organic matterconcentration and climate factors in different geographicalregions of China using 886 datasets from the SecondNational Soil Survey of China. They found no single
1008 J Soils Sediments (2010) 10:1007–1017

driving variable of soil organic matter concentration indifferent geographical regions.
In summary, the relationship between climate and SOCat individual scales has been widely reported, but littleinformation is available on multiple scales. Generally, weakrelationships between climatic variables and SOC atcontinental or regional scales make it difficult to predictchanges in the SOC pool as a function of projected climatechange (Kern et al. 1998), especially at large scales (Tan etal. 2004). But the scale providing the optimal relationshipbetween climate and SOC and how that relationship variesat multiple scales are still unclear. Therefore, research onthe relationship between climate and SOC at multiple scalesis helpful and also provides a theoretical base for accurateprediction of global SOC reserves.
By examining four scales (regional, provincial, city, andcounty), the goals of this paper are to: (1) show how therelationship between climate and SOC content in theUplands of Northeast China varies with scale and (2)explore the main climate factor controlling SOC content atdifferent scales.
2 Materials and methods
2.1 Site description
Northeast China (38º 40′–53º 30′ N, 115º 05′–135º 02′ E)covers an area of 1.24 million square kilometer, includingHeilongjiang Province, Liaoning Province, Jilin Province,and Eastern Inner Mongolia (Fig. 1). It has a temperatemonsoon climate but varies across the region. From northto south (∼1,600 km), temperatures generally increase,
transitioning from cold temperature zones to midtemper-ature zones and finally warm temperature zones. From eastto west (∼1,400 km), moisture generally decreases, tran-sitioning from humid areas to subhumid areas and finallysemiarid areas. The MAT varies from −4°C to 11°C, andthe MAP is between 350 and 1,100 mm. Northeast China isa relatively complete geographical region, surrounded by theGreat Khingan Mountains, Lesser Khingan Mountains, andChangbai Mountains to the north, east, and west, respective-ly. The center of the region is the Northeast Plain toward thesouthward extension. The black soil (isohumosols; Shi et al.2006) zone, distributed in the east and northern piedmontmesa of the Songnen plain in the center of Northeast China,is one of the major grain-producing areas given its highfertility. The midwest area of the Songnen Plain ischaracterized by Chernozems (Isohumosols). Meadow soils(Cambisols; Shi et al. 2006) are also widely distributed inthis area. Corn (Zea mays), soybean (Glycine max (L.)Merr.), and sugar beet (Beta vulgaris L.) are the main cropsin Northeast China (Ren 1985).
2.2 Datasets
The data used for this study were obtained from the SecondNational Soil Survey of China (National Soil Survey Office1996) conducted in the beginning of 1980s including 1,041upland soil profiles taken from Soil Species of China andSoil Species of provinces, cities, and counties in NortheastChina. A nested sampling scheme was adopted at fourscales (see Section 2.3) for this research. Based on land usetypes, topography, and soil types of the survey area, thedistribution and number of soil samples were designed(National Soil Survey Office 1992). After a soil pit (1.5×1.5 m) was excavated, genetic soil horizons from top tobottom in the profile were classified and their depths weremeasured. One soil sample was collected from each genetichorizon. All samples were taken back to the laboratory forphysicochemical analysis. SOC content was measuredusing the Walkley and Black oil bath method (Page et al.1982). The SOC content of the 0–20- and 0–100-cm depthsfor each profile were recalculated based on the total 1,041 soilprofile data. According to the Genetic Soil Classification ofChina (GSCC), these profiles were classified into 102families, 56 subgroups, 17 great groups, and seven orders(Gong et al. 1978). The 17 great groups include eight zonalsoils and nine azonal soils. Among the selected soil profiles,there are 309, 161, 138, and 126 profiles of meadow soils,brown soils, black soils, and chernozems, respectively.There are two profiles of volcanic ash soils which havethe least profiles among all the great groups. The data weregathered to create a soil profile database which included theinformation on sampling location, longitude and latitude,soil type, parent materials, and physicochemical properties
Fig. 1 Location of typical cities and counties in the study area (1Nenjiang, 2 Hailun, 3 Yushu, 4 Dehui, 5 Lishu, 6 Fuxin, 7 Jinxi,8 Xinjin, and 9 Keyou counties)
J Soils Sediments (2010) 10:1007–1017 1009

to include soil texture (Wang et al. 2007), pH (Model PHS-3C, Shanghai Precision and Scientific Instrument, Wang etal. 2008), SOC content, total nitrogen (Page et al. 1982),total phosphorus (Murphy and Riley 1962), total potassium(Parkinson and Allen 1975), NaOH-extractable nitrogen(Page et al. 1982), available phosphorus (Page et al. 1982),and available potassium (Lu 2000).
Because of the great influence of azonal factorsincluding microtopography and groundwater, some SOCcontent values are outliers and could negatively influencethe relationship between climate factors and SOC content.In order to obtain an unbiased conclusion, we removed theinfluence of outliers falling beyond three times standarddeviation from the mean (Wu et al. 2001). In doing so, 19soil profiles were deleted, and the number of profiles usedin the analysis was 1,022.
Climatic data were provided by the Institute of Agricul-tural Resources and Regional Planning, Chinese Academy ofAgricultural Sciences. The spatial resolution of all climaticgrid maps is 1×1 km. The climate database includes: annualaccumulated temperature (AAT), mean monthly temperature,mean monthly precipitation. Also, AAT, MAT, and MAPof 1,022 soil profile points were extracted from the
corresponding grid climate data layer using geographicinformation system (ESRI, Inc., Redlands, CA, USA). Here,AAT refers to the AAT when the mean daily air temperatureis ≥10°C.
2.3 Methods
In this study, regional scale refers to all of Northeast China,while provincial scale includes Heilongjiang, Jilin, Liaoning,and Eastern Inner Mongolia. Among 40 cities and 225counties in the study area, eight cities and nine counties wereselected as typical areas for the city and county scales,respectively, according to the area of Upland, number ofprofiles and geographical location (Table 1).
All the statistical analyses were performed with SPSSsoftware 13.0 (SPSS Inc. Chicago, IL, USA). At differentscales, simple correlation analysis was used to quantify therelationship between AAT and SOC content as well asbetween the ratio of MAP to MAT (P/T ratio for short) andSOC content. Partial correlation analysis was applied toidentify the effects of MAT and MAP on SOC content at 0–20 and 0–100 cm. Single linear regression was used todetermine the contributions of each climate factor to SOC
Table 1 Statistical characteristics of SOC content and climate at different scales in the Uplands of Northeast China
Scale Name Number SOC content kg m−2 (mean ± SD) MAT (°C) MAP (mm)
0–20 cm 0–100 cm Min. Mean Max. Min. Mean Max.
Region Northeast China 1,022 3.36±2.07 10.7±6.84 −2.12 5.51 15.6 340 562 936
Province Heilongjiang 183 5.48±2.33a 16.21±8.39a −2.12 2.43 5.14 388 502 651
Jilin 404 3.34±1.75b 10.79±5.58b 1.84 4.79 9.55 373 544 919
Liaoning 346 2.30±1.3c 7.52±5.13c 4.06 8.10 15.6 431 655 936
Eastern Inner Mongolia 89 3.27±2b 11.38±6.98b −0.85 5.03 7.01 340 405 533
City Heihe 28 7.77±2.47a 22.73±8.96a −2.12 −0.44 0.54 469 498 536
Suihua 31 6.23±1.68ab 21.70±8.33a 1.38 2.29 3.7 444 500 547
Yanbian 39 4.82±2.53bc 12.38±5.94bc 1.84 4.32 9.55 477 573 736
Changchun 120 3.44 ±1.3cd 13.15±6.1b 3.75 4.47 5.31 474 556 647
Siping 91 2.84±1.41de 10.32±4.97cd 4.38 5.65 6.15 462 583 659
Songyuan 61 2.71±1.16e 8.53±3.99d 3.9 4.56 5.23 414 460 528
Fushun 38 3.11±2.32cde 8.56±7.08cd 4.06 6.28 7.73 721 762 797
Chifeng 42 2.03±0.76f 8.07±3.08d 2.89 5.71 7.01 340 395 460
County Nenjiang 14 7.00±1.79a 19.94±7.92a −1.04 −0.21 0.5 469 483 510
Hailun 12 7.23±2.07a 26.11±10.08ab 1.38 1.82 2.38 502 531 547
Yushu 31 4.00±1.53b 14.33±6.75abc 3.75 4.04 4.33 474 575 647
Dehui 65 3.33±1.16bc 13.61±5.98bc 4.28 4.51 5.01 526 546 591
Lishu 58 2.76±1.03c 10.43±4.85c 4.93 5.79 6.13 508 598 659
Fuxin 29 1.67±0.74d 5.90±2.88d 6.52 7.33 7.79 447 510 558
Jinxi 50 1.93±0.73d 6.88±3.83d 7.88 8.69 9.08 505 542 563
Xinjin 34 1.60±1.12d 5.16±3.6d 9.43 12.14 15.6 636 654 679
Keyou 17 4.61±2.01abc 15.16±8.99abc 1.49 4.30 5.69 373 395 415
Values in the columns with the same letter are not significantly different (P<0.05) at the scale
1010 J Soils Sediments (2010) 10:1007–1017

content variability at each scale. Since SOC content was notnormally distributed, it was logarithm-transformed whenlinear regression analysis was applied. Because some SOCvalues (kg m−2) were less than 1, SOC values had to bemultiplied by 10 before they were logarithm-transformed toavoid negative values. Thus, all values are nearly normallydistributed and meet the requirement of correlation andlinear regression analysis. U tests (Eqs. 1 and 2) of any twocorrelation coefficients were carried out to compare thedifference in relationships between climate factors and SOCcontent at the provincial scale and z-transformations (Eq. 3)were conducted first for the correlation coefficients to makethem follow a normal distribution (Gai 2000).
sz1�z2 ¼ffiffiffiffiffiffiffiffiffiffiffiffiffiffiffiffiffiffiffiffiffiffiffiffiffiffiffiffiffiffiffiffi
1
n1 � 3þ 1
n2 � 3
r
ð1Þ
u ¼ z1 � z2ð Þ � mz1 � mz2
� �
sz1�z2ð2Þ
z ¼ 1
2ln
1þ r
1� r
� �
ðr > 0Þ
z ¼ � 1
2ln
1þ rj j1� rjj
� �
ðr < 0Þ
ð3Þ
Where r is correlation coefficient; n1 and n2 are soilsampling number; sz1�z2 is the standard error of differencesbetween two z values. mz1and mz2are mean values of z; mz1 isequal to mz2 here.
3 Results and discussion
3.1 Distribution characteristics of SOC content and climatefactors at different scales
Distribution characteristics of SOC content and climatefactors at different scales in the Uplands of Northeast Chinaare given in Table 1. There are differences in SOC contentfor both 0–20- and 0–100-cm layers among provinces,cities, and counties, respectively. At the provincial scale,the mean value of SOC content at 0–20 cm graduallydecreases from Heilongjiang in the north, to Jilin, toLiaoning in the south. SOC content in Heilongjiang is ashigh as 5.48 kg m−2, while SOC content in Liaoning is aslow as 2.30 kg m−2. The former is over twice as muchas the latter. Significant differences were observed in SOCcontent values among provinces except for that betweenJilin and Eastern Inner Mongolia. At the city scale, themean value of SOC content at 0–20 cm decreases gradually
from 7.77 kg m−2 in Heihe of Heilongjiang to 2.03 kg m−2
in Chifeng of Eastern Inner Mongolia. The differencebetween the highest and lowest values is nearly 2.71 times,indicating wide variability in SOC content at the city scale.The distribution of the mean value of SOC content at 0–20 cm also presents a decreasing trend from Hailun inHeilongjiang to Xinjin in Liaoning at the county scale, thesame as the city and provincial scales which are influencedby increasing temperature from north (Heilongjiang) tosouth (Liaoning) in this area (Zhou et al. 2003; Wang et al.2005). Results showed that decomposition was moretemperature sensitive than net primary productivity at lowertemperatures, whereas similar temperature sensitivity wasfound at higher temperatures (Kirschbaum 1995, 2006),which caused higher SOC content at lower temperaturesand lower SOC content at higher temperatures. Noticeably,the highest value is 4.5 times higher than the lowest value,indicating wide variability in SOC content at the countyscale too. The distribution of the mean SOC content at 0–100 cm has the same trend with that at 0–20 cm in theUplands at the provincial, city, and county scales.
There is a large range of climates across the sampleprofiles in the Uplands of Northeast China. MAT variesfrom −2°C to 16°C, and MAP is between 340 and 936 mm(see Table 1). Both MAT and MAP show an increasingtrend from Heilongjiang to Liaoning. However, MAP isrelatively lower in Eastern Inner Mongolia. Small gradientsof MAT and MAP were found within the county area (seeTable 1), and SOC content was not significantly related toclimate factors at the county scale. Therefore, SOC contentvariability was not caused by MAT and MAP, and it wasnot discussed at the county scale.
3.2 Relationship between temperature and SOC contentat different scales
Based on soil profile and climate grid data, partialcorrelation analysis between MAT and SOC content takingMAP as the controlling variable and simple correlationanalysis between AAT and SOC content were conducted(Table 2). The relationships between temperature factorsand SOC content are diverse at different scales in theUplands of Northeast China. At the regional scale, SOCcontent is highly significant and negatively related to AATand MAT, not only at 0–20 cm but also at 0–100 cm. Thisindicates that increasing temperature generally enhancesdecomposition more than detrital production. Also, MAThas a greater influence on SOC compared with AAT. At theprovincial scale, SOC content at 0–20 cm in the Uplandshas a highly significant and negative correlation with AATand MAT. The results of the u tests show the difference inthe relationship between temperature factors and SOCcontent in the Uplands among provinces (Table 3). The
J Soils Sediments (2010) 10:1007–1017 1011

relationship between temperature factors and SOC contentin Liaoning is significantly different compared with that inEastern Inner Mongolia and Heilongjiang. A significantdifference in Heilongjiang and Jilin was observed in therelationship between temperature factors and SOC contentexcept for that between AAT and SOC content at 0–100 cm.A significant difference in Jilin and Liaoning was observedonly in the relationship between AAT and SOC content.The relationships between temperature factors and SOC
content in Jilin and Eastern Inner Mongolia also havesignificant differences except for that between AAT andSOC content at 0–20 cm. No difference was observed in therelationships between temperature factors and SOC contentin Heilongjiang and Eastern Inner Mongolia. At the cityscale, there is a significant negative correlation betweentemperature factors and SOC content at 0–20 cm in fourcities. The results indicate that the relationship betweentemperature factors and SOC content in the Uplands of
Scale Name Number rAAT rMAT
0–20 cm 0–100 cm 0–20 cm 0–100 cm
Region Northeast China 1,022 −0.478*** −0.391*** −0.587*** −0.485***Province Heilongjiang 183 −0.574*** −0.337*** −0.510*** −0.395***
Jilin 404 −0.360*** −0.218*** −0.316*** −0.199***Liaoning 346 −0.144** −0.063 −0.186** −0.141**Eastern Inner Mongolia 89 −0.504*** −0.474*** −0.611*** −0.522***
City Heihe 28 −0.459* −0.199 −0.109 0.211
Suihua 31 0.306 0.348 −0.219 −0.257Yanbian 61 −0.122 −0.189 −0.346** −0.367**Changchun 120 −0.152 −0.055 −0.229* −0.119Siping 91 −0.306** −0.172 −0.183 −0.093Songyuan 39 −0.357* −0.227 −0.334* −0.206Fushun 38 −0.493** −0.415* −0.470** −0.405*Chifeng 42 −0.226 −0.264 −0.299 −0.349*
County Nenjiang 14 0.286 0.262 0.068 0.497
Hailun 12 −0.205 −0.417 −0.367 −0.241Yushu 31 0.214 −0.004 −0.387* 0.001
Dehui 65 0.072 0.022 −0.034 0.058
Lishu 58 0.101 0.023 −0.142 0.064
Fuxin 29 0.294 0.379 0.375 0.096
Jinxi 50 0.291* 0.222 0.135 0.304*
Xinjin 35 0.219 −0.070 0.258 0.040
Keyou 17 0.217 0.071 0.280 −0.019
Table 2 Correlation analysisof SOC content with tempera-ture in the Uplands ofNortheast China
rAAT correlation coefficient be-tween AAT and SOC content,rMAT correlation coefficientbetween MAT and SOC content
*P<0.05; **P<0.01;***P<0.001
Table 3 Difference in the degree of relationships at the provincial scale in Northeast China
Factor uHJ uHL uHN uJL uJN uLN
AAT20 3.070** 5.517** 0.749 3.159** 1.492 3.396**
AAT100 1.446 3.312** 1.255 2.155* 2.476* 3.754**
MAT20 2.627** 4.069** 1.123 1.888 3.222** 4.326**
MAT100 2.411* 2.992** 1.235 0.804 3.183** 3.627**
P/T20 5.006** 2.796** 0.206 2.608** 4.007** 2.358**
P/T100 2.477** 1.512 0.092 1.129 1.769 1.054
MAP20 0.053 1.591 1.790 2.056* 2.014* 0.731
MAP100 0.677 0.961 1.186 2.029* 1.819 0.555
uHJ u value of r between Heilongjiang and Jilin, uHL u value of r between Heilongjiang and Liaoning, uHN u value of r between Heilongjiang andEastern Inner Mongolia, uJL u value of r between Jilin and Liaoning, uJN u value of r between Jilin and Eastern Inner Mongolia, uLN u value of rbetween Liaoning and Eastern Inner Mongolia
*P<0.05; **P<0.01
1012 J Soils Sediments (2010) 10:1007–1017

Northeast China is scale dependent and weakens withdecreasing scale, especially from provincial to city scales.
3.3 Relationship between precipitation and SOC contentat different scales
The simple correlation coefficients between the ratio ofMAP and MAT (P/T ratio for short) and SOC content aswell as the partial correlation coefficients between MAPand SOC content taking MAT as the controlling variable aregiven in Table 4. Precipitation/temperature ratio reflects thecombined effect of temperature and precipitation on SOCcontent. At the regional scale, P/T ratio has no significantrelationship with SOC content for both 0–20- and 0–100-cm layers, which is different from the relationshipbetween P/T index and SOC density in seven ecologicalareas in the USA (Homann et al. 2007). But MAP has astrong and significantly positive relationship with SOCcontent (P<0.001) at 0–20 cm in the Uplands of NortheastChina and a weak relationship with SOC content at 0–100 cm. Obvious regional differences occurred in therelationship between P/T ratio along with MAP and SOCcontent at the provincial scale. For example, SOC content at0–20 cm is not significantly related with P/T ratio inHeilongjiang and Eastern Inner Mongolia. However, there
is a significant and positive relationship between P/T ratioand SOC content in Jilin and Liaoning. Similar results werefound in the other places worldwide. For example, asignificant relationship between the P/T ratio and the levelof soil organic matter was observed in the Pampa andChaco soils, Argentina (Alvarez and Lavado 1998). At theprovincial scale, SOC content has a significant and positiverelationship with MAP except for Liaoning at 0–100 cmand Eastern Inner Mongolia at 0–20 and 0–100 cm. AsTable 3 shows, the relationship between P/T ratio and SOCcontent at 0–20 cm has significant differences amongprovinces except for that between Heilongjiang and EasternInner Mongolia. Significant differences between P/T ratioand SOC content at 0–100 cm exist only betweenHeilongjiang and Jilin. In terms of the relationshipsbetween MAP and SOC content, there are significantdifferences between Jilin and Liaoning or Eastern InnerMongolia at 0–20 cm. At the city scale, no relationship wasobserved except for a significant positive relationshipbetween MAP and SOC content at 0–20 cm in Siping anda significant negative relationship between MAP and SOCcontent at 0–100 cm in Chifeng. SOC content is signifi-cantly related to P/T ratio in Jilin and Liaoning. Therelationship between MAP and SOC content weakens fromprovincial to city scales. Also, relationships between P/T
Scale Name Number rP/T rMAP
0–20 cm 0–100 cm 0–20 cm 0–100 cm
Region Northeast China 1,022 0.042 0.040 0.194*** 0.070*
Province Heilongjiang 183 0.042 0.051 0.321*** 0.173*
Jilin 404 0.455*** 0.266*** 0.325*** 0.232***
Liaoning 346 0.291*** 0.188*** 0.184** 0.086
Eastern Inner Mongolia 89 0.015 0.063 0.097 0.020
City Heihe 28 0.062 0.115 0.168 0.327
Suihua 31 0.271 0.327 −0.013 −0.021Yanbian 61 0.201 0.290* −0.150 −0.077Changchun 120 0.230* 0.081 0.037 −0.020Siping 91 0.346** 0.199 0.237* 0.147
Songyuan 39 0.458** 0.160 0.230 0.033
Fushun 38 0.534** 0.432** 0.111 −0.030Chifeng 42 0.174 0.155 −0.125 −0.361*
County Nenjiang 14 0.270 0.346 0.168 0.505
Hailun 12 −0.472 −0.382 −0.635* −0.493Yushu 31 0.146 −0.097 −0.120 −0.101Dehui 65 0.089 −0.037 0.144 0.027
Lishu 58 0.203 0.061 0.034 0.126
Fuxin 29 −0.115 −0.027 −0.091 −0.032Jinxi 50 −0.145 −0.232 0.028 −0.075Xinjin 35 0.035 0.107 −0.359* −0.153Keyou 17 0.427 0.517* 0.666** 0.495
Table 4 Correlation analysisof SOC content with precipita-tion in the Uplands ofNortheast China
rP/T correlation coefficientbetween P/T ratio and SOCcontent, rMAP correlationcoefficient between MAPand SOC content
*P<0.05; **P<0.01;***P<0.001
J Soils Sediments (2010) 10:1007–1017 1013

ratio and SOC content show regional differences at theprovincial and city scales but do not vary with scale.
3.4 Main climate factors controlling SOC contentat different scales
Climate is an important factor regulating SOC (Alvarez andLavado 1998). SOC content is negatively related to MATand positively related to MAP at the regional and provincialscales, which is consistent with previous studies (Burke etal. 1989; Hontoria et al. 1999; Ganuza and Almendros2003; Xie et al. 2004; Wang et al. 2005; Dai and Huang2006; Homann et al. 2007). The relationship betweenclimate and SOC content varies with scale. Linear single-regression analysis between climate factors (including P/Tratio, AAT, MAT, and MAP), and SOC content wasconducted to further determine the main climate factorsinfluencing SOC content at different scales based onadjusted R2 (Table 5). Differences exist in the main climatefactors controlling SOC content at different scales. At theregional scale, MAT (rMAT=−0.587, P<0.001) has a greaterinfluence on SOC content than MAP (rMAP=0.194, P<0.001) according to the correlation coefficients (see Tables 2and 4). SOC content is affected by MAT primarily in theUplands of Northeast China, which is consistent with theresults by Wang et al. (2005), which might be explain thatSOC content was sensitive to temperature in NortheastChina where MAT is quite low. Other studies also showedthat SOC pools in cold regions may be especially sensitiveto temperature (Lal et al. 2000; Lal 2004b). Therefore,
Uplands soils in Northeast China might be a potentialcarbon source in the future with global warming, likenorthern European regions (Singh 2008). MAT explains32% and 24% of the variability of SOC content at 0–20 and0–100 cm, respectively (P<0.001). At the provincial scale,the effect of climate factors on SOC content shows regionaldifferences. Although this scale differs from those studiedby other researchers, similar results have been reported inChina (Wang et al. 2005; Dai and Huang 2006), the USA(Homann et al. 2007), and Spain (Ganuza and Almendros2003). The reasons might be attributed to the differences insoil type, ecosystem, and topographic position. In ourstudy, 17 soil groups of Uplands were included and mainlydistributed in areas with relatively flat topography. How-ever, Dai and Huang (2006) and Homann et al. (2007)focused on mineral soils across several regions withdifferent climate and topography conditions. Ganuza andAlmendros (2003) concentrated on two different climateregimes in Basque County, Spain. Additionally, all thesestudies were carried out in several ecosystems, while ourresearch and the study by Wang et al. (2005) only involvedagricultural land.
Temperature is the main climate factor influencing SOCcontent in the Uplands of Heilongjiang. Also, AAT andMAT explain about 33% and 24% of SOC contentvariability at 0–20 cm, respectively, while MAP onlyexplains 9% of the variability. At 0–20 cm, temperature orprecipitation accounts for 13% of SOC content variability,while P/T ratio accounts for 21% in Jilin. So, SOC contentin the Uplands of Jilin is controlled by the combined effect
Table 5 Single linear regression (R2) values of SOC content vs. climate factors in the Uplands of Northeast China
Scale Number RP/T2 RAAT
2 RMAT2 RMAP
2
0–20 cm 0–100 cm 0–20 cm 0–100 cm 0–20 cm 0–100 cm 0–20 cm 0–100 cm
Region Northeast China 1,022 ns ns 0.20*** 0.14*** 0.32*** 0.24*** ns 0.01**
Province Heilongjiang 183 ns ns 0.33*** 0.11*** 0.24*** 0.15*** 0.09*** 0.02*
Jilin 404 0.21*** 0.07*** 0.12*** 0.05*** 0.12*** 0.05*** 0.13*** 0.07***
Liaoning 346 0.08*** 0.03*** 0.02** ns 0.05*** 0.02** 0.05*** 0.01*
Eastern InnerMongolia
89 ns ns 0.25*** 0.22*** 0.42*** 0.30*** 0.09** 0.04*
City Heihe 28 ns ns 0.181* ns ns ns ns ns
Suihua 31 ns ns ns ns ns 0.12* ns ns
Yanbian 61 ns 0.07* ns ns 0.08* 0.12** ns ns
Changchun 120 0.04* ns ns ns 0.05** ns ns ns
Siping 91 0.11** ns 0.08** ns 0.06* ns 0.08** ns
Songyuan 39 0.19** ns 0.10* ns 0.17** ns 0.11* ns
Fushun 38 0.27** 0.16** 0.22** 0.15* 0.23** 0.14* ns ns
Chifeng 42 ns ns ns ns ns 0.08* ns 0.09*
ns not significant
*P<0.05; **P<0.01; P<0.001
1014 J Soils Sediments (2010) 10:1007–1017
of temperature and precipitation. As for the Uplands ofLiaoning, MATorMAP explains only 5% of the variability inSOC content, while P/T ratio can explain 8% of the variabilityat 0–20 cm. So, SOC content in the Uplands of Liaoning isinfluenced by the combined effect of temperature andprecipitation. In Eastern Inner Mongolia, MAT is the mainclimate factor controlling SOC content, accounting for 42%of the variability in SOC content. At the city scale, thenumber of climate factors linearly related to SOC contentdecrease significantly. SOC content is controlled by thecombined effect of temperature and precipitation whichexplain 11%, 19%, and 27% of the variability at 0–20 cm inthe Uplands of Siping, Yanbian of Jilin province, and Fushunof Liaoning provinces, respectively. No relation was ob-served in other cities. The correlation between climate factorsand SOC content at 0–20 cm is better than that at 0–100 cm atall four scales supporting that the impact of climate factors onSOC decreases with increasing soil depth (Jobbágy andJackson 2000). It indicates that SOC content at 0–20 cm ismore sensitive to climate change.
Our results show that climate factors have limited abilityto explain the variability of SOC content especially forsmall scales. This is because SOC was affected by multiplefactors such as precipitation, temperature, and other factorsnot taken into account (Dai and Huang 2006). Humanactivity and management practices in agroecosystems couldaffect the C balance more strongly than climate change(Lugato and Bertia 2008). Also, seasonal temperatures andprecipitation, which are not reflected in MAP and MAT,probably result in different SOC levels in spite of the same
mean annual values (Kirschbaum 2000). Our study issimilar to the work of Dai and Huang (2006) and Homannet al. (2007) using pedon data, but our study focused onhow the correlation between climate factors and SOCcontent changes at different scales. This fills a critical gapin the study of scale effect factors on SOC content.
3.5 The sensitivity of SOC content at different scalesto global climate change in the future
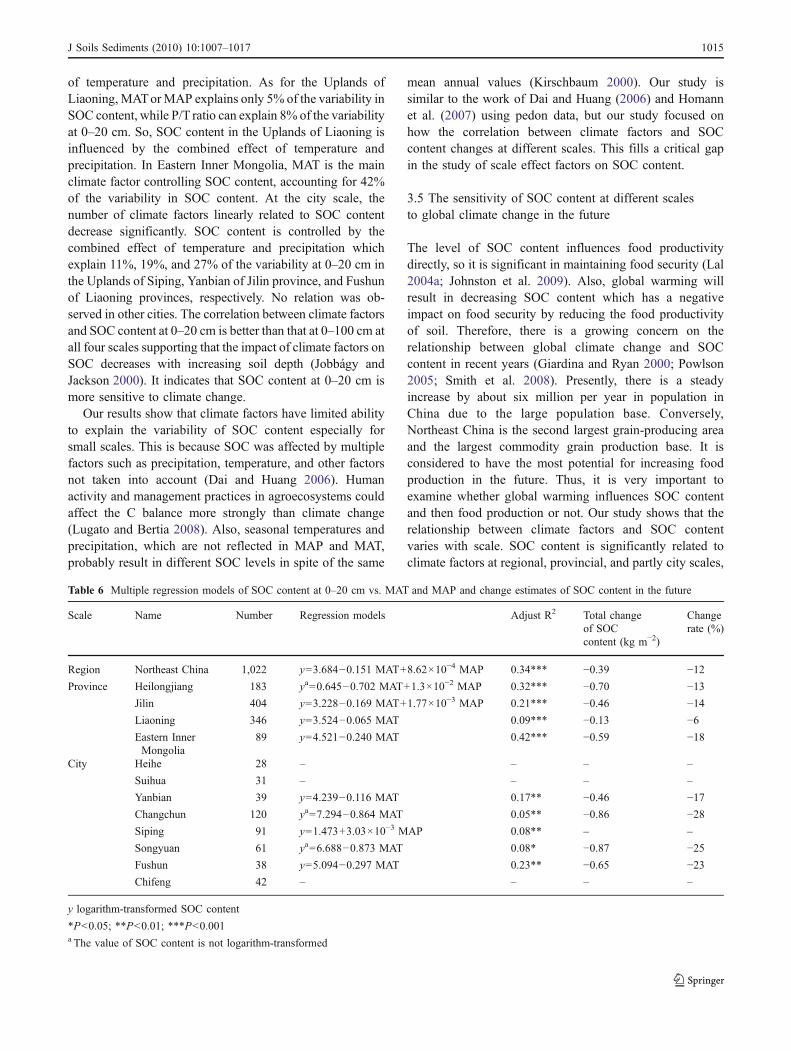
The level of SOC content influences food productivitydirectly, so it is significant in maintaining food security (Lal2004a; Johnston et al. 2009). Also, global warming willresult in decreasing SOC content which has a negativeimpact on food security by reducing the food productivityof soil. Therefore, there is a growing concern on therelationship between global climate change and SOCcontent in recent years (Giardina and Ryan 2000; Powlson2005; Smith et al. 2008). Presently, there is a steadyincrease by about six million per year in population inChina due to the large population base. Conversely,Northeast China is the second largest grain-producing areaand the largest commodity grain production base. It isconsidered to have the most potential for increasing foodproduction in the future. Thus, it is very important toexamine whether global warming influences SOC contentand then food production or not. Our study shows that therelationship between climate factors and SOC contentvaries with scale. SOC content is significantly related toclimate factors at regional, provincial, and partly city scales,
Table 6 Multiple regression models of SOC content at 0–20 cm vs. MAT and MAP and change estimates of SOC content in the future
Scale Name Number Regression models Adjust R2 Total changeof SOCcontent (kg m−2)
Changerate (%)
Region Northeast China 1,022 y=3.684−0.151 MAT+8.62×10⁻⁴ MAP 0.34*** −0.39 −12Province Heilongjiang 183 ya=0.645−0.702 MAT+1.3×10⁻² MAP 0.32*** −0.70 −13
Jilin 404 y=3.228−0.169 MAT+1.77×10⁻³ MAP 0.21*** −0.46 −14Liaoning 346 y=3.524−0.065 MAT 0.09*** −0.13 −6Eastern InnerMongolia
89 y=4.521−0.240 MAT 0.42*** −0.59 −18
City Heihe 28 – – – –
Suihua 31 – – – –
Yanbian 39 y=4.239−0.116 MAT 0.17** −0.46 −17Changchun 120 ya=7.294−0.864 MAT 0.05** −0.86 −28Siping 91 y=1.473+3.03×10⁻³ MAP 0.08** – –
Songyuan 61 ya=6.688−0.873 MAT 0.08* −0.87 −25Fushun 38 y=5.094−0.297 MAT 0.23** −0.65 −23Chifeng 42 – – – –
y logarithm-transformed SOC content
*P<0.05; **P<0.01; ***P<0.001a The value of SOC content is not logarithm-transformed
J Soils Sediments (2010) 10:1007–1017 1015

especially for temperature, rather than for the county scale.Different scales contributed to the difference in therelationship between climate factors and SOC content. Itis better to select a large scale, such as regional andprovincial scales, to study the effect of global warming onSOC content. County is not a suitable scale for the study ofthe sensitivity of SOC content to climate factors.
The sensitivity of SOC content to global warming varieswith scale. The regression equations of SOC content at 0–20 cm vs. MAT and MAP are given in Table 6. The resultsshow that SOC content will decrease when temperatureincreases under current climate conditions (see Table 1).Soils in the Uplands of Northeast China might be animportant carbon resource after global warming. If therelationship between SOC, climate factors, the farmingsystem, and management practices remains constant whenMAT rises by 1°C, SOC content would decrease by0.39 kg m−2 at the regional scale. There are differences inthe total change of SOC content due to global warming atthe provincial scale. Heilongjiang (0.70 kg m−2) had thelargest decrease in SOC content, followed by Eastern InnerMongolia (0.59 kg m−2) and Jilin (0.46 kg m−2). Liaoninghad the lowest decrease in SOC content (0.13 kg m−2). Asfor the change rate (the ratio of total change of SOC contentto original SOC content), Eastern Inner Mongolia had thelargest value (18%), then Jilin (14%), Heilongjiang (13%),and Liaoning (6%). At the city scale, SOC content in theUplands of Yanbian, Changchun, Songyuan, and Fushuncities all decreased with a high total change and change rate(see Table 6).Therefore, multiple scales should be takeninto account when the feedback relationship between globalclimate change and SOC content is studied.
4 Conclusions
The relationship between climate factors and SOC contentweakens with decreasing scale, especially from the provin-cial to city scale. In general, the main climate factorcontrolling SOC content varies at different scales. Temper-ature is the main climate factor influencing SOC content. Atthe provincial scale, regional differences were observed inthe main climate factor controlling SOC content in theUplands. Due to the impact of soil texture, humanactivities, and other influencing factors on SOC content,climate factors are not the main factors controlling SOCcontent at the city and county scales. Regional scale is notthe optimal scale to study the relationship between climatefactors and SOC content in the Uplands of Northeast Chinabecause regional differences among provinces may becovered up at this scale. As such, the provincial scale isoptimal for studying the effect of climate factors on SOCcontent.
5 Recommendations and perspectives
SOC content is controlled by several factors, many ofwhich are mutually interactive and limit the ability ofclimate factors to interpret the SOC content variability atsmall (city and county) scales. Seasonal change oftemperature and precipitation may influence SOC. So, inorder to find the key climate factors controlling, SOC it isnecessary to consider climate factors at multiple timescales.Research on the main factor controlling SOC content is thepremise of accurately predicting the SOC pool. Therefore,further studies focusing on the scale effect of other factors(including climate) on the variability of SOC content shallbe carried out at different scales to determine the mainfactors controlling SOC content.
Acknowledgements We gratefully acknowledge support for thisresearch from the National Natural Science Foundation of China (no.40621001), The Frontier Project of the Chinese Academy of Sciences(no. ISSASIP0715), and the National Basic Research Program ofChina (2007CB407206).
References
Alvarez R, Lavado RS (1998) Climate, organic matter and claycontent relationships in the Pampa and Chaco soils, Argentina.Geoderma 83(1–2):127–141
Batjes NH (1996) Total carbon and nitrogen in the soils of the world.Eur J Soil Sci 47:151–163
Bellamy PH, Loveland PJ, Bradley RI, Lark RM, Kirk GJD (2005)Carbon losses from all soils across England and Wales 1978–2003. Nature 437:245–248
Blumfield TJ, Xu Z, Prasolova NV, Mathers NJ (2006) Effect ofoverlying windrowed harvest residues on soil carbon andnitrogen in hoop pine plantations of subtropical Australia. J SoilsSediments 6(4):243–248
Burke IC, Yonker CM, PartonWJ, Cole CV, Flach K, Schimel DS (1989)Texture, climate, and cultivation effects on soil organic mattercontent in U.S. grassland soils. Soil Sci Soc Am J 53:800–805
Dai WH, Huang Y (2006) Relation of soil organic matter concentra-tion to climate and altitude in zonal soils of China. Catena 65(1):87–94
Davidson EA, Janssens IA (2006) Temperature sensitivity of soilcarbon decomposition and feedbacks to climate change. Nature440:165–173
Finzi AC, Breemen NV, Canham CD (1998) Canopy tree soilinteractions within temperate forests: tree species effects oncarbon and nitrogen. Ecol Appl 8:440–446
Gai JY (2000) Statistics methods of experiments. Chinese AgriculturePress, Beijing, p 407 (in Chinese)
Ganuza A, Almendros G (2003) Organic carbon storage in soils of theBasque Country (Spain): the effect of climate, vegetation typeand edaphic variables. Biol Fert Soils 37:154–162
Gao M, Luo YJ, Wang ZF, Tang XH, Wei CF (2008) Effect of tillagesystem on distribution of aggregates and organic carbon in ahydragric anthrosol. Pedosphere 18(5):574–581
Giardina CP, Ryan MG (2000) Evidence that decomposition rates oforganic carbon in mineral soil do not vary with temperature.Nature 404(6780):858–861
1016 J Soils Sediments (2010) 10:1007–1017

Gong ZT, Zhao QG, Zeng SZ, Lin P, Wang RC (1978) A draftingproposal for soil classification of China. Soil 5:168–169 (in Chinese)
Guo YY, Gong P, Amundson R, Yu Q (2006) Analysis of factorscontrolling soil carbon in the conterminous United States. SoilSci Soc Am J 70:601–612
Homann PS, Sollins P, Chappell HN, Stangenberger AG (1995) Soilorganic carbon in a mountainous, forested region: relation to sitecharacteristics. Soil Sci Soc Am J 59:1468–1475
Homann PS, Kapchinske JS, Boyce A (2007) Relations of mineral-soil C and N to climate and texture: regional differences withinthe conterminous USA. Biogeochem 85(3):303–316
Hontoria C, Rodríguez-Murillo JC, Saa A (1999) Relationshipsbetween soil organic carbon and site characteristics in peninsularSpain. Soil Sci Soc Am J 63:614–621
Jenny H (1941) Factors of soil formation: a system of quantitativepedology. McGraw-Hill, New York
Jobbágy EG, Jackson RB (2000) The vertical distribution of soilorganic carbon and its relation to climate and vegetation. EcolAppl 10:423–436
Johnston AE, Poulton PR, Coleman K, Donald LS (2009) Chapter 1soil organic matter: its importance in sustainable agriculture andcarbon dioxide fluxes, advances in agronomy. Academic, NewYork, pp 1–57
Kern JS, Turner DP, Dodson RF (1998) Spatial patterns in soil organiccarbon pool size in the northwestern United States. In: Lal R,Kimbai JM, Foilett R, Stewart BA (eds) Soil processes and thecarbon cycle. Lewis, Boca Raton, pp 29–43
Kirschbaum MUF (1995) The temperature dependence of soil organicmatter decomposition, and the effect of global warming on soilorganic C storage. Soil Biol Biochem 27(6):753–760
Kirschbaum MUF (2000) Will changes in soil organic carbon act as apositive or negative feedback on global warming? Biogeochem-istry 48:21–51
Kirschbaum MUF (2006) The temperature dependence of organic-matter decomposition—still a topic of debate. Soil Biol Biochem38(9):2510–2518
Lal R (2004a) Soil carbon sequestration impacts on global climatechange and food security. Science 304:1623–1627
Lal R (2004b) Soil carbon sequestration to mitigate climate change.Geoderma 123:1–22
Lal R, Kimble JM, Stewart BA (2000) Global climate change and coldregions ecosystems. CRC Lewis, Boca Raton, p 265
Lu RK (2000) Analysis methods of soil agrochemistry. ChinaAgriculture Science and Technology Press, Beijing, p 638 inChinese
Lugato E, Bertia A (2008) Potential carbon sequestration in acultivated soil under different climate change scenarios: amodeling approach for evaluating promising management prac-tices in north-east Italy. Agric Ecosyst Environ 128(1–2):97–103
Murphy J, Riley JP (1962) A modified single-solution method for thedetermination of phosphate in natural waters. Anal Chem Acta27:31–36
National Soil Survey Office (1992) Soil survey techniques of China.China Agriculture Press, Beijing (in Chinese)
National Soil Survey Office (1996) Soil species of China. ChinaAgriculture Press, Beijing (in Chinese)
Page AL, Miller RH, Keeney DR (1982) Methods of soil analysis part2—chemical and microbiological properties, 2nd edn. ASA,Madison
Parkinson JA, Allen SE (1975) A wet oxidation procedure suitable fordetermination of nitrogen and mineral nutrients in biologicalmaterial. Commun Soil Sci Plant Anal 6:1–11
Percival HJ, Parfitt RL, Scott NA (2000) Factors controlling soilcarbon levels in New Zealand grasslands: is clay contentimportant? Soil Sci Soc Am J 64:1623–1630
Post WM, Emanuel WR, Zink PJ, Stangenberger AG (1982) Soilcarbon pools and world life zone. Nature 298:156–159
Powers JS, Schlesinger WH (2002) Relationships among soil carbondistributions and biophysical factors at nested spatial scales inrain forests of northeastern Costa Rica. Geoderma 109:165–190
Powlson D (2005) Will soil amplify climate change? Nature 433:204–205
Ren JZ (1985) English–Chinese agriculture dictionary (grasslandscience). China Agriculture Press, Beijing, p 337 in Chinese
Schlesinger WH (1990) Evidence from chronosequence studies for alow carbon-storage potential of soils. Nature 348(6298):232–234
Shi XZ, Yu DS, Yang GX, Wang HJ, Sun WX, Du GH, Gong ZT(2006) Cross-reference benchmarks for translating the geneticsoil classification of China into the Chinese soil taxonomy.Pedosphere 16(2):147–153
Singh BR (2008) Carbon sequestration in soils of cool temperateregions (introductory and editorial). Nutr Cycl Agroecosyst81:107–112
Sleutel S, Neve SD, Hofman G (2007) Assessing causes of recentorganic carbon losses from cropland soils by means of regional-scaled input balances for the case of Flanders (Belgium). NutrCycl Agroecosyst 78:265–278
Smith P, Fang C, Dawson JJC, Moncrieff JB, Donald LS (2008)Impact of global warming on soil organic carbon. Advances inagronomy. Academic, New York, pp 1–43
Sollins P, Homann P, Caldwell BA (1996) Stabilization anddestabilization of soil organic matter: mechanisms and controls.Geoderma 74:65–105
Tan ZX, Lal R, Smeck NE, Calhoun FG (2004) Relationships betweensurface soil organic carbon poll and site variables. Geoderma 122(3–4):187–195
Turner MG, Dale VH, Gardner RH (1989) Predicting across scales:theory development and testing. Landsc Ecol 3:245–252
Wagai R, Mayer LM, Kitayama K, Knicker H (2008) Climate andparent material controls on organic matter storage in surfacesoils: a three-pool, density-separation approach. Geoderma 147(1–2):23–33
Wang SQ, Yu GR, Zhao QJ, Niu D, Chen QM, Wu ZF (2005) Spatialcharacteristics of soil organic carbon storage in China’s crop-lands. Pedosphere 15(4):417–423
Wang HJ, Liu QH, Shi XZ, Yu DS, Zhao YC, Sun WX, Darilek JL(2007) Carbon storage and spatial distribution patterns of paddysoils in China. Front Agric China 1(2):149–154
Wang HJ, Huang B, Shi XZ, Darilek JL, Yu DS, Sun WX, Zhao YC,Chang Q, Öborn I (2008) Major nutrient balances in small-scalevegetable farming systems in peri-urban areas in China. NutrCycl Agroecosyst 81:203–218
Wu T, Zhou T, Yuan SJ (2001) Data analysis and applications ofSPSS. Beijing Normal University Press, Beijing (in Chinese)
Wu QB, Wang XK, Ouyang ZY (2009) Soil organic carbon and itsfractions across vegetation types: effects of soil mineral surfacearea and microaggregates. Pedosphere 19(2):258–264
Xie XL, Sun B, Zhou HZ, Li AB (2004) Soil organic carbon storagein China. Pedosphere 14(4):491–500
Xu ZH, Ward S, Chen C, Blumfield T, Prasolova N, Liu JX (2008)Soil carbon and nutrient pools, microbial properties and grossnitrogen transformations in adjacent natural forest and hoop pineplantations of Subtropical Australia. J Soils Sediments 8(2):99–105
Yang XM, Drury CF, Wander MM, Kay BD (2008) Evaluating theeffect of tillage on carbon sequestration using the minimumdetectable difference concept. Pedosphere 18(4):421–430
Zhou CH, Zhou QM, Wang SQ (2003) Estimating and analyzing thespatial distribution of soil organic carbon in China. R Swed AcadSci 32(1):6–12
J Soils Sediments (2010) 10:1007–1017 1017