saving fuel, saving costs impacts and reduction potential for
TRANSCRIPT
Saving fuel, saving costs
Impacts and reduction potential for
corporate fleets
Report prepared for: Greenpeace Report Delft, April 2015
Author(s): Sanne Aarnink
Huib van Essen
Arno Schroten
Matthijs Otten
2 April 2015 4.E62.1 – Saving fuel, saving costs
Publication Data
Bibliographical data:
Sanne Aarnink, Huib van Essen, Arno Schroten, Matthijs Otten
Saving fuel, saving costs
Impacts and reduction potential for corporate fleets
Delft, CE Delft, April 2015
Carbon dioxide / Standards / Vehicles / Freight transport / Market / Industry / Policy /
Decision-making
FT : Options
Publication code: 15.4E62.23
CE publications are available from www.cedelft.eu
Commissioned by: Greenpeace
Further information on this study can be obtained from the contact person, Huib van Essen.
© copyright, CE Delft, Delft
CE Delft
Committed to the Environment
Through its independent research and consultancy work CE Delft is helping build a sustainable
world. In the fields of energy, transport and resources our expertise is leading-edge. With our
wealth of know-how on technologies, policies and economic issues we support government
agencies, NGOs and industries in pursuit of structural change. For 35 years now, the skills and
enthusiasm of CE Delft’s staff have been devoted to achieving this mission.
3 April 2015 4.E62.1 – Saving fuel, saving costs
Executive summary
This report provides a comprehensive overview of how corporate fleets
contribute to global oil consumption and greenhouse gas emissions. It also
describes the wide range of practical solutions available to reduce the fuel
use and emissions of both passenger and freight fleets. The study shows that
there is a large potential of options for reducing fuel use, many with a
payback time of several years.
Our reliance on oil is expensive and environmentally damaging Global oil consumption is causing serious environmental problems, including air
pollution and climate change. The hunt for new oil reserves is threatening to
destroy sensitive areas of international importance like the Arctic. And our
reliance on oil is creating economies that are dependent on foreign oil imports
and vulnerable to fluctuating oil prices.
Transport represents 64% of global oil demand. As a result, the sector is
responsible for a large share – 23% – of global greenhouse gas (GHG) emissions.
In the EU this share is lower (20%); in the US and Canada it is higher (28%).
Transport emissions are dominated by road transport.
Almost half of domestic transport emissions are from corporate fleets A large proportion of a country’s road transport fleet will be made up of
company vehicles, and a high percentage of new vehicle sales will be for
corporate use. In the EU nearly all heavy goods vehicles (HGVs), most light
commercial vehicles (LCVs) and about half of all new passenger cars are
purchased by companies or other fleet owners.
These vehicles use a vast amount of fuel. Corporate fleets (company cars +
HGVs + LCVs) in Europe spend nearly € 200 billion on fuel every year. The Total
Cost of Ownership (TCO) is about € 600 billion per year.
In all, the EU’s entire corporate fleet is responsible for approximately 45% of
emissions from road transport, and therefore 8% of total EU GHG emissions.
Company cars are often sold on to private buyers after a few years and remain
on the road for many more, so the influence of the corporate fleet on
emissions is greater than these figures suggest.
Cleaner corporate passenger fleets can significantly reduce costs Many companies are searching for ways to bring down fuel use in order to save
money and reduce environmental impact. Cutting fuel consumption means
lower GHG emissions and less demand for oil. This in turn makes the
extraction of alternative, controversial crude – from tar sands or the Arctic,
for example – less profitable. Solutions to save fuel include:
Choosing more fuel efficient conventional cars. This has a significant
potential for reducing GHG emissions against low or often even negative
costs. Furthermore, choosing low resistance tyres for all cars is also a cost
effective measure that saves fuel and money.
Adopting alternative powertrains, like full electric or plug-in hybrid cars,
can reduce emissions even further. Investment costs are significantly
higher, but are often offset by tax benefits or subsidies. In some countries,
for vehicles with sufficiently high mileages, the total fuel savings are
earned back within the vehicle’s lifetime. Unlike full electric, the driving
4 April 2015 4.E62.1 – Saving fuel, saving costs
range of plug-in hybrids is not limited by battery capacity. They require
additional arrangements to make sure that drivers charge as often as
possible which is needed for harvesting the full fuel saving potential.
Measures encouraging fuel efficient driving behaviour can also be
effective. As well as offering initial eco-driving courses to employees, it is
essential to follow-up with monitoring, feedback and additional incentives,
like a competition or financial bonus/malus scheme. Such an approach can
improve fuel efficiency from 2 to more than 20% per year. Alongside saving
fuel, eco-driving can also bring down accident rates and maintenance
costs.
Teleworking and teleconferencing can save significant amounts of time
and money spent on travel. Teleworking for one day a week reduces CO2
emissions by an average of 14% and can save € 2,000 per employee per
year. A modal shift from cars to alternative transport modes in business
and commuting travel can be stimulated in various ways, including
financial incentives and travel card schemes. For example, offering
multimodal business travel cards to employees can reduce company car
kilometres by 7%.
Freight fleets can be cleaner, more efficient and cost less There are many ways to reduce the fuel consumption and emissions of HGVs
and LCVs. Just as for cars, using less petrol and diesel will save a company
money and reduce its environmental impact. Solutions include:
Choosing the most fuel efficient conventional vehicle. In addition,
retrofitting vehicles, particularly trucks, can make them much more
efficient. Emissions from HGVs can be reduced by 1-4% with a single
measure to improve aerodynamics, by combing measures much higher
reductions can be achieved and many measures have a relatively short
payback time.
Purchasing alternative powertrains can reduce emissions even further.
The first full electric and plug-in hybrid trucks have entered the market
and electric vans are also available. Emissions from HGVs can be reduced
by 8-30% with full hybridisation. Purchase costs are much higher than for
conventional vehicles but, with significant reductions in fuel costs and
subsidies in some countries, the difference in the TCO is decreasing and in
some cases becoming (close to) competitive. Other alternatives are CNG or
LNG drivetrains, which usually have lower investment costs but also lower
emissions reduction potential (up to 20%).
Eco-driving programmes can again have a significant impact for freight
vehicles. This kind of behaviour change can produce immediate fuel
savings of up to 20% and long-term savings of 5-7%. Monitoring and
feedback to drivers is crucial to maintain the positive effects. Various
co-benefits can be expected, including lower accident rates and
maintenance costs.
Reducing freight vehicle kilometres can also contribute to lower GHG
emissions. This can be done by modal shift or increasing the logistical
efficiency. Real world examples show that improved logistical efficiency can
reduce emissions by 4-20%. A shift to alternative transport modes (inland
navigation or rail transport) can have even much higher GHG reduction
potentials, but these are very case specific.
5 April 2015 4.E62.1 – Saving fuel, saving costs
Contents
Contents 5
1 Introduction 7 1.1 Background 7 1.2 Objectives and scope of the project 8 1.3 Approach 8 1.4 Outline of the report 8
2 Greenhouse Gas Emissions and Costs of Corporate Fleets 9 2.1 Introduction 9 2.2 Contribution of transport to climate change 9 2.3 Contribution of corporate fleets to climate change 12 2.4 Costs of corporate fleets and their fuel use 13
3 Potential for Reducing Oil Consumption of Corporate Fleets 15 3.1 Introduction 15 3.2 Passenger transport 16 3.3 Freight transport 25
References 39
Annex A Estimations company cars in the EU28 47
Annex B Overview and explanation of technical measures for freight transport vehicles 49

6 April 2015 4.E62.1 – Saving fuel, saving costs
7 April 2015 4.E62.1 – Saving fuel, saving costs
1 Introduction
1.1 Background
Transport represents a relatively high share of global oil demand. This poses a
threat to sensitive areas like the Arctic and causes serious environmental
problems such as air pollution and global warming.
Anthropogenic GreenHouse Gas (GHG) emissions currently cause global
warming of approximately 1˚C compared to the pre-industrial level, warming
that is expected to increase to 2-4˚C in 2100 depending on the chosen
reduction scenario (IPCC, 2014a). Politicians aim to limit the global
temperature increase to 2˚C to prevent dangerous climate change. In order to
reach this goal, each country and every economic sector will have to
drastically reduce its GHG emissions.
The combustion of fossil fuels (oil, coal and gas) is the main contributor to
global warming, in which emissions from oil consumption make up the largest
share in the EU28 and USA/Canada (IPCC, 2014a; IEA, 2014a). The demand for
crude oil and oil products has grown significantly over the last decades, mainly
because of growing transport volumes and the dependency of transport on oil
products (IEA, 2014b). Consequently, the transport sector now produces 23% of
global GHG emissions (IEA, 2014a) and, therefore, the sector has an important
role to play in reducing them.
Company cars and road freight transport are responsible for a large share of
the transport sector’s oil consumption and emissions (SULTAN, 2012; EPA,
2014; Environment Canada, 2014). The direct impacts of the fuel used by
company fleets is significant. In addition, a significant proportion of new
vehicle sales are company cars, which has a large impact on new vehicle
technologies and the fuel efficiency of future private fleets, affecting
emissions in the longer term.
Many companies are searching for options to reduce the fuel consumption of
their fleets and wider transport operations, in order to bring down costs and
reduce environmental impact. This reduces GHG emissions and so is a positive
development for climate change. It also reduces the demand for crude oil,
making the extraction of alternative oil1, e.g. from tar sands or sensitive areas
like the Arctic, less profitable. The main reason for developed countries, such
as the USA and Canada, to extract oil from such alternative oil sources is to
reduce their dependence on other (unstable) countries for their crude oil
supply. However, as became visible again recently, a lower demand for oil
results in oversupply and lower oil prices. The counter side of low oil prices is
an increase in the cost hurdle for a transition to alternative, low carbon
energy sources (IPCC, 2014b).
In this context Greenpeace commissioned CE Delft to conduct an independent
study on the potential and costs of reducing oil consumption (and therefore
emissions) of corporate fleets.
1 Sometimes referred to as ‘extreme oils’.
8 April 2015 4.E62.1 – Saving fuel, saving costs
1.2 Objectives and scope of the project
The overall objective of the study is to show what action can be taken by
corporate fleet operators with the aim of greening fleets and reducing costs.
In order to do so, the specific objectives of this study are to:
explore the contribution of corporate fleets to worldwide oil consumption
and GHG emissions, and the Total Costs of Ownership (TCO) - fuel costs in
particular – of corporate fleets;
summarise available (groups of) measures which fleet owners can adopt to
reduce the fuel consumption of passenger transport (company car fleets
in particular) and freight transport (van and truck fleets in particular),
including the reduction potential, monetary savings, and other benefits of
these measures.
As there are significant differences between regions and transport modes when
considering the specific objectives mentioned above, the scope is mainly
limited to:
The EU28 and partly to the USA and Canada. However, the second
chapter, which provides a background on emissions from transport and
corporate fleets, also covers the rest of the world.
Passenger cars, Light Commercial Vehicles (LCVs) and Heavy Goods
Vehicles (HGVs). Buses, motorcycles, rail transport, inland navigation,
aviation and maritime shipping are also included, except in Chapter 2.
1.3 Approach
For this study, an extensive literature review has been conducted.
The collected evidence is based on recent and fact-based sources, such as:
Databases and reports from the International Energy Agency (IEA).
Databases from the European Environment Agency (EEA) and from the EU
GHG transport: Routes from 2050 project (e.g. SULTAN).
National GHG inventories and other studies/data from the European
Commission, EPA, and Environment Canada.
Reports from independent research organisations, such as Ricardo-AEA,
TNO, the International Panel on Climate Change (IPCC) and CE Delft.
Company data (for case studies throughout the report). The inclusion of
case studies ensures that literature findings, especially as regards the
reduction potential and costs of measures, are in line with real-world
experiences.
CE Delft is an independent research and consultancy company, and this is an
independent study.
1.4 Outline of the report
The remainder of this report is structured around the specific objectives
outlined in Section 1.2. In Chapter 2 the contribution of (road) transport, and
corporate fleets in particular, to oil consumption and GHG emissions is
explored. This chapter also provides cost estimates of corporate fleets and
their fuel use. The measures that fleet owners can take to reduce fuel costs
and emissions are described in Chapter 3. This is done for both corporate
passenger and freight transport.
9 April 2015 4.E62.1 – Saving fuel, saving costs
2 Greenhouse Gas Emissions and Costs of Corporate Fleets
2.1 Introduction
In this chapter background information on the GHG emissions resulting from
transport is provided in Section 2.2. Then Section 2.3 highlights the
contribution of corporate fleets to these transport GHG emissions and provides
figures on the total (fuel) costs of corporate fleets.
2.2 Contribution of transport to climate change
Several human activities are causing anthropogenic GHG emissions.
The majority of these GHG emissions are CO2 emissions, which mainly result
from fossil fuel combustion (i.e. burning coal, gas and oil), industrial processes
(combined 65%) and from deforestation (11%) (IPCC, 2014a). The remainder of
the emitted GHGs (24%) comprise of non-CO2 emissions: fluorinated gases
(F-gases), methane (CH4) and nitrous oxide (N2O), which mainly result from
industrial processes and agricultural activities, for example due to the use of
fertilisers (IEA, 2014a). Together, human activities caused global
GHG emissions of 49 Gt CO2 equivalent (CO2 eq.) in 2010 (IPCC, 2014a).
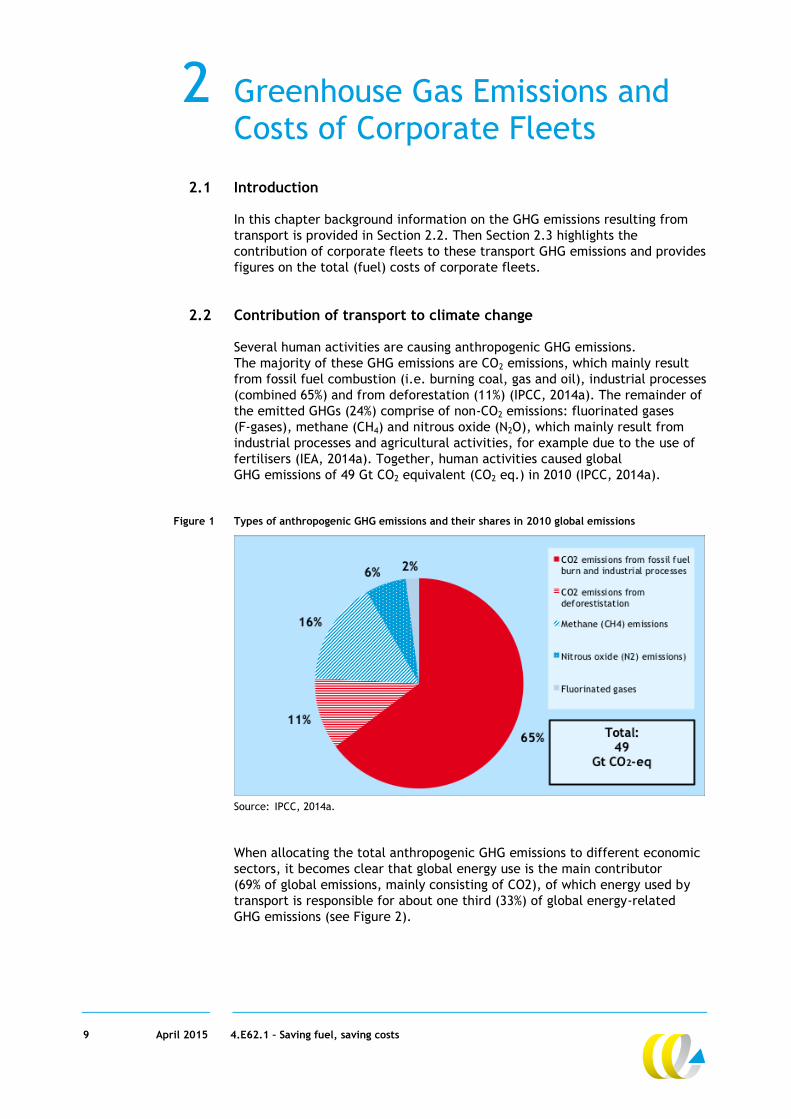
Figure 1 Types of anthropogenic GHG emissions and their shares in 2010 global emissions
Source: IPCC, 2014a.
When allocating the total anthropogenic GHG emissions to different economic
sectors, it becomes clear that global energy use is the main contributor
(69% of global emissions, mainly consisting of CO2), of which energy used by
transport is responsible for about one third (33%) of global energy-related
GHG emissions (see Figure 2).
10 April 2015 4.E62.1 – Saving fuel, saving costs
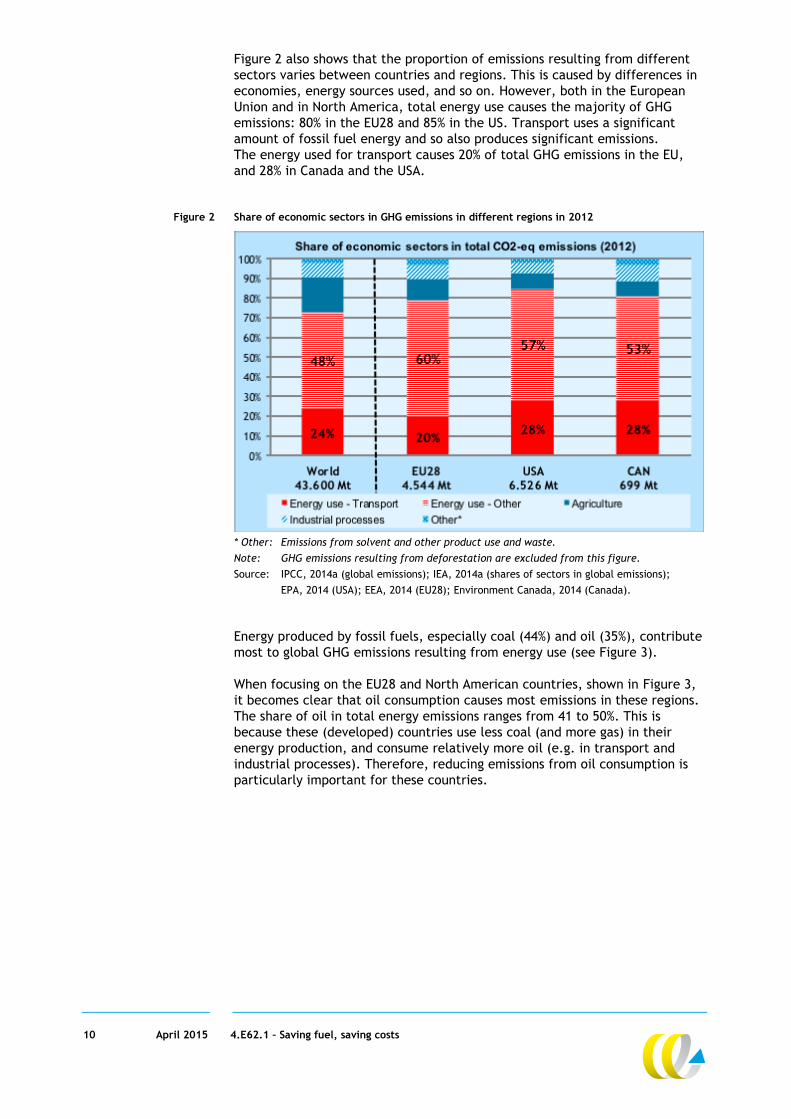
Figure 2 also shows that the proportion of emissions resulting from different
sectors varies between countries and regions. This is caused by differences in
economies, energy sources used, and so on. However, both in the European
Union and in North America, total energy use causes the majority of GHG
emissions: 80% in the EU28 and 85% in the US. Transport uses a significant
amount of fossil fuel energy and so also produces significant emissions.
The energy used for transport causes 20% of total GHG emissions in the EU,
and 28% in Canada and the USA.
Figure 2 Share of economic sectors in GHG emissions in different regions in 2012
* Other: Emissions from solvent and other product use and waste.
Note: GHG emissions resulting from deforestation are excluded from this figure.
Source: IPCC, 2014a (global emissions); IEA, 2014a (shares of sectors in global emissions);
EPA, 2014 (USA); EEA, 2014 (EU28); Environment Canada, 2014 (Canada).
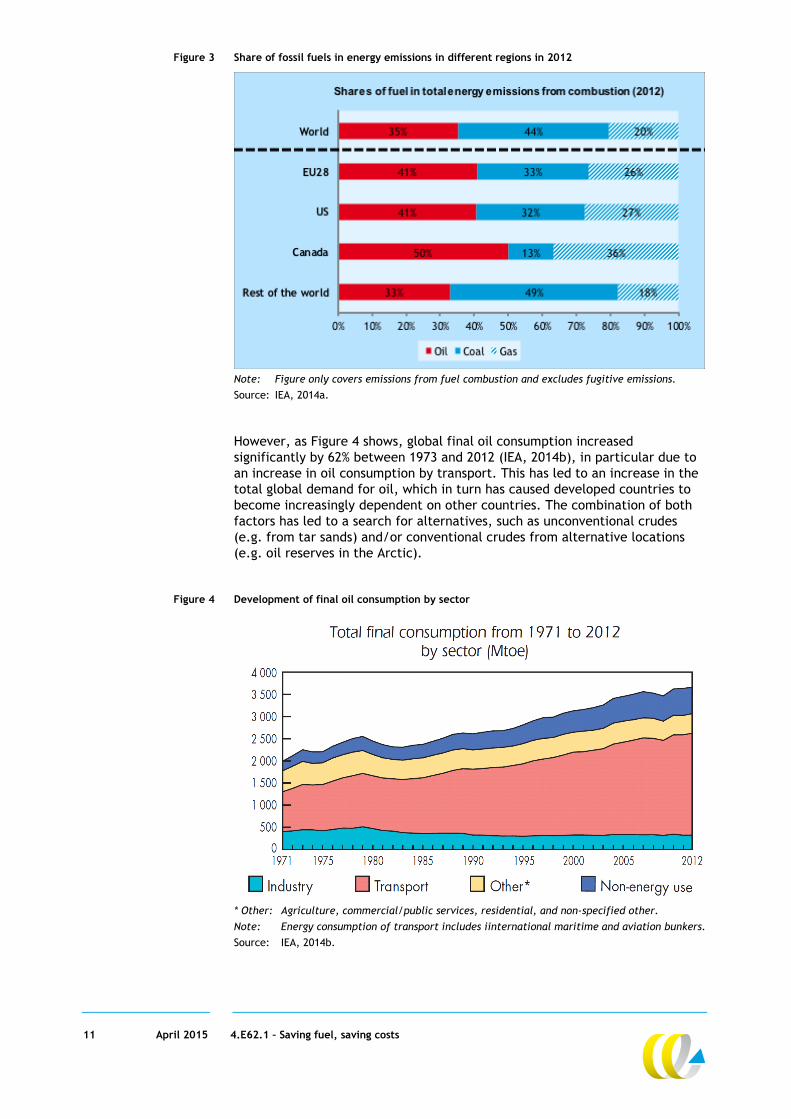
Energy produced by fossil fuels, especially coal (44%) and oil (35%), contribute
most to global GHG emissions resulting from energy use (see Figure 3).
When focusing on the EU28 and North American countries, shown in Figure 3,
it becomes clear that oil consumption causes most emissions in these regions.
The share of oil in total energy emissions ranges from 41 to 50%. This is
because these (developed) countries use less coal (and more gas) in their
energy production, and consume relatively more oil (e.g. in transport and
industrial processes). Therefore, reducing emissions from oil consumption is
particularly important for these countries.
11 April 2015 4.E62.1 – Saving fuel, saving costs
Figure 3 Share of fossil fuels in energy emissions in different regions in 2012
Note: Figure only covers emissions from fuel combustion and excludes fugitive emissions.
Source: IEA, 2014a.
However, as Figure 4 shows, global final oil consumption increased
significantly by 62% between 1973 and 2012 (IEA, 2014b), in particular due to
an increase in oil consumption by transport. This has led to an increase in the
total global demand for oil, which in turn has caused developed countries to
become increasingly dependent on other countries. The combination of both
factors has led to a search for alternatives, such as unconventional crudes
(e.g. from tar sands) and/or conventional crudes from alternative locations
(e.g. oil reserves in the Arctic).
Figure 4 Development of final oil consumption by sector
* Other: Agriculture, commercial/public services, residential, and non-specified other.
Note: Energy consumption of transport includes iinternational maritime and aviation bunkers.
Source: IEA, 2014b.
12 April 2015 4.E62.1 – Saving fuel, saving costs
Transport is the largest consumer of oil, representing 64% of global oil
consumption. Transport is still almost fully dependent on oil products: 93% of
the transport energy demand is met with oil products and only 4%, 2% and 1%
with natural gas, biofuel and electricity, respectively (IEA, 2014b). It is crucial
therefore to significantly reduce the oil consumption of transport in order to
reduce the emissions of this sector.
2.3 Contribution of corporate fleets to climate change
As highlighted in the previous section, the transport sector is responsible for
23% of total global GHG emissions. Statistics from the IEA (2014a) show that
road transport is by far the most significant contributor to these transport
emissions, with a share of 72-81%. This increases to 84-95% when only taking
into account domestic transport emissions (excluding international maritime
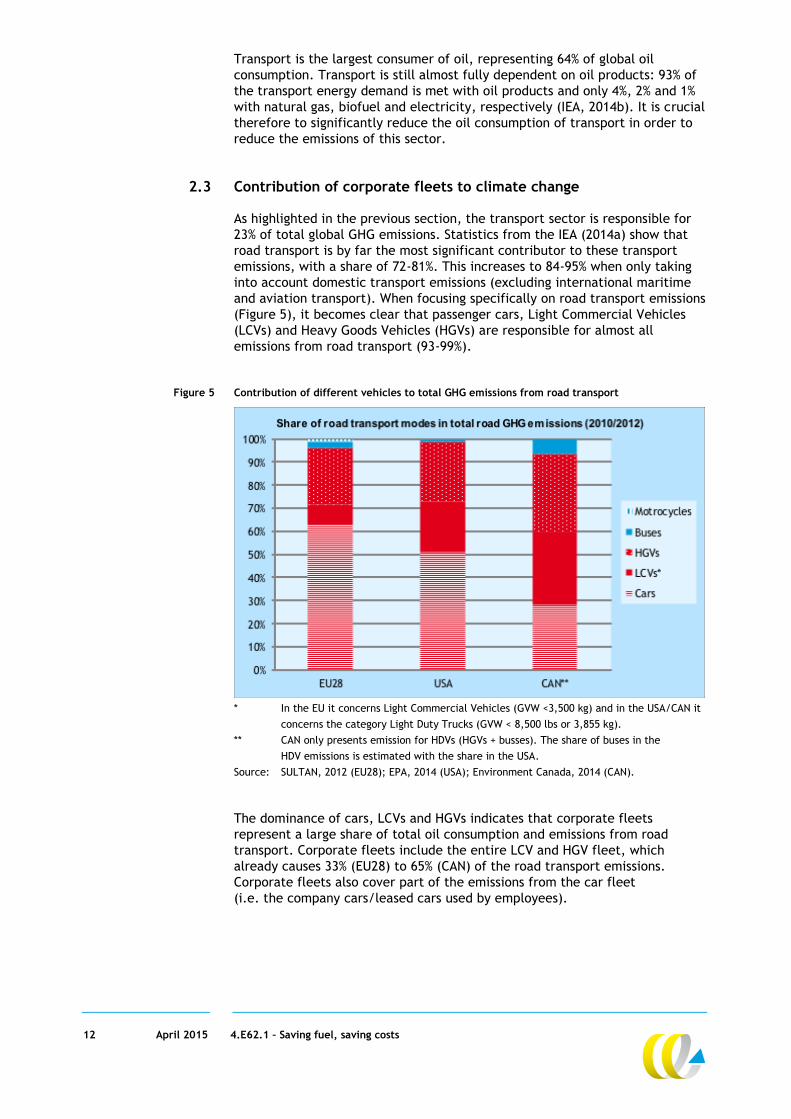
and aviation transport). When focusing specifically on road transport emissions
(Figure 5), it becomes clear that passenger cars, Light Commercial Vehicles
(LCVs) and Heavy Goods Vehicles (HGVs) are responsible for almost all
emissions from road transport (93-99%).
Figure 5 Contribution of different vehicles to total GHG emissions from road transport
* In the EU it concerns Light Commercial Vehicles (GVW <3,500 kg) and in the USA/CAN it
concerns the category Light Duty Trucks (GVW < 8,500 lbs or 3,855 kg).
** CAN only presents emission for HDVs (HGVs + busses). The share of buses in the
HDV emissions is estimated with the share in the USA.
Source: SULTAN, 2012 (EU28); EPA, 2014 (USA); Environment Canada, 2014 (CAN).
The dominance of cars, LCVs and HGVs indicates that corporate fleets
represent a large share of total oil consumption and emissions from road
transport. Corporate fleets include the entire LCV and HGV fleet, which
already causes 33% (EU28) to 65% (CAN) of the road transport emissions.
Corporate fleets also cover part of the emissions from the car fleet
(i.e. the company cars/leased cars used by employees).
13 April 2015 4.E62.1 – Saving fuel, saving costs
The share of company vs. private cars in the fleet or in the emissions are not
known at the global level. However, the European Union (2010) has found that
approximately 50% of new car sales in 18 investigated EU countries were
company cars in 2008. More recent numbers for specific countries show similar
shares (e.g. 54% in the UK (DfT, 2014) in 2013 and 57% in the Netherlands in
2012 (RAI, 2013)). As most company cars are eventually sold on to the private
market, and then remain on the road until the end of their vehicle life, it is
clear that the types of cars that companies buy has a large impact on the
composition of car fleets more widely.
When combining this with some general statistics on the EU car fleet, it is
estimated that the share of company cars in the EU28 fleet is 12%. When
correcting this share for the fact that company cars have a higher mileage and
higher efficiency (g/km) than an average car, it can be estimated that
company cars have a share of 18% in the total passenger car emissions of the
EU28. The main assumptions made for this estimate can be found in Annex A.
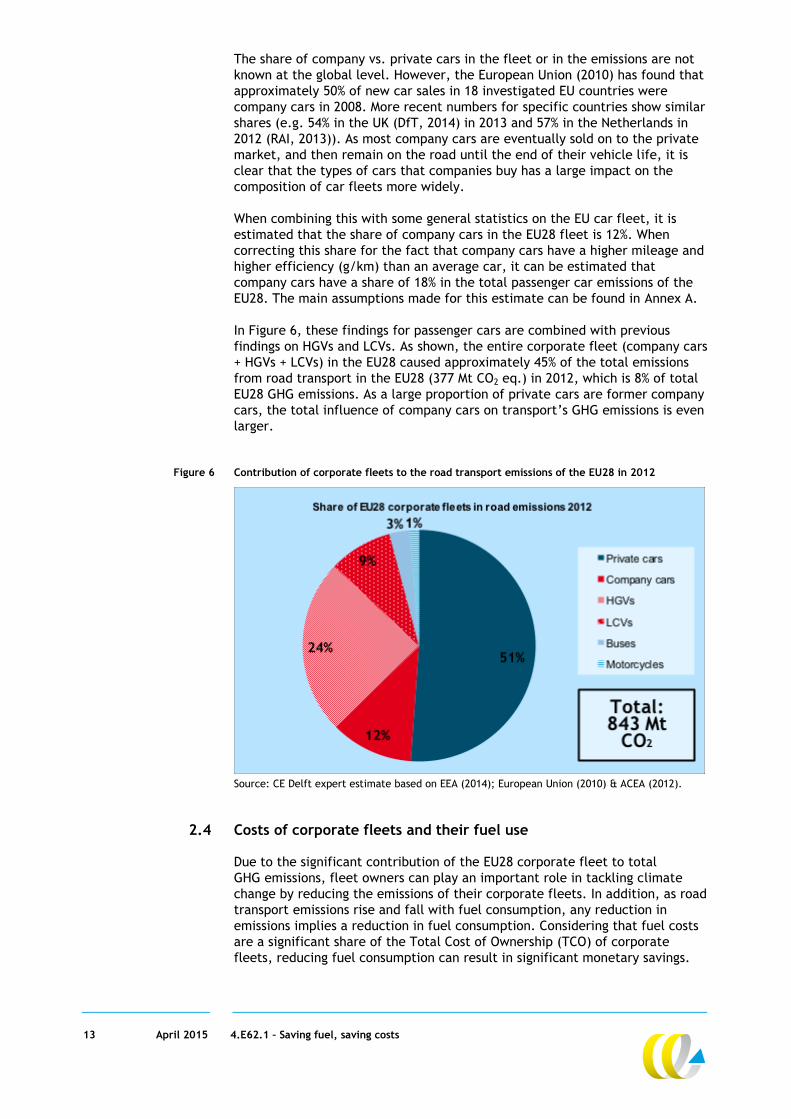
In Figure 6, these findings for passenger cars are combined with previous
findings on HGVs and LCVs. As shown, the entire corporate fleet (company cars
+ HGVs + LCVs) in the EU28 caused approximately 45% of the total emissions
from road transport in the EU28 (377 Mt CO2 eq.) in 2012, which is 8% of total
EU28 GHG emissions. As a large proportion of private cars are former company
cars, the total influence of company cars on transport’s GHG emissions is even
larger.
Figure 6 Contribution of corporate fleets to the road transport emissions of the EU28 in 2012
Source: CE Delft expert estimate based on EEA (2014); European Union (2010) & ACEA (2012).
2.4 Costs of corporate fleets and their fuel use
Due to the significant contribution of the EU28 corporate fleet to total
GHG emissions, fleet owners can play an important role in tackling climate
change by reducing the emissions of their corporate fleets. In addition, as road
transport emissions rise and fall with fuel consumption, any reduction in
emissions implies a reduction in fuel consumption. Considering that fuel costs
are a significant share of the Total Cost of Ownership (TCO) of corporate
fleets, reducing fuel consumption can result in significant monetary savings.
14 April 2015 4.E62.1 – Saving fuel, saving costs
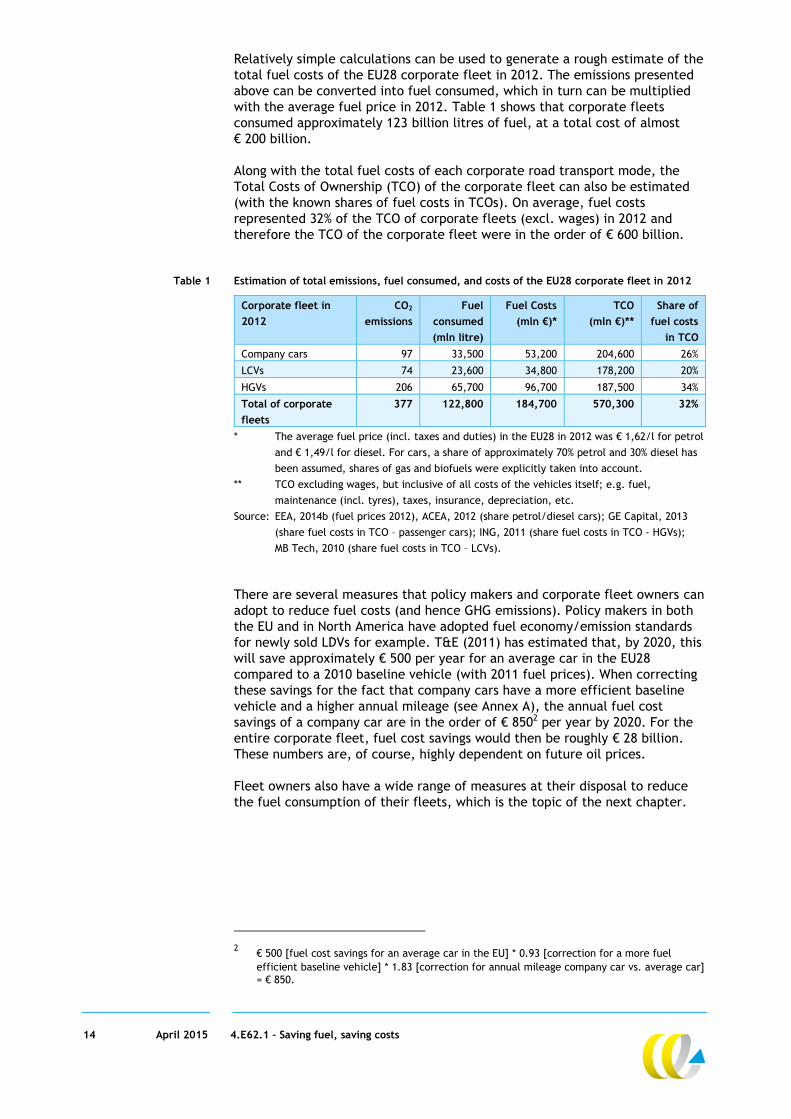
Relatively simple calculations can be used to generate a rough estimate of the
total fuel costs of the EU28 corporate fleet in 2012. The emissions presented
above can be converted into fuel consumed, which in turn can be multiplied
with the average fuel price in 2012. Table 1 shows that corporate fleets
consumed approximately 123 billion litres of fuel, at a total cost of almost
€ 200 billion.
Along with the total fuel costs of each corporate road transport mode, the
Total Costs of Ownership (TCO) of the corporate fleet can also be estimated
(with the known shares of fuel costs in TCOs). On average, fuel costs
represented 32% of the TCO of corporate fleets (excl. wages) in 2012 and
therefore the TCO of the corporate fleet were in the order of € 600 billion.
Table 1 Estimation of total emissions, fuel consumed, and costs of the EU28 corporate fleet in 2012
Corporate fleet in
2012
CO2
emissions
Fuel
consumed
(mln litre)
Fuel Costs
(mln €)*
TCO
(mln €)**
Share of
fuel costs
in TCO
Company cars 97 33,500 53,200 204,600 26%
LCVs 74 23,600 34,800 178,200 20%
HGVs 206 65,700 96,700 187,500 34%
Total of corporate
fleets
377 122,800 184,700 570,300 32%
* The average fuel price (incl. taxes and duties) in the EU28 in 2012 was € 1,62/l for petrol
and € 1,49/l for diesel. For cars, a share of approximately 70% petrol and 30% diesel has
been assumed, shares of gas and biofuels were explicitly taken into account.
** TCO excluding wages, but inclusive of all costs of the vehicles itself; e.g. fuel,
maintenance (incl. tyres), taxes, insurance, depreciation, etc.
Source: EEA, 2014b (fuel prices 2012), ACEA, 2012 (share petrol/diesel cars); GE Capital, 2013
(share fuel costs in TCO – passenger cars); ING, 2011 (share fuel costs in TCO - HGVs);
MB Tech, 2010 (share fuel costs in TCO – LCVs).
There are several measures that policy makers and corporate fleet owners can
adopt to reduce fuel costs (and hence GHG emissions). Policy makers in both
the EU and in North America have adopted fuel economy/emission standards
for newly sold LDVs for example. T&E (2011) has estimated that, by 2020, this
will save approximately € 500 per year for an average car in the EU28
compared to a 2010 baseline vehicle (with 2011 fuel prices). When correcting
these savings for the fact that company cars have a more efficient baseline
vehicle and a higher annual mileage (see Annex A), the annual fuel cost
savings of a company car are in the order of € 8502 per year by 2020. For the
entire corporate fleet, fuel cost savings would then be roughly € 28 billion.
These numbers are, of course, highly dependent on future oil prices.
Fleet owners also have a wide range of measures at their disposal to reduce
the fuel consumption of their fleets, which is the topic of the next chapter.
2 € 500 [fuel cost savings for an average car in the EU] * 0.93 [correction for a more fuel
efficient baseline vehicle] * 1.83 [correction for annual mileage company car vs. average car]
= € 850.
15 April 2015 4.E62.1 – Saving fuel, saving costs
3 Potential for Reducing Oil Consumption of Corporate Fleets
3.1 Introduction
The previous chapter showed the significant contribution of corporate fleets to
total transport-related GHG emissions and the significant costs that result.
There is a wide range of potential measures available that fleet owners can
adopt to reduce the fuel consumption (and therefore GHG emissions) of their
corporate fleets. In this chapter, a broad overview of these measures is
presented. This shows the potential monetary costs and cost savings, GHG
emission reduction potential, and other benefits (e.g. air pollution, health,
corporate image), for each group of measures. The description of each
measure is illustrated with real life case studies, describing the experiences of
companies that have already successfully implemented such measures.
The reduction potential of the various measures are expressed in GHG emission
reduction rates. The relative reductions in fuel use are in most cases roughly
the same. The direct CO2 emissions from burning a litre of petrol and diesel
are 2.38 and 2.63 kg of CO2. On a well-to-wheel (WTW) basis – so also taking
account of the emissions from oil extraction, refining and transport – these
factors are on average 18 to 20% higher (JRC, 2014). For unconventional oils
such as from tar sands or the Arctic, these WTW emission factors are higher
again.
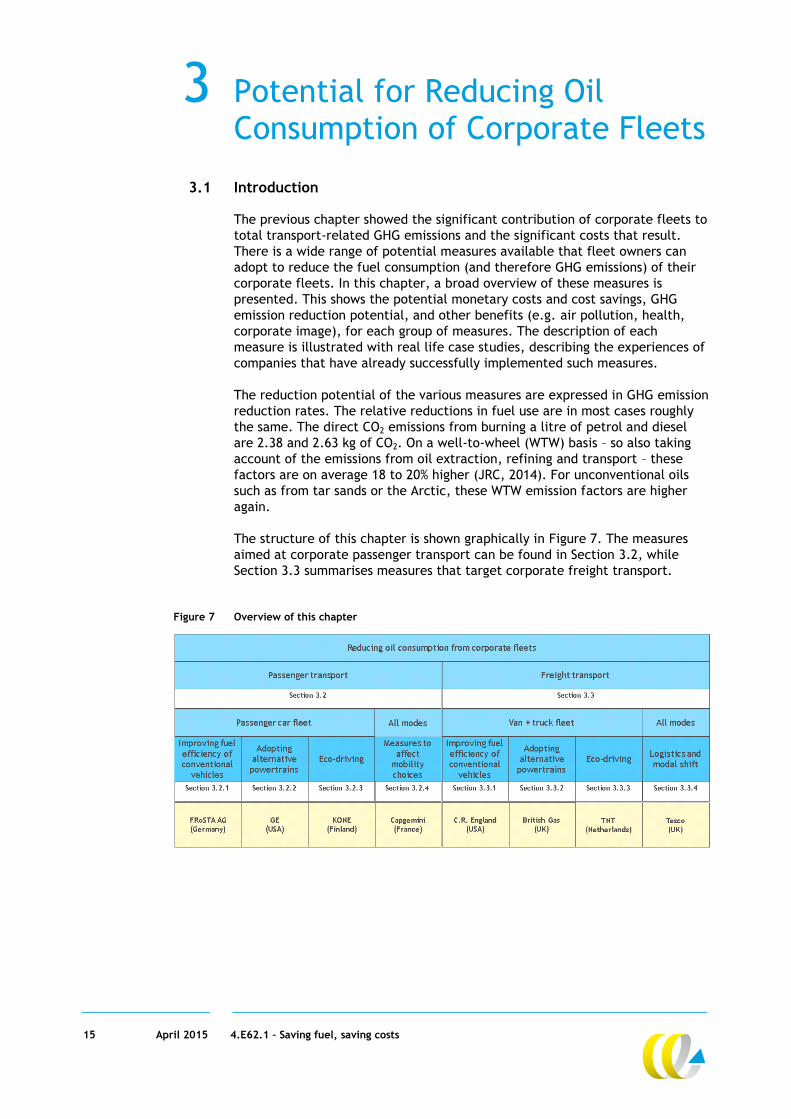
The structure of this chapter is shown graphically in Figure 7. The measures
aimed at corporate passenger transport can be found in Section 3.2, while
Section 3.3 summarises measures that target corporate freight transport.
Figure 7 Overview of this chapter
16 April 2015 4.E62.1 – Saving fuel, saving costs
3.2 Passenger transport
In this section, the main groups of measures for reducing the oil consumption
of the passenger car fleet (Section 3.2.1, 3.2.2 and 3.2.3) and for reducing
emissions from commuter and business travel (Section 3.2.4) are presented.
3.2.1 More fuel efficient conventional cars
Main benefit: Significant reduction of fuel consumption and GHG emissions at very low or
often even negative costs.
Co-benefits: N/a.
Disadvantages: Real world reduction potential is dependent on the driving patterns and style
of employees; it can be experienced as a negative measure by employees.
Lessons learned: To capture the reduction potential, fleet owners will have to implement
measures to incentivise employees to choose more efficient cars.
Description of the measure and reduction potential There is a wide range of technical measures available to reduce emissions
from conventional cars. These include retrofitting existing cars, particularly
choosing low-resistance tyres. For most other fuel saving options, (e.g. on
powertrain or aerodynamics), purchasing policies that favour efficient vehicles
are most effective, as retrofitting is not an option. Many countries, including
the USA, Canada and the EU, have regulated the CO2 emissions of new cars.
This has resulted in significant fuel efficiency improvements and an increasing
supply of (very) fuel efficient vehicles, including hybrid cars . According to
CE Delft & TNO (2012), a reduction potential of 35% can be achieved by
combining the most cost-effective measures, which costs (from a user
perspective) -57 €/tonne CO2, i.e. it actually saves money. For petrol cars,
a reduction of 42% can be achieved when applying cost-effective technologies
at a cost of -5 €/tonne CO23. In many countries, fuel efficient cars get tax
benefits, which further improves the cost/benefit ratio.
There are several measures that fleet owners can take to indirectly stimulate
or enforce fuel saving technologies for their passenger car fleet. Examples are:
Capping the CO2 emissions of new cars by setting a maximum gCO2/km for
employees when they choose a car (this information might be expressed in
an energy label). This measure enforces a particular efficiency on the
fleet.
Downsizing, where fleet owners enforce a maximum vehicle size.
As smaller cars generally consume less fuel than larger ones, this also
improves the efficiency of the fleet.
Providing a financial incentive for choosing a more fuel efficient car.
Some companies provide a monthly bonus to employees choosing a more
efficient car than the company average. This measure stimulates the use
of more efficient cars.
Choosing low resistance tyres for all vehicles in the fleet.
Note that, except for the last one, these measures are designed to encourage
employees to choose more efficient car types. There is increasing evidence
that real world fuel use is much higher than energy labels might suggest and
that the gap is increasing. Nevertheless, in almost every case, a lower
emission factor on the test cycle corresponds to a lower real world fuel
consumption, although the relative difference may be smaller than the energy
label suggests.
3 Note that these estimates are sensitive to technological innovation, fuel prices, annual
mileage, etc. The numbers mentioned are therefore just indicative averages.
17 April 2015 4.E62.1 – Saving fuel, saving costs
To capture the full potential of technical measures in real-world driving
conditions, other measures are recommended such as eco-driving
(Section3.2.3 ) and measures to incentivise employees. An example is to
calculate a fuel budget for each employee (e.g. an acceptable real-world fuel
consumption per km for a particular car). Employees with higher costs than
their budget allows would have to pay (part of) these additional costs, while
employees spending less than their budget could receive (part of) these fuel
savings in cash. This incentivises the employee to not only drive as efficiently
as possible, but also to buy fuel at the cheapest petrol stations.
Monetary costs and savings The net costs of the measures outlined above for enforcing/stimulating a more
fuel efficient car fleet are generally very low or even negative. This is because
more fuel efficient variants of a certain car model or tyre often have no or
relatively low additional cost, which is quickly earned back by fuel savings.
In the case of advanced technology like hybridisation, differences in
investment cost can be somewhat higher, but as the fuel savings are higher
too, the payback time is usually still just a few years. The payback time varies
with annual mileage and fuel and vehicle taxes. If a fleet manager provides
financial incentives, the size of the incentive can be determined in such a way
that the incentive paid is equal or lower than the fuel cost savings realised
(GE Capital, 2013). Hence, this measure has mostly monetary savings, which
result from reduced fuel consumption.
Some of the measures (e.g. setting CO2 limits) may result in reduced
employee benefits, as they are required to use smaller cars or have a more
limited choice. This depends on the strictness of the limits that are set.
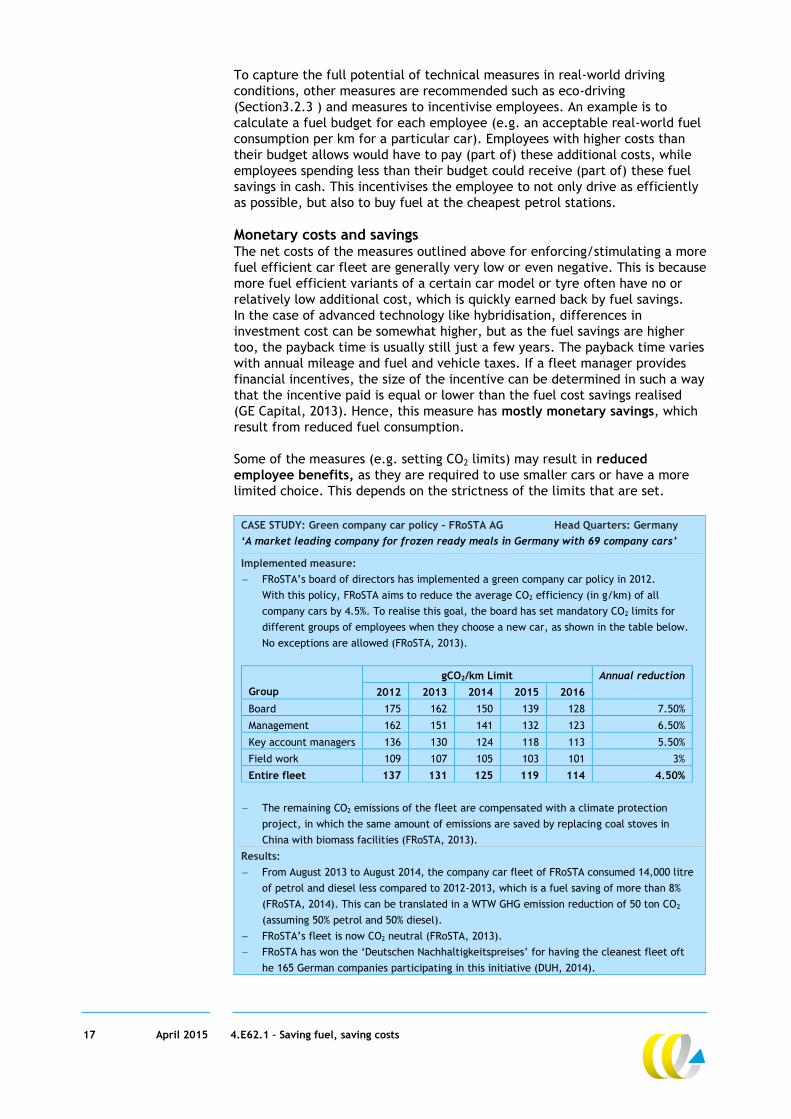
CASE STUDY: Green company car policy – FRoSTA AG Head Quarters: Germany
‘A market leading company for frozen ready meals in Germany with 69 company cars’
Implemented measure:
FRoSTA’s board of directors has implemented a green company car policy in 2012.
With this policy, FRoSTA aims to reduce the average CO2 efficiency (in g/km) of all
company cars by 4.5%. To realise this goal, the board has set mandatory CO2 limits for
different groups of employees when they choose a new car, as shown in the table below.
No exceptions are allowed (FRoSTA, 2013).
GroupGGggggrgrff
ff Group
gCO2/km Limit Annual reduction
2012 2013 2014 2015 2016
Board 175 162 150 139 128 7.50%
Management 162 151 141 132 123 6.50%
Key account managers 136 130 124 118 113 5.50%
Field work 109 107 105 103 101 3%
Entire fleet 137 131 125 119 114 4.50%
The remaining CO2 emissions of the fleet are compensated with a climate protection
project, in which the same amount of emissions are saved by replacing coal stoves in
China with biomass facilities (FRoSTA, 2013).
Results:
From August 2013 to August 2014, the company car fleet of FRoSTA consumed 14,000 litre
of petrol and diesel less compared to 2012-2013, which is a fuel saving of more than 8%
(FRoSTA, 2014). This can be translated in a WTW GHG emission reduction of 50 ton CO2
(assuming 50% petrol and 50% diesel).
FRoSTA’s fleet is now CO2 neutral (FRoSTA, 2013).
FRoSTA has won the ‘Deutschen Nachhaltigkeitspreises’ for having the cleanest fleet oft
he 165 German companies participating in this initiative (DUH, 2014).
18 April 2015 4.E62.1 – Saving fuel, saving costs
Costs
With average fuel costs of 1.47 €/l (incl. taxes) in the EU in 2014 (50%-50% petrol-diesel
EEA, 2014b), the savings of 14,000 litre saved FRoSTA roughly € 20,500.
3.2.2 Adopting alternative powertrains for cars
Main benefit: Significant reduction of oil consumption, GHG emissions and air pollutants.
Co-benefits: Noise reduction, lower maintenance costs, fiscal benefits for employees in some
EU countries.
Disadvantages: Lower operational costs (e.g. lower fuel costs) only partially compensate the
additional investment if no tax incentives/subsidies apply.
Lessons learned: To capture the full potential of the GHG emission reduction of electric
vehicles, power generation should be decarbonised; in order to realise the full reduction
potential of PHEVs, measures maximising the use of the electric drivetrain are highly
recommended.
Description of the measure and reduction potential Electric and semi-electric vehicles have rapidly gained popularity in corporate
fleets as they significantly reduce oil consumption and GHG emissions, and
contribute to the ‘green’ image of corporations. There are two main options:
− Full electric vehicles (FEVs) have zero tailpipe emissions, but also have a
limited driving range (varying from 80 to 480 km depending on the model)
(zerijden.nl, 2015).
− Semi-electric vehicles have both an electric motor and an internal
combustion engine, and therefore can drive both on electricity and on
petrol or diesel and therefore do not have range limitations. The electric
range is significantly smaller (varying from 25 to 80 km, depending on the
model) compared to a FEV (zerijden.nl, 2015). There are two main types
available on the market: Plug-in hybrid Electric Vehicles (PHEVs)4 and
Electric Range Extended Vehicles (E-REVs)5 (CE Delft, 2013). In the
remainder of this section, PHEVs are used to refer to all semi-electric
vehicles that can be charged from the grid6.
The WTW GHG reduction potential of FEVs/PHEVs is highly dependent on the
assumed carbon intensity of the electricity mix. With the EU electricity mix in
2010 (150 g/MJ – AEA, 2012), the WTW GHG emission reduction potential of a
FEV is roughly 50% compared to a diesel car (AEA, 2012; TNO & CE Delft,
2013). The emission savings from PHEVs are also highly dependent on the share
of electricity in the total mileage, which in turn depends on the frequency of
charging the PHEV. The GHG reduction potential varies from about 0 to almost
50%, where 10 or 95% of the mileage is driven in the electric mode,
respectively (TNO & CE Delft, 2013). This reduction potential will increase
with the further decarbonisation of the electricity mix in a particular country.
In order to actually realise a high GHG emission reduction potential with
PHEVs, the fleet owner should take several measures. The two most important
measures are the provision of sufficient charging infrastructure (both at the
office and at employees’ homes), and the creation of (financial) incentives for
good vehicle use (e.g. fees for a high fuel consumption, bonuses for low fuel
4 PHEVs combine an electric motor with an internal combustion engine (ICE). When the battery
is empty, the car switches to a combination of the ICE and the electric motor
(CE Delft, 2013).
5 E-REVs always drive on the electric motor. When the battery is empty, the ICE provides power
to the electric motor (CE Delft, 2013).
6 Semi-electric vehicles differ from regular hybrid vehicles as the battery of the latter cannot
be charged externally.
19 April 2015 4.E62.1 – Saving fuel, saving costs
consumption, internal competitions, etc.) (CE Delft, 2013). If such measures
are not taken, the fleet owner risks that some PHEVs in the fleet will have
higher emissions (and hence fuel costs) than necessary.
Further benefits from electric vehicles include reduced air pollutants. A FEV
reduces WTW NOx emissions by 75% and WTW particulate matter emission from
the engine7 close to 100% (CE Delft et al., 2013). As for CO2 reduction, the
exact percentages here also depend on the local power mix8, but in all cases
local emissions in urban areas are reduced significantly. Electric cars also
create less noise than diesel or petrol cars (CE Delft & ICF, 2011). These
benefits also apply to PHEVs, but only when the vehicle operates in the full
electric mode. Finally, a disadvantage of electric vehicles is the relatively
higher production and disposal GHG emissions (+52% to +60% compared to the
production/disposal of a diesel car). This is related to the high energy use of
battery production. This erodes some (but not all) of the aforementioned
GHG emission savings (TNO & CE Delft, 2013). For a FEV, there is still a 32%
reduction in emissions in comparison to a new diesel vehicle if the entire life
cycle is considered (WTW emissions9 and vehicle production).
Other alternative energy carriers
There are several other alternative powertrains available for passenger cars, most notably
CNG and in the longer term (> 2020) hydrogen. However, the GHG savings of CNG are
relatively limited (15-20%) compared to FEVs/PHEVs and hydrogen (with potential WTW savings
of 40% or more). Hydrogen driven cars (with fuel cells) are still in a pilot phase
CE Delft et al., 2013). Therefore, this section focusses on FEVs and PHEVs.
Monetary costs and savings There are several differences in terms of the monetary costs and savings
between electric and conventional cars. These are summarised below:
Purchase costs of PHEVs and of FEVs in particular are significantly higher
compared to a conventional car. The price of a FEV (€ 31,500-42,500) was
roughly twice as high compared to its diesel alternative, and the price of
PHEVs (€ 26,500-28,000) was 60 to 70% higher (CE Delft & AEA-Ricardo,
2013; AEA, 2012). In more recent estimates the cost differences are in the
same range or slightly lower. However, in many countries tax reductions or
subsidies exist for electric vehicles, resulting in a much smaller difference
in purchase price. Examples include reduced company car taxes in the
Netherlands and vehicle subsidies in Ontario and Quebec. The level of
these tax reductions and subsidies differ significantly between countries.
In various cities electric vehicles are stimulated by local incentives, e.g.
an exemption from parking fees. In addition, part of the remaining price
difference can be earned back with two main categories of savings:
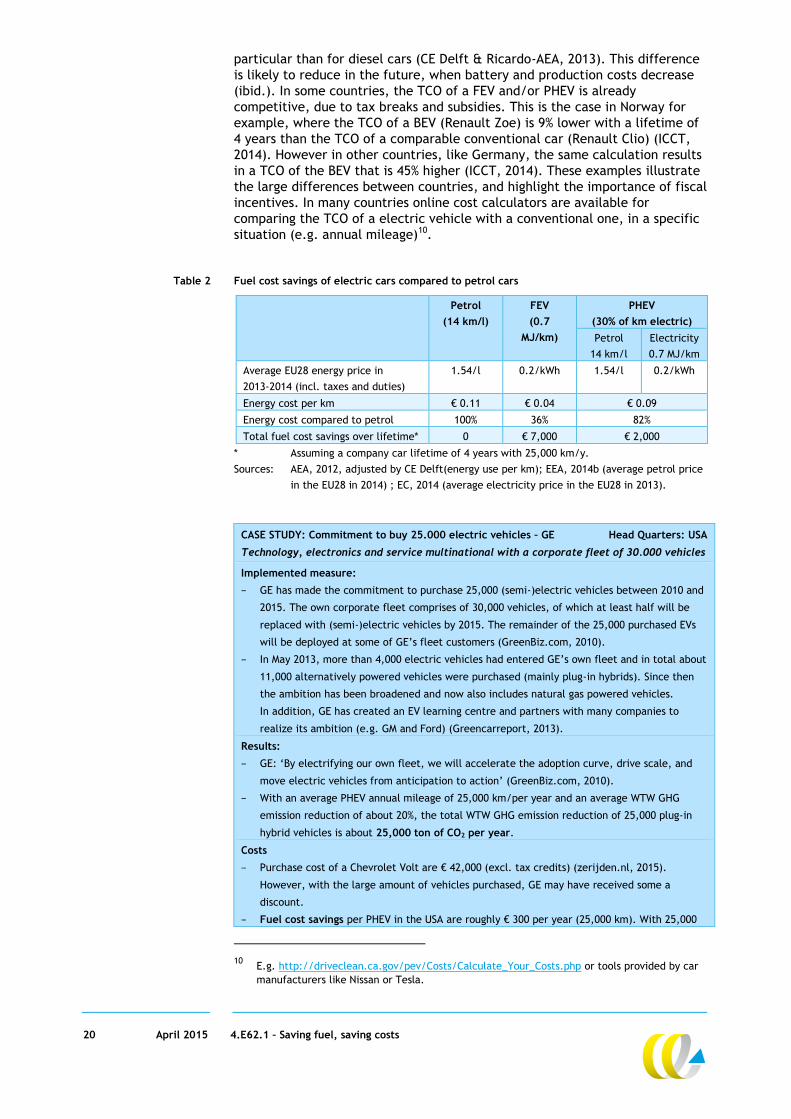
Fuel cost savings of 40-60% as illustrated in Table 2.
Maintenance costs are 34% (FEV) and 17% (PHEV) lower compared to a
diesel car (CE Delft & AEA-Ricardo, 2013).
The extent to which the Total Cost of Ownership (TCO) increases also depends
on the lifetime of the car, residual value, annual mileage, and so on.
However, in most countries, these are higher for both PHEVs and FEVs in
7 The impact on the PM emissions from wear and tear (e.g. brakes and tyres, which are less
harmful than emissions from the engine) are not included in this study of CE Delft et al.,
2013. These emissions are likely to be comparable or could even higher compared to those of
diesel cars.
8 The numbers mentioned are based on the power mix in the Netherlands.
9 Based on the average GHG intensity of electric power mix of the Netherlands.
20 April 2015 4.E62.1 – Saving fuel, saving costs
particular than for diesel cars (CE Delft & Ricardo-AEA, 2013). This difference
is likely to reduce in the future, when battery and production costs decrease
(ibid.). In some countries, the TCO of a FEV and/or PHEV is already
competitive, due to tax breaks and subsidies. This is the case in Norway for
example, where the TCO of a BEV (Renault Zoe) is 9% lower with a lifetime of
4 years than the TCO of a comparable conventional car (Renault Clio) (ICCT,
2014). However in other countries, like Germany, the same calculation results
in a TCO of the BEV that is 45% higher (ICCT, 2014). These examples illustrate
the large differences between countries, and highlight the importance of fiscal
incentives. In many countries online cost calculators are available for
comparing the TCO of a electric vehicle with a conventional one, in a specific
situation (e.g. annual mileage)10.
Table 2 Fuel cost savings of electric cars compared to petrol cars
Petrol
(14 km/l)
FEV
(0.7
MJ/km)
PHEV
(30% of km electric)
Petrol
14 km/l
Electricity
0.7 MJ/km
Average EU28 energy price in
2013-2014 (incl. taxes and duties)
1.54/l 0.2/kWh 1.54/l 0.2/kWh
Energy cost per km € 0.11 € 0.04 € 0.09
Energy cost compared to petrol 100% 36% 82%
Total fuel cost savings over lifetime* 0 € 7,000 € 2,000
* Assuming a company car lifetime of 4 years with 25,000 km/y.
Sources: AEA, 2012, adjusted by CE Delft(energy use per km); EEA, 2014b (average petrol price
in the EU28 in 2014) ; EC, 2014 (average electricity price in the EU28 in 2013).
CASE STUDY: Commitment to buy 25.000 electric vehicles – GE Head Quarters: USA
Technology, electronics and service multinational with a corporate fleet of 30.000 vehicles
Implemented measure:
− GE has made the commitment to purchase 25,000 (semi-)electric vehicles between 2010 and
2015. The own corporate fleet comprises of 30,000 vehicles, of which at least half will be
replaced with (semi-)electric vehicles by 2015. The remainder of the 25,000 purchased EVs
will be deployed at some of GE’s fleet customers (GreenBiz.com, 2010).
− In May 2013, more than 4,000 electric vehicles had entered GE’s own fleet and in total about
11,000 alternatively powered vehicles were purchased (mainly plug-in hybrids). Since then
the ambition has been broadened and now also includes natural gas powered vehicles.
In addition, GE has created an EV learning centre and partners with many companies to
realize its ambition (e.g. GM and Ford) (Greencarreport, 2013).
Results:
− GE: ‘By electrifying our own fleet, we will accelerate the adoption curve, drive scale, and
move electric vehicles from anticipation to action’ (GreenBiz.com, 2010).
− With an average PHEV annual mileage of 25,000 km/per year and an average WTW GHG
emission reduction of about 20%, the total WTW GHG emission reduction of 25,000 plug-in
hybrid vehicles is about 25,000 ton of CO2 per year.
Costs
− Purchase cost of a Chevrolet Volt are € 42,000 (excl. tax credits) (zerijden.nl, 2015).
However, with the large amount of vehicles purchased, GE may have received some a
discount.
− Fuel cost savings per PHEV in the USA are roughly € 300 per year (25,000 km). With 25,000
10 E.g. http://driveclean.ca.gov/pev/Costs/Calculate_Your_Costs.php or tools provided by car
manufacturers like Nissan or Tesla.
21 April 2015 4.E62.1 – Saving fuel, saving costs
vehicles, fuel costs savings are roughly € 7 million per year. With an average lifetime of
4 years for a company car, the fuel cost savings over the lifetime are € 1,200 per vehicle and
€ 30 million for 25,000 PHEVs.
3.2.3 Eco-driving with passenger cars
Main benefit: Reduces fuel consumption/CO2 emissions per kilometre by 5-25%.
Co-benefits: Lower number of accidents and associated costs, lower maintenance costs (e.g.
fewer flat tyres), reduced noise.
Disadvantages: n/a.
Lessons learned: Some sort of monitoring and feedback to employees is crucial to maintain
the positive effects of the driving course.
Description of the measure and reduction potential The use of fuel-efficient driving styles is a very popular measure to reduce the
fuel consumption of corporate fleets. So-called ‘eco-driving’ can involve
several driving techniques that drivers can use to improve the fuel economy of
their car (CE Delft & TNO, 2012; AEA et al., 2010):
ensuring that the engine is used efficiently, for example by using a higher
gear and limiting fast acceleration;
an anticipating driving style, minimising unnecessary braking;
minimising redundant energy use, e.g. by minimising idling and by limiting
unnecessary energy use;
maintaining tyre pressure at specified levels.
Most estimates available in literature indicate that
eco-driving techniques result in an average emission reduction of 10 to 15%
(CE Delft, 2012).
The starting point for encouraging employees to adopt this eco-driving style is
often to implement a driving course, which immediately results in significant
fuel savings of 5 to 25% (CE Delft, 2009). However, it is well known that the
savings reduce rapidly if driving courses are not regularly repeated and/or if
no follow-up measures are taken by the company to motivate employees. In
this case, the reduction potential that is obtained a year or more after the
course has been estimated at 3% (CE Delft, 2009; TNO et al., 2006; McKinsey &
Company, 2009).
With follow-up measures, corporate fleet owners can obtain a higher reduction
potential in the longer term as well. Such follow-up measures are therefore
equally as important (if not more) as the driving course itself. This can entail:
Monitoring the performance of individual drivers and offering feedback,
e.g. in a periodic meeting, on the employees’ pay slips, by sending
monthly reports to employees about their performance, and so on.
Providing immediate feedback to drivers, e.g. by gear shift indicators (GSI)
or with smart phone apps. Kurani et al. (2013) measured a reduction in
fuel consumption of approximately 2.8% due to the use of in-car feedback
devices with a sample of 118 cars. TNO et al. (2006) estimates a slightly
lower reduction potential of 1.5% (without feedback via smart phones at
that time).
Internal eco-driving competitions. Companies increasingly publish the best
performing drivers and/or reward the winning drivers with a prize.
FLEAT performed a pilot with 6 corporate fleets (643 LDVs, including vans).
The participating fleet owners implemented a driving course and some sort of
monitoring and feedback. They measured a yearly reduction of 2.2 to 21.8%
(FLEAT, 2014). One company did not implement the driving course itself, but
22 April 2015 4.E62.1 – Saving fuel, saving costs
only the monitoring and feedback, and actually obtained a relatively large
reduction, which shows the importance of implementing a follow-up system
(ibid.).
Monetary costs and savings The cost of applying the full eco-driving package outlined above include:
The trainer fee for the driving course and loss in man hours when
employees are in training. TNO et al. (2006) estimated the costs of the
driving course at € 50-100, which does not cover the loss in man hours.
FLEAT (2010) does include this loss of man hours, which results in costs of
€ 300 to 1,000 per driver.
Purchase costs of ICT tools to assist drivers: € 15 for gear shift indicators
(TNO et al., 2006); in many cars these are standard.
Setting up a monitoring and feedback system, and the FTEs spend on the
actual execution the system. Costs are highly dependent on the complexity
of the monitoring and feedback, wages, etc.
The monetary fuel savings of eco-driving can be calculated by multiplying the
absolute reduction in fuel consumption (in l/km) with the fuel price and
mileage of the company car. Other monetary benefits are cost reductions from
fewer accidents and lower maintenance, which are often not quantified in
literature but can be significant. Despite the fact that only fuel cost savings
are taken into account, most studies estimate that eco-driving has negative
abatement costs (i.e. higher benefits in terms of fuel savings than costs), with
abatement costs ranging from -€ 315 to € 15 per tonne (CE Delft, 2008, cited
in CE Delft & TNO, 2012; TNO et al., 2006; FLEAT, 2010).
Finally, eco-driving can result in societal benefits, such as reducing traffic
noise and improving road safety (which in turn positively impacts congestion,
reduces medical costs and improves health) (CE Delft, 2012).
Eco-driving itself has no effect on air pollution.
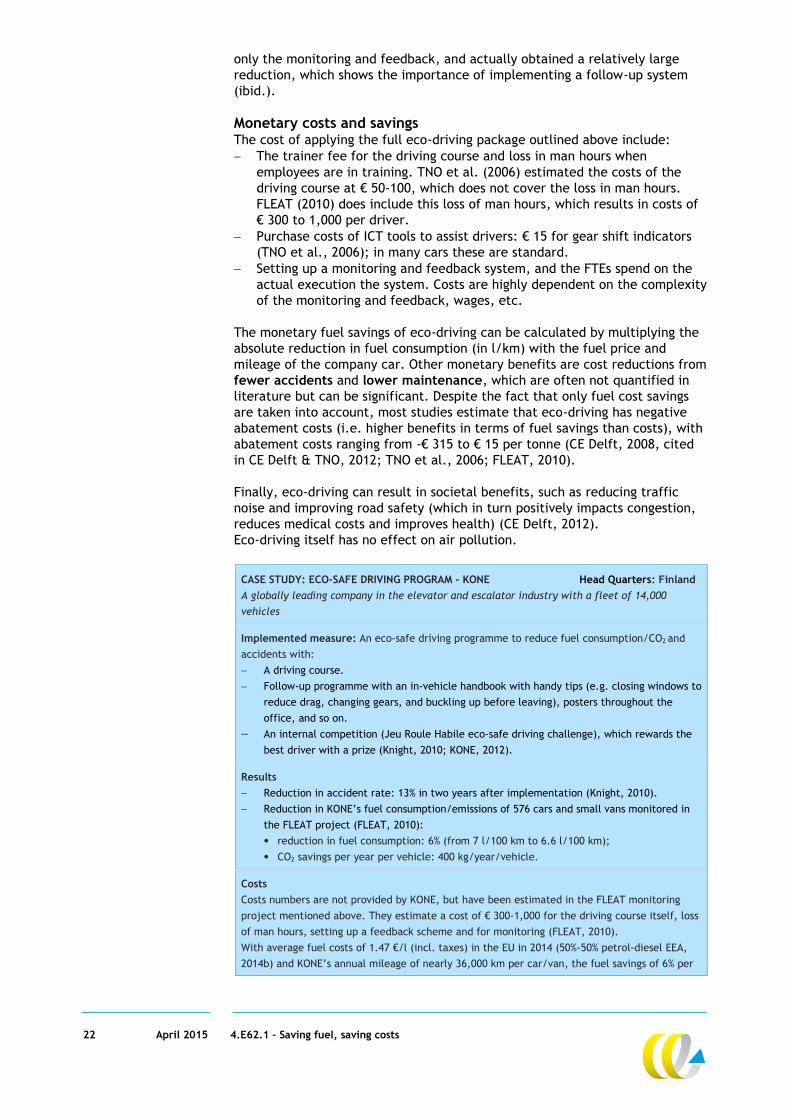
CASE STUDY: ECO-SAFE DRIVING PROGRAM - KONE Head Quarters: Finland
A globally leading company in the elevator and escalator industry with a fleet of 14,000
vehicles
Implemented measure: An eco-safe driving programme to reduce fuel consumption/CO2 and
accidents with:
A driving course.
Follow-up programme with an in-vehicle handbook with handy tips (e.g. closing windows to
reduce drag, changing gears, and buckling up before leaving), posters throughout the
office, and so on.
An internal competition (Jeu Roule Habile eco-safe driving challenge), which rewards the
best driver with a prize (Knight, 2010; KONE, 2012).
Results
Reduction in accident rate: 13% in two years after implementation (Knight, 2010).
Reduction in KONE’s fuel consumption/emissions of 576 cars and small vans monitored in
the FLEAT project (FLEAT, 2010):
• reduction in fuel consumption: 6% (from 7 l/100 km to 6.6 l/100 km);
• CO2 savings per year per vehicle: 400 kg/year/vehicle.
Costs
Costs numbers are not provided by KONE, but have been estimated in the FLEAT monitoring
project mentioned above. They estimate a cost of € 300-1,000 for the driving course itself, loss
of man hours, setting up a feedback scheme and for monitoring (FLEAT, 2010).
With average fuel costs of 1.47 €/l (incl. taxes) in the EU in 2014 (50%-50% petrol-diesel EEA,
2014b) and KONE’s annual mileage of nearly 36,000 km per car/van, the fuel savings of 6% per
23 April 2015 4.E62.1 – Saving fuel, saving costs
year result in:
A payback period of 1.3 years (costs of € 300) to 4.4 years (costs of € 1,000).
Abatement costs of -€ 340 to € 55/tonne CO2 over the average lifetime of a company car
(4 years).
3.2.4 Measures to affect mobility choices
Main benefit: Reduced CO2 emissions due to reduced travel resulting from teleworking and
virtual meetings (one day a week reduces emissions by 14%), and a modal shift from cars to
alternative modes.
Co-benefits: Less air pollutant and noise emissions, lower congestion levels, improved road
safety, increased productivity of employees, and increased (perceived) quality of life of
employees (only teleworking).
Disadvantages: Less human interaction (teleworking and virtual meetings), less control for
managers (teleworking).
Lessons learned: Communication with employees and customers is crucial to successfully
implement teleworking and the application of virtual meetings.
Description of the measure and reduction potential Mobility choices can be affected by a broad range of measures. Two main
categories can be distinguished that have been implemented by front runners:
reducing travel by implementing teleworking and virtual meetings and
stimulating modal shift, e.g. by providing business travel cards.
Over the last decade employees have increasingly been given the opportunity
to telework. In the Netherlands, about 60% of companies currently provide this
opportunity to employees, compared to 25% in 2003 (CBS, 2013).
In Europe, the share of companies providing teleworking opportunities is 60%
on average, ranging from 80% (in Finland) to 37% (in Hungary).
Teleworking can be applied in several ways (Gareis, 2003). The most
traditional type of teleworking is working from home. However, mobile
working during business trips, at customers’ premises and/or at dedicated
telework offices are other options. Successful implementation of teleworking
requires intensive communication between the employer and employees and a
more performance based management style (Peters en Den Dulk, 2003).
Teleworking leads to a net reduction in CO2 emissions. The impact of reduction
in kilometres travelled can however be partly off-set by an increase in energy
use at home (for heating and ICT) and some additional car use for
non-commuting reasons (rebound effect). Most recent evidence suggests that
teleworking will result in a net reduction of CO2 emissions (CE Delft, 2012;
CE Delft et al., 2014). The application of teleworking for one day a week
results in 14% reduction of CO2 emissions on average. This estimate does not
include second order (rebound) effects (e.g. people moving farther away from
work if they have the opportunity to work at home).
Another option to reduce employees’ travel is to adopt virtual meetings
instead of face-to-face meetings, e.g. audio conferencing, video-conferencing
or web-conferencing (CE Delft, 2012). Virtual meetings reduce the amount of
business kilometres travelled, and hence reduce CO2 emissions. A small part of
this reduction will be eroded with the additional energy use from virtual
meeting equipment. However, this effect is small: the net impact of replacing
20% of the face-to-face meetings by virtual meetings is a 17% reduction of
meeting-related travel CO2 emissions (CE Delft et al., 2014).
24 April 2015 4.E62.1 – Saving fuel, saving costs
A modal shift from cars to alternative transport modes in business and
commuting travel can be stimulated by various means such as financial
incentives, facilities or, for example, offering multimodal business travel cards
to employees. Most of these cards can also be used for payment in car parks or
to easily book flex work stations. Business travel cards can particularly affect
car use by company car owners. Currently, these people have no incentive to
make use of other transport modes, as they can use their car for free while
they have to pay for other modes. Evidence from Dutch cases show a reduction
in car kilometres of 7% when this group is provided with a travel card
(CE Delft, 2010).
Monetary costs and savings Teleworking results in various cost savings for companies, in particular lower
travel costs and lower energy costs for heating, air conditioning and electricity
in offices. In some cases it can also lead to cost savings from reducing the
amount of office space and parking places needed. Last but not least,
teleworking can have a positive impact on the productivity of employees
(Ecofys, 2009; Sustel, 2004). This is due to lower absenteeism, longer working
hours (which are not claimed), and higher concentration levels at home.
CE Delft (2008) estimates that these cost savings can amount to more than
€ 2,000 per employee per year. Using virtual meetings has the same types of
benefits as teleworking (CE Delft, 2012), but no cost estimates are available.
Finally, both teleworking and virtual meetings can result in societal benefits
(CE Delft, 2012). The reduction of vehicle kilometres results in a reduction of
traffic noise, air pollution and congestion levels and may improve road safety.
Additionally, teleworking may improve (experienced) quality of life and
employees’ work-life balance (Sustel,2004).
Increased use of public transport or cycling can result in various cost savings
for employers, such as higher productivity of employees (as employees
travelling with public transport have the opportunity to work while travelling)
or, in the case of cycling, better health. Multimodal business travel cards can
reduce administrative costs. The impacts on the mobility costs of measures
aimed at modal shift are very case specific; no quantitative evidence is
available on the overall cost savings that could be realised. Modal shifts can
result in several societal benefits, e.g. less noise and air pollutant emissions,
lower congestion levels and improved road safety.
25 April 2015 4.E62.1 – Saving fuel, saving costs
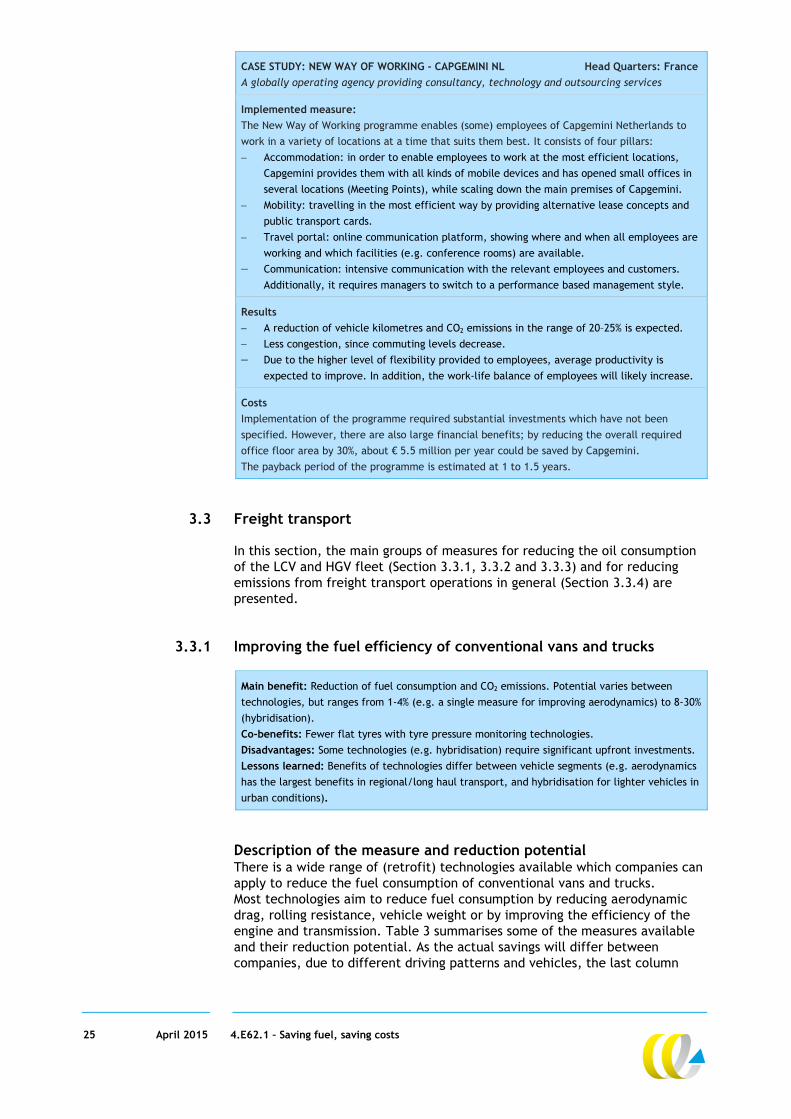
CASE STUDY: NEW WAY OF WORKING - CAPGEMINI NL Head Quarters: France
A globally operating agency providing consultancy, technology and outsourcing services
Implemented measure:
The New Way of Working programme enables (some) employees of Capgemini Netherlands to
work in a variety of locations at a time that suits them best. It consists of four pillars:
Accommodation: in order to enable employees to work at the most efficient locations,
Capgemini provides them with all kinds of mobile devices and has opened small offices in
several locations (Meeting Points), while scaling down the main premises of Capgemini.
Mobility: travelling in the most efficient way by providing alternative lease concepts and
public transport cards.
Travel portal: online communication platform, showing where and when all employees are
working and which facilities (e.g. conference rooms) are available.
Communication: intensive communication with the relevant employees and customers.
Additionally, it requires managers to switch to a performance based management style.
Results
A reduction of vehicle kilometres and CO2 emissions in the range of 20–25% is expected.
Less congestion, since commuting levels decrease.
Due to the higher level of flexibility provided to employees, average productivity is
expected to improve. In addition, the work-life balance of employees will likely increase.
Costs
Implementation of the programme required substantial investments which have not been
specified. However, there are also large financial benefits; by reducing the overall required
office floor area by 30%, about € 5.5 million per year could be saved by Capgemini.
The payback period of the programme is estimated at 1 to 1.5 years.
3.3 Freight transport
In this section, the main groups of measures for reducing the oil consumption
of the LCV and HGV fleet (Section 3.3.1, 3.3.2 and 3.3.3) and for reducing
emissions from freight transport operations in general (Section 3.3.4) are
presented.
3.3.1 Improving the fuel efficiency of conventional vans and trucks
Main benefit: Reduction of fuel consumption and CO2 emissions. Potential varies between
technologies, but ranges from 1-4% (e.g. a single measure for improving aerodynamics) to 8-30%
(hybridisation).
Co-benefits: Fewer flat tyres with tyre pressure monitoring technologies.
Disadvantages: Some technologies (e.g. hybridisation) require significant upfront investments.
Lessons learned: Benefits of technologies differ between vehicle segments (e.g. aerodynamics
has the largest benefits in regional/long haul transport, and hybridisation for lighter vehicles in
urban conditions).
Description of the measure and reduction potential There is a wide range of (retrofit) technologies available which companies can
apply to reduce the fuel consumption of conventional vans and trucks.
Most technologies aim to reduce fuel consumption by reducing aerodynamic
drag, rolling resistance, vehicle weight or by improving the efficiency of the
engine and transmission. Table 3 summarises some of the measures available
and their reduction potential. As the actual savings will differ between
companies, due to different driving patterns and vehicles, the last column
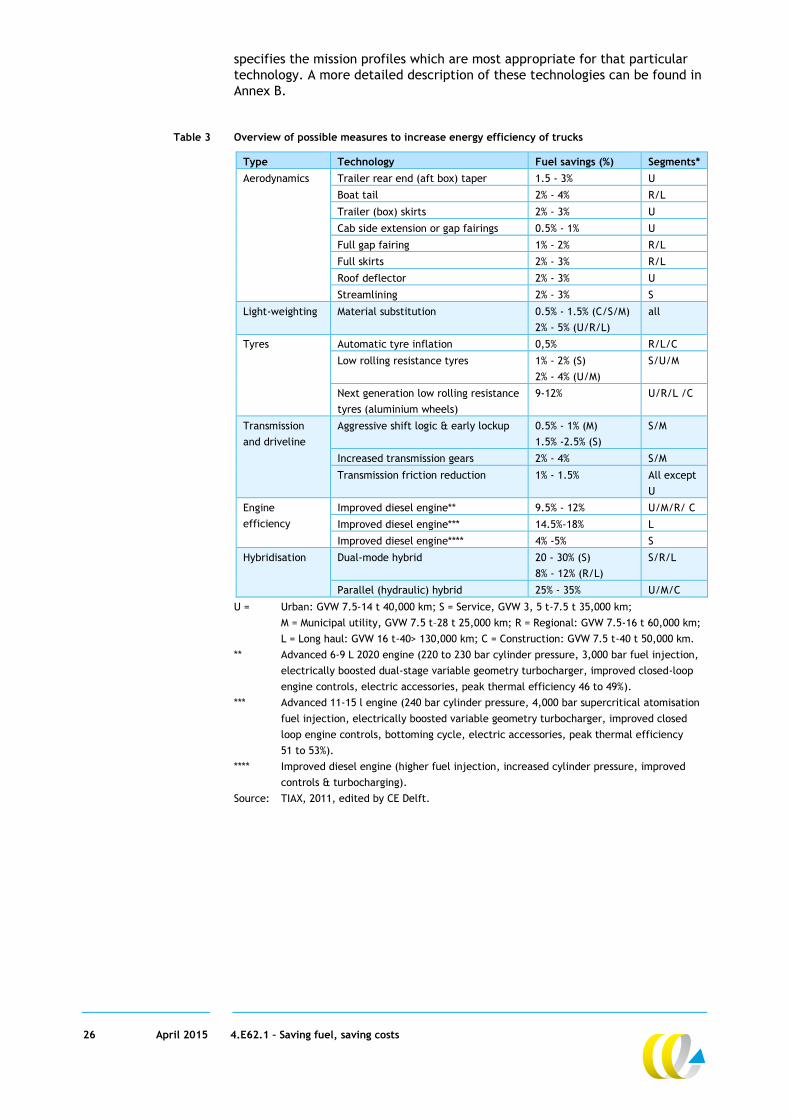
26 April 2015 4.E62.1 – Saving fuel, saving costs
specifies the mission profiles which are most appropriate for that particular
technology. A more detailed description of these technologies can be found in
Annex B.
Table 3 Overview of possible measures to increase energy efficiency of trucks
Type Technology Fuel savings (%) Segments*
Aerodynamics Trailer rear end (aft box) taper 1.5 - 3% U
Boat tail 2% - 4% R/L
Trailer (box) skirts 2% - 3% U
Cab side extension or gap fairings 0.5% - 1% U
Full gap fairing 1% - 2% R/L
Full skirts 2% - 3% R/L
Roof deflector 2% - 3% U
Streamlining 2% - 3% S
Light-weighting Material substitution 0.5% - 1.5% (C/S/M)
2% - 5% (U/R/L)
all
Tyres Automatic tyre inflation 0,5% R/L/C
Low rolling resistance tyres 1% - 2% (S)
2% - 4% (U/M)
S/U/M
Next generation low rolling resistance
tyres (aluminium wheels)
9-12% U/R/L /C
Transmission
and driveline
Aggressive shift logic & early lockup 0.5% - 1% (M)
1.5% -2.5% (S)
S/M
Increased transmission gears 2% - 4% S/M
Transmission friction reduction 1% - 1.5% All except
U
Engine
efficiency
Improved diesel engine** 9.5% - 12% U/M/R/ C
Improved diesel engine*** 14.5%-18% L
Improved diesel engine**** 4% -5% S
Hybridisation Dual-mode hybrid 20 - 30% (S)
8% - 12% (R/L)
S/R/L
Parallel (hydraulic) hybrid 25% - 35% U/M/C
U = Urban: GVW 7.5-14 t 40,000 km; S = Service, GVW 3, 5 t-7.5 t 35,000 km;
M = Municipal utility, GVW 7.5 t–28 t 25,000 km; R = Regional: GVW 7.5-16 t 60,000 km;
L = Long haul: GVW 16 t-40> 130,000 km; C = Construction: GVW 7.5 t-40 t 50,000 km.
** Advanced 6-9 L 2020 engine (220 to 230 bar cylinder pressure, 3,000 bar fuel injection,
electrically boosted dual-stage variable geometry turbocharger, improved closed-loop
engine controls, electric accessories, peak thermal efficiency 46 to 49%).
*** Advanced 11-15 l engine (240 bar cylinder pressure, 4,000 bar supercritical atomisation
fuel injection, electrically boosted variable geometry turbocharger, improved closed
loop engine controls, bottoming cycle, electric accessories, peak thermal efficiency
51 to 53%).
**** Improved diesel engine (higher fuel injection, increased cylinder pressure, improved
controls & turbocharging).
Source: TIAX, 2011, edited by CE Delft.
27 April 2015 4.E62.1 – Saving fuel, saving costs
The total combined reduction potential between 2015 and 2020 if all the
measures shown in Table 3 were adopted is 35% for Service and Regional, 45%
for Urban and Construction, and 40%11 for Long Haul Vehicles (TIAX, 2011). The
technical measures that can be applied to large vans are largely similar to
those that can be applied to service vehicles, and those of small vans to the
measures described for passenger cars (Section 3.2.1). Annex B summarises
these measures for small, medium and large vans.
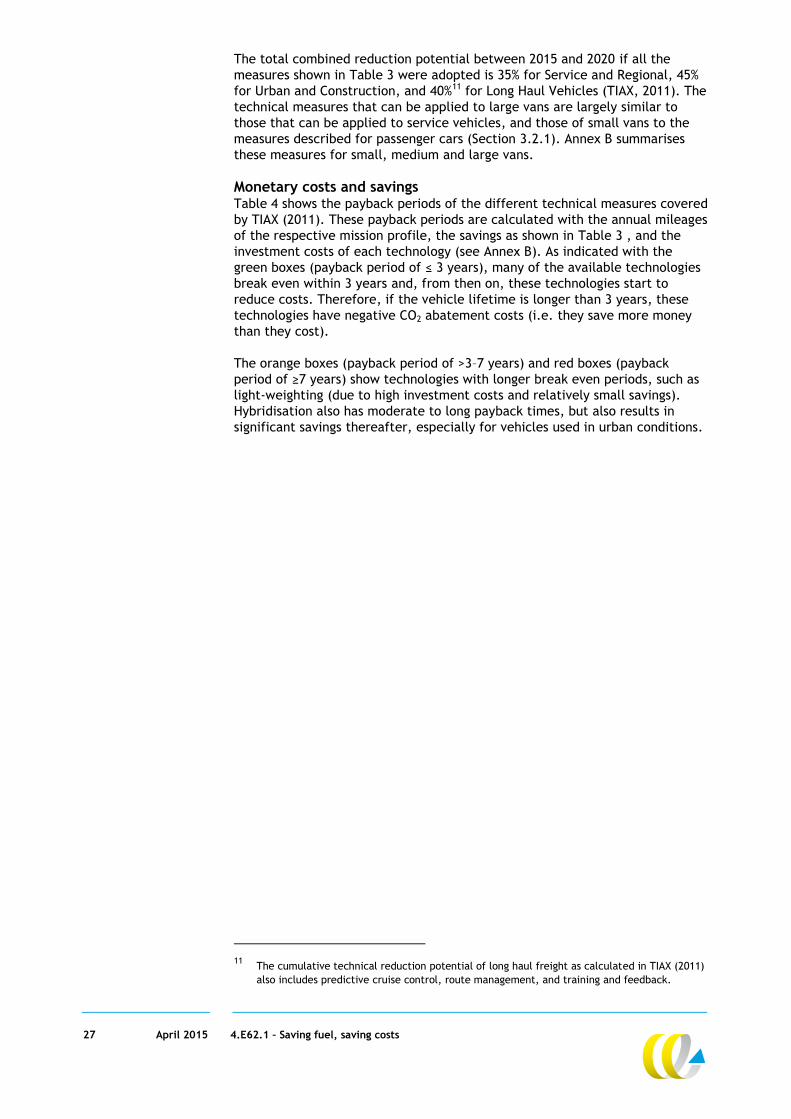
Monetary costs and savings Table 4 shows the payback periods of the different technical measures covered
by TIAX (2011). These payback periods are calculated with the annual mileages
of the respective mission profile, the savings as shown in Table 3 , and the
investment costs of each technology (see Annex B). As indicated with the
green boxes (payback period of ≤ 3 years), many of the available technologies
break even within 3 years and, from then on, these technologies start to
reduce costs. Therefore, if the vehicle lifetime is longer than 3 years, these
technologies have negative CO2 abatement costs (i.e. they save more money
than they cost).
The orange boxes (payback period of >3–7 years) and red boxes (payback
period of ≥7 years) show technologies with longer break even periods, such as
light-weighting (due to high investment costs and relatively small savings).
Hybridisation also has moderate to long payback times, but also results in
significant savings thereafter, especially for vehicles used in urban conditions.
11 The cumulative technical reduction potential of long haul freight as calculated in TIAX (2011)
also includes predictive cruise control, route management, and training and feedback.
28 April 2015 4.E62.1 – Saving fuel, saving costs
Table 4 Payback periods of different technical measures (in years)
Technology Service* Urban* Municipal* Regional* Long
haul*
Construction*
Trailer rear end (aft box) taper 2
Boat tail 2 1
Trailer (box) skirts 3
Cab side extension or gap fairings 5
Full gap fairing 3 1
Full skirts 4 2
Roof deflector 2
Streamlining 0,5
Material substitution 8 8 14 5 2 6
Automatic tyre inflation (truck) 29 11 33
Automatic tyre inflation (trailer) 2 1
Low rolling resistance tyres 0,1 1
Next generation low rolling resistance tyres (aluminium
wheels)
1 0,2 0,1 0,2
Aggressive shift logic & early lockup 0,3 1
Increased transmission gears 3 4
Transmission friction reduction 1 1
Improved diesel engine 4 3 2 2 1 2
Dual-mode hybrid 13 4 5
Parallel (hydraulic) hybrid 5 6 3
* Urban: GVW 7.5-14 t 40,000 km; Service, GVW 3.5 t-7.5 t 35,000 km; Municipal utility,
GVW 7.5 t–28 t 25,000 km; Regional: GVW 7.5-16 t 60,000 km; Long haul: GVW 16 t-40>
130,000 km; Construction: GVW 7.5 t-40 t 50,000 km.
Note: TIAX (2011) has assumed a diesel price of 1.30 €/l in their estimates.
Source: TIAX (2011).
29 April 2015 4.E62.1 – Saving fuel, saving costs
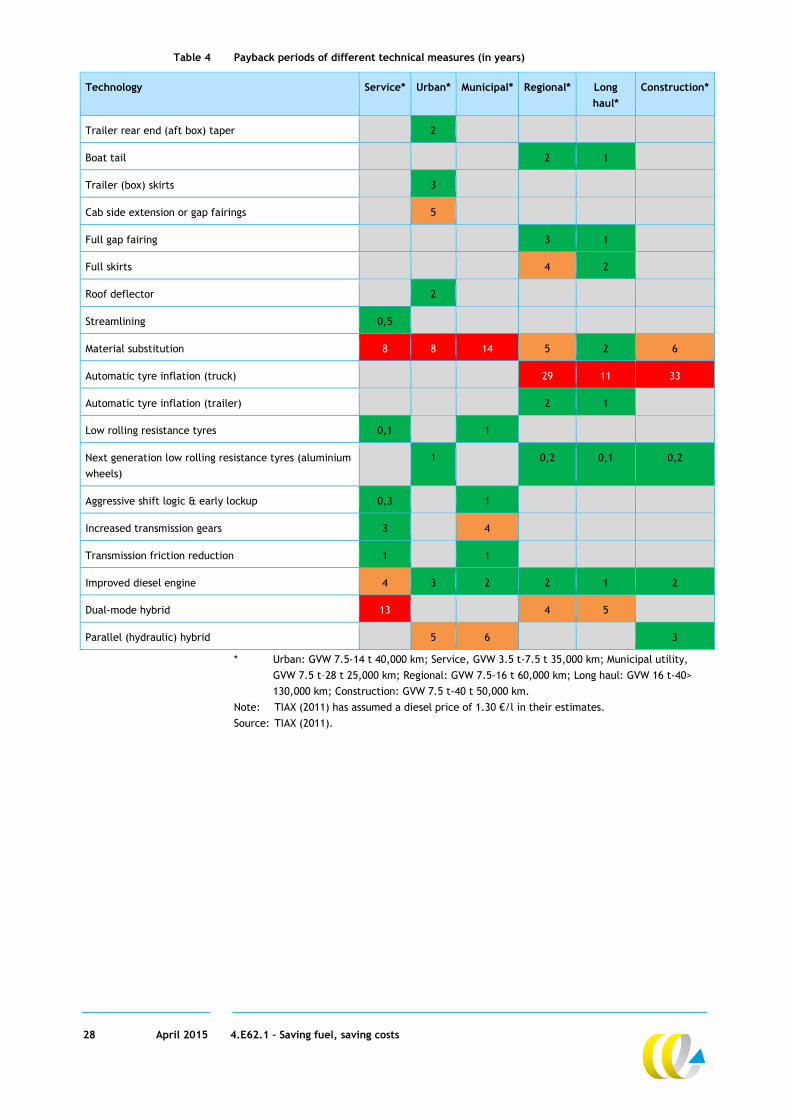
CASE STUDY: Transporting the Smartway - C.R. England Head Quarters: USA
“The largest temperature-controlled carrier in the world with 4,100 tractors and
6,200 trailers”
Implemented measure:
C.R. England participates in the SmartWay Transport Partner programme, a national
public-private partnership in the USA that aims to reduce emissions of freight transport.
The company has implemented many technical measures on all tractors and trailers:
Aerodynamics:
on all tractors: aero kits, aluminium wheels, low rolling resistant tyres and wheel
covers;
on all trailers: side skirts, low rolling resistant tyres with aluminium wheels to reduce
weight.
Idling reduction: vehicles are equipped with economical bunk heaters that prevent idling
for heat during winter, and with ambient sensors and computer programming which
prevent idling if the temperature is between -6 to 20 degrees Fahrenheit.
Speed reduction: New trucks are set to 100 km/h.
Several operational measures: e.g. training, route optimisation, increasing loads, etc.
(C.R. England, 2015).
Results
Due to the implementation of this wide range of technologies on conventional trucks (in
addition to operational measures), C.R England has the highest rank possible (1 on a scale
from 1-5) in the SmartWay database which shippers can use to select carriers (SmartWay,
2015).
Several awards for environmental excellence, e.g. SmartWay Excellence Award (2009,
2012) and the Food Logistics Top Green Supply Chain Partners Award (2013, 2012)
(C.R. England, 2015).
In 2014, the g/mile performance of C.R. England was 1,550, while the average of all
participating companies with refrigerated trucks (2,500+) was 1,686. The efficiency of
C.R. England is therefore 8% better (SmartWay, 2015). When comparing this to the total
average truck fleet of the USA this will be even higher, as the companies participating in
SmartWay are likely to be more focused on GHG emissions compared to non-participants.
In one year, C.R England has saved 0.07 MPG, which saved over 3 million litres of fuel in
total. This was due to rolling out trailer tails, wheel covers, fuel coaching and idle air
technology (PRNewswire, 2014).
Costs
Investment costs are not publicly available. However, the saving of 0.07 MPG that resulted
in a reduced fuel consumption of over 3 million litres of diesel, resulted in a cost saving of
€ 2.5 million (PRNewswire, 2014). A saving of 3 million litres would result in even higher
fuel cost savings with EU28 average prices (1.40/l) of roughly € 4.2 million.
3.3.2 Adopting alternative powertrains for vans and trucks
Main benefit: Significant reduction of oil consumption, GHG emissions and air pollution.
Co-benefits: Noise reduction, lower maintenance costs (EVs).
Disadvantages: Requires large upfront investments, which are only partially earned back with
lower operational costs (e.g. lower energy costs, taxes, etc.).
Lessons learned: To capture the full potential of the GHG emission reduction of electric
vehicles, power generation should be decarbonised.
30 April 2015 4.E62.1 – Saving fuel, saving costs
Description of the measure and reduction potential In addition to buying more fuel-efficient conventional vehicles, fleet owners
can significantly reduce their oil consumption and GHG emissions with the
adoption of alternatively powered vehicles. Currently, there are two main
alternative energy carriers available.
Electricity. Electric vehicles are powered with an electric motor and have a
limited (electric) driving range of about 125 km. Consequently, they provide
an alternative to vans and rigid trucks with low mileages (e.g. city
distribution) (CE Delft & DLR, 2013). Two main electric vehicle types can be
distinguished:
Full electric vehicles (FEVs) have zero tailpipe emissions. The overall WTW
reduction potential is dependent on the energy efficiency and source of
the electricity. According to CE Delft et al. (2013) the reduction is 15%
(electricity of 124 g/MJ) and according to AEA (2012) 45% (electricity of
150 g/MJ) for a rigid truck. AEA (2012) estimates that the WTW reduction
potential of electric vans is larger (58%). In the future, increasing shares of
renewable electricity will further enhance the emission reduction potential
(CE Delft & TNO, 2014).
Semi-electric vehicles (Plug-in Hybrid electric vehicles - PHEVs12/Electric
Range Extended Vehicles – E-REVs13), which can drive both on electricity
and diesel. In the remainder of this section they are referred to as PHEVs.
The reduction potential is highly dependent on the share of ‘electric
kilometres’ (CE Delft & TNO, 2014). If the PHEV is mainly operated in the
electric mode, GHG emission reductions are comparable to those of FEVs.
With lower shares, the reduction potential decreases.
Natural Gas. Gas powered vehicles, which can either use CNG or LNG (and, in
case of dual fuel vehicles, diesel as well). While CNG is mostly appropriate for
vans and rigid trucks, LNG can provide an alternative for heavier vehicles
(CE Delft et al., 2013).
CNG powered vans and rigid trucks reduce WTW GHG emissions by
-12% (van) to -20% (truck) compared to diesel;
LNG powered rigid trucks reduce WTW GHG emissions by -17% to -27% and
tractor-trailers by -11% to -19% compared to the diesel variants
(CE Delft et al., 2013).
Hydrogen - Fuel Cell Electric Vehicles (FCEVs)
In the medium to long term (>2020), hydrogen is likely to provide an additional alternative to
diesel, especially for long-distance freight transport. Hydrogen has a much higher driving range
compared to battery electric vehicles. For shorter distances, where BEVs can also be applied,
FCEVs are generally less efficient, as hydrogen must be electrochemically transformed into
electricity before it powers the electric motor (CE Delft & DLR, 2013). However, as these
vehicles are currently in the pilot phase, they are not covered in this section.
12 PHEVs combine an electric motor with an internal combustion engine (ICE). When the battery
is empty, the car switches to a combination of the ICE and the electric motor (CE Delft,
2013).
13 E-REVs always drive on the electric motor. When the battery is empty, the ICE provides power
to the electric motor (CE Delft, 2013).
31 April 2015 4.E62.1 – Saving fuel, saving costs
In addition to GHG emission reduction potential, air pollutants (NOx and PM)
can also be reduced with the adoption of alternative powertrains. With a
reduction of approximately 90%, the benefits are largest for the adoption of
FEVs. For gas powered trucks (both CNG and LNG), emissions of NOx and PM
are roughly comparable to a EURO VI Diesel truck. For vans, CNG results in a
50% reduction of NOx emissions compared to EURO 6, and comparable PM
emissions (CE Delft et al., 2013).
Finally, FEVs (and to a lesser extent PHEVs and CNG or LNG powered vehicles)
reduce noise pollution, especially in urban areas (CE Delft & ICF, 2011)
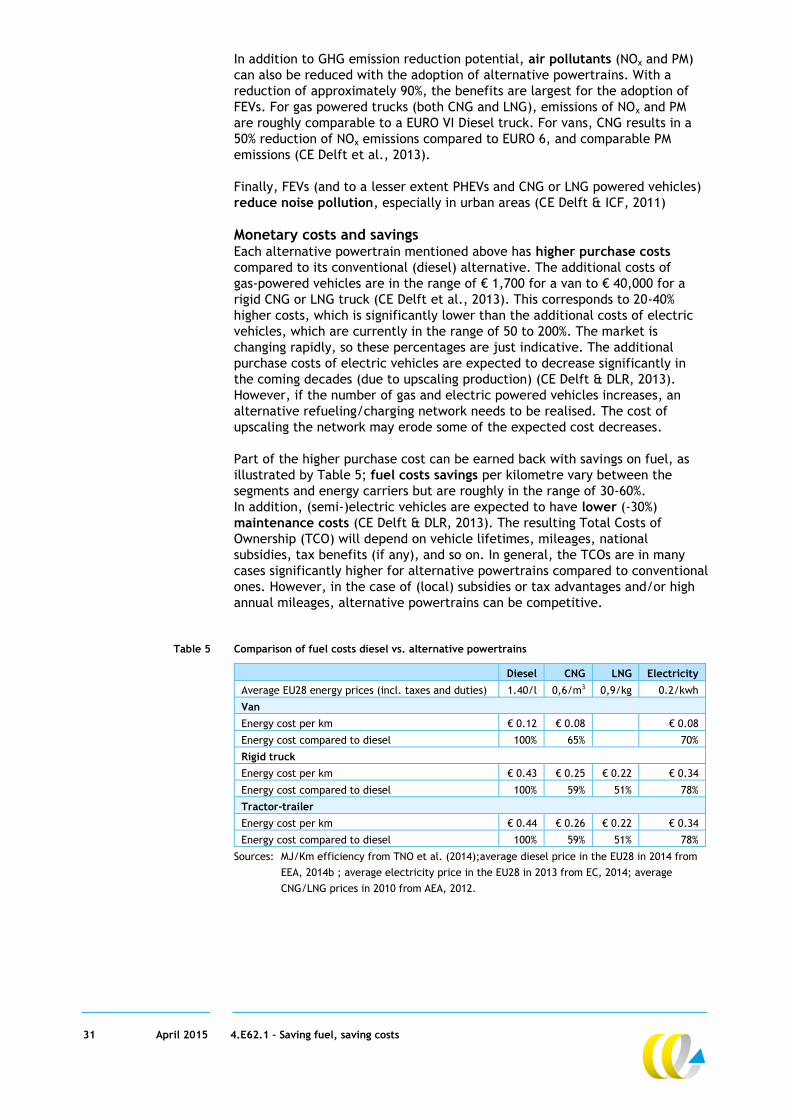
Monetary costs and savings Each alternative powertrain mentioned above has higher purchase costs
compared to its conventional (diesel) alternative. The additional costs of
gas-powered vehicles are in the range of € 1,700 for a van to € 40,000 for a
rigid CNG or LNG truck (CE Delft et al., 2013). This corresponds to 20-40%
higher costs, which is significantly lower than the additional costs of electric
vehicles, which are currently in the range of 50 to 200%. The market is
changing rapidly, so these percentages are just indicative. The additional
purchase costs of electric vehicles are expected to decrease significantly in
the coming decades (due to upscaling production) (CE Delft & DLR, 2013).
However, if the number of gas and electric powered vehicles increases, an
alternative refueling/charging network needs to be realised. The cost of
upscaling the network may erode some of the expected cost decreases.
Part of the higher purchase cost can be earned back with savings on fuel, as
illustrated by Table 5; fuel costs savings per kilometre vary between the
segments and energy carriers but are roughly in the range of 30-60%.
In addition, (semi-)electric vehicles are expected to have lower (-30%)
maintenance costs (CE Delft & DLR, 2013). The resulting Total Costs of
Ownership (TCO) will depend on vehicle lifetimes, mileages, national
subsidies, tax benefits (if any), and so on. In general, the TCOs are in many
cases significantly higher for alternative powertrains compared to conventional
ones. However, in the case of (local) subsidies or tax advantages and/or high
annual mileages, alternative powertrains can be competitive.
Table 5 Comparison of fuel costs diesel vs. alternative powertrains
Diesel CNG LNG Electricity
Average EU28 energy prices (incl. taxes and duties) 1.40/l 0,6/m3 0,9/kg 0.2/kwh
Van
Energy cost per km € 0.12 € 0.08 € 0.08
Energy cost compared to diesel 100% 65% 70%
Rigid truck
Energy cost per km € 0.43 € 0.25 € 0.22 € 0.34
Energy cost compared to diesel 100% 59% 51% 78%
Tractor-trailer
Energy cost per km € 0.44 € 0.26 € 0.22 € 0.34
Energy cost compared to diesel 100% 59% 51% 78%
Sources: MJ/Km efficiency from TNO et al. (2014);average diesel price in the EU28 in 2014 from
EEA, 2014b ; average electricity price in the EU28 in 2013 from EC, 2014; average
CNG/LNG prices in 2010 from AEA, 2012.
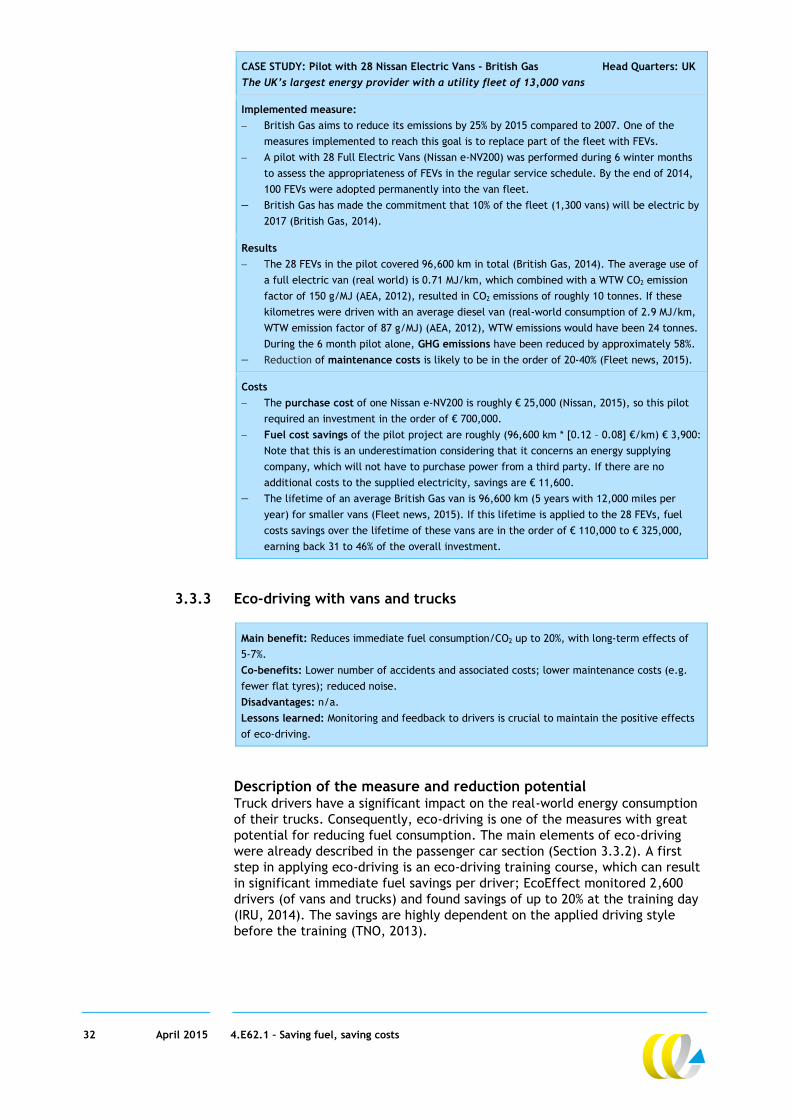
32 April 2015 4.E62.1 – Saving fuel, saving costs
CASE STUDY: Pilot with 28 Nissan Electric Vans - British Gas Head Quarters: UK
The UK’s largest energy provider with a utility fleet of 13,000 vans
Implemented measure:
British Gas aims to reduce its emissions by 25% by 2015 compared to 2007. One of the
measures implemented to reach this goal is to replace part of the fleet with FEVs.
A pilot with 28 Full Electric Vans (Nissan e-NV200) was performed during 6 winter months
to assess the appropriateness of FEVs in the regular service schedule. By the end of 2014,
100 FEVs were adopted permanently into the van fleet.
British Gas has made the commitment that 10% of the fleet (1,300 vans) will be electric by
2017 (British Gas, 2014).
Results
The 28 FEVs in the pilot covered 96,600 km in total (British Gas, 2014). The average use of
a full electric van (real world) is 0.71 MJ/km, which combined with a WTW CO2 emission
factor of 150 g/MJ (AEA, 2012), resulted in CO2 emissions of roughly 10 tonnes. If these
kilometres were driven with an average diesel van (real-world consumption of 2.9 MJ/km,
WTW emission factor of 87 g/MJ) (AEA, 2012), WTW emissions would have been 24 tonnes.
During the 6 month pilot alone, GHG emissions have been reduced by approximately 58%.
Reduction of maintenance costs is likely to be in the order of 20-40% (Fleet news, 2015).
Costs
The purchase cost of one Nissan e-NV200 is roughly € 25,000 (Nissan, 2015), so this pilot
required an investment in the order of € 700,000.
Fuel cost savings of the pilot project are roughly (96,600 km * [0.12 – 0.08] €/km) € 3,900:
Note that this is an underestimation considering that it concerns an energy supplying
company, which will not have to purchase power from a third party. If there are no
additional costs to the supplied electricity, savings are € 11,600.
The lifetime of an average British Gas van is 96,600 km (5 years with 12,000 miles per
year) for smaller vans (Fleet news, 2015). If this lifetime is applied to the 28 FEVs, fuel
costs savings over the lifetime of these vans are in the order of € 110,000 to € 325,000,
earning back 31 to 46% of the overall investment.
3.3.3 Eco-driving with vans and trucks
Main benefit: Reduces immediate fuel consumption/CO2 up to 20%, with long-term effects of
5-7%.
Co-benefits: Lower number of accidents and associated costs; lower maintenance costs (e.g.
fewer flat tyres); reduced noise.
Disadvantages: n/a.
Lessons learned: Monitoring and feedback to drivers is crucial to maintain the positive effects
of eco-driving.
Description of the measure and reduction potential Truck drivers have a significant impact on the real-world energy consumption
of their trucks. Consequently, eco-driving is one of the measures with great
potential for reducing fuel consumption. The main elements of eco-driving
were already described in the passenger car section (Section 3.3.2). A first
step in applying eco-driving is an eco-driving training course, which can result
in significant immediate fuel savings per driver; EcoEffect monitored 2,600
drivers (of vans and trucks) and found savings of up to 20% at the training day
(IRU, 2014). The savings are highly dependent on the applied driving style
before the training (TNO, 2013).
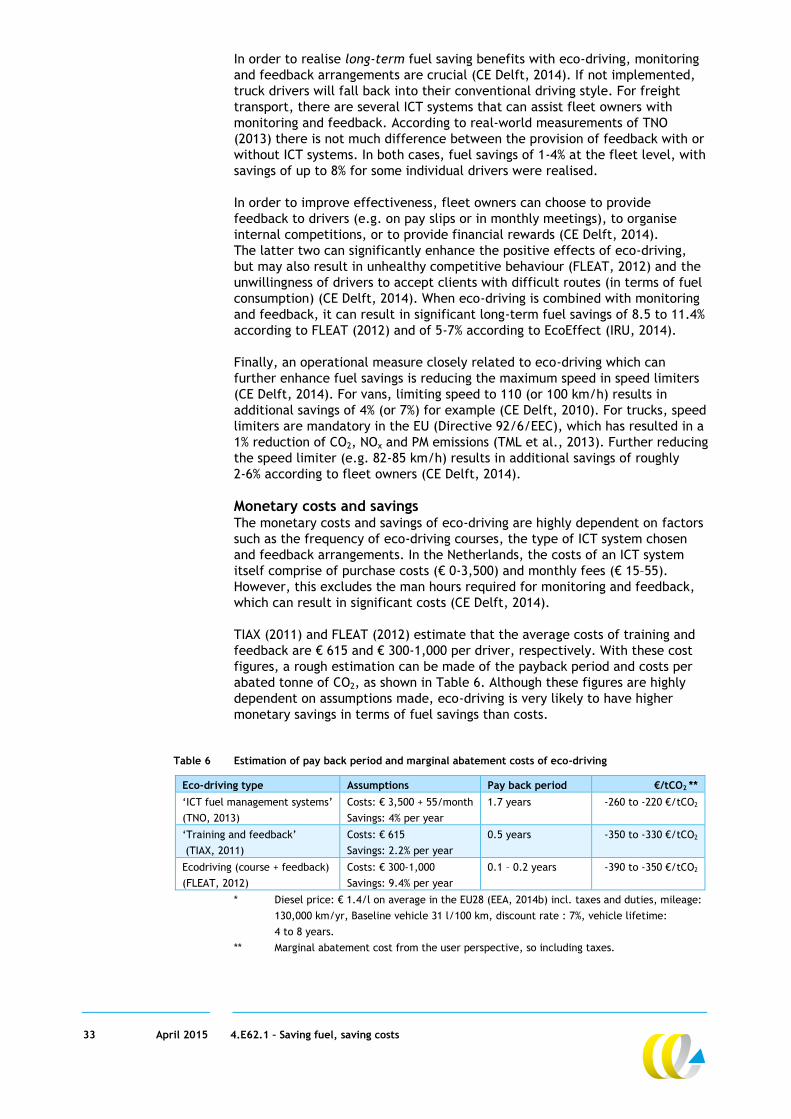
33 April 2015 4.E62.1 – Saving fuel, saving costs
In order to realise long-term fuel saving benefits with eco-driving, monitoring
and feedback arrangements are crucial (CE Delft, 2014). If not implemented,
truck drivers will fall back into their conventional driving style. For freight
transport, there are several ICT systems that can assist fleet owners with
monitoring and feedback. According to real-world measurements of TNO
(2013) there is not much difference between the provision of feedback with or
without ICT systems. In both cases, fuel savings of 1-4% at the fleet level, with
savings of up to 8% for some individual drivers were realised.
In order to improve effectiveness, fleet owners can choose to provide
feedback to drivers (e.g. on pay slips or in monthly meetings), to organise
internal competitions, or to provide financial rewards (CE Delft, 2014).
The latter two can significantly enhance the positive effects of eco-driving,
but may also result in unhealthy competitive behaviour (FLEAT, 2012) and the
unwillingness of drivers to accept clients with difficult routes (in terms of fuel
consumption) (CE Delft, 2014). When eco-driving is combined with monitoring
and feedback, it can result in significant long-term fuel savings of 8.5 to 11.4%
according to FLEAT (2012) and of 5-7% according to EcoEffect (IRU, 2014).
Finally, an operational measure closely related to eco-driving which can
further enhance fuel savings is reducing the maximum speed in speed limiters
(CE Delft, 2014). For vans, limiting speed to 110 (or 100 km/h) results in
additional savings of 4% (or 7%) for example (CE Delft, 2010). For trucks, speed
limiters are mandatory in the EU (Directive 92/6/EEC), which has resulted in a
1% reduction of CO2, NOx and PM emissions (TML et al., 2013). Further reducing
the speed limiter (e.g. 82-85 km/h) results in additional savings of roughly
2-6% according to fleet owners (CE Delft, 2014).
Monetary costs and savings The monetary costs and savings of eco-driving are highly dependent on factors
such as the frequency of eco-driving courses, the type of ICT system chosen
and feedback arrangements. In the Netherlands, the costs of an ICT system
itself comprise of purchase costs (€ 0-3,500) and monthly fees (€ 15–55).
However, this excludes the man hours required for monitoring and feedback,
which can result in significant costs (CE Delft, 2014).
TIAX (2011) and FLEAT (2012) estimate that the average costs of training and
feedback are € 615 and € 300-1,000 per driver, respectively. With these cost
figures, a rough estimation can be made of the payback period and costs per
abated tonne of CO2, as shown in Table 6. Although these figures are highly
dependent on assumptions made, eco-driving is very likely to have higher
monetary savings in terms of fuel savings than costs.
Table 6 Estimation of pay back period and marginal abatement costs of eco-driving
Eco-driving type Assumptions Pay back period €/tCO2 **
‘ICT fuel management systems’
(TNO, 2013)
Costs: € 3,500 + 55/month
Savings: 4% per year
1.7 years -260 to -220 €/tCO2
‘Training and feedback’
(TIAX, 2011)
Costs: € 615
Savings: 2.2% per year
0.5 years -350 to -330 €/tCO2
Ecodriving (course + feedback)
(FLEAT, 2012)
Costs: € 300-1,000
Savings: 9.4% per year
0.1 – 0.2 years -390 to -350 €/tCO2
* Diesel price: € 1.4/l on average in the EU28 (EEA, 2014b) incl. taxes and duties, mileage:
130,000 km/yr, Baseline vehicle 31 l/100 km, discount rate : 7%, vehicle lifetime:
4 to 8 years.
** Marginal abatement cost from the user perspective, so including taxes.
34 April 2015 4.E62.1 – Saving fuel, saving costs
Limiting speeds will also have mostly negative abatement costs, as there are
no additional costs; according to TML et al., (2013) speed limiters have had no
significant impact on travel time. In addition to fuel savings, this measure
reduces administrative costs of traffic fines and accidents (CE Delft, 2014)
and reduces maintenance costs (less wear and tear of tyres and engines)
(TML et al., 2013). Furthermore, eco-driving also reduces maintenance costs
due to fewer flat tyres and it reduces traffic noise (CE Delft, 2012).
CASE STUDY: Drive Me Challenge - TNT Express Head Quarters: Netherlands
One of the world’s largest express delivery companies with over 25,000 road vehicles
Implemented measure:
Eco-driving training (aiming at 100% of the drivers trained) with monitoring and feedback.
Drive Me Challenge – an annual international competition in which delivery van drivers of
TNT and sub-contractors compete with each other on fuel efficiency, safety and speed,
while delivering and picking up packages on a circuit. The winners of the national Drive Me
Challenges compete in the final international Drive Me Challenge (TNT express, 2013).
Results
Eco-driving training is applied throughout the entire company. TNT Skypak (Greece)
participated in a public monitoring scheme (FLEAT) with 140 delivery vans. The results
showed short-term benefits of 16% fuel saving during the training day (FLEAT, 2010b).
The long-term benefits (incl. monitoring and feedback) were 5%. These results indicated
the importance of motivating employees to continue with eco-driving. According to TNT
their internal competition “has proved a popular way to support our fuel efficiency
efforts” (TNT Express, 2013). In addition to the reduced fuel consumption, eco-driving
resulted in lower stress levels of drivers, due to – surprisingly for them – the average
speed increasing rather than decreasing (FLEAT, 2010b).
Costs
No cost figures reported publicly. However, with the FLEAT monitoring of the eco-driving
course and feedback of TNT Skypak (Greece) a rough estimation can be made. With average
diesel costs of 1.4 €/l (incl. taxes) in 2014 (EEA, 2014b) and an annual mileage of nearly 34,000
km per van, the fuel savings of 5.2% per year result in:
A payback period of 0.8 year (costs of € 300) to 2.6 years (costs of € 1,000).
Abatement costs of -€ 158 to -€ 55/tonne CO2 with an average lifetime of 8 years.
3.3.4 Logistics and modal shift
Main benefit: Reduces fuel consumption/CO2 emissions per tonne-kilometre or TEU-kilometre.
Increased logistical efficiency can reduce CO2 emission by 4-20%.
Co-benefits: Lower transport costs, lower air polluting emissions and noise emissions, less
congestion.
Possible disadvantages: Possibly longer delivery times and extra trans-shipment costs (for
modal shift). For modal shift to inland waterways, air polluting emissions might increase.
Lessons learned: Collaboration among shippers and among carriers, and between carriers and
shippers, increases the possibilities for modal shift and increased logistical efficiency.
Description of the measure and reduction potential For transport and shipping companies, optimisation of transport logistics is an
important mechanism to minimise transport costs, and also to reduce CO2 and
other transport emissions. Ultimately, efficient transport logistics minimises
the fuel consumption and CO2 emissions per delivered good (expressed in, for
example, CO2 emissions per tonne-kilometre).
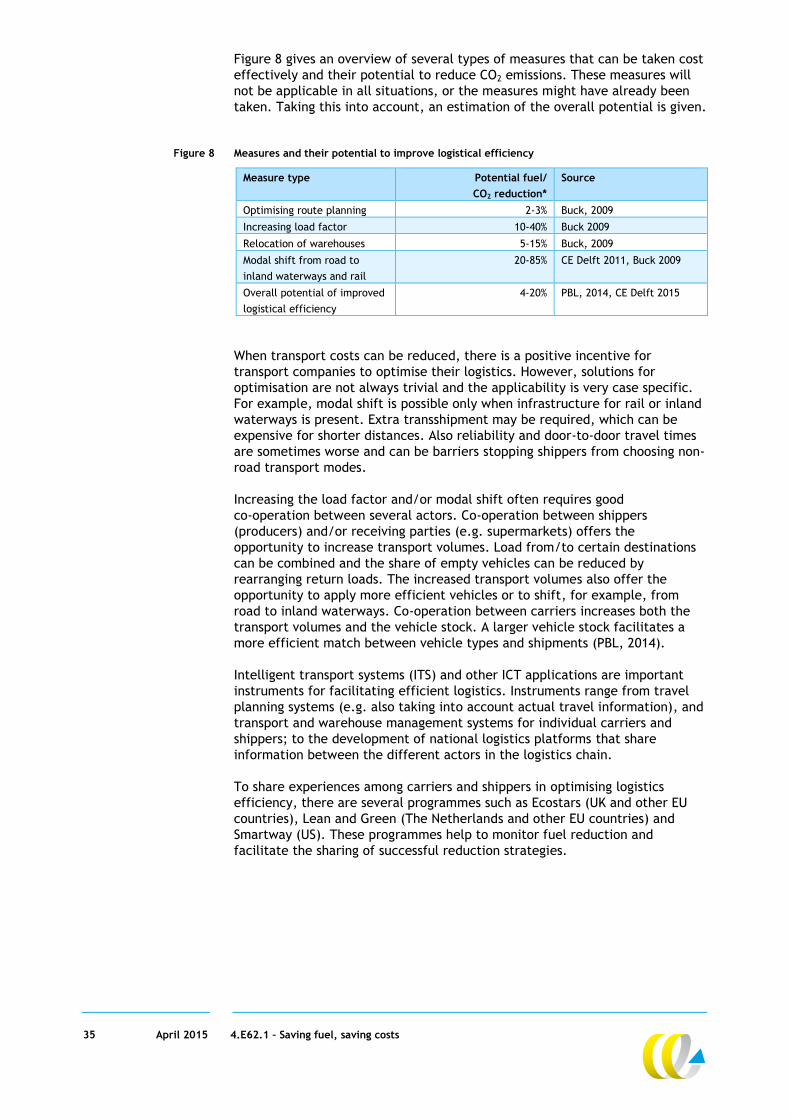
35 April 2015 4.E62.1 – Saving fuel, saving costs
Figure 8 gives an overview of several types of measures that can be taken cost
effectively and their potential to reduce CO2 emissions. These measures will
not be applicable in all situations, or the measures might have already been
taken. Taking this into account, an estimation of the overall potential is given.
Figure 8 Measures and their potential to improve logistical efficiency
Measure type Potential fuel/
CO2 reduction*
Source
Optimising route planning 2-3% Buck, 2009
Increasing load factor 10-40% Buck 2009
Relocation of warehouses 5-15% Buck, 2009
Modal shift from road to
inland waterways and rail
20-85% CE Delft 2011, Buck 2009
Overall potential of improved
logistical efficiency
4-20% PBL, 2014, CE Delft 2015
When transport costs can be reduced, there is a positive incentive for
transport companies to optimise their logistics. However, solutions for
optimisation are not always trivial and the applicability is very case specific.
For example, modal shift is possible only when infrastructure for rail or inland
waterways is present. Extra transshipment may be required, which can be
expensive for shorter distances. Also reliability and door-to-door travel times
are sometimes worse and can be barriers stopping shippers from choosing non-
road transport modes.
Increasing the load factor and/or modal shift often requires good
co-operation between several actors. Co-operation between shippers
(producers) and/or receiving parties (e.g. supermarkets) offers the
opportunity to increase transport volumes. Load from/to certain destinations
can be combined and the share of empty vehicles can be reduced by
rearranging return loads. The increased transport volumes also offer the
opportunity to apply more efficient vehicles or to shift, for example, from
road to inland waterways. Co-operation between carriers increases both the
transport volumes and the vehicle stock. A larger vehicle stock facilitates a
more efficient match between vehicle types and shipments (PBL, 2014).
Intelligent transport systems (ITS) and other ICT applications are important
instruments for facilitating efficient logistics. Instruments range from travel
planning systems (e.g. also taking into account actual travel information), and
transport and warehouse management systems for individual carriers and
shippers; to the development of national logistics platforms that share
information between the different actors in the logistics chain.
To share experiences among carriers and shippers in optimising logistics
efficiency, there are several programmes such as Ecostars (UK and other EU
countries), Lean and Green (The Netherlands and other EU countries) and
Smartway (US). These programmes help to monitor fuel reduction and
facilitate the sharing of successful reduction strategies.
36 April 2015 4.E62.1 – Saving fuel, saving costs
Monetary costs and savings The cost of improving logistics efficiency varies, depending on the measures
taken. Costs to be taken into account are the costs of ICT applications,
warehousing changes, man-hours for monitoring and planning. In practice it
appears that investments are often paid back within a reasonable time by
savings due to a reduction in kilometres, net transport hours and/or fuel
consumption per transported unit (CE Delft, 2015).
In general, modal shift from road to inland waterways and rail can save costs
of up to 80% per tonne-kilometre (NEA, 2004). Costs of modal shift to be taken
into account are extra costs for transhipment and (non monetary) costs of
possibly longer transport times.
In programmes such as Lean and Green (http://lean-green.nl/en-GB/),
companies voluntarily develop basis action plans for reducing their
CO2 emissions by 20% in 5 years. Many examples within this programme show
that improving logistics efficiency often also results in net monetary benefits.
Finally, improved logistics efficiency results in societal benefits, such as a
reduced traffic noise, improved road safety, reduced congestion and reduced
air pollution. For modal shift to inland waterways, air pollution emissions can
also be higher, depending on the ship size and the motor type.
CASE STUDY: Tesco Sets the Pace on Low Carbon and Efficiency Head Quarter: UK
Tesco is one of the world’s leading international retailers and is involved in a wide variety of
different markets and sectors. It employs over 450,000 people around the globe.
With approximately 1,800 stores across the UK, distribution is a key area of operation for the
company (Tesco, 2010)
Implemented measure: Reduction of CO2 emissions per case (itemised box of goods) delivered
by improving logistics efficiency and modal shift. Specific measures taken by Tesco (Tesco,
2010):
Establishing a baseline from which improvements could be monitored.
Tesco updated its warehouse management system, and combined this with its transport
planning system to maximise both cage and trailer fill.
Tesco has replaced a significant number of road movements with train and barge journeys.
Increasing the use of double deck trailers (capacity of 75 cages compared to 45 in
conventional trailers).
Reduction of the level of empty running by undertaking 55,432 supplier backloads in 2007.
After delivering to a store, the vehicle calls into a Tesco supplier on the journey back to
collect a load bound for the distribution centre.
Relocation and reduction of the amount of distribution centres.
Results (Tesco ,2010)
Saving 3.2 million road miles and 2.4 ktonne CO2 per year (54%) due to modal shift from
road to rail on the link Daventry – Grangemouth. Saving 0.26 million road miles and 330
tonnes CO2 per year (ca. 90%) due to modal shift from truck to barge for wine transport.
Saving 0.76 million road miles and 948 tonnes CO2 per year (20-30% reduction on these
trips) by increasing the use of double deck trailers.
Reduction of 2.6 million road miles and 3.59 ktonnes CO2 due to backloading.
Saving 2.2 million road miles and 2.9 ktonnes CO2 due to the new warehousing strategy.
Overall reduction of the carbon footprint by 10% in 2007.
The reduction in truck mileage also reduces congestion, noise and air pollution on these
tracks.

37 April 2015 4.E62.1 – Saving fuel, saving costs
Costs
Costs numbers are not provided in the Tesco case description. However on a yearly basis
3.8 million litres of fuel have been saved. With 2014 EU average diesel costs of 1,4 €/l (incl.
taxes and duties) this results in savings of € 5.3 million per year. It’s unknown how the fuel
savings relate to investment costs.

38 April 2015 4.E62.1 – Saving fuel, saving costs
39 April 2015 4.E62.1 – Saving fuel, saving costs
References
ACEA, 2012
Statistics: Vehicles in use
Available at:http://www.acea.be/statistics/tag/category/vehicles-in-use
Accessed on December 24th 2014
AEA, 2012
A review of the efficiency and cost assumptions for road transport vehicles to
2050
Didcot : AEA Technology plc, 2012
Available at:http://www.ricardo-aea.com/cms/assets/Documents-for-Insight-
pages/8.-Review-of-cost-and-efficiency.pdf
Accessed on December 24th 2014
AEA et al., 2010
Ian Skinner (AEA Associate); Huib van Essen (CE Delft); Richard Smokers (TNO);
Nikolas Hill (AEA)
EU Transport GHG: Routes to 2050? : Towards the decarbonisation of the EU’s
transport sector by 2050
London : AEA, 2010
British Gas, 2014
Press release: British Gas orders 100 Nissan e-NV200 vans following successful
pilot
Available at:
https://britishgas.presscentre.com/Press-releases/British-Gas-orders-100-
Nissan-e-NV200-vans-following-successful-pilot-440.aspx
Buck et al., 2009
INTERACTION, Reducing energy use in freight transportation, Final report
Buck Consultants International et al.
Available at:
http://ec.europa.eu/energy/intelligent/projects/sites/iee-
projects/files/projects/documents/interaction_final_report.pdf
CE & Ricardo-AEA, 2013
An Economic assessment of low carbon vehicles
Cambridge ; London : Cambridge Economics (CE) ; Ricardo-AEA, 2013
Available at:
http://europeanclimate.org/documents/Cars-Economic-assessment-vehicles-
FINAL.pdf
CBS, 2013
Telewerken kan bij zes op de tien bedrijven
Webmagazine CBS
Available at: http://www.cbs.nl/nl-NL/menu/themas/bedrijven/
publicaties/artikelen/archief/2013/2013-3881-wm.htm
Accessed on January 13th 2015
CBS Statline, 2014
Verkeersprestaties personenauto’s; eigendom, brandstof, gewicht, leeftijd
Available at: http://statline.cbs.nl/Statweb/publication/
?DM=SLNL&PA=71107ned&D1=0&D2=a&D3=a&D4=0&D5=0&D6=(l-11)-l&VW=T
Accessed on December 24th 2014
40 April 2015 4.E62.1 – Saving fuel, saving costs
CE Delft et al., 2014
CE Delft, TNO en ECN
CO2-reductie door gedragsverandering in de verkeerssector
CE Delft : Delft, 2014
CE Delft, 2011
STREAM International Freight 2011 : Comparison of various transport modes on
a EU scale with the STREAM database
CE Delft ,Delft 2011
CE Delft, 2015
For ODMH (Environmental protection agency Middle-Holland) CE Delft has
performed several transport scans for shipper and carrier companies to
investigate the potential of more efficient logistics. A 3% reduction in fuel
consumption seems to be feasable in all performed scans.
CE Delft, 2013
Opladen voor de toekomst van plug in hybrides en elektrische auto met
rangeextender : Een verkenning naar mogelijkheden voor vergroten van het
elektrische gebruik
Delft : CE Delft, 2013
CE Delft, 2012
Behavioural Climate Change Mitigation Options. Report Domain Transport
Delft : CE Delft, 2012
CE Delft, 2010a
Effecten van Mobility Mixx voor de BV Nederland
Delft : CE Delft, 2010
CE Delft, 2010b
Speed limiters for vans in Europe : Environmental and safety impacts
Delft : CE Delft, 2010
Available at: http://www.ce.nl/publicatie/speed_limiters_
for_vans_in_europe/1046
CE Delft, 2009
EU Transport GHG: Routes to 2050? Operational options and improved vehicle
utilisation for all passenger transport mode
available at:http://www.eutransportghg2050.eu/cms/assets/Operational-
options-for-passenger-transport.pdf
Accessed on December 26th 2014
CE Delft, 2008
Kosten en effecten van beleidsmaatregelen
Delft : CE Delft, 2008
CE Delft, 2007
State-of-the-Art CO2 en Mobiliteit : Input voor gezamenlijk adviesproject van
Raad V&W, VROM-raad en AER
Delft : CE Delft, 2007
CE Delft & Carbon Matters, 2013
Economic and environmental effects of the FQD on crude oil production from
tar sands
Delft : CE Delft, 2013
41 April 2015 4.E62.1 – Saving fuel, saving costs
CE Delft & DLR, 2013
Zero emission trucks : An overview of the state-of-the-art technologies and
their potential
Delft : CE Delft, 2013
Available at: http://www.ce.nl/publicatie/zero_emission_trucks/1400
CE Delft et al., 2013
Natural gas in transport study : An assessment of different routes
Delft : CE Delft, 2013
CE Delft & ICF, 2011
Impacts of Electric Vehicles
Deliverable 5 : Impact analysis for market uptake scenarios and policy
implications
Delft : CE Delft, 2011
CE Delft & TNO, 2012
EU Transport GHG: Routes to 2050 II. Final Report Appendix 8: Cost
effectiveness of policies and options for decarbonising transport.
Delft : CE Delft ; TNO, 2012
C.R. England, 2015
Webpage C.R. England, the Company and sustainability
Available at: http://www.crengland.com/our-company/coporate-
responsibility/sustainability
DfT, 2014
Vehicle Licensing Statistics:2013 : Statistical Release 10 April 2014
S.l. : UK Department for Transport (DfT), 2014
https://www.gov.uk/government/uploads/system/uploads/attachment_data/
file/302409/vls-2013.pdf
DUH, 2014
DUH-Dienstwagen-Check: Sieben deutsche Unternehmen fahren beim
Klimaschutz mit gutem Beispiel voran, Pressemitteilung 23-07-2014
S.l. : Deutsche Umwelthilfe (DUT), 2014
Available at: http://www.duh.de/pressemitteilung.html?
&tx_ttnews[tt_news]=3358
Ecofys, 2009
From workplace to anyplace : assessing the opportunities to reduce
greenhouse gas emissions with virtual meetings and telecommuting
S.l. : S.n., 2009
EEA, 2014
EEA greenhouse gas - data viewer
Available at: http://www.eea.europa.eu/data-and-maps/data/data-
viewers/greenhouse-gases-viewer
Accessed on December 22nd 2014
EEA, 2014b
Fuel prices (TERM 021)
Available at: http://www.eea.europa.eu/data-and-maps/indicators/fuel-
prices-and-taxes/assessment-3
Accessed on December 24th 2014
42 April 2015 4.E62.1 – Saving fuel, saving costs
Element energy, 2012
Ultra Low Emission Vans study, final report
S.l. Element Energy Limited, 2012
Available at: https://www.gov.uk/government/uploads/system/
uploads/attachment_data/file/4550/ultra-low-emission-vans-study.pdf
Environment Canada, 2014
National Inventory Report: Greenhouse Gas Sources and Sinks in Canada 1990-
2012
Gatineau, (Ca) : Environment Canada, 2014
EPA, 2014
Inventory of U.S. Greenhouse Gas Emissions and Sinks: 1990-2012
Washington DC : US Environmental Protection Agency (EPA), 2014
EC, 2014
EU energy in figures: Statistical pocketbook 2014
Luxembourg : European Commission (EC), 2014
European Union, 2010
Copenhagen Economics
Taxation papers : Company car taxation. Luxembourg : European Union, 2010
FLEAT, 2010a
Intelligent Energy EuropeD5.3 Report on monitoring pilot actions, final report.
Available at: http://fleat-eu.org/downloads/wp5_d53_finalreport.pdf
FLEAT, 2010b
Intelligent Energy Europe : Brochure FLEAT
Available at: http://www.energyagency.at/fileadmin/dam/pdf/
publikationen/berichteBroschueren/Endbericht-FLEAT.pdf
FLEET News, 2015
Fleets in focus : British Gas
Avialable at: http://www.fleetnews.co.uk/fleet-management/fleets-in-focus-
british-gas/46126/
FRoSTA, 2013
FRoSTA’s Firmenwagen fahren jetzt CO2 neutral : Blog
Available at: http://www.frostablog.de/nachhaltigkeit/firmenwagen-jetzt-
co2-neutral
FRoSTA, 2014
Mehr als 14.000 Liter Benzin und Diesel eingespart! : Blog
Available at: http://www.frostablog.de/nachhaltigkeit/mehr-als-14-000-litre-
benzin-und-diesel-eingespart
Gareis, 2003
Karsten Gareis
The intensity of telework in 2002 in the EU, Switzerland and the USA
Paper presented at the International Congress Sustainability in the New
Economy : Designing a New Work Space, Spain, 2003
GE Capital, 2013a
Key Solutions CO2 Assessment : CO2 emissions from company cars across
Europe’s major markets between 2008 and 2012
London : GE Capital, 2013
43 April 2015 4.E62.1 – Saving fuel, saving costs
GE Capital, 2013b
How to Drive down company car and van CO2 emissions
London : GE Capital, 2013b
Greenbiz.com, 2010
GE To Boost Electric Vehicle Fleet By 25K : Press release November 11, 2010
Available at: http://www.greenbiz.com/news/2010/11/11/ge-boost-electric-
vehicle-fleet-25k?utm_source=GreenBuzz&utm_campaign=c5e4489fdd-
GreenBuzz-2010-11-15&utm_medium=email#ixzz15MosUCYr
Green Car Report, 2013
GE Adds Natural-Gas Vehicles To Its Electric And Alternate-Fuels Fleet. Press
release Jan. 9, 2013
http://www.greencarreports.com/news/1081557_ge-adds-natural-gas-
vehicles-to-its-electric-and-alternate-fuels-fleet
ICCT, 2014
Driving electrification : A global comparison of fiscal incentive policy for
electric vehicles
S.l. : The International Transport Council (ICCT), 2014
IEA, 2014a
CO2 emissions from fuel combustion : Highlights, 2014 edition
Paris : International Energy Agency (IEA), 2014
IEA, 2014b
2014 Key world energy statistics
Paris : International Energy Agency (IEA), 2014
ING, 2011
R. Luman (ING)
Wegtransport uitgedaagd tot hogere vrachtprijs; vrachtvolumes herstellen,
strategische keuzes noodzakelijk. Sectorvisie wegtransport
S.l. : ING (BE), 2011
IPCC, 2014a
Summary for Policymakers
In: Climate Change 2013 : The Physical Science Basis. Contribution of Working
Group I to the Fifth Assessment Report of the Intergovernmental Panel on
Climate Change
Cambridge (UK) : Cambridge University Press, 2014
IPCC, 2014b
Summary for Policymakers. In: Climate Change 2014: Mitigation of Climate
Change. Contribution of Working Group III to the Fifth Assessment Report of
the Intergovernmental Panel on Climate Change
Cambridge (UK) : Cambridge University Press,2014
IRU, 2014
IRU Observations on the European Commission Strategy for Reducing Heavy
Vehicles Fuel Consumption and CO2 Emissions
Brussels : International Road Transport Union (IRU), 2014
Available at: http://www.iru.org/cms-filesystem-
action/policies/sustainable_development/br3080finalen.pdf
44 April 2015 4.E62.1 – Saving fuel, saving costs
IvDM, 2015
Factsheet elektrische vrachtwagen
Available at: http://www.truckvandetoekomst.nl/thema/brandstoffen-
aandrijving/elektrische-aandrijving/
JRC and IET, 2014
Well-to-Wheels analysis of future automotive fuels and powertrains in the
European context
Luxembourg : Publications Office of the European Union, 2014
Knight, 2010
Cheryl Knight
Kone Takes Fleet Eco-efficiency to a higher Level; Cover story
Available at: http://www.fleetfinancials.com/fc_resources/ff0310kone.pdf
Accessed on December 26th 2014
KONE, 2012
More cars, less emissions: eco-safe driving brings results
Available at: http://www.kone.com/en/responsibility-2012/cases/case-more-
cars-less-emissions-eco-safe-driving-brings-results/
Accessed on December 26th 2014
Kurani et al., 2013
Kenneth S. Kurani, Tai Stillwater, Matt Jones, Nicolette Caperello Ecodrive I-
80: A large sample fuel economy feedback field test
Davis : University of California, (Institute of Transportation Studis (ITS). 2013
McKinsey & Company, 2009
Roads towards a low carbon future: reducing CO2 emissions from passenger
vehicles in the global road transportation system
New York : McKinsey & Company, 2009
MB Tech, 2010
Trend Monitor 2010. Light Commercial Vehicle of the Future : Optimising Total
Cost of Ownership considering future drive concepts and business conditions
Sindelfingen : MB Tech, 2010
NEA, 2004
Factorkosten van het goederenvervoer: een analyse van de ontwikkeling in de
tijd
Rijswijk : NEA, 2004
Nissan, 2015
Webpage : De geheel nieuwe volledig elektrische, geheel flexibele e-NV200
Available at: http://www.nissan.nl/NL/nl/vehicle/electric-vehicles/e-
nv200.html
Peters and Den Dulk, 2003
Pascal Peters and Laura Den Dulk
Cross cultural differences in managers’ support for home-based telework :
a theoretical elaboration
In : International Journal of Cross Cultural Management, Vol. 3, No.3 (2003); p.
329-346
45 April 2015 4.E62.1 – Saving fuel, saving costs
PBL, 2014
Options for the road freight sector to meet long term climate targets
The Hague : Netherlands Environmental Assessment Agency (PBL), 2014
available at: http://abstracts.aetransport.org/paper/index/id/4224/confid/19
Accessed on January 13nd 2014
PRNewswire, 2014
C.R. England Receives US EPA 2014 SmartWay Excellence Award, news release,
oct. 8, 2014
Available at: http://www.prnewswire.com/news-releases/cr-england-
receives-us-epa-2014-smartway-excellence-award-278487821.html
RAI, 2013
Analyse autoverkopen 2012
Amsterdam : RAI Vereniging, 2012
SmartWay, 2015
Webpage: SmartWay Carrier Performance Rankings
Available at: http://www.epa.gov/smartway/forpartners/performance.htm
SULTAN, 2012
EU Transport GHG : Routes to 2050. Illustrative Scenarios tool
Available at: http://www.eutransportghg2050.eu/cms/illustrative-scenarios-
tool/
Accessed on December 22nd 2014
Sustel, 2004
Is teleworking sustainable? : An analysis of its economic, environmental and
social impacts
S.l. : Sustainable Teleworking (Sustel), EU project, 2004
T&E 2011
Webpage: What we do – Cars and CO2 – Background
available at: http://www.transportenvironment.org/what-we-do/cars-and-
co2/background
Accessed December 24th 2014
Tesco 2010
Freight Best Practice series (FBP 1094) : Tesco Sets the Pace on Low Carbon
and Efficiency
Colchester : Low Carbon Freight Dividend, 2010
Tiax, 2011
European Union Greenhouse Gas Reduction Potential for Heavy-Duty Vehicles
Cupertino : TIAX, 2011
TML et al., 2013
Ex-post evaluation of Directive 92/6/EEC on the installation and use of speed
limitation devices for certain categories of motor vehicles in the Community,
as amended by Directive 2002/85/EC
Brussels : European Commission (EC), 2013
TNO et al., 2014
Verzamelde kennisnotities t.b.v. de visie duurzame brandstoffenmix
Delft ; Petten : TNO, CE Delft and ECN, 2014
46 April 2015 4.E62.1 – Saving fuel, saving costs
TNO, 2013
Praktijkverbruik van zakelijke personenauto’s en plug-in voertuigen
Delft : TNO, 2013
TNO et al., 2011
Support for the revision of Regulation (EC) No 443/2009 on CO2 emissions from
cars, final report
Delft : TNO, 2011
TNO et al., 2006
Review and analysis of the reduction potential and costs of technological and
other measures to reduce CO2 emissions from Delft, passenger cars
TNO : Delft, 2006
TNT, 2013
TNT Express holds international eco-driving competition in the Netherlands,
press release October 11, 2013
Available at: http://www.tnt.com/corporate/en/data/press/2013/10/tnt-
express-holds-international-eco-driving-competition-in-the-netherlands.html
TREMOVE, 2012
TREMOVE economic transport and emissions model, version 3.3.2
Leuven : Transport & Mobility Leuven (TML), 2012
Verbruiken.nl, 2014
Webpage : Nissan e-NV200 verbruik en prijs
Available at: http://www.verbruiken.nl/elektrische-autos/nissan-e-nv200
zerijden.nl, 2015
Webpage: Overzicht Elektrische auto’s
Available at: http://zerijden.nl/elektrische-autos/
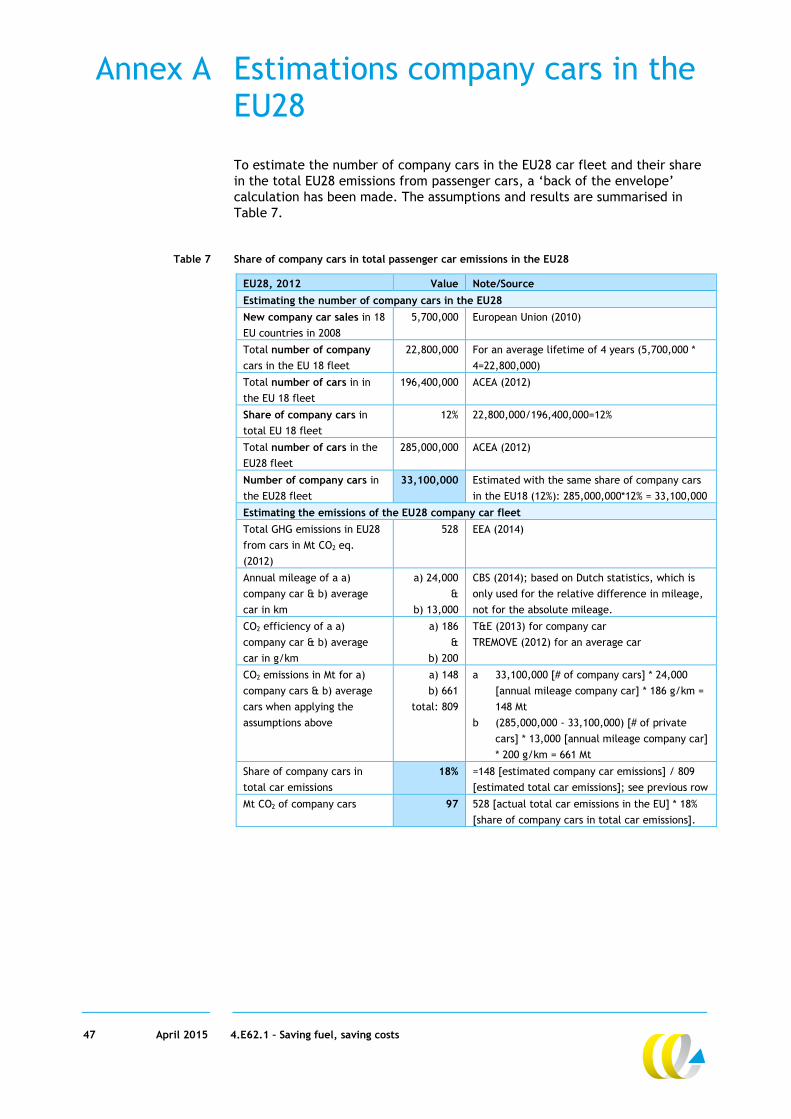
47 April 2015 4.E62.1 – Saving fuel, saving costs
Annex A Estimations company cars in the EU28
To estimate the number of company cars in the EU28 car fleet and their share
in the total EU28 emissions from passenger cars, a ‘back of the envelope’
calculation has been made. The assumptions and results are summarised in
Table 7.
Table 7 Share of company cars in total passenger car emissions in the EU28
EU28, 2012 Value Note/Source
Estimating the number of company cars in the EU28
New company car sales in 18
EU countries in 2008
5,700,000 European Union (2010)
Total number of company
cars in the EU 18 fleet
22,800,000 For an average lifetime of 4 years (5,700,000 *
4=22,800,000)
Total number of cars in in
the EU 18 fleet
196,400,000 ACEA (2012)
Share of company cars in
total EU 18 fleet
12% 22,800,000/196,400,000=12%
Total number of cars in the
EU28 fleet
285,000,000 ACEA (2012)
Number of company cars in
the EU28 fleet
33,100,000 Estimated with the same share of company cars
in the EU18 (12%): 285,000,000*12% = 33,100,000
Estimating the emissions of the EU28 company car fleet
Total GHG emissions in EU28
from cars in Mt CO2 eq.
(2012)
528 EEA (2014)
Annual mileage of a a)
company car & b) average
car in km
a) 24,000
&
b) 13,000
CBS (2014); based on Dutch statistics, which is
only used for the relative difference in mileage,
not for the absolute mileage.
CO2 efficiency of a a)
company car & b) average
car in g/km
a) 186
&
b) 200
T&E (2013) for company car
TREMOVE (2012) for an average car
CO2 emissions in Mt for a)
company cars & b) average
cars when applying the
assumptions above
a) 148
b) 661
total: 809
a 33,100,000 [# of company cars] * 24,000
[annual mileage company car] * 186 g/km =
148 Mt
b (285,000,000 - 33,100,000) [# of private
cars] * 13,000 [annual mileage company car]
* 200 g/km = 661 Mt
Share of company cars in
total car emissions
18% =148 [estimated company car emissions] / 809
[estimated total car emissions]; see previous row
Mt CO2 of company cars 97 528 [actual total car emissions in the EU] * 18%
[share of company cars in total car emissions].

48 April 2015 4.E62.1 – Saving fuel, saving costs
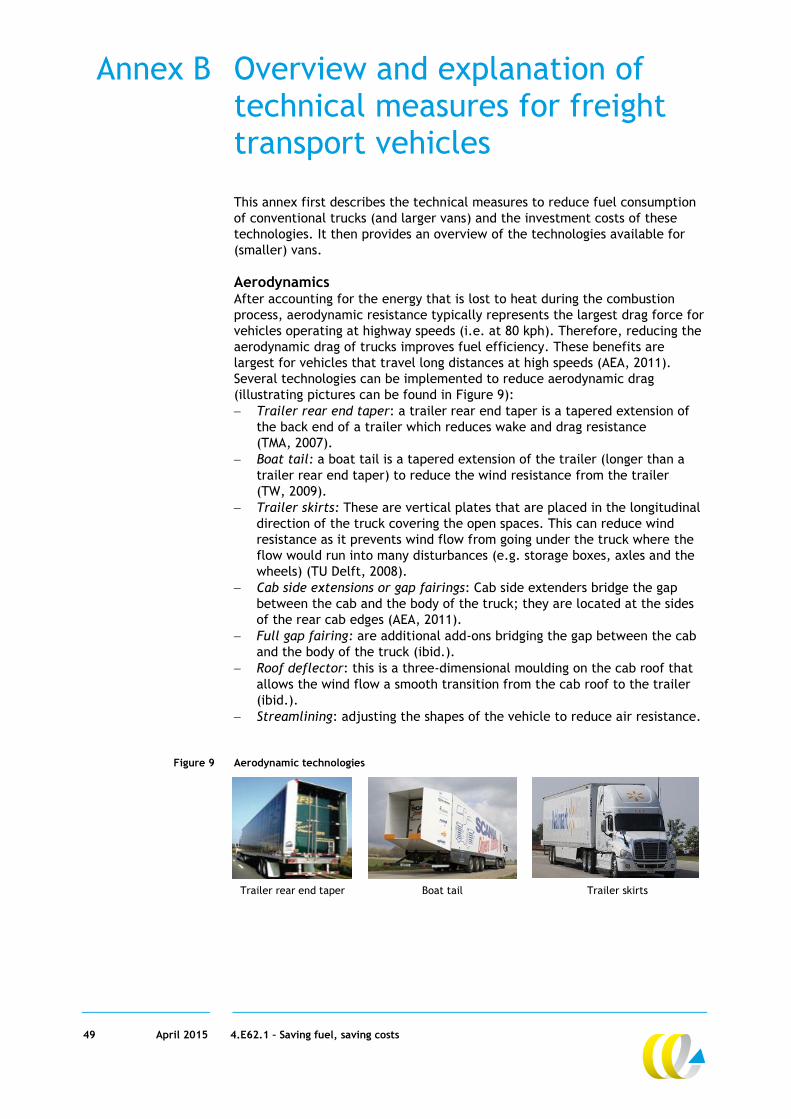
49 April 2015 4.E62.1 – Saving fuel, saving costs
Annex B Overview and explanation of technical measures for freight transport vehicles
This annex first describes the technical measures to reduce fuel consumption
of conventional trucks (and larger vans) and the investment costs of these
technologies. It then provides an overview of the technologies available for
(smaller) vans.
Aerodynamics After accounting for the energy that is lost to heat during the combustion
process, aerodynamic resistance typically represents the largest drag force for
vehicles operating at highway speeds (i.e. at 80 kph). Therefore, reducing the
aerodynamic drag of trucks improves fuel efficiency. These benefits are
largest for vehicles that travel long distances at high speeds (AEA, 2011).
Several technologies can be implemented to reduce aerodynamic drag
(illustrating pictures can be found in Figure 9):
Trailer rear end taper: a trailer rear end taper is a tapered extension of
the back end of a trailer which reduces wake and drag resistance
(TMA, 2007).
Boat tail: a boat tail is a tapered extension of the trailer (longer than a
trailer rear end taper) to reduce the wind resistance from the trailer
(TW, 2009).
Trailer skirts: These are vertical plates that are placed in the longitudinal
direction of the truck covering the open spaces. This can reduce wind
resistance as it prevents wind flow from going under the truck where the
flow would run into many disturbances (e.g. storage boxes, axles and the
wheels) (TU Delft, 2008).
Cab side extensions or gap fairings: Cab side extenders bridge the gap
between the cab and the body of the truck; they are located at the sides
of the rear cab edges (AEA, 2011).
Full gap fairing: are additional add-ons bridging the gap between the cab
and the body of the truck (ibid.).
Roof deflector: this is a three-dimensional moulding on the cab roof that
allows the wind flow a smooth transition from the cab roof to the trailer
(ibid.).
Streamlining: adjusting the shapes of the vehicle to reduce air resistance.
Figure 9 Aerodynamic technologies
Trailer rear end taper Boat tail Trailer skirts
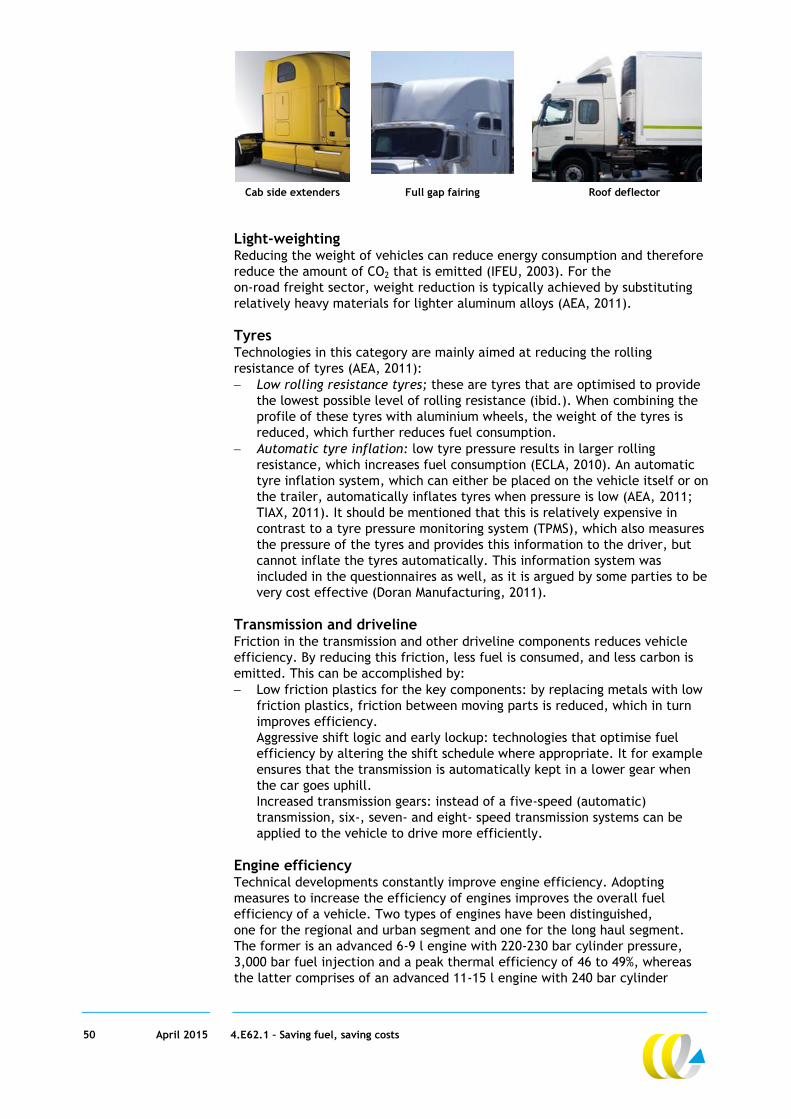
50 April 2015 4.E62.1 – Saving fuel, saving costs
Cab side extenders Full gap fairing Roof deflector
Light-weighting Reducing the weight of vehicles can reduce energy consumption and therefore
reduce the amount of CO2 that is emitted (IFEU, 2003). For the
on-road freight sector, weight reduction is typically achieved by substituting
relatively heavy materials for lighter aluminum alloys (AEA, 2011).
Tyres Technologies in this category are mainly aimed at reducing the rolling
resistance of tyres (AEA, 2011):
Low rolling resistance tyres; these are tyres that are optimised to provide
the lowest possible level of rolling resistance (ibid.). When combining the
profile of these tyres with aluminium wheels, the weight of the tyres is
reduced, which further reduces fuel consumption.
Automatic tyre inflation: low tyre pressure results in larger rolling
resistance, which increases fuel consumption (ECLA, 2010). An automatic
tyre inflation system, which can either be placed on the vehicle itself or on
the trailer, automatically inflates tyres when pressure is low (AEA, 2011;
TIAX, 2011). It should be mentioned that this is relatively expensive in
contrast to a tyre pressure monitoring system (TPMS), which also measures
the pressure of the tyres and provides this information to the driver, but
cannot inflate the tyres automatically. This information system was
included in the questionnaires as well, as it is argued by some parties to be
very cost effective (Doran Manufacturing, 2011).
Transmission and driveline Friction in the transmission and other driveline components reduces vehicle
efficiency. By reducing this friction, less fuel is consumed, and less carbon is
emitted. This can be accomplished by:
Low friction plastics for the key components: by replacing metals with low
friction plastics, friction between moving parts is reduced, which in turn
improves efficiency.
Aggressive shift logic and early lockup: technologies that optimise fuel
efficiency by altering the shift schedule where appropriate. It for example
ensures that the transmission is automatically kept in a lower gear when
the car goes uphill.
Increased transmission gears: instead of a five-speed (automatic)
transmission, six-, seven- and eight- speed transmission systems can be
applied to the vehicle to drive more efficiently.
Engine efficiency Technical developments constantly improve engine efficiency. Adopting
measures to increase the efficiency of engines improves the overall fuel
efficiency of a vehicle. Two types of engines have been distinguished,
one for the regional and urban segment and one for the long haul segment.
The former is an advanced 6-9 l engine with 220-230 bar cylinder pressure,
3,000 bar fuel injection and a peak thermal efficiency of 46 to 49%, whereas
the latter comprises of an advanced 11-15 l engine with 240 bar cylinder
51 April 2015 4.E62.1 – Saving fuel, saving costs
pressure, 4,000 bar supercritical atomisation fuel injection and a peak thermal
efficiency of 51 to 53%14.
Hybridisation Hybrid systems for HGVs aim to reduce unnecessary engine idling when the
vehicle is stationary (by means of a start/stop hybrid) and/or to recover
energy from braking, which is stored and then used to help accelerate the
vehicle (AEA, 2011). Hybrid technologies will have the largest benefits for
vehicles operating in urban areas, as these vehicles typically have transient
driving patterns (ibid.). Two hybrids are distinguished by TIAX (2011) for the
market segments that are the focus of this study:
(Generation II) Dual-mode hybrid (long haul and regional haul): The dual
mode hybrid automatically switches the engine off at idle.
When accelerating from stop, the diesel engine and electric motor blend
their power until the truck has reached highway speed, from there the
diesel engine takes over, although the electric motor can still assist when
going up a steep hill, for example. In addition, the electric motor is used
to power all accessories that would normally run with the diesel engine,
such as the power steering or air compressor. Its batteries can be loaded
either from storing energy that is released when braking or the diesel
engine can work as a generator (ArvinMeritor, 2008).
Parallel hybrid: A parallel hybrid turns the engine off at idle and uses the
electric motor to drive when starting. Thereafter, the diesel engine is
started as well; both power sources can work in parallel. The electric
motor also works as a generator to deliver energy that is recovered from
braking to the battery pack (Volvo trucks global, 2012). As vehicles driving
in urban areas need to brake often, the parallel hybrid is typically
advantageous for this group of vehicles (TIAX, 2011).
The investment costs of the measures described above are summarised in
Table 8.
14 Further technical specifications of both engines can be found in TIAX (2011).
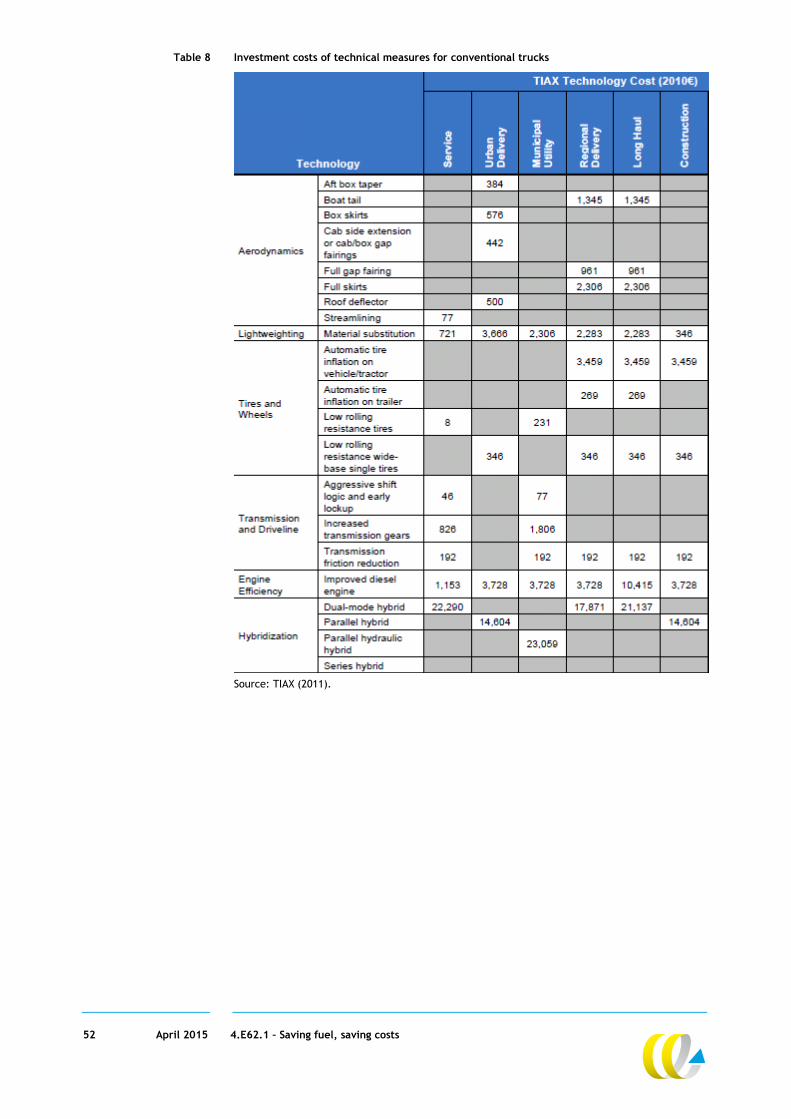
52 April 2015 4.E62.1 – Saving fuel, saving costs
Table 8 Investment costs of technical measures for conventional trucks
Source: TIAX (2011).
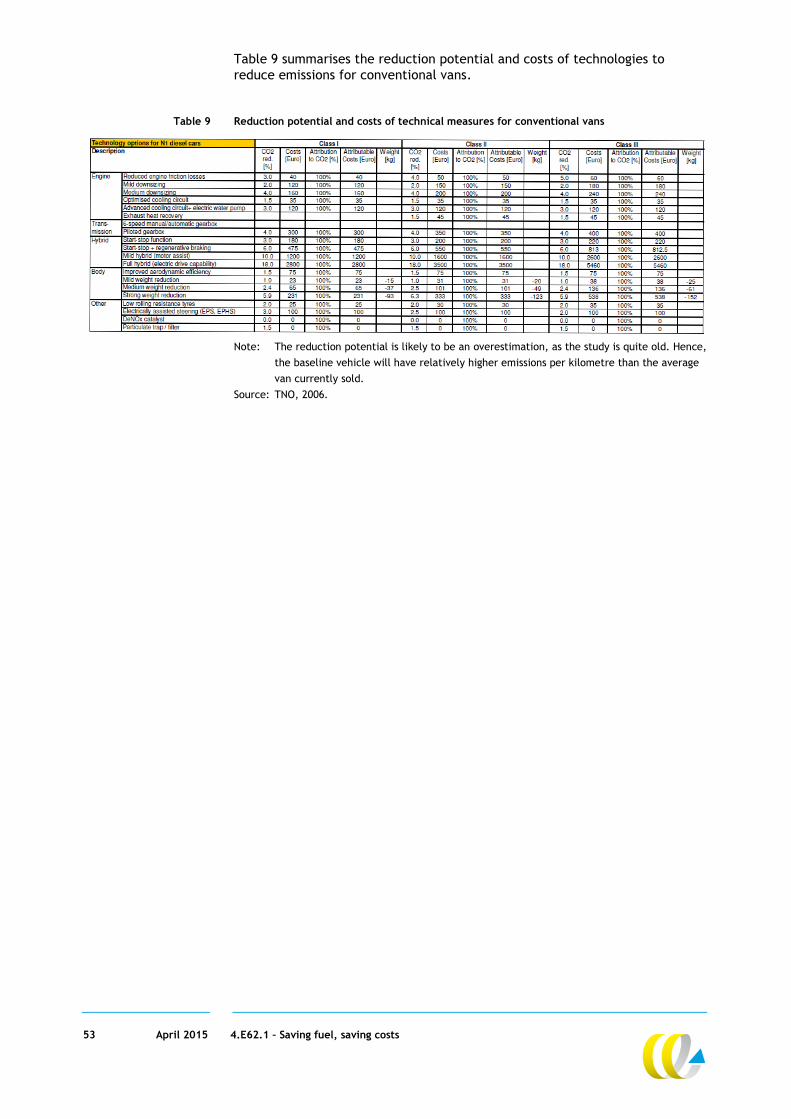
53 April 2015 4.E62.1 – Saving fuel, saving costs
Table 9 summarises the reduction potential and costs of technologies to
reduce emissions for conventional vans.
Table 9 Reduction potential and costs of technical measures for conventional vans
Note: The reduction potential is likely to be an overestimation, as the study is quite old. Hence,
the baseline vehicle will have relatively higher emissions per kilometre than the average
van currently sold.
Source: TNO, 2006.