save more tomorrow : using behavioral economics to ... · s166 journal of political economy those...
TRANSCRIPT

S164
[Journal of Political Economy, 2004, vol. 112, no. 1, pt. 2]� 2004 by The University of Chicago. All rights reserved. 0022-3808/2004/11201S1-0018$10.00
Save More Tomorrow�: Using BehavioralEconomics to Increase Employee Saving
Richard H. ThalerUniversity of Chicago
Shlomo BenartziUniversity of California, Los Angeles
As firms switch from defined-benefit plans to defined-contributionplans, employees bear more responsibility for making decisions abouthow much to save. The employees who fail to join the plan or whoparticipate at a very low level appear to be saving at less than thepredicted life cycle savings rates. Behavioral explanations for this be-havior stress bounded rationality and self-control and suggest that atleast some of the low-saving households are making a mistake andwould welcome aid in making decisions about their saving. In thispaper, we propose such a prescriptive savings program, called SaveMore Tomorrow� (hereafter, the SMarT program). The essence ofthe program is straightforward: people commit in advance to allocat-ing a portion of their future salary increases toward retirement savings.We report evidence on the first three implementations of the SMarTprogram. Our key findings, from the first implementation, which has
We are grateful to Brian Tarbox for implementing the Save More Tomorrow� plan andfor sharing the data with us. We would also like to thank many people at the followingcompanies for their help: Financial Engines, Hewitt Associates, Ispat Inland, John Hancock,Philips Electronics, and the Vanguard Group. Jodi Dicenzo, Bill Sharpe, and Steve Utkusdeserve special thanks. We are also grateful for comments from David Laibson, BrigitteMadrian, Casey Mulligan, Ted O’Donoghue, and Cass Sunstein. Benartzi would like tothank Reish Luftman McDaniel & Reicher for financial support. Save More Tomorrow isa registered trademark of Benartzi and Thaler, but the plan is available at no charge toany company that is willing to share data on the outcomes. This paper is dedicated toSherwin Rosen, Thaler’s thesis advisor. Thaler would not be an economist today if notfor Rosen’s help. The usual disclaimer, assigning none of the blame for errors to thosethanked above, applies in spades to Sherwin. He would not have liked this paper much,but we sure would have enjoyed hearing him complain about it!

behavioral economics S165
been in place for four annual raises, are as follows: (1) a high pro-portion (78 percent) of those offered the plan joined, (2) the vastmajority of those enrolled in the SMarT plan (80 percent) remainedin it through the fourth pay raise, and (3) the average saving ratesfor SMarT program participants increased from 3.5 percent to 13.6percent over the course of 40 months. The results suggest that be-havioral economics can be used to design effective prescriptive pro-grams for important economic decisions.
I. Introduction
Economic theory generally assumes that people solve important prob-lems as economists would. The life cycle theory of saving is a goodexample. Households are assumed to want to smooth consumption overthe life cycle and are expected to solve the relevant optimization prob-lem in each period before deciding how much to consume and howmuch to save. Actual household behavior might differ from this optimalplan for at least two reasons. First, the problem is a hard one, even foran economist, so households might fail to compute the correct savingsrate. Second, even if the correct savings rate were known, householdsmight lack the self-control to reduce current consumption in favor offuture consumption (Thaler and Shefrin 1981).
One fact that underscores the important role of self-control is thatthe typical middle-class American household accumulates retirementwealth primarily in three forms: social security, pensions, and homeequity. Neither social security nor defined-benefit pension plans requirewillpower on the part of participants, and once a home is purchased,the monthly mortgage bill provides a useful discipline in building upequity.
Those Americans who have access to and make use of all three low-willpower savings techniques appear to be doing a decent job of savingfor retirement. Gustman and Steinmeier (1998), using the 1992 Healthand Retirement Survey of households with heads of household bornbetween 1931 and 1941, find that households with pensions have whatappear to be adequate income replacement rates. A majority of thepensions in their sample are of the defined-benefit variety, however, inwhich self-control plays no role. Over the past decade, there has beena rapid change toward defined-contribution plans that require employ-ees to actively join and select their own savings rate. For those workerswho are eligible only for a defined-contribution plan and elect not tojoin or to contribute a token amount, savings adequacy may be muchlower. One hint at this comes from Gustman and Steinmeier’s analysisof workers who do not have pensions. The adequacy levels of their wealthand savings are substantially lower than those with pensions. Indeed,

S166 journal of political economy
those workers with pensions are wealthier by approximately the valueof their pension.1
For whatever reason, some employees at firms that offer only defined-contribution plans contribute little or nothing to the plan. In this paper,we take seriously the possibility that some of these low-saving workersare making a mistake. By calling their low-saving behavior a mistake, wemean that they might characterize the action the same way, just assomeone who is 100 pounds overweight might agree that he or sheweighs too much. We then use principles from psychology and behav-ioral economics to devise a program to help people save more. Theprogram is called Save More Tomorrow� (or SMarT), and the basicidea is to give workers the option of committing themselves now toincreasing their savings rate later, each time they get a raise. We reportextensive data on one firm that implemented the program in 1998 andpreliminary data on two other firms that implemented it recently.
We note that the null hypothesis predicted by the standard economicapproach is that workers will have no interest in joining the SMarT plan.If households are already choosing their optimal life cycle savings rate,then they will not join a program that will commit them to periodicchanges. In contrast, the behavioral economics prediction is that work-ers will find this program quite attractive and that it will significantlyincrease the savings rates of those who join the plan.
II. A Prescriptive Approach to Increasing Savings Rates
Raiffa (1982) suggested that economists and other social scientists couldbenefit from distinguishing three different kinds of analyses: normative,descriptive, and prescriptive. Normative theories characterize rationalchoice and are often derived by solving some kind of optimization prob-lem. The life cycle hypothesis is an example of a normative theory ofsaving since it is based on the solution to a lifetime consumption-smooth-ing problem. Descriptive theories simply model how people actuallychoose, often by stressing systematic departures from the normativetheory. In the realm of savings behavior, Shefrin and Thaler (1988) offerthe behavioral life cycle hypothesis as a descriptive model of household
1 It is sometimes argued that this fact can be explained by selection effects, i.e., thatthose workers with a “taste for savings” go to work for companies with more attractivepension benefits. But it is important not to push this argument too far. It is implausiblethat pension benefits are so salient and important that workers sort themselves to firmsprimarily on this basis. Many other features of a job determine its attractiveness, andpotential employees must make trade-offs. To give one example, one of the authors ofthis paper is much more interested in collegiate athletics than the other, but he teachesat the University of Chicago, not UCLA! Therefore, we should not expect underlyingpreferences and employment characteristics to be perfectly correlated on any singledimension.
behavioral economics S167
savings in which self-control and mental accounting play key roles. Fi-nally, prescriptive theories are attempts to offer advice on how peoplecan improve their decision making and get closer to the normative ideal.Prescriptions often have a second-best quality. For a golfer who hits aslice (in which the ball tails off to the right) when he would prefer tohit the ball straight, simple prescriptive advice might be to aim to theleft. Better prescriptive advice would help the golfer hit the ball straight.This paper is an attempt at good prescriptive savings advice.
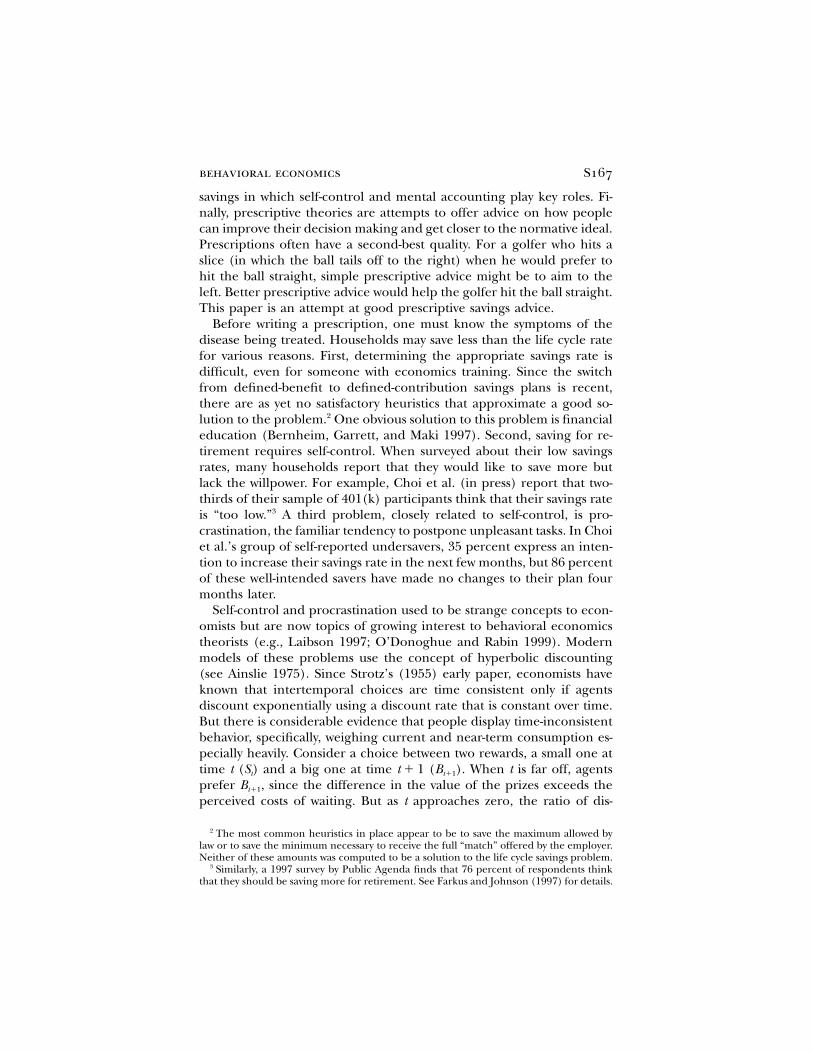
Before writing a prescription, one must know the symptoms of thedisease being treated. Households may save less than the life cycle ratefor various reasons. First, determining the appropriate savings rate isdifficult, even for someone with economics training. Since the switchfrom defined-benefit to defined-contribution savings plans is recent,there are as yet no satisfactory heuristics that approximate a good so-lution to the problem.2 One obvious solution to this problem is financialeducation (Bernheim, Garrett, and Maki 1997). Second, saving for re-tirement requires self-control. When surveyed about their low savingsrates, many households report that they would like to save more butlack the willpower. For example, Choi et al. (in press) report that two-thirds of their sample of 401(k) participants think that their savings rateis “too low.”3 A third problem, closely related to self-control, is pro-crastination, the familiar tendency to postpone unpleasant tasks. In Choiet al.’s group of self-reported undersavers, 35 percent express an inten-tion to increase their savings rate in the next few months, but 86 percentof these well-intended savers have made no changes to their plan fourmonths later.
Self-control and procrastination used to be strange concepts to econ-omists but are now topics of growing interest to behavioral economicstheorists (e.g., Laibson 1997; O’Donoghue and Rabin 1999). Modernmodels of these problems use the concept of hyperbolic discounting(see Ainslie 1975). Since Strotz’s (1955) early paper, economists haveknown that intertemporal choices are time consistent only if agentsdiscount exponentially using a discount rate that is constant over time.But there is considerable evidence that people display time-inconsistentbehavior, specifically, weighing current and near-term consumption es-pecially heavily. Consider a choice between two rewards, a small one attime t ( ) and a big one at time ( ). When t is far off, agentsS t � 1 Bt t�1
prefer , since the difference in the value of the prizes exceeds theBt�1
perceived costs of waiting. But as t approaches zero, the ratio of dis-
2 The most common heuristics in place appear to be to save the maximum allowed bylaw or to save the minimum necessary to receive the full “match” offered by the employer.Neither of these amounts was computed to be a solution to the life cycle savings problem.
3 Similarly, a 1997 survey by Public Agenda finds that 76 percent of respondents thinkthat they should be saving more for retirement. See Farkus and Johnson (1997) for details.

S168 journal of political economy
counted values increases, causing people to switch their preferences.4
Such present-biased preferences can be captured with models that em-ploy hyperbolic discounting. These models come in two varieties: so-phisticated and naive. Sophisticated agents (modeled by Laibson) re-alize that they have hyperbolic preferences and take steps to deal withthe problem, whereas naive agents fail to appreciate at least the extentof their problem (see O’Donoghue and Rabin 1999, 2001). Actual be-havior is likely best described by something between naivete andsophistication.
Hyperbolic agents procrastinate because they (wrongly) think thatwhatever they will be doing later will not be as important as what theyare doing now. The more naive agents are, the more pronounced thetendency to procrastinate. Procrastination, in turn, produces a strongtendency toward inertia, or what Samuelson and Zeckhauser (1988)have dubbed status quo bias. Status quo bias is prevalent in the retire-ment savings domain. For example, Samuelson and Zeckhauser reporton the behavior of the 1987 participants of TIAA-CREF, the large re-tirement plan that then catered to university employees. Their analysisreveals that the median number of changes in the asset allocation overthe lifetime was zero! In other words, more than half the participants inTIAA-CREF reached retirement with the same asset allocation as theday they became eligible for the plan. Note that zero changes meansthat participants were electing a constant flow into the two funds thenoffered, TIAA, a fixed-income fund, and CREF, a stock fund, and en-gaged in no rebalancing. Since stocks appreciated much more thanbonds over this period, participants with a constant flow (such as 50–50, the most common allocation) ended up with a much larger sharein stocks over time. A recent study by Ameriks and Zeldes (2000), usinga 10-year panel of TIAA-CREF participants, finds a similar result. Nearlyhalf of the participants made no changes to their plan over the 10-yearperiod.5
The importance of procrastination and status quo bias in the designof prescriptive savings plans is illustrated by the experience some firmshave had with so-called automatic enrollment plans. In such plans, whenemployees first become eligible for the savings plan, they are automat-ically enrolled unless they explicitly opt out. So, unlike the typical plan,in which the default is not to join, here the default is to join. Employees
4 For evidence on hyperbolic discounting, see Thaler (1981) and the papers in Loew-enstein and Elster (1992).
5 Choi, Laibson, and Mettrick (2000) find somewhat more frequent trading in a sampleof workers at two firms in 1998 and 1999, partly because of the ease of trading via theInternet that was possible at both firms. But this increase in trading may also be attributableto rapidly rising stock prices during this period and the resulting excitement amongindividual investors.

behavioral economics S169
who take no action are typically enrolled at a modest saving rate (suchas 3 percent) and a conservative investment strategy. Standard economictheory would predict that this change would have virtually no effect onsaving behavior. The costs of actively joining the plan (typically fillingout a short form) are trivial compared with the potential benefits of thetax-free accumulation of wealth, and in some cases a “match” is providedby the employer, in which the employer typically contributes 50 centsto the plan for every dollar the employee contributes, up to some max-imum. In contrast, if agents display procrastination and status quo bias,then automatic enrollment could be useful in increasing participationrates.
Consistent with the behavioral predictions, automatic enrollmentplans have proved to be remarkably successful in increasing enrollments.In one plan studied by Madrian and Shea (1999), participation ratesfor newly eligible workers increased from 49 percent to 86 percent.Other plans have obtained participation rates of over 90 percent (Choiet al., in press). But there is a downside to automatic enrollment. Thevery inertia that explains why automatic enrollment increases partici-pation rates can also lower the saving rates of those who do participate.In the firm Madrian and Shea studied, the vast majority of new enrolleeselected the default saving rate (3 percent), and Madrian and Shea’sanalysis shows that many of these employees would have elected a highersaving rate if left to their own devices (see Choi et al. [in press], whoexplore these issues in depth). A goal of the SMarT plan is to obtainsome of the advantages of automatic enrollment while avoiding someof the disadvantages.
On the basis of our analysis of undersaving households in the previoussection, some elements of a proposed solution are fairly obvious. Thepresence of bounded rationality suggests that the program should besimple and should help people approximate the life cycle saving rateif they are unable to do so themselves. Hyperbolic discounting impliesthat opportunities to save more in the future will be considered moreattractive than those in the present. Procrastination and inertia suggestthat once employees are enrolled in the program, they should remainin until they opt out.
The final behavioral factor that should be considered in designing aprescriptive savings plan is loss aversion, the empirically demonstratedtendency for people to weigh losses significantly more heavily than gains.Estimates of loss aversion are typically close to 2.0: losses hurt roughlytwice as much as gains yield pleasure. These estimates come both fromrisky choice (Tversky and Kahneman 1992) and from riskless choice(Kahneman, Knetsch, and Thaler 1990).
Loss aversion affects savings because once households get used to aparticular level of disposable income, they tend to view reductions in

S170 journal of political economy
that level as a loss. Thus households may be reluctant to increase theircontributions to the savings plan because they do not want to experiencethis cut in take-home pay. Significantly, gains and losses appear to beexperienced in nominal dollars. For example, in a study of perceptionsof fairness (Kahneman et al. 1986), subjects were asked to judge thefairness of pay cuts and pay increases in a company located in a com-munity with substantial unemployment. One group of subjects was toldthat there was no inflation in the community and was asked whether a7 percent wage cut was “fair.” A majority, 62 percent, judged the actionto be unfair. Another group was told that there was 12 percent inflationand was asked to judge the perceived fairness of a 5 percent raise. Here,only 22 percent thought the action was unfair. Similar results suggestingthis money illusion are reported by Shafir, Diamond, and Tversky(1997). The combination of loss aversion and money illusion suggeststhat pay increases may provide a propitious time to try to get workersto save more, since they are less likely to consider an increased contri-bution to the plan as a loss than they would at other times of the year.
In summary, for households that appear to be saving too little, thebehavioral analysis stresses four factors that are important explanatoryfactors: bounded rationality, self-control, procrastination (which pro-duces inertia), and nominal loss aversion. These households are notsure how much they should be saving, though they realize that it isprobably more than they are doing now; but they procrastinate aboutsaving more now, thinking that they will get to it later. Our program toincrease saving is aimed at these households.
III. The SMarT Program
Our goal was to design a program to help those employees who wouldlike to save more but lack the willpower to act on this desire. On thebasis of the principles discussed so far, we have proposed a program wecall Save More Tomorrow�. The plan has four ingredients. First, em-ployees are approached about increasing their contribution rates a con-siderable time before their scheduled pay increase. Because of hyper-bolic discounting, the lag between the sign-up and the start-up datesshould be as long as feasible.6 Second, if employees join, their contri-bution to the plan is increased beginning with the first paycheck aftera raise. This feature mitigates the perceived loss aversion of a cut intake-home pay. Third, the contribution rate continues to increase oneach scheduled raise until the contribution rate reaches a preset max-imum. In this way, inertia and status quo bias work toward keeping
6 The intuition here is the same as one in which requests to give a talk or write a chaptermeet with more success when they are received many months ahead of time.

behavioral economics S171
people in the plan. Fourth, the employee can opt out of the plan atany time. Although we expect few employees to be unhappy with theplan, it is important that they can always opt out. Knowledge of thisfeature will also make employees more comfortable about joining.
The SMarT plan has many features that were included with the in-tention of making it attractive to employees who want to save more. Itis not possible to say on theoretical grounds which features are mostimportant, nor can theory tell us the ideal levels to select for many ofthe parameters that must be picked (e.g., the delay between the solic-itation letter and the start of the program, the rate of increase, and themethods of soliciting and educating potential participants). Similarly,we cannot say a priori whether particular features, such as linking theincreases in the savings rate to pay increases, are just one of manyattractive components or are essential ingredients to success. We shalllearn more about these questions over time as firms adopt the plan andprovide data for analysis.
At this time we have three implementations on which we can report,each done rather differently. The particular design features were gen-erally not selected by us but, rather, reflect the preferences of the firmsthat have adopted the plan. In this type of field research, we, the aca-demic investigators, have quite limited control over many of the details,especially if compared with a laboratory environment. Nevertheless, itis not possible to study actual household savings behavior in a lab, sowe are grateful for the data we are able to report here.
A. The First Implementation of SMarT: Midsize Manufacturing Company
The first implementation of the SMarT plan took place in 1998 at amidsize manufacturing company (which prefers to remain anonymous).The company, with the help of an investment consultant, selected thespecific details of the implementation. Prior to the adoption of theSMarT plan, the company suffered from low participation rates as wellas low saving rates. This was a concern for two reasons. First, since thecompany did not have a defined-benefit plan, management was con-cerned that some of the workers might not be saving enough to supportthemselves when they retired. Second, the company was being con-strained by U.S. Department of Labor nondiscrimination rules that re-strict the proportion of benefits that can be paid to the higher-paidemployees in the firm. Since the lower-paid workers were the ones whowere typically saving little or nothing, the executives were not able tocontribute the maximum normally allowed to their own plan.
In an effort to increase the savings rates of the employees, the com-pany hired an investment consultant and offered his services to everyemployee eligible for the retirement savings plan. Of the 315 eligible

S172 journal of political economy
participants, all but 29 agreed to meet with the consultant and get hisadvice. On the basis of information that the employee provided, theconsultant used commercial software to compute a desired saving rate,which can be thought of as an estimate of the appropriate life cyclesavings rate. The consultant also discussed with each employee howmuch of an increase in savings would be considered economically fea-sible. If the employee seemed very reluctant to increase his or her savingrate substantially, the consultant would constrain the program to in-crease the saving contribution by no more than 5 percent.7 The con-sultant justified his decision not to go with the advice from the programmechanically as follows:
In most cases with rank and file workers, the computer pro-gram calculates that workers contribute the maximum [allowedby the Internal Revenue Service (IRS) and the plan rules] andmakes that recommendation. As a practical matter, when theaverage worker receives this recommendation from the com-puter program or the “financial planner,” s/he shuts down anddoes nothing. So in all cases, after we reviewed their currentplan but before I hit the “Get Advice” button, I would discusswillingness to save with each participant. As you can imagine,the majority of workers live paycheck to paycheck and canbarely make ends meet, and they tell you that immediately. …If a participant indicated a willingness to immediately increasetheir deferral level by more than 5 percent, I hit the “GetAdvice” button. Otherwise, I would constrain the advice pro-posed to an increase of no more than 5 percent. [Personalcommunication from Brian Tarbox, the investment consultant]
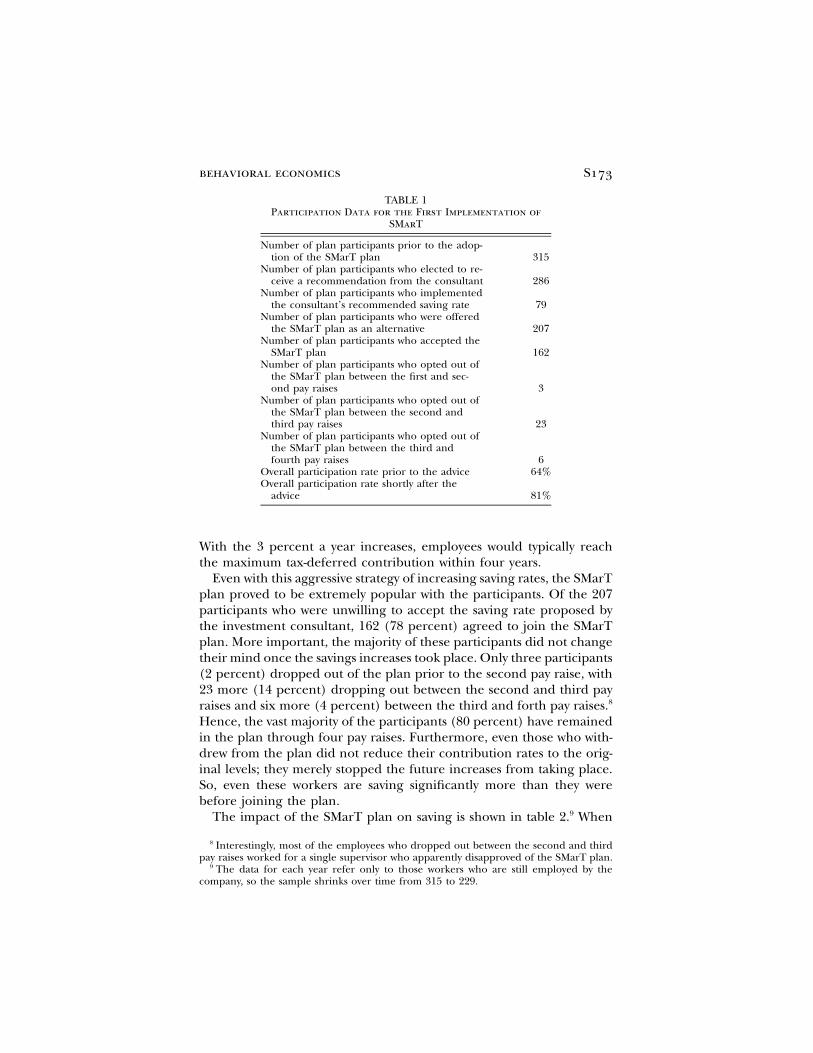
The participation data are reported in table 1. Of the 286 employeeswho talked to the investment consultant, only 79 (28 percent) werewilling to accept his advice, even with the constraint that recommendedincreases were usually no more than five percentage points. For the restof the participants, the planner offered a version of the SMarT plan asan alternative, proposing that they increase their saving rates by threepercentage points each year, starting with the next pay increase. Thiswas quite aggressive advice, since pay increases were barely more thanthis amount (approximately 3.25 percent for hourly employees and 3.50percent for salaried employees). The pay increases were scheduled tooccur roughly three months from the time the advice was being given.
7 Here and elsewhere, when we refer to a five-percentage-point increase, we are referringto an increase of percentage points, e.g., from a 2 percent saving rate to a 7 percent savingrate.
behavioral economics S173
TABLE 1Participation Data for the First Implementation of
SMarT
Number of plan participants prior to the adop-tion of the SMarT plan 315
Number of plan participants who elected to re-ceive a recommendation from the consultant 286
Number of plan participants who implementedthe consultant’s recommended saving rate 79
Number of plan participants who were offeredthe SMarT plan as an alternative 207
Number of plan participants who accepted theSMarT plan 162
Number of plan participants who opted out ofthe SMarT plan between the first and sec-ond pay raises 3
Number of plan participants who opted out ofthe SMarT plan between the second andthird pay raises 23
Number of plan participants who opted out ofthe SMarT plan between the third andfourth pay raises 6
Overall participation rate prior to the advice 64%Overall participation rate shortly after the
advice 81%
With the 3 percent a year increases, employees would typically reachthe maximum tax-deferred contribution within four years.
Even with this aggressive strategy of increasing saving rates, the SMarTplan proved to be extremely popular with the participants. Of the 207participants who were unwilling to accept the saving rate proposed bythe investment consultant, 162 (78 percent) agreed to join the SMarTplan. More important, the majority of these participants did not changetheir mind once the savings increases took place. Only three participants(2 percent) dropped out of the plan prior to the second pay raise, with23 more (14 percent) dropping out between the second and third payraises and six more (4 percent) between the third and forth pay raises.8
Hence, the vast majority of the participants (80 percent) have remainedin the plan through four pay raises. Furthermore, even those who with-drew from the plan did not reduce their contribution rates to the orig-inal levels; they merely stopped the future increases from taking place.So, even these workers are saving significantly more than they werebefore joining the plan.
The impact of the SMarT plan on saving is shown in table 2.9 When
8 Interestingly, most of the employees who dropped out between the second and thirdpay raises worked for a single supervisor who apparently disapproved of the SMarT plan.
9 The data for each year refer only to those workers who are still employed by thecompany, so the sample shrinks over time from 315 to 229.

S174 journal of political economy
TABLE 2Average Saving Rates (%) for the First Implementation of SMarT
ParticipantsWho Did NotContact the
FinancialConsultant
ParticipantsWho Accepted
the Consultant’sRecommended
Saving Rate
ParticipantsWho Joinedthe SMarT
Plan
ParticipantsWho Declined
the SMarTPlan All
Participantsinitiallychoosingeachoption* 29 79 162 45 315
Pre-advice 6.6 4.4 3.5 6.1 4.4First pay raise 6.5 9.1 6.5 6.3 7.1Second pay
raise 6.8 8.9 9.4 6.2 8.6Third pay raise 6.6 8.7 11.6 6.1 9.8Fourth pay
raise 6.2 8.8 13.6 5.9 10.6
* There is attrition from each group over time. The number of employees who remain by the time of the fourthpay raise is 229.
the investment consultant was brought into the company, the overallsavings rate in the plan was 4.4 percent. The employees who did notwant to talk to the consultant were saving more than the average, 6.6percent. The group that accepted the advice of the consultant had beensaving at exactly the overall company average, 4.4 percent, and afterimplementing the advice, they began saving 9.1 percent of their salary.At the end of our data collection period, that rate had slipped slightlyto 8.8 percent. Those who were unwilling to accept the advice were, notsurprisingly, starting from a lower base of 3.5 percent and so would findthe advice harder to adopt. Once they got their first pay raise, however,their saving rate jumped to 6.5 percent, and after three more raises, itwas up 13.6 percent. Those participating in the SMarT plan ended upwith a much higher saving rate than those who accepted the consultant’srecommendation.
Of course, the implementation of the SMarT plan was not conductedas an experiment with random assignment to conditions. Participantsselected themselves into the SMarT plan. In other circumstances, onemight worry that the observed increase in savings rates might be attrib-utable to some unmeasured “taste for saving” in the households thatjoined the SMarT plan; however, this worry seems unwarranted here ontwo counts. First, the SMarT participants had been saving very littlebefore joining the plan, so one would have to believe that their tastefor saving was newly acquired. Second, recall that the SMarT plan wasoffered only to those employees who were unwilling to increase theirsavings rate immediately by 5 percent. So, if anything, the group that

behavioral economics S175
accepted the consultant’s advice would appear to have a greater tastefor saving than those in the SMarT plan.
The design of the study also rules out an information-based expla-nation for our results. Since the employees met with the investmentconsultant, they received useful information about proper savings rates,and this information quite possibly could affect their savings rates. Allthe employees who agreed to meet with the consultant received thisinformation, however, including those who accepted the consultant’sadvice to increase their savings rate immediately. We find it difficult toconstruct an information-based explanation for the subsequent in-creases in savings rates for those enrolled in the SMarT plan.
B. The Second Implementation of SMarT: Ispat Inland
The second implementation of the program took place in May 2001 atIspat Inland, a large midwestern steel company. Ispat had heard aboutthe SMarT plan and expressed to us an interest in increasing the savingrates among its 5,000 unionized employees. Ispat employees have re-ceived only one pay raise from the introduction of SMarT to date, sowe can report only on the initial results at this time.
The implementation at Ispat was quite different from our first ex-perience in that it was implemented with quite minimal resources. Mostimportant, there was no financial consultant hired to meet one on onewith employees. Instead, employees received a letter sent jointly by thehuman resources department and the union inviting them to join theSMarT program. There were no follow-up letters, no financial educationseminars, and no other expenditures other than that single invitationletter and a few posters displayed in the cafeteria. In this implemen-tation, the annual increase to the savings contribution rate was set attwo percentage points every time they got a pay raise, with a cap oncontribution rates set at 18 percent of salary. The first pay raise wasscheduled for August 1, 2001, about two months after the solicitationletter was sent. The pay raise was to be 50 cents per hour, whichamounted to roughly 2.5 percent of the average wage.
Participation in the program and the resulting saving rates are de-scribed in table 3. Even with this very inexpensive solicitation strategy,the program was popular with employees. Of the participants who werealready enrolled in the 401(k) plan and were not already saving themaximum, 615 (18.1 percent) joined the SMarT plan. In addition, 165employees joined SMarT who were not yet enrolled in the 401(k) plan;this was 8.2 percent of those employees who were eligible to participatein the 401(k) plan but had not yet enrolled. The lower take-up rateamong the employees who were not currently in the 401(k) plan mightbe attributable to less interest in saving, but there is an additional con-

S176 journal of political economy
TABLE 3Average Saving Rates for Ispat Inland (%)
Employees Who WereAlready Saving on
May 31, 2001
Employees Who WereNot Saving on May 31,
2001All
EligibleEmployees(Np5,817)
JoinedSMarT
(Np615)
Did NotJoin SMarT(Np3,197)
JoinedSMarT
(Np165)
Did NotJoin SMarT(Np1,840)
Pre-SMarT(May 2001) 7.62 8.62 .00 .00 5.54
First pay raise(October2001) 9.38 8.54 2.28 .26 5.83
Note.—The sample includes 5,817 employees who are eligible to participate in the 401(k) plan and have remainedwith the company from May 2001 through October 2001. The sample includes 414 employees who were already savingat the maximum rate of 18 percent, although they were not allowed to join the SMarT program. The reported savingrates represent the equally weighted average of the individual saving rates.
tributing factor. Those who were not in the plan might have ignoredthe letter altogether. The letter came with the heading “important in-formation about your 401(k) account,” a teaser that would not be ofparticular interest to employees who were not in the plan.
The immediate effect on savings was about what might be expected.Those joining SMarT increased their saving rates by roughly 2 percent,whereas those not joining the program did not change their saving ratesmuch. If the experience in the first implementation is repeated hereand few employees drop out of the SMarT plan, then saving rates willcontinue to increase whenever the employees get raises.
C. The Third Implementation of SMarT: Philips Electronics
The third implementation of SMarT took place at two divisions (Divi-sions A and O) of Philips Electronics in January 2002, with the firstsaving increase taking place on April 1, 2002.10 The remaining 28 di-visions of Philips served as a control. Invitation letters were sent to 815“non–highly compensated” employees whose saving rates were below 10percent. Everything was done the same way at the two divisions exceptfor the following: Employees at Division A were given the option ofattending educational seminars devoted to retirement savings (includ-ing a description of the new SMarT plan) but were not offered any one-on-one meetings. For the employees at Division O, attendance at thefinancial education seminar was strongly encouraged. The seminar wasdescribed to the employees as “required,” although there was no penaltyfor failing to meet the requirement. Whether because of the “require-
10 Additional details on the implementation at Philips are available at http://institutional.vanguard.com/pdf/SMarT_112002.pdf.

behavioral economics S177
ment” or other reasons, 60 percent of the employees attended the sem-inar, whereas only 40 percent did so in Division A. The employees inDivision O were also offered the opportunity to have a one-on-one meet-ing with a certified financial planner. The average saving rates prior toSMarT were quite similar at the two divisions, 3.12 percent and 3.74percent for Divisions A and O, respectively, both rates slightly higherthan the saving rates in the rest of the Philips divisions (2.90 percent).But the two divisions are different along many other dimensions, makingdirect comparisons difficult. For example, Division A is in the technologybusiness, is located in the desert Southwest, and was suffering througha severe recession at the time of the implementation, whereas DivisionO focuses on consumer products, is located in the Pacific Northwest,and has been doing well economically.11 Thus the two divisions do notrepresent a true controlled experiment in comparison with each other,though they can reasonably be compared with the other control divi-sions, at least in terms of saving rates.
There were two notable differences between the implementation atPhilips and the previous two trials described above. First, increases insavings were not necessarily linked to pay raises. Instead, employees weretold that if they joined the plan, their saving rates would go up on April1 of each year whether or not they received a pay raise. Pay raises dotend to occur on April 1, but the employees could not be sure that theextra contribution to the savings plan would come out of their raise.Second, employees were allowed to pick the rate at which their savingswould increase: one, two, or three percentage points per year. Thosewho joined the plan but did not choose a rate of increase were assigneda 2 percent rate of increase.12 Fifty-four percent of the SMarT enrolleeselected an annual increase of 1 percent, 35 percent elected the defaultof 2 percent, and the remaining 11 percent elected 3 percent. Regardlessof the chosen annual increase, the annual increases will stop once theparticipant reaches a saving rate of 10 percent.
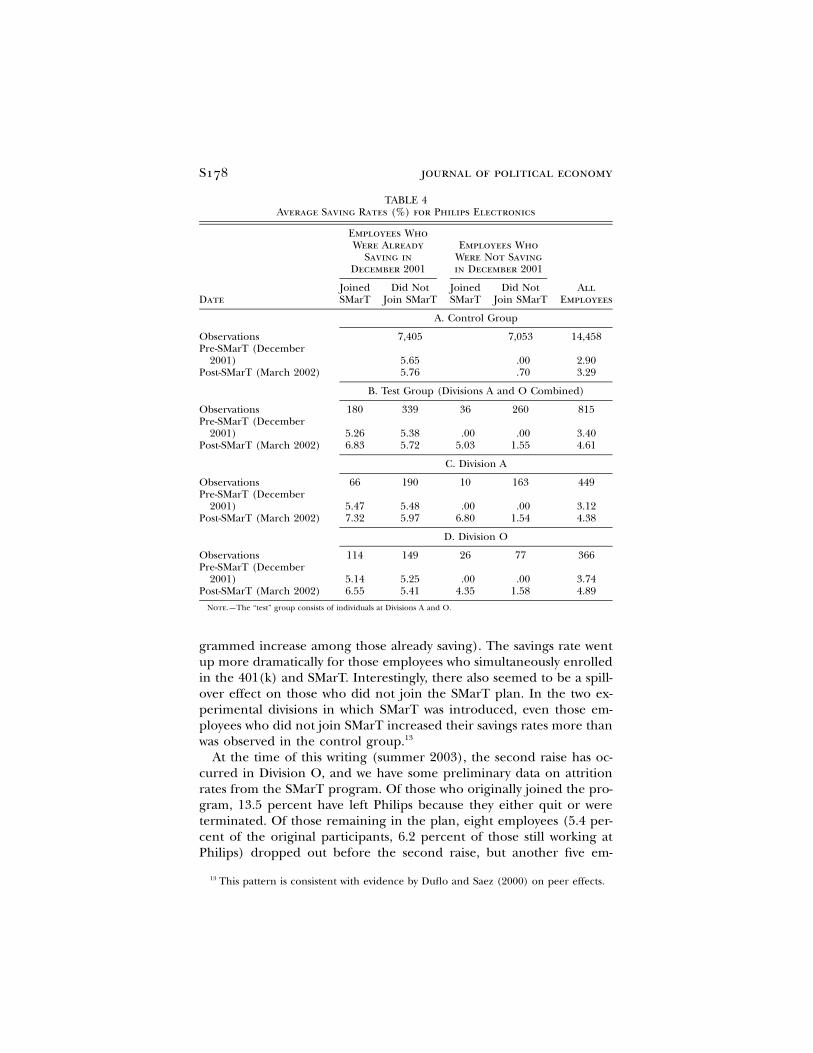
The resulting saving rates are displayed in table 4. As expected, notmuch is happening at the remaining 28 divisions of Philips Electronicsthat served as our control group. In contrast, saving rates for those whowere already enrolled in the 401(k) plan and joined the SMarT planwent up, as expected, by about 1.5 percent (the weighted-average pro-
11 Division A is now closing down, so the long-term results of the SMarT plan will notbe available.
12 There are pros and cons to offering this choice to participants, as opposed to justpicking a single rate of increase. The obvious advantage is that employees can select therate of increase they like best. The disadvantage is that simply being forced to make sucha choice adds another layer of complexity that could discourage some potential enrollees.We included the default 2 percent rate of increase with the goal of mitigating this potentialimpediment to enrolling. Only a controlled experiment will be able to determine whetherthe pros of offering choice outweigh the cons.
S178 journal of political economy
TABLE 4Average Saving Rates (%) for Philips Electronics
Date
Employees WhoWere Already
Saving inDecember 2001
Employees WhoWere Not Savingin December 2001
AllEmployees
JoinedSMarT
Did NotJoin SMarT
JoinedSMarT
Did NotJoin SMarT
A. Control Group
Observations 7,405 7,053 14,458Pre-SMarT (December
2001) 5.65 .00 2.90Post-SMarT (March 2002) 5.76 .70 3.29
B. Test Group (Divisions A and O Combined)
Observations 180 339 36 260 815Pre-SMarT (December
2001) 5.26 5.38 .00 .00 3.40Post-SMarT (March 2002) 6.83 5.72 5.03 1.55 4.61
C. Division A
Observations 66 190 10 163 449Pre-SMarT (December
2001) 5.47 5.48 .00 .00 3.12Post-SMarT (March 2002) 7.32 5.97 6.80 1.54 4.38
D. Division O
Observations 114 149 26 77 366Pre-SMarT (December
2001) 5.14 5.25 .00 .00 3.74Post-SMarT (March 2002) 6.55 5.41 4.35 1.58 4.89
Note.—The “test” group consists of individuals at Divisions A and O.
grammed increase among those already saving). The savings rate wentup more dramatically for those employees who simultaneously enrolledin the 401(k) and SMarT. Interestingly, there also seemed to be a spill-over effect on those who did not join the SMarT plan. In the two ex-perimental divisions in which SMarT was introduced, even those em-ployees who did not join SMarT increased their savings rates more thanwas observed in the control group.13
At the time of this writing (summer 2003), the second raise has oc-curred in Division O, and we have some preliminary data on attritionrates from the SMarT program. Of those who originally joined the pro-gram, 13.5 percent have left Philips because they either quit or wereterminated. Of those remaining in the plan, eight employees (5.4 per-cent of the original participants, 6.2 percent of those still working atPhilips) dropped out before the second raise, but another five em-
13 This pattern is consistent with evidence by Duflo and Saez (2000) on peer effects.

behavioral economics S179
ployees joined the plan. This experience of low dropout rates is com-parable to that in the first implementation and suggests that, over time,savings rates will continue to rise.
In this implementation, we were given access to some demographicinformation about the employees as well as information about how theplan was administered in each division. The participation rates in SMarTwere quite different in the two divisions, as shown in table 5. In DivisionA, only 16.9 percent of the division’s employees joined the program( ), whereas Division O had a take-up rate of 38.3 percent76/449( ). One potential explanation for this difference is that the140/366employees at Division O had the opportunity to meet with a certifiedfinancial planner. In fact, 41.8 percent of the employees at Division Omet with the financial planner, and 81 percent of those who attendedsuch a meeting actually joined SMarT. Of course, electing to meet withthe planner might by itself signal a desire to save, so it is not possibleto ascertain the incremental effect of the financial planner on eithersaving rates or SMarT participation.
Table 5 also provides some basic information on who joins the SMarTplan. Neither gender nor age appears to be an important determiningfactor. Employees with four to five years of tenure working for Philipswere the most likely to join, as were those with annual incomes of lessthan $50,000.
At this stage, there are some preliminary lessons that can be drawnfrom the Philips experience. First, the SMarT design feature linkingsavings increases to pay increases, while desirable, may not be essential.This is important, since some firms find it difficult to coordinate thesavings plan with the salary increases. Second, one-on-one meetings witha financial planner appear to be a very effective (though costly) re-cruitment tool, though selection problems make it difficult to parse outthe precise value of this intervention.
IV. SMarT and Savings Adequacy
Obviously, the SMarT plan can produce dramatic increases in savingrates. In the first implementation, those who joined the plan more thantripled their saving rates in 28 months. This raises the question of whateffect SMarT has on savings adequacy. Is this increase enough to makea substantial difference in the standard of living the participants willhave in retirement? If so, is it possible that we have been “too successful”and have somehow duped the participants into saving too much? Thissection offers some information on these important questions usinglessons from our first implementation. We focus on the first implemen-tation since it has the longest track record.
We do not have demographic or financial information about the em-
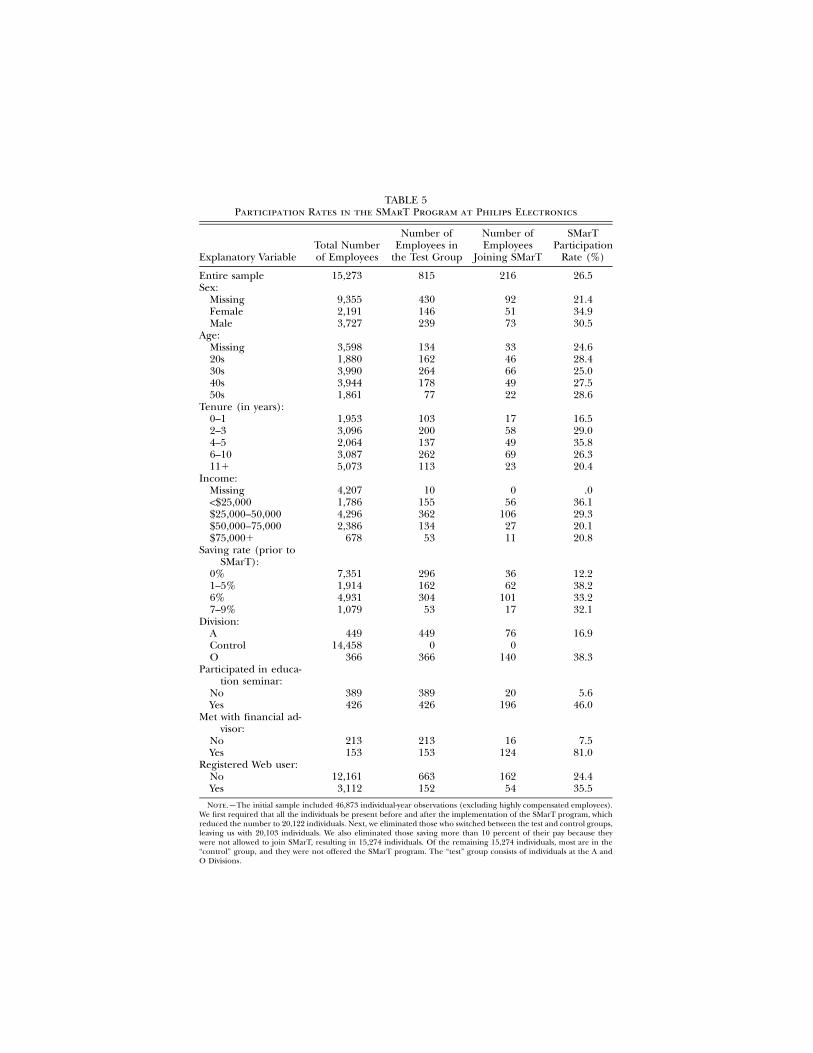
TABLE 5Participation Rates in the SMarT Program at Philips Electronics
Explanatory VariableTotal Numberof Employees
Number ofEmployees in
the Test Group
Number ofEmployees
Joining SMarT
SMarTParticipation
Rate (%)
Entire sample 15,273 815 216 26.5Sex:
Missing 9,355 430 92 21.4Female 2,191 146 51 34.9Male 3,727 239 73 30.5
Age:Missing 3,598 134 33 24.620s 1,880 162 46 28.430s 3,990 264 66 25.040s 3,944 178 49 27.550s 1,861 77 22 28.6
Tenure (in years):0–1 1,953 103 17 16.52–3 3,096 200 58 29.04–5 2,064 137 49 35.86–10 3,087 262 69 26.311� 5,073 113 23 20.4
Income:Missing 4,207 10 0 .0!$25,000 1,786 155 56 36.1$25,000–50,000 4,296 362 106 29.3$50,000–75,000 2,386 134 27 20.1$75,000� 678 53 11 20.8
Saving rate (prior toSMarT):
0% 7,351 296 36 12.21–5% 1,914 162 62 38.26% 4,931 304 101 33.27–9% 1,079 53 17 32.1
Division:A 449 449 76 16.9Control 14,458 0 0O 366 366 140 38.3
Participated in educa-tion seminar:
No 389 389 20 5.6Yes 426 426 196 46.0
Met with financial ad-visor:
No 213 213 16 7.5Yes 153 153 124 81.0
Registered Web user:No 12,161 663 162 24.4Yes 3,112 152 54 35.5
Note.—The initial sample included 46,873 individual-year observations (excluding highly compensated employees).We first required that all the individuals be present before and after the implementation of the SMarT program, whichreduced the number to 20,122 individuals. Next, we eliminated those who switched between the test and control groups,leaving us with 20,103 individuals. We also eliminated those saving more than 10 percent of their pay because theywere not allowed to join SMarT, resulting in 15,274 individuals. Of the remaining 15,274 individuals, most are in the“control” group, and they were not offered the SMarT program. The “test” group consists of individuals at the A andO Divisions.

behavioral economics S181
ployees in our study, so we need to make some assumptions about theirhousehold financial situations in order to calculate the likely effects ofjoining the SMarT plan. We make calculations for hypothetical workerswho join the plan at age 25, 35, 45, or 55 for three different annualincomes: $25,000, $50,000, and $75,000. We estimate beginning 401(k)account balances, using data from Hewitt Associates for some of thelarger 401(k) plans they administer. In particular, we calculate the ac-count balances of people of a similar age, income, and savings rate. Toavoid the issue of multiple 401(k) accounts per individual, we selectonly those who remained with the same employer through their career.As to savings and investment choices, we assume that employees aresaving 4 percent in the 401(k) plan when they join the SMarT plan andthat saving rates are capped at 14 percent. We also assume that theemployer matches the employee’s contributions at a 50 percent rate onthe first 6 percent of employee contributions, as was true in the firmwe studied. For other financial assets, we assume that non-401(k) em-ployee savings are half the existing balance in the 401(k) account, onthe basis of data from John Hancock Financial Services (the Sixth De-fined Contribution Plan Survey [1999]). Finally, we assume that em-ployees choose a portfolio mix of 60 percent stocks and 40 percentbonds. The particular company in our study does not sponsor a defined-benefit pension, so we assumed no pension benefits. Finally, we assumedthe statutory benefits from social security. We then use software providedby Financial Engines to estimate the distribution of retirement incomethat can be expected on the basis of these assumptions. The FinancialEngines software provides several points on a probability distributionof retirement income. We use the fiftieth percentile of this distributionto compute expected income replacement rates, that is, the ratio ofretirement income to preretirement income.
Table 6 reports retirement income replacement rates for various ageand income combinations. The issue of savings adequacy is well studiedby economists, but there is no agreement on a single number as theappropriate replacement rate (see Boskin and Shoven [1987], Bernheim[1993], and Gustman and Steinmeier [1998] for discussions of this is-sue). Still, most economists writing on this issue consider replacementrates near 100 percent adequate and judge replacement rates below 70percent to be too low.14
Panel A of table 6 shows the expected income replacement rates forour employees before they join the SMarT plan, all of which are between
14 One might think that a 100 percent replacement rate would be too high, suggestingthat agents are very patient. However, survey evidence suggests that households desire anincreasing consumption profile. Laibson (1999) offers a cogent discussion of this issueand reports that economists also prefer rising profiles for themselves. If agents want arising profile, then even a 100 percent replacement rate may be too low.

S182 journal of political economy
TABLE 6Median Income Replacement Ratios (%)
Income
Age
25 35 45 55
A. Pre-SMarT
$25,000 57 57 56 55$50,000 51 51 51 54$75,000 48 49 46 43
B. Post-SMarT
$25,000 108 90 75 63$50,000 98 83 70 62$75,000 90 77 63 50
Note.—The table displays the median income replacement ratios for differentage and income profiles, using investment advice software by Financial Engines. Theprojections are based on the following assumptions: no defined-benefit pension,statutory social security benefits, employee saving rate of 4 percent before SMarTand 14 percent thereafter, employer match of 50 cents on the dollar up to 6 percent,portfolio mix of 60 percent stocks and 40 percent bonds, and retirement age of 65.
43 and 57 percent. Replacement rates are highest for the $25,000 in-come category because social security offers substantial replacement atthat level. Panel B shows that replacement income rates are considerablyhigher with the SMarT plan, especially for those joining the plan whenyoung. Obviously, increasing the savings rate is less effective when onestarts at 55 than at 25. Still, expected replacement rates exceed 100percent in just one cell (108 percent replacement for those making$25,000 per year who join the plan at age 25), so there does not appearto be evidence that we have induced people to save too much. Fur-thermore, if the stock market returns are exceptionally high, workersnearing retirement can always reduce savings rates or plan an earlierretirement if they have higher retirement benefits than they expected.
V. The Potential Effect of SMarT on the U.S. Personal SavingsRate
The U.S. personal savings rate is currently close to zero. Some macro-economists consider this rate too low and have advocated governmentintervention to increase the savings rate. We do not take any stand onwhether such policies are good for the economy but, instead, ask adifferent question. If it were desirable to increase the personal savingsrate, could widespread adoption of the SMarT plan make a substantialcontribution to meeting this goal?
To determine the potential impact of widespread adoption of SMarT,we begin by characterizing how much employees are saving now in their401(k) plans. To do so, we utilize a data set from Hewitt Associates thatincludes demographic and account balance information on the partic-

behavioral economics S183
ipants in 15 large companies, covering a total of 539,516 employees.On the basis of comparisons with data from Fidelity (a 2001 report oncorporate defined-contribution plans) and John Hancock Financial Ser-vices (the 1999 Sixth Defined Contribution Plan Survey), two other large401(k) service providers, we believe that our sample is representativeof employees who work for large companies. Consequently, we thinkthat it can serve as a basis for some rough estimates on the potentialcontribution SMarT can make to increasing employee savings rates.
Starting from the baseline behavior we observe now, we make cal-culations of changes in savings rates over a 10-year period for variousimplementation strategies. Specifically, we consider three hypotheticalimplementation strategies, each matched with increases in the savingsrate of 1, 2, or 3 percent per year, giving us nine configurations toexamine. We start each plan at a 5 percent savings rate, approximatelythe average in the Hewitt data. We then simulate the impact of addingspecific implementations of SMarT. In all the simulations, we assumethat 5 percent of enrollees drop out of SMarT each year, leaving theirsavings rate at the level they had obtained up to that point.
The first two implementation strategies we consider are based on theexperiences we have had in the implementations described above. PlanA is based on the first implementation, which used one-on-one inter-actions with a financial consultant. On the basis of the results in thatcompany, we assume that 80 percent of those who are currently partic-ipating in the savings program will join the SMarT plan, and half ofthose who are not enrolled will join. Plan B is based on the experienceat Ispat, where the SMarT plan was marketed to employees only with asingle direct-mail campaign rather than personal contact. This approachis much less costly but is also less effective in reaching potential en-rollees. In this scenario, we project 20 percent enrollment rates for thosecurrently in the savings plan and 10 percent for those who are notcurrently saving anything.
Plan C is to combine the SMarT program with automatic enrollment.Specifically, we assume that all employees would be enrolled in theSMarT plan unless they opted out. Those who are not currently partic-ipating in the 401(k) plan would be enrolled, and their initial savingrate would be the savings incremental rate (i.e., 1, 2, or 3 percent). Onthe basis of our experience and that of Madrian and Shea (1999) andChoi et al. (in press), for plan C we estimate that 90 percent of theemployees would join the program in this design (i.e., only 10 percentwould opt out). The saving rates we report are weighted by income,and they are averaged across all employees (whether or not they aresaving). Hence, the reported rates represent the average savings perdollar of income.15
15 For simplicity, our calculations exclude the effects of employer contributions and

S184 journal of political economy
TABLE 7Projected Saving Rates (%)
SMarT AnnualIncrements (%)
Projected Saving Rates with SMarT in Year (%)
0 1 2 3 4 5 10
A. One-on-One Interaction with a Financial Consultant
1 5.0 5.6 6.2 6.7 7.2 7.6 9.22 5.0 6.2 7.3 8.2 9.0 9.7 11.93 5.0 6.8 8.3 9.5 10.6 11.4 12.9
B. One-Shot Mailing
1 5.0 5.2 5.3 5.4 5.5 5.6 6.02 5.0 5.3 5.6 5.8 6.0 6.1 6.73 5.0 5.4 5.8 6.1 6.3 6.5 6.9
C. Automatic Enrollment
1 5.0 5.8 6.4 7.1 7.7 8.2 10.22 5.0 6.5 7.8 8.9 10.0 10.9 13.73 5.0 7.2 9.0 10.6 11.9 13.0 15.0
The results of our projections are displayed in table 7. As of year end2000, the saving rate in the Hewitt sample averaged 5.0 percent, lessthan a third of the allowable IRS deferrals, which averaged 17.7 percentfor our sample.16 This means that there is considerable opportunity forthe SMarT program to increase the saving rate. With plan A, which usesone-on-one interaction with a financial consultant and the 2 percentper year rate of increase, the SMarT program could boost the overallsaving rate from 5.0 percent to 9.7 percent within five years (see panelA). When one switches to the cheaper method of one-shot mailing, theeffects are much smaller (see panel B). For instance, over the courseof five years, the saving rate would increase from 5.0 percent to 6.1percent. But if employees were automatically enrolled in the program,as in plan C, the average saving rate is projected to increase from 5.0percent to 10.9 percent within five years (see panel C).
How large is the potential increase in saving rates? In terms of dollars,we calculate that each one-percentage-point increase in the employeesaving rate would translate into $250 million of additional annual con-tributions for the Hewitt sample. Extrapolating from our sample of halfa million individuals to the universe of 50–60 million individuals withaccess to 401(k) plans, we estimate roughly $25 billion of additionalannual contributions for each 1 percent increase. So if a 5 percent
employee turnover. These omissions create biases in opposite directions. On one hand,including employer contributions would increase the estimated effect of the SMarT pro-gram because increased employee contributions will often trigger higher employer con-tributions. On the other hand, employee turnover is likely to decrease the effect of theSMarT program unless the employee moves to another firm with the SMarT plan in effect.
16 The IRS limit for the year 2000 was the lower of $10,500 or 25 percent of income.

behavioral economics S185
increase were obtained, this would increase personal saving by $125billion per year. Percentage-wise, this would amount to 1.5 percent ofdisposable personal income (data from the National Income and Prod-uct Accounts: Personal Income and Its Disposition: http://www.bea.doc.gov/briefrm/tables/ebr6.htm). Since the current personal savingsrate is hovering near zero, this is a substantial increase. Furthermore,in contrast to other approaches to increasing the employee savings rate,such as increasing the maximum allowable contribution, much of thegains from the SMarT program come from those who are saving littleor nothing now. This means that the increase can be presumed to bevirtually all “new” savings, as opposed to substitution from other (pos-sibly taxable) forms.
VI. Conclusions
The initial experience with the SMarT plan has been quite successful.Many of the people who were offered the plan elected to use it, and amajority of the people who joined the SMarT plan stuck with it. Con-sequently, in the first implementation, for which we have data for fourannual raises, SMarT participants almost quadrupled their saving rates.Of course, one reason why the SMarT plan works so well is that inertiais so powerful. Once people enroll in the plan, few opt out. The SMarTplan takes precisely the same behavioral tendency that induces peopleto postpone saving indefinitely (i.e., procrastination and inertia) andputs it to use. As the financial consultant involved in the first imple-mentation has noted, in hindsight it would have been better to offerthe SMarT plan to all participants, even those who were willing to maketheir initial savings increase more than the first step of the SMarT plan.Very few of these eager savers ever got around to changing their savingsallocations again, whereas the SMarT plan participants were alreadysaving more than they were after just 16 months (see table 2)
Some economists have criticized practices such as automatic enroll-ment and the SMarT plan on the grounds that they are paternalistic, aterm that is not meant to be complimentary. We agree that these plansare paternalistic, but since no coercion is involved, they constitute whatSunstein and Thaler (2003) call “libertarian paternalism.”17 Libertarianpaternalism is a philosophy that advocates designing institutions thathelp people make better decisions but do not impinge on their freedomto choose. Automatic enrollment is a good example of libertarian pa-ternalism. Notice that firms must decide what happens to employeeswho take no action with respect to joining the savings plan. Traditionally,employees who did nothing were presumed not to want to join the plan.
17 For a brief summary of this idea, see Thaler and Sunstein (2003).

S186 journal of political economy
Automatic enrollment simply changes that presumption. Neither ar-rangement infringes on choice (so both are libertarian), but one pro-duces higher savings rates and so might be considered paternalistic. TheSMarT plan is even less intrusive than automatic enrollment since par-ticipants have to take some action to enroll, and it is even more suc-cessful at getting people to save. So, we plead guilty to the charge oftrying to be paternalistic, but since we are striving for libertarian pa-ternalism, we do not think that it should be considered objectionable.
Finally, we hope that this study serves as a valid reply to two frequentcritiques of behavioral economics: the reliance on laboratory studiesusing modest stakes and the ex post explanation of anomalous facts,drawing on what is alleged to be a limitless store of potential behavioralexplanations. Here, we have used behavioral principles to design a planto increase savings rates and tested the idea in the real world.
References
Ainslie, George. 1975. “Specious Reward: A Behavioral Theory of Impulsivenessand Impulse Control.” Psychological Bull. 82 (4): 463–96.
Ameriks, John, and Stephen Zeldes. 2000. “How Do Household Portfolio SharesVary with Age?” Working paper. New York: Columbia Univ.
Bernheim, B. Douglas. 1993. Is the Baby Boom Generation Preparing Adequately forRetirement? Plainsboro, N.J.: Merrill Lynch.
Bernheim B. Douglas, Daniel M. Garrett, and Dean M. Maki. 1997. “Educationand Saving: The Long-Term Effects of High School Financial CurriculumMandates.” Working Paper no. 6085 (July). Cambridge, Mass.: NBER.
Boskin, Michael J., and John B. Shoven. 1987. “Concepts and Measures of Earn-ings Replacement during Retirement.” In Issues in Pension Economics, editedby Zvi Bodie, John B. Shoven, and David A. Wise. Chicago: Univ. ChicagoPress (for NBER).
Choi, James J., David Laibson, Brigitte Madrian, and Andrew Metrick. In press.“For Better or for Worse: Default Effects and 401(k) Savings Behavior.” InPerspectives on the Economics of Aging, edited by David A. Wise. Chicago: Univ.Chicago Press (for NBER).
Choi, James J., David Laibson, and Andrew Metrick. 2000. “Does the InternetIncrease Trading? Evidence from Investor Behavior in 401(k) Plans.” WorkingPaper no. 7878 (September). Cambridge, Mass.: NBER.
Duflo, Esther, and Emmanuel Saez. 2000. “Participation and Investment Deci-sions in a Retirement Plan: The Influence of Colleagues’ Choices.” Workingpaper. Cambridge: Massachusetts Inst. Tech.
Farkus, Steve, and Jean Johnson. 1997. Miles to Go: A Status Report on Americans’Plans for Retirement. New York: Public Agenda.
Gustman, Alan L., and Thomas L. Steinmeier. 1998. “Effects of Pensions onSavings: Analysis with Data from the Health and Retirement Study.” WorkingPaper no. 6681 (August). Cambridge, Mass.: NBER.
Kahneman, Daniel, Jack L. Knetsch, and Richard H. Thaler. 1986. “Fairness asa Constraint on Profit Seeking: Entitlements in the Market.” A.E.R. 76 (Sep-tember): 728–41.
behavioral economics S187
———. 1990. “Experimental Tests of the Endowment Effect and the CoaseTheorem.” J.P.E. 98 (December): 1325–48.
Laibson, David I. 1997. “Golden Eggs and Hyperbolic Discounting.” Q.J.E. 112(May): 443–77.
———. 1999. Discussion of “The Adequacy of Household Saving” by Eric Engen,William Gale, and Cori Uccello. Brookings Papers Econ. Activity, no. 2, pp. 174–77.
Loewenstein, George, and Jon Elster, eds. 1992. Choice over Time. New York: Sage.Madrian, Brigitte C., and Dennis Shea. 1999. “The Power of Suggestion: An
Analysis of 401(k) Participation and Saving Behavior.” Working paper. Chi-cago: Univ. Chicago, Grad. School Bus.
O’Donoghue, Ted, and Matthew Rabin. 1999. “Doing It Now or Later.” A.E.R.89 (March): 103–24.
———. 2001. “Choice and Procrastination.” Q.J.E. 116 (February): 121–60.Raiffa, Howard. 1982. The Art and Science of Negotiation. Cambridge Mass.: Harvard
Univ. Press.Samuelson, William, and Richard J. Zeckhauser. 1988. “Status Quo Bias in De-
cision Making.” J. Risk and Uncertainty 1 (March): 7–59.Shafir, Eldar, Peter Diamond, and Amos Tversky. 1997. “Money Illusion.” Q.J.E.
112 (May): 341–74.Shefrin, Hersh M., and Richard H. Thaler. 1988. “The Behavioral Life-Cycle
Hypothesis.” Econ. Inquiry 26 (October): 609–43.Sunstein, Cass R., and Richard H. Thaler. 2003. “Libertarian Paternalism Is Not
an Oxymoron.” Univ. Chicago Law Rev. 70 (Fall): 1159–99.Strotz, Robert H. 1955. “Myopia and Inconsistency in Dynamic Utility Maximi-
zation.” Rev. Econ. Studies 23 (3): 165–80.Thaler, Richard H. 1981. “Some Empirical Evidence on Dynamic Inconsistency.”
Econ. Letters 8 (3): 201–7.Thaler, Richard H., and Hersh M. Shefrin. 1981. “An Economic Theory of Self-
Control.” J.P.E. 89 (April): 392–406.Thaler, Richard H., and Cass R. Sunstein. 2003. “Libertarian Paternalism.” A.E.R.
Papers and Proc. 93 (May): 175–79.Tversky, Amos, and Daniel Kahneman. 1992. “Advances in Prospect Theory:
Cumulative Representation of Uncertainty.” J. Risk and Uncertainty 5 (October):297–323.