santa ana unified school district -...
TRANSCRIPT

Joel D. MonteroChief Executive Officer
Special Education ReviewMarch 31, 2016
Santa Ana Unified School District

Fiscal crisis & ManageMent assistance teaM

March 31, 2016
Rick Miller, Ph.D., SuperintendentSanta Ana Unified School District1601 East Chestnut Avenue Santa Ana, CA 92701-6322
Dear Superintendent Miller:In August 2015, the Santa Ana Unified School District and the Fiscal Crisis and Management Assistance Team (FCMAT) entered into an agreement for a review of the district’s special education programs and services. Specifically, the agreement states that FCMAT will perform the following:
1. Review whether the district provides a continuum of special education and related services; include an analysis of the least restrictive environment.
2. Analyze special education teacher staffing ratios and class and caseload sizes using the statutory requirements for mandated services and statewide guidelines.
3. Review the efficiency of paraeducator staffing, including 1-to-1 paraeducators. Analyze the procedures for identifying the need for instructional aides, and the process for monitoring the resources for allocating paraeducator, and determining the need for continuing support from year to year. Provide recommendations to improve the efficiency of staffing.
4. Provide an analysis of all staffing and caseloads for related service providers including speech therapists, psychologists, occupational/physical therapists, behavior specialists, adaptive physical education teachers, credentialed nurses and others.
5. Review the district’s Medi-Cal LEA revenues and allocations and make recommen-dations to increase efficiencies.
6. Review special education department staffing and organization in the district’s central office, including staffing comparisons, to ensure that clerical and admin-istrative support, programs, and overall functionality are aligned with those of districts of comparable size and structure. The team will compare the district’s special education staffing and organization with that of three to six similarly-sized districts using the Ed Data website, or six districts selected by the district.
Fiscal crisis & ManageMent assistance teaM
7. Review the district’s implementation of Student Success Team (SST) and Response to Intervention (Rtl) and provide recommendations as needed.
8. Determine whether the district is over identifying students for special educa-tion services compared to the statewide average identification rate, and make recommendations for reducing over identification if needed.
9. Determine the district’s general education fund contribution to special educa-tion and make recommendations for greater efficiency.
This report contains the study team’s findings and recommendations.
We appreciate the opportunity to serve you and we extend thanks to all the staff of the Santa Ana Unified School District for their cooperation and assistance during fieldwork.
Sincerely
Joel D. MonteroChief Executive Officer

santa ana unified school district
iT A B L E O F C O N T E N T S
Table of ContentsAbout FCMAT ......................................................................................... iii
Introduction ............................................................................................ 1
Executive Summary .............................................................................. 3
Findings and Recommendations ..................................................... 5
Special Education Program and Services ............................................... 5
Staffing and Caseloads ................................................................................. 9
Related Service Provider Caseloads ....................................................... 13
Instructional Assistants .............................................................................. 19
Medi-Cal LEA .................................................................................................23
Organizational Structure ........................................................................... 27
Response to Interventions ........................................................................29
Identification Rate ........................................................................................ 31
Fiscal Efficiencies .......................................................................................... 33
Appendices ...........................................................................................39

Fiscal crisis & ManageMent assistance teaM
ii

santa ana unified school district
iiiA B O U T F C M A T
About FCMATFCMAT’s primary mission is to assist California’s local K-14 educational agencies to identify, prevent, and resolve financial, human resources and data management challenges. FCMAT provides fiscal and data management assistance, professional development training, product development and other related school business and data services. FCMAT’s fiscal and manage-ment assistance services are used not just to help avert fiscal crisis, but to promote sound financial practices, support the training and development of chief business officials and help to create efficient organizational operations. FCMAT’s data management services are used to help local educational agencies (LEAs) meet state reporting responsibilities, improve data quality, and inform instructional program decisions.
FCMAT may be requested to provide fiscal crisis or management assistance by a school district, charter school, community college, county office of education, the state Superintendent of Public Instruction, or the Legislature.
When a request or assignment is received, FCMAT assembles a study team that works closely with the LEA to define the scope of work, conduct on-site fieldwork and provide a written report with findings and recommendations to help resolve issues, overcome challenges and plan for the future.
FCMAT has continued to make adjustments in the types of support provided based on the changing dynamics of K-14 LEAs and the implementation of major educational reforms.
92/93 93/94 94/95 95/96 96/97 97/98 98/99 99/00 00/01 01/02 02/03 03/04 04/05 05/06 06/07 07/08 08/09 09/10 10/11 11/12 12/13 13/14 14/15
90
80
70
60
50
40
30
20
10
0
Studies by Fiscal Year
Num
ber o
f Stu
dies
FCMAT also develops and provides numerous publications, software tools, workshops and professional development opportunities to help LEAs operate more effectively and fulfill their fiscal oversight and data management responsibilities. The California School Information Services (CSIS) division of FCMAT assists the California Department of Education with the implementation of the California Longitudinal Pupil Achievement Data System (CALPADS) and also maintains DataGate, the FCMAT/CSIS software LEAs use for CSIS services. FCMAT was created by Assembly Bill (AB) 1200 in 1992 to assist LEAs to meet and sustain their financial obligations. AB 107 in 1997 charged FCMAT with responsibility for CSIS and its statewide data management work. AB 1115 in 1999 codified CSIS’ mission.
Fiscal crisis & ManageMent assistance teaM
iv A B O U T F C M A T
AB 1200 is also a statewide plan for county offices of education and school districts to work together locally to improve fiscal procedures and accountability standards. AB 2756 (2004) provides specific responsibilities to FCMAT with regard to districts that have received emergency state loans.
In January 2006, Senate Bill 430 (charter schools) and AB 1366 (community colleges) became law and expanded FCMAT’s services to those types of LEAs.
Since 1992, FCMAT has been engaged to perform more than 1,000 reviews for LEAs, including school districts, county offices of education, charter schools and community colleges. The Kern County Superintendent of Schools is the administrative agent for FCMAT. The team is led by Joel D. Montero, Chief Executive Officer, with funding derived through appropriations in the state budget and a modest fee schedule for charges to requesting agencies.

santa ana unified school district
1I N T R O D U C T I O N
Introduction
BackgroundThe Santa Ana Unified School District covers approximately 27 square miles and serves the city of Santa Ana, which has a population of 335,264. The district is the sixth largest in California, and the largest in Orange County, serving approximately 56,815 students grades in preschool through 22 years of age. Of these, 6,098 are identified with special needs.
The district includes 36 elementary schools, nine intermediate schools, seven high schools, three alternative schools, one special school, and five charter schools with an operating budget of $505.1 million dollars. Approximately 60% of district students are English learners, and approxi-mately 91% are eligible for free and reduced-price meals.
All school districts and county school offices in the state are required to belong to a special educa-tion local plan area (SELPA) to address the needs of disabled children. All SELPAs have the same basic goal of delivering high-quality special education programs and services to these students in the most effective, efficient, and cost-effective manner feasible. In general, there are two types of SELPAs. The single-district SELPA serves one district that may be unified or nonunified. This SELPA generally operates within the district’s administrative structure. It also operates all of the district’s special education programs as well as providing the functions of the SELPA. The second type is a multidistrict SELPA, which may or may not operate programs along with providing SELPA functions. The Santa Ana Unified School District is a single-district SELPA and therefore is required to operate a continuum of programs to meet the needs of students from birth to age 22.
In August 2015, the district requested that FCMAT review its special education programs and services in an effort to increase efficiencies in the program and district.
Study and Report GuidelinesFCMAT visited the district on January 26-28, 2016 to conduct interviews, collect data and review documents. This report is the result of those activities and is divided into the following sections:
• Executive Summary
• Special Education Program and Services
• Staffing and Caseloads
• Instructional Assistants
• Related Service Provider Caseloads
• Medi-Cal LEA
• Organizational Structure
• Response to Intervention
• Identification Rate
• Fiscal Efficiencies
• Appendices
Fiscal crisis & ManageMent assistance teaM
2 I N T R O D U C T I O N
In writing its reports, FCMAT uses the Associated Press Stylebook, a comprehensive guide to usage and accepted style that emphasizes conciseness and clarity. In addition, this guide empha-sizes plain language, discourages the use of jargon and capitalizes relatively few terms.
Study TeamThe study team was composed of the following members:
William P. Gillaspie, Ed.D. Jackie Kirk-Martinez, Ed.D.FCMAT Deputy Administrative Officer FCMAT ConsultantSacramento, CA Pismo Beach, CA
Leonel Martínez Don DennisonFCMAT Technical Writer FCMAT ConsultantBakersfield, CA Arroyo Grande, CA
Sandee Kludt, Ed.D. Pamela BlattFCMAT Consultant FCMAT ConsultantStockton, CA Napa, CA
JoAnn MurphyFCMAT ConsultantSantee, CA
santa ana unified school district
3E X E C U T I V E S U M M A R Y
Executive SummaryThe Individuals with Disabilities Education Act (IDEA) is a federal law ensuring services to disabled children throughout the nation. IDEA governs how states and public agencies provide early interventions, special education and related services to all eligible infants, toddlers (preschoolers), children, and youth with disabilities up to age 22. A review of data and staff interviews indicates the Santa Ana Unified School District provides special education services to students from preschool age through the 12th grade. The district has improved its options to provide services within the least restrictive environment; however, no strategic planning was completed with school site and district staff to redesign the program delivery model. Staff reported concerns that the availability of “blended” programs at the secondary level sometimes drives the IEP rather than the needs of the student driving placement and services.
Santa Ana Unified has a district-adopted guideline for class size ratios. The guidelines are used at the beginning of the year to staff classes and are based on keeping the overall staff-to-student ratios to similar levels within a grade range, for example elementary, intermediate, and high school. Some industry standards and Education Codes differ from district guidelines, and Santa Ana Unified does not have a formalized and/or consistent process to add or reduce classes.
A review of related service providers caseloads and staffing was completed, but the documents remain inconsistent within the district. Santa Ana Unified lacks a formalized and comprehensive tracking system for speech services and caseload monitoring. The district also employs speech and language assistants and certified occupational therapist assistants who cannot decrease actual caseloads. These positions are an added cost to the budget.
Staff reported that the district has a procedure for identifying the need for instructional aides or for monitoring the use of aides in the classroom. The number of aides assigned to each classroom is based on district guidelines and used to maintain a specific number of aides per teacher depending on the number of students assigned to the teacher and the category of the class such as the disability category. The district is overstaffed in instructional assistants.
The district is understaffed in administrative positions compared to other single-district SELPAs of comparable size. While all SELPAs have a SELPA director/director, Santa Ana Unified is the only district that has combined the SELPA/Special Education Department with the responsibility of Student Services. For purposes of this study, FCMAT has only analyzed the special education administrative and clerical structure.
The district’s multitiered system of support (MTSS) team designed and organized critical profes-sional development for the district in the five areas of the MTSS core structure. The student success team (SST) process was fully redesigned. A system of universal screening was established and operates consistently in the elementary system. The district is working to implement a districtwide culture of Positive Behavioral Interventions and Supports (PBIS). Other key facets of implementation have been developed. However, the district has indicated this has not resulted in the overall outcomes desired.
The special education identification rate for district-of-residence students with disabilities is 10.73%, which exceeds the statewide average by 0.7%. The estimated cost of this overidentifi-cation is $3,572,050. A report entitled “Santa Ana Unified School District Report on Special Education Services” completed by Jack Lucas in December 2015 compares the district and the state of California in three areas of significant growth. By comparing state and district pupil counts from December 2014, he found that the district’s growth in the area of autism, emotional

Fiscal crisis & ManageMent assistance teaM
4 E X E C U T I V E S U M M A R Y
disturbance and speech and language issues parallels the state. This was the largest six-year increase over a total of 15 years.
The district’s general fund contribution based on the maintenance-of-effort (MOE) documents provided to FCMAT was $37,602,864.75 or 37.9% in 2013-14 and $41,750,974 or 39.5% in 2014-15. The district’s 2015-16 projection expenditures budget for special education is $106,622,355 based on the MOE document provided to FCMAT. The district’s general fund contribution is projected to be $52,073,327, which is 48.8%% of the special education budget. The statewide average is 43%. Staff indicated that communication and openness regarding the budget is a concern. Staff does not know the amount of the special education budget or the staff and items charged to it. Staff indicated the budget is rolled from one year to the next, and the use of available resources is not evaluated.
No one takes ownership of the special education budget or accountability. The Special Education, Business and Human Resources departments do not meet regularly.
santa ana unified school district
5S P E C I A L E D U C A T I O N P R O G R A M S A N D S E R V I C E S
Findings and Recommendations
Special Education Programs and ServicesThe Individuals with Disabilities Education Act (IDEA) is a federal law ensuring services to disabled children throughout the nation. IDEA governs how states and public agencies provide early interventions, special education and related services to all eligible infants, toddlers (preschoolers), children, and disabled youth up to age 22. Further, each state must ensure that a free appropriate public education (FAPE) is available to any individual disabled child who needs special education and related services even though the child has not failed or been retained in a course or grade and is advancing from grade level to grade level (34 CFR 300.101(c)).
A review of data and staff interviews indicates the district provides special education services to students from preschool age through 12th grade. In California, a child receiving services under IDEA’s Part C and eligible for services under Part B must have an individualized education program (IEP) created and implemented by the time he or she turns three years old. Preschool program staff reported the district has regular meetings with the regional center (the agency that provides early intervention services) regarding transition from Part C to Part B of the IDEA. An effective and smooth transition is an essential part of the IDEA, and the district has procedures to accomplish this. The district provides services for infants, which supports continuity of service and effective communication regarding student needs in the IEP process.
State and federal laws mandate that students have the opportunity to be educated in a general education setting with their nondisabled peers, also known as the least restrictive environment (LRE), to the greatest extent possible. Compliance with this mandate is measured by the percentage of time a student is removed from the general education classroom and placed in a special education setting.
The U.S. Department of Education, Office of Special Education Programs has provided the California Department of Education (CDE) Special Education Division with guidance and instructions on developing calculations to measure progress toward meeting the LRE provision of IDEA. Targets and corresponding benchmarks have been established in the State Performance plan for IDEA 2004. The three measures are as follows:
A. In a regular class 80% or more of the day
B. In a regular class less than 40% of the day
C. In separate schools, residential facilities or homebound/hospital placement
D. The table below from CDE indicates that the district has not met the LRE goals. Students with special needs spend more time in specialized classrooms than general education class
Fiscal crisis & ManageMent assistance teaM
6 S P E C I A L E D U C A T I O N P R O G R A M S A N D S E R V I C E S
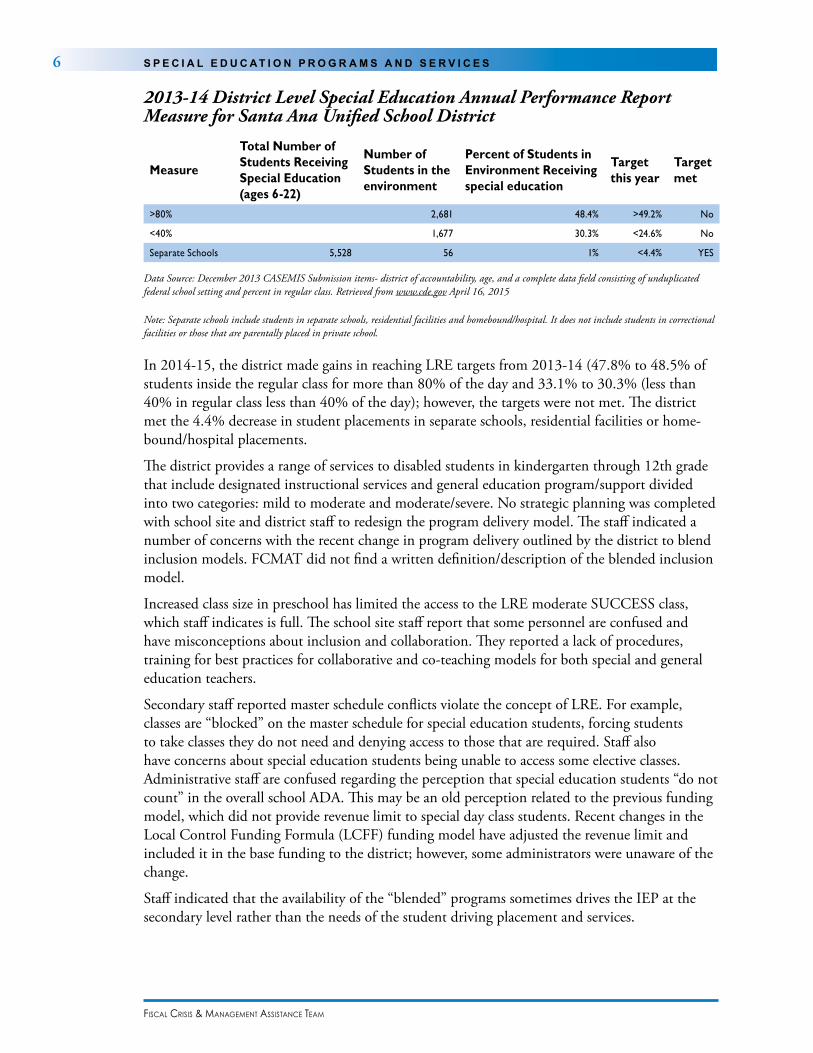
2013-14 District Level Special Education Annual Performance Report Measure for Santa Ana Unified School District
Measure
Total Number of Students Receiving Special Education (ages 6-22)
Number of Students in the environment
Percent of Students in Environment Receiving special education
Target this year
Target met
>80% 2,681 48.4% >49.2% No
<40% 1,677 30.3% <24.6% No
Separate Schools 5,528 56 1% <4.4% YES
Data Source: December 2013 CASEMIS Submission items- district of accountability, age, and a complete data field consisting of unduplicated federal school setting and percent in regular class. Retrieved from www.cde.gov April 16, 2015
Note: Separate schools include students in separate schools, residential facilities and homebound/hospital. It does not include students in correctional facilities or those that are parentally placed in private school.
In 2014-15, the district made gains in reaching LRE targets from 2013-14 (47.8% to 48.5% of students inside the regular class for more than 80% of the day and 33.1% to 30.3% (less than 40% in regular class less than 40% of the day); however, the targets were not met. The district met the 4.4% decrease in student placements in separate schools, residential facilities or home-bound/hospital placements.
The district provides a range of services to disabled students in kindergarten through 12th grade that include designated instructional services and general education program/support divided into two categories: mild to moderate and moderate/severe. No strategic planning was completed with school site and district staff to redesign the program delivery model. The staff indicated a number of concerns with the recent change in program delivery outlined by the district to blend inclusion models. FCMAT did not find a written definition/description of the blended inclusion model.
Increased class size in preschool has limited the access to the LRE moderate SUCCESS class, which staff indicates is full. The school site staff report that some personnel are confused and have misconceptions about inclusion and collaboration. They reported a lack of procedures, training for best practices for collaborative and co-teaching models for both special and general education teachers.
Secondary staff reported master schedule conflicts violate the concept of LRE. For example, classes are “blocked” on the master schedule for special education students, forcing students to take classes they do not need and denying access to those that are required. Staff also have concerns about special education students being unable to access some elective classes. Administrative staff are confused regarding the perception that special education students “do not count” in the overall school ADA. This may be an old perception related to the previous funding model, which did not provide revenue limit to special day class students. Recent changes in the Local Control Funding Formula (LCFF) funding model have adjusted the revenue limit and included it in the base funding to the district; however, some administrators were unaware of the change.
Staff indicated that the availability of the “blended” programs sometimes drives the IEP at the secondary level rather than the needs of the student driving placement and services.
santa ana unified school district
7S P E C I A L E D U C A T I O N P R O G R A M S A N D S E R V I C E S
RecommendationsThe district should:
1. Continue to adhere to district procedures for the transition of students receiving services under Part C and eligible for services under Part B of IDEA.
2. Provide clear program criteria for the least restrictive environment.
3. Develop a strategic plan for special education that defines LRE and program delivery and that includes representatives from all affected groups: teachers, specialists, administrators, parents etc.
4. Develop an implementation guide to ensure that critical elements of the strategic plan are implemented.
5. Provide training and support on co-teaching models for general education and special education teachers.
6. Provide training for site administrators on LRE and the mandate for inclu-sion that includes equal access to master school classes based on need not availability.
7. Provide training to site administrators on the LCFF funding model as it relates to special education revenue limit.

Fiscal crisis & ManageMent assistance teaM
8 S P E C I A L E D U C A T I O N P R O G R A M S A N D S E R V I C E S

santa ana unified school district
9S T A F F I N G A N D C A S E L O A D S
Staffing and CaseloadsThe district maintains caseloads and class sizes of all service providers and teachers, which includes lists by school, teacher full-time equivalencies (FTEs), class caseloads, and aide hours. Teachers and aides are designated as mild/moderate (MM) or moderate/severe (MS) personnel.
The district adopted a guideline for class size ratios. These guidelines are used at the beginning of the year to staff classes based on the premise of working to keep overall staff-to-student ratios similar within a grade range for example elementary, intermediate, and high school. The guidelines also establish teacher and aide ratios based on number of students in various categories of moderate and severe programs. In some cases, the guidelines provide for three instructional aides per classroom, which is above industrial standards of one six-hour aide position for MM classrooms and two six-hour aide positions for MS classrooms. Staff also indicated that at the start of the school year, teacher-to-student ratios are within ranges that are sometimes below their guidelines and/or industry standards. Class size ratios are consistently evaluated throughout the year. The union contract allows for a class size problem resolution committee at each level such as elementary, intermediate, and high school. This committee studies and suggests methods of relief to reduce grade split classes, decrease the impact of low-enrollment classes, and allow for large group experimental instruction and team teaching.
The district has begun to run blended programs. These programs mix RSP and SDC students under one caseload and service deliver. The caseloads and staffing ratios analyzed included MM blended programs and MS special day classes including classes offered for students with autism, emotional disturbance, deafness and hardness of hearing, and students of preschool and transi-tional age (18-22).
The Education Code does not include maximum caseloads for MM blended programs or MS classes although there are industry standards throughout the California for these classes. The district has decided to operate MM programs referred to as the blended programs rather than using resource specialist positions and special day class positions for mild to moderately disabled students. According to the district guidelines, blended class caseloads are not to exceed 28 students and are staffed with one special education teacher and one student support personnel at 3.75 hours.
Staff reported that in some cases, blended programs do not meet student needs because some students require more assistance than the locally adopted caseload of 1-to-28. In addition, the 3.75 hours of aide time do not always allow appropriate coverage, particularly at the high school level, for inclusive practices to succeed. Staff indicated that some teachers are not comfortable with the combined classroom structure and require additional training in accessing curriculum and support for students in the general education programs.
MM classrooms range from 18 to 25 and therefore operate below the adopted guideline of 1-to-28. The following chart depicts the caseload average for MM programs.

Fiscal crisis & ManageMent assistance teaM
10 S T A F F I N G A N D C A S E L O A D S
Mild-Moderate Caseloads Total Teacher FTE Total Students Ratio District Guideline Ratio Elem 108 1,956 1:18.1 Caseloads not to exceed 28
Intermediate 47.5 1,065 1:22.4 Caseloads not to exceed 28
Secondary 64.5 1,295 1:20 Caseloads not to exceed 28
Transition 3 75 1:25 Caseloads not to exceed 28
Total/Average 223 4,391 1:19.7 Caseloads not to exceed 28
Source: District provided data
The pre-K population receives services at Mitchell and other sites nearby and is divided into MM and MS classes. The MM pre-K population operates above industry standards at an average caseload of 1-to-17 as depicted in the chart below.
Mild to Moderate Pre-K Caseloads
Total Teacher FTE
Total Students
Total Ratio
Industry Standards(FTE to Student Caseload)
Mitchell and other Pre-K sites 14 242 1:17.3 1-to-12-15
Source: District provided data
The MS classes operate within industry standards in the moderate to severe, deaf and hard of hearing, and autism classrooms. The emotionally disturbed (ED) and moderate to severe Pre K classes operate slightly below, and the transition classes operate slightly above. The following charts compares the caseload average for MS programs and compares with industry standards.
Moderate to Severe Caseloads
Total Teacher FTE
Total Students Ratio
Industry Standards (FTE toStudent Caseload)
Elem 16 149 1:9.3 Caseloads not to exceed 10-12
Intermediate 9 105 1:11.6 Caseloads not to exceed 10-12
Secondary 8 94 1:11.8 Caseloads not to exceed 10-12
Transition 6 76 1: 12.7 Caseloads not to exceed 10-12
Total/Average 39 424 1:10.8 Caseloads not to exceed 10-12
Source: District provided data
Moderate to Severe Caseloads
Total Teacher FTE
Total Students
Total Ratio District Guideline Ratio
Pre-K 13 129 1:9.9 Caseloads not to exceed 10-12
ED Caseloads Total Teacher FTE Total Students Ratio
Industry Standards (FTE toStudent Caseload)
Elem 3 18 1:6 Caseloads not to exceed 8-10
Intermediate 2 18 1:9 Caseloads not to exceed 8-10
Secondary 4 27 1:6.8 Caseloads not to exceed 8-10
Total/Average 9 63 1: 7 Caseloads not to exceed 8-10
Source: District provided data

santa ana unified school district
11S T A F F I N G A N D C A S E L O A D S
Deaf Hard/Hearing Caseloads
Total Teacher FTE
Total Students
Total Ratio
Industry Standards (FTE to Student Caseload)
Taft 12 89 1:7.4 Caseloads not to exceed 8-10
Intermediate 1 6 1:6 Caseloads not to exceed 8-10
Secondary 1 25 1:25 Caseloads not to exceed 8-10
Total/Average 14 120 1:8.6 Caseloads not to exceed 8-10
Source: District provided data
Autism Caseloads Total Teacher FTE Total
Students Ratio Guideline Ratio
Excluding Pre-K 33 325 1:9.8 Caseloads not to exceed
8-10
Source: District provided data
MS Transition Caseloads Total Teacher FTE
Total Students Ratio
Guideline Ratio (FTE to Student Caseload)
6 76 1:12.7 Caseloads not to exceed
10-12
Source: District provided data
The district does not have a formalized and/or consistent process for adding or reducing classes. Staff reported that one person approves additional classes based on IEP recommendations without consistently providing the budgetary ramifications to Human Resources or Business. Requests for additional positions are rarely denied. In addition, joint staff meetings between fiscal, personnel, and special education are not consistently held throughout the year. When proposals for additional staff are submitted to the cabinet, they do not include specifics such as an analysis of overfunding or underfunding of total staff as a result of such an addition. Instead, they only describe the purpose and justification for the additional staff included in the proposal. Some staff expressed concern that the approval process is not sufficiently structured or coordi-nated across departments.
RecommendationsThe district should:
1. Distribute district guidelines for class size ratios in special education programs to all staff.
2. Continue to monitor caseloads to ensure they remain within industry stan-dards.
3. Continue the monthly evaluation schedule in which class size ratios are reviewed and provided to the supervisor and the Human Resources and Business departments.

Fiscal crisis & ManageMent assistance teaM
12 S T A F F I N G A N D C A S E L O A D S
4. Establish a consistent process and procedure to propose and approve addi-tional staff positions.
5. Expand the information required for considering additional staff positions so it includes the position’s expenses such salaries and benefits.
6. Establish monthly or quarterly staffing meetings between the Fiscal, Personnel, and Special Education departments to review status and fiscal impact of positions.
7. Consistently and periodically plan a review of additional staff members to determine ongoing need.
8. Refrain from starting additional MM classes until the class average reaches 1-to-28 to be consistent with district guidelines.
9. Equalize the existing positions to the average of locally adopted guidelines. Utilize the savings realized from not adding additional MM programs to develop additional classified support services in the MM programs to maxi-mize LRE opportunities for students.
10. Analyze instructional configurations for MM programs other than blended programs to ensure that the students who need more service than a blended program can receive an appropriate education.
11. Continue providing staff development opportunities on optional curriculum and instructional strategies, particularly for staff employed in MM blended programs.
santa ana unified school district
13R E L A T E D S E R V I C E P R O V I D E R C A S E L O A D S
Related Service Provider (also known as Designated Instruction Provider) Caseloads
Speech The district employs 70.65 FTE of speech and language pathologists (SLPs), representing a total average cost of $8,054,594 with salary and benefits. The district also employs speech and language pathology assistants (SLPAs) to provide support to the speech pathologists. The American Speech-Language Hearing Association (ASHA) defines a SLPA as, “Speech-language pathology assistants are support personnel who, following academic coursework, fieldwork, and on-the-job training, perform tasks prescribed, directed, and supervised by ASHA-certified speech-language pathologists.” In this district, an SLPA receives an average salary and benefits of $80,465. The district employs 22.75 SLPAs at an average cost of $1,830,578.
FCMAT reviewed the assignment of speech pathologists from the perspective of differentiating preschool speech caseloads from grades K-12 speech caseloads. The Education Code establishes a maximum caseload of 40 students for preschool (Education Code 56441.7(a)) and 55 students for K-12 (Education Code 566563.3). This review also attempted to consider district developed-special programs that affect the assignment of speech services. Those programs range from Small Talk, a mild/moderate diagnostic small group speech setting for preschool students, SUCCESS, an intensive setting for students with autisticlike behaviors to a Preschool Assessment Team (PAT). The district invests a higher level of services in these assignments in an attempt to meet student needs. Establishing accurate caseload averages involves considering a number of factors including separating preschool and K-12 services and settings and determining the impact of special programs. In completing this analysis, the FCMAT study team had difficulty interpreting and deriving the needed information from the types of data the district uses to track provider caseloads. To the extent possible, this review considers all of these factors in establishing average speech and language provider caseloads.
FCMAT consultants used all the available data to calculate caseload averages for speech language pathologists. It was impossible to determine the amount of full-time equivalent SLPs serving preschool students with absolute certainty. For this review, a caseload average for preschool service was determined based on assignments that were clearly identified as preschool service and contained clearly identifiable levels of FTE for preschool and/or grades K-12. Any FTE assign-ments and caseloads that were unclear as to their status for preschool or K-12 were counted in the K-12 caseload average so that all providers and students were ultimately represented. Accurate tracking of SLP provider assignments and caseloads as preschool and K-12 is essential to effective staffing projections and planning.
As represented in the tables below, the district has 58.85 FTE speech pathologists serving the K-12 population and 15.15 FTE serving the preschool population. This preschool figure includes 5.15 FTE SLP assigned to the Preschool Assessment Team (PAT). The calculation of preschool average caseload includes SLPs serving this team because all SLPs provide assessment in their course of work, and no separate calculation is made to differentiate between direct service and assessment. Service to preschool special education students presents a unique problem since all districts must anticipate growth in the preschool population through identification over the course of the entire year. If the district were to staff preschool speech services at an average of 40 students, it would require 8.52 FTE speech pathologists. That would suggest overstaffing of 6.63 preschool FTE, including assessment SLPs, at a cost of $755,866.

Fiscal crisis & ManageMent assistance teaM
14 R E L A T E D S E R V I C E P R O V I D E R C A S E L O A D S
Grades K-12 are served by 57.70 FTE speech pathologists, and 3,116 students receive speech and language services in K-12. The average caseload for the K-12 population is 54. According to the Education Code, the maximum speech and language caseload is 55 students. If caseloads were maximized at an average of 55, the district would require 56.65 FTE in the K-12 grades. This analysis suggests that K-12 SLPs are overstaffed by 1.05 FTE. A system of Response to Intervention (RtI) for speech that provides both articulation and language intervention to nonidentified students has been implemented for the last three years. These RtI students do not appear on the speech pathologist caseloads.
The district should evaluate its use of SLPAs. The trend among districts in California is to use SLPAs to offset the shortage of SLPs. In those circumstances, an SLP will supervise one or more SLPAs who provide service to students within the SLPA scope of practice. In this district, SLPAs are used in a more traditional support role in an SLP’s caseload. In this instance, the assignment of SLPAs as support to an SLP is primarily based on the intensity of service the SLP provides and the size of the caseload this position serves. In many districts across the state, an SLP who needs support with his or her caseload receives assistance from a paraprofessional who is trained by the SLP. In “Defining Speech-Language Pathology Assistants” ASHA indicates that SLPs typically have two levels of support personnel: assistants and aides. Aides may be referred to as commu-nication aides, paraprofessionals, or service extenders. (American Speech-Language Hearing Association Website, “Frequently Asked Questions: Speech – Language Pathology Assistants (SLPAs)”)
In general, preschool speech services are staffed at a higher level of support than K-12 speech services. The combination of special targeted programs, especially in preschool, and the teaming of an SLP with an SLPA has resulted in some highly supported caseloads. However, other speech assignments exceed the Education Code guidelines for speech caseloads with little or no SLPA support. This variation creates uneven caseloads for speech pathologists despite the addition of SLPA support. For example, one full-time speech and language pathologist has a caseload of 29 preschool students divided into four Small Talk groups of approximately six mild students. Each Small Talk group meets twice a week for one hour per session. The pathologist also has an RtI group that is not counted in the caseload. The pathologist has the full-time (five days a week) support of an SLPA. This preschool caseload may or may not grow substantially over the next four months of school. By contrast, the K-12 system has 26 SLP caseloads of 56-73 students with of SLPA support of from zero to two days.
Speech and Language Pathologist Comparison
ProviderDistrict Total FTE to Caseload Ratio
District Average Caseload Ratio
Ed Code Maximum FTE to Caseload Ratio
Speech Language Pathologist Ratio K-12 57.70 to 3116 1 to 54 1 to 55
Speech Language Pathologist Ratio Preschool 15.15 to 341 1 to 22.51 1 to 40
Source Education Code 56441.7(a) 56563.3 and district data
FCMAT was provided with additional evidence indicating that early intervention during the preschool years, (3-5 year old), leads to a decrease in special education identification at the elementary level. The district made a conscious decision and effort to customize its preschool programs to benefit students early on, especially in speech and language development.

santa ana unified school district
15R E L A T E D S E R V I C E P R O V I D E R C A S E L O A D S
Additionally, evidence shows that if special-needs students who receive services in preschool are not transferred from special education, they move into a less-intensive program or service. Although the industry standards show preschool speech and language caseloads are high, and elementary caseloads are low and unequally balanced with the preschool caseload, the district made a conscious decision to intensively support the 3-5 year old population, which has resulted in positive outcomes.
RecommendationsThe district should:
1. Define and track preschool and K-12 speech services in a clear manner that provides accurate caseload comparisons, and develop a comprehensible deci-sion-making system for monitoring caseloads.
2. Review the caseload distribution for speech pathologists in preschool and K-12 on a regularly scheduled basis to determine reasonable equity between service providers and make informed decisions on assignments and the alloca-tion of support.
3. Examine the function of SLPA support in preschool and K-12 programs to determine if they can be reduced or eliminated.
4. Consider using instructional assistants trained for support in speech therapy instead of SPLAs when speech pathologists require additional support.
School PsychologistsThe district employs 48.90 FTE school psychologists. Most psychologists are assigned to school sites and support the students and programs located there. They perform the duties common to school psychologists, which consist primarily of performing initial assessments for special education eligibility, writing reports, participating in IEP team meetings and completing triennial evaluations. The district has 6.3 FTE assigned to provide support to the infant and preschool program. However, the FCMAT comparison for psychologist staffing is based on the K-12 assignments since there is no statewide comparison for school psychology staffing at the lower level. Therefore, the preschool psychologist 6.3 FTE was removed from the K-12 comparison. The district also chooses to use some psychologists in assignments that are outside the duties common to the position. The multitiered system of support (MTSS) team has 1.6 FTE school psychologists assigned to help with duties such as professional development and implementation of MTSS. The district also assigns a .50 FTE school psychologist to serve as the lead in supporting the work of all psychologists. The 2.1 FTE psychologists assigned to special duties are included with the total K-12 psychologists since they continue to be hired under the title school psychologist, are tracked for purposes of district staffing using that title and can be reassigned at any time to the school psychologist’s traditional role. Therefore, the average caseload for school psychologist, K-12 is calculated on 42.6 FTE. FCMAT used two different sources for comparison of school psychology staffing. Both are based on California data since national aver-ages or recommendations vary too much to be of statistical significance because of differences in the contribution of state and federal funding for special education. Kidsdata provided a statewide caseload average of 1,321 for K-12 school psychologists, and CalEdFacts cited an average 1,235. The district is understaffed by .40 FTE school psychologists according to the former source

Fiscal crisis & ManageMent assistance teaM
16 R E L A T E D S E R V I C E P R O V I D E R C A S E L O A D S
understaffed by 3.4 FTE according to the latter (see table below). Based on district average cost of school psychologist including salary and benefits, an addition of .40 FTE represents a cost of $32,698.50 and an addition of 3.4 FTE represents a cost of $444,699.60.
Program No. of FTE CaseloadKIDSData for Students per Class
District Caseload Average
Aides 1-to-1 Aides
Psychologist 42.6 56,815 1-to-1,321 1-to-1,333 0 0
Source: Kidsdata and district data
Program No. of FTE CaseloadCalEdFacts for Students per Class
District Caseload Average
Aides 1-to-1 Aides
Psychologist 42.6 56,815 1-to-1,235 1-to-1,333 0 0
Source: CalEdFacts and district data
RecommendationThe district should:
1. Evaluate the nonstandard roles assigned to school psychologists and deter-mine whether those duties are necessary and whether they are best filled through the assignment of a school psychologist.
Occupational TherapistsThe district employs nine occupational therapists (OTs) who serve a total caseload of 410 students, including 72 or 17.5% who are served on a consult basis. The industry standard for OT student caseload is one OT to 45-55 students. The district average including students on consul-tation is 1-to-45.5. The district also employs four certified occupational therapists assistants at a total cost of $317,512. The district caseloads for OTs is well within the industry standard, yet the district maintains OT support from four certified occupational therapists assistants (COTAs). Districts across the state typically employ COTAs to help support caseloads that exceed the industry standard.
Occupational Therapists Caseload Comparison
Provider FTE Caseload
Occupational Therapy FTE-Student Ratio COTA
Ratio (FTE-to Student Caseload)
Occupational Therapist 9 410 1-to-45 4 1-to-45-55

santa ana unified school district
17R E L A T E D S E R V I C E P R O V I D E R C A S E L O A D S
RecommendationThe district should:
1. Evaluate the role and support provided by the COTAs to determine if it is warranted and cost-effective.
Adaptive Physical Education TeachersThe district employs 10 FTE adaptive physical education (APE) teachers who serve a caseload of 450 students districtwide. Virtually all of the students receive direct instruction, with only 14 students receiving APE services on a consult basis. The industry standard for APE caseloads is 1-to-45-55, and the district average is 1-to-45.
Adapted Physical Education Caseload Comparison
Program No. of FTE CaseloadGuideline for Students per Class
Average No. of Students
APE 10.0 450 1-to-45-55 1-to-45
Source: Industry Standard and district data
Physical TherapistsThe district employs two FTE physical therapists (PTs) who serve a caseload of 91 students districtwide. Forty-four students (45%) receive physical therapy on a consult basis, and the industry standard for PT caseload is 1-to-45-55. The district average is 1:45.5, but it is not uncommon to find a higher rate of consultation in the PT caseload.
Physical Therapists Caseload Comparison
Program No. of FTE CaseloadGuideline for Students per Class
Average No. of Students
APE 2.0 91 1-to-45-55 1-to-45.5
Source: Industry Standard and district data
School NurseThe district employs 19 FTE school nurses and 24 licensed vocational nurses (LVNs). A school nurse must supervise and train an LVN, but the latter positions can perform significantly more health-related duties than a health clerk. Staff interviewed indicated the district’s goal is placing an LVN at every school. The school nurses are funded primarily through the general fund and the Medi-Cal billing option. Of the 19 FTE school nurses, .80 FTE are funded from special education funds. Based on Kidsdata, the industry standard for school nurse caseloads is 1-to-2,784. The district is staffed at an average school nurse caseload of 1:2,990, which would indicate it is understaffed by 1.4 FTE. However, the LVNs may help compensate for the slightly higher nurse caseloads.

Fiscal crisis & ManageMent assistance teaM
18 R E L A T E D S E R V I C E P R O V I D E R C A S E L O A D S
School Nurse Caseload Comparison
Provider FTE CaseloadSchool Nurse FTE-Student Ratio
LVN FTE
KIDSdata Ratio (FTE-to Student Caseload)
School Nurse 19 5,6815 1-to-2,990 24 1-to-2784
Source: Kidsdata and district data
RecommendationThe district should:
1. Review the allocation of school nurses and the assignment of LVNs to determine if federal and state health mandates and individual student health support is appropriately provided through the district system of school nurses and LVNs.

santa ana unified school district
19I N S T R U C T I O N A L A S S I S T A N T S
Instructional AssistantsStaff indicated the district lacks a procedure for identifying the need for instructional aides or for monitoring the use of aides in the classroom. The number of aides assigned to each class-room is based on the district guidelines used to maintain a specific number of aides per teacher depending on the number of students assigned to the teacher and the classification of class such as disability category.
The district has a special circumstances instructional assistance (SCIA) binder to help deter-mine the need for 1-to-1 aides. The documents in the binder a checklist for SCIA, procedures for requesting assistance, evaluation reports, and sample fading plans to be utilized when an individual student’s needs change, warranting the decrease or elimination of 1-to-1 aides. Some staff reported that they are aware of the process, but do not believe it is consistently used and indicated that some personnel have not been trained to utilize it. There is no indication of the following:
• That re-evaluations are used to determine the need for 1-to-1 assistance or full-time instructional assistance for a specific child.
• That plans were written to decrease the 1-to-1 or full-time instructional assistance.
Staff reported that 1-to-1 aides remain in the same assignments from year to year without the district performing a review to determine if the position is still needed there.
In addition, some positions labeled “rovers” were established to decrease the need for 1-to-1 aides. These staff members are not assigned to a specific child, but rove from class to class wherever needed. These positions seem never to be eliminated, and the need for them is not re-evaluated from year to year, according to staff. Staff were inconsistent regarding which posi-tions are actually called rovers, but at least 11 FTEs are designated with that title. Staff have an inconsistent understanding of the classification of aides in the SUCCESS programs, e.g., rovers, instructional assistants, student support personnel. The difference between these positions is not widely known.
Industry standards provides for the allocation of six hours of aide time for MM classes and 12 hours of aide time for MS classrooms. The district decided to operate fewer hours in the MM programs than would be allocated by industry standards. With the exception of classes for the autistic and deaf and hearing, all MS classes operate with an excessive number of instructional assistants when compared to industry standards.
The chart below depicts the current assignment of aide time to specific classes, the comparison to industry standards for both MM and MS programs, and the number of FTEs operated above and below industry standards. The district assigned 3.75 hours of aide time to MM classes and six-hour aide positions to MS classes. Excluding 1-to-1 aides or rovers, the programs operate 20.13 FTEs below the allotment of aide time per industry standards. However, the district oper-ates a large number of 1-to-1 aides in both MM and MS classes (15 FTE of 3.75 aide positions for MM and 6.7 FTE of six-hour positions in the MM classes) and 8.5 FTE six-hour positions in MS classes. In addition, the district operates 11 FTE rovers. If the district worked within industry standards, it could save approximately, $1,324,479.

Fiscal crisis & ManageMent assistance teaM
20 I N S T R U C T I O N A L A S S I S T A N T S
Class Ratios
FTE CaseloadDistrictCaseloadAverage
Industry Standardsfor Students
Industry Standardsfor aidesin hours
AideHours Operated
Mild-Moderate Including Transition
223 4391 19.7 28 District Guideline 6 956.3
Mild-Moderate Pre-K 14 242 17.3 12-15 6 180
Moderate-Severe Including Transition
39 424 10.8 10-12 12 658.3
Moderate-Severe--ED 9 63 7 8-10 12 119
Moderate- Severe—Deaf/Hard of Hearing
14 120 8.6 8-10 12 102
Moderate-Severe—Autism Not Incl Pre-K 33 325 9.8 8-10 12 354
Moderate-Severe—Pre-K 13 129 9.9 10-12 12 228
Classroom Aides
Industry Standardshours total Allowed
Aide Hours Operated
Total hours over/under guidelines or Industry Standards
Total FTE (6 hour)Over/under
Mild- Moderate Including Transition
1338 956.3 -381.7 -63.6
Mild-Moderate Pre-K
84 180 96 16
Moderate-Severe Including Transition
468 658.3 190.3 31.7
Moderate-Severe ED 108 119 11 1.8
Moderate-Severe Deaf/Hard of Hearing
168 102 -66 -11
Moderate-Severe Autism Not Incl Autism
396 354 -42 -7
Moderate-Severe Pre-K
156 228 72 12
Source: District-provided data
santa ana unified school district
21I N S T R U C T I O N A L A S S I S T A N T S
The district assigns 3.75 hours of aide time to MM classes and six-hour aide positions to MS classes. The above chart shows that the district operates with 20.13 fewer FTEs than it could based on industry standards. However, the district uses a large number of 1-to-1 aides in both MM and MS classes (15 FTEs for 3.75 aide positions for MM and 6.7 FTE six-hour positions in MM classes) and 8.5 FTE six-hour positions in MS classes. It also operates 11 FTE rover positions. These 1-to-1 and rover positions (41.2 FTEs) are above and beyond those aide posi-tions referenced in the above chart. When comparing the underutilized positions (-20.13 FTE) to those operated above industry standards (+41.2), the number of FTE aides used above and beyond industry standards is 21.07 FTEs amounting to a cost of $1,431,116.
RecommendationsThe district should:
1. Analyze annually whether or not each of the 1-to-1 aides should be continued the following year by completing the process detailed in the special circum-stance instructional aide (SCIA) binder as developed by the district to avoid overstaffing and inconsistencies.
2. Conduct further staff development training on the use of the SCIA process, procedures, and forms and monitor its utilization.
3. Ensure that the relevant SCIA forms are completed at each annual IEP for students who have intensive intervention services written on their IEP.
4. Ensure the IEP contains an individual annual fade plan for the student to decrease and eventually eliminate the need for 1-to-1 assistance or for full time instructional assistance, when the IEP team determines the need for 1-to-1 instructional assistance or full time instructional support.
5. Develop a district tracking form that clarifies why a student receives 1-to-1 instructional assistant services or full-time instructional assistance, when that position is reduced or eliminated, and the status of the reassigned instruc-tional assistant.
6. Establish a standard procedure that the special education program administra-tors will consult with the special education director determine if an existing instructional assistant can be reassigned to cover the new assignment before initiating the request procedure posting a new instructional assistant position.
7. Develop a list of the various aide classifications and descriptions to ensure consistent understanding and application throughout programs.

Fiscal crisis & ManageMent assistance teaM
22 I N S T R U C T I O N A L A S S I S T A N T S

santa ana unified school district
23M E D I - C A L L E A
Medi-Cal LEA FCMAT reviewed the 2014-15 and the 2015-16 Medi-Cal budget, the related staffing alloca-tions, the LEA billing performance report, and the provider participation agreement.
Santa Ana Unified is a qualified local educational agency (LEA) and is eligible to participate as a provider of services under the state Medicaid program (Medi-Cal) authorized under California’s Welfare and Institutions Code §14132.06. The mutual objective of the California Department of Health Care Services (DHCS), the California Department of Education (CDE), and the LEA are to improve access to needed services for children. Eligible LEAs provide many reimbursable services as part of the federal and state mandate of providing special education, and these services are reimbursable under the state Medicaid program. Therefore, all eligible LEAs should submit for reimbursement for these services to supplement district-provided services.
The district contracts with Paradigm HealthCare Services to submit for qualified Medi-Cal covered service reimbursement. The Paradigm representative meets at least annually with the LEA coordinator and trains qualified service providers on the reimbursement process. The LEA Medi-Cal Billing Option Program requires the close supervision of a leader who understands the costs of providing special education services across a district, the demand that cost has on the general fund, and the role the program can play in ensuring comprehensive services and decreasing the contribution from the general fund. The district provided a list of qualified services that are provided and summary billing payment reports.
Because of recent changes in billing allowances, districts must obtain authorization from an authorized medical doctor to be reimbursed for speech and language services, physical therapy services and occupational therapy services. The district has been proactive and has a medical doctor on contract who authorizes these services.
Service providers can bill for assessments and treatments. Assessments include annual IEP meet-ings, triennial assessments, any amendment IEP meetings, including manifestation determination assessments and amendment meetings. Treatment sessions are divided into individual and group sessions. Although the district closely monitors billing for services, billing could be maximized and revenues increased. For example, 91 students receive physical therapy, and each must have an annual IEP meeting. This generates $8,005 in annual IEP meetings and does not include any treatments or other assessments. The chart below for 2014-15 and 2015-16 to date shows that the total reimbursement for physical therapy was between $8,000 and $10,000. A second example is the number of annuals per year for students receiving speech and language services. The district has 3,671 students receiving speech services who have an IEP every year, and the total revenue for these IEP meetings is $220,260. The chart below shows that speech pathologists and other related service providers did not maximize their billing. The district can estimate the potential for revenues by querying the special education information system to determine the number of IEPs and triennials and the amount of services provided. This would be a simple baseline for potential revenues. Staff indicated that because of third-party contracting for trans-portation of disabled students, maximizing potential billing in this area has been difficult.
According to the LEA Medi-Cal Billing Option Program, transportation can be reimbursed if the LEA can document the following:
• Transportation provided in a medical vehicle that contains lifts, ramps, and restraints.
• The need for LEA-covered medical services and LEA-covered medical transportation services in the student’s IEP/IFSP.

Fiscal crisis & ManageMent assistance teaM
24 M E D I - C A L L E A
• A transportation trip log that includes the trip, the mileage, origination point, and destination point for each student, student’s full name, and date transportation was provided.
The Medi-Cal reimbursement rate is attached as Appendix A to this report. It can guide districts in determining potential revenues.
2013-14 2014-15 2015-16 to date
Provider GroupAUDIO
Assessments$4,740
Treatments$883
Assessments$0
Treatments$0
Assessments$5,286
Treatments$5,706
Health Aides $0 $26 ,225 $0 $14,885 $0 $29,832
Nurses $96,520 $7,969 $89,442 $8,461 $50,373 $5, 111
Occup Therapists $28,619 $19,043 $24,222 $36,287 $29,902 $44,812
Phys Therapists $5,853 $4,322 $4,925 $4,326 $7,174 $1, 148
Psychologists $375,975 $27,033 $376,257 $26,053 $301,551 $13 ,825
Social Workers, MFT/MFCC $0 $152,769 $0 $211,553 $0 $133 ,439
Speech/Language Paths $147,304 $901,449 $119,804 $812, 166 $153,099 $876,572
Transportation) $0 $17, 150 $0 $27,995 $0 $23, 129
Subtotal $659,011 $1,156,841 $614,650 $1,141,726 $547,385 $1,133,573
Source: District provided data
According to the Medi-Cal budget staffing allocation, a .4 FTE psychologist and 2 FTE speech and language pathologists are charged to Medi-Cal. Federal regulations do not allow districts to bill for Medi-Cal if the provider is federally funded. Therefore, 2.4 FTE positions cannot bill to the potential.
Because of certificated and classified negotiated salary increases and the potential for loss of revenues in Medi-Cal, the Medi-Cal LEA consortium needed to alter the number and type of employees who were charged from the Medi-Cal LEA budget. The district removed the LVNs who were budgeted under Medi-Cal and moved them under the Pupil Support Services (PSS) Department. This also allows the LVNs to bill at 100% if needed since they are no longer feder-ally funded.
The LEA Medi-Cal Billing Option Program Provider Participation Agreement and Education Code Section 8806 require the establishment of a collaborative interagency human services group at the county level or subcounty level to make decisions about the reinvestment of funds made available through the program. The LEA collaborative is required to meet a minimum of twice a year. The process is to promote full participation in policy development as explained on CDE’s website, http://www.cde.ca.gov/sp/se/ac/optsrltdsvcs.asp. The interagency collaborative is required to consist of at least three individuals with varying interest in the reinvestment of funds for the LEA program. According to the Medi-Cal Provider Enrollment Information Sheet the collaborative membership is required to include seven LEA interagency collaborative partners. These members include the assistant superintendent – support services, the executive director of pupil support services, the program specialist - Medi-Cal programs coordinator, the director of special education services, the coordinator of special education services, a community member,
santa ana unified school district
25M E D I - C A L L E A
and the budget analyst. Staff expressed concerns regarding a limited interagency membership and lack of a decision-making process. Staff indicated a need for an expanded group allowing for additional input on expenditures, needs of student services, and staff materials and equipment.
RecommendationsThe district should:
1. Continue to contract with a physician to authorize billing in the area of speech and language services, physical therapy, and occupational therapy.
2. Analyze the potential for maximizing all billable services and track the specific services by assessments, services and amendments/annual IEP meetings and review with providers the areas of need for improvement.
3. Move the .4 FTE psychologist and 2 FTE speech and language pathologists from the Medi-Cal budget to the special education budget, and place autism professionals who do not Medi-Cal bill in the Medi-Cal budget at the same total expense of the 2.4 certificated FTEs.
4. Review with the third-party transportation agency the Medi-Cal LEA documents, and require the agency to indicate all the students allowed under LEA mandates and provide professional development to bill for allowable transportation costs.
5. Review the expansion of the LEA collaborative membership and deci-sion-making process.

Fiscal crisis & ManageMent assistance teaM
26 M E D I - C A L L E A

santa ana unified school district
27O R G A N I Z A T I O N A L S T R U C T U R E
Organizational StructureFCMAT developed a comparison of the administrative and clerical support structures of four single-district SELPAs of comparable size; Corona-Norco, Capistrano, San Bernardino and San Francisco. Data for size comparisons was taken from 2014-15 Dataquest, California Department of Education. The total number of special education students from birth to age 22 was reported by district of residence.
Single District by Comparable Size
Enrollment 2014-15 Special Ed. 2014-15
Capistrano 54,036 5193
San Bernardino 53,365 5835
San Francisco 58,414 6752
Corona - Norco 53,739 6397
Santa Ana 56,815 6763
Information on administrative and clerical support staffing was provided by the district and a Dataquest report. Capistrano Unified provided data on its administrative support level, but not on clerical support positions, and these positions were unavailable on the district website. Each district identifies clerical support positions differently. FCMAT reviewed the available job descriptions for administrative and clerical positions and combined some categories into similar groups for purpose of this study only.
The district is understaffed in administrative positions compared to other single districts of comparable size. While all SELPAs have a SELPA director/director, Santa Ana Unified is the one that combined the SELPA/Special Education department with Student Services. For purposes of this study, FCMAT has analyzed only the special education administrative and clerical structure.
The average number of executive directors was 1 FTE, but the district does not have this posi-tion. This position typically has responsibility for the day-to-day operations of special education. The average number of directors with comparable size districts is 2 FTE, and the district has one director. Program supervisors, coordinators and assistant directors average 4 FTE, while the district averages 3 FTE, and the average number of program specialists is 13 while the district has 9 FTE positions.
In summary, the district is below the average administrative staffing of the four single districts of comparable size in all positions. The staff indicated a significant need for program specialists for the severely handicapped, which would include programs for those who are medically fragile, have low-incidence disabilities and significant orthopedic issues and have multiple handicaps.

Fiscal crisis & ManageMent assistance teaM
28 O R G A N I Z A T I O N A L S T R U C T U R E
Administrative Positions SELPA/District
Santa Ana
Corona - Norco
San Bernardino Capistrano
San Francisco
Average SELPA
SELPA Director/Assistant Superintendent/Director 1 1 1 1 1 1
Executive Director 2 1 1
Director 1 1 3 2 2
Coordinator/Assistant Director/Program Supervisor 3 3 5 1 8 4
Program Specialists/Teachers on Special Assignment 9 12 8 11 20 13
Data provided by the districts
The district is understaffed in clerical support positions for special education compared to single-district SELPAs of comparable size. This comparison does not include an analysis of overlap responsibilities that some of the clerical positions may have in other departments.
Clerical Support Positions Santa Ana
Corona - Norco
San Bernardino Capistrano San
FranciscoAverage SELPA
Administrative Secretary 1 1 1 No response 1
Secretary I, II, III 1 1 7 No response 3
Senior Clerk 4 3 2 No response 1 2
Clerk I, II 1 8 11 No response 11 10
Other 1 0 0 No response 3 1
Data provided by the districts
RecommendationsThe district should:
1. Consider adding one program specialist to provide support for the severely handicapped programs.
2. Review the clerical support positions and determine any additional supports that may be necessary.

santa ana unified school district
29R E S P O N S E T O I N T E R V E N T I O N S
Response to InterventionsRecords provided to FCMAT and interviews with staff indicate that the district made a significant effort and investment in an RtI2 system. In conjunction with recent changes in the public education, RtI2 is otherwise known as MTSS. A recent issue of “The Special EDge”, Winter 2015, Volume 29, No. 1, describes MTSS as “standards based instruction, interventions, mental health, and academic and behavioral supports aligned with accessible instruction and curriculum…” The issue indicates that a MTSS approach can, “be used to develop and align resources, programs, supports, and services at all organizational levels to increase positive student outcomes.” Based on a records review and interviews with staff, Santa Ana Unified has accom-plished much to align a large single-SELPA district with the day-to-day operation of an MTSS. The essential core structure of an effective MTSS is composed of fortifying the core, universal screening, research-based intervening, progress monitoring and data-based decision-making. The district’s MTSS team designed and organized critical professional development in those five areas. The student success team (SST) process was fully redesigned, and a system of universal screening was established that operates consistently in the elementary system. The district is also working to implement a districtwide PBIS culture. Other key facets of implementation were also developed.
However, these efforts did not result in as much progress as anticipated. First among these concerns is that students did not make sufficient progress in reading and literacy skills. The district determined that the main cause is the quality of core reading instruction in general education. Many classroom staff are still likely to address this lack of progress with referrals to intervention outside the general education classroom. FCMAT agrees with the district’s analysis. Without substantial and effective change in core instruction, it is difficult to change the long-standing practice of referring students to external resources for lack of progress.
The district took several significant steps to address core literacy instruction in the classroom. As part of the MTSS, data-based instructional decision-making is a key component of professional development. A reading academy was developed as a core professional development effort in grades K-3. This year, an advanced learning academy pilot program was initiated in grades four through six as a pilot project that is intended be implemented across the district. These efforts have separate points of origin and responsibility for implementation and monitoring in the district’s organization structure. They do not share a cohesive vision for improving literacy.
Other problems have arisen based on records review and interviews with staff. Several staff members at all levels of the district reported that the delivery of professional development for MTSS has been difficult to achieve. Few substitutes are available to allow teachers to be released for training during the work day. As a result, the district relies on voluntary after-work or weekend/summer paid workshops. Instead of targeting each individual, the district depends on a system that relies on cohorts to send teams for training that can be shared at the sites. Still, participation has not been sufficient to accomplish systemic change. The strategies for improving standard core reading instruction are not consistently implemented. Data-driven instructional team meetings have not been held, but decision-making based on data is not firmly established throughout the MTSS processes. The instructional staff is not held accountable for implementing research-based strategies and procedures. Much of the oversight and organization of the MTSS occurs and is delivered through the Student Support Division and carries a special education association rather than a sense of origin in general education.

Fiscal crisis & ManageMent assistance teaM
30 R E S P O N S E T O I N T E R V E N T I O N S
An interview with the deputy superintendent confirmed that the district had developed a plan that consisted of a reorganization of the Support Services Division and reassignment of work not specifically related to special education or SELPA. The areas included, but are not limited to, responsibilities such as oversight of the MTSS team, including reading interventions, and PBIS. These areas would be reassigned to other educational services. This FCMAT review confirms the district’s plan.
RecommendationsThe district should:
1. Ensure site and district supervisory staff are sufficiently trained and autho-rized to provide frequent monitoring for consistent implementation of MTSS and SST models.
2. Develop a work group of those affected in the district to review and make recommendations on improving access and delivery of professional develop-ment.
3. Reorganize administrative responsibility and oversight of MTSS development and implementation that emphasizes the general education and core instruc-tion foundation of MTSS.
4. Continue to direct district training and resources to strengthen the core instruction of reading in the general education classroom.
5. Develop a cohesive and aligned master plan that focuses all of the efforts on core instruction in reading into one single well defined shared outcome.
6. Continue to direct district training and resources to promote a districtwide PBIS culture.

santa ana unified school district
31I D E N T I F I C A T I O N R A T E
Identification RateThe special education identification rate for district-of-residence students with disabilities is 10.73%, which exceeds the statewide average by .7%. The estimated cost of this overidentifica-tion is $3,572,050. A document entitled “Santa Ana Unified School District Report on Special Education Services” completed by Jack Lucas in December 2015 compares the district and the state in three areas of significant growth. By comparing the district and state pupil counts for December 2014, the report found that the district’s growth in the areas of autism, emotional disturbance and speech and language impairment parallels the state. This was the largest six-year increase over 15 years.
The district is experiencing an increase in high-cost students (autism and speech and language) and a decrease in low-cost student such as those with specific learning disabilities. This shift in is well documented in the report as a major contributing factor to the increase in special education costs.
Comparison of Santa Ana SELPA December Count to State December Count
Year ID HH DEAF SLI VI ED OI OHI SLD DB MD AUT TBI TOTAL
Santa Ana 2014 440 101 48 1,492 29 103 147 648 2,677 0 24 964 14 6,687
% OF 2014 6.58% 1.51% 0.72% 22.31% 0.43% 1.54% 2.20% 9.69% 40.03% 0.00% 0.36% 14.42% 0.21% 100.00%
State 2014 43,751 10,325 3,531 160,071 3,864 24,214 12,293 76,627 284,196 116 6,435 90,794 1,744 717,961
% OF 2014 6.09% 1.44% 0.49% 22.30% 0.54% 3.37% 1.71% 10.67% 39.58% 0.02% 0.90% 12.65% 0.24% 100.00%
The highest disability growth area for the district in the past six years is in speech and language identification. The district should closely examine the criteria for identification, the frequency and duration of speech and language services and the exit rate for students with speech and language disabilities. Based on the findings, the district should ensure that procedures are devel-oped ad fully implemented for identification. Speech therapists should be trained in the criteria for terminating therapy.
RecommendationsThe district should:
1. Complete a speech audit to determine the cause of overidentification for students with speech and language disabilities.
2. Examine the extent to which autism increases have affected speech identifica-tion.
3. Review the exit rates reported in the June 2014 and 2015 annual CASEMIS reports to determine if students are appropriately transferred from speech and language services.
4. Analyze the frequency and duration rates of speech services in addition to the length of time students have remained identified for speech and language service.
5. Provide training and support to therapists on the criteria for exit rates.

Fiscal crisis & ManageMent assistance teaM
32 I D E N T I F I C A T I O N R A T E
santa ana unified school district
33F I S C A L E F F I C I E N C I E S
Fiscal Efficiencies Districts, including single-district SELPAs, have little control over federal and state special educa-tion revenues. California changed its funding model and distributes funds to SELPAs based on their member districts’ total ADA, not identified special education students as was previously the case.
The reporting methods of districts, county offices, and SELPAs can vary. There is no consistent or uniform procedure or coding requirements for special education. Some districts include transportation in their expenditures while others do not and there are variations in how special education funds are allocated through a SELPA’s approved allocation plans. Therefore, it is not always possible to accurately compare a district’s general fund contribution to that of other districts. However, Santa Ana Unified is a single-district SELPA and can therefore utilize all reve-nues received. The administration staff in the Special Education, Business and Human Relations departments discuss special education staffing needs and budgets inconsistently and informally, according to staff. Reports and documents indicate no single consistent document is used for staffing and budgeting between the departments.
Maintenance of effort (MOE) is the federal statutory requirement that a district must spend the same amount of state and local money on special education each year, with some exceptions. In considering how to reduce the overall general fund contribution, the district is required to follow the guidelines in the MOE document (20 U.S.C.1413 (a)(2)(A)). The MOE document from the California Department of Education (CDE) lists the following as exceptions that allow the district to reduce the amount of state and local funds spent on special education:
1. The voluntary departure, by retirement or otherwise, or departure for just cause, of special education or related services, of personnel who are replaced by qualified, lower-salaried staff.
2. A decrease in the enrollment of children with disabilities.
3. The termination of the obligation of the agency to provide a program of special education to a particular child with a disability that is an exceptionally costly program, as determined by the State Educational Agency, because the child:
a. Has left the jurisdiction of the agency;
b. Has reached the age at which the obligation of the agency to provide FAPE (free and appropriate public education) to the child has termi-nated; or
c. No longer needs the program of special education.
4. The termination of costly expenditures for long-term purchases, such as the acquisition of equipment or the construction of school facilities.
The district’s general fund contribution based on the MOE documents provided to FCMAT was $37,602,864.75 or 37.9% in 2013-14 and $41,750,974 or 39.5% in 2014-15. The district’s 2015-16 projection expenditures budget for special education is $106,622,355 based on the

Fiscal crisis & ManageMent assistance teaM
34 F I S C A L E F F I C I E N C I E S
MOE document provided to FCMAT. The district’s general fund contribution is projected to be $52,073,327, which is 48.8%% of the special education budget. The statewide average is 43%.
FCMAT reviewed the district’s general fund contribution with district staff because of district concern regarding the increase in this area.
Several factors affect a district’s general fund contribution, including revenue received to operate the programs and the expenditures for salaries, benefits, staffing and caseloads, nonpublic school and nonpublic agency costs and transportation. Litigation can also increase a district’s general fund contribution. Staff and documents indicate that the cost of litigation has remained about the same since 2013-14, but staff has received a 10% salary increase. Documents show salaries and benefits cost $76,448,857 in 2013-14, and are projected to increase to $89,965,630 in 2015-16, a difference of $13,516,773 over three years.
The LCFF was enacted with the passage of the 2013-14 Budget Act, replacing the previous K-12 finance system with a new funding formula. The new formula for school districts and charter schools consists of uniform base grants by grade spans (K-3, 4-6, 7-8, 9-12) and includes additional funding for targeted students. The previous K-12 finance system included a transfer from the unrestricted general fund to the special education program based on funding generated from special day classes attendance. Special day class ADA is no longer reported separately, and the CDE determined that this revenue limit special education ADA transfer will be discontinued because of the LCFF. The implementation of the LCFF has automatically increased the amount of many districts’ general fund contributions to special education because of this accounting change.
Effective in 2013-14, special education transportation revenue became an add-on to the LCFF and therefore is no longer restricted. This change in accounting has increased the amount of many districts general fund contribution to special education.
The table below compares the revenue the district receives from state and federal resources. The special education revenue data provided to FCMAT was data posted to the district’s special education program in their financial system. Since 2013-14, the district’s revenue received to operate special education programs has decreased by $302,084.

santa ana unified school district
35F I S C A L E F F I C I E N C I E S
Special Education Revenues from 2013-14 to Projected 2015-16
Description FEDERAL 2013-14 2014-15 Projected 2015-16
Difference from 2013-14 to pro-jected 2015-16
IDEA Entitlement $9,059,932 $9,542,178 $9,542,178 +$482466
IDEA Preschool Grant $344,477 $333,154 $333,154 -$11,323
IDEA Preschool Local Entitlement, Part B $744,903 $784,552 $784,552 +$39,649
IDEA Mental Health $580,688 $700,555 $633,659 +$52,971
IDEA Preschool Staff Development Part B $526 $1,191 $8,622 +$8,096
IDEA Early Intervention Grants $282,678 $282,678 $282,678 $0
Alternative Dispute Resolution $16,127 $17,258 $31,499 +$15,372
Workability, Transition Partnership $264,198 $294,942 $297,530 +$33,332
Medi-Cal Billing Option $2,255,029 $1,631,152 $2,000,000 -$255,029
Total Federal Revenues $13,548,558 $13,587,660 $13,913,872 +$365,314
Description STATE 2013-14 2014-15Projected
2015-16
Difference from 2013-14 to projected
2015-16
Special Education $29,078,541 $30,055,323 $29,061,765 -$16,776
Special Education: Infant Program $398,893 $404,127 $402,374 +$3,481
Special Education: Mental Health Services $3,290,193 $3,278,871 $3,314,450 +$24,257
Special Education: State Preschool Grant $16,295 $4,552 $0 -$16,295
Special Education: Infant Fund $16,641 $15,612 $6,244 -$10,397
Special Education: Workability $377,360 $329,860 $329,860 -$47,500
Total State Revenues $33,177,923 $30,813,623 $33,114,693 -$63,230
Total REVENUES $46,726,481 $44,401,283 $47,028,565 -$302,084
School districts throughout the state face a continuing challenge in funding the costs for serving special education students. Districts are faced with continued increases in the differences between the federal and state governments’ funding and the mandated costs for these vital student services.
The table below compares the district’s special education program expenditures. The special education expenditure data is based on the MOE documents provided to FCMAT. Since 2013-14, the district’s expenditures to operate special education programs have increased by $15,936,386. The general fund contribution for projected 2015-16 is $59,593,788.

Fiscal crisis & ManageMent assistance teaM
36 F I S C A L E F F I C I E N C I E S
Special Education Expenditures from 2013-14 to Projected 2015-16
Description 2013-14 2014-15 Projected 2015-16
Difference from 2013-14 to pro-jected 2015-16
Certificated Salaries $40,402,051 $43,290,443 $45,391,548 +$4,989,497
Classified Salaries $16,612,155 $17,557,417 $19,950,586 +$3,338,431
Benefits $19,434,651 $21,037,647 $24,623,496 +$5,188,845
Materials and Supplies $866,973 $977,039 $1,104,526 +$237,553
Contracts and Operating $12,851,443 $13,101335 $14,660,915 +$1,809,472
State Special Schools $0 ($3,211) $3,500 +$3,500
Sub-Total, Direct Costs $90,167,273 $95,960,670 $105,734,571 +$15,567,298
Transfer Indirect Charges $518,694 $1,069,507 $887,782 +$369,088
Total, Expenditures $90,685,967 $97,030,177 $106,622,353 +$15,936,386
*Does not includes Program Cost Report Allowance
The table below compares the district’s December 1 identified special education pupil count and the expenditures per identified pupil count. Since 2013-14, the district count has decreased by 89 pupils, and expenditures per identified special education pupils have increased by $2,566 per pupil. Santa Ana Unified has no method to communicate student needs and the cost for support. When the number of students identified for special education declines, the district has no mecha-nism to determine whether a reduction in staffing is warranted.
Description 2013-14 2014-15 2015-16 Difference from 2013-14 to projected 2015-16
December 1 IdentifiedPupil Count birth-22 years of age 6,763 6,549 6,674 -89
Expenditures per Pupil $13,409 $14,816 $15,975 +$2,566 per pupil
The district contracts with the Orange County Department of Education primarily for services to students who are deaf and hard of hearing and those who require intensive services through a severely handicapped program. For the 2015-16 school year, the district contracts for 25 students who are deaf and 24 students who are severely disabled. FCMAT reviewed the cost of the deaf/hard of hearing program provided by the county office and found that, excluding the cost of transportation, the district pays $44,306 per student to provide these services. The district contracts with the department of education to provide services, support and coordination for deaf and hard-of-hearing students who are secondary level (middle school to 22 years of age) and severely disabled students (preschool to 22 years of age) with severe behavior and communication needs or severe medical needs who cannot be appropriately served in the district. These students all present with significant problems that require intensive services to address their academic, communication, behavioral, social emotional health and medical needs.
The county department of education employs highly qualified staff that are provided ongoing training and support. The program is also supported by a highly trained ancillary staff: school psychologists, speech and language specialists, audiologists, certified interpreters, counselors, occupational therapists, a physical therapist, assistive technology specialists, school nurses, adaptive PE specialists, vision specialist, ab orientation and mobility specialist, and a vocational education specialist. These students also require specialized equipment such as: a soundproof booth for necessary evaluation and management of hearing aids or cochlear implants for deaf and

santa ana unified school district
37F I S C A L E F F I C I E N C I E S
hard-of-hearing students. Other severely disabled student require specialized equipment medi-cally necessary for feeding and breathing. Students with behavioral problems require facilities that are safe and can accommodate their issues. In addition, the avoidance of due process hearings as a result of placing students in these programs is a savings to the district. Such hearings could present significant legal costs to the district, especially those for students who are deaf and hard of hearing and severely disabled and have medical or behavioral problems.
During FCMAT interviews, staff had varying opinions of the development of the special educa-tion budgets. Some staff had concerns about communication and budget openness; they do not know the amount of the special education budget or the staff or items charged to it. The budget is rolled over from one year to the next, and staff do not review the use of resources. Various staff reported no one takes ownership of the special education budget or accountability. The Special Education, Business and Human Resources departments do not meet regularly. District office administrative staff; however, reported that the special education director directly monitors, and approves requests for budget increases in collaboration with the Human Resource Department and business office.
RecommendationsThe district should:
1. Monitor the district’s general fund contribution through the annual MOE and determine whether expenditures can be reduced using any of the exemp-tions allowed.
2. Establish monthly meetings between the SELPA director, special education director and the assistant superintendent of Business Services and Human Resources Department that include the following topics:
a. Budget development
b. Budget monitoring
c. Maintenance of effort requirements
d. Additional staff requests or change in assignments
e. Nonpublic school and/or agency contracts and invoices and new place-ments
f. Due process or complaint issues
g. Staff caseload
h. Identified student counts
i. Identified needs
3. Implement zero-based budgeting. Each department should build and propose its 2015-16 budget including staffing. The Special Education, Business and Human Resources departments should review all of the staffing and assign-ments through this process. Staff should review how personnel is used and charged to the district budget. Adjusting the coding for any staff that provide

Fiscal crisis & ManageMent assistance teaM
38 F I S C A L E F F I C I E N C I E S
services to both identified and nonidentified pupils will not reduce the total budget, but will ensure that the special education budget is accurate.
4. Develop a single document to use for staffing in the Special Education, Business and Human Resources departments to include but not limited to the following:
a. Name
b. Position
c. Position control
d. Location of placement
e. Number of hours
f. Resource/coding
g. FTE
h. Salary and benefits
i. Caseload or assignment
j. Date of hire
k. Credential(s) held
5. Review and analyze the cost efficiencies and least restrictive environment options for students referred to the county office and determine whether the district should serve these students directly.

santa ana unified school district
D R A F T 39A P P E N D I C E S 39
Appendices
A. Medi-Cal LEA Reimbursement Rates
B. Study Agreement
Fiscal crisis & ManageMent assistance teaM
D R A F T40 A P P E N D I C E S40

santa ana unified school district
D R A F T 41A P P E N D I C E S 41
Appendix A: . Medi-Cal LEA Reimbursement Rates

Fiscal crisis & ManageMent assistance teaM
D R A F T42 A P P E N D I C E S42
santa ana unified school district
D R A F T 43A P P E N D I C E S 43
Appendix B: . Study Agreement

Fiscal crisis & ManageMent assistance teaM
D R A F T44 A P P E N D I C E S44

santa ana unified school district
D R A F T 45A P P E N D I C E S 45
Fiscal crisis & ManageMent assistance teaM
D R A F T46
santa ana unified school district
D R A F T 47A P P E N D I C E S 47
Fiscal crisis & ManageMent assistance teaM
D R A F T48 A P P E N D I C E S48