sandler sandler o’neill partners o ... - … · sm-all stars sandler o'neill does and seeks...
TRANSCRIPT
Sm-All Stars
Sandler O'Neill does and seeks to do business with companies covered in its research reports. As a result, investors should be aware thatSandler O'Neill may have a conflict of interest that could affect the objectivity of the report. Investors should consider this report as only a singlefactor in making their investment decision. Please see "Important Disclosures" and the analyst certifications in the Appendix of this report.
© Sandler O'Neill + Partners, L.P. All rights reserved.
NewYork
Research Depar tment
+ Atlanta + Boston + Chicago + SanFrancisco
SANDLER O’NEILL + PARTNERS
PARTNERS
O’NE ILL
SANDLER
+
2 0 1 5B
ank
&T
hri ft
Sm
-Al l
Stars
2015 Bank & Thrift
Mark Fitzgibbon, CFA Richard Repetto, CFA Jeffery J. Harte Principal & Principal Principal Director of Research
+ Northeast Banks & Thrifts Mark Fitzgibbon, CFA 212-466-7925 Frank Schiraldi, CFA 212-466-7931
Casey Orr 212-466-8061 Alex Twerdahl 212-466-7916
Anna Barnard 212-466-7921 Robert Haderer, CFA 212-466-7923 Nicholas Cucharale 212-466-7922
+ Midwest Banks & Thrifts R. Scott Siefers 212-466-7924
Brad J. Milsaps, CFA 404-442-2857 Andrew Liesch, CFA 415-978-5031
Matt Forgotson 212-466-8064 Peter Ruiz 404-442-2886
Brendan Nosal 212-466-7918
+ Southeast/Southwest Banks & Thrifts Brad J. Milsaps, CFA 404-442-2857
Stephen Scouten, CFA 404-442-2882 Casey Orr 212-466-8061
+ West Coast Banks & Thrifts Tim O’Brien 415-978-5033 Aaron Deer 415-978-5032
Brad J. Milsaps, CFA 404-442-2857 Andrew Liesch, CFA 415-978-5031
Alexander Morris 415-978-5034
+ Asset Manager Michael S. Kim 212-466-7722 Andrew Disdier 212-466-7805
+ eFinance
Richard Repetto, CFA 212-466-7906 Michael Adams, CFA 212-466-7962
Collin Cook 212-466-8065
+ Financial Technology & Specialty Finance
Christopher Donat, CFA 212-466-8068 Crispin Love 212-466-7938
+ Insurance
Paul Newsome 312-281-3445 John Barnidge 312-281-3412
+ Investment, Global, and Trust Banks
Jeffery Harte 312-281-3443 Sumeet Mody 312-281-3414
+ Real Estate
Alexander Goldfarb 212-466-7937 Ryan Peterson 212-466-7927
Robert Haderer, CFA 212-466-7923
Access National Corporation ~ ANCX Bank of the James Financial Group, Inc. ~ BOTJ
BofI Holding, Inc. ~ BOFI Cardinal Financial Corporation ~ CFNL
Cathay General Bancorp ~ CATY CB Financial Services, Inc. ~ CBFV
Eagle Bancorp, Inc. ~ EGBN Enterprise Financial Services Corp ~ EFSC
First of Long Island Corporation ~ FLIC Flushing Financial Corporation ~ FFIC
FS Bancorp, Inc. ~ FSBW Guaranty Bancorp ~ GBNK
Heritage Commerce Corp ~ HTBK Hilltop Holdings Inc. ~ HTH HomeStreet, Inc. ~ HMST
MainSource Financial Group, Inc.~ MSFG Monarch Financial Holdings, Inc. ~ MNRK
National Penn Bancshares, Inc. ~ NPBC NewBridge Bancorp ~ NBBC
Oritani Financial Corp. ~ ORIT Pacific Premier Bancorp, Inc. ~ PPBI
Patriot National Bancorp, Inc. ~ PNBK Peapack‐Gladstone Financial Corporation ~ PGC
Pinnacle Financial Partners, Inc. ~ PNFP Preferred Bank ~ PFBC
S&T Bancorp, Inc. ~ STBA ServisFirst Bancshares, Inc. ~ SFBS
Southern First Bancshares, Inc.~ SFST Southern Missouri Bancorp, Inc. ~ SMBC
Stonegate Bank ~ SGBK Suffolk Bancorp ~ SUBK
Texas Capital Bancshares, Inc. ~ TCBI United Community Banks, Inc. ~ UCBI
West Bancorporation, Inc. ~ WTBA
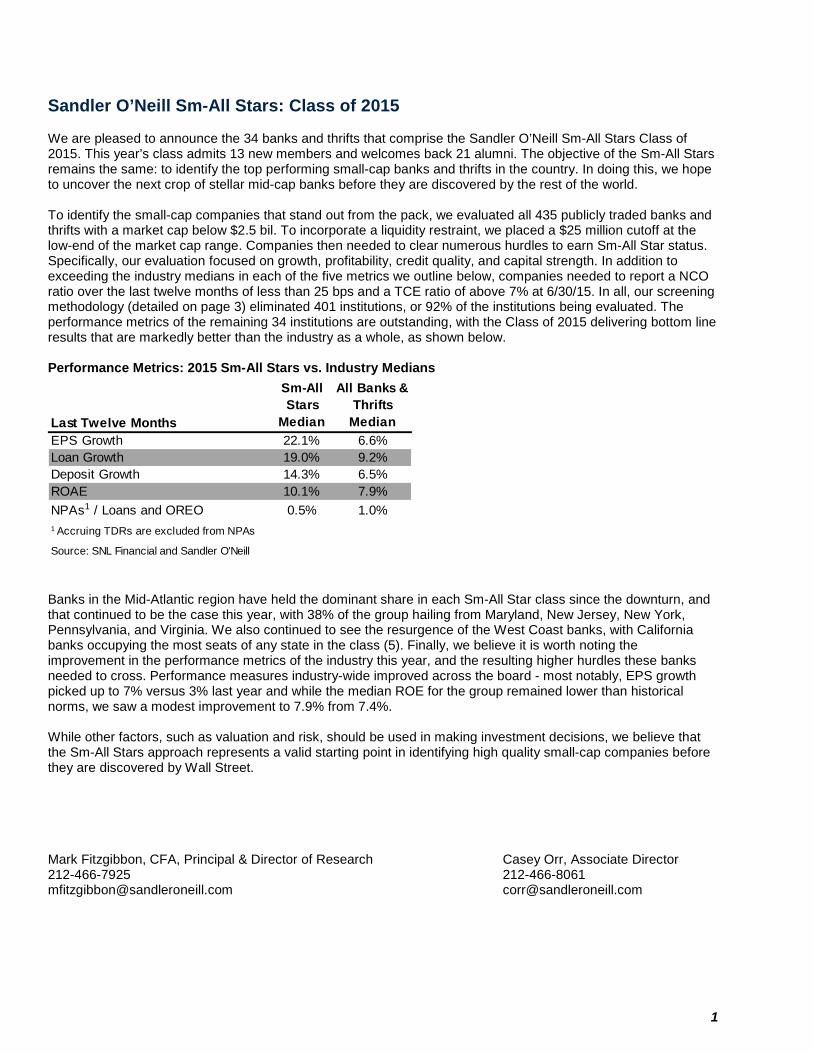
Sandler O’Neill Sm-All Stars: Class of 2015 We are pleased to announce the 34 banks and thrifts that comprise the Sandler O’Neill Sm-All Stars Class of 2015. This year’s class admits 13 new members and welcomes back 21 alumni. The objective of the Sm-All Stars remains the same: to identify the top performing small-cap banks and thrifts in the country. In doing this, we hope to uncover the next crop of stellar mid-cap banks before they are discovered by the rest of the world. To identify the small-cap companies that stand out from the pack, we evaluated all 435 publicly traded banks and thrifts with a market cap below $2.5 bil. To incorporate a liquidity restraint, we placed a $25 million cutoff at the low-end of the market cap range. Companies then needed to clear numerous hurdles to earn Sm-All Star status. Specifically, our evaluation focused on growth, profitability, credit quality, and capital strength. In addition to exceeding the industry medians in each of the five metrics we outline below, companies needed to report a NCO ratio over the last twelve months of less than 25 bps and a TCE ratio of above 7% at 6/30/15. In all, our screening methodology (detailed on page 3) eliminated 401 institutions, or 92% of the institutions being evaluated. The performance metrics of the remaining 34 institutions are outstanding, with the Class of 2015 delivering bottom line results that are markedly better than the industry as a whole, as shown below.
Performance Metrics: 2015 Sm-All Stars vs. Industry Medians
Banks in the Mid-Atlantic region have held the dominant share in each Sm-All Star class since the downturn, and that continued to be the case this year, with 38% of the group hailing from Maryland, New Jersey, New York, Pennsylvania, and Virginia. We also continued to see the resurgence of the West Coast banks, with California banks occupying the most seats of any state in the class (5). Finally, we believe it is worth noting the improvement in the performance metrics of the industry this year, and the resulting higher hurdles these banks needed to cross. Performance measures industry-wide improved across the board - most notably, EPS growth picked up to 7% versus 3% last year and while the median ROE for the group remained lower than historical norms, we saw a modest improvement to 7.9% from 7.4%. While other factors, such as valuation and risk, should be used in making investment decisions, we believe that the Sm-All Stars approach represents a valid starting point in identifying high quality small-cap companies before they are discovered by Wall Street.
Mark Fitzgibbon, CFA, Principal & Director of Research Casey Orr, Associate Director 212-466-7925 212-466-8061 [email protected] [email protected]
Last Twelve Months
Sm-All Stars
Median
All Banks & Thrifts
MedianEPS Growth 22.1% 6.6%Loan Growth 19.0% 9.2%Deposit Growth 14.3% 6.5%ROAE 10.1% 7.9%
NPAs1 / Loans and OREO 0.5% 1.0%1 Accruing TDRs are excluded from NPAs
Source: SNL Financial and Sandler O'Neill
1
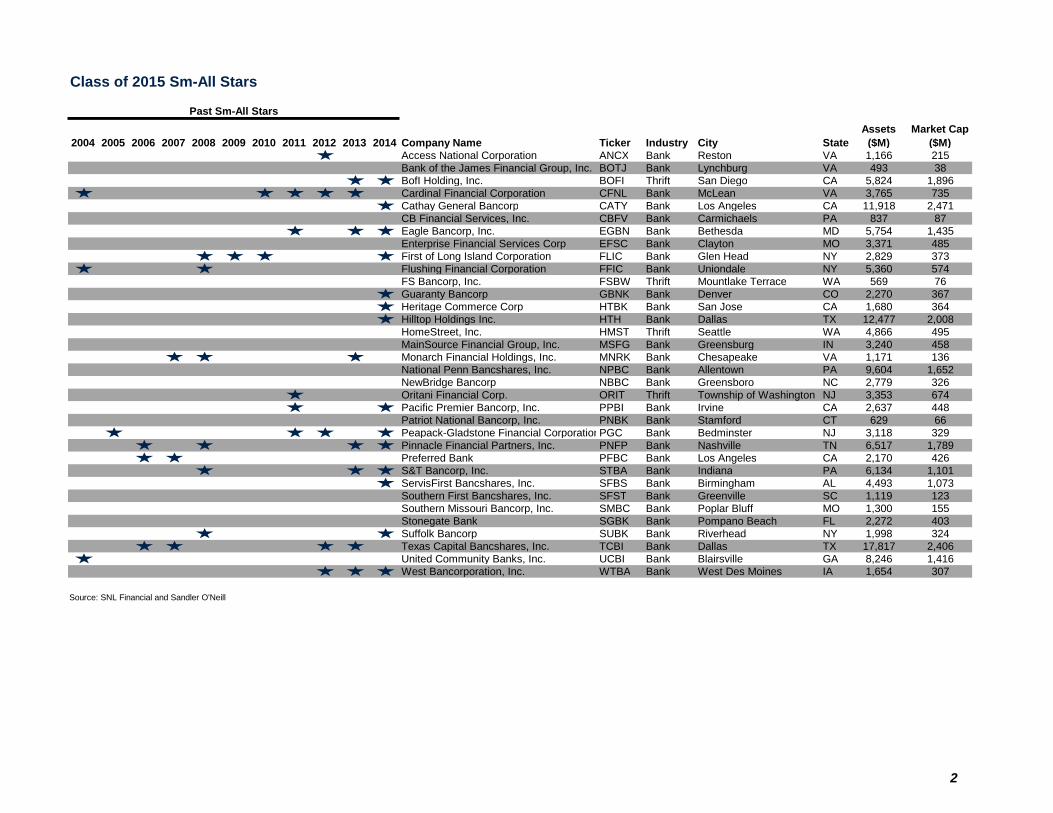
Class of 2015 Sm-All Stars
2004 2005 2006 2007 2008 2009 2010 2011 2012 2013 2014 Company Name Ticker Industry City StateAssets
($M)Market Cap
($M)Access National Corporation ANCX Bank Reston VA 1,166 215Bank of the James Financial Group, Inc. BOTJ Bank Lynchburg VA 493 38BofI Holding, Inc. BOFI Thrift San Diego CA 5,824 1,896Cardinal Financial Corporation CFNL Bank McLean VA 3,765 735Cathay General Bancorp CATY Bank Los Angeles CA 11,918 2,471
CB Financial Services, Inc. CBFV Bank Carmichaels PA 837 87Eagle Bancorp, Inc. EGBN Bank Bethesda MD 5,754 1,435Enterprise Financial Services Corp EFSC Bank Clayton MO 3,371 485First of Long Island Corporation FLIC Bank Glen Head NY 2,829 373Flushing Financial Corporation FFIC Bank Uniondale NY 5,360 574FS Bancorp, Inc. FSBW Thrift Mountlake Terrace WA 569 76Guaranty Bancorp GBNK Bank Denver CO 2,270 367Heritage Commerce Corp HTBK Bank San Jose CA 1,680 364Hilltop Holdings Inc. HTH Bank Dallas TX 12,477 2,008HomeStreet, Inc. HMST Thrift Seattle WA 4,866 495MainSource Financial Group, Inc. MSFG Bank Greensburg IN 3,240 458Monarch Financial Holdings, Inc. MNRK Bank Chesapeake VA 1,171 136National Penn Bancshares, Inc. NPBC Bank Allentown PA 9,604 1,652NewBridge Bancorp NBBC Bank Greensboro NC 2,779 326Oritani Financial Corp. ORIT Thrift Township of Washington NJ 3,353 674Pacific Premier Bancorp, Inc. PPBI Bank Irvine CA 2,637 448Patriot National Bancorp, Inc. PNBK Bank Stamford CT 629 66Peapack-Gladstone Financial CorporationPGC Bank Bedminster NJ 3,118 329Pinnacle Financial Partners, Inc. PNFP Bank Nashville TN 6,517 1,789Preferred Bank PFBC Bank Los Angeles CA 2,170 426S&T Bancorp, Inc. STBA Bank Indiana PA 6,134 1,101ServisFirst Bancshares, Inc. SFBS Bank Birmingham AL 4,493 1,073Southern First Bancshares, Inc. SFST Bank Greenville SC 1,119 123Southern Missouri Bancorp, Inc. SMBC Bank Poplar Bluff MO 1,300 155Stonegate Bank SGBK Bank Pompano Beach FL 2,272 403Suffolk Bancorp SUBK Bank Riverhead NY 1,998 324Texas Capital Bancshares, Inc. TCBI Bank Dallas TX 17,817 2,406United Community Banks, Inc. UCBI Bank Blairsville GA 8,246 1,416West Bancorporation, Inc. WTBA Bank West Des Moines IA 1,654 307
Source: SNL Financial and Sandler O'Neill
Past Sm-All Stars
2
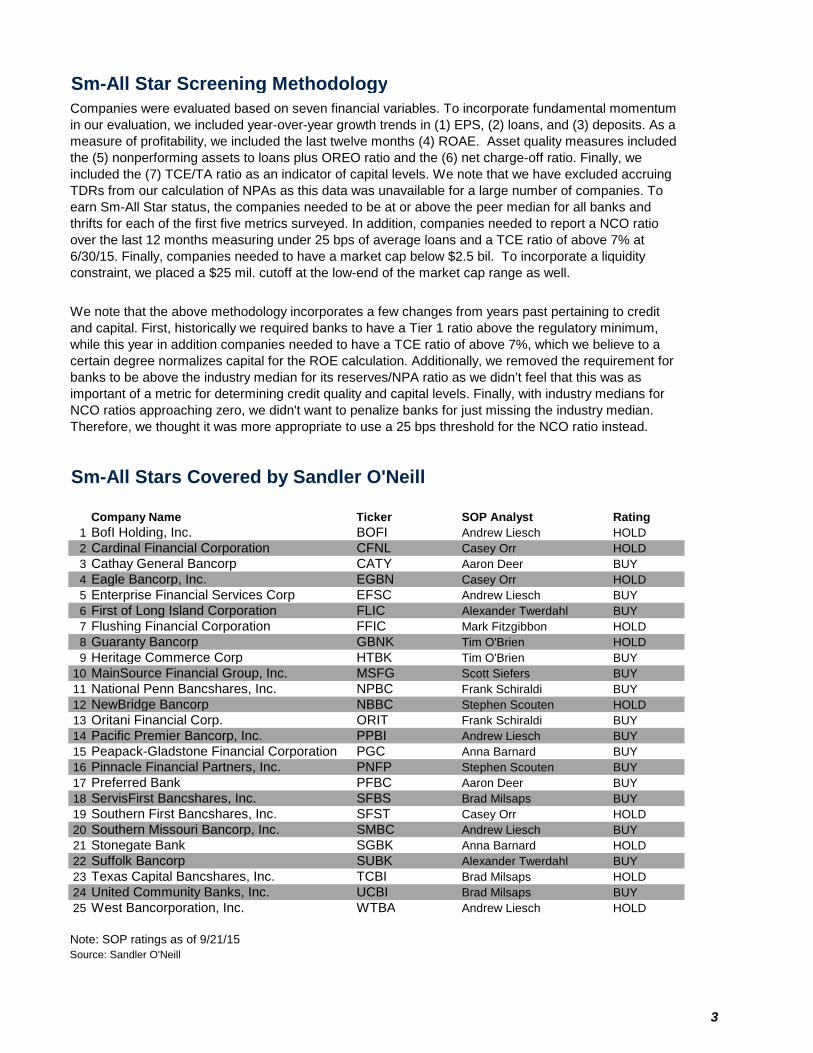
Sm-All Star Screening Methodology
Sm-All Stars Covered by Sandler O'Neill
Company Name Ticker SOP Analyst Rating1 BofI Holding, Inc. BOFI Andrew Liesch HOLD2 Cardinal Financial Corporation CFNL Casey Orr HOLD3 Cathay General Bancorp CATY Aaron Deer BUY4 Eagle Bancorp, Inc. EGBN Casey Orr HOLD5 Enterprise Financial Services Corp EFSC Andrew Liesch BUY6 First of Long Island Corporation FLIC Alexander Twerdahl BUY7 Flushing Financial Corporation FFIC Mark Fitzgibbon HOLD8 Guaranty Bancorp GBNK Tim O'Brien HOLD9 Heritage Commerce Corp HTBK Tim O'Brien BUY
10 MainSource Financial Group, Inc. MSFG Scott Siefers BUY11 National Penn Bancshares, Inc. NPBC Frank Schiraldi BUY12 NewBridge Bancorp NBBC Stephen Scouten HOLD13 Oritani Financial Corp. ORIT Frank Schiraldi BUY14 Pacific Premier Bancorp, Inc. PPBI Andrew Liesch BUY15 Peapack-Gladstone Financial Corporation PGC Anna Barnard BUY16 Pinnacle Financial Partners, Inc. PNFP Stephen Scouten BUY17 Preferred Bank PFBC Aaron Deer BUY18 ServisFirst Bancshares, Inc. SFBS Brad Milsaps BUY19 Southern First Bancshares, Inc. SFST Casey Orr HOLD20 Southern Missouri Bancorp, Inc. SMBC Andrew Liesch BUY21 Stonegate Bank SGBK Anna Barnard HOLD22 Suffolk Bancorp SUBK Alexander Twerdahl BUY23 Texas Capital Bancshares, Inc. TCBI Brad Milsaps HOLD24 United Community Banks, Inc. UCBI Brad Milsaps BUY25 West Bancorporation, Inc. WTBA Andrew Liesch HOLD
Note: SOP ratings as of 9/21/15Source: Sandler O'Neill
We note that the above methodology incorporates a few changes from years past pertaining to credit and capital. First, historically we required banks to have a Tier 1 ratio above the regulatory minimum, while this year in addition companies needed to have a TCE ratio of above 7%, which we believe to a certain degree normalizes capital for the ROE calculation. Additionally, we removed the requirement for banks to be above the industry median for its reserves/NPA ratio as we didn’t feel that this was as important of a metric for determining credit quality and capital levels. Finally, with industry medians for NCO ratios approaching zero, we didn't want to penalize banks for just missing the industry median. Therefore, we thought it was more appropriate to use a 25 bps threshold for the NCO ratio instead.
Companies were evaluated based on seven financial variables. To incorporate fundamental momentum in our evaluation, we included year-over-year growth trends in (1) EPS, (2) loans, and (3) deposits. As a measure of profitability, we included the last twelve months (4) ROAE. Asset quality measures included the (5) nonperforming assets to loans plus OREO ratio and the (6) net charge-off ratio. Finally, we included the (7) TCE/TA ratio as an indicator of capital levels. We note that we have excluded accruing TDRs from our calculation of NPAs as this data was unavailable for a large number of companies. To earn Sm-All Star status, the companies needed to be at or above the peer median for all banks and thrifts for each of the first five metrics surveyed. In addition, companies needed to report a NCO ratio over the last 12 months measuring under 25 bps of average loans and a TCE ratio of above 7% at 6/30/15. Finally, companies needed to have a market cap below $2.5 bil. To incorporate a liquidity constraint, we placed a $25 mil. cutoff at the low-end of the market cap range as well.
3
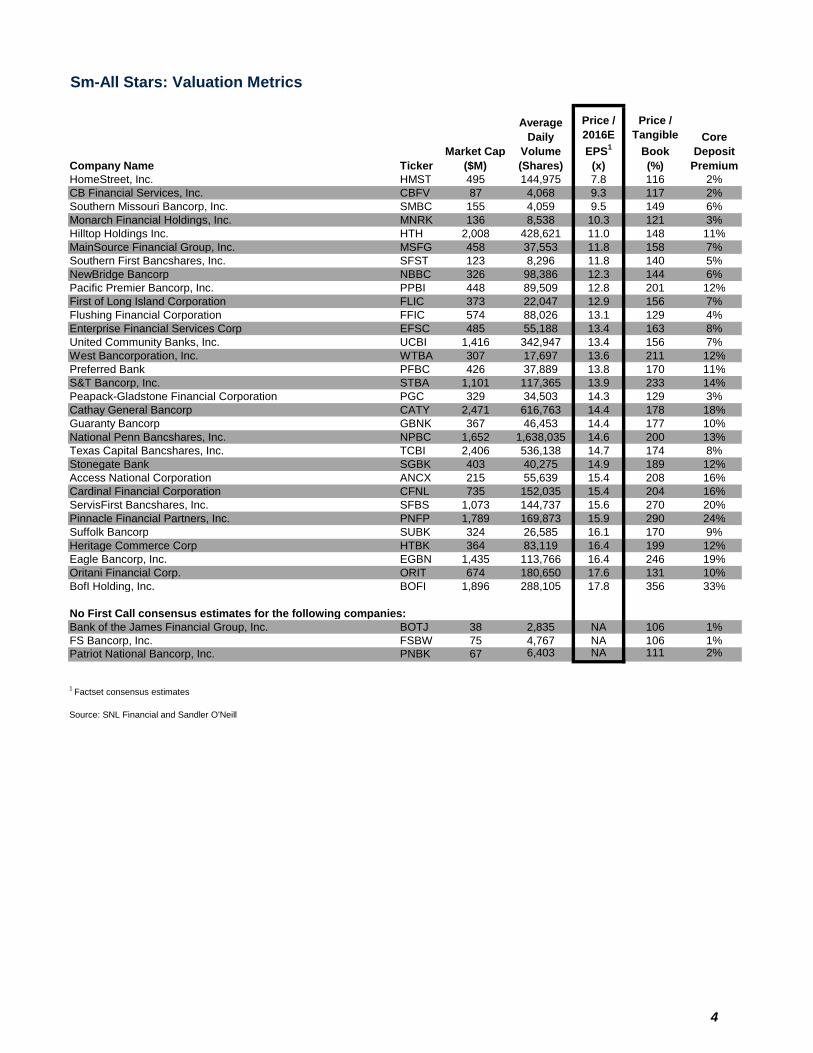
Sm-All Stars: Valuation Metrics
Company Name TickerMarket Cap
($M)
Average Daily
Volume (Shares)
Price / 2016E EPS1
(x)
Price / Tangible
Book (%)
Core Deposit
PremiumHomeStreet, Inc. HMST 495 144,975 7.8 116 2%CB Financial Services, Inc. CBFV 87 4,068 9.3 117 2%Southern Missouri Bancorp, Inc. SMBC 155 4,059 9.5 149 6%Monarch Financial Holdings, Inc. MNRK 136 8,538 10.3 121 3%Hilltop Holdings Inc. HTH 2,008 428,621 11.0 148 11%MainSource Financial Group, Inc. MSFG 458 37,553 11.8 158 7%Southern First Bancshares, Inc. SFST 123 8,296 11.8 140 5%NewBridge Bancorp NBBC 326 98,386 12.3 144 6%Pacific Premier Bancorp, Inc. PPBI 448 89,509 12.8 201 12%First of Long Island Corporation FLIC 373 22,047 12.9 156 7%Flushing Financial Corporation FFIC 574 88,026 13.1 129 4%Enterprise Financial Services Corp EFSC 485 55,188 13.4 163 8%United Community Banks, Inc. UCBI 1,416 342,947 13.4 156 7%West Bancorporation, Inc. WTBA 307 17,697 13.6 211 12%Preferred Bank PFBC 426 37,889 13.8 170 11%S&T Bancorp, Inc. STBA 1,101 117,365 13.9 233 14%Peapack-Gladstone Financial Corporation PGC 329 34,503 14.3 129 3%Cathay General Bancorp CATY 2,471 616,763 14.4 178 18%Guaranty Bancorp GBNK 367 46,453 14.4 177 10%National Penn Bancshares, Inc. NPBC 1,652 1,638,035 14.6 200 13%Texas Capital Bancshares, Inc. TCBI 2,406 536,138 14.7 174 8%Stonegate Bank SGBK 403 40,275 14.9 189 12%Access National Corporation ANCX 215 55,639 15.4 208 16%Cardinal Financial Corporation CFNL 735 152,035 15.4 204 16%ServisFirst Bancshares, Inc. SFBS 1,073 144,737 15.6 270 20%Pinnacle Financial Partners, Inc. PNFP 1,789 169,873 15.9 290 24%Suffolk Bancorp SUBK 324 26,585 16.1 170 9%Heritage Commerce Corp HTBK 364 83,119 16.4 199 12%Eagle Bancorp, Inc. EGBN 1,435 113,766 16.4 246 19%Oritani Financial Corp. ORIT 674 180,650 17.6 131 10%BofI Holding, Inc. BOFI 1,896 288,105 17.8 356 33%
No First Call consensus estimates for the following companies:Bank of the James Financial Group, Inc. BOTJ 38 2,835 NA 106 1%FS Bancorp, Inc. FSBW 75 4,767 NA 106 1%Patriot National Bancorp, Inc. PNBK 67 6,403 NA 111 2%
1 Factset consensus estimates
Source: SNL Financial and Sandler O'Neill
4
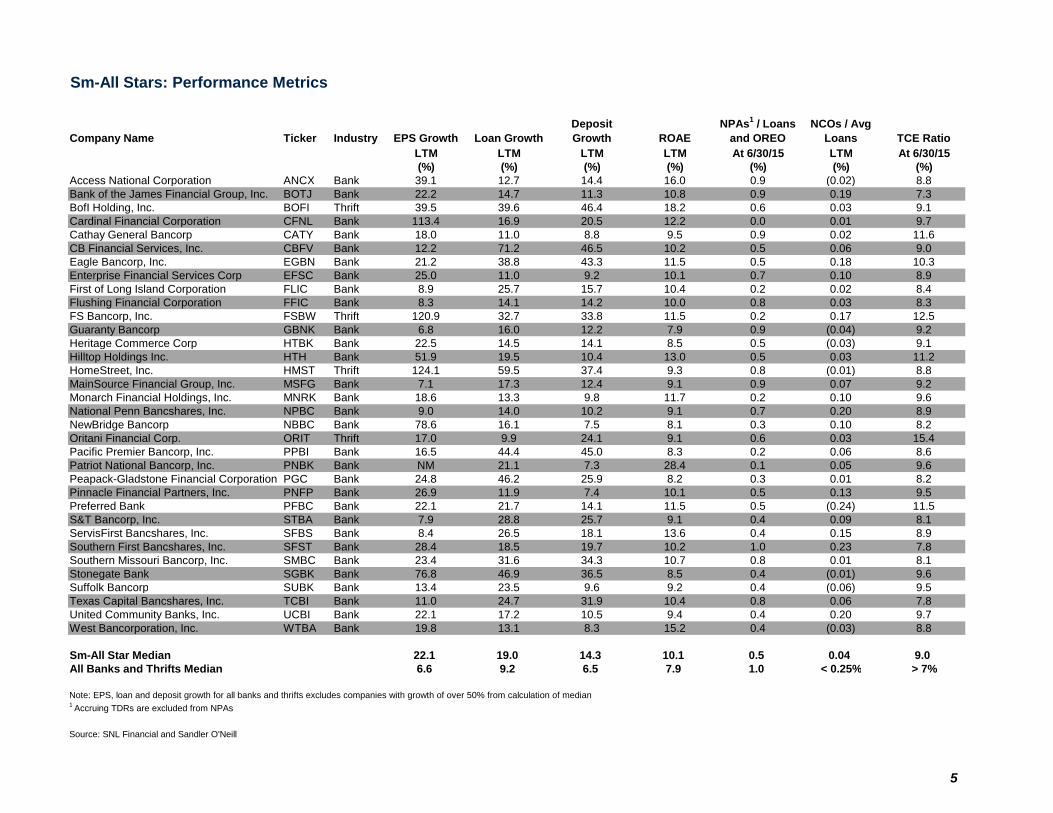
Sm-All Stars: Performance Metrics
Company Name Ticker Industry EPS Growth Loan GrowthDeposit Growth ROAE
NPAs1 / Loans and OREO
NCOs / Avg Loans TCE Ratio
LTM LTM LTM LTM At 6/30/15 LTM At 6/30/15(%) (%) (%) (%) (%) (%) (%)
Access National Corporation ANCX Bank 39.1 12.7 14.4 16.0 0.9 (0.02) 8.8 Bank of the James Financial Group, Inc. BOTJ Bank 22.2 14.7 11.3 10.8 0.9 0.19 7.3 BofI Holding, Inc. BOFI Thrift 39.5 39.6 46.4 18.2 0.6 0.03 9.1 Cardinal Financial Corporation CFNL Bank 113.4 16.9 20.5 12.2 0.0 0.01 9.7 Cathay General Bancorp CATY Bank 18.0 11.0 8.8 9.5 0.9 0.02 11.6 CB Financial Services, Inc. CBFV Bank 12.2 71.2 46.5 10.2 0.5 0.06 9.0 Eagle Bancorp, Inc. EGBN Bank 21.2 38.8 43.3 11.5 0.5 0.18 10.3 Enterprise Financial Services Corp EFSC Bank 25.0 11.0 9.2 10.1 0.7 0.10 8.9 First of Long Island Corporation FLIC Bank 8.9 25.7 15.7 10.4 0.2 0.02 8.4 Flushing Financial Corporation FFIC Bank 8.3 14.1 14.2 10.0 0.8 0.03 8.3 FS Bancorp, Inc. FSBW Thrift 120.9 32.7 33.8 11.5 0.2 0.17 12.5 Guaranty Bancorp GBNK Bank 6.8 16.0 12.2 7.9 0.9 (0.04) 9.2 Heritage Commerce Corp HTBK Bank 22.5 14.5 14.1 8.5 0.5 (0.03) 9.1 Hilltop Holdings Inc. HTH Bank 51.9 19.5 10.4 13.0 0.5 0.03 11.2 HomeStreet, Inc. HMST Thrift 124.1 59.5 37.4 9.3 0.8 (0.01) 8.8 MainSource Financial Group, Inc. MSFG Bank 7.1 17.3 12.4 9.1 0.9 0.07 9.2 Monarch Financial Holdings, Inc. MNRK Bank 18.6 13.3 9.8 11.7 0.2 0.10 9.6 National Penn Bancshares, Inc. NPBC Bank 9.0 14.0 10.2 9.1 0.7 0.20 8.9 NewBridge Bancorp NBBC Bank 78.6 16.1 7.5 8.1 0.3 0.10 8.2 Oritani Financial Corp. ORIT Thrift 17.0 9.9 24.1 9.1 0.6 0.03 15.4 Pacific Premier Bancorp, Inc. PPBI Bank 16.5 44.4 45.0 8.3 0.2 0.06 8.6 Patriot National Bancorp, Inc. PNBK Bank NM 21.1 7.3 28.4 0.1 0.05 9.6 Peapack-Gladstone Financial Corporation PGC Bank 24.8 46.2 25.9 8.2 0.3 0.01 8.2 Pinnacle Financial Partners, Inc. PNFP Bank 26.9 11.9 7.4 10.1 0.5 0.13 9.5 Preferred Bank PFBC Bank 22.1 21.7 14.1 11.5 0.5 (0.24) 11.5 S&T Bancorp, Inc. STBA Bank 7.9 28.8 25.7 9.1 0.4 0.09 8.1 ServisFirst Bancshares, Inc. SFBS Bank 8.4 26.5 18.1 13.6 0.4 0.15 8.9 Southern First Bancshares, Inc. SFST Bank 28.4 18.5 19.7 10.2 1.0 0.23 7.8 Southern Missouri Bancorp, Inc. SMBC Bank 23.4 31.6 34.3 10.7 0.8 0.01 8.1 Stonegate Bank SGBK Bank 76.8 46.9 36.5 8.5 0.4 (0.01) 9.6 Suffolk Bancorp SUBK Bank 13.4 23.5 9.6 9.2 0.4 (0.06) 9.5 Texas Capital Bancshares, Inc. TCBI Bank 11.0 24.7 31.9 10.4 0.8 0.06 7.8 United Community Banks, Inc. UCBI Bank 22.1 17.2 10.5 9.4 0.4 0.20 9.7 West Bancorporation, Inc. WTBA Bank 19.8 13.1 8.3 15.2 0.4 (0.03) 8.8 Sm-All Star Median 22.1 19.0 14.3 10.1 0.5 0.04 9.0All Banks and Thrifts Median 6.6 9.2 6.5 7.9 1.0 < 0.25% > 7%
Note: EPS, loan and deposit growth for all banks and thrifts excludes companies with growth of over 50% from calculation of median1 Accruing TDRs are excluded from NPAs
Source: SNL Financial and Sandler O'Neill
5
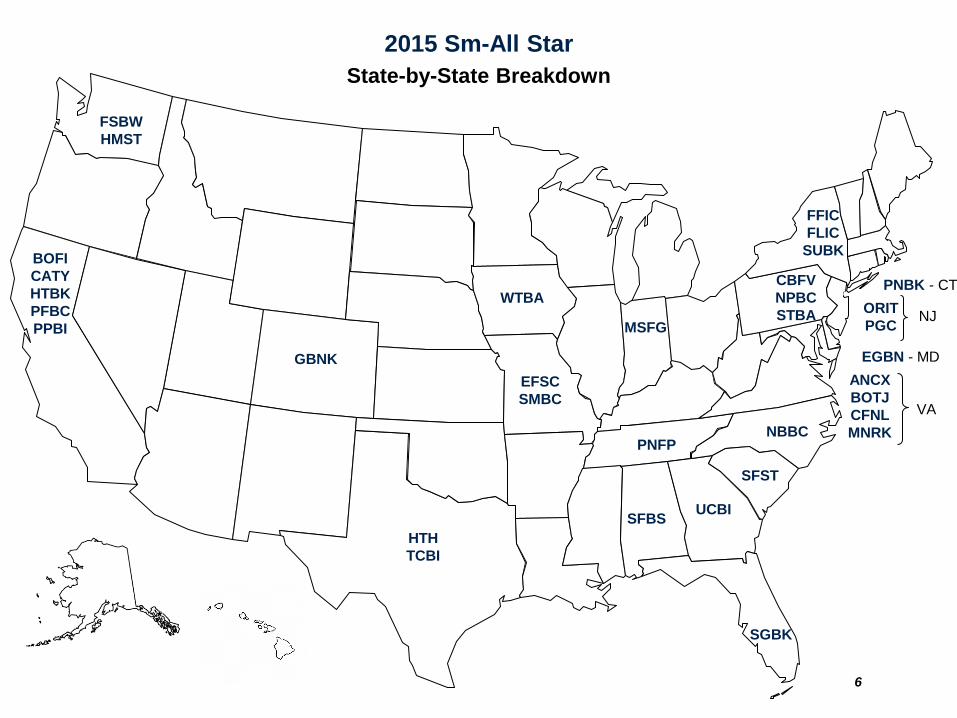
2015 Sm-All Star
State-by-State Breakdown
CBFV
NPBC
STBA
BOFI
CATY
HTBK
PFBC
PPBI
ORIT
PGC
NJ
PNFP
EGBN - MD
SFBS
HTH
TCBI
MSFG
WTBA
GBNK
FFIC
FLIC
SUBK
SGBK
PNBK - CT
UCBI
EFSC
SMBC
NBBC
SFST
FSBW
HMST
ANCX
BOTJ
CFNL
MNRK
VA
6
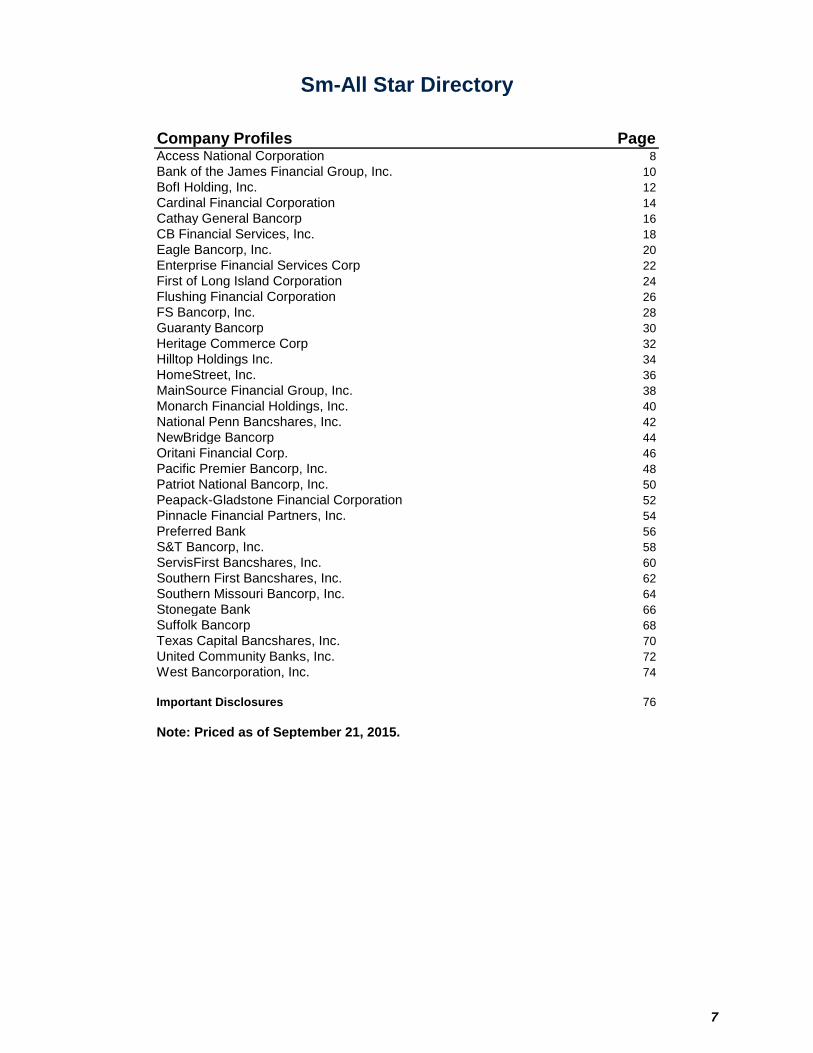
Company Profiles PageAccess National Corporation 8Bank of the James Financial Group, Inc. 10BofI Holding, Inc. 12Cardinal Financial Corporation 14Cathay General Bancorp 16CB Financial Services, Inc. 18Eagle Bancorp, Inc. 20Enterprise Financial Services Corp 22First of Long Island Corporation 24Flushing Financial Corporation 26FS Bancorp, Inc. 28Guaranty Bancorp 30Heritage Commerce Corp 32Hilltop Holdings Inc. 34HomeStreet, Inc. 36MainSource Financial Group, Inc. 38Monarch Financial Holdings, Inc. 40National Penn Bancshares, Inc. 42NewBridge Bancorp 44Oritani Financial Corp. 46Pacific Premier Bancorp, Inc. 48Patriot National Bancorp, Inc. 50Peapack-Gladstone Financial Corporation 52Pinnacle Financial Partners, Inc. 54Preferred Bank 56S&T Bancorp, Inc. 58ServisFirst Bancshares, Inc. 60Southern First Bancshares, Inc. 62Southern Missouri Bancorp, Inc. 64Stonegate Bank 66Suffolk Bancorp 68Texas Capital Bancshares, Inc. 70United Community Banks, Inc. 72West Bancorporation, Inc. 74
Important Disclosures 76
Note: Priced as of September 21, 2015.
Sm-All Star Directory
7
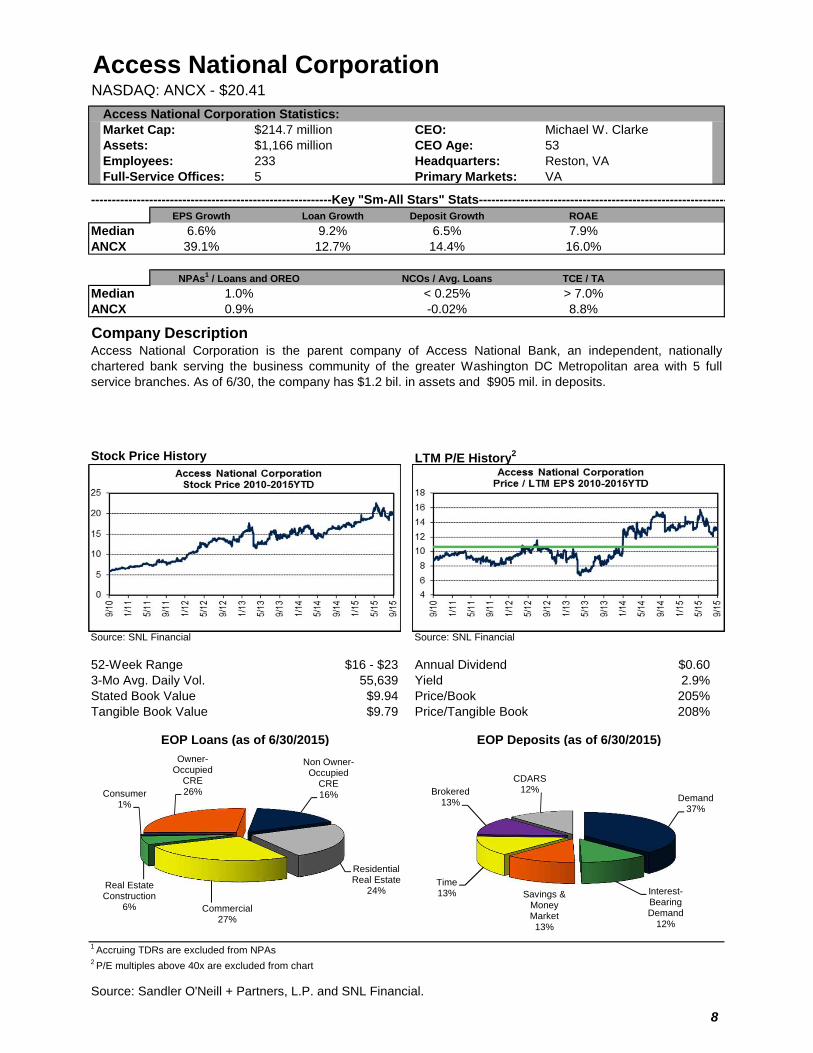
Access National CorporationNASDAQ: ANCX - $20.41
Access National Corporation Statistics:Market Cap: $214.7 million CEO: Michael W. ClarkeAssets: $1,166 million CEO Age: 53Employees: 233 Headquarters: Reston, VAFull-Service Offices: 5 Primary Markets: VA
----------------------------------------------------------Key "Sm-All Stars" Stats------------------------------------------------------------EPS Growth Loan Growth Deposit Growth ROAE
Median 6.6% 9.2% 6.5% 7.9%ANCX 39.1% 12.7% 14.4% 16.0%
NCOs / Avg. Loans TCE / TA
Median < 0.25% > 7.0%ANCX -0.02% 8.8%
Company Description
Stock Price History LTM P/E History2
Source: SNL Financial Source: SNL Financial
52-Week Range $16 - $23 Annual Dividend $0.603-Mo Avg. Daily Vol. 55,639 Yield 2.9%Stated Book Value $9.94 Price/Book 205%Tangible Book Value $9.79 Price/Tangible Book 208%
EOP Loans (as of 6/30/2015) EOP Deposits (as of 6/30/2015)
1 Accruing TDRs are excluded from NPAs2 P/E multiples above 40x are excluded from chart
Source: Sandler O'Neill + Partners, L.P. and SNL Financial.
Access National Corporation is the parent company of Access National Bank, an independent, nationallychartered bank serving the business community of the greater Washington DC Metropolitan area with 5 fullservice branches. As of 6/30, the company has $1.2 bil. in assets and $905 mil. in deposits.
NPAs1 / Loans and OREO
1.0%0.9%
Owner-Occupied
CRE26%
Non Owner-Occupied
CRE16%
Residential Real Estate
24%
Commercial27%
Real Estate Construction
6%
Consumer1%
Demand37%
Interest-Bearing Demand
12%
Savings & Money Market13%
Time13%
Brokered13%
CDARS12%
8
Access National Corporation ANCX
Quarterly Snapshot 0.23
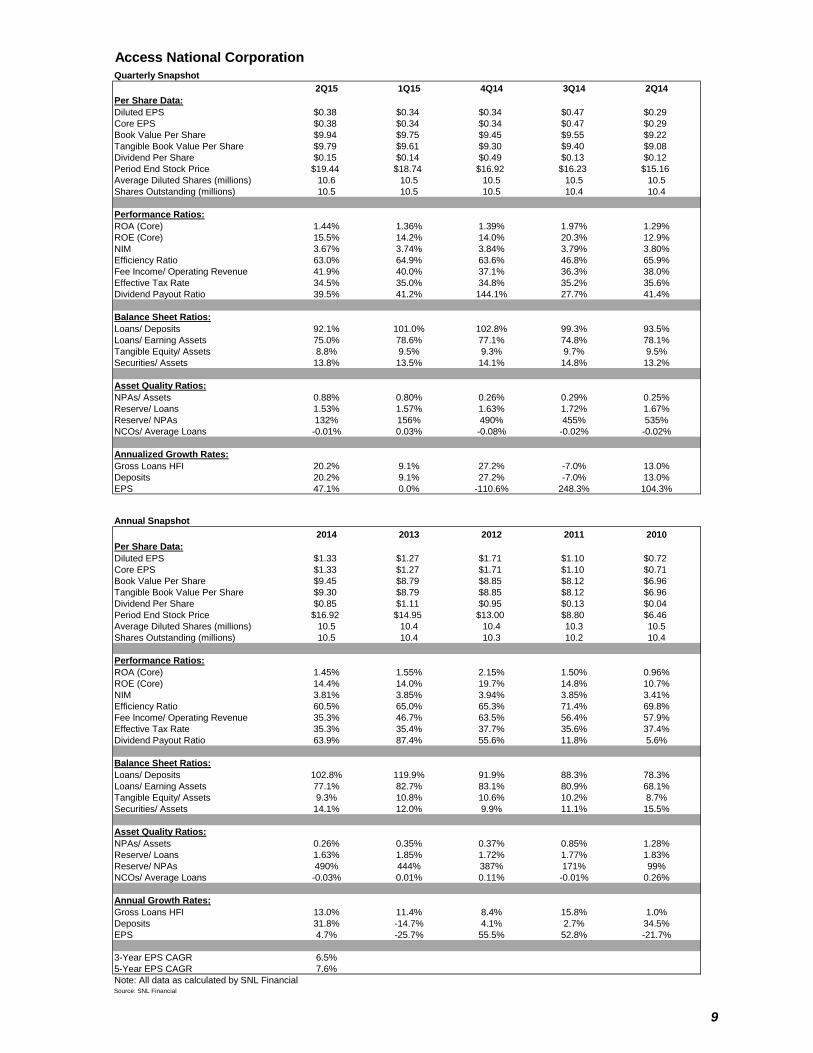
2Q15 1Q15 4Q14 3Q14 2Q14Per Share Data:Diluted EPS $0.38 $0.34 $0.34 $0.47 $0.29Core EPS $0.38 $0.34 $0.34 $0.47 $0.29Book Value Per Share $9.94 $9.75 $9.45 $9.55 $9.22Tangible Book Value Per Share $9.79 $9.61 $9.30 $9.40 $9.08Dividend Per Share $0.15 $0.14 $0.49 $0.13 $0.12Period End Stock Price $19.44 $18.74 $16.92 $16.23 $15.16Average Diluted Shares (millions) 10.6 10.5 10.5 10.5 10.5Shares Outstanding (millions) 10.5 10.5 10.5 10.4 10.4
Performance Ratios:ROA (Core) 1.44% 1.36% 1.39% 1.97% 1.29%ROE (Core) 15.5% 14.2% 14.0% 20.3% 12.9%NIM 3.67% 3.74% 3.84% 3.79% 3.80%Efficiency Ratio 63.0% 64.9% 63.6% 46.8% 65.9%Fee Income/ Operating Revenue 41.9% 40.0% 37.1% 36.3% 38.0%Effective Tax Rate 34.5% 35.0% 34.8% 35.2% 35.6%Dividend Payout Ratio 39.5% 41.2% 144.1% 27.7% 41.4%
Balance Sheet Ratios:Loans/ Deposits 92.1% 101.0% 102.8% 99.3% 93.5%Loans/ Earning Assets 75.0% 78.6% 77.1% 74.8% 78.1%Tangible Equity/ Assets 8.8% 9.5% 9.3% 9.7% 9.5%Securities/ Assets 13.8% 13.5% 14.1% 14.8% 13.2%
Asset Quality Ratios:NPAs/ Assets 0.88% 0.80% 0.26% 0.29% 0.25%Reserve/ Loans 1.53% 1.57% 1.63% 1.72% 1.67%Reserve/ NPAs 132% 156% 490% 455% 535%NCOs/ Average Loans -0.01% 0.03% -0.08% -0.02% -0.02%
Annualized Growth Rates:Gross Loans HFI 20.2% 9.1% 27.2% -7.0% 13.0%Deposits 20.2% 9.1% 27.2% -7.0% 13.0%EPS 47.1% 0.0% -110.6% 248.3% 104.3%
Annual Snapshot2014 2013 2012 2011 2010
Per Share Data:Diluted EPS $1.33 $1.27 $1.71 $1.10 $0.72Core EPS $1.33 $1.27 $1.71 $1.10 $0.71Book Value Per Share $9.45 $8.79 $8.85 $8.12 $6.96Tangible Book Value Per Share $9.30 $8.79 $8.85 $8.12 $6.96Dividend Per Share $0.85 $1.11 $0.95 $0.13 $0.04Period End Stock Price $16.92 $14.95 $13.00 $8.80 $6.46Average Diluted Shares (millions) 10.5 10.4 10.4 10.3 10.5Shares Outstanding (millions) 10.5 10.4 10.3 10.2 10.4
Performance Ratios:ROA (Core) 1.45% 1.55% 2.15% 1.50% 0.96%ROE (Core) 14.4% 14.0% 19.7% 14.8% 10.7%NIM 3.81% 3.85% 3.94% 3.85% 3.41%Efficiency Ratio 60.5% 65.0% 65.3% 71.4% 69.8%Fee Income/ Operating Revenue 35.3% 46.7% 63.5% 56.4% 57.9%Effective Tax Rate 35.3% 35.4% 37.7% 35.6% 37.4%Dividend Payout Ratio 63.9% 87.4% 55.6% 11.8% 5.6%
Balance Sheet Ratios:Loans/ Deposits 102.8% 119.9% 91.9% 88.3% 78.3%Loans/ Earning Assets 77.1% 82.7% 83.1% 80.9% 68.1%Tangible Equity/ Assets 9.3% 10.8% 10.6% 10.2% 8.7%Securities/ Assets 14.1% 12.0% 9.9% 11.1% 15.5%
Asset Quality Ratios:NPAs/ Assets 0.26% 0.35% 0.37% 0.85% 1.28%Reserve/ Loans 1.63% 1.85% 1.72% 1.77% 1.83%Reserve/ NPAs 490% 444% 387% 171% 99%NCOs/ Average Loans -0.03% 0.01% 0.11% -0.01% 0.26%
Annual Growth Rates:Gross Loans HFI 13.0% 11.4% 8.4% 15.8% 1.0%Deposits 31.8% -14.7% 4.1% 2.7% 34.5%EPS 4.7% -25.7% 55.5% 52.8% -21.7%
3-Year EPS CAGR 6.5%5-Year EPS CAGR 7.6%Note: All data as calculated by SNL FinancialSource: SNL Financial
9
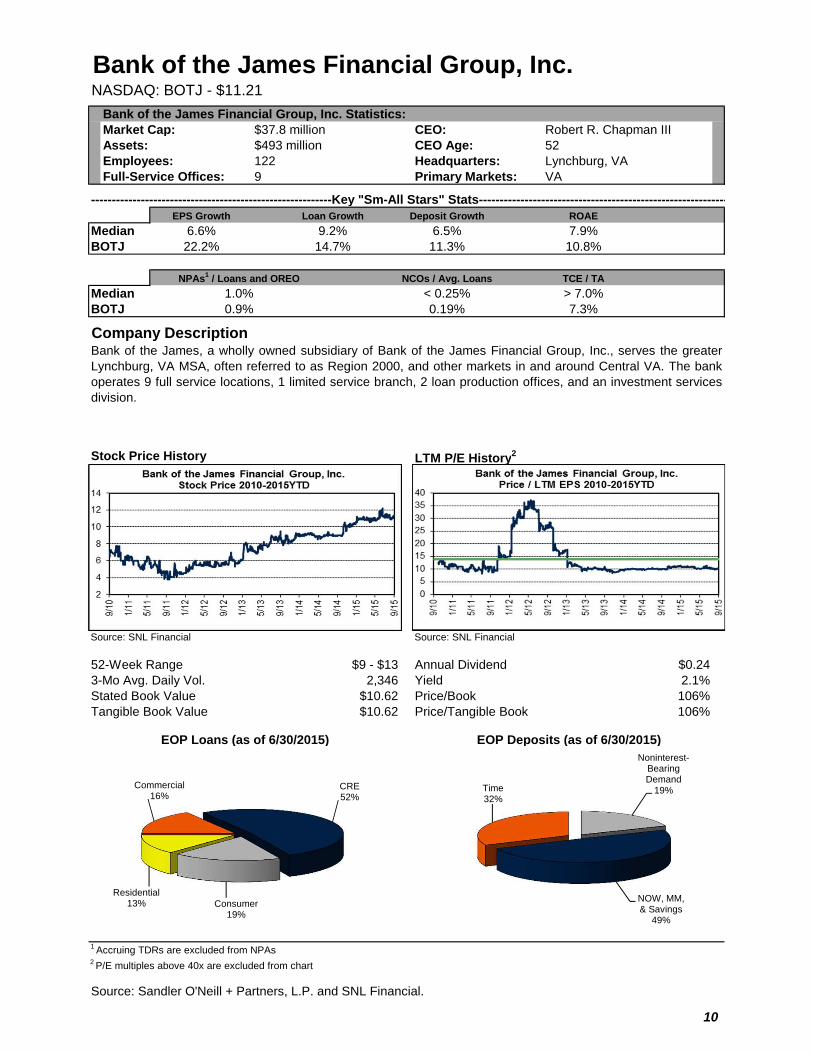
Bank of the James Financial Group, Inc.NASDAQ: BOTJ - $11.21
Bank of the James Financial Group, Inc. Statistics:Market Cap: $37.8 million CEO: Robert R. Chapman IIIAssets: $493 million CEO Age: 52Employees: 122 Headquarters: Lynchburg, VAFull-Service Offices: 9 Primary Markets: VA
----------------------------------------------------------Key "Sm-All Stars" Stats------------------------------------------------------------EPS Growth Loan Growth Deposit Growth ROAE
Median 6.6% 9.2% 6.5% 7.9%BOTJ 22.2% 14.7% 11.3% 10.8%
NCOs / Avg. Loans TCE / TA
Median < 0.25% > 7.0%BOTJ 0.19% 7.3%
Company Description
Stock Price History LTM P/E History2
Source: SNL Financial Source: SNL Financial
52-Week Range $9 - $13 Annual Dividend $0.243-Mo Avg. Daily Vol. 2,346 Yield 2.1%Stated Book Value $10.62 Price/Book 106%Tangible Book Value $10.62 Price/Tangible Book 106%
EOP Loans (as of 6/30/2015) EOP Deposits (as of 6/30/2015)
1 Accruing TDRs are excluded from NPAs2 P/E multiples above 40x are excluded from chart
Source: Sandler O'Neill + Partners, L.P. and SNL Financial.
Bank of the James, a wholly owned subsidiary of Bank of the James Financial Group, Inc., serves the greaterLynchburg, VA MSA, often referred to as Region 2000, and other markets in and around Central VA. The bankoperates 9 full service locations, 1 limited service branch, 2 loan production offices, and an investment servicesdivision.
NPAs1 / Loans and OREO
1.0%0.9%
Commercial16%
CRE52%
Consumer19%
Residential13%
Noninterest-Bearing Demand
19%
NOW, MM, & Savings
49%
Time32%
10
Bank of the James Financial Group, Inc. BOTJ
Quarterly Snapshot 0.21
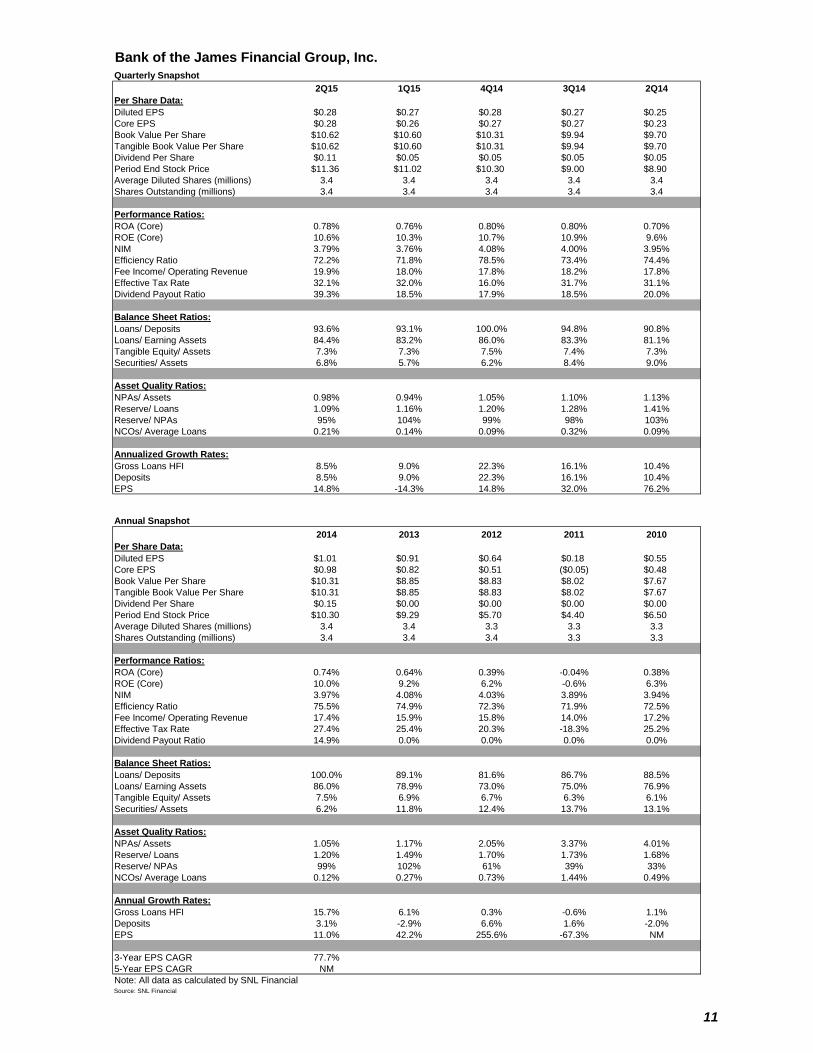
2Q15 1Q15 4Q14 3Q14 2Q14Per Share Data:Diluted EPS $0.28 $0.27 $0.28 $0.27 $0.25Core EPS $0.28 $0.26 $0.27 $0.27 $0.23Book Value Per Share $10.62 $10.60 $10.31 $9.94 $9.70Tangible Book Value Per Share $10.62 $10.60 $10.31 $9.94 $9.70Dividend Per Share $0.11 $0.05 $0.05 $0.05 $0.05Period End Stock Price $11.36 $11.02 $10.30 $9.00 $8.90Average Diluted Shares (millions) 3.4 3.4 3.4 3.4 3.4Shares Outstanding (millions) 3.4 3.4 3.4 3.4 3.4
Performance Ratios:ROA (Core) 0.78% 0.76% 0.80% 0.80% 0.70%ROE (Core) 10.6% 10.3% 10.7% 10.9% 9.6%NIM 3.79% 3.76% 4.08% 4.00% 3.95%Efficiency Ratio 72.2% 71.8% 78.5% 73.4% 74.4%Fee Income/ Operating Revenue 19.9% 18.0% 17.8% 18.2% 17.8%Effective Tax Rate 32.1% 32.0% 16.0% 31.7% 31.1%Dividend Payout Ratio 39.3% 18.5% 17.9% 18.5% 20.0%
Balance Sheet Ratios:Loans/ Deposits 93.6% 93.1% 100.0% 94.8% 90.8%Loans/ Earning Assets 84.4% 83.2% 86.0% 83.3% 81.1%Tangible Equity/ Assets 7.3% 7.3% 7.5% 7.4% 7.3%Securities/ Assets 6.8% 5.7% 6.2% 8.4% 9.0%
Asset Quality Ratios:NPAs/ Assets 0.98% 0.94% 1.05% 1.10% 1.13%Reserve/ Loans 1.09% 1.16% 1.20% 1.28% 1.41%Reserve/ NPAs 95% 104% 99% 98% 103%NCOs/ Average Loans 0.21% 0.14% 0.09% 0.32% 0.09%
Annualized Growth Rates:Gross Loans HFI 8.5% 9.0% 22.3% 16.1% 10.4%Deposits 8.5% 9.0% 22.3% 16.1% 10.4%EPS 14.8% -14.3% 14.8% 32.0% 76.2%
Annual Snapshot2014 2013 2012 2011 2010
Per Share Data:Diluted EPS $1.01 $0.91 $0.64 $0.18 $0.55Core EPS $0.98 $0.82 $0.51 ($0.05) $0.48Book Value Per Share $10.31 $8.85 $8.83 $8.02 $7.67Tangible Book Value Per Share $10.31 $8.85 $8.83 $8.02 $7.67Dividend Per Share $0.15 $0.00 $0.00 $0.00 $0.00Period End Stock Price $10.30 $9.29 $5.70 $4.40 $6.50Average Diluted Shares (millions) 3.4 3.4 3.3 3.3 3.3Shares Outstanding (millions) 3.4 3.4 3.4 3.3 3.3
Performance Ratios:ROA (Core) 0.74% 0.64% 0.39% -0.04% 0.38%ROE (Core) 10.0% 9.2% 6.2% -0.6% 6.3%NIM 3.97% 4.08% 4.03% 3.89% 3.94%Efficiency Ratio 75.5% 74.9% 72.3% 71.9% 72.5%Fee Income/ Operating Revenue 17.4% 15.9% 15.8% 14.0% 17.2%Effective Tax Rate 27.4% 25.4% 20.3% -18.3% 25.2%Dividend Payout Ratio 14.9% 0.0% 0.0% 0.0% 0.0%
Balance Sheet Ratios:Loans/ Deposits 100.0% 89.1% 81.6% 86.7% 88.5%Loans/ Earning Assets 86.0% 78.9% 73.0% 75.0% 76.9%Tangible Equity/ Assets 7.5% 6.9% 6.7% 6.3% 6.1%Securities/ Assets 6.2% 11.8% 12.4% 13.7% 13.1%
Asset Quality Ratios:NPAs/ Assets 1.05% 1.17% 2.05% 3.37% 4.01%Reserve/ Loans 1.20% 1.49% 1.70% 1.73% 1.68%Reserve/ NPAs 99% 102% 61% 39% 33%NCOs/ Average Loans 0.12% 0.27% 0.73% 1.44% 0.49%
Annual Growth Rates:Gross Loans HFI 15.7% 6.1% 0.3% -0.6% 1.1%Deposits 3.1% -2.9% 6.6% 1.6% -2.0%EPS 11.0% 42.2% 255.6% -67.3% NM
3-Year EPS CAGR 77.7%5-Year EPS CAGR NMNote: All data as calculated by SNL FinancialSource: SNL Financial
11
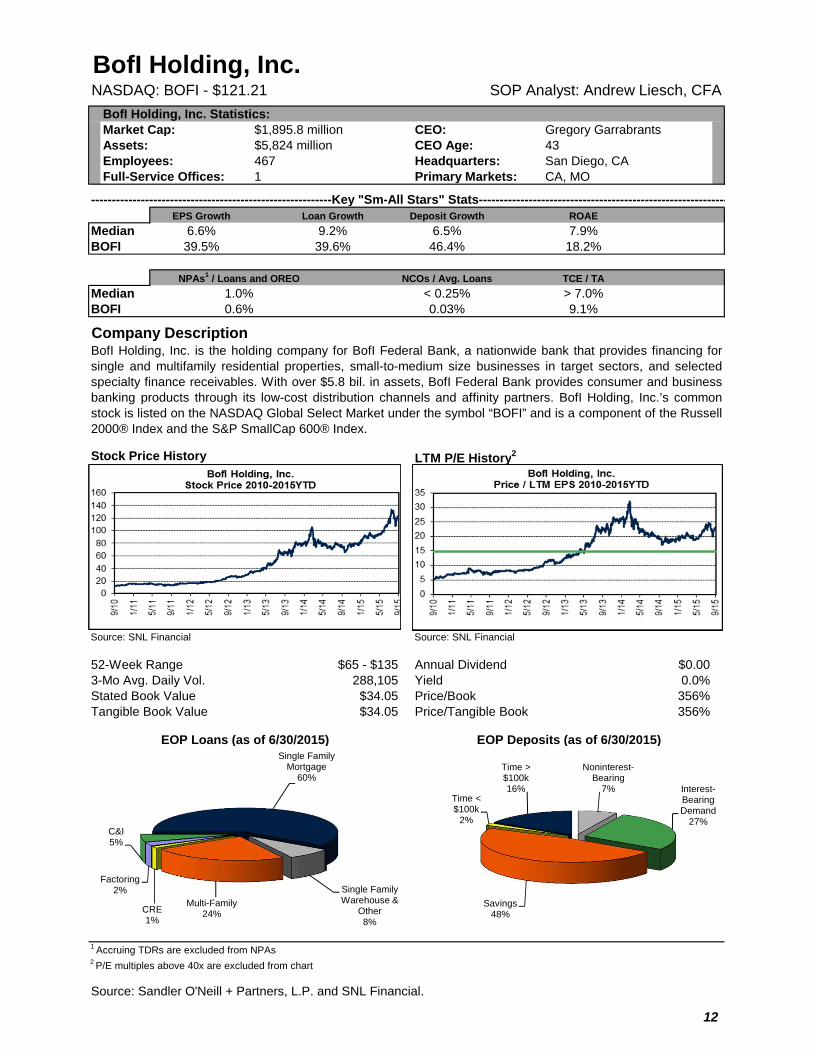
BofI Holding, Inc.NASDAQ: BOFI - $121.21 SOP Analyst: Andrew Liesch, CFA
BofI Holding, Inc. Statistics:Market Cap: $1,895.8 million CEO: Gregory GarrabrantsAssets: $5,824 million CEO Age: 43Employees: 467 Headquarters: San Diego, CAFull-Service Offices: 1 Primary Markets: CA, MO
----------------------------------------------------------Key "Sm-All Stars" Stats------------------------------------------------------------EPS Growth Loan Growth Deposit Growth ROAE
Median 6.6% 9.2% 6.5% 7.9%BOFI 39.5% 39.6% 46.4% 18.2%
NCOs / Avg. Loans TCE / TA
Median < 0.25% > 7.0%BOFI 0.03% 9.1%
Company Description
Stock Price History LTM P/E History2
Source: SNL Financial Source: SNL Financial
52-Week Range $65 - $135 Annual Dividend $0.003-Mo Avg. Daily Vol. 288,105 Yield 0.0%Stated Book Value $34.05 Price/Book 356%Tangible Book Value $34.05 Price/Tangible Book 356%
EOP Loans (as of 6/30/2015) EOP Deposits (as of 6/30/2015)
1 Accruing TDRs are excluded from NPAs2 P/E multiples above 40x are excluded from chart
Source: Sandler O'Neill + Partners, L.P. and SNL Financial.
BofI Holding, Inc. is the holding company for BofI Federal Bank, a nationwide bank that provides financing forsingle and multifamily residential properties, small-to-medium size businesses in target sectors, and selectedspecialty finance receivables. With over $5.8 bil. in assets, BofI Federal Bank provides consumer and businessbanking products through its low-cost distribution channels and affinity partners. BofI Holding, Inc.’s commonstock is listed on the NASDAQ Global Select Market under the symbol “BOFI” and is a component of the Russell2000® Index and the S&P SmallCap 600® Index.
NPAs1 / Loans and OREO
1.0%0.6%
Single Family Mortgage
60%
Single Family Warehouse &
Other8%
Multi-Family24%CRE
1%
Factoring2%
C&I5%
Noninterest-Bearing
7% Interest-Bearing Demand
27%
Savings48%
Time < $100k
2%
Time > $100k16%
12
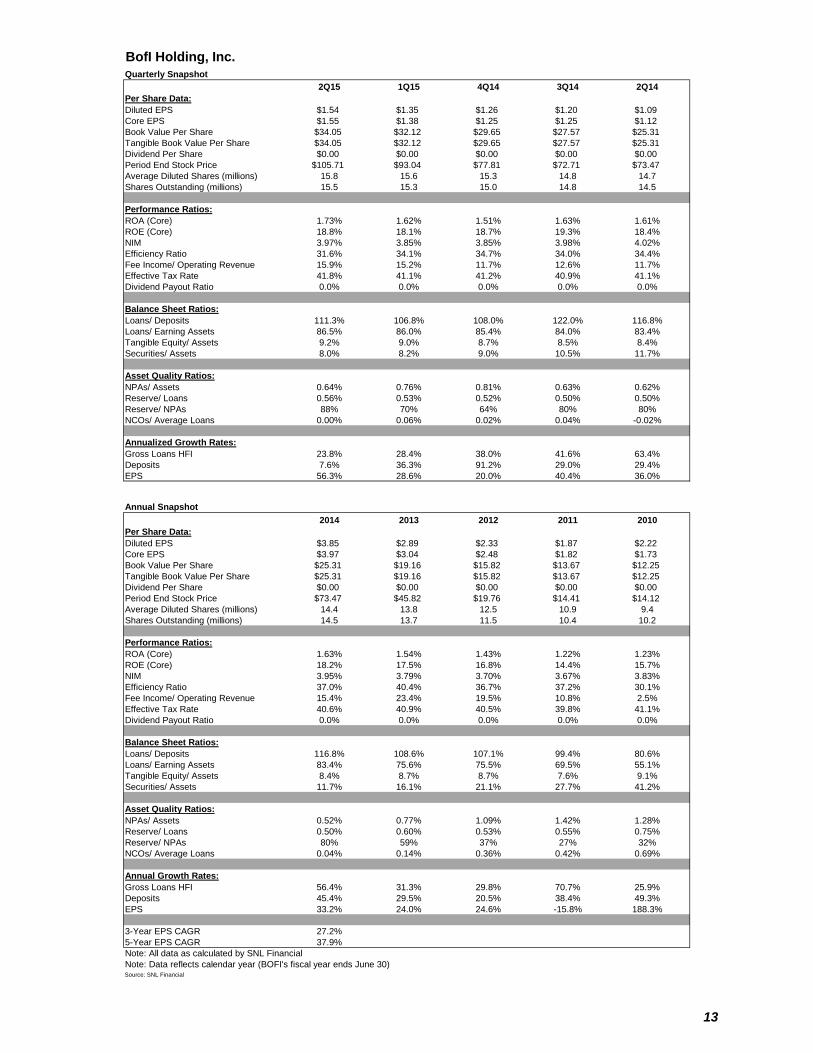
BofI Holding, Inc. BOFI
Quarterly Snapshot 1
2Q15 1Q15 4Q14 3Q14 2Q14Per Share Data:Diluted EPS $1.54 $1.35 $1.26 $1.20 $1.09Core EPS $1.55 $1.38 $1.25 $1.25 $1.12Book Value Per Share $34.05 $32.12 $29.65 $27.57 $25.31Tangible Book Value Per Share $34.05 $32.12 $29.65 $27.57 $25.31Dividend Per Share $0.00 $0.00 $0.00 $0.00 $0.00Period End Stock Price $105.71 $93.04 $77.81 $72.71 $73.47Average Diluted Shares (millions) 15.8 15.6 15.3 14.8 14.7Shares Outstanding (millions) 15.5 15.3 15.0 14.8 14.5
Performance Ratios:ROA (Core) 1.73% 1.62% 1.51% 1.63% 1.61%ROE (Core) 18.8% 18.1% 18.7% 19.3% 18.4%NIM 3.97% 3.85% 3.85% 3.98% 4.02%Efficiency Ratio 31.6% 34.1% 34.7% 34.0% 34.4%Fee Income/ Operating Revenue 15.9% 15.2% 11.7% 12.6% 11.7%Effective Tax Rate 41.8% 41.1% 41.2% 40.9% 41.1%Dividend Payout Ratio 0.0% 0.0% 0.0% 0.0% 0.0%
Balance Sheet Ratios:Loans/ Deposits 111.3% 106.8% 108.0% 122.0% 116.8%Loans/ Earning Assets 86.5% 86.0% 85.4% 84.0% 83.4%Tangible Equity/ Assets 9.2% 9.0% 8.7% 8.5% 8.4%Securities/ Assets 8.0% 8.2% 9.0% 10.5% 11.7%
Asset Quality Ratios:NPAs/ Assets 0.64% 0.76% 0.81% 0.63% 0.62%Reserve/ Loans 0.56% 0.53% 0.52% 0.50% 0.50%Reserve/ NPAs 88% 70% 64% 80% 80%NCOs/ Average Loans 0.00% 0.06% 0.02% 0.04% -0.02%
Annualized Growth Rates:Gross Loans HFI 23.8% 28.4% 38.0% 41.6% 63.4%Deposits 7.6% 36.3% 91.2% 29.0% 29.4%EPS 56.3% 28.6% 20.0% 40.4% 36.0%
Annual Snapshot2014 2013 2012 2011 2010
Per Share Data:Diluted EPS $3.85 $2.89 $2.33 $1.87 $2.22Core EPS $3.97 $3.04 $2.48 $1.82 $1.73Book Value Per Share $25.31 $19.16 $15.82 $13.67 $12.25Tangible Book Value Per Share $25.31 $19.16 $15.82 $13.67 $12.25Dividend Per Share $0.00 $0.00 $0.00 $0.00 $0.00Period End Stock Price $73.47 $45.82 $19.76 $14.41 $14.12Average Diluted Shares (millions) 14.4 13.8 12.5 10.9 9.4Shares Outstanding (millions) 14.5 13.7 11.5 10.4 10.2
Performance Ratios:ROA (Core) 1.63% 1.54% 1.43% 1.22% 1.23%ROE (Core) 18.2% 17.5% 16.8% 14.4% 15.7%NIM 3.95% 3.79% 3.70% 3.67% 3.83%Efficiency Ratio 37.0% 40.4% 36.7% 37.2% 30.1%Fee Income/ Operating Revenue 15.4% 23.4% 19.5% 10.8% 2.5%Effective Tax Rate 40.6% 40.9% 40.5% 39.8% 41.1%Dividend Payout Ratio 0.0% 0.0% 0.0% 0.0% 0.0%
Balance Sheet Ratios:Loans/ Deposits 116.8% 108.6% 107.1% 99.4% 80.6%Loans/ Earning Assets 83.4% 75.6% 75.5% 69.5% 55.1%Tangible Equity/ Assets 8.4% 8.7% 8.7% 7.6% 9.1%Securities/ Assets 11.7% 16.1% 21.1% 27.7% 41.2%
Asset Quality Ratios:NPAs/ Assets 0.52% 0.77% 1.09% 1.42% 1.28%Reserve/ Loans 0.50% 0.60% 0.53% 0.55% 0.75%Reserve/ NPAs 80% 59% 37% 27% 32%NCOs/ Average Loans 0.04% 0.14% 0.36% 0.42% 0.69%
Annual Growth Rates:Gross Loans HFI 56.4% 31.3% 29.8% 70.7% 25.9%Deposits 45.4% 29.5% 20.5% 38.4% 49.3%EPS 33.2% 24.0% 24.6% -15.8% 188.3%
3-Year EPS CAGR 27.2%5-Year EPS CAGR 37.9%Note: All data as calculated by SNL FinancialNote: Data reflects calendar year (BOFI's fiscal year ends June 30)Source: SNL Financial
13
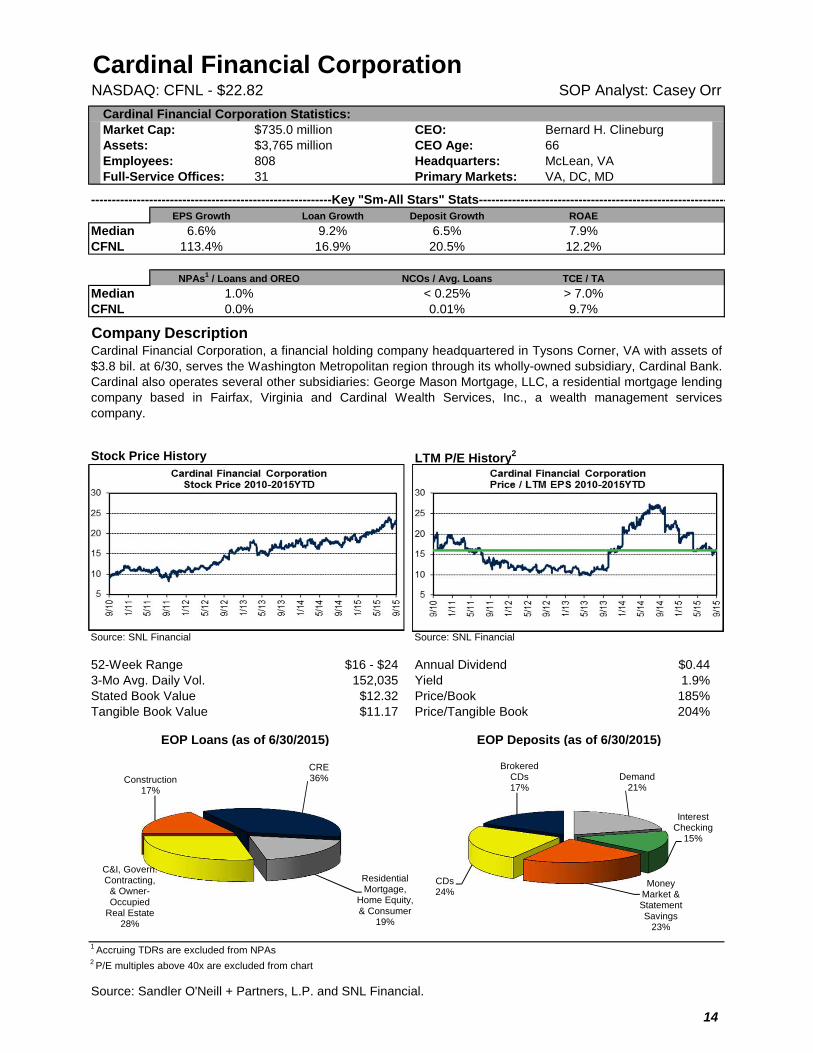
Cardinal Financial CorporationNASDAQ: CFNL - $22.82 SOP Analyst: Casey Orr
Cardinal Financial Corporation Statistics:Market Cap: $735.0 million CEO: Bernard H. ClineburgAssets: $3,765 million CEO Age: 66Employees: 808 Headquarters: McLean, VAFull-Service Offices: 31 Primary Markets: VA, DC, MD
----------------------------------------------------------Key "Sm-All Stars" Stats------------------------------------------------------------EPS Growth Loan Growth Deposit Growth ROAE
Median 6.6% 9.2% 6.5% 7.9%CFNL 113.4% 16.9% 20.5% 12.2%
NCOs / Avg. Loans TCE / TA
Median < 0.25% > 7.0%CFNL 0.01% 9.7%
Company Description
Stock Price History LTM P/E History2
Source: SNL Financial Source: SNL Financial
52-Week Range $16 - $24 Annual Dividend $0.443-Mo Avg. Daily Vol. 152,035 Yield 1.9%Stated Book Value $12.32 Price/Book 185%Tangible Book Value $11.17 Price/Tangible Book 204%
EOP Loans (as of 6/30/2015) EOP Deposits (as of 6/30/2015)
1 Accruing TDRs are excluded from NPAs2 P/E multiples above 40x are excluded from chart
Source: Sandler O'Neill + Partners, L.P. and SNL Financial.
Cardinal Financial Corporation, a financial holding company headquartered in Tysons Corner, VA with assets of$3.8 bil. at 6/30, serves the Washington Metropolitan region through its wholly-owned subsidiary, Cardinal Bank.Cardinal also operates several other subsidiaries: George Mason Mortgage, LLC, a residential mortgage lendingcompany based in Fairfax, Virginia and Cardinal Wealth Services, Inc., a wealth management servicescompany.
NPAs1 / Loans and OREO
1.0%0.0%
Construction17%
CRE36%
Residential Mortgage,
Home Equity, & Consumer
19%
C&I, Govern. Contracting,
& Owner-Occupied
Real Estate28%
Demand21%
Interest Checking
15%
Money Market & Statement Savings
23%
CDs24%
Brokered CDs17%
14
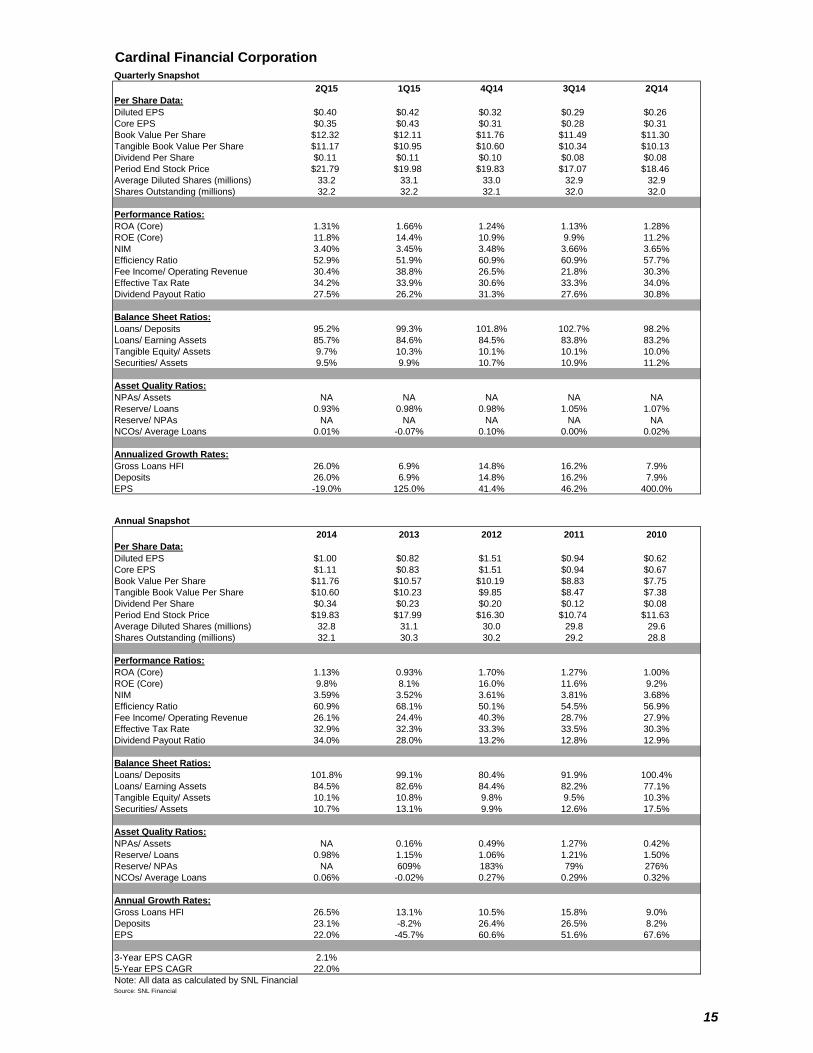
Cardinal Financial Corporation CFNL
Quarterly Snapshot 0.13
2Q15 1Q15 4Q14 3Q14 2Q14Per Share Data:Diluted EPS $0.40 $0.42 $0.32 $0.29 $0.26Core EPS $0.35 $0.43 $0.31 $0.28 $0.31Book Value Per Share $12.32 $12.11 $11.76 $11.49 $11.30Tangible Book Value Per Share $11.17 $10.95 $10.60 $10.34 $10.13Dividend Per Share $0.11 $0.11 $0.10 $0.08 $0.08Period End Stock Price $21.79 $19.98 $19.83 $17.07 $18.46Average Diluted Shares (millions) 33.2 33.1 33.0 32.9 32.9Shares Outstanding (millions) 32.2 32.2 32.1 32.0 32.0
Performance Ratios:ROA (Core) 1.31% 1.66% 1.24% 1.13% 1.28%ROE (Core) 11.8% 14.4% 10.9% 9.9% 11.2%NIM 3.40% 3.45% 3.48% 3.66% 3.65%Efficiency Ratio 52.9% 51.9% 60.9% 60.9% 57.7%Fee Income/ Operating Revenue 30.4% 38.8% 26.5% 21.8% 30.3%Effective Tax Rate 34.2% 33.9% 30.6% 33.3% 34.0%Dividend Payout Ratio 27.5% 26.2% 31.3% 27.6% 30.8%
Balance Sheet Ratios:Loans/ Deposits 95.2% 99.3% 101.8% 102.7% 98.2%Loans/ Earning Assets 85.7% 84.6% 84.5% 83.8% 83.2%Tangible Equity/ Assets 9.7% 10.3% 10.1% 10.1% 10.0%Securities/ Assets 9.5% 9.9% 10.7% 10.9% 11.2%
Asset Quality Ratios:NPAs/ Assets NA NA NA NA NAReserve/ Loans 0.93% 0.98% 0.98% 1.05% 1.07%Reserve/ NPAs NA NA NA NA NANCOs/ Average Loans 0.01% -0.07% 0.10% 0.00% 0.02%
Annualized Growth Rates:Gross Loans HFI 26.0% 6.9% 14.8% 16.2% 7.9%Deposits 26.0% 6.9% 14.8% 16.2% 7.9%EPS -19.0% 125.0% 41.4% 46.2% 400.0%
Annual Snapshot2014 2013 2012 2011 2010
Per Share Data:Diluted EPS $1.00 $0.82 $1.51 $0.94 $0.62Core EPS $1.11 $0.83 $1.51 $0.94 $0.67Book Value Per Share $11.76 $10.57 $10.19 $8.83 $7.75Tangible Book Value Per Share $10.60 $10.23 $9.85 $8.47 $7.38Dividend Per Share $0.34 $0.23 $0.20 $0.12 $0.08Period End Stock Price $19.83 $17.99 $16.30 $10.74 $11.63Average Diluted Shares (millions) 32.8 31.1 30.0 29.8 29.6Shares Outstanding (millions) 32.1 30.3 30.2 29.2 28.8
Performance Ratios:ROA (Core) 1.13% 0.93% 1.70% 1.27% 1.00%ROE (Core) 9.8% 8.1% 16.0% 11.6% 9.2%NIM 3.59% 3.52% 3.61% 3.81% 3.68%Efficiency Ratio 60.9% 68.1% 50.1% 54.5% 56.9%Fee Income/ Operating Revenue 26.1% 24.4% 40.3% 28.7% 27.9%Effective Tax Rate 32.9% 32.3% 33.3% 33.5% 30.3%Dividend Payout Ratio 34.0% 28.0% 13.2% 12.8% 12.9%
Balance Sheet Ratios:Loans/ Deposits 101.8% 99.1% 80.4% 91.9% 100.4%Loans/ Earning Assets 84.5% 82.6% 84.4% 82.2% 77.1%Tangible Equity/ Assets 10.1% 10.8% 9.8% 9.5% 10.3%Securities/ Assets 10.7% 13.1% 9.9% 12.6% 17.5%
Asset Quality Ratios:NPAs/ Assets NA 0.16% 0.49% 1.27% 0.42%Reserve/ Loans 0.98% 1.15% 1.06% 1.21% 1.50%Reserve/ NPAs NA 609% 183% 79% 276%NCOs/ Average Loans 0.06% -0.02% 0.27% 0.29% 0.32%
Annual Growth Rates:Gross Loans HFI 26.5% 13.1% 10.5% 15.8% 9.0%Deposits 23.1% -8.2% 26.4% 26.5% 8.2%EPS 22.0% -45.7% 60.6% 51.6% 67.6%
3-Year EPS CAGR 2.1%5-Year EPS CAGR 22.0%Note: All data as calculated by SNL FinancialSource: SNL Financial
15
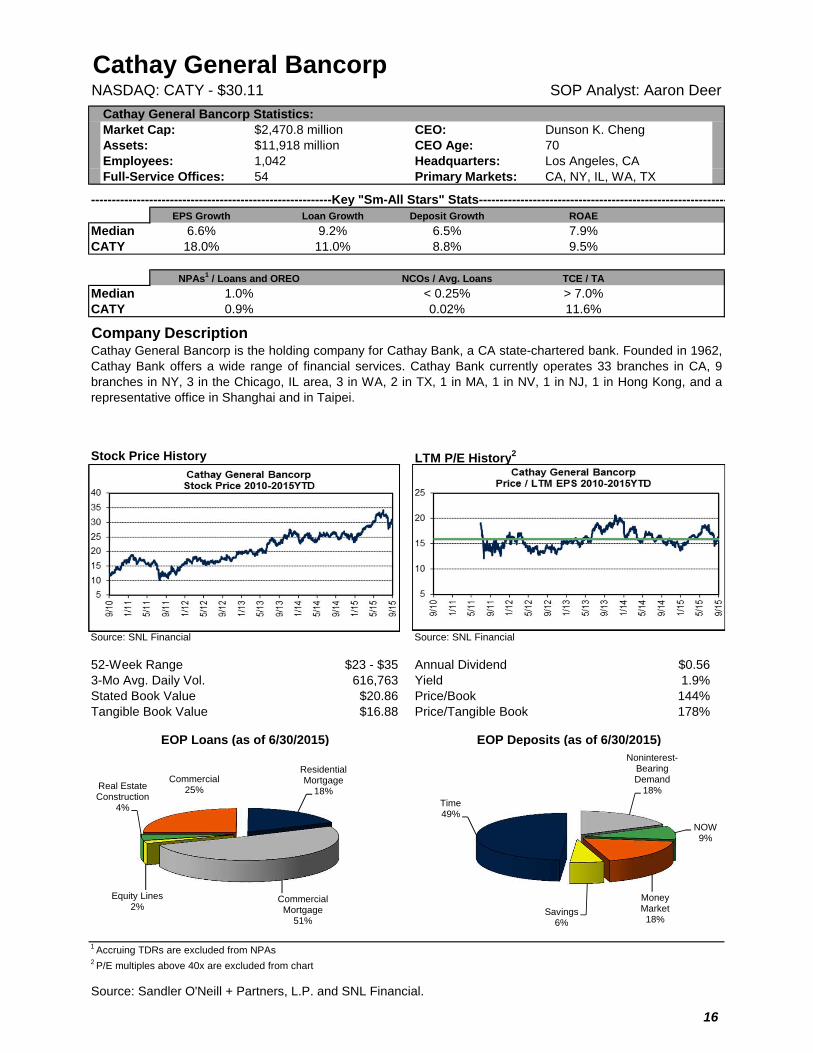
Cathay General BancorpNASDAQ: CATY - $30.11 SOP Analyst: Aaron Deer
Cathay General Bancorp Statistics:Market Cap: $2,470.8 million CEO: Dunson K. ChengAssets: $11,918 million CEO Age: 70Employees: 1,042 Headquarters: Los Angeles, CAFull-Service Offices: 54 Primary Markets: CA, NY, IL, WA, TX
----------------------------------------------------------Key "Sm-All Stars" Stats------------------------------------------------------------EPS Growth Loan Growth Deposit Growth ROAE
Median 6.6% 9.2% 6.5% 7.9%CATY 18.0% 11.0% 8.8% 9.5%
NCOs / Avg. Loans TCE / TA
Median < 0.25% > 7.0%CATY 0.02% 11.6%
Company Description
Stock Price History LTM P/E History2
Source: SNL Financial Source: SNL Financial
52-Week Range $23 - $35 Annual Dividend $0.563-Mo Avg. Daily Vol. 616,763 Yield 1.9%Stated Book Value $20.86 Price/Book 144%Tangible Book Value $16.88 Price/Tangible Book 178%
EOP Loans (as of 6/30/2015) EOP Deposits (as of 6/30/2015)
1 Accruing TDRs are excluded from NPAs2 P/E multiples above 40x are excluded from chart
Source: Sandler O'Neill + Partners, L.P. and SNL Financial.
Cathay General Bancorp is the holding company for Cathay Bank, a CA state-chartered bank. Founded in 1962,Cathay Bank offers a wide range of financial services. Cathay Bank currently operates 33 branches in CA, 9branches in NY, 3 in the Chicago, IL area, 3 in WA, 2 in TX, 1 in MA, 1 in NV, 1 in NJ, 1 in Hong Kong, and arepresentative office in Shanghai and in Taipei.
NPAs1 / Loans and OREO
1.0%0.9%
Commercial25%
Residential Mortgage
18%
Commercial Mortgage
51%
Equity Lines2%
Real Estate Construction
4%
Noninterest-Bearing Demand
18%
NOW9%
Money Market18%
Savings6%
Time49%
16
Cathay General Bancorp CATY
Quarterly Snapshot 0.39
2Q15 1Q15 4Q14 3Q14 2Q14Per Share Data:Diluted EPS $0.56 $0.45 $0.44 $0.45 $0.44Core EPS $0.59 $0.45 $0.44 $0.45 $0.44Book Value Per Share $20.86 $20.45 $20.08 $19.70 $19.31Tangible Book Value Per Share $16.88 $16.47 $16.10 $15.71 $15.33Dividend Per Share $0.14 $0.10 $0.10 $0.07 $0.07Period End Stock Price $32.45 $28.45 $25.59 $24.83 $25.56Average Diluted Shares (millions) 80.7 80.3 80.2 80.2 80.0Shares Outstanding (millions) 80.0 79.9 79.8 79.7 79.7
Performance Ratios:ROA (Core) 1.63% 1.29% 1.28% 1.28% 1.27%ROE (Core) 11.4% 8.9% 9.0% 9.2% 9.2%NIM 3.50% 3.37% 3.38% 3.34% 3.36%Efficiency Ratio 47.5% 45.0% 43.4% 45.5% 45.4%Fee Income/ Operating Revenue 8.6% 8.9% 8.4% 9.0% 9.0%Effective Tax Rate 17.7% 37.3% 37.1% 38.3% 37.2%Dividend Payout Ratio 25.0% 22.2% 22.7% 15.6% 15.9%
Balance Sheet Ratios:Loans/ Deposits 101.6% 101.1% 101.3% 101.7% 99.7%Loans/ Earning Assets 78.6% 76.4% 76.2% 75.2% 72.9%Tangible Equity/ Assets 11.6% 11.4% 11.5% 11.1% 10.9%Securities/ Assets 13.1% 10.3% 11.8% 11.9% 11.8%
Asset Quality Ratios:NPAs/ Assets 1.59% 1.78% 1.80% 1.87% 1.93%Reserve/ Loans 1.62% 1.69% 1.81% 1.91% 1.98%Reserve/ NPAs 81% 74% 78% 78% 76%NCOs/ Average Loans 0.02% 0.01% 0.26% -0.24% -0.17%
Annualized Growth Rates:Gross Loans HFI 12.1% 14.0% 2.5% 13.7% 12.7%Deposits 12.1% 14.0% 2.5% 13.7% 12.7%EPS 97.8% 9.1% -8.9% 9.1% 51.3%
Annual Snapshot2014 2013 2012 2011 2010
Per Share Data:Diluted EPS $1.72 $1.43 $1.28 $1.06 ($0.06)Core EPS $1.67 $1.24 $1.22 $0.93 ($0.17)Book Value Per Share $20.08 $18.33 $17.35 $15.97 $15.03Tangible Book Value Per Share $16.10 $14.35 $13.27 $11.81 $10.79Dividend Per Share $0.29 $0.08 $0.04 $0.04 $0.04Period End Stock Price $25.59 $26.73 $19.53 $14.93 $16.70Average Diluted Shares (millions) 80.1 79.1 78.7 78.6 77.1Shares Outstanding (millions) 79.8 79.6 78.8 78.7 78.5
Performance Ratios:ROA (Core) 1.22% 1.03% 1.07% 0.85% 0.03%ROE (Core) 8.7% 7.0% 7.2% 6.1% 0.2%NIM 3.35% 3.33% 3.28% 3.21% 2.77%Efficiency Ratio 46.4% 52.9% 47.2% 48.9% 49.3%Fee Income/ Operating Revenue 9.0% 9.2% 8.1% 8.7% 4.4%Effective Tax Rate 37.3% 36.3% 35.9% 33.7% NMDividend Payout Ratio 16.9% 5.6% 3.1% 3.8% NM
Balance Sheet Ratios:Loans/ Deposits 101.3% 101.1% 100.5% 97.5% 98.1%Loans/ Earning Assets 76.2% 72.3% 68.2% 65.0% 62.1%Tangible Equity/ Assets 11.5% 10.7% 12.6% 11.5% 10.5%Securities/ Assets 11.8% 14.7% 19.8% 23.6% 27.0%
Asset Quality Ratios:NPAs/ Assets 1.80% 2.31% 2.76% 3.90% 4.26%Reserve/ Loans 1.81% 2.15% 2.47% 2.93% 3.57%Reserve/ NPAs 78% 69% 62% 50% 53%NCOs/ Average Loans 0.02% 0.08% 0.21% 0.95% 1.83%
Annual Growth Rates:Gross Loans HFI 10.3% 8.8% 5.2% 2.8% -0.4%Deposits 10.1% 8.1% 2.1% 3.4% -6.8%EPS 20.3% 11.7% 20.8% NM NM
3-Year EPS CAGR 17.5%5-Year EPS CAGR NMNote: All data as calculated by SNL FinancialSource: SNL Financial
17
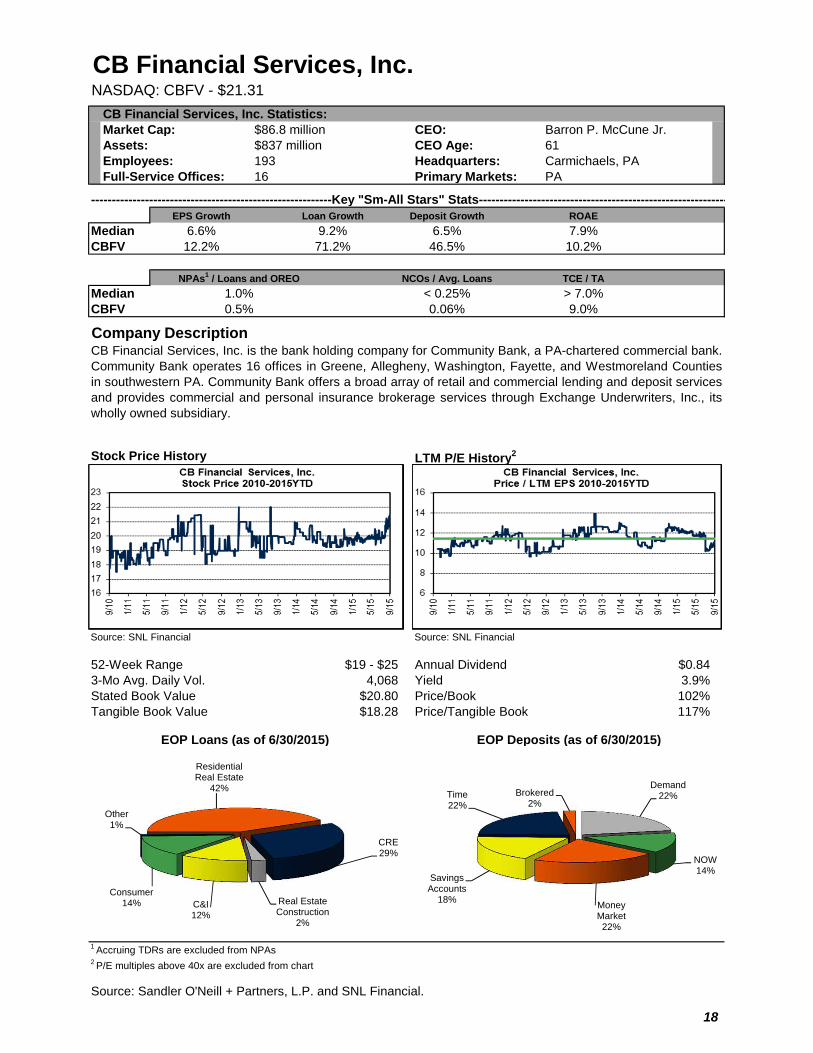
CB Financial Services, Inc.NASDAQ: CBFV - $21.31
CB Financial Services, Inc. Statistics:Market Cap: $86.8 million CEO: Barron P. McCune Jr.Assets: $837 million CEO Age: 61Employees: 193 Headquarters: Carmichaels, PAFull-Service Offices: 16 Primary Markets: PA
----------------------------------------------------------Key "Sm-All Stars" Stats------------------------------------------------------------EPS Growth Loan Growth Deposit Growth ROAE
Median 6.6% 9.2% 6.5% 7.9%CBFV 12.2% 71.2% 46.5% 10.2%
NCOs / Avg. Loans TCE / TA
Median < 0.25% > 7.0%CBFV 0.06% 9.0%
Company Description
Stock Price History LTM P/E History2
Source: SNL Financial Source: SNL Financial
52-Week Range $19 - $25 Annual Dividend $0.843-Mo Avg. Daily Vol. 4,068 Yield 3.9%Stated Book Value $20.80 Price/Book 102%Tangible Book Value $18.28 Price/Tangible Book 117%
EOP Loans (as of 6/30/2015) EOP Deposits (as of 6/30/2015)
1 Accruing TDRs are excluded from NPAs2 P/E multiples above 40x are excluded from chart
Source: Sandler O'Neill + Partners, L.P. and SNL Financial.
CB Financial Services, Inc. is the bank holding company for Community Bank, a PA-chartered commercial bank.Community Bank operates 16 offices in Greene, Allegheny, Washington, Fayette, and Westmoreland Countiesin southwestern PA. Community Bank offers a broad array of retail and commercial lending and deposit servicesand provides commercial and personal insurance brokerage services through Exchange Underwriters, Inc., itswholly owned subsidiary.
NPAs1 / Loans and OREO
1.0%0.5%
Residential Real Estate
42%
CRE29%
Real Estate Construction
2%
C&I12%
Consumer14%
Other1%
Demand22%
NOW14%
Money Market22%
Savings Accounts
18%
Time22%
Brokered2%
18
CB Financial Services, Inc. CBFV
Quarterly Snapshot 0.46
2Q15 1Q15 4Q14 3Q14 2Q14Per Share Data:Diluted EPS $0.55 $0.56 $0.50 $0.32 $0.31Core EPS $0.57 $0.58 $0.69 $0.41 $0.49Book Value Per Share $20.80 $20.55 $20.12 $19.00 $18.91Tangible Book Value Per Share $18.28 $18.00 $17.53 $18.09 $17.99Dividend Per Share $0.21 $0.21 $0.21 $0.21 $0.21Period End Stock Price $19.90 $19.76 $19.90 $20.00 $19.75Average Diluted Shares (millions) 4.1 4.1 2.3 2.3 2.4Shares Outstanding (millions) 4.1 4.1 4.1 2.3 2.3
Performance Ratios:ROA (Core) 1.10% 1.12% 1.36% 0.70% 0.86%ROE (Core) 11.0% 11.5% 15.1% 8.5% 10.5%NIM 3.77% 3.84% 3.92% 3.35% 3.39%Efficiency Ratio 58.3% 59.1% 62.1% 66.5% 66.0%Fee Income/ Operating Revenue 19.9% 19.7% 18.4% 16.4% 15.6%Effective Tax Rate 29.2% 29.1% 33.5% 26.6% 18.7%Dividend Payout Ratio 38.2% 37.5% 42.0% 65.6% 67.7%
Balance Sheet Ratios:Loans/ Deposits 95.4% 93.7% 98.3% 81.7% 81.6%Loans/ Earning Assets 78.7% 80.7% 80.5% 71.4% 71.2%Tangible Equity/ Assets 9.0% 8.7% 8.5% 7.7% 7.9%Securities/ Assets NA NA 12.9% 19.3% 21.1%
Asset Quality Ratios:NPAs/ Assets 0.90% 0.87% 0.82% 0.83% 0.84%Reserve/ Loans 0.86% 0.79% 0.76% 1.33% 1.38%Reserve/ NPAs 76% 74% 75% 116% 118%NCOs/ Average Loans 0.10% 0.01% 0.10% 0.00% 0.03%
Annualized Growth Rates:Gross Loans HFI -1.1% -12.0% 284.1% 14.0% 2.1%Deposits -1.1% -12.0% 284.1% 14.0% 2.1%EPS -7.1% 48.0% 225.0% 12.9% -130.4%
Annual Snapshot2014 2013 2012 2011 2010
Per Share Data:Diluted EPS $1.63 $1.72 $1.70 $1.78 $1.69Core EPS $2.13 $1.73 $1.71 $1.79 $1.69Book Value Per Share $20.12 $18.24 $18.19 $17.41 $16.10Tangible Book Value Per Share $17.53 $17.36 $17.29 $16.47 $15.12Dividend Per Share $0.84 $0.84 $0.84 $0.83 $0.81Period End Stock Price $19.90 $19.75 $19.00 $21.00 $19.00Average Diluted Shares (millions) 2.6 2.5 2.5 2.5 2.5Shares Outstanding (millions) 4.1 2.5 2.4 2.4 2.4
Performance Ratios:ROA (Core) 0.94% 0.80% 0.79% 0.89% 0.88%ROE (Core) 11.2% 9.5% 9.7% 10.9% 10.9%NIM 3.47% 3.23% 3.27% 3.61% 3.54%Efficiency Ratio 65.4% 67.4% 64.8% 62.3% 64.7%Fee Income/ Operating Revenue 16.6% 17.0% 18.5% 17.0% 17.2%Effective Tax Rate 27.3% 21.4% 19.7% 16.9% 16.8%Dividend Payout Ratio 51.5% 48.8% 49.4% 46.6% 47.9%
Balance Sheet Ratios:Loans/ Deposits 98.3% 78.9% 74.0% 75.6% 77.3%Loans/ Earning Assets 80.5% 68.7% 63.0% 63.1% 62.6%Tangible Equity/ Assets 8.5% 7.9% 7.8% 7.5% 7.3%Securities/ Assets 12.9% 25.0% 29.0% 25.7% 27.2%
Asset Quality Ratios:NPAs/ Assets 0.82% 0.78% 1.23% 1.14% 0.53%Reserve/ Loans 0.76% 1.42% 1.70% 1.73% 1.67%Reserve/ NPAs 75% 127% 88% 97% 199%NCOs/ Average Loans 0.04% 0.17% 0.12% 0.11% 0.19%
Annual Growth Rates:Gross Loans HFI 80.8% 8.9% 2.3% 8.2% 7.5%Deposits 45.2% 2.2% 4.4% 10.7% 5.2%EPS -5.2% 1.2% -4.5% 5.3% 19.0%
3-Year EPS CAGR -2.9%5-Year EPS CAGR 2.8%Note: All data as calculated by SNL FinancialSource: SNL Financial
19
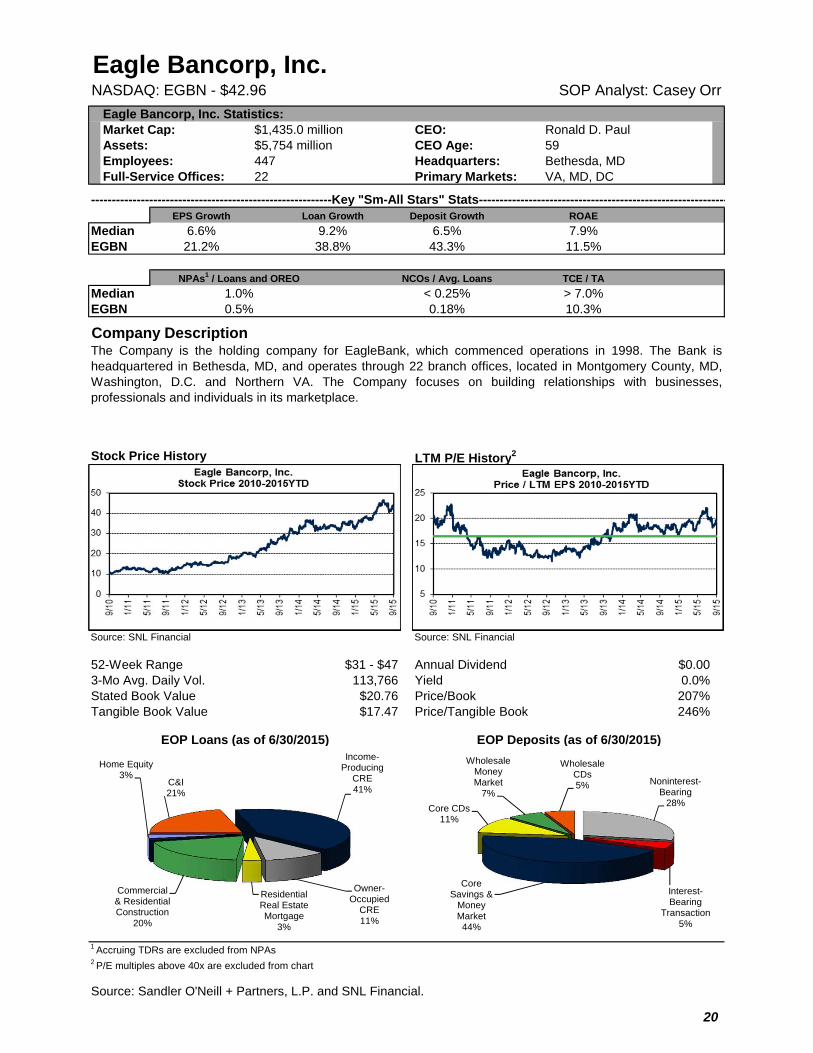
Eagle Bancorp, Inc.NASDAQ: EGBN - $42.96 SOP Analyst: Casey Orr
Eagle Bancorp, Inc. Statistics:Market Cap: $1,435.0 million CEO: Ronald D. PaulAssets: $5,754 million CEO Age: 59Employees: 447 Headquarters: Bethesda, MDFull-Service Offices: 22 Primary Markets: VA, MD, DC
----------------------------------------------------------Key "Sm-All Stars" Stats------------------------------------------------------------EPS Growth Loan Growth Deposit Growth ROAE
Median 6.6% 9.2% 6.5% 7.9%EGBN 21.2% 38.8% 43.3% 11.5%
NCOs / Avg. Loans TCE / TA
Median < 0.25% > 7.0%EGBN 0.18% 10.3%
Company Description
Stock Price History LTM P/E History2
Source: SNL Financial Source: SNL Financial
52-Week Range $31 - $47 Annual Dividend $0.003-Mo Avg. Daily Vol. 113,766 Yield 0.0%Stated Book Value $20.76 Price/Book 207%Tangible Book Value $17.47 Price/Tangible Book 246%
EOP Loans (as of 6/30/2015) EOP Deposits (as of 6/30/2015)
1 Accruing TDRs are excluded from NPAs2 P/E multiples above 40x are excluded from chart
Source: Sandler O'Neill + Partners, L.P. and SNL Financial.
The Company is the holding company for EagleBank, which commenced operations in 1998. The Bank isheadquartered in Bethesda, MD, and operates through 22 branch offices, located in Montgomery County, MD,Washington, D.C. and Northern VA. The Company focuses on building relationships with businesses,professionals and individuals in its marketplace.
NPAs1 / Loans and OREO
1.0%0.5%
C&I21%
Income-Producing
CRE41%
Owner-Occupied
CRE11%
Residential Real Estate Mortgage
3%
Commercial & Residential Construction
20%
Home Equity3%
Noninterest-Bearing
28%
Interest-Bearing
Transaction5%
Core Savings &
Money Market44%
Core CDs11%
Wholesale Money Market
7%
Wholesale CDs5%
20
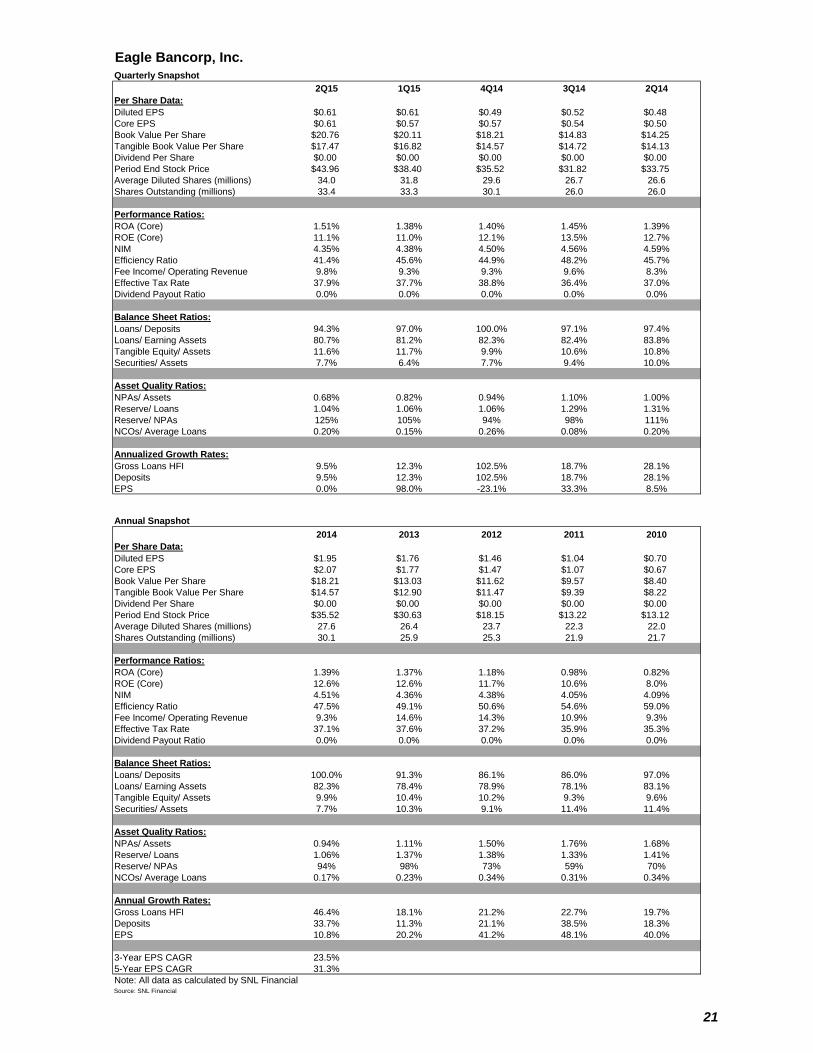
Eagle Bancorp, Inc. EGBN
Quarterly Snapshot 0.47
2Q15 1Q15 4Q14 3Q14 2Q14Per Share Data:Diluted EPS $0.61 $0.61 $0.49 $0.52 $0.48Core EPS $0.61 $0.57 $0.57 $0.54 $0.50Book Value Per Share $20.76 $20.11 $18.21 $14.83 $14.25Tangible Book Value Per Share $17.47 $16.82 $14.57 $14.72 $14.13Dividend Per Share $0.00 $0.00 $0.00 $0.00 $0.00Period End Stock Price $43.96 $38.40 $35.52 $31.82 $33.75Average Diluted Shares (millions) 34.0 31.8 29.6 26.7 26.6Shares Outstanding (millions) 33.4 33.3 30.1 26.0 26.0
Performance Ratios:ROA (Core) 1.51% 1.38% 1.40% 1.45% 1.39%ROE (Core) 11.1% 11.0% 12.1% 13.5% 12.7%NIM 4.35% 4.38% 4.50% 4.56% 4.59%Efficiency Ratio 41.4% 45.6% 44.9% 48.2% 45.7%Fee Income/ Operating Revenue 9.8% 9.3% 9.3% 9.6% 8.3%Effective Tax Rate 37.9% 37.7% 38.8% 36.4% 37.0%Dividend Payout Ratio 0.0% 0.0% 0.0% 0.0% 0.0%
Balance Sheet Ratios:Loans/ Deposits 94.3% 97.0% 100.0% 97.1% 97.4%Loans/ Earning Assets 80.7% 81.2% 82.3% 82.4% 83.8%Tangible Equity/ Assets 11.6% 11.7% 9.9% 10.6% 10.8%Securities/ Assets 7.7% 6.4% 7.7% 9.4% 10.0%
Asset Quality Ratios:NPAs/ Assets 0.68% 0.82% 0.94% 1.10% 1.00%Reserve/ Loans 1.04% 1.06% 1.06% 1.29% 1.31%Reserve/ NPAs 125% 105% 94% 98% 111%NCOs/ Average Loans 0.20% 0.15% 0.26% 0.08% 0.20%
Annualized Growth Rates:Gross Loans HFI 9.5% 12.3% 102.5% 18.7% 28.1%Deposits 9.5% 12.3% 102.5% 18.7% 28.1%EPS 0.0% 98.0% -23.1% 33.3% 8.5%
Annual Snapshot2014 2013 2012 2011 2010
Per Share Data:Diluted EPS $1.95 $1.76 $1.46 $1.04 $0.70Core EPS $2.07 $1.77 $1.47 $1.07 $0.67Book Value Per Share $18.21 $13.03 $11.62 $9.57 $8.40Tangible Book Value Per Share $14.57 $12.90 $11.47 $9.39 $8.22Dividend Per Share $0.00 $0.00 $0.00 $0.00 $0.00Period End Stock Price $35.52 $30.63 $18.15 $13.22 $13.12Average Diluted Shares (millions) 27.6 26.4 23.7 22.3 22.0Shares Outstanding (millions) 30.1 25.9 25.3 21.9 21.7
Performance Ratios:ROA (Core) 1.39% 1.37% 1.18% 0.98% 0.82%ROE (Core) 12.6% 12.6% 11.7% 10.6% 8.0%NIM 4.51% 4.36% 4.38% 4.05% 4.09%Efficiency Ratio 47.5% 49.1% 50.6% 54.6% 59.0%Fee Income/ Operating Revenue 9.3% 14.6% 14.3% 10.9% 9.3%Effective Tax Rate 37.1% 37.6% 37.2% 35.9% 35.3%Dividend Payout Ratio 0.0% 0.0% 0.0% 0.0% 0.0%
Balance Sheet Ratios:Loans/ Deposits 100.0% 91.3% 86.1% 86.0% 97.0%Loans/ Earning Assets 82.3% 78.4% 78.9% 78.1% 83.1%Tangible Equity/ Assets 9.9% 10.4% 10.2% 9.3% 9.6%Securities/ Assets 7.7% 10.3% 9.1% 11.4% 11.4%
Asset Quality Ratios:NPAs/ Assets 0.94% 1.11% 1.50% 1.76% 1.68%Reserve/ Loans 1.06% 1.37% 1.38% 1.33% 1.41%Reserve/ NPAs 94% 98% 73% 59% 70%NCOs/ Average Loans 0.17% 0.23% 0.34% 0.31% 0.34%
Annual Growth Rates:Gross Loans HFI 46.4% 18.1% 21.2% 22.7% 19.7%Deposits 33.7% 11.3% 21.1% 38.5% 18.3%EPS 10.8% 20.2% 41.2% 48.1% 40.0%
3-Year EPS CAGR 23.5%5-Year EPS CAGR 31.3%Note: All data as calculated by SNL FinancialSource: SNL Financial
21
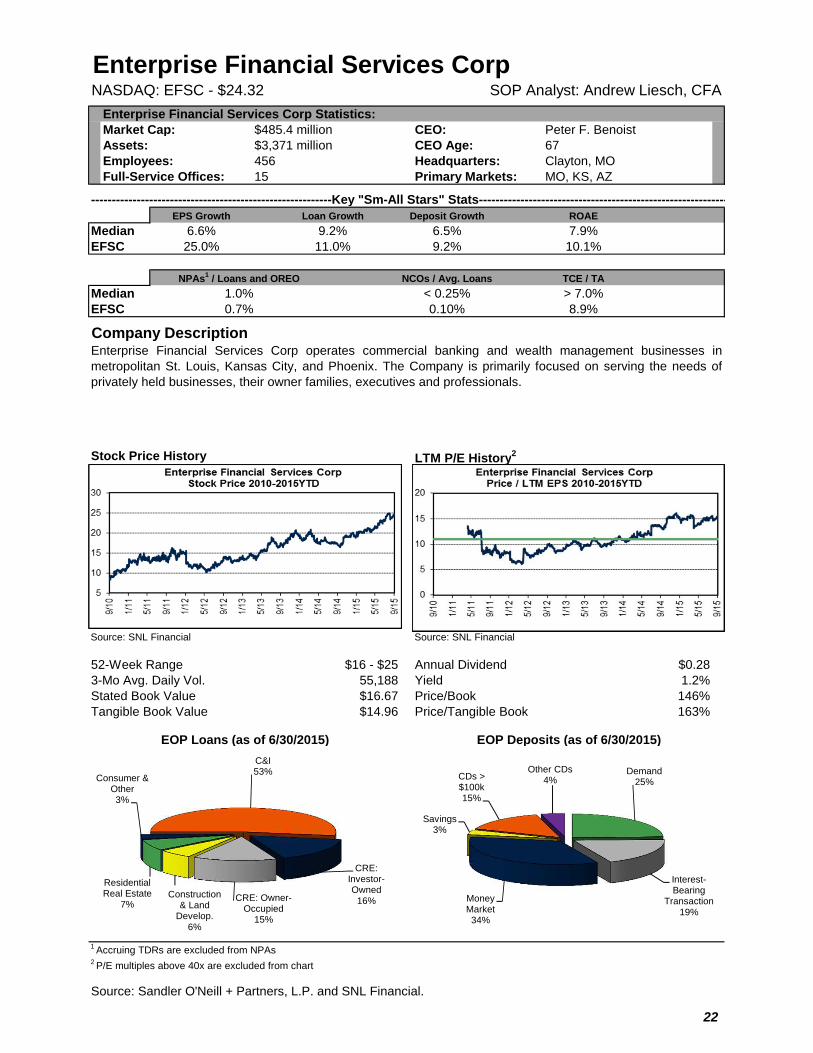
Enterprise Financial Services CorpNASDAQ: EFSC - $24.32 SOP Analyst: Andrew Liesch, CFA
Enterprise Financial Services Corp Statistics:Market Cap: $485.4 million CEO: Peter F. BenoistAssets: $3,371 million CEO Age: 67Employees: 456 Headquarters: Clayton, MOFull-Service Offices: 15 Primary Markets: MO, KS, AZ
----------------------------------------------------------Key "Sm-All Stars" Stats------------------------------------------------------------EPS Growth Loan Growth Deposit Growth ROAE
Median 6.6% 9.2% 6.5% 7.9%EFSC 25.0% 11.0% 9.2% 10.1%
NCOs / Avg. Loans TCE / TA
Median < 0.25% > 7.0%EFSC 0.10% 8.9%
Company Description
Stock Price History LTM P/E History2
Source: SNL Financial Source: SNL Financial
52-Week Range $16 - $25 Annual Dividend $0.283-Mo Avg. Daily Vol. 55,188 Yield 1.2%Stated Book Value $16.67 Price/Book 146%Tangible Book Value $14.96 Price/Tangible Book 163%
EOP Loans (as of 6/30/2015) EOP Deposits (as of 6/30/2015)
1 Accruing TDRs are excluded from NPAs2 P/E multiples above 40x are excluded from chart
Source: Sandler O'Neill + Partners, L.P. and SNL Financial.
Enterprise Financial Services Corp operates commercial banking and wealth management businesses inmetropolitan St. Louis, Kansas City, and Phoenix. The Company is primarily focused on serving the needs ofprivately held businesses, their owner families, executives and professionals.
NPAs1 / Loans and OREO
1.0%0.7%
C&I53%
CRE: Investor-Owned
16%CRE: Owner-Occupied
15%
Construction & Land
Develop.6%
Residential Real Estate
7%
Consumer & Other3%
Demand25%
Interest-Bearing
Transaction19%
Money Market34%
Savings3%
CDs > $100k15%
Other CDs4%
22
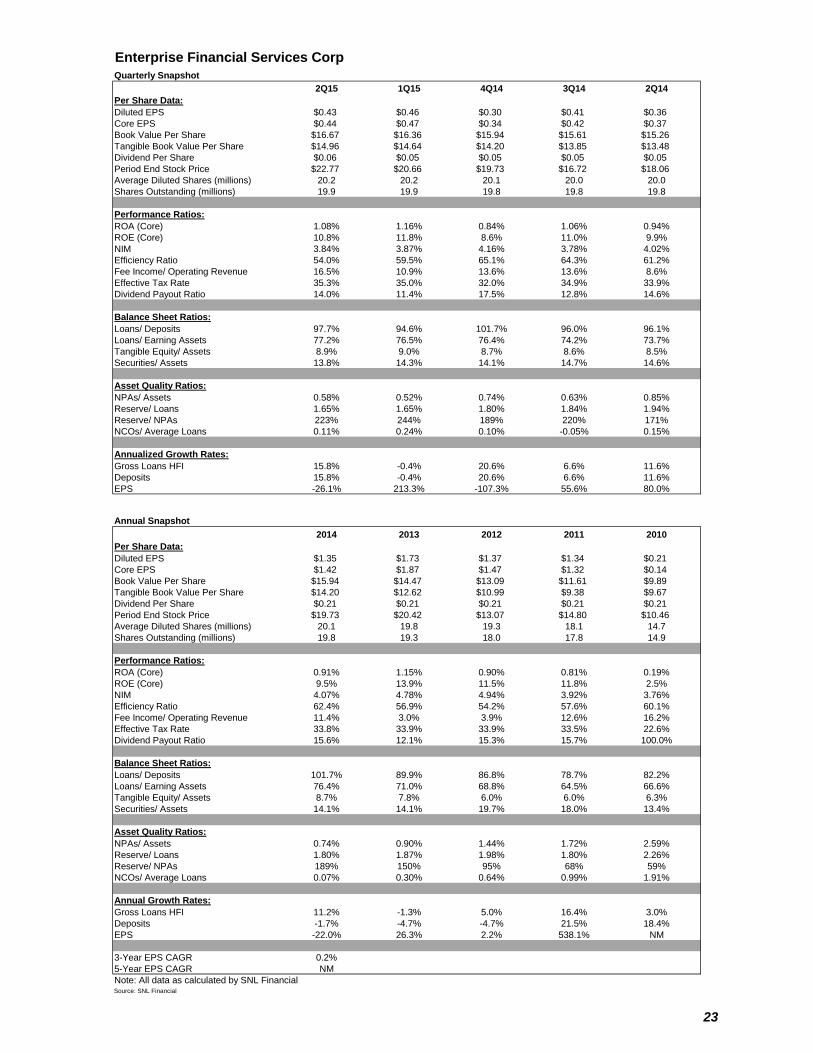
Enterprise Financial Services Corp EFSC
Quarterly Snapshot 0.30
2Q15 1Q15 4Q14 3Q14 2Q14Per Share Data:Diluted EPS $0.43 $0.46 $0.30 $0.41 $0.36Core EPS $0.44 $0.47 $0.34 $0.42 $0.37Book Value Per Share $16.67 $16.36 $15.94 $15.61 $15.26Tangible Book Value Per Share $14.96 $14.64 $14.20 $13.85 $13.48Dividend Per Share $0.06 $0.05 $0.05 $0.05 $0.05Period End Stock Price $22.77 $20.66 $19.73 $16.72 $18.06Average Diluted Shares (millions) 20.2 20.2 20.1 20.0 20.0Shares Outstanding (millions) 19.9 19.9 19.8 19.8 19.8
Performance Ratios:ROA (Core) 1.08% 1.16% 0.84% 1.06% 0.94%ROE (Core) 10.8% 11.8% 8.6% 11.0% 9.9%NIM 3.84% 3.87% 4.16% 3.78% 4.02%Efficiency Ratio 54.0% 59.5% 65.1% 64.3% 61.2%Fee Income/ Operating Revenue 16.5% 10.9% 13.6% 13.6% 8.6%Effective Tax Rate 35.3% 35.0% 32.0% 34.9% 33.9%Dividend Payout Ratio 14.0% 11.4% 17.5% 12.8% 14.6%
Balance Sheet Ratios:Loans/ Deposits 97.7% 94.6% 101.7% 96.0% 96.1%Loans/ Earning Assets 77.2% 76.5% 76.4% 74.2% 73.7%Tangible Equity/ Assets 8.9% 9.0% 8.7% 8.6% 8.5%Securities/ Assets 13.8% 14.3% 14.1% 14.7% 14.6%
Asset Quality Ratios:NPAs/ Assets 0.58% 0.52% 0.74% 0.63% 0.85%Reserve/ Loans 1.65% 1.65% 1.80% 1.84% 1.94%Reserve/ NPAs 223% 244% 189% 220% 171%NCOs/ Average Loans 0.11% 0.24% 0.10% -0.05% 0.15%
Annualized Growth Rates:Gross Loans HFI 15.8% -0.4% 20.6% 6.6% 11.6%Deposits 15.8% -0.4% 20.6% 6.6% 11.6%EPS -26.1% 213.3% -107.3% 55.6% 80.0%
Annual Snapshot2014 2013 2012 2011 2010
Per Share Data:Diluted EPS $1.35 $1.73 $1.37 $1.34 $0.21Core EPS $1.42 $1.87 $1.47 $1.32 $0.14Book Value Per Share $15.94 $14.47 $13.09 $11.61 $9.89Tangible Book Value Per Share $14.20 $12.62 $10.99 $9.38 $9.67Dividend Per Share $0.21 $0.21 $0.21 $0.21 $0.21Period End Stock Price $19.73 $20.42 $13.07 $14.80 $10.46Average Diluted Shares (millions) 20.1 19.8 19.3 18.1 14.7Shares Outstanding (millions) 19.8 19.3 18.0 17.8 14.9
Performance Ratios:ROA (Core) 0.91% 1.15% 0.90% 0.81% 0.19%ROE (Core) 9.5% 13.9% 11.5% 11.8% 2.5%NIM 4.07% 4.78% 4.94% 3.92% 3.76%Efficiency Ratio 62.4% 56.9% 54.2% 57.6% 60.1%Fee Income/ Operating Revenue 11.4% 3.0% 3.9% 12.6% 16.2%Effective Tax Rate 33.8% 33.9% 33.9% 33.5% 22.6%Dividend Payout Ratio 15.6% 12.1% 15.3% 15.7% 100.0%
Balance Sheet Ratios:Loans/ Deposits 101.7% 89.9% 86.8% 78.7% 82.2%Loans/ Earning Assets 76.4% 71.0% 68.8% 64.5% 66.6%Tangible Equity/ Assets 8.7% 7.8% 6.0% 6.0% 6.3%Securities/ Assets 14.1% 14.1% 19.7% 18.0% 13.4%
Asset Quality Ratios:NPAs/ Assets 0.74% 0.90% 1.44% 1.72% 2.59%Reserve/ Loans 1.80% 1.87% 1.98% 1.80% 2.26%Reserve/ NPAs 189% 150% 95% 68% 59%NCOs/ Average Loans 0.07% 0.30% 0.64% 0.99% 1.91%
Annual Growth Rates:Gross Loans HFI 11.2% -1.3% 5.0% 16.4% 3.0%Deposits -1.7% -4.7% -4.7% 21.5% 18.4%EPS -22.0% 26.3% 2.2% 538.1% NM
3-Year EPS CAGR 0.2%5-Year EPS CAGR NMNote: All data as calculated by SNL FinancialSource: SNL Financial
23
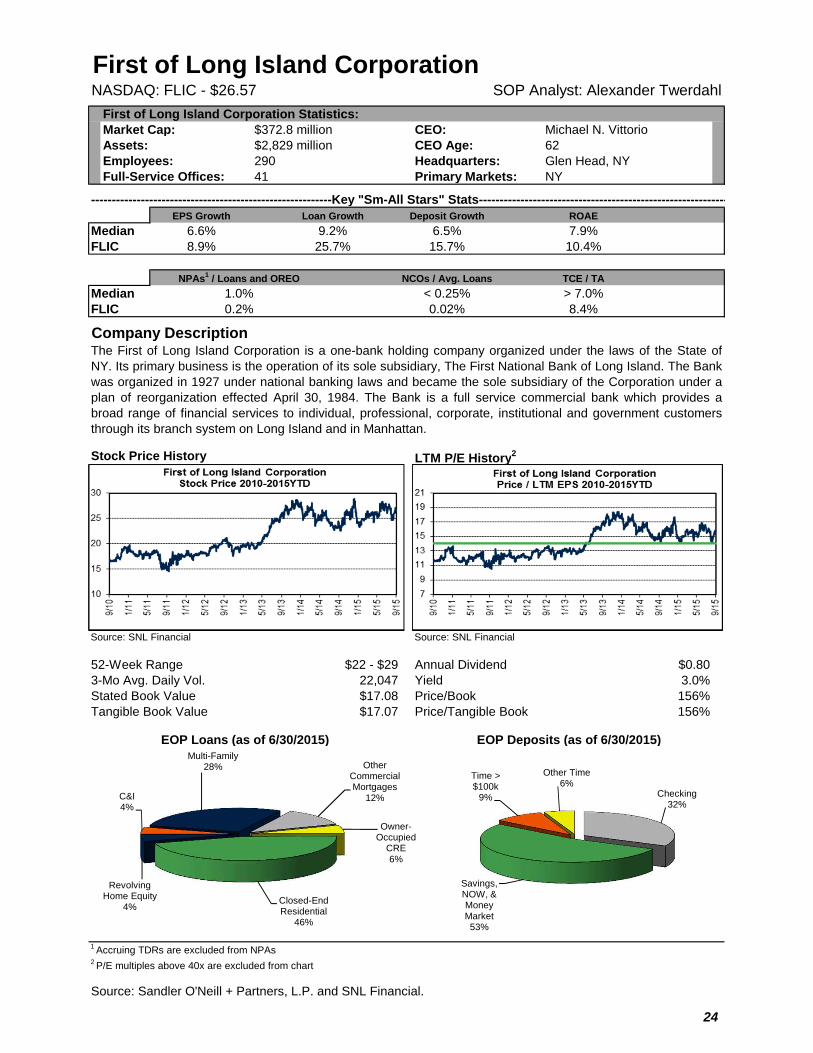
First of Long Island CorporationNASDAQ: FLIC - $26.57 SOP Analyst: Alexander Twerdahl
First of Long Island Corporation Statistics:Market Cap: $372.8 million CEO: Michael N. VittorioAssets: $2,829 million CEO Age: 62Employees: 290 Headquarters: Glen Head, NYFull-Service Offices: 41 Primary Markets: NY
----------------------------------------------------------Key "Sm-All Stars" Stats------------------------------------------------------------EPS Growth Loan Growth Deposit Growth ROAE
Median 6.6% 9.2% 6.5% 7.9%FLIC 8.9% 25.7% 15.7% 10.4%
NCOs / Avg. Loans TCE / TA
Median < 0.25% > 7.0%FLIC 0.02% 8.4%
Company Description
Stock Price History LTM P/E History2
Source: SNL Financial Source: SNL Financial
52-Week Range $22 - $29 Annual Dividend $0.803-Mo Avg. Daily Vol. 22,047 Yield 3.0%Stated Book Value $17.08 Price/Book 156%Tangible Book Value $17.07 Price/Tangible Book 156%
EOP Loans (as of 6/30/2015) EOP Deposits (as of 6/30/2015)
1 Accruing TDRs are excluded from NPAs2 P/E multiples above 40x are excluded from chart
Source: Sandler O'Neill + Partners, L.P. and SNL Financial.
The First of Long Island Corporation is a one-bank holding company organized under the laws of the State ofNY. Its primary business is the operation of its sole subsidiary, The First National Bank of Long Island. The Bankwas organized in 1927 under national banking laws and became the sole subsidiary of the Corporation under aplan of reorganization effected April 30, 1984. The Bank is a full service commercial bank which provides abroad range of financial services to individual, professional, corporate, institutional and government customersthrough its branch system on Long Island and in Manhattan.
NPAs1 / Loans and OREO
1.0%0.2%
C&I4%
Multi-Family28% Other
Commercial Mortgages
12%
Owner-Occupied
CRE6%
Closed-End Residential
46%
Revolving Home Equity
4%
Checking32%
Savings, NOW, & Money Market53%
Time > $100k
9%
Other Time6%
24
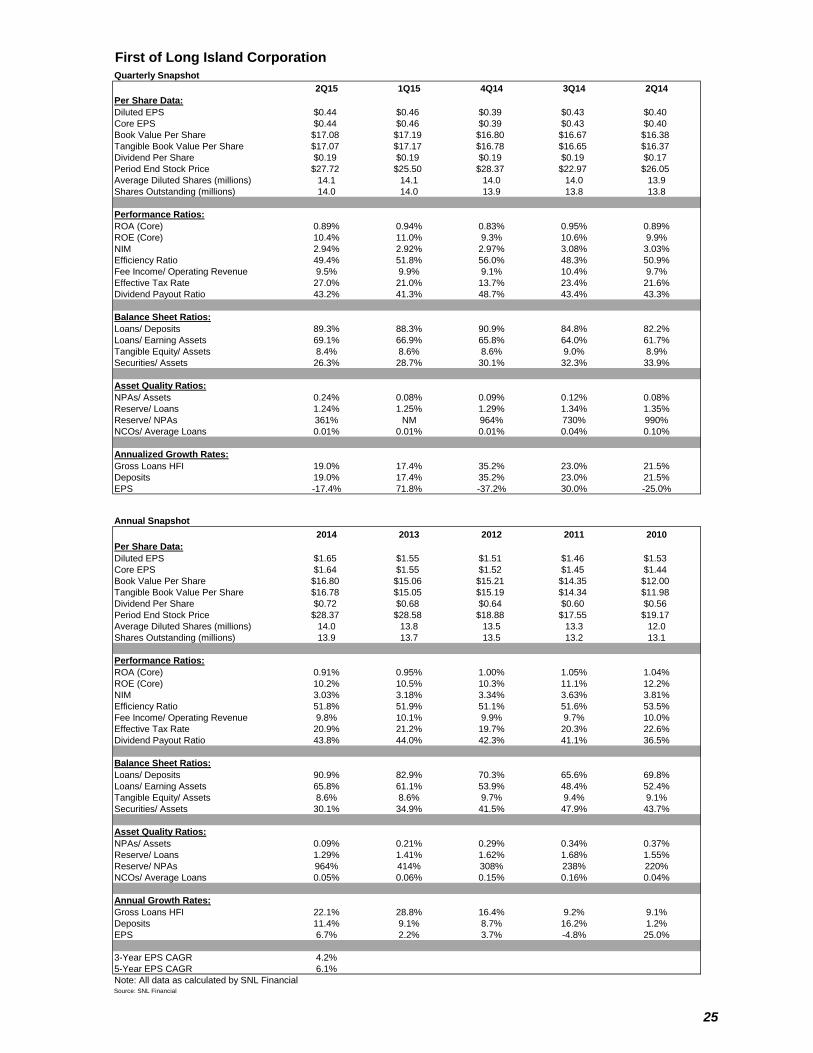
First of Long Island Corporation FLIC
Quarterly Snapshot 0.43
2Q15 1Q15 4Q14 3Q14 2Q14Per Share Data:Diluted EPS $0.44 $0.46 $0.39 $0.43 $0.40Core EPS $0.44 $0.46 $0.39 $0.43 $0.40Book Value Per Share $17.08 $17.19 $16.80 $16.67 $16.38Tangible Book Value Per Share $17.07 $17.17 $16.78 $16.65 $16.37Dividend Per Share $0.19 $0.19 $0.19 $0.19 $0.17Period End Stock Price $27.72 $25.50 $28.37 $22.97 $26.05Average Diluted Shares (millions) 14.1 14.1 14.0 14.0 13.9Shares Outstanding (millions) 14.0 14.0 13.9 13.8 13.8
Performance Ratios:ROA (Core) 0.89% 0.94% 0.83% 0.95% 0.89%ROE (Core) 10.4% 11.0% 9.3% 10.6% 9.9%NIM 2.94% 2.92% 2.97% 3.08% 3.03%Efficiency Ratio 49.4% 51.8% 56.0% 48.3% 50.9%Fee Income/ Operating Revenue 9.5% 9.9% 9.1% 10.4% 9.7%Effective Tax Rate 27.0% 21.0% 13.7% 23.4% 21.6%Dividend Payout Ratio 43.2% 41.3% 48.7% 43.4% 43.3%
Balance Sheet Ratios:Loans/ Deposits 89.3% 88.3% 90.9% 84.8% 82.2%Loans/ Earning Assets 69.1% 66.9% 65.8% 64.0% 61.7%Tangible Equity/ Assets 8.4% 8.6% 8.6% 9.0% 8.9%Securities/ Assets 26.3% 28.7% 30.1% 32.3% 33.9%
Asset Quality Ratios:NPAs/ Assets 0.24% 0.08% 0.09% 0.12% 0.08%Reserve/ Loans 1.24% 1.25% 1.29% 1.34% 1.35%Reserve/ NPAs 361% NM 964% 730% 990%NCOs/ Average Loans 0.01% 0.01% 0.01% 0.04% 0.10%
Annualized Growth Rates:Gross Loans HFI 19.0% 17.4% 35.2% 23.0% 21.5%Deposits 19.0% 17.4% 35.2% 23.0% 21.5%EPS -17.4% 71.8% -37.2% 30.0% -25.0%
Annual Snapshot2014 2013 2012 2011 2010
Per Share Data:Diluted EPS $1.65 $1.55 $1.51 $1.46 $1.53Core EPS $1.64 $1.55 $1.52 $1.45 $1.44Book Value Per Share $16.80 $15.06 $15.21 $14.35 $12.00Tangible Book Value Per Share $16.78 $15.05 $15.19 $14.34 $11.98Dividend Per Share $0.72 $0.68 $0.64 $0.60 $0.56Period End Stock Price $28.37 $28.58 $18.88 $17.55 $19.17Average Diluted Shares (millions) 14.0 13.8 13.5 13.3 12.0Shares Outstanding (millions) 13.9 13.7 13.5 13.2 13.1
Performance Ratios:ROA (Core) 0.91% 0.95% 1.00% 1.05% 1.04%ROE (Core) 10.2% 10.5% 10.3% 11.1% 12.2%NIM 3.03% 3.18% 3.34% 3.63% 3.81%Efficiency Ratio 51.8% 51.9% 51.1% 51.6% 53.5%Fee Income/ Operating Revenue 9.8% 10.1% 9.9% 9.7% 10.0%Effective Tax Rate 20.9% 21.2% 19.7% 20.3% 22.6%Dividend Payout Ratio 43.8% 44.0% 42.3% 41.1% 36.5%
Balance Sheet Ratios:Loans/ Deposits 90.9% 82.9% 70.3% 65.6% 69.8%Loans/ Earning Assets 65.8% 61.1% 53.9% 48.4% 52.4%Tangible Equity/ Assets 8.6% 8.6% 9.7% 9.4% 9.1%Securities/ Assets 30.1% 34.9% 41.5% 47.9% 43.7%
Asset Quality Ratios:NPAs/ Assets 0.09% 0.21% 0.29% 0.34% 0.37%Reserve/ Loans 1.29% 1.41% 1.62% 1.68% 1.55%Reserve/ NPAs 964% 414% 308% 238% 220%NCOs/ Average Loans 0.05% 0.06% 0.15% 0.16% 0.04%
Annual Growth Rates:Gross Loans HFI 22.1% 28.8% 16.4% 9.2% 9.1%Deposits 11.4% 9.1% 8.7% 16.2% 1.2%EPS 6.7% 2.2% 3.7% -4.8% 25.0%
3-Year EPS CAGR 4.2%5-Year EPS CAGR 6.1%Note: All data as calculated by SNL FinancialSource: SNL Financial
25
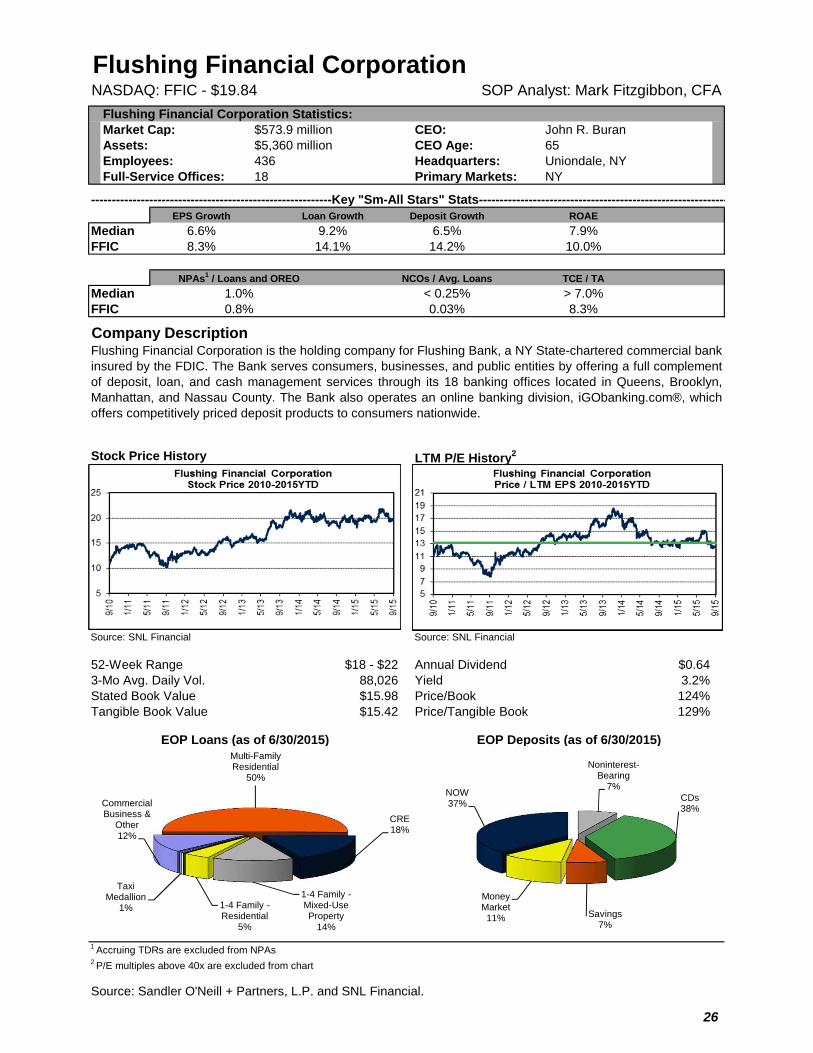
Flushing Financial CorporationNASDAQ: FFIC - $19.84 SOP Analyst: Mark Fitzgibbon, CFA
Flushing Financial Corporation Statistics:Market Cap: $573.9 million CEO: John R. BuranAssets: $5,360 million CEO Age: 65Employees: 436 Headquarters: Uniondale, NYFull-Service Offices: 18 Primary Markets: NY
----------------------------------------------------------Key "Sm-All Stars" Stats------------------------------------------------------------EPS Growth Loan Growth Deposit Growth ROAE
Median 6.6% 9.2% 6.5% 7.9%FFIC 8.3% 14.1% 14.2% 10.0%
NCOs / Avg. Loans TCE / TA
Median < 0.25% > 7.0%FFIC 0.03% 8.3%
Company Description
Stock Price History LTM P/E History2
Source: SNL Financial Source: SNL Financial
52-Week Range $18 - $22 Annual Dividend $0.643-Mo Avg. Daily Vol. 88,026 Yield 3.2%Stated Book Value $15.98 Price/Book 124%Tangible Book Value $15.42 Price/Tangible Book 129%
EOP Loans (as of 6/30/2015) EOP Deposits (as of 6/30/2015)
1 Accruing TDRs are excluded from NPAs2 P/E multiples above 40x are excluded from chart
Source: Sandler O'Neill + Partners, L.P. and SNL Financial.
Flushing Financial Corporation is the holding company for Flushing Bank, a NY State-chartered commercial bankinsured by the FDIC. The Bank serves consumers, businesses, and public entities by offering a full complementof deposit, loan, and cash management services through its 18 banking offices located in Queens, Brooklyn,Manhattan, and Nassau County. The Bank also operates an online banking division, iGObanking.com®, whichoffers competitively priced deposit products to consumers nationwide.
NPAs1 / Loans and OREO
1.0%0.8%
Multi-Family Residential
50%
CRE18%
1-4 Family -Mixed-Use Property
14%
1-4 Family -Residential
5%
Taxi Medallion
1%
Commercial Business &
Other12%
Noninterest-Bearing
7%CDs38%
Savings7%
Money Market11%
NOW37%
26

Flushing Financial Corporation FFIC
Quarterly Snapshot 0.34
2Q15 1Q15 4Q14 3Q14 2Q14Per Share Data:Diluted EPS $0.51 $0.30 $0.38 $0.38 $0.39Core EPS $0.36 $0.30 $0.43 $0.26 $0.39Book Value Per Share $15.98 $15.84 $15.52 $15.26 $15.26Tangible Book Value Per Share $15.42 $15.29 $14.97 $14.72 $14.72Dividend Per Share $0.16 $0.16 $0.15 $0.15 $0.15Period End Stock Price $21.01 $20.07 $20.27 $18.27 $20.55Average Diluted Shares (millions) 29.3 29.4 29.4 29.8 30.1Shares Outstanding (millions) 28.9 29.4 29.4 29.6 30.2
Performance Ratios:ROA (Core) 0.79% 0.68% 1.02% 0.64% 0.97%ROE (Core) 9.1% 7.6% 11.1% 6.9% 10.3%NIM 3.03% 3.09% 3.19% 2.77% 3.22%Efficiency Ratio 58.2% 64.4% 54.7% 62.2% 52.4%Fee Income/ Operating Revenue 8.1% 4.9% 4.5% 5.6% 5.1%Effective Tax Rate 39.1% 38.8% 38.7% 38.7% 39.4%Dividend Payout Ratio 31.4% 53.3% 39.5% 39.5% 38.5%
Balance Sheet Ratios:Loans/ Deposits 109.0% 110.9% 108.6% 108.4% 109.1%Loans/ Earning Assets 74.9% 75.5% 74.7% 74.1% 72.3%Tangible Equity/ Assets 8.3% 8.6% 8.7% 8.9% 9.2%Securities/ Assets 20.4% 20.1% 20.1% 21.1% 22.9%
Asset Quality Ratios:NPAs/ Assets 1.03% 1.12% 1.27% 1.39% 1.54%Reserve/ Loans 0.57% 0.60% 0.66% 0.78% 0.83%Reserve/ NPAs 55% 54% 52% 56% 54%NCOs/ Average Loans 0.05% 0.03% 0.01% 0.03% -0.01%
Annualized Growth Rates:Gross Loans HFI 3.5% 19.9% 18.4% 13.1% 3.9%Deposits 10.2% 11.1% 17.2% 15.4% -13.3%EPS 280.0% -84.2% 0.0% -10.3% 58.8%
Annual Snapshot2014 2013 2012 2011 2010
Per Share Data:Diluted EPS $1.48 $1.26 $1.13 $1.15 $1.28Core EPS $1.42 $1.24 $1.16 $1.19 $1.33Book Value Per Share $15.52 $14.36 $14.39 $13.49 $12.48Tangible Book Value Per Share $14.97 $13.82 $13.85 $12.94 $11.92Dividend Per Share $0.60 $0.52 $0.52 $0.52 $0.52Period End Stock Price $20.27 $20.70 $15.34 $12.63 $14.00Average Diluted Shares (millions) 29.8 30.1 30.4 30.7 30.4Shares Outstanding (millions) 29.4 30.1 30.7 30.9 31.3
Performance Ratios:ROA (Core) 0.88% 0.81% 0.80% 0.85% 0.95%ROE (Core) 9.4% 8.6% 8.2% 9.1% 10.7%NIM 3.11% 3.37% 3.65% 3.61% 3.43%Efficiency Ratio 56.4% 50.7% 49.2% 46.9% 46.4%Fee Income/ Operating Revenue 4.9% 5.2% 6.1% 7.4% 6.9%Effective Tax Rate 39.2% 37.8% 38.9% 39.9% 29.1%Dividend Payout Ratio 40.5% 41.3% 46.0% 45.2% 40.6%
Balance Sheet Ratios:Loans/ Deposits 108.6% 106.2% 107.3% 102.6% 102.7%Loans/ Earning Assets 74.7% 72.3% 72.3% 74.8% 75.3%Tangible Equity/ Assets 8.7% 8.8% 9.6% 9.4% 8.6%Securities/ Assets 20.1% 22.6% 22.3% 19.7% 19.3%
Asset Quality Ratios:NPAs/ Assets 0.96% 1.40% 2.55% 3.20% 2.99%Reserve/ Loans 0.66% 0.93% 0.96% 0.94% 0.85%Reserve/ NPAs 52% 48% 27% 22% 21%NCOs/ Average Loans 0.02% 0.41% 0.64% 0.59% 0.42%
Annual Growth Rates:Gross Loans HFI 11.0% 6.2% 0.2% -1.4% 1.7%Deposits 8.5% 7.2% -4.2% -1.4% 18.5%EPS 17.5% 11.5% -1.7% -10.2% 40.7%
3-Year EPS CAGR 8.8%5-Year EPS CAGR 10.2%Note: All data as calculated by SNL FinancialSource: SNL Financial
27
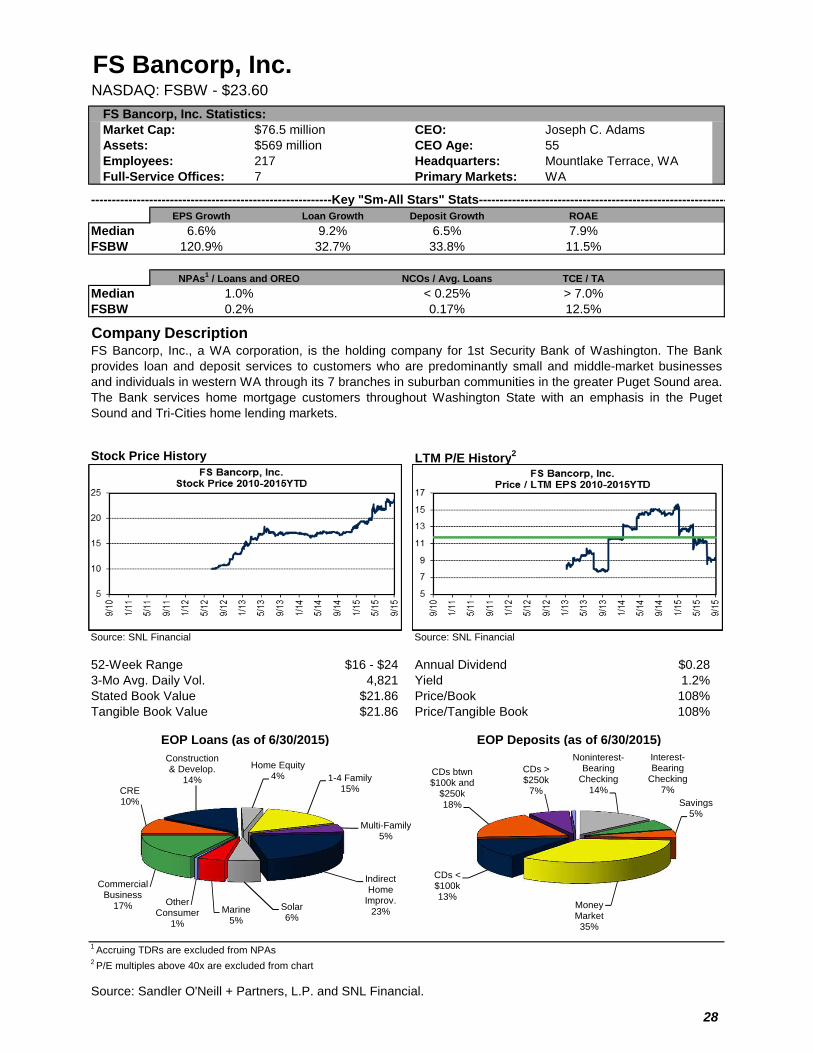
FS Bancorp, Inc.NASDAQ: FSBW - $23.60
FS Bancorp, Inc. Statistics:Market Cap: $76.5 million CEO: Joseph C. AdamsAssets: $569 million CEO Age: 55Employees: 217 Headquarters: Mountlake Terrace, WAFull-Service Offices: 7 Primary Markets: WA
----------------------------------------------------------Key "Sm-All Stars" Stats------------------------------------------------------------EPS Growth Loan Growth Deposit Growth ROAE
Median 6.6% 9.2% 6.5% 7.9%FSBW 120.9% 32.7% 33.8% 11.5%
NCOs / Avg. Loans TCE / TA
Median < 0.25% > 7.0%FSBW 0.17% 12.5%
Company Description
Stock Price History LTM P/E History2
Source: SNL Financial Source: SNL Financial
52-Week Range $16 - $24 Annual Dividend $0.283-Mo Avg. Daily Vol. 4,821 Yield 1.2%Stated Book Value $21.86 Price/Book 108%Tangible Book Value $21.86 Price/Tangible Book 108%
EOP Loans (as of 6/30/2015) EOP Deposits (as of 6/30/2015)
1 Accruing TDRs are excluded from NPAs2 P/E multiples above 40x are excluded from chart
Source: Sandler O'Neill + Partners, L.P. and SNL Financial.
FS Bancorp, Inc., a WA corporation, is the holding company for 1st Security Bank of Washington. The Bankprovides loan and deposit services to customers who are predominantly small and middle-market businessesand individuals in western WA through its 7 branches in suburban communities in the greater Puget Sound area.The Bank services home mortgage customers throughout Washington State with an emphasis in the PugetSound and Tri-Cities home lending markets.
NPAs1 / Loans and OREO
1.0%0.2%
CRE10%
Construction & Develop.
14%
Home Equity4% 1-4 Family
15%
Multi-Family5%
Indirect Home
Improv.23%Solar
6%Marine
5%
Other Consumer
1%
Commercial Business
17%
Noninterest-Bearing
Checking14%
Interest-Bearing
Checking7%
Savings5%
Money Market35%
CDs < $100k13%
CDs btwn $100k and
$250k18%
CDs > $250k
7%
28
FS Bancorp, Inc. FSBW
Quarterly Snapshot 0.29
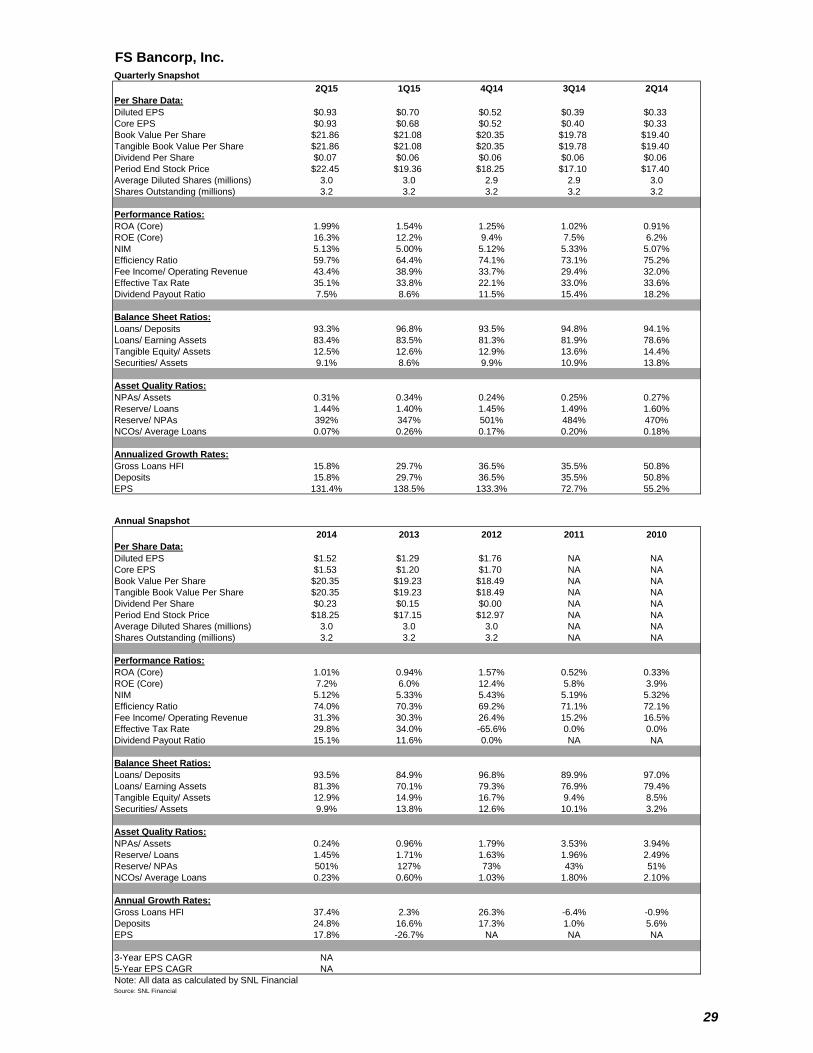
2Q15 1Q15 4Q14 3Q14 2Q14Per Share Data:Diluted EPS $0.93 $0.70 $0.52 $0.39 $0.33Core EPS $0.93 $0.68 $0.52 $0.40 $0.33Book Value Per Share $21.86 $21.08 $20.35 $19.78 $19.40Tangible Book Value Per Share $21.86 $21.08 $20.35 $19.78 $19.40Dividend Per Share $0.07 $0.06 $0.06 $0.06 $0.06Period End Stock Price $22.45 $19.36 $18.25 $17.10 $17.40Average Diluted Shares (millions) 3.0 3.0 2.9 2.9 3.0Shares Outstanding (millions) 3.2 3.2 3.2 3.2 3.2
Performance Ratios:ROA (Core) 1.99% 1.54% 1.25% 1.02% 0.91%ROE (Core) 16.3% 12.2% 9.4% 7.5% 6.2%NIM 5.13% 5.00% 5.12% 5.33% 5.07%Efficiency Ratio 59.7% 64.4% 74.1% 73.1% 75.2%Fee Income/ Operating Revenue 43.4% 38.9% 33.7% 29.4% 32.0%Effective Tax Rate 35.1% 33.8% 22.1% 33.0% 33.6%Dividend Payout Ratio 7.5% 8.6% 11.5% 15.4% 18.2%
Balance Sheet Ratios:Loans/ Deposits 93.3% 96.8% 93.5% 94.8% 94.1%Loans/ Earning Assets 83.4% 83.5% 81.3% 81.9% 78.6%Tangible Equity/ Assets 12.5% 12.6% 12.9% 13.6% 14.4%Securities/ Assets 9.1% 8.6% 9.9% 10.9% 13.8%
Asset Quality Ratios:NPAs/ Assets 0.31% 0.34% 0.24% 0.25% 0.27%Reserve/ Loans 1.44% 1.40% 1.45% 1.49% 1.60%Reserve/ NPAs 392% 347% 501% 484% 470%NCOs/ Average Loans 0.07% 0.26% 0.17% 0.20% 0.18%
Annualized Growth Rates:Gross Loans HFI 15.8% 29.7% 36.5% 35.5% 50.8%Deposits 15.8% 29.7% 36.5% 35.5% 50.8%EPS 131.4% 138.5% 133.3% 72.7% 55.2%
Annual Snapshot2014 2013 2012 2011 2010
Per Share Data:Diluted EPS $1.52 $1.29 $1.76 NA NACore EPS $1.53 $1.20 $1.70 NA NABook Value Per Share $20.35 $19.23 $18.49 NA NATangible Book Value Per Share $20.35 $19.23 $18.49 NA NADividend Per Share $0.23 $0.15 $0.00 NA NAPeriod End Stock Price $18.25 $17.15 $12.97 NA NAAverage Diluted Shares (millions) 3.0 3.0 3.0 NA NAShares Outstanding (millions) 3.2 3.2 3.2 NA NA
Performance Ratios:ROA (Core) 1.01% 0.94% 1.57% 0.52% 0.33%ROE (Core) 7.2% 6.0% 12.4% 5.8% 3.9%NIM 5.12% 5.33% 5.43% 5.19% 5.32%Efficiency Ratio 74.0% 70.3% 69.2% 71.1% 72.1%Fee Income/ Operating Revenue 31.3% 30.3% 26.4% 15.2% 16.5%Effective Tax Rate 29.8% 34.0% -65.6% 0.0% 0.0%Dividend Payout Ratio 15.1% 11.6% 0.0% NA NA
Balance Sheet Ratios:Loans/ Deposits 93.5% 84.9% 96.8% 89.9% 97.0%Loans/ Earning Assets 81.3% 70.1% 79.3% 76.9% 79.4%Tangible Equity/ Assets 12.9% 14.9% 16.7% 9.4% 8.5%Securities/ Assets 9.9% 13.8% 12.6% 10.1% 3.2%
Asset Quality Ratios:NPAs/ Assets 0.24% 0.96% 1.79% 3.53% 3.94%Reserve/ Loans 1.45% 1.71% 1.63% 1.96% 2.49%Reserve/ NPAs 501% 127% 73% 43% 51%NCOs/ Average Loans 0.23% 0.60% 1.03% 1.80% 2.10%
Annual Growth Rates:Gross Loans HFI 37.4% 2.3% 26.3% -6.4% -0.9%Deposits 24.8% 16.6% 17.3% 1.0% 5.6%EPS 17.8% -26.7% NA NA NA
3-Year EPS CAGR NA5-Year EPS CAGR NANote: All data as calculated by SNL FinancialSource: SNL Financial
29
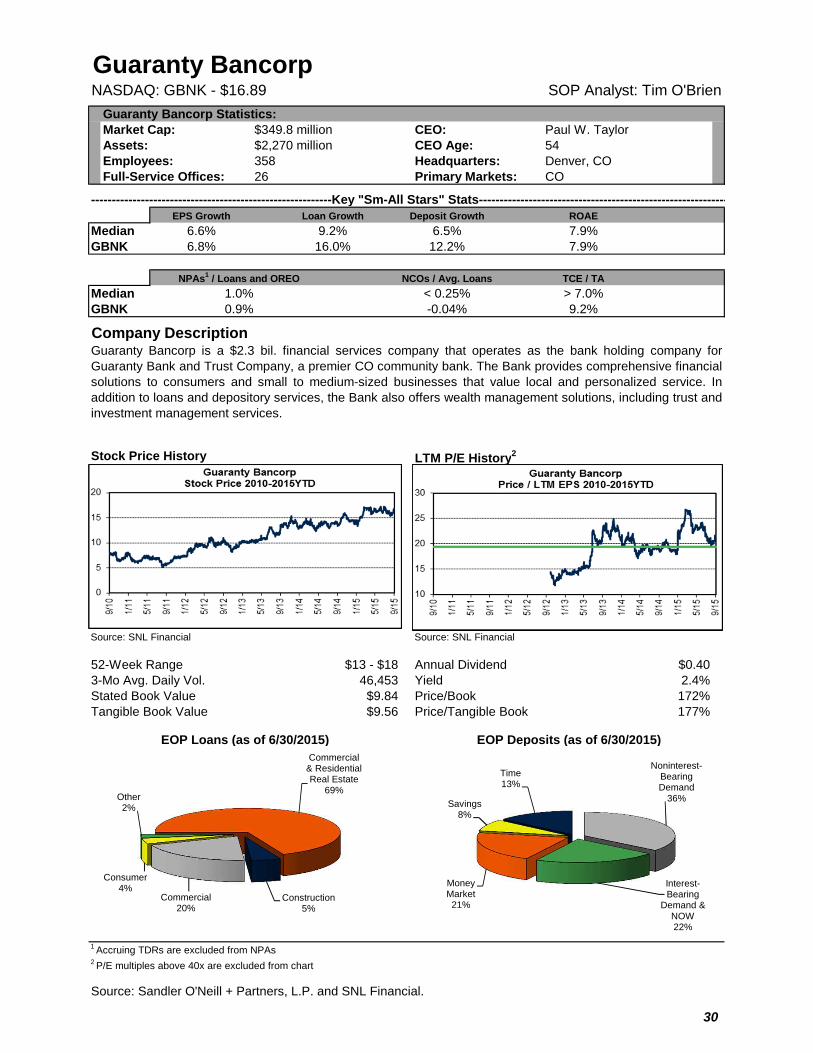
Guaranty BancorpNASDAQ: GBNK - $16.89 SOP Analyst: Tim O'Brien
Guaranty Bancorp Statistics:Market Cap: $349.8 million CEO: Paul W. TaylorAssets: $2,270 million CEO Age: 54Employees: 358 Headquarters: Denver, COFull-Service Offices: 26 Primary Markets: CO
----------------------------------------------------------Key "Sm-All Stars" Stats------------------------------------------------------------EPS Growth Loan Growth Deposit Growth ROAE
Median 6.6% 9.2% 6.5% 7.9%GBNK 6.8% 16.0% 12.2% 7.9%
NCOs / Avg. Loans TCE / TA
Median < 0.25% > 7.0%GBNK -0.04% 9.2%
Company Description
Stock Price History LTM P/E History2
Source: SNL Financial Source: SNL Financial
52-Week Range $13 - $18 Annual Dividend $0.403-Mo Avg. Daily Vol. 46,453 Yield 2.4%Stated Book Value $9.84 Price/Book 172%Tangible Book Value $9.56 Price/Tangible Book 177%
EOP Loans (as of 6/30/2015) EOP Deposits (as of 6/30/2015)
1 Accruing TDRs are excluded from NPAs2 P/E multiples above 40x are excluded from chart
Source: Sandler O'Neill + Partners, L.P. and SNL Financial.
Guaranty Bancorp is a $2.3 bil. financial services company that operates as the bank holding company forGuaranty Bank and Trust Company, a premier CO community bank. The Bank provides comprehensive financialsolutions to consumers and small to medium-sized businesses that value local and personalized service. Inaddition to loans and depository services, the Bank also offers wealth management solutions, including trust andinvestment management services.
NPAs1 / Loans and OREO
1.0%0.9%
Commercial & Residential Real Estate
69%
Construction5%
Commercial 20%
Consumer4%
Other2%
Noninterest-Bearing Demand
36%
Interest-Bearing
Demand & NOW22%
Money Market21%
Savings8%
Time13%
30
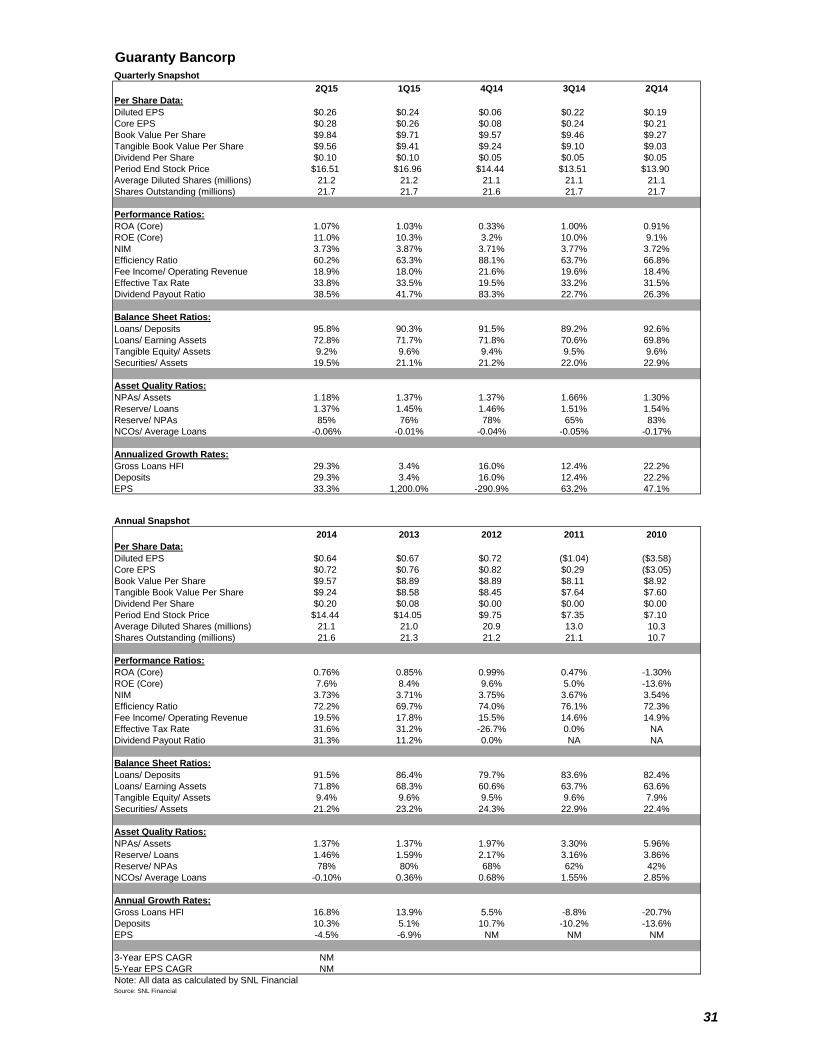
Guaranty Bancorp GBNK
Quarterly Snapshot 0.17
2Q15 1Q15 4Q14 3Q14 2Q14Per Share Data:Diluted EPS $0.26 $0.24 $0.06 $0.22 $0.19Core EPS $0.28 $0.26 $0.08 $0.24 $0.21Book Value Per Share $9.84 $9.71 $9.57 $9.46 $9.27Tangible Book Value Per Share $9.56 $9.41 $9.24 $9.10 $9.03Dividend Per Share $0.10 $0.10 $0.05 $0.05 $0.05Period End Stock Price $16.51 $16.96 $14.44 $13.51 $13.90Average Diluted Shares (millions) 21.2 21.2 21.1 21.1 21.1Shares Outstanding (millions) 21.7 21.7 21.6 21.7 21.7
Performance Ratios:ROA (Core) 1.07% 1.03% 0.33% 1.00% 0.91%ROE (Core) 11.0% 10.3% 3.2% 10.0% 9.1%NIM 3.73% 3.87% 3.71% 3.77% 3.72%Efficiency Ratio 60.2% 63.3% 88.1% 63.7% 66.8%Fee Income/ Operating Revenue 18.9% 18.0% 21.6% 19.6% 18.4%Effective Tax Rate 33.8% 33.5% 19.5% 33.2% 31.5%Dividend Payout Ratio 38.5% 41.7% 83.3% 22.7% 26.3%
Balance Sheet Ratios:Loans/ Deposits 95.8% 90.3% 91.5% 89.2% 92.6%Loans/ Earning Assets 72.8% 71.7% 71.8% 70.6% 69.8%Tangible Equity/ Assets 9.2% 9.6% 9.4% 9.5% 9.6%Securities/ Assets 19.5% 21.1% 21.2% 22.0% 22.9%
Asset Quality Ratios:NPAs/ Assets 1.18% 1.37% 1.37% 1.66% 1.30%Reserve/ Loans 1.37% 1.45% 1.46% 1.51% 1.54%Reserve/ NPAs 85% 76% 78% 65% 83%NCOs/ Average Loans -0.06% -0.01% -0.04% -0.05% -0.17%
Annualized Growth Rates:Gross Loans HFI 29.3% 3.4% 16.0% 12.4% 22.2%Deposits 29.3% 3.4% 16.0% 12.4% 22.2%EPS 33.3% 1,200.0% -290.9% 63.2% 47.1%
Annual Snapshot2014 2013 2012 2011 2010
Per Share Data:Diluted EPS $0.64 $0.67 $0.72 ($1.04) ($3.58)Core EPS $0.72 $0.76 $0.82 $0.29 ($3.05)Book Value Per Share $9.57 $8.89 $8.89 $8.11 $8.92Tangible Book Value Per Share $9.24 $8.58 $8.45 $7.64 $7.60Dividend Per Share $0.20 $0.08 $0.00 $0.00 $0.00Period End Stock Price $14.44 $14.05 $9.75 $7.35 $7.10Average Diluted Shares (millions) 21.1 21.0 20.9 13.0 10.3Shares Outstanding (millions) 21.6 21.3 21.2 21.1 10.7
Performance Ratios:ROA (Core) 0.76% 0.85% 0.99% 0.47% -1.30%ROE (Core) 7.6% 8.4% 9.6% 5.0% -13.6%NIM 3.73% 3.71% 3.75% 3.67% 3.54%Efficiency Ratio 72.2% 69.7% 74.0% 76.1% 72.3%Fee Income/ Operating Revenue 19.5% 17.8% 15.5% 14.6% 14.9%Effective Tax Rate 31.6% 31.2% -26.7% 0.0% NADividend Payout Ratio 31.3% 11.2% 0.0% NA NA
Balance Sheet Ratios:Loans/ Deposits 91.5% 86.4% 79.7% 83.6% 82.4%Loans/ Earning Assets 71.8% 68.3% 60.6% 63.7% 63.6%Tangible Equity/ Assets 9.4% 9.6% 9.5% 9.6% 7.9%Securities/ Assets 21.2% 23.2% 24.3% 22.9% 22.4%
Asset Quality Ratios:NPAs/ Assets 1.37% 1.37% 1.97% 3.30% 5.96%Reserve/ Loans 1.46% 1.59% 2.17% 3.16% 3.86%Reserve/ NPAs 78% 80% 68% 62% 42%NCOs/ Average Loans -0.10% 0.36% 0.68% 1.55% 2.85%
Annual Growth Rates:Gross Loans HFI 16.8% 13.9% 5.5% -8.8% -20.7%Deposits 10.3% 5.1% 10.7% -10.2% -13.6%EPS -4.5% -6.9% NM NM NM
3-Year EPS CAGR NM5-Year EPS CAGR NMNote: All data as calculated by SNL FinancialSource: SNL Financial
31
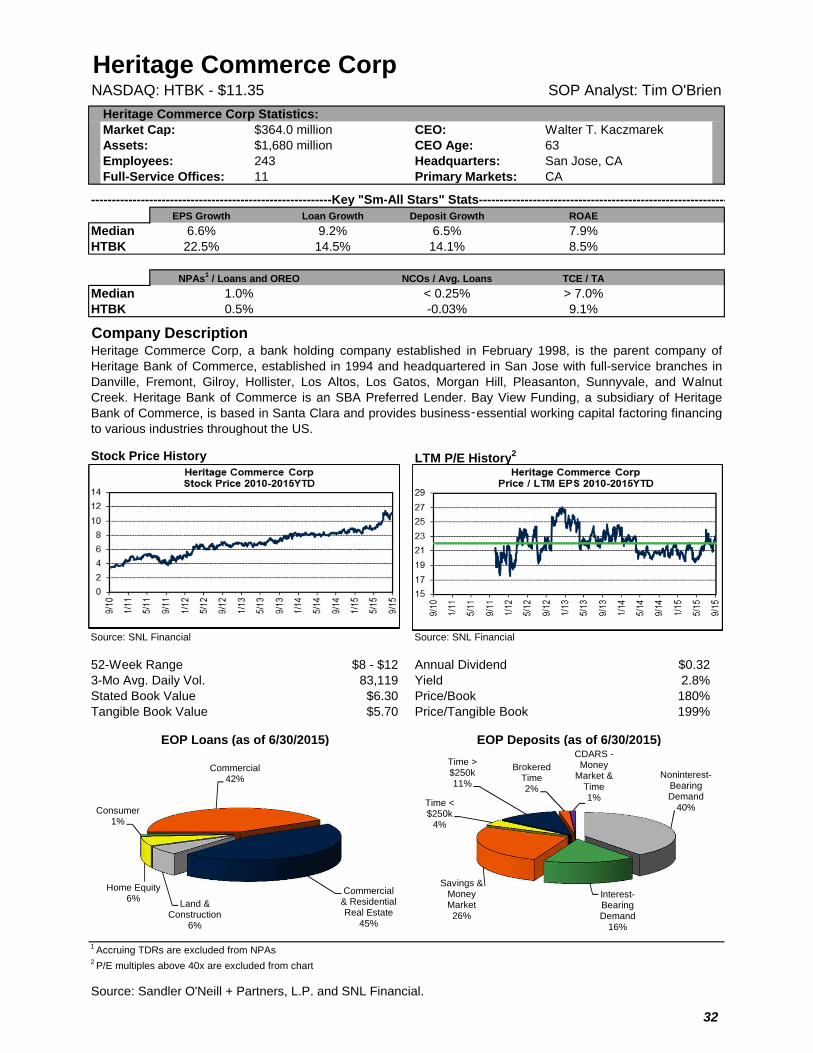
Heritage Commerce CorpNASDAQ: HTBK - $11.35 SOP Analyst: Tim O'Brien
Heritage Commerce Corp Statistics:Market Cap: $364.0 million CEO: Walter T. KaczmarekAssets: $1,680 million CEO Age: 63Employees: 243 Headquarters: San Jose, CAFull-Service Offices: 11 Primary Markets: CA
----------------------------------------------------------Key "Sm-All Stars" Stats------------------------------------------------------------EPS Growth Loan Growth Deposit Growth ROAE
Median 6.6% 9.2% 6.5% 7.9%HTBK 22.5% 14.5% 14.1% 8.5%
NCOs / Avg. Loans TCE / TA
Median < 0.25% > 7.0%HTBK -0.03% 9.1%
Company Description
Stock Price History LTM P/E History2
Source: SNL Financial Source: SNL Financial
52-Week Range $8 - $12 Annual Dividend $0.323-Mo Avg. Daily Vol. 83,119 Yield 2.8%Stated Book Value $6.30 Price/Book 180%Tangible Book Value $5.70 Price/Tangible Book 199%
EOP Loans (as of 6/30/2015) EOP Deposits (as of 6/30/2015)
1 Accruing TDRs are excluded from NPAs2 P/E multiples above 40x are excluded from chart
Source: Sandler O'Neill + Partners, L.P. and SNL Financial.
Heritage Commerce Corp, a bank holding company established in February 1998, is the parent company ofHeritage Bank of Commerce, established in 1994 and headquartered in San Jose with full-service branches inDanville, Fremont, Gilroy, Hollister, Los Altos, Los Gatos, Morgan Hill, Pleasanton, Sunnyvale, and WalnutCreek. Heritage Bank of Commerce is an SBA Preferred Lender. Bay View Funding, a subsidiary of HeritageBank of Commerce, is based in Santa Clara and provides business‑essential working capital factoring financingto various industries throughout the US.
NPAs1 / Loans and OREO
1.0%0.5%
Commercial42%
Commercial & Residential Real Estate
45%
Land & Construction
6%
Home Equity6%
Consumer1%
Noninterest-Bearing Demand
40%
Interest-Bearing Demand
16%
Savings & Money Market26%
Time < $250k
4%
Time > $250k11%
Brokered Time2%
CDARS -Money
Market & Time1%
32
Heritage Commerce Corp HTBK
Quarterly Snapshot 0.10
2Q15 1Q15 4Q14 3Q14 2Q14Per Share Data:Diluted EPS $0.14 $0.13 $0.11 $0.11 $0.10Core EPS $0.16 $0.14 $0.13 $0.12 $0.11Book Value Per Share $6.30 $6.31 $6.22 $6.20 $6.14Tangible Book Value Per Share $5.70 $5.70 $5.60 $6.15 $6.09Dividend Per Share $0.08 $0.08 $0.05 $0.05 $0.04Period End Stock Price $9.61 $9.13 $8.83 $8.21 $8.17Average Diluted Shares (millions) 26.8 26.7 26.6 26.5 26.5Shares Outstanding (millions) 26.6 26.5 26.5 26.4 26.4
Performance Ratios:ROA (Core) 1.17% 1.06% 1.01% 0.94% 0.99%ROE (Core) 10.4% 9.4% 8.9% 8.0% 8.2%NIM 4.65% 4.52% 4.36% 3.96% 4.06%Efficiency Ratio 59.9% 63.6% 63.6% 63.0% 64.2%Fee Income/ Operating Revenue 10.9% 10.3% 10.1% 11.5% 13.0%Effective Tax Rate 37.5% 37.0% 35.6% 36.5% 35.6%Dividend Payout Ratio 57.1% 61.5% 45.5% 45.5% 40.0%
Balance Sheet Ratios:Loans/ Deposits 78.3% 77.4% 78.4% 76.7% 78.1%Loans/ Earning Assets 66.9% 66.0% 66.6% 65.3% 66.2%Tangible Equity/ Assets 10.3% 10.4% 10.5% 11.7% 12.2%Securities/ Assets 19.0% 18.5% 19.3% 19.1% 24.8%
Asset Quality Ratios:NPAs/ Assets 0.32% 0.52% 0.41% 0.46% 0.59%Reserve/ Loans 1.65% 1.68% 1.69% 1.80% 1.87%Reserve/ NPAs 347% 217% 277% 259% 211%NCOs/ Average Loans -0.07% -0.09% 0.02% 0.01% 0.01%
Annualized Growth Rates:Gross Loans HFI 11.5% 4.9% 22.9% 15.9% 20.6%Deposits 11.5% 4.9% 22.9% 15.9% 20.6%EPS 30.8% 72.7% 0.0% 40.0% 0.0%
Annual Snapshot2014 2013 2012 2011 2010
Per Share Data:Diluted EPS $0.42 $0.36 $0.27 $0.28 ($3.64)Core EPS $0.46 $0.37 $0.29 $0.28 ($1.94)Book Value Per Share $6.22 $5.84 $5.71 $5.30 $4.73Tangible Book Value Per Share $5.60 $5.78 $5.63 $5.20 $4.61Dividend Per Share $0.18 $0.06 $0.00 $0.00 $0.00Period End Stock Price $8.83 $8.24 $6.98 $4.74 $4.50Average Diluted Shares (millions) 26.5 26.4 26.3 26.3 16.0Shares Outstanding (millions) 26.5 26.4 26.3 26.3 26.2
Performance Ratios:ROA (Core) 0.95% 0.83% 0.71% 0.89% -2.14%ROE (Core) 8.0% 6.9% 5.6% 6.0% -15.8%NIM 4.10% 3.84% 3.88% 3.94% 3.69%Efficiency Ratio 64.4% 69.2% 68.2% 69.5% 83.2%Fee Income/ Operating Revenue 11.8% 12.5% 13.1% 14.7% 11.3%Effective Tax Rate 36.0% 35.0% 35.6% 1.7% NADividend Payout Ratio 42.9% 16.7% 0.0% 0.0% NA
Balance Sheet Ratios:Loans/ Deposits 78.4% 71.1% 54.9% 72.9% 85.1%Loans/ Earning Assets 66.6% 60.8% 47.6% 57.7% 67.4%Tangible Equity/ Assets 10.5% 11.5% 9.9% 15.0% 14.4%Securities/ Assets 19.3% 25.9% 25.4% 29.9% 19.4%
Asset Quality Ratios:NPAs/ Assets 0.41% 0.76% 1.18% 1.39% 2.78%Reserve/ Loans 1.69% 2.09% 2.33% 2.70% 2.94%Reserve/ NPAs 277% 170% 95% 114% 73%NCOs/ Average Loans 0.05% -0.11% 0.57% 1.12% 3.13%
Annual Growth Rates:Gross Loans HFI 19.0% 12.6% 6.2% -9.6% -20.9%Deposits 7.9% -13.1% 41.0% 5.6% -8.8%EPS 16.7% 33.3% -3.6% NM NM
3-Year EPS CAGR 14.5%5-Year EPS CAGR NMNote: All data as calculated by SNL FinancialSource: SNL Financial
33
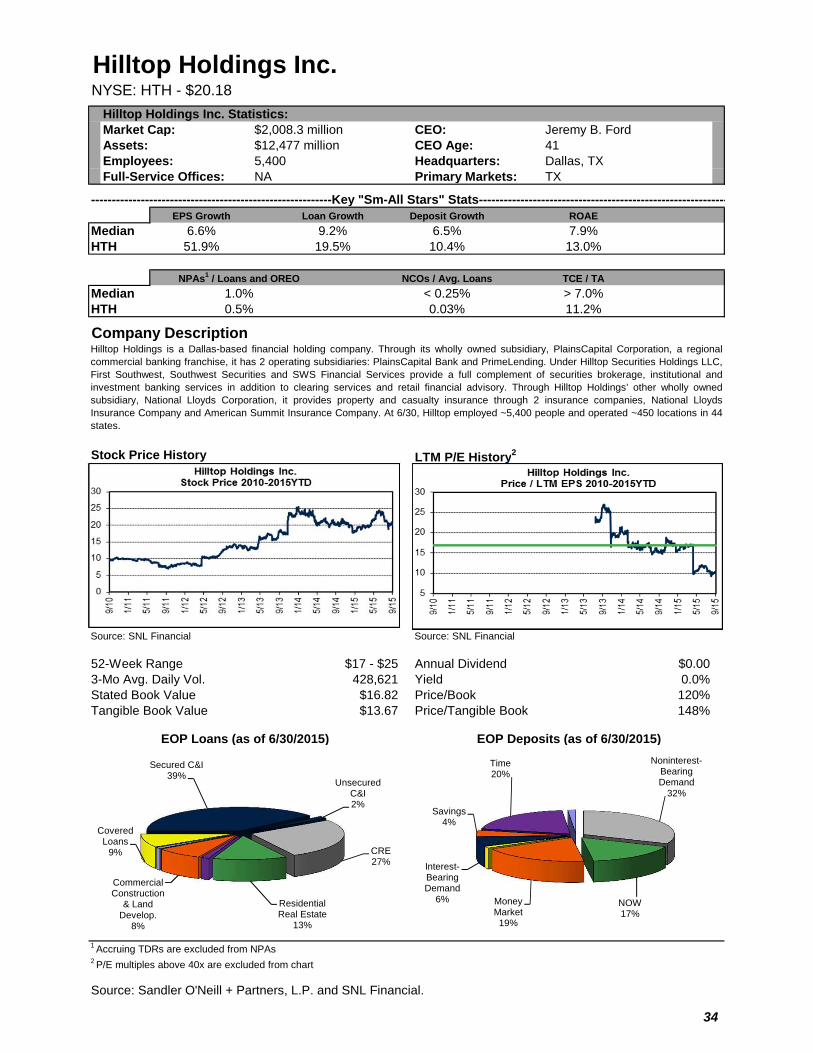
Hilltop Holdings Inc.NYSE: HTH - $20.18
Hilltop Holdings Inc. Statistics:Market Cap: $2,008.3 million CEO: Jeremy B. FordAssets: $12,477 million CEO Age: 41Employees: 5,400 Headquarters: Dallas, TXFull-Service Offices: NA Primary Markets: TX
----------------------------------------------------------Key "Sm-All Stars" Stats------------------------------------------------------------EPS Growth Loan Growth Deposit Growth ROAE
Median 6.6% 9.2% 6.5% 7.9%HTH 51.9% 19.5% 10.4% 13.0%
NCOs / Avg. Loans TCE / TA
Median < 0.25% > 7.0%HTH 0.03% 11.2%
Company Description
Stock Price History LTM P/E History2
Source: SNL Financial Source: SNL Financial
52-Week Range $17 - $25 Annual Dividend $0.003-Mo Avg. Daily Vol. 428,621 Yield 0.0%Stated Book Value $16.82 Price/Book 120%Tangible Book Value $13.67 Price/Tangible Book 148%
EOP Loans (as of 6/30/2015) EOP Deposits (as of 6/30/2015)
1 Accruing TDRs are excluded from NPAs2 P/E multiples above 40x are excluded from chart
Source: Sandler O'Neill + Partners, L.P. and SNL Financial.
Hilltop Holdings is a Dallas-based financial holding company. Through its wholly owned subsidiary, PlainsCapital Corporation, a regionalcommercial banking franchise, it has 2 operating subsidiaries: PlainsCapital Bank and PrimeLending. Under Hilltop Securities Holdings LLC,First Southwest, Southwest Securities and SWS Financial Services provide a full complement of securities brokerage, institutional andinvestment banking services in addition to clearing services and retail financial advisory. Through Hilltop Holdings’ other wholly ownedsubsidiary, National Lloyds Corporation, it provides property and casualty insurance through 2 insurance companies, National LloydsInsurance Company and American Summit Insurance Company. At 6/30, Hilltop employed ~5,400 people and operated ~450 locations in 44states.
NPAs1 / Loans and OREO
1.0%0.5%
Secured C&I39%
Unsecured C&I2%
CRE27%
Residential Real Estate
13%
Commercial Construction
& Land Develop.
8%
Covered Loans
9%
Noninterest-Bearing Demand
32%
NOW17%
Money Market19%
Interest-Bearing Demand
6%
Savings4%
Time20%
34
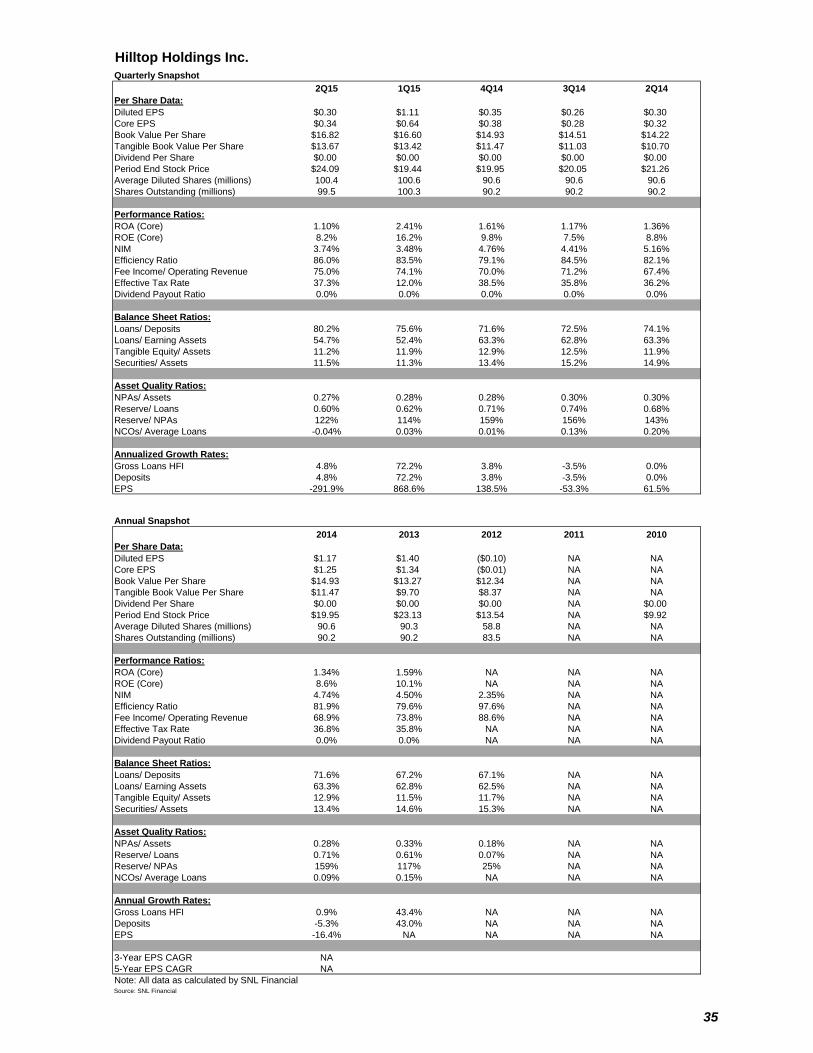
Hilltop Holdings Inc. HTH
Quarterly Snapshot 0.26
2Q15 1Q15 4Q14 3Q14 2Q14Per Share Data:Diluted EPS $0.30 $1.11 $0.35 $0.26 $0.30Core EPS $0.34 $0.64 $0.38 $0.28 $0.32Book Value Per Share $16.82 $16.60 $14.93 $14.51 $14.22Tangible Book Value Per Share $13.67 $13.42 $11.47 $11.03 $10.70Dividend Per Share $0.00 $0.00 $0.00 $0.00 $0.00Period End Stock Price $24.09 $19.44 $19.95 $20.05 $21.26Average Diluted Shares (millions) 100.4 100.6 90.6 90.6 90.6Shares Outstanding (millions) 99.5 100.3 90.2 90.2 90.2
Performance Ratios:ROA (Core) 1.10% 2.41% 1.61% 1.17% 1.36%ROE (Core) 8.2% 16.2% 9.8% 7.5% 8.8%NIM 3.74% 3.48% 4.76% 4.41% 5.16%Efficiency Ratio 86.0% 83.5% 79.1% 84.5% 82.1%Fee Income/ Operating Revenue 75.0% 74.1% 70.0% 71.2% 67.4%Effective Tax Rate 37.3% 12.0% 38.5% 35.8% 36.2%Dividend Payout Ratio 0.0% 0.0% 0.0% 0.0% 0.0%
Balance Sheet Ratios:Loans/ Deposits 80.2% 75.6% 71.6% 72.5% 74.1%Loans/ Earning Assets 54.7% 52.4% 63.3% 62.8% 63.3%Tangible Equity/ Assets 11.2% 11.9% 12.9% 12.5% 11.9%Securities/ Assets 11.5% 11.3% 13.4% 15.2% 14.9%
Asset Quality Ratios:NPAs/ Assets 0.27% 0.28% 0.28% 0.30% 0.30%Reserve/ Loans 0.60% 0.62% 0.71% 0.74% 0.68%Reserve/ NPAs 122% 114% 159% 156% 143%NCOs/ Average Loans -0.04% 0.03% 0.01% 0.13% 0.20%
Annualized Growth Rates:Gross Loans HFI 4.8% 72.2% 3.8% -3.5% 0.0%Deposits 4.8% 72.2% 3.8% -3.5% 0.0%EPS -291.9% 868.6% 138.5% -53.3% 61.5%
Annual Snapshot2014 2013 2012 2011 2010
Per Share Data:Diluted EPS $1.17 $1.40 ($0.10) NA NACore EPS $1.25 $1.34 ($0.01) NA NABook Value Per Share $14.93 $13.27 $12.34 NA NATangible Book Value Per Share $11.47 $9.70 $8.37 NA NADividend Per Share $0.00 $0.00 $0.00 NA $0.00Period End Stock Price $19.95 $23.13 $13.54 NA $9.92Average Diluted Shares (millions) 90.6 90.3 58.8 NA NAShares Outstanding (millions) 90.2 90.2 83.5 NA NA
Performance Ratios:ROA (Core) 1.34% 1.59% NA NA NAROE (Core) 8.6% 10.1% NA NA NANIM 4.74% 4.50% 2.35% NA NAEfficiency Ratio 81.9% 79.6% 97.6% NA NAFee Income/ Operating Revenue 68.9% 73.8% 88.6% NA NAEffective Tax Rate 36.8% 35.8% NA NA NADividend Payout Ratio 0.0% 0.0% NA NA NA
Balance Sheet Ratios:Loans/ Deposits 71.6% 67.2% 67.1% NA NALoans/ Earning Assets 63.3% 62.8% 62.5% NA NATangible Equity/ Assets 12.9% 11.5% 11.7% NA NASecurities/ Assets 13.4% 14.6% 15.3% NA NA
Asset Quality Ratios:NPAs/ Assets 0.28% 0.33% 0.18% NA NAReserve/ Loans 0.71% 0.61% 0.07% NA NAReserve/ NPAs 159% 117% 25% NA NANCOs/ Average Loans 0.09% 0.15% NA NA NA
Annual Growth Rates:Gross Loans HFI 0.9% 43.4% NA NA NADeposits -5.3% 43.0% NA NA NAEPS -16.4% NA NA NA NA
3-Year EPS CAGR NA5-Year EPS CAGR NANote: All data as calculated by SNL FinancialSource: SNL Financial
35
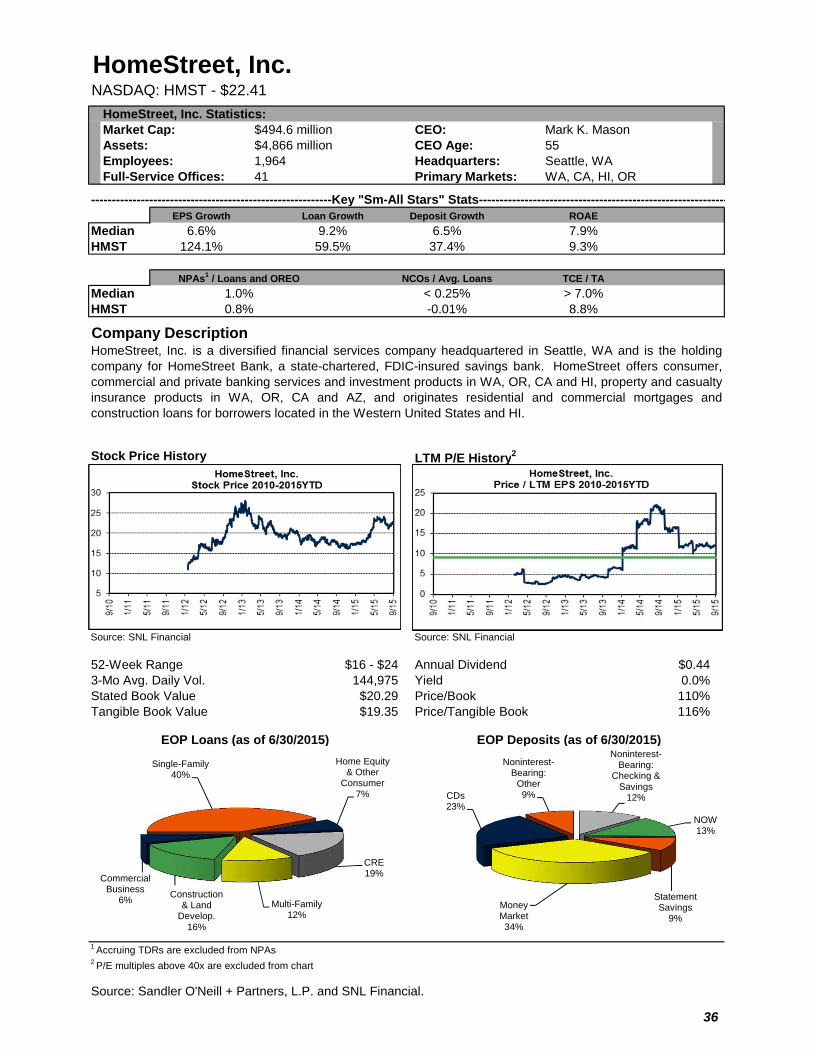
HomeStreet, Inc.NASDAQ: HMST - $22.41
HomeStreet, Inc. Statistics:Market Cap: $494.6 million CEO: Mark K. MasonAssets: $4,866 million CEO Age: 55Employees: 1,964 Headquarters: Seattle, WAFull-Service Offices: 41 Primary Markets: WA, CA, HI, OR
----------------------------------------------------------Key "Sm-All Stars" Stats------------------------------------------------------------EPS Growth Loan Growth Deposit Growth ROAE
Median 6.6% 9.2% 6.5% 7.9%HMST 124.1% 59.5% 37.4% 9.3%
NCOs / Avg. Loans TCE / TA
Median < 0.25% > 7.0%HMST -0.01% 8.8%
Company Description
Stock Price History LTM P/E History2
Source: SNL Financial Source: SNL Financial
52-Week Range $16 - $24 Annual Dividend $0.443-Mo Avg. Daily Vol. 144,975 Yield 0.0%Stated Book Value $20.29 Price/Book 110%Tangible Book Value $19.35 Price/Tangible Book 116%
EOP Loans (as of 6/30/2015) EOP Deposits (as of 6/30/2015)
1 Accruing TDRs are excluded from NPAs2 P/E multiples above 40x are excluded from chart
Source: Sandler O'Neill + Partners, L.P. and SNL Financial.
HomeStreet, Inc. is a diversified financial services company headquartered in Seattle, WA and is the holdingcompany for HomeStreet Bank, a state-chartered, FDIC-insured savings bank. HomeStreet offers consumer,commercial and private banking services and investment products in WA, OR, CA and HI, property and casualtyinsurance products in WA, OR, CA and AZ, and originates residential and commercial mortgages andconstruction loans for borrowers located in the Western United States and HI.
NPAs1 / Loans and OREO
1.0%0.8%
Single-Family40%
Home Equity & Other
Consumer7%
CRE19%
Multi-Family12%
Construction & Land
Develop.16%
Commercial Business
6%
Noninterest-Bearing:
Checking & Savings
12%
NOW13%
Statement Savings
9%Money Market34%
CDs23%
Noninterest-Bearing:
Other9%
36
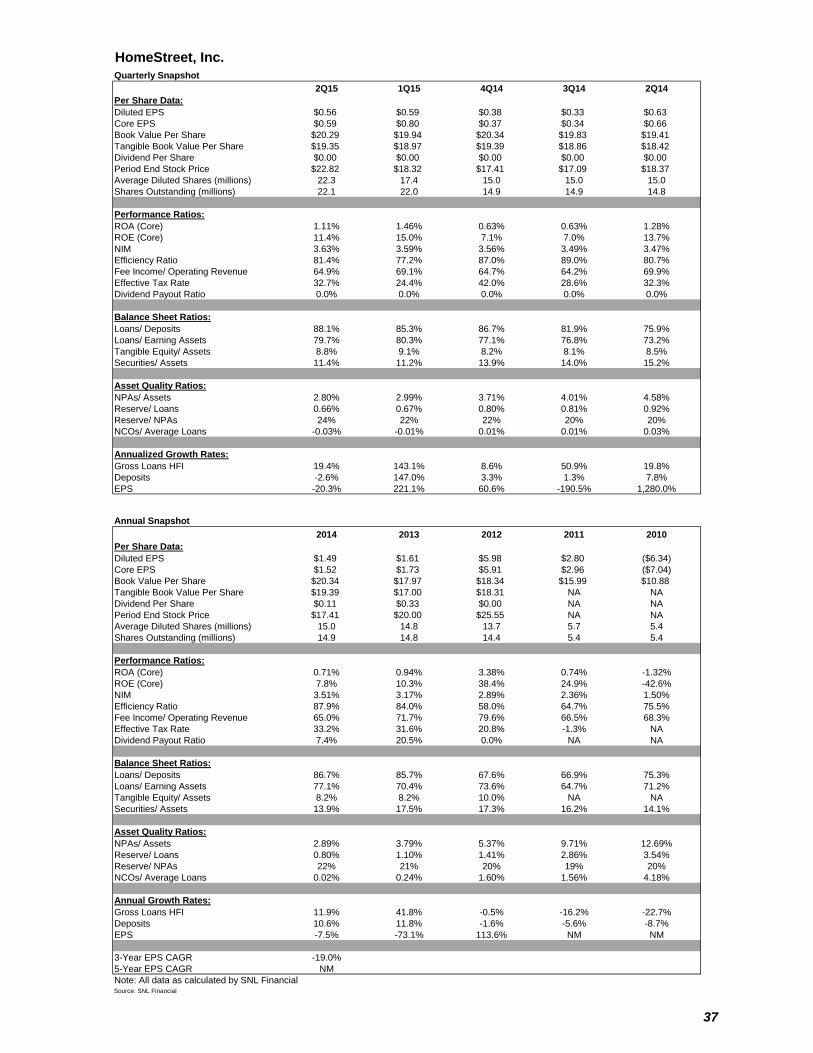
HomeStreet, Inc. HMST
Quarterly Snapshot 0.15
2Q15 1Q15 4Q14 3Q14 2Q14Per Share Data:Diluted EPS $0.56 $0.59 $0.38 $0.33 $0.63Core EPS $0.59 $0.80 $0.37 $0.34 $0.66Book Value Per Share $20.29 $19.94 $20.34 $19.83 $19.41Tangible Book Value Per Share $19.35 $18.97 $19.39 $18.86 $18.42Dividend Per Share $0.00 $0.00 $0.00 $0.00 $0.00Period End Stock Price $22.82 $18.32 $17.41 $17.09 $18.37Average Diluted Shares (millions) 22.3 17.4 15.0 15.0 15.0Shares Outstanding (millions) 22.1 22.0 14.9 14.9 14.8
Performance Ratios:ROA (Core) 1.11% 1.46% 0.63% 0.63% 1.28%ROE (Core) 11.4% 15.0% 7.1% 7.0% 13.7%NIM 3.63% 3.59% 3.56% 3.49% 3.47%Efficiency Ratio 81.4% 77.2% 87.0% 89.0% 80.7%Fee Income/ Operating Revenue 64.9% 69.1% 64.7% 64.2% 69.9%Effective Tax Rate 32.7% 24.4% 42.0% 28.6% 32.3%Dividend Payout Ratio 0.0% 0.0% 0.0% 0.0% 0.0%
Balance Sheet Ratios:Loans/ Deposits 88.1% 85.3% 86.7% 81.9% 75.9%Loans/ Earning Assets 79.7% 80.3% 77.1% 76.8% 73.2%Tangible Equity/ Assets 8.8% 9.1% 8.2% 8.1% 8.5%Securities/ Assets 11.4% 11.2% 13.9% 14.0% 15.2%
Asset Quality Ratios:NPAs/ Assets 2.80% 2.99% 3.71% 4.01% 4.58%Reserve/ Loans 0.66% 0.67% 0.80% 0.81% 0.92%Reserve/ NPAs 24% 22% 22% 20% 20%NCOs/ Average Loans -0.03% -0.01% 0.01% 0.01% 0.03%
Annualized Growth Rates:Gross Loans HFI 19.4% 143.1% 8.6% 50.9% 19.8%Deposits -2.6% 147.0% 3.3% 1.3% 7.8%EPS -20.3% 221.1% 60.6% -190.5% 1,280.0%
Annual Snapshot2014 2013 2012 2011 2010
Per Share Data:Diluted EPS $1.49 $1.61 $5.98 $2.80 ($6.34)Core EPS $1.52 $1.73 $5.91 $2.96 ($7.04)Book Value Per Share $20.34 $17.97 $18.34 $15.99 $10.88Tangible Book Value Per Share $19.39 $17.00 $18.31 NA NADividend Per Share $0.11 $0.33 $0.00 NA NAPeriod End Stock Price $17.41 $20.00 $25.55 NA NAAverage Diluted Shares (millions) 15.0 14.8 13.7 5.7 5.4Shares Outstanding (millions) 14.9 14.8 14.4 5.4 5.4
Performance Ratios:ROA (Core) 0.71% 0.94% 3.38% 0.74% -1.32%ROE (Core) 7.8% 10.3% 38.4% 24.9% -42.6%NIM 3.51% 3.17% 2.89% 2.36% 1.50%Efficiency Ratio 87.9% 84.0% 58.0% 64.7% 75.5%Fee Income/ Operating Revenue 65.0% 71.7% 79.6% 66.5% 68.3%Effective Tax Rate 33.2% 31.6% 20.8% -1.3% NADividend Payout Ratio 7.4% 20.5% 0.0% NA NA
Balance Sheet Ratios:Loans/ Deposits 86.7% 85.7% 67.6% 66.9% 75.3%Loans/ Earning Assets 77.1% 70.4% 73.6% 64.7% 71.2%Tangible Equity/ Assets 8.2% 8.2% 10.0% NA NASecurities/ Assets 13.9% 17.5% 17.3% 16.2% 14.1%
Asset Quality Ratios:NPAs/ Assets 2.89% 3.79% 5.37% 9.71% 12.69%Reserve/ Loans 0.80% 1.10% 1.41% 2.86% 3.54%Reserve/ NPAs 22% 21% 20% 19% 20%NCOs/ Average Loans 0.02% 0.24% 1.60% 1.56% 4.18%
Annual Growth Rates:Gross Loans HFI 11.9% 41.8% -0.5% -16.2% -22.7%Deposits 10.6% 11.8% -1.6% -5.6% -8.7%EPS -7.5% -73.1% 113.6% NM NM
3-Year EPS CAGR -19.0%5-Year EPS CAGR NMNote: All data as calculated by SNL FinancialSource: SNL Financial
37
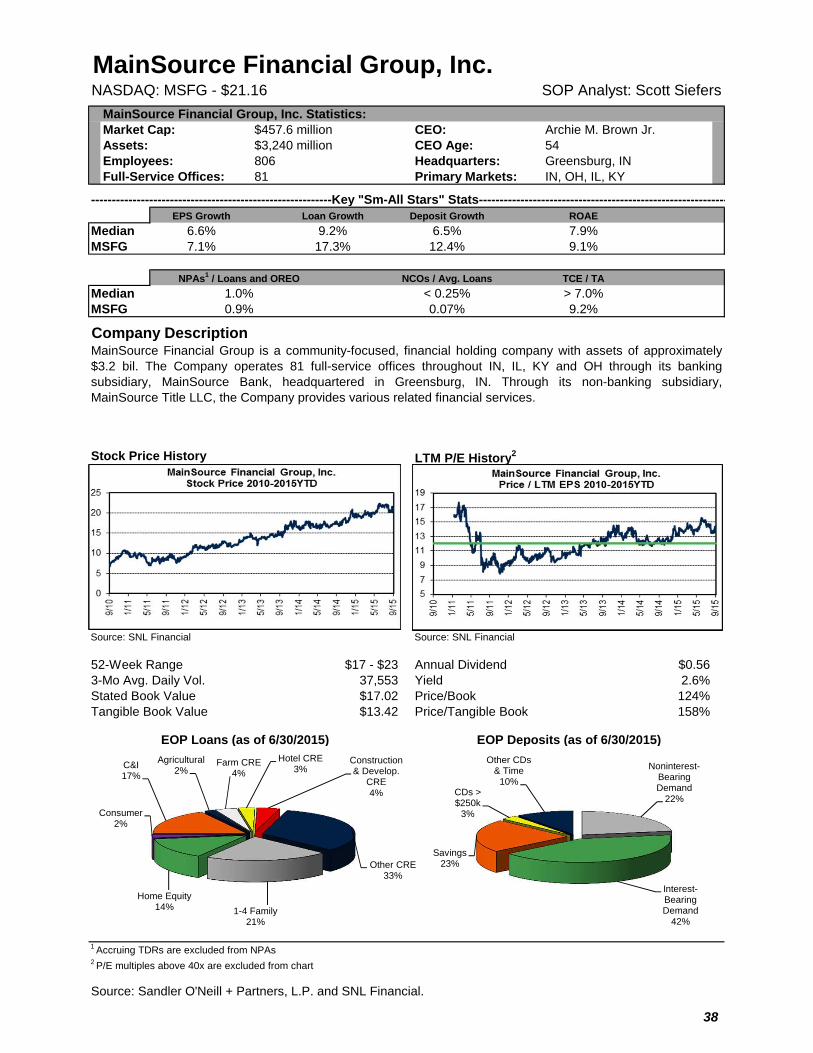
MainSource Financial Group, Inc.NASDAQ: MSFG - $21.16 SOP Analyst: Scott Siefers
MainSource Financial Group, Inc. Statistics:Market Cap: $457.6 million CEO: Archie M. Brown Jr.Assets: $3,240 million CEO Age: 54Employees: 806 Headquarters: Greensburg, INFull-Service Offices: 81 Primary Markets: IN, OH, IL, KY
----------------------------------------------------------Key "Sm-All Stars" Stats------------------------------------------------------------EPS Growth Loan Growth Deposit Growth ROAE
Median 6.6% 9.2% 6.5% 7.9%MSFG 7.1% 17.3% 12.4% 9.1%
NCOs / Avg. Loans TCE / TA
Median < 0.25% > 7.0%MSFG 0.07% 9.2%
Company Description
Stock Price History LTM P/E History2
Source: SNL Financial Source: SNL Financial
52-Week Range $17 - $23 Annual Dividend $0.563-Mo Avg. Daily Vol. 37,553 Yield 2.6%Stated Book Value $17.02 Price/Book 124%Tangible Book Value $13.42 Price/Tangible Book 158%
EOP Loans (as of 6/30/2015) EOP Deposits (as of 6/30/2015)
1 Accruing TDRs are excluded from NPAs2 P/E multiples above 40x are excluded from chart
Source: Sandler O'Neill + Partners, L.P. and SNL Financial.
MainSource Financial Group is a community-focused, financial holding company with assets of approximately$3.2 bil. The Company operates 81 full-service offices throughout IN, IL, KY and OH through its bankingsubsidiary, MainSource Bank, headquartered in Greensburg, IN. Through its non-banking subsidiary,MainSource Title LLC, the Company provides various related financial services.
NPAs1 / Loans and OREO
1.0%0.9%
C&I17%
Agricultural2%
Farm CRE4%
Hotel CRE3%
Construction & Develop.
CRE4%
Other CRE33%
1-4 Family21%
Home Equity14%
Consumer2%
Noninterest-Bearing Demand
22%
Interest-Bearing Demand
42%
Savings23%
CDs > $250k
3%
Other CDs & Time
10%
38
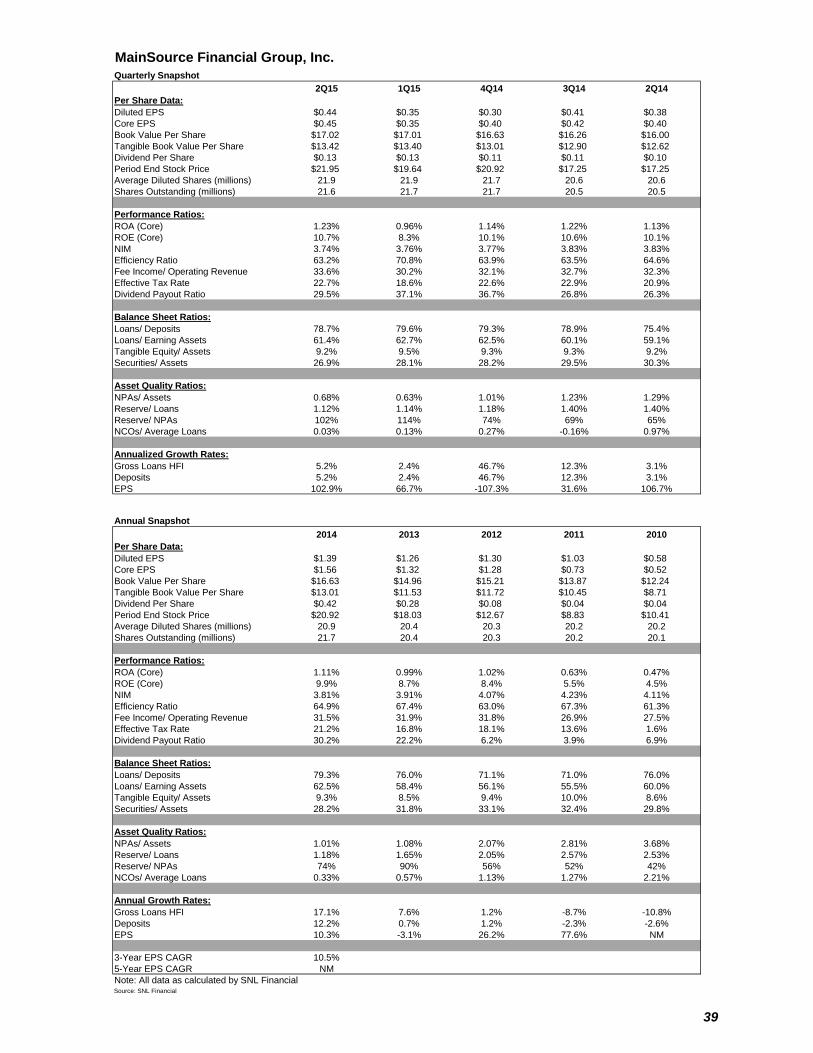
MainSource Financial Group, Inc. MSFG
Quarterly Snapshot 0.30
2Q15 1Q15 4Q14 3Q14 2Q14Per Share Data:Diluted EPS $0.44 $0.35 $0.30 $0.41 $0.38Core EPS $0.45 $0.35 $0.40 $0.42 $0.40Book Value Per Share $17.02 $17.01 $16.63 $16.26 $16.00Tangible Book Value Per Share $13.42 $13.40 $13.01 $12.90 $12.62Dividend Per Share $0.13 $0.13 $0.11 $0.11 $0.10Period End Stock Price $21.95 $19.64 $20.92 $17.25 $17.25Average Diluted Shares (millions) 21.9 21.9 21.7 20.6 20.6Shares Outstanding (millions) 21.6 21.7 21.7 20.5 20.5
Performance Ratios:ROA (Core) 1.23% 0.96% 1.14% 1.22% 1.13%ROE (Core) 10.7% 8.3% 10.1% 10.6% 10.1%NIM 3.74% 3.76% 3.77% 3.83% 3.83%Efficiency Ratio 63.2% 70.8% 63.9% 63.5% 64.6%Fee Income/ Operating Revenue 33.6% 30.2% 32.1% 32.7% 32.3%Effective Tax Rate 22.7% 18.6% 22.6% 22.9% 20.9%Dividend Payout Ratio 29.5% 37.1% 36.7% 26.8% 26.3%
Balance Sheet Ratios:Loans/ Deposits 78.7% 79.6% 79.3% 78.9% 75.4%Loans/ Earning Assets 61.4% 62.7% 62.5% 60.1% 59.1%Tangible Equity/ Assets 9.2% 9.5% 9.3% 9.3% 9.2%Securities/ Assets 26.9% 28.1% 28.2% 29.5% 30.3%
Asset Quality Ratios:NPAs/ Assets 0.68% 0.63% 1.01% 1.23% 1.29%Reserve/ Loans 1.12% 1.14% 1.18% 1.40% 1.40%Reserve/ NPAs 102% 114% 74% 69% 65%NCOs/ Average Loans 0.03% 0.13% 0.27% -0.16% 0.97%
Annualized Growth Rates:Gross Loans HFI 5.2% 2.4% 46.7% 12.3% 3.1%Deposits 5.2% 2.4% 46.7% 12.3% 3.1%EPS 102.9% 66.7% -107.3% 31.6% 106.7%
Annual Snapshot2014 2013 2012 2011 2010
Per Share Data:Diluted EPS $1.39 $1.26 $1.30 $1.03 $0.58Core EPS $1.56 $1.32 $1.28 $0.73 $0.52Book Value Per Share $16.63 $14.96 $15.21 $13.87 $12.24Tangible Book Value Per Share $13.01 $11.53 $11.72 $10.45 $8.71Dividend Per Share $0.42 $0.28 $0.08 $0.04 $0.04Period End Stock Price $20.92 $18.03 $12.67 $8.83 $10.41Average Diluted Shares (millions) 20.9 20.4 20.3 20.2 20.2Shares Outstanding (millions) 21.7 20.4 20.3 20.2 20.1
Performance Ratios:ROA (Core) 1.11% 0.99% 1.02% 0.63% 0.47%ROE (Core) 9.9% 8.7% 8.4% 5.5% 4.5%NIM 3.81% 3.91% 4.07% 4.23% 4.11%Efficiency Ratio 64.9% 67.4% 63.0% 67.3% 61.3%Fee Income/ Operating Revenue 31.5% 31.9% 31.8% 26.9% 27.5%Effective Tax Rate 21.2% 16.8% 18.1% 13.6% 1.6%Dividend Payout Ratio 30.2% 22.2% 6.2% 3.9% 6.9%
Balance Sheet Ratios:Loans/ Deposits 79.3% 76.0% 71.1% 71.0% 76.0%Loans/ Earning Assets 62.5% 58.4% 56.1% 55.5% 60.0%Tangible Equity/ Assets 9.3% 8.5% 9.4% 10.0% 8.6%Securities/ Assets 28.2% 31.8% 33.1% 32.4% 29.8%
Asset Quality Ratios:NPAs/ Assets 1.01% 1.08% 2.07% 2.81% 3.68%Reserve/ Loans 1.18% 1.65% 2.05% 2.57% 2.53%Reserve/ NPAs 74% 90% 56% 52% 42%NCOs/ Average Loans 0.33% 0.57% 1.13% 1.27% 2.21%
Annual Growth Rates:Gross Loans HFI 17.1% 7.6% 1.2% -8.7% -10.8%Deposits 12.2% 0.7% 1.2% -2.3% -2.6%EPS 10.3% -3.1% 26.2% 77.6% NM
3-Year EPS CAGR 10.5%5-Year EPS CAGR NMNote: All data as calculated by SNL FinancialSource: SNL Financial
39
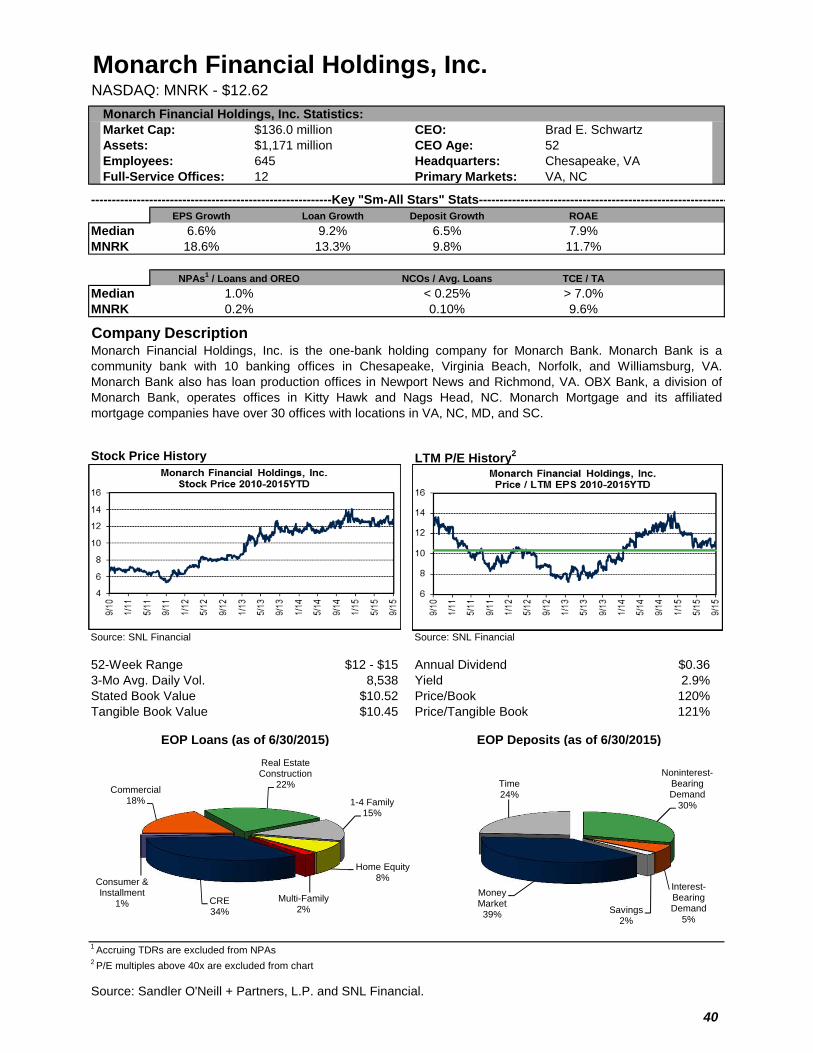
Monarch Financial Holdings, Inc.NASDAQ: MNRK - $12.62
Monarch Financial Holdings, Inc. Statistics:Market Cap: $136.0 million CEO: Brad E. SchwartzAssets: $1,171 million CEO Age: 52Employees: 645 Headquarters: Chesapeake, VAFull-Service Offices: 12 Primary Markets: VA, NC
----------------------------------------------------------Key "Sm-All Stars" Stats------------------------------------------------------------EPS Growth Loan Growth Deposit Growth ROAE
Median 6.6% 9.2% 6.5% 7.9%MNRK 18.6% 13.3% 9.8% 11.7%
NCOs / Avg. Loans TCE / TA
Median < 0.25% > 7.0%MNRK 0.10% 9.6%
Company Description
Stock Price History LTM P/E History2
Source: SNL Financial Source: SNL Financial
52-Week Range $12 - $15 Annual Dividend $0.363-Mo Avg. Daily Vol. 8,538 Yield 2.9%Stated Book Value $10.52 Price/Book 120%Tangible Book Value $10.45 Price/Tangible Book 121%
EOP Loans (as of 6/30/2015) EOP Deposits (as of 6/30/2015)
1 Accruing TDRs are excluded from NPAs2 P/E multiples above 40x are excluded from chart
Source: Sandler O'Neill + Partners, L.P. and SNL Financial.
Monarch Financial Holdings, Inc. is the one-bank holding company for Monarch Bank. Monarch Bank is acommunity bank with 10 banking offices in Chesapeake, Virginia Beach, Norfolk, and Williamsburg, VA.Monarch Bank also has loan production offices in Newport News and Richmond, VA. OBX Bank, a division ofMonarch Bank, operates offices in Kitty Hawk and Nags Head, NC. Monarch Mortgage and its affiliatedmortgage companies have over 30 offices with locations in VA, NC, MD, and SC.
NPAs1 / Loans and OREO
1.0%0.2%
Commercial18%
Real Estate Construction
22%
1-4 Family15%
Home Equity8%
Multi-Family2%
CRE34%
Consumer & Installment
1%
Noninterest-Bearing Demand
30%
Interest-Bearing Demand
5%Savings
2%
Money Market39%
Time24%
40
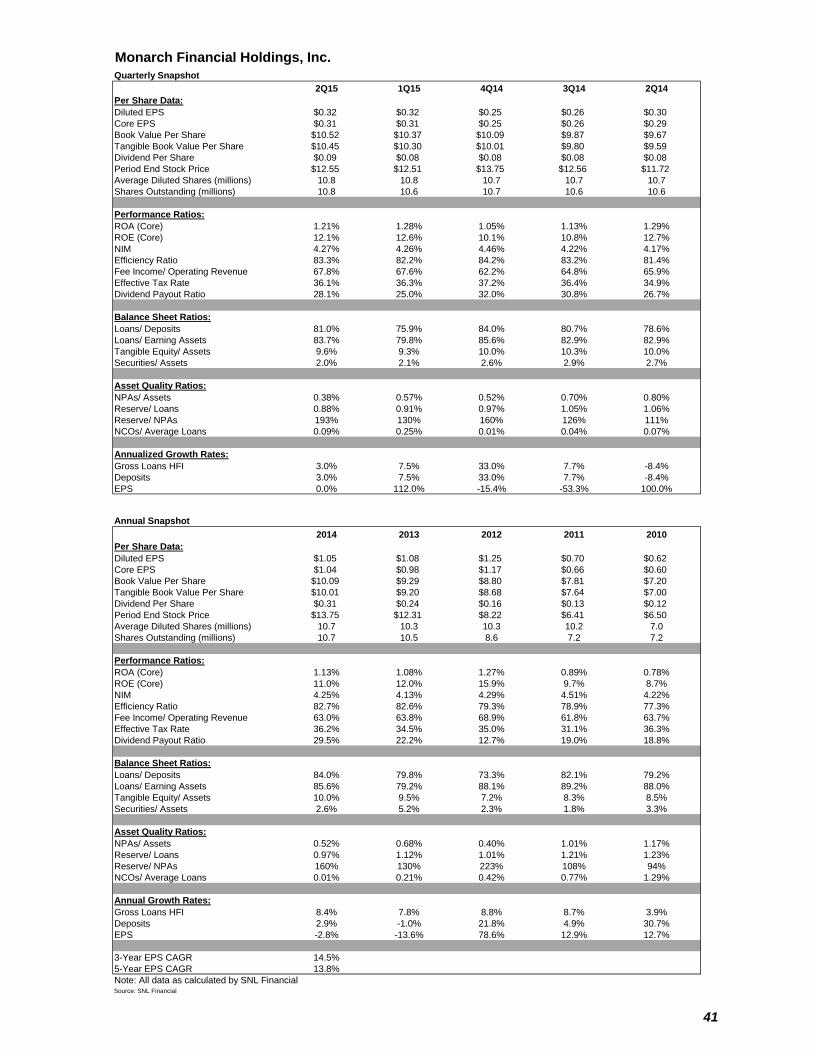
Monarch Financial Holdings, Inc. MNRK
Quarterly Snapshot 0.24
2Q15 1Q15 4Q14 3Q14 2Q14Per Share Data:Diluted EPS $0.32 $0.32 $0.25 $0.26 $0.30Core EPS $0.31 $0.31 $0.25 $0.26 $0.29Book Value Per Share $10.52 $10.37 $10.09 $9.87 $9.67Tangible Book Value Per Share $10.45 $10.30 $10.01 $9.80 $9.59Dividend Per Share $0.09 $0.08 $0.08 $0.08 $0.08Period End Stock Price $12.55 $12.51 $13.75 $12.56 $11.72Average Diluted Shares (millions) 10.8 10.8 10.7 10.7 10.7Shares Outstanding (millions) 10.8 10.6 10.7 10.6 10.6
Performance Ratios:ROA (Core) 1.21% 1.28% 1.05% 1.13% 1.29%ROE (Core) 12.1% 12.6% 10.1% 10.8% 12.7%NIM 4.27% 4.26% 4.46% 4.22% 4.17%Efficiency Ratio 83.3% 82.2% 84.2% 83.2% 81.4%Fee Income/ Operating Revenue 67.8% 67.6% 62.2% 64.8% 65.9%Effective Tax Rate 36.1% 36.3% 37.2% 36.4% 34.9%Dividend Payout Ratio 28.1% 25.0% 32.0% 30.8% 26.7%
Balance Sheet Ratios:Loans/ Deposits 81.0% 75.9% 84.0% 80.7% 78.6%Loans/ Earning Assets 83.7% 79.8% 85.6% 82.9% 82.9%Tangible Equity/ Assets 9.6% 9.3% 10.0% 10.3% 10.0%Securities/ Assets 2.0% 2.1% 2.6% 2.9% 2.7%
Asset Quality Ratios:NPAs/ Assets 0.38% 0.57% 0.52% 0.70% 0.80%Reserve/ Loans 0.88% 0.91% 0.97% 1.05% 1.06%Reserve/ NPAs 193% 130% 160% 126% 111%NCOs/ Average Loans 0.09% 0.25% 0.01% 0.04% 0.07%
Annualized Growth Rates:Gross Loans HFI 3.0% 7.5% 33.0% 7.7% -8.4%Deposits 3.0% 7.5% 33.0% 7.7% -8.4%EPS 0.0% 112.0% -15.4% -53.3% 100.0%
Annual Snapshot2014 2013 2012 2011 2010
Per Share Data:Diluted EPS $1.05 $1.08 $1.25 $0.70 $0.62Core EPS $1.04 $0.98 $1.17 $0.66 $0.60Book Value Per Share $10.09 $9.29 $8.80 $7.81 $7.20Tangible Book Value Per Share $10.01 $9.20 $8.68 $7.64 $7.00Dividend Per Share $0.31 $0.24 $0.16 $0.13 $0.12Period End Stock Price $13.75 $12.31 $8.22 $6.41 $6.50Average Diluted Shares (millions) 10.7 10.3 10.3 10.2 7.0Shares Outstanding (millions) 10.7 10.5 8.6 7.2 7.2
Performance Ratios:ROA (Core) 1.13% 1.08% 1.27% 0.89% 0.78%ROE (Core) 11.0% 12.0% 15.9% 9.7% 8.7%NIM 4.25% 4.13% 4.29% 4.51% 4.22%Efficiency Ratio 82.7% 82.6% 79.3% 78.9% 77.3%Fee Income/ Operating Revenue 63.0% 63.8% 68.9% 61.8% 63.7%Effective Tax Rate 36.2% 34.5% 35.0% 31.1% 36.3%Dividend Payout Ratio 29.5% 22.2% 12.7% 19.0% 18.8%
Balance Sheet Ratios:Loans/ Deposits 84.0% 79.8% 73.3% 82.1% 79.2%Loans/ Earning Assets 85.6% 79.2% 88.1% 89.2% 88.0%Tangible Equity/ Assets 10.0% 9.5% 7.2% 8.3% 8.5%Securities/ Assets 2.6% 5.2% 2.3% 1.8% 3.3%
Asset Quality Ratios:NPAs/ Assets 0.52% 0.68% 0.40% 1.01% 1.17%Reserve/ Loans 0.97% 1.12% 1.01% 1.21% 1.23%Reserve/ NPAs 160% 130% 223% 108% 94%NCOs/ Average Loans 0.01% 0.21% 0.42% 0.77% 1.29%
Annual Growth Rates:Gross Loans HFI 8.4% 7.8% 8.8% 8.7% 3.9%Deposits 2.9% -1.0% 21.8% 4.9% 30.7%EPS -2.8% -13.6% 78.6% 12.9% 12.7%
3-Year EPS CAGR 14.5%5-Year EPS CAGR 13.8%Note: All data as calculated by SNL FinancialSource: SNL Financial
41
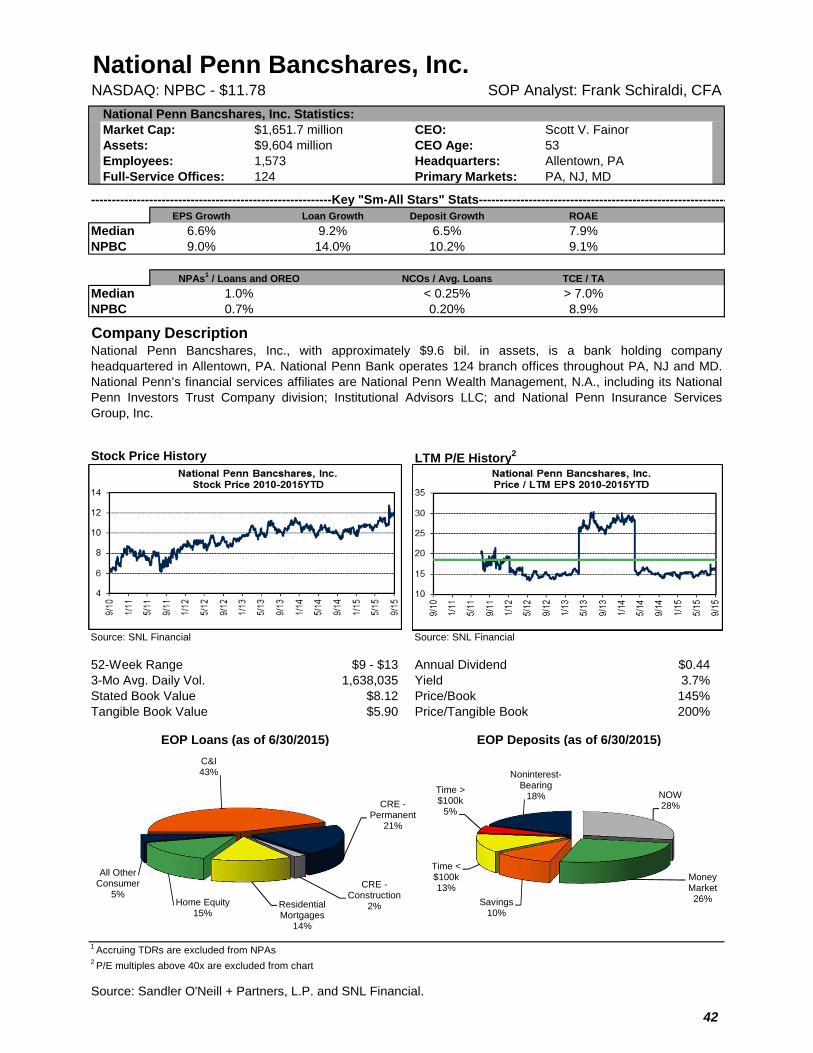
National Penn Bancshares, Inc.NASDAQ: NPBC - $11.78 SOP Analyst: Frank Schiraldi, CFA
National Penn Bancshares, Inc. Statistics:Market Cap: $1,651.7 million CEO: Scott V. FainorAssets: $9,604 million CEO Age: 53Employees: 1,573 Headquarters: Allentown, PAFull-Service Offices: 124 Primary Markets: PA, NJ, MD
----------------------------------------------------------Key "Sm-All Stars" Stats------------------------------------------------------------EPS Growth Loan Growth Deposit Growth ROAE
Median 6.6% 9.2% 6.5% 7.9%NPBC 9.0% 14.0% 10.2% 9.1%
NCOs / Avg. Loans TCE / TA
Median < 0.25% > 7.0%NPBC 0.20% 8.9%
Company Description
Stock Price History LTM P/E History2
Source: SNL Financial Source: SNL Financial
52-Week Range $9 - $13 Annual Dividend $0.443-Mo Avg. Daily Vol. 1,638,035 Yield 3.7%Stated Book Value $8.12 Price/Book 145%Tangible Book Value $5.90 Price/Tangible Book 200%
EOP Loans (as of 6/30/2015) EOP Deposits (as of 6/30/2015)
1 Accruing TDRs are excluded from NPAs2 P/E multiples above 40x are excluded from chart
Source: Sandler O'Neill + Partners, L.P. and SNL Financial.
National Penn Bancshares, Inc., with approximately $9.6 bil. in assets, is a bank holding companyheadquartered in Allentown, PA. National Penn Bank operates 124 branch offices throughout PA, NJ and MD.National Penn’s financial services affiliates are National Penn Wealth Management, N.A., including its NationalPenn Investors Trust Company division; Institutional Advisors LLC; and National Penn Insurance ServicesGroup, Inc.
NPAs1 / Loans and OREO
1.0%0.7%
C&I43%
CRE -Permanent
21%
CRE -Construction
2%Residential Mortgages
14%
Home Equity15%
All Other Consumer
5%
NOW28%
Money Market26%Savings
10%
Time < $100k13%
Time > $100k
5%
Noninterest-Bearing
18%
42
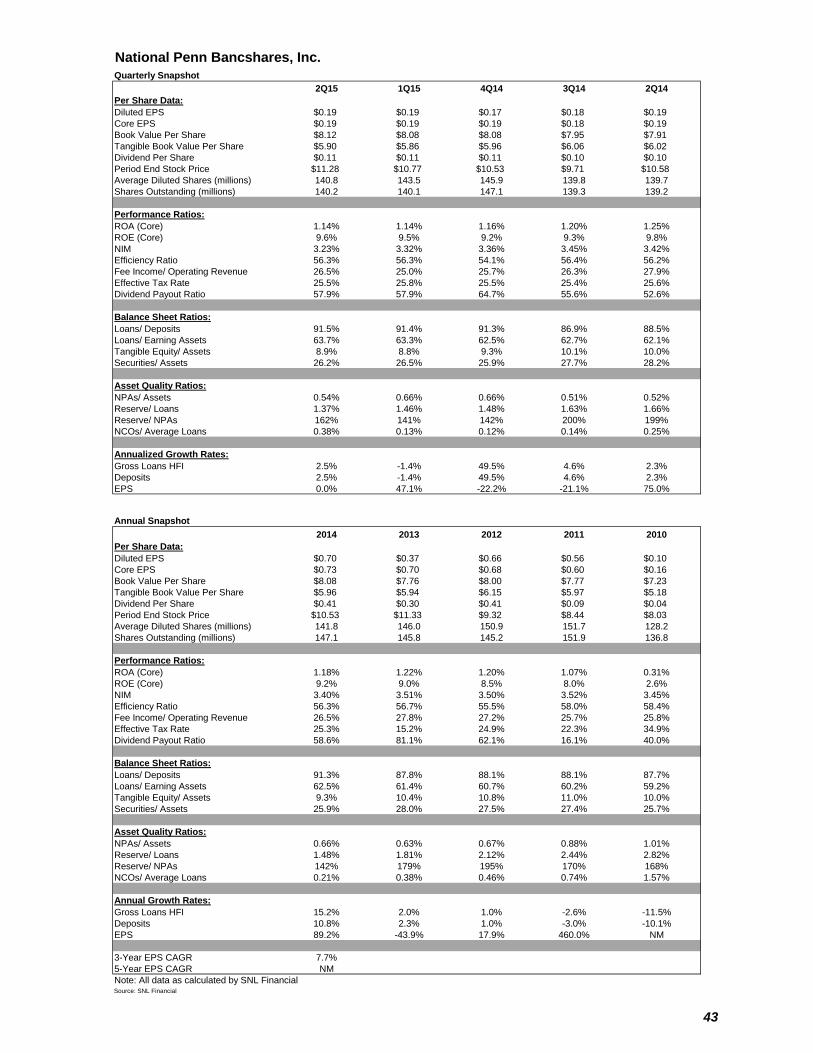
National Penn Bancshares, Inc. NPBC
Quarterly Snapshot 0.16
2Q15 1Q15 4Q14 3Q14 2Q14Per Share Data:Diluted EPS $0.19 $0.19 $0.17 $0.18 $0.19Core EPS $0.19 $0.19 $0.19 $0.18 $0.19Book Value Per Share $8.12 $8.08 $8.08 $7.95 $7.91Tangible Book Value Per Share $5.90 $5.86 $5.96 $6.06 $6.02Dividend Per Share $0.11 $0.11 $0.11 $0.10 $0.10Period End Stock Price $11.28 $10.77 $10.53 $9.71 $10.58Average Diluted Shares (millions) 140.8 143.5 145.9 139.8 139.7Shares Outstanding (millions) 140.2 140.1 147.1 139.3 139.2
Performance Ratios:ROA (Core) 1.14% 1.14% 1.16% 1.20% 1.25%ROE (Core) 9.6% 9.5% 9.2% 9.3% 9.8%NIM 3.23% 3.32% 3.36% 3.45% 3.42%Efficiency Ratio 56.3% 56.3% 54.1% 56.4% 56.2%Fee Income/ Operating Revenue 26.5% 25.0% 25.7% 26.3% 27.9%Effective Tax Rate 25.5% 25.8% 25.5% 25.4% 25.6%Dividend Payout Ratio 57.9% 57.9% 64.7% 55.6% 52.6%
Balance Sheet Ratios:Loans/ Deposits 91.5% 91.4% 91.3% 86.9% 88.5%Loans/ Earning Assets 63.7% 63.3% 62.5% 62.7% 62.1%Tangible Equity/ Assets 8.9% 8.8% 9.3% 10.1% 10.0%Securities/ Assets 26.2% 26.5% 25.9% 27.7% 28.2%
Asset Quality Ratios:NPAs/ Assets 0.54% 0.66% 0.66% 0.51% 0.52%Reserve/ Loans 1.37% 1.46% 1.48% 1.63% 1.66%Reserve/ NPAs 162% 141% 142% 200% 199%NCOs/ Average Loans 0.38% 0.13% 0.12% 0.14% 0.25%
Annualized Growth Rates:Gross Loans HFI 2.5% -1.4% 49.5% 4.6% 2.3%Deposits 2.5% -1.4% 49.5% 4.6% 2.3%EPS 0.0% 47.1% -22.2% -21.1% 75.0%
Annual Snapshot2014 2013 2012 2011 2010
Per Share Data:Diluted EPS $0.70 $0.37 $0.66 $0.56 $0.10Core EPS $0.73 $0.70 $0.68 $0.60 $0.16Book Value Per Share $8.08 $7.76 $8.00 $7.77 $7.23Tangible Book Value Per Share $5.96 $5.94 $6.15 $5.97 $5.18Dividend Per Share $0.41 $0.30 $0.41 $0.09 $0.04Period End Stock Price $10.53 $11.33 $9.32 $8.44 $8.03Average Diluted Shares (millions) 141.8 146.0 150.9 151.7 128.2Shares Outstanding (millions) 147.1 145.8 145.2 151.9 136.8
Performance Ratios:ROA (Core) 1.18% 1.22% 1.20% 1.07% 0.31%ROE (Core) 9.2% 9.0% 8.5% 8.0% 2.6%NIM 3.40% 3.51% 3.50% 3.52% 3.45%Efficiency Ratio 56.3% 56.7% 55.5% 58.0% 58.4%Fee Income/ Operating Revenue 26.5% 27.8% 27.2% 25.7% 25.8%Effective Tax Rate 25.3% 15.2% 24.9% 22.3% 34.9%Dividend Payout Ratio 58.6% 81.1% 62.1% 16.1% 40.0%
Balance Sheet Ratios:Loans/ Deposits 91.3% 87.8% 88.1% 88.1% 87.7%Loans/ Earning Assets 62.5% 61.4% 60.7% 60.2% 59.2%Tangible Equity/ Assets 9.3% 10.4% 10.8% 11.0% 10.0%Securities/ Assets 25.9% 28.0% 27.5% 27.4% 25.7%
Asset Quality Ratios:NPAs/ Assets 0.66% 0.63% 0.67% 0.88% 1.01%Reserve/ Loans 1.48% 1.81% 2.12% 2.44% 2.82%Reserve/ NPAs 142% 179% 195% 170% 168%NCOs/ Average Loans 0.21% 0.38% 0.46% 0.74% 1.57%
Annual Growth Rates:Gross Loans HFI 15.2% 2.0% 1.0% -2.6% -11.5%Deposits 10.8% 2.3% 1.0% -3.0% -10.1%EPS 89.2% -43.9% 17.9% 460.0% NM
3-Year EPS CAGR 7.7%5-Year EPS CAGR NMNote: All data as calculated by SNL FinancialSource: SNL Financial
43
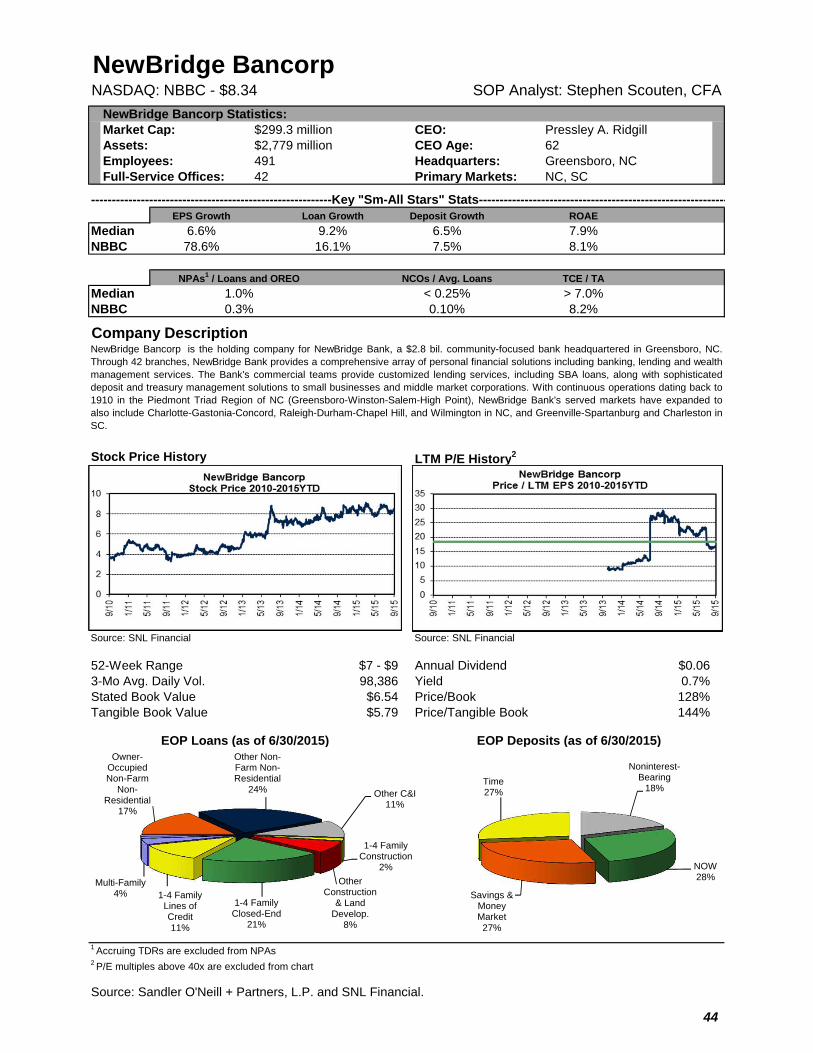
NewBridge BancorpNASDAQ: NBBC - $8.34 SOP Analyst: Stephen Scouten, CFA
NewBridge Bancorp Statistics:Market Cap: $299.3 million CEO: Pressley A. RidgillAssets: $2,779 million CEO Age: 62Employees: 491 Headquarters: Greensboro, NCFull-Service Offices: 42 Primary Markets: NC, SC
----------------------------------------------------------Key "Sm-All Stars" Stats------------------------------------------------------------EPS Growth Loan Growth Deposit Growth ROAE
Median 6.6% 9.2% 6.5% 7.9%NBBC 78.6% 16.1% 7.5% 8.1%
NCOs / Avg. Loans TCE / TA
Median < 0.25% > 7.0%NBBC 0.10% 8.2%
Company Description
Stock Price History LTM P/E History2
Source: SNL Financial Source: SNL Financial
52-Week Range $7 - $9 Annual Dividend $0.063-Mo Avg. Daily Vol. 98,386 Yield 0.7%Stated Book Value $6.54 Price/Book 128%Tangible Book Value $5.79 Price/Tangible Book 144%
EOP Loans (as of 6/30/2015) EOP Deposits (as of 6/30/2015)
1 Accruing TDRs are excluded from NPAs2 P/E multiples above 40x are excluded from chart
Source: Sandler O'Neill + Partners, L.P. and SNL Financial.
NewBridge Bancorp is the holding company for NewBridge Bank, a $2.8 bil. community-focused bank headquartered in Greensboro, NC.Through 42 branches, NewBridge Bank provides a comprehensive array of personal financial solutions including banking, lending and wealthmanagement services. The Bank's commercial teams provide customized lending services, including SBA loans, along with sophisticateddeposit and treasury management solutions to small businesses and middle market corporations. With continuous operations dating back to1910 in the Piedmont Triad Region of NC (Greensboro-Winston-Salem-High Point), NewBridge Bank's served markets have expanded toalso include Charlotte-Gastonia-Concord, Raleigh-Durham-Chapel Hill, and Wilmington in NC, and Greenville-Spartanburg and Charleston inSC.
NPAs1 / Loans and OREO
1.0%0.3%
Owner-Occupied Non-Farm
Non-Residential
17%
Other Non-Farm Non-Residential
24% Other C&I11%
1-4 Family Construction
2%
Other Construction
& Land Develop.
8%
1-4 Family Closed-End
21%
1-4 Family Lines of Credit11%
Multi-Family4%
Noninterest-Bearing
18%
NOW28%
Savings & Money Market27%
Time27%
44
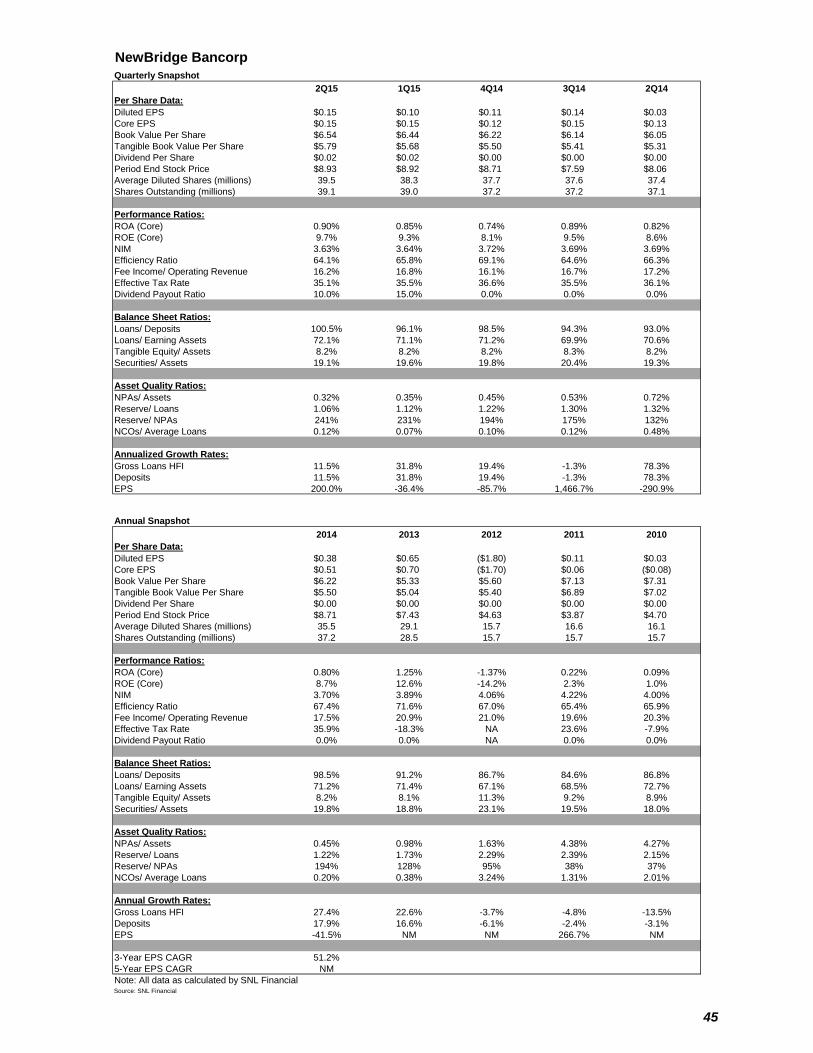
NewBridge Bancorp NBBC
Quarterly Snapshot 0.11
2Q15 1Q15 4Q14 3Q14 2Q14Per Share Data:Diluted EPS $0.15 $0.10 $0.11 $0.14 $0.03Core EPS $0.15 $0.15 $0.12 $0.15 $0.13Book Value Per Share $6.54 $6.44 $6.22 $6.14 $6.05Tangible Book Value Per Share $5.79 $5.68 $5.50 $5.41 $5.31Dividend Per Share $0.02 $0.02 $0.00 $0.00 $0.00Period End Stock Price $8.93 $8.92 $8.71 $7.59 $8.06Average Diluted Shares (millions) 39.5 38.3 37.7 37.6 37.4Shares Outstanding (millions) 39.1 39.0 37.2 37.2 37.1
Performance Ratios:ROA (Core) 0.90% 0.85% 0.74% 0.89% 0.82%ROE (Core) 9.7% 9.3% 8.1% 9.5% 8.6%NIM 3.63% 3.64% 3.72% 3.69% 3.69%Efficiency Ratio 64.1% 65.8% 69.1% 64.6% 66.3%Fee Income/ Operating Revenue 16.2% 16.8% 16.1% 16.7% 17.2%Effective Tax Rate 35.1% 35.5% 36.6% 35.5% 36.1%Dividend Payout Ratio 10.0% 15.0% 0.0% 0.0% 0.0%
Balance Sheet Ratios:Loans/ Deposits 100.5% 96.1% 98.5% 94.3% 93.0%Loans/ Earning Assets 72.1% 71.1% 71.2% 69.9% 70.6%Tangible Equity/ Assets 8.2% 8.2% 8.2% 8.3% 8.2%Securities/ Assets 19.1% 19.6% 19.8% 20.4% 19.3%
Asset Quality Ratios:NPAs/ Assets 0.32% 0.35% 0.45% 0.53% 0.72%Reserve/ Loans 1.06% 1.12% 1.22% 1.30% 1.32%Reserve/ NPAs 241% 231% 194% 175% 132%NCOs/ Average Loans 0.12% 0.07% 0.10% 0.12% 0.48%
Annualized Growth Rates:Gross Loans HFI 11.5% 31.8% 19.4% -1.3% 78.3%Deposits 11.5% 31.8% 19.4% -1.3% 78.3%EPS 200.0% -36.4% -85.7% 1,466.7% -290.9%
Annual Snapshot2014 2013 2012 2011 2010
Per Share Data:Diluted EPS $0.38 $0.65 ($1.80) $0.11 $0.03Core EPS $0.51 $0.70 ($1.70) $0.06 ($0.08)Book Value Per Share $6.22 $5.33 $5.60 $7.13 $7.31Tangible Book Value Per Share $5.50 $5.04 $5.40 $6.89 $7.02Dividend Per Share $0.00 $0.00 $0.00 $0.00 $0.00Period End Stock Price $8.71 $7.43 $4.63 $3.87 $4.70Average Diluted Shares (millions) 35.5 29.1 15.7 16.6 16.1Shares Outstanding (millions) 37.2 28.5 15.7 15.7 15.7
Performance Ratios:ROA (Core) 0.80% 1.25% -1.37% 0.22% 0.09%ROE (Core) 8.7% 12.6% -14.2% 2.3% 1.0%NIM 3.70% 3.89% 4.06% 4.22% 4.00%Efficiency Ratio 67.4% 71.6% 67.0% 65.4% 65.9%Fee Income/ Operating Revenue 17.5% 20.9% 21.0% 19.6% 20.3%Effective Tax Rate 35.9% -18.3% NA 23.6% -7.9%Dividend Payout Ratio 0.0% 0.0% NA 0.0% 0.0%
Balance Sheet Ratios:Loans/ Deposits 98.5% 91.2% 86.7% 84.6% 86.8%Loans/ Earning Assets 71.2% 71.4% 67.1% 68.5% 72.7%Tangible Equity/ Assets 8.2% 8.1% 11.3% 9.2% 8.9%Securities/ Assets 19.8% 18.8% 23.1% 19.5% 18.0%
Asset Quality Ratios:NPAs/ Assets 0.45% 0.98% 1.63% 4.38% 4.27%Reserve/ Loans 1.22% 1.73% 2.29% 2.39% 2.15%Reserve/ NPAs 194% 128% 95% 38% 37%NCOs/ Average Loans 0.20% 0.38% 3.24% 1.31% 2.01%
Annual Growth Rates:Gross Loans HFI 27.4% 22.6% -3.7% -4.8% -13.5%Deposits 17.9% 16.6% -6.1% -2.4% -3.1%EPS -41.5% NM NM 266.7% NM
3-Year EPS CAGR 51.2%5-Year EPS CAGR NMNote: All data as calculated by SNL FinancialSource: SNL Financial
45
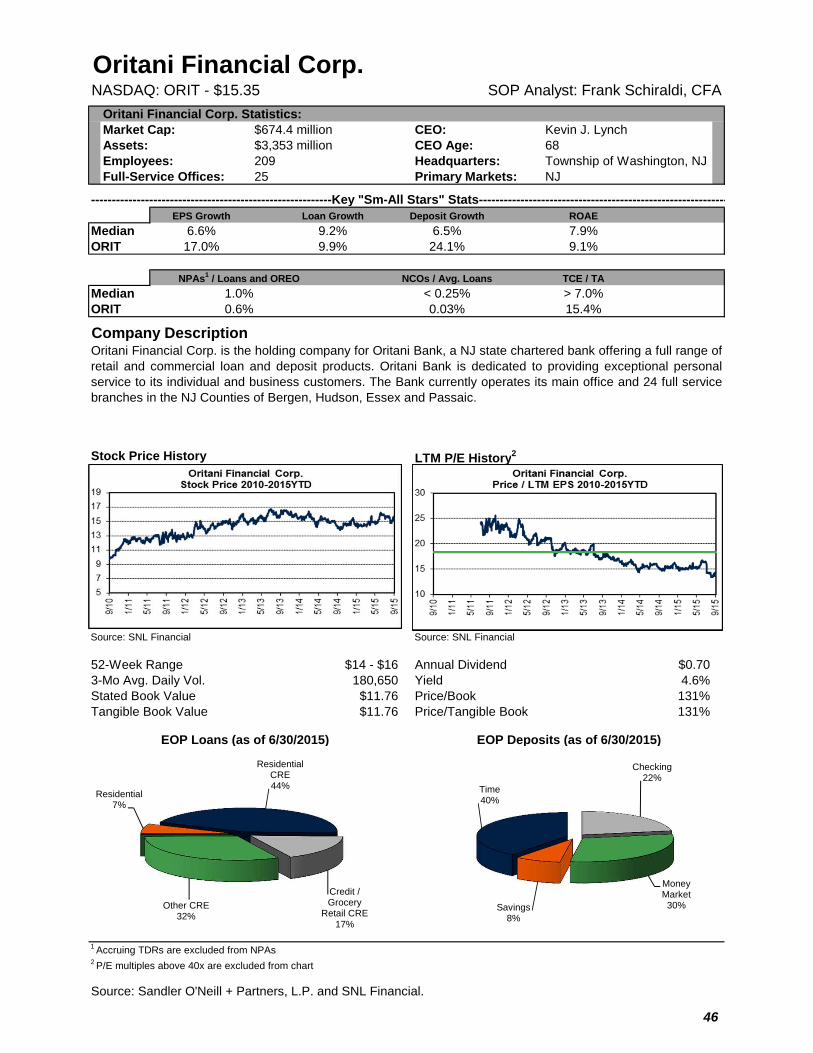
Oritani Financial Corp.NASDAQ: ORIT - $15.35 SOP Analyst: Frank Schiraldi, CFA
Oritani Financial Corp. Statistics:Market Cap: $674.4 million CEO: Kevin J. LynchAssets: $3,353 million CEO Age: 68Employees: 209 Headquarters: Township of Washington, NJFull-Service Offices: 25 Primary Markets: NJ
----------------------------------------------------------Key "Sm-All Stars" Stats------------------------------------------------------------EPS Growth Loan Growth Deposit Growth ROAE
Median 6.6% 9.2% 6.5% 7.9%ORIT 17.0% 9.9% 24.1% 9.1%
NCOs / Avg. Loans TCE / TA
Median < 0.25% > 7.0%ORIT 0.03% 15.4%
Company Description
Stock Price History LTM P/E History2
Source: SNL Financial Source: SNL Financial
52-Week Range $14 - $16 Annual Dividend $0.703-Mo Avg. Daily Vol. 180,650 Yield 4.6%Stated Book Value $11.76 Price/Book 131%Tangible Book Value $11.76 Price/Tangible Book 131%
EOP Loans (as of 6/30/2015) EOP Deposits (as of 6/30/2015)
1 Accruing TDRs are excluded from NPAs2 P/E multiples above 40x are excluded from chart
Source: Sandler O'Neill + Partners, L.P. and SNL Financial.
Oritani Financial Corp. is the holding company for Oritani Bank, a NJ state chartered bank offering a full range ofretail and commercial loan and deposit products. Oritani Bank is dedicated to providing exceptional personalservice to its individual and business customers. The Bank currently operates its main office and 24 full servicebranches in the NJ Counties of Bergen, Hudson, Essex and Passaic.
NPAs1 / Loans and OREO
1.0%0.6%
Residential7%
Residential CRE44%
Credit / Grocery
Retail CRE17%
Other CRE32%
Checking22%
Money Market30%Savings
8%
Time40%
46
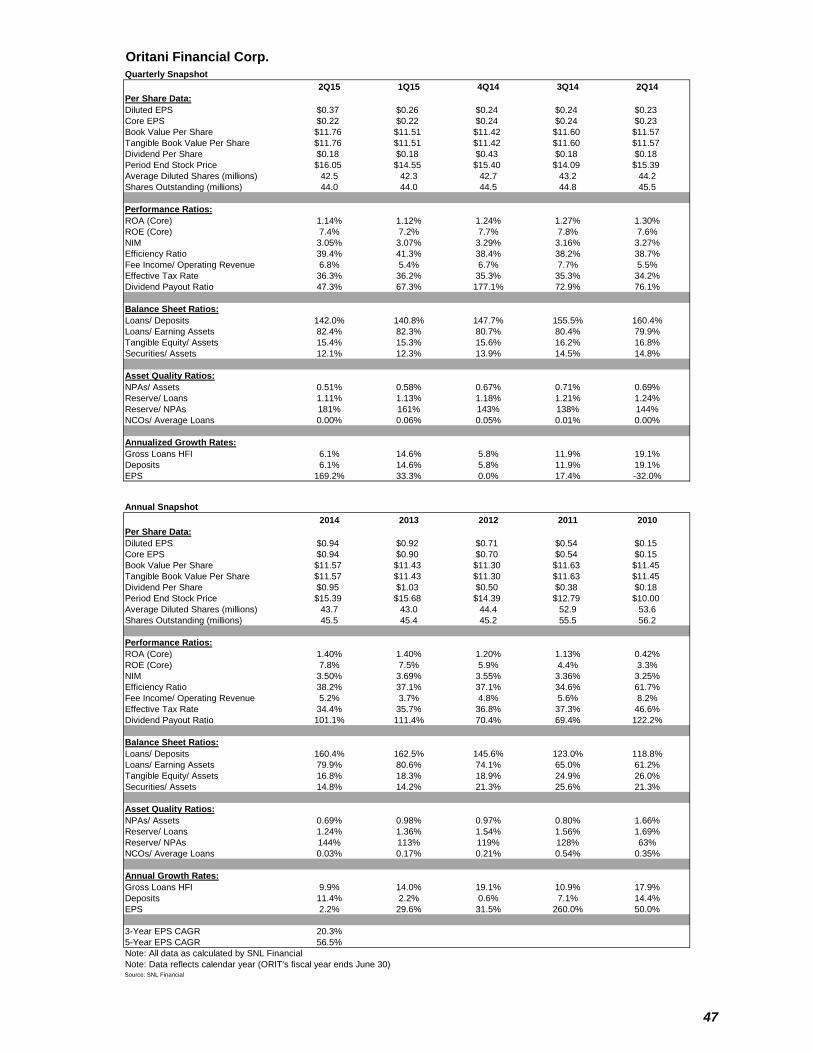
Oritani Financial Corp. ORIT
Quarterly Snapshot 0.25
2Q15 1Q15 4Q14 3Q14 2Q14Per Share Data:Diluted EPS $0.37 $0.26 $0.24 $0.24 $0.23Core EPS $0.22 $0.22 $0.24 $0.24 $0.23Book Value Per Share $11.76 $11.51 $11.42 $11.60 $11.57Tangible Book Value Per Share $11.76 $11.51 $11.42 $11.60 $11.57Dividend Per Share $0.18 $0.18 $0.43 $0.18 $0.18Period End Stock Price $16.05 $14.55 $15.40 $14.09 $15.39Average Diluted Shares (millions) 42.5 42.3 42.7 43.2 44.2Shares Outstanding (millions) 44.0 44.0 44.5 44.8 45.5
Performance Ratios:ROA (Core) 1.14% 1.12% 1.24% 1.27% 1.30%ROE (Core) 7.4% 7.2% 7.7% 7.8% 7.6%NIM 3.05% 3.07% 3.29% 3.16% 3.27%Efficiency Ratio 39.4% 41.3% 38.4% 38.2% 38.7%Fee Income/ Operating Revenue 6.8% 5.4% 6.7% 7.7% 5.5%Effective Tax Rate 36.3% 36.2% 35.3% 35.3% 34.2%Dividend Payout Ratio 47.3% 67.3% 177.1% 72.9% 76.1%
Balance Sheet Ratios:Loans/ Deposits 142.0% 140.8% 147.7% 155.5% 160.4%Loans/ Earning Assets 82.4% 82.3% 80.7% 80.4% 79.9%Tangible Equity/ Assets 15.4% 15.3% 15.6% 16.2% 16.8%Securities/ Assets 12.1% 12.3% 13.9% 14.5% 14.8%
Asset Quality Ratios:NPAs/ Assets 0.51% 0.58% 0.67% 0.71% 0.69%Reserve/ Loans 1.11% 1.13% 1.18% 1.21% 1.24%Reserve/ NPAs 181% 161% 143% 138% 144%NCOs/ Average Loans 0.00% 0.06% 0.05% 0.01% 0.00%
Annualized Growth Rates:Gross Loans HFI 6.1% 14.6% 5.8% 11.9% 19.1%Deposits 6.1% 14.6% 5.8% 11.9% 19.1%EPS 169.2% 33.3% 0.0% 17.4% -32.0%
Annual Snapshot2014 2013 2012 2011 2010
Per Share Data:Diluted EPS $0.94 $0.92 $0.71 $0.54 $0.15Core EPS $0.94 $0.90 $0.70 $0.54 $0.15Book Value Per Share $11.57 $11.43 $11.30 $11.63 $11.45Tangible Book Value Per Share $11.57 $11.43 $11.30 $11.63 $11.45Dividend Per Share $0.95 $1.03 $0.50 $0.38 $0.18Period End Stock Price $15.39 $15.68 $14.39 $12.79 $10.00Average Diluted Shares (millions) 43.7 43.0 44.4 52.9 53.6Shares Outstanding (millions) 45.5 45.4 45.2 55.5 56.2
Performance Ratios:ROA (Core) 1.40% 1.40% 1.20% 1.13% 0.42%ROE (Core) 7.8% 7.5% 5.9% 4.4% 3.3%NIM 3.50% 3.69% 3.55% 3.36% 3.25%Efficiency Ratio 38.2% 37.1% 37.1% 34.6% 61.7%Fee Income/ Operating Revenue 5.2% 3.7% 4.8% 5.6% 8.2%Effective Tax Rate 34.4% 35.7% 36.8% 37.3% 46.6%Dividend Payout Ratio 101.1% 111.4% 70.4% 69.4% 122.2%
Balance Sheet Ratios:Loans/ Deposits 160.4% 162.5% 145.6% 123.0% 118.8%Loans/ Earning Assets 79.9% 80.6% 74.1% 65.0% 61.2%Tangible Equity/ Assets 16.8% 18.3% 18.9% 24.9% 26.0%Securities/ Assets 14.8% 14.2% 21.3% 25.6% 21.3%
Asset Quality Ratios:NPAs/ Assets 0.69% 0.98% 0.97% 0.80% 1.66%Reserve/ Loans 1.24% 1.36% 1.54% 1.56% 1.69%Reserve/ NPAs 144% 113% 119% 128% 63%NCOs/ Average Loans 0.03% 0.17% 0.21% 0.54% 0.35%
Annual Growth Rates:Gross Loans HFI 9.9% 14.0% 19.1% 10.9% 17.9%Deposits 11.4% 2.2% 0.6% 7.1% 14.4%EPS 2.2% 29.6% 31.5% 260.0% 50.0%
3-Year EPS CAGR 20.3%5-Year EPS CAGR 56.5%Note: All data as calculated by SNL FinancialNote: Data reflects calendar year (ORIT's fiscal year ends June 30)Source: SNL Financial
47
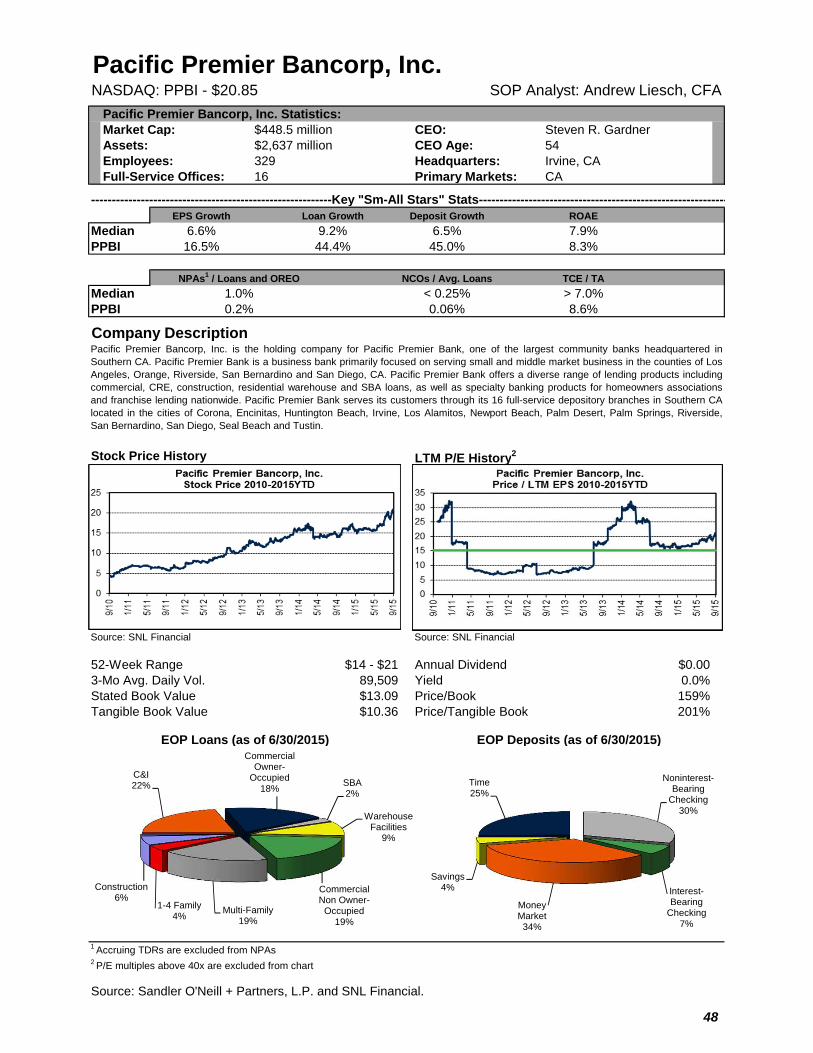
Pacific Premier Bancorp, Inc.NASDAQ: PPBI - $20.85 SOP Analyst: Andrew Liesch, CFA
Pacific Premier Bancorp, Inc. Statistics:Market Cap: $448.5 million CEO: Steven R. GardnerAssets: $2,637 million CEO Age: 54Employees: 329 Headquarters: Irvine, CAFull-Service Offices: 16 Primary Markets: CA
----------------------------------------------------------Key "Sm-All Stars" Stats------------------------------------------------------------EPS Growth Loan Growth Deposit Growth ROAE
Median 6.6% 9.2% 6.5% 7.9%PPBI 16.5% 44.4% 45.0% 8.3%
NCOs / Avg. Loans TCE / TA
Median < 0.25% > 7.0%PPBI 0.06% 8.6%
Company Description
Stock Price History LTM P/E History2
Source: SNL Financial Source: SNL Financial
52-Week Range $14 - $21 Annual Dividend $0.003-Mo Avg. Daily Vol. 89,509 Yield 0.0%Stated Book Value $13.09 Price/Book 159%Tangible Book Value $10.36 Price/Tangible Book 201%
EOP Loans (as of 6/30/2015) EOP Deposits (as of 6/30/2015)
1 Accruing TDRs are excluded from NPAs2 P/E multiples above 40x are excluded from chart
Source: Sandler O'Neill + Partners, L.P. and SNL Financial.
Pacific Premier Bancorp, Inc. is the holding company for Pacific Premier Bank, one of the largest community banks headquartered inSouthern CA. Pacific Premier Bank is a business bank primarily focused on serving small and middle market business in the counties of LosAngeles, Orange, Riverside, San Bernardino and San Diego, CA. Pacific Premier Bank offers a diverse range of lending products includingcommercial, CRE, construction, residential warehouse and SBA loans, as well as specialty banking products for homeowners associationsand franchise lending nationwide. Pacific Premier Bank serves its customers through its 16 full-service depository branches in Southern CAlocated in the cities of Corona, Encinitas, Huntington Beach, Irvine, Los Alamitos, Newport Beach, Palm Desert, Palm Springs, Riverside,San Bernardino, San Diego, Seal Beach and Tustin.
NPAs1 / Loans and OREO
1.0%0.2%
C&I22%
Commercial Owner-
Occupied18%
SBA2%
Warehouse Facilities
9%
Commercial Non Owner-
Occupied19%
Multi-Family19%
1-4 Family4%
Construction6%
Noninterest-Bearing
Checking30%
Interest-Bearing
Checking7%
Money Market34%
Savings4%
Time25%
48
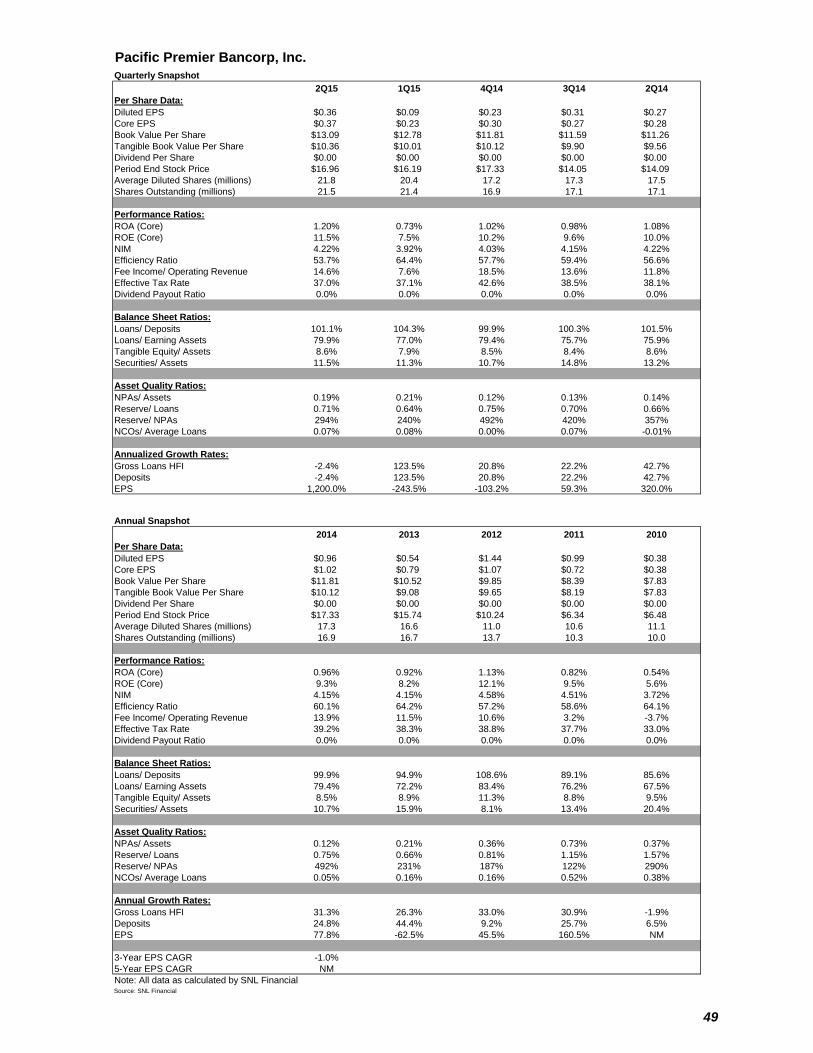
Pacific Premier Bancorp, Inc. PPBI
Quarterly Snapshot 0.15
2Q15 1Q15 4Q14 3Q14 2Q14Per Share Data:Diluted EPS $0.36 $0.09 $0.23 $0.31 $0.27Core EPS $0.37 $0.23 $0.30 $0.27 $0.28Book Value Per Share $13.09 $12.78 $11.81 $11.59 $11.26Tangible Book Value Per Share $10.36 $10.01 $10.12 $9.90 $9.56Dividend Per Share $0.00 $0.00 $0.00 $0.00 $0.00Period End Stock Price $16.96 $16.19 $17.33 $14.05 $14.09Average Diluted Shares (millions) 21.8 20.4 17.2 17.3 17.5Shares Outstanding (millions) 21.5 21.4 16.9 17.1 17.1
Performance Ratios:ROA (Core) 1.20% 0.73% 1.02% 0.98% 1.08%ROE (Core) 11.5% 7.5% 10.2% 9.6% 10.0%NIM 4.22% 3.92% 4.03% 4.15% 4.22%Efficiency Ratio 53.7% 64.4% 57.7% 59.4% 56.6%Fee Income/ Operating Revenue 14.6% 7.6% 18.5% 13.6% 11.8%Effective Tax Rate 37.0% 37.1% 42.6% 38.5% 38.1%Dividend Payout Ratio 0.0% 0.0% 0.0% 0.0% 0.0%
Balance Sheet Ratios:Loans/ Deposits 101.1% 104.3% 99.9% 100.3% 101.5%Loans/ Earning Assets 79.9% 77.0% 79.4% 75.7% 75.9%Tangible Equity/ Assets 8.6% 7.9% 8.5% 8.4% 8.6%Securities/ Assets 11.5% 11.3% 10.7% 14.8% 13.2%
Asset Quality Ratios:NPAs/ Assets 0.19% 0.21% 0.12% 0.13% 0.14%Reserve/ Loans 0.71% 0.64% 0.75% 0.70% 0.66%Reserve/ NPAs 294% 240% 492% 420% 357%NCOs/ Average Loans 0.07% 0.08% 0.00% 0.07% -0.01%
Annualized Growth Rates:Gross Loans HFI -2.4% 123.5% 20.8% 22.2% 42.7%Deposits -2.4% 123.5% 20.8% 22.2% 42.7%EPS 1,200.0% -243.5% -103.2% 59.3% 320.0%
Annual Snapshot2014 2013 2012 2011 2010
Per Share Data:Diluted EPS $0.96 $0.54 $1.44 $0.99 $0.38Core EPS $1.02 $0.79 $1.07 $0.72 $0.38Book Value Per Share $11.81 $10.52 $9.85 $8.39 $7.83Tangible Book Value Per Share $10.12 $9.08 $9.65 $8.19 $7.83Dividend Per Share $0.00 $0.00 $0.00 $0.00 $0.00Period End Stock Price $17.33 $15.74 $10.24 $6.34 $6.48Average Diluted Shares (millions) 17.3 16.6 11.0 10.6 11.1Shares Outstanding (millions) 16.9 16.7 13.7 10.3 10.0
Performance Ratios:ROA (Core) 0.96% 0.92% 1.13% 0.82% 0.54%ROE (Core) 9.3% 8.2% 12.1% 9.5% 5.6%NIM 4.15% 4.15% 4.58% 4.51% 3.72%Efficiency Ratio 60.1% 64.2% 57.2% 58.6% 64.1%Fee Income/ Operating Revenue 13.9% 11.5% 10.6% 3.2% -3.7%Effective Tax Rate 39.2% 38.3% 38.8% 37.7% 33.0%Dividend Payout Ratio 0.0% 0.0% 0.0% 0.0% 0.0%
Balance Sheet Ratios:Loans/ Deposits 99.9% 94.9% 108.6% 89.1% 85.6%Loans/ Earning Assets 79.4% 72.2% 83.4% 76.2% 67.5%Tangible Equity/ Assets 8.5% 8.9% 11.3% 8.8% 9.5%Securities/ Assets 10.7% 15.9% 8.1% 13.4% 20.4%
Asset Quality Ratios:NPAs/ Assets 0.12% 0.21% 0.36% 0.73% 0.37%Reserve/ Loans 0.75% 0.66% 0.81% 1.15% 1.57%Reserve/ NPAs 492% 231% 187% 122% 290%NCOs/ Average Loans 0.05% 0.16% 0.16% 0.52% 0.38%
Annual Growth Rates:Gross Loans HFI 31.3% 26.3% 33.0% 30.9% -1.9%Deposits 24.8% 44.4% 9.2% 25.7% 6.5%EPS 77.8% -62.5% 45.5% 160.5% NM
3-Year EPS CAGR -1.0%5-Year EPS CAGR NMNote: All data as calculated by SNL FinancialSource: SNL Financial
49
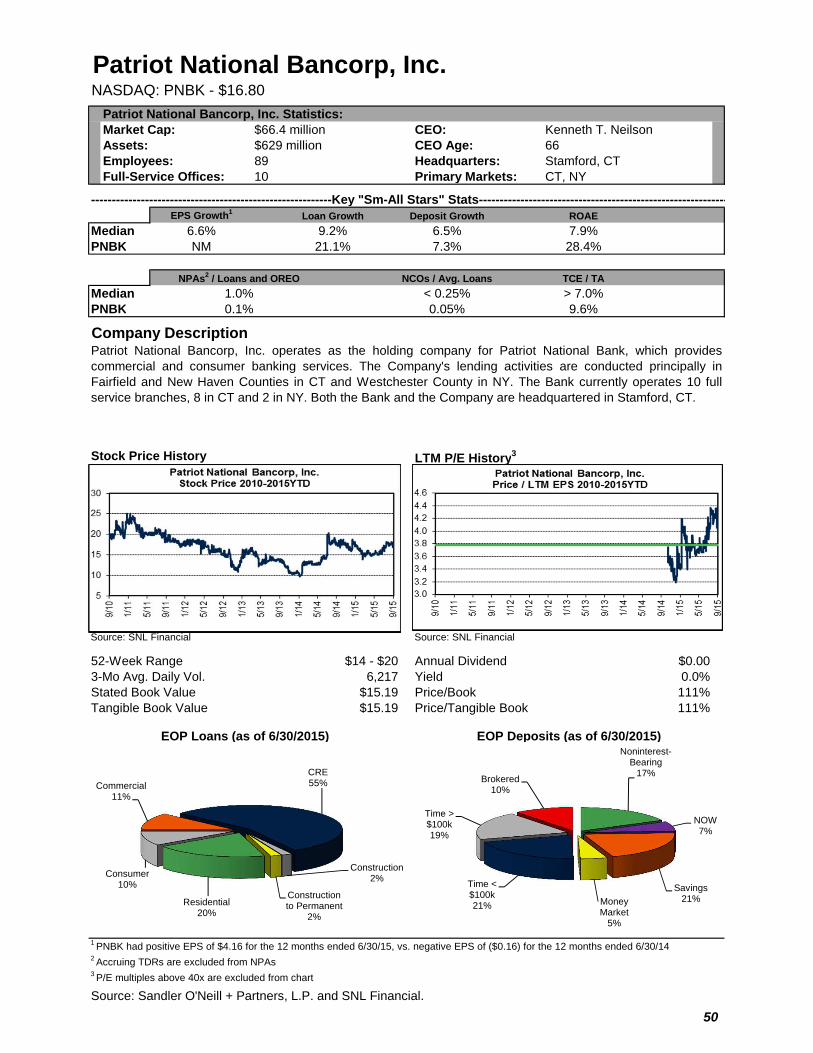
Patriot National Bancorp, Inc.NASDAQ: PNBK - $16.80
Patriot National Bancorp, Inc. Statistics:Market Cap: $66.4 million CEO: Kenneth T. NeilsonAssets: $629 million CEO Age: 66Employees: 89 Headquarters: Stamford, CTFull-Service Offices: 10 Primary Markets: CT, NY
----------------------------------------------------------Key "Sm-All Stars" Stats------------------------------------------------------------EPS Growth1 Loan Growth Deposit Growth ROAE
Median 6.6% 9.2% 6.5% 7.9%PNBK NM 21.1% 7.3% 28.4%
NCOs / Avg. Loans TCE / TA
Median < 0.25% > 7.0%PNBK 0.05% 9.6%
Company Description
Stock Price History LTM P/E History3
Source: SNL Financial Source: SNL Financial
52-Week Range $14 - $20 Annual Dividend $0.003-Mo Avg. Daily Vol. 6,217 Yield 0.0%Stated Book Value $15.19 Price/Book 111%Tangible Book Value $15.19 Price/Tangible Book 111%
EOP Loans (as of 6/30/2015) EOP Deposits (as of 6/30/2015)
1 PNBK had positive EPS of $4.16 for the 12 months ended 6/30/15, vs. negative EPS of ($0.16) for the 12 months ended 6/30/142 Accruing TDRs are excluded from NPAs3 P/E multiples above 40x are excluded from chart
Source: Sandler O'Neill + Partners, L.P. and SNL Financial.
Patriot National Bancorp, Inc. operates as the holding company for Patriot National Bank, which providescommercial and consumer banking services. The Company's lending activities are conducted principally inFairfield and New Haven Counties in CT and Westchester County in NY. The Bank currently operates 10 fullservice branches, 8 in CT and 2 in NY. Both the Bank and the Company are headquartered in Stamford, CT.
NPAs2 / Loans and OREO
1.0%0.1%
Commercial11%
CRE55%
Construction2%
Construction to Permanent
2%
Residential20%
Consumer10%
Noninterest-Bearing
17%
NOW7%
Savings21%Money
Market5%
Time < $100k21%
Time > $100k19%
Brokered 10%
50
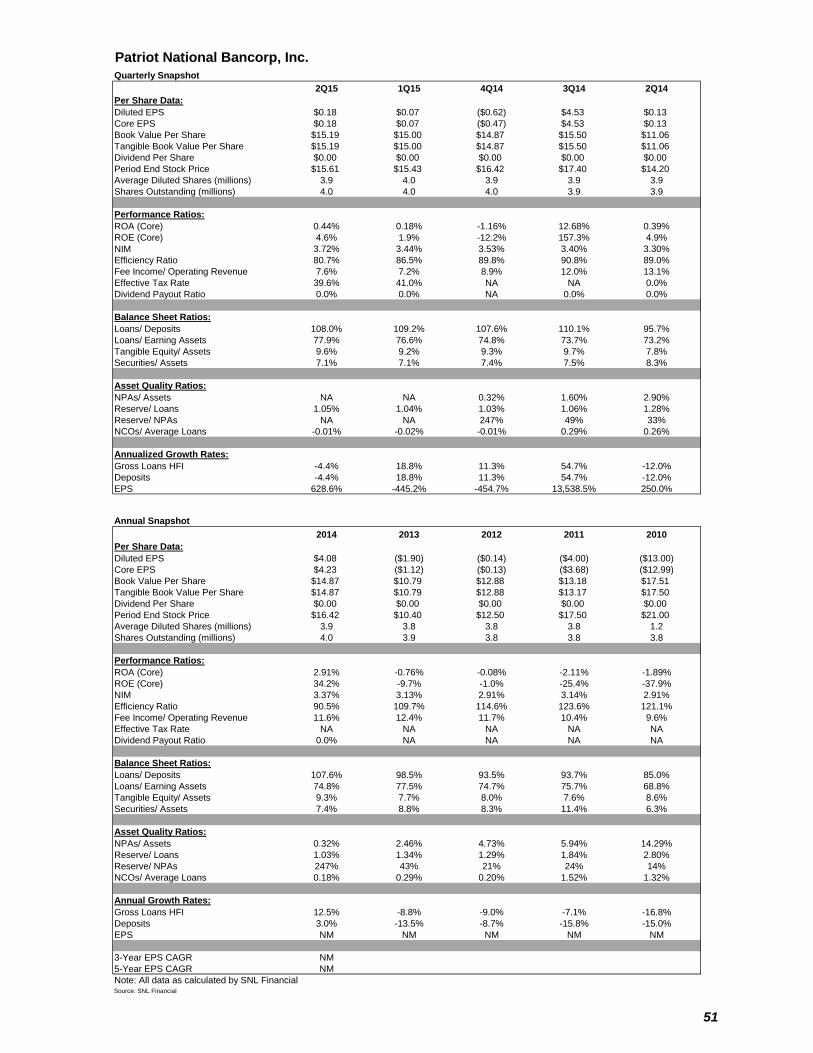
Patriot National Bancorp, Inc. PNBK
Quarterly Snapshot 0.08
2Q15 1Q15 4Q14 3Q14 2Q14Per Share Data:Diluted EPS $0.18 $0.07 ($0.62) $4.53 $0.13Core EPS $0.18 $0.07 ($0.47) $4.53 $0.13Book Value Per Share $15.19 $15.00 $14.87 $15.50 $11.06Tangible Book Value Per Share $15.19 $15.00 $14.87 $15.50 $11.06Dividend Per Share $0.00 $0.00 $0.00 $0.00 $0.00Period End Stock Price $15.61 $15.43 $16.42 $17.40 $14.20Average Diluted Shares (millions) 3.9 4.0 3.9 3.9 3.9Shares Outstanding (millions) 4.0 4.0 4.0 3.9 3.9
Performance Ratios:ROA (Core) 0.44% 0.18% -1.16% 12.68% 0.39%ROE (Core) 4.6% 1.9% -12.2% 157.3% 4.9%NIM 3.72% 3.44% 3.53% 3.40% 3.30%Efficiency Ratio 80.7% 86.5% 89.8% 90.8% 89.0%Fee Income/ Operating Revenue 7.6% 7.2% 8.9% 12.0% 13.1%Effective Tax Rate 39.6% 41.0% NA NA 0.0%Dividend Payout Ratio 0.0% 0.0% NA 0.0% 0.0%
Balance Sheet Ratios:Loans/ Deposits 108.0% 109.2% 107.6% 110.1% 95.7%Loans/ Earning Assets 77.9% 76.6% 74.8% 73.7% 73.2%Tangible Equity/ Assets 9.6% 9.2% 9.3% 9.7% 7.8%Securities/ Assets 7.1% 7.1% 7.4% 7.5% 8.3%
Asset Quality Ratios:NPAs/ Assets NA NA 0.32% 1.60% 2.90%Reserve/ Loans 1.05% 1.04% 1.03% 1.06% 1.28%Reserve/ NPAs NA NA 247% 49% 33%NCOs/ Average Loans -0.01% -0.02% -0.01% 0.29% 0.26%
Annualized Growth Rates:Gross Loans HFI -4.4% 18.8% 11.3% 54.7% -12.0%Deposits -4.4% 18.8% 11.3% 54.7% -12.0%EPS 628.6% -445.2% -454.7% 13,538.5% 250.0%
Annual Snapshot2014 2013 2012 2011 2010
Per Share Data:Diluted EPS $4.08 ($1.90) ($0.14) ($4.00) ($13.00)Core EPS $4.23 ($1.12) ($0.13) ($3.68) ($12.99)Book Value Per Share $14.87 $10.79 $12.88 $13.18 $17.51Tangible Book Value Per Share $14.87 $10.79 $12.88 $13.17 $17.50Dividend Per Share $0.00 $0.00 $0.00 $0.00 $0.00Period End Stock Price $16.42 $10.40 $12.50 $17.50 $21.00Average Diluted Shares (millions) 3.9 3.8 3.8 3.8 1.2Shares Outstanding (millions) 4.0 3.9 3.8 3.8 3.8
Performance Ratios:ROA (Core) 2.91% -0.76% -0.08% -2.11% -1.89%ROE (Core) 34.2% -9.7% -1.0% -25.4% -37.9%NIM 3.37% 3.13% 2.91% 3.14% 2.91%Efficiency Ratio 90.5% 109.7% 114.6% 123.6% 121.1%Fee Income/ Operating Revenue 11.6% 12.4% 11.7% 10.4% 9.6%Effective Tax Rate NA NA NA NA NADividend Payout Ratio 0.0% NA NA NA NA
Balance Sheet Ratios:Loans/ Deposits 107.6% 98.5% 93.5% 93.7% 85.0%Loans/ Earning Assets 74.8% 77.5% 74.7% 75.7% 68.8%Tangible Equity/ Assets 9.3% 7.7% 8.0% 7.6% 8.6%Securities/ Assets 7.4% 8.8% 8.3% 11.4% 6.3%
Asset Quality Ratios:NPAs/ Assets 0.32% 2.46% 4.73% 5.94% 14.29%Reserve/ Loans 1.03% 1.34% 1.29% 1.84% 2.80%Reserve/ NPAs 247% 43% 21% 24% 14%NCOs/ Average Loans 0.18% 0.29% 0.20% 1.52% 1.32%
Annual Growth Rates:Gross Loans HFI 12.5% -8.8% -9.0% -7.1% -16.8%Deposits 3.0% -13.5% -8.7% -15.8% -15.0%EPS NM NM NM NM NM
3-Year EPS CAGR NM5-Year EPS CAGR NMNote: All data as calculated by SNL FinancialSource: SNL Financial
51

Peapack-Gladstone Financial CorporationNASDAQ: PGC - $21.09 SOP Analyst: Anna Barnard
Peapack-Gladstone Financial Corporation Statistics:Market Cap: $328.8 million CEO: Douglas L. KennedyAssets: $3,118 million CEO Age: 58Employees: 327 Headquarters: Bedminster, NJFull-Service Offices: 23 Primary Markets: NJ
----------------------------------------------------------Key "Sm-All Stars" Stats------------------------------------------------------------EPS Growth Loan Growth Deposit Growth ROAE
Median 6.6% 9.2% 6.5% 7.9%PGC 24.8% 46.2% 25.9% 8.2%
NCOs / Avg. Loans TCE / TA
Median < 0.25% > 7.0%PGC 0.01% 8.2%
Company Description
Stock Price History LTM P/E History2
Source: SNL Financial Source: SNL Financial
52-Week Range $17 - $23 Annual Dividend $0.203-Mo Avg. Daily Vol. 34,503 Yield 0.9%Stated Book Value $16.54 Price/Book 128%Tangible Book Value $16.32 Price/Tangible Book 129%
EOP Loans (as of 6/30/2015) EOP Deposits (as of 6/30/2015)
1 Accruing TDRs are excluded from NPAs2 P/E multiples above 40x are excluded from chart
Source: Sandler O'Neill + Partners, L.P. and SNL Financial.
Peapack-Gladstone Financial Corporation is a NJ bank holding company with total assets of $3.1 bil. Founded in1921, Peapack-Gladstone Bank is a commercial bank that provides innovative private banking services tobusinesses, non-profits and consumers, which help them to establish, maintain and expand their legacy.Through its private banking locations in Bedminster, Morristown, Princeton and Teaneck, its wealth managementdivision, and its branch network and online platforms, Peapack-Gladstone Bank offers an unparalleledcommitment to client service.
NPAs1 / Loans and OREO
1.0%0.3%
Residential Mortgage
17%
Multi-Family50%
CRE14%
Commercial16%
Home Equity Lines of Credit
2%
Noninterest-Bearing Demand
14% Interest-Bearing
Checking25%
Savings5%
Money Market27%
CDs - Retail14%
Interest-Bearing
Demand -Brokered
11%
CDs -Brokered
4%
52
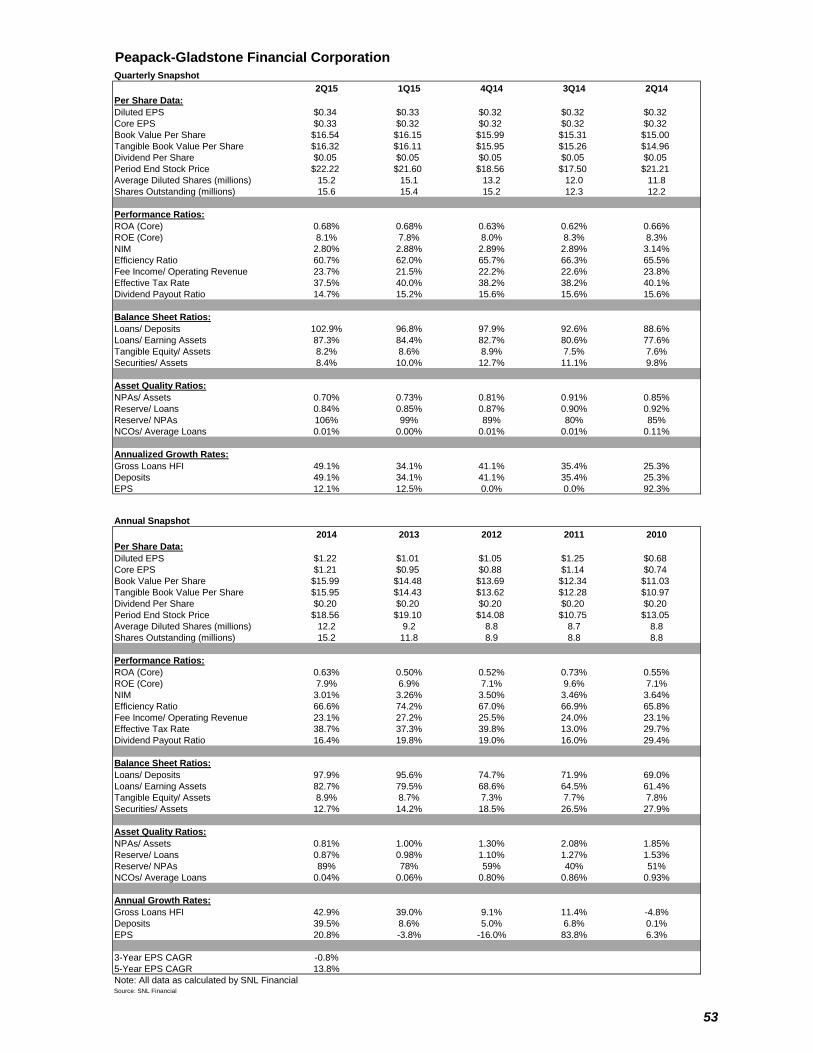
Peapack-Gladstone Financial Corporation PGC
Quarterly Snapshot 0.26
2Q15 1Q15 4Q14 3Q14 2Q14Per Share Data:Diluted EPS $0.34 $0.33 $0.32 $0.32 $0.32Core EPS $0.33 $0.32 $0.32 $0.32 $0.32Book Value Per Share $16.54 $16.15 $15.99 $15.31 $15.00Tangible Book Value Per Share $16.32 $16.11 $15.95 $15.26 $14.96Dividend Per Share $0.05 $0.05 $0.05 $0.05 $0.05Period End Stock Price $22.22 $21.60 $18.56 $17.50 $21.21Average Diluted Shares (millions) 15.2 15.1 13.2 12.0 11.8Shares Outstanding (millions) 15.6 15.4 15.2 12.3 12.2
Performance Ratios:ROA (Core) 0.68% 0.68% 0.63% 0.62% 0.66%ROE (Core) 8.1% 7.8% 8.0% 8.3% 8.3%NIM 2.80% 2.88% 2.89% 2.89% 3.14%Efficiency Ratio 60.7% 62.0% 65.7% 66.3% 65.5%Fee Income/ Operating Revenue 23.7% 21.5% 22.2% 22.6% 23.8%Effective Tax Rate 37.5% 40.0% 38.2% 38.2% 40.1%Dividend Payout Ratio 14.7% 15.2% 15.6% 15.6% 15.6%
Balance Sheet Ratios:Loans/ Deposits 102.9% 96.8% 97.9% 92.6% 88.6%Loans/ Earning Assets 87.3% 84.4% 82.7% 80.6% 77.6%Tangible Equity/ Assets 8.2% 8.6% 8.9% 7.5% 7.6%Securities/ Assets 8.4% 10.0% 12.7% 11.1% 9.8%
Asset Quality Ratios:NPAs/ Assets 0.70% 0.73% 0.81% 0.91% 0.85%Reserve/ Loans 0.84% 0.85% 0.87% 0.90% 0.92%Reserve/ NPAs 106% 99% 89% 80% 85%NCOs/ Average Loans 0.01% 0.00% 0.01% 0.01% 0.11%
Annualized Growth Rates:Gross Loans HFI 49.1% 34.1% 41.1% 35.4% 25.3%Deposits 49.1% 34.1% 41.1% 35.4% 25.3%EPS 12.1% 12.5% 0.0% 0.0% 92.3%
Annual Snapshot2014 2013 2012 2011 2010
Per Share Data:Diluted EPS $1.22 $1.01 $1.05 $1.25 $0.68Core EPS $1.21 $0.95 $0.88 $1.14 $0.74Book Value Per Share $15.99 $14.48 $13.69 $12.34 $11.03Tangible Book Value Per Share $15.95 $14.43 $13.62 $12.28 $10.97Dividend Per Share $0.20 $0.20 $0.20 $0.20 $0.20Period End Stock Price $18.56 $19.10 $14.08 $10.75 $13.05Average Diluted Shares (millions) 12.2 9.2 8.8 8.7 8.8Shares Outstanding (millions) 15.2 11.8 8.9 8.8 8.8
Performance Ratios:ROA (Core) 0.63% 0.50% 0.52% 0.73% 0.55%ROE (Core) 7.9% 6.9% 7.1% 9.6% 7.1%NIM 3.01% 3.26% 3.50% 3.46% 3.64%Efficiency Ratio 66.6% 74.2% 67.0% 66.9% 65.8%Fee Income/ Operating Revenue 23.1% 27.2% 25.5% 24.0% 23.1%Effective Tax Rate 38.7% 37.3% 39.8% 13.0% 29.7%Dividend Payout Ratio 16.4% 19.8% 19.0% 16.0% 29.4%
Balance Sheet Ratios:Loans/ Deposits 97.9% 95.6% 74.7% 71.9% 69.0%Loans/ Earning Assets 82.7% 79.5% 68.6% 64.5% 61.4%Tangible Equity/ Assets 8.9% 8.7% 7.3% 7.7% 7.8%Securities/ Assets 12.7% 14.2% 18.5% 26.5% 27.9%
Asset Quality Ratios:NPAs/ Assets 0.81% 1.00% 1.30% 2.08% 1.85%Reserve/ Loans 0.87% 0.98% 1.10% 1.27% 1.53%Reserve/ NPAs 89% 78% 59% 40% 51%NCOs/ Average Loans 0.04% 0.06% 0.80% 0.86% 0.93%
Annual Growth Rates:Gross Loans HFI 42.9% 39.0% 9.1% 11.4% -4.8%Deposits 39.5% 8.6% 5.0% 6.8% 0.1%EPS 20.8% -3.8% -16.0% 83.8% 6.3%
3-Year EPS CAGR -0.8%5-Year EPS CAGR 13.8%Note: All data as calculated by SNL FinancialSource: SNL Financial
53
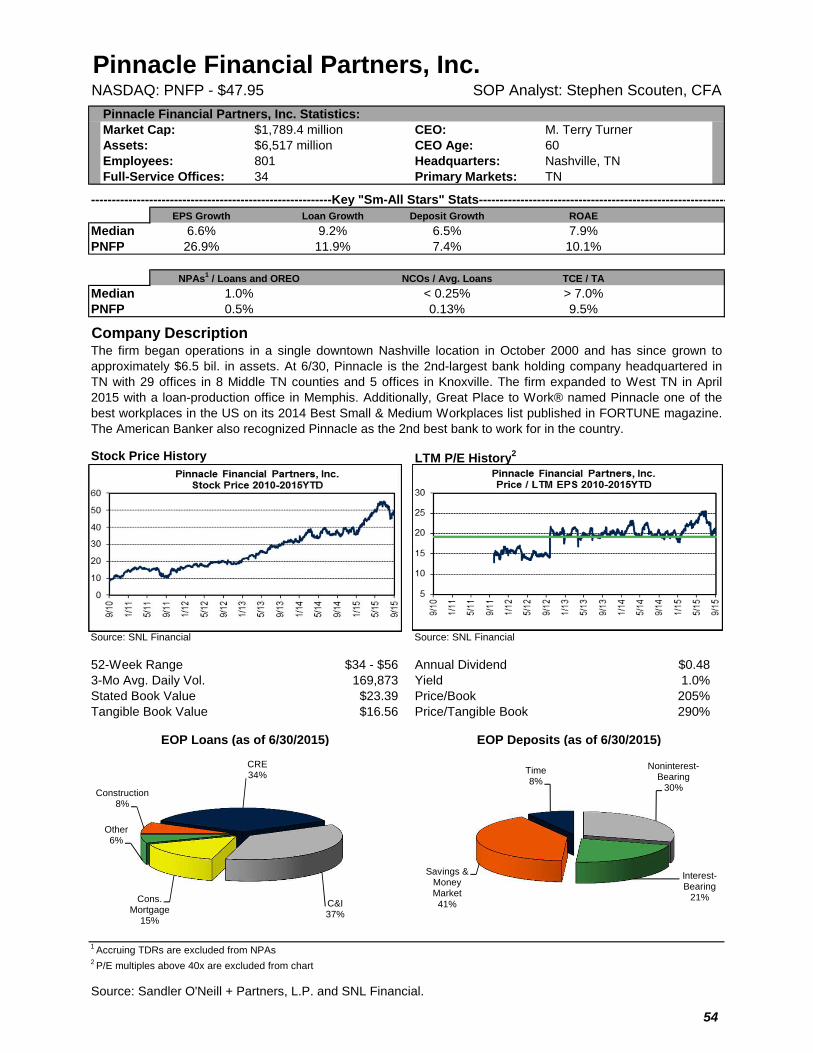
Pinnacle Financial Partners, Inc.NASDAQ: PNFP - $47.95 SOP Analyst: Stephen Scouten, CFA
Pinnacle Financial Partners, Inc. Statistics:Market Cap: $1,789.4 million CEO: M. Terry TurnerAssets: $6,517 million CEO Age: 60Employees: 801 Headquarters: Nashville, TNFull-Service Offices: 34 Primary Markets: TN
----------------------------------------------------------Key "Sm-All Stars" Stats------------------------------------------------------------EPS Growth Loan Growth Deposit Growth ROAE
Median 6.6% 9.2% 6.5% 7.9%PNFP 26.9% 11.9% 7.4% 10.1%
NCOs / Avg. Loans TCE / TA
Median < 0.25% > 7.0%PNFP 0.13% 9.5%
Company Description
Stock Price History LTM P/E History2
Source: SNL Financial Source: SNL Financial
52-Week Range $34 - $56 Annual Dividend $0.483-Mo Avg. Daily Vol. 169,873 Yield 1.0%Stated Book Value $23.39 Price/Book 205%Tangible Book Value $16.56 Price/Tangible Book 290%
EOP Loans (as of 6/30/2015) EOP Deposits (as of 6/30/2015)
1 Accruing TDRs are excluded from NPAs2 P/E multiples above 40x are excluded from chart
Source: Sandler O'Neill + Partners, L.P. and SNL Financial.
The firm began operations in a single downtown Nashville location in October 2000 and has since grown toapproximately $6.5 bil. in assets. At 6/30, Pinnacle is the 2nd-largest bank holding company headquartered inTN with 29 offices in 8 Middle TN counties and 5 offices in Knoxville. The firm expanded to West TN in April2015 with a loan-production office in Memphis. Additionally, Great Place to Work® named Pinnacle one of thebest workplaces in the US on its 2014 Best Small & Medium Workplaces list published in FORTUNE magazine.The American Banker also recognized Pinnacle as the 2nd best bank to work for in the country.
NPAs1 / Loans and OREO
1.0%0.5%
Construction8%
CRE34%
C&I37%
Cons. Mortgage
15%
Other6%
Noninterest-Bearing
30%
Interest-Bearing
21%
Savings & Money Market41%
Time8%
54

Pinnacle Financial Partners, Inc. PNFP
Quarterly Snapshot 0.47
2Q15 1Q15 4Q14 3Q14 2Q14Per Share Data:Diluted EPS $0.64 $0.62 $0.53 $0.52 $0.49Core EPS $0.56 $0.57 $0.53 $0.53 $0.50Book Value Per Share $23.39 $22.98 $22.46 $21.93 $21.47Tangible Book Value Per Share $16.56 $16.12 $15.57 $15.01 $14.53Dividend Per Share $0.12 $0.12 $0.08 $0.08 $0.08Period End Stock Price $54.37 $44.46 $39.54 $36.10 $39.48Average Diluted Shares (millions) 35.6 35.4 35.3 35.2 35.1Shares Outstanding (millions) 36.0 35.9 35.7 35.7 35.6
Performance Ratios:ROA (Core) 1.25% 1.30% 1.28% 1.28% 1.22%ROE (Core) 9.4% 9.8% 9.4% 9.5% 9.2%NIM 3.60% 3.67% 3.74% 3.76% 3.64%Efficiency Ratio 54.6% 54.4% 54.0% 53.6% 55.9%Fee Income/ Operating Revenue 22.7% 23.0% 21.9% 20.2% 21.1%Effective Tax Rate 33.2% 33.0% 33.7% 33.1% 33.1%Dividend Payout Ratio 18.8% 19.4% 15.1% 15.4% 16.3%
Balance Sheet Ratios:Loans/ Deposits 96.7% 97.0% 96.0% 94.8% 92.8%Loans/ Earning Assets 73.9% 73.2% 75.7% 74.9% 74.1%Tangible Equity/ Assets 9.5% 9.5% 9.6% 9.5% 9.3%Securities/ Assets NA NA 13.4% 13.4% 14.1%
Asset Quality Ratios:NPAs/ Assets 0.51% 0.56% 0.60% 0.72% 0.63%Reserve/ Loans 1.35% 1.42% 1.46% 1.49% 1.54%Reserve/ NPAs 198% 186% 186% 157% 184%NCOs/ Average Loans 0.16% 0.12% 0.08% 0.14% 0.08%
Annualized Growth Rates:Gross Loans HFI 15.9% 4.8% 15.3% 9.8% 12.8%Deposits 15.9% 4.8% 15.3% 9.8% 12.8%EPS 12.9% 67.9% 7.7% 24.5% 17.0%
Annual Snapshot2014 2013 2012 2011 2010
Per Share Data:Diluted EPS $2.01 $1.67 $1.10 $1.09 ($0.93)Core EPS $2.02 $1.74 $1.15 $1.12 ($0.93)Book Value Per Share $22.46 $20.55 $19.57 $18.66 $17.32Tangible Book Value Per Share $15.57 $13.52 $12.39 $11.33 $9.80Dividend Per Share $0.32 $0.08 $0.00 $0.00 $0.00Period End Stock Price $39.54 $32.53 $18.84 $16.15 $13.58Average Diluted Shares (millions) 35.1 34.5 34.5 34.1 32.8Shares Outstanding (millions) 35.7 35.2 34.7 34.4 33.9
Performance Ratios:ROA (Core) 1.24% 1.15% 0.90% 0.93% -0.49%ROE (Core) 9.2% 8.5% 6.3% 6.4% -3.5%NIM 3.70% 3.71% 3.71% 3.48% 3.18%Efficiency Ratio 54.8% 55.3% 59.6% 63.2% 64.6%Fee Income/ Operating Revenue 21.2% 21.6% 20.2% 19.5% 18.7%Effective Tax Rate 33.3% 32.8% 33.0% -53.5% NADividend Payout Ratio 15.9% 4.8% 0.0% 0.0% NA
Balance Sheet Ratios:Loans/ Deposits 96.0% 91.4% 92.5% 90.1% 83.8%Loans/ Earning Assets 75.7% 73.8% 73.5% 67.4% 64.7%Tangible Equity/ Assets 9.6% 9.0% 9.0% 9.9% 9.1%Securities/ Assets 13.4% 13.8% 14.6% 19.4% 21.6%
Asset Quality Ratios:NPAs/ Assets 0.60% 0.96% 1.37% 2.28% 3.29%Reserve/ Loans 1.46% 1.63% 1.85% 2.22% 2.56%Reserve/ NPAs 186% 127% 101% 67% 51%NCOs/ Average Loans 0.10% 0.24% 0.29% 0.94% 1.88%
Annual Growth Rates:Gross Loans HFI 10.8% 11.6% 12.8% 2.5% -9.8%Deposits 5.5% 12.9% 9.9% -4.7% 0.2%EPS 20.4% 51.8% 0.9% NM NM
3-Year EPS CAGR 22.6%5-Year EPS CAGR NMNote: All data as calculated by SNL FinancialSource: SNL Financial
55
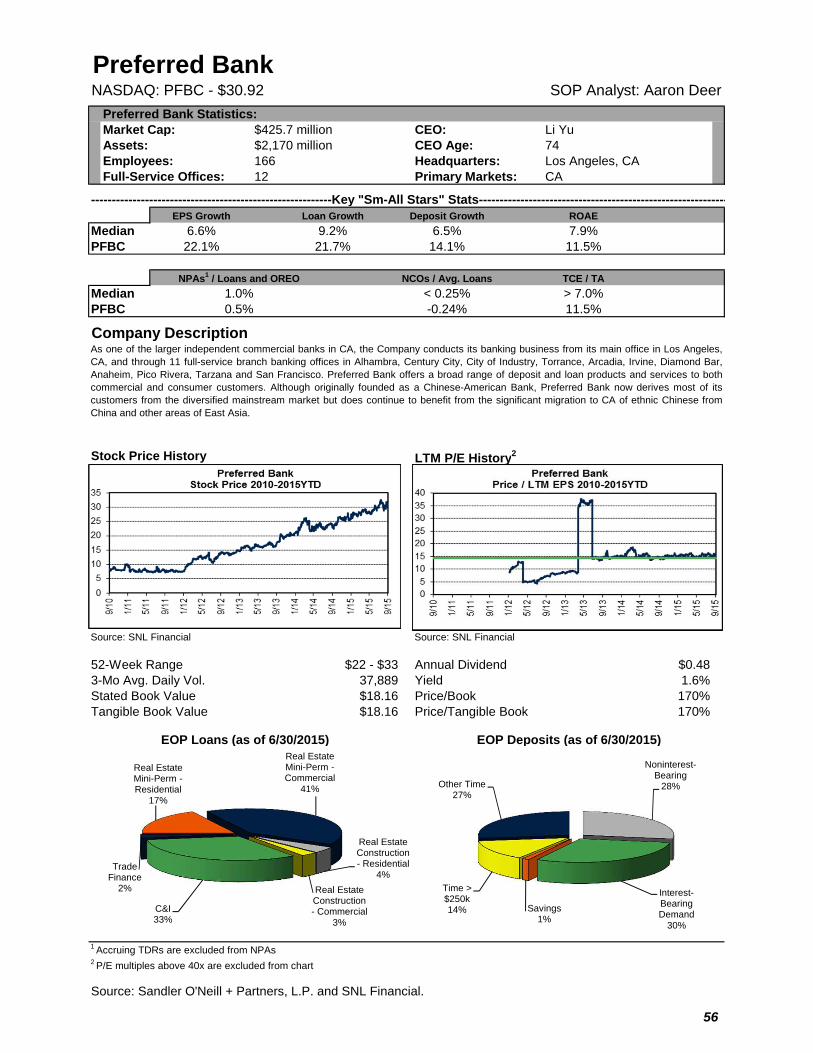
Preferred BankNASDAQ: PFBC - $30.92 SOP Analyst: Aaron Deer
Preferred Bank Statistics:Market Cap: $425.7 million CEO: Li YuAssets: $2,170 million CEO Age: 74Employees: 166 Headquarters: Los Angeles, CAFull-Service Offices: 12 Primary Markets: CA
----------------------------------------------------------Key "Sm-All Stars" Stats------------------------------------------------------------EPS Growth Loan Growth Deposit Growth ROAE
Median 6.6% 9.2% 6.5% 7.9%PFBC 22.1% 21.7% 14.1% 11.5%
NCOs / Avg. Loans TCE / TA
Median < 0.25% > 7.0%PFBC -0.24% 11.5%
Company Description
Stock Price History LTM P/E History2
Source: SNL Financial Source: SNL Financial
52-Week Range $22 - $33 Annual Dividend $0.483-Mo Avg. Daily Vol. 37,889 Yield 1.6%Stated Book Value $18.16 Price/Book 170%Tangible Book Value $18.16 Price/Tangible Book 170%
EOP Loans (as of 6/30/2015) EOP Deposits (as of 6/30/2015)
1 Accruing TDRs are excluded from NPAs2 P/E multiples above 40x are excluded from chart
Source: Sandler O'Neill + Partners, L.P. and SNL Financial.
As one of the larger independent commercial banks in CA, the Company conducts its banking business from its main office in Los Angeles,CA, and through 11 full-service branch banking offices in Alhambra, Century City, City of Industry, Torrance, Arcadia, Irvine, Diamond Bar,Anaheim, Pico Rivera, Tarzana and San Francisco. Preferred Bank offers a broad range of deposit and loan products and services to bothcommercial and consumer customers. Although originally founded as a Chinese-American Bank, Preferred Bank now derives most of itscustomers from the diversified mainstream market but does continue to benefit from the significant migration to CA of ethnic Chinese fromChina and other areas of East Asia.
NPAs1 / Loans and OREO
1.0%0.5%
Real Estate Mini-Perm -Residential
17%
Real Estate Mini-Perm -Commercial
41%
Real Estate Construction - Residential
4%
Real Estate Construction - Commercial
3%
C&I33%
Trade Finance
2%
Noninterest-Bearing
28%
Interest-Bearing Demand
30%
Savings1%
Time > $250k14%
Other Time27%
56
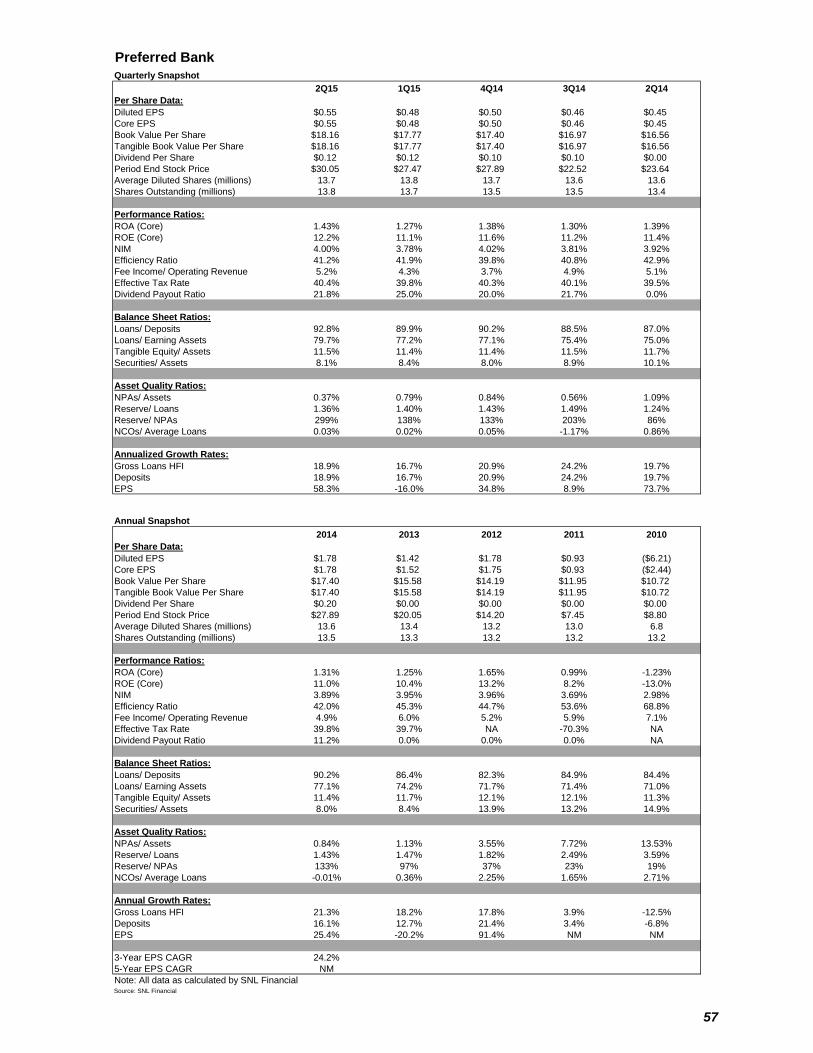
Preferred Bank PFBC
Quarterly Snapshot 0.38
2Q15 1Q15 4Q14 3Q14 2Q14Per Share Data:Diluted EPS $0.55 $0.48 $0.50 $0.46 $0.45Core EPS $0.55 $0.48 $0.50 $0.46 $0.45Book Value Per Share $18.16 $17.77 $17.40 $16.97 $16.56Tangible Book Value Per Share $18.16 $17.77 $17.40 $16.97 $16.56Dividend Per Share $0.12 $0.12 $0.10 $0.10 $0.00Period End Stock Price $30.05 $27.47 $27.89 $22.52 $23.64Average Diluted Shares (millions) 13.7 13.8 13.7 13.6 13.6Shares Outstanding (millions) 13.8 13.7 13.5 13.5 13.4
Performance Ratios:ROA (Core) 1.43% 1.27% 1.38% 1.30% 1.39%ROE (Core) 12.2% 11.1% 11.6% 11.2% 11.4%NIM 4.00% 3.78% 4.02% 3.81% 3.92%Efficiency Ratio 41.2% 41.9% 39.8% 40.8% 42.9%Fee Income/ Operating Revenue 5.2% 4.3% 3.7% 4.9% 5.1%Effective Tax Rate 40.4% 39.8% 40.3% 40.1% 39.5%Dividend Payout Ratio 21.8% 25.0% 20.0% 21.7% 0.0%
Balance Sheet Ratios:Loans/ Deposits 92.8% 89.9% 90.2% 88.5% 87.0%Loans/ Earning Assets 79.7% 77.2% 77.1% 75.4% 75.0%Tangible Equity/ Assets 11.5% 11.4% 11.4% 11.5% 11.7%Securities/ Assets 8.1% 8.4% 8.0% 8.9% 10.1%
Asset Quality Ratios:NPAs/ Assets 0.37% 0.79% 0.84% 0.56% 1.09%Reserve/ Loans 1.36% 1.40% 1.43% 1.49% 1.24%Reserve/ NPAs 299% 138% 133% 203% 86%NCOs/ Average Loans 0.03% 0.02% 0.05% -1.17% 0.86%
Annualized Growth Rates:Gross Loans HFI 18.9% 16.7% 20.9% 24.2% 19.7%Deposits 18.9% 16.7% 20.9% 24.2% 19.7%EPS 58.3% -16.0% 34.8% 8.9% 73.7%
Annual Snapshot2014 2013 2012 2011 2010
Per Share Data:Diluted EPS $1.78 $1.42 $1.78 $0.93 ($6.21)Core EPS $1.78 $1.52 $1.75 $0.93 ($2.44)Book Value Per Share $17.40 $15.58 $14.19 $11.95 $10.72Tangible Book Value Per Share $17.40 $15.58 $14.19 $11.95 $10.72Dividend Per Share $0.20 $0.00 $0.00 $0.00 $0.00Period End Stock Price $27.89 $20.05 $14.20 $7.45 $8.80Average Diluted Shares (millions) 13.6 13.4 13.2 13.0 6.8Shares Outstanding (millions) 13.5 13.3 13.2 13.2 13.2
Performance Ratios:ROA (Core) 1.31% 1.25% 1.65% 0.99% -1.23%ROE (Core) 11.0% 10.4% 13.2% 8.2% -13.0%NIM 3.89% 3.95% 3.96% 3.69% 2.98%Efficiency Ratio 42.0% 45.3% 44.7% 53.6% 68.8%Fee Income/ Operating Revenue 4.9% 6.0% 5.2% 5.9% 7.1%Effective Tax Rate 39.8% 39.7% NA -70.3% NADividend Payout Ratio 11.2% 0.0% 0.0% 0.0% NA
Balance Sheet Ratios:Loans/ Deposits 90.2% 86.4% 82.3% 84.9% 84.4%Loans/ Earning Assets 77.1% 74.2% 71.7% 71.4% 71.0%Tangible Equity/ Assets 11.4% 11.7% 12.1% 12.1% 11.3%Securities/ Assets 8.0% 8.4% 13.9% 13.2% 14.9%
Asset Quality Ratios:NPAs/ Assets 0.84% 1.13% 3.55% 7.72% 13.53%Reserve/ Loans 1.43% 1.47% 1.82% 2.49% 3.59%Reserve/ NPAs 133% 97% 37% 23% 19%NCOs/ Average Loans -0.01% 0.36% 2.25% 1.65% 2.71%
Annual Growth Rates:Gross Loans HFI 21.3% 18.2% 17.8% 3.9% -12.5%Deposits 16.1% 12.7% 21.4% 3.4% -6.8%EPS 25.4% -20.2% 91.4% NM NM
3-Year EPS CAGR 24.2%5-Year EPS CAGR NMNote: All data as calculated by SNL FinancialSource: SNL Financial
57
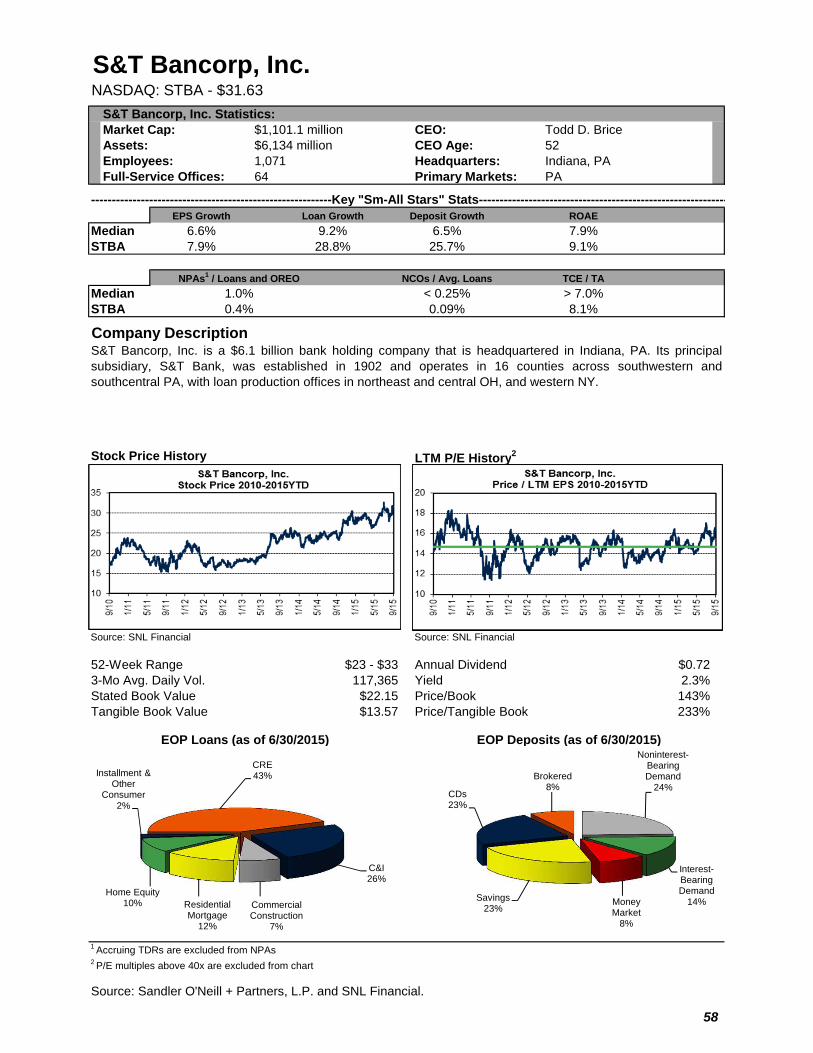
S&T Bancorp, Inc.NASDAQ: STBA - $31.63
S&T Bancorp, Inc. Statistics:Market Cap: $1,101.1 million CEO: Todd D. BriceAssets: $6,134 million CEO Age: 52Employees: 1,071 Headquarters: Indiana, PAFull-Service Offices: 64 Primary Markets: PA
----------------------------------------------------------Key "Sm-All Stars" Stats------------------------------------------------------------EPS Growth Loan Growth Deposit Growth ROAE
Median 6.6% 9.2% 6.5% 7.9%STBA 7.9% 28.8% 25.7% 9.1%
NCOs / Avg. Loans TCE / TA
Median < 0.25% > 7.0%STBA 0.09% 8.1%
Company Description
Stock Price History LTM P/E History2
Source: SNL Financial Source: SNL Financial
52-Week Range $23 - $33 Annual Dividend $0.723-Mo Avg. Daily Vol. 117,365 Yield 2.3%Stated Book Value $22.15 Price/Book 143%Tangible Book Value $13.57 Price/Tangible Book 233%
EOP Loans (as of 6/30/2015) EOP Deposits (as of 6/30/2015)
1 Accruing TDRs are excluded from NPAs2 P/E multiples above 40x are excluded from chart
Source: Sandler O'Neill + Partners, L.P. and SNL Financial.
S&T Bancorp, Inc. is a $6.1 billion bank holding company that is headquartered in Indiana, PA. Its principalsubsidiary, S&T Bank, was established in 1902 and operates in 16 counties across southwestern andsouthcentral PA, with loan production offices in northeast and central OH, and western NY.
NPAs1 / Loans and OREO
1.0%0.4%
CRE43%
C&I26%
Commercial Construction
7%
Residential Mortgage
12%
Home Equity10%
Installment & Other
Consumer2%
Noninterest-Bearing Demand
24%
Interest-Bearing Demand
14%Money Market
8%
Savings23%
CDs23%
Brokered8%
58
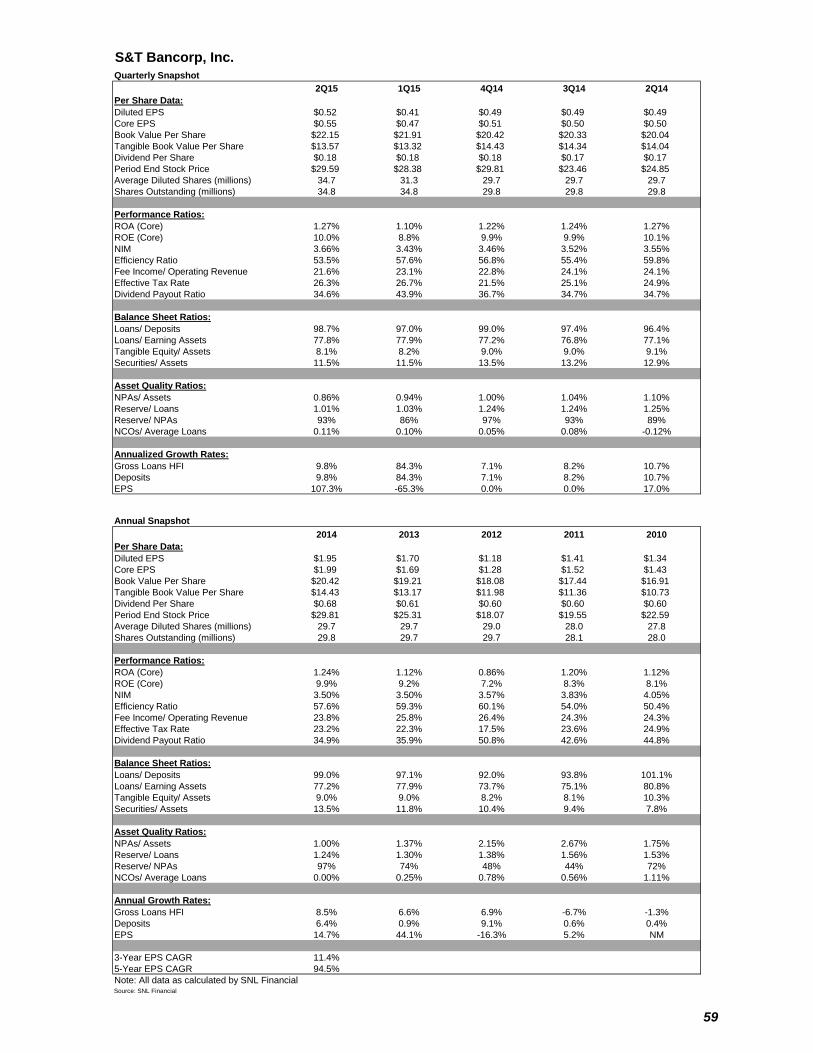
S&T Bancorp, Inc. STBA
Quarterly Snapshot 0.47
2Q15 1Q15 4Q14 3Q14 2Q14Per Share Data:Diluted EPS $0.52 $0.41 $0.49 $0.49 $0.49Core EPS $0.55 $0.47 $0.51 $0.50 $0.50Book Value Per Share $22.15 $21.91 $20.42 $20.33 $20.04Tangible Book Value Per Share $13.57 $13.32 $14.43 $14.34 $14.04Dividend Per Share $0.18 $0.18 $0.18 $0.17 $0.17Period End Stock Price $29.59 $28.38 $29.81 $23.46 $24.85Average Diluted Shares (millions) 34.7 31.3 29.7 29.7 29.7Shares Outstanding (millions) 34.8 34.8 29.8 29.8 29.8
Performance Ratios:ROA (Core) 1.27% 1.10% 1.22% 1.24% 1.27%ROE (Core) 10.0% 8.8% 9.9% 9.9% 10.1%NIM 3.66% 3.43% 3.46% 3.52% 3.55%Efficiency Ratio 53.5% 57.6% 56.8% 55.4% 59.8%Fee Income/ Operating Revenue 21.6% 23.1% 22.8% 24.1% 24.1%Effective Tax Rate 26.3% 26.7% 21.5% 25.1% 24.9%Dividend Payout Ratio 34.6% 43.9% 36.7% 34.7% 34.7%
Balance Sheet Ratios:Loans/ Deposits 98.7% 97.0% 99.0% 97.4% 96.4%Loans/ Earning Assets 77.8% 77.9% 77.2% 76.8% 77.1%Tangible Equity/ Assets 8.1% 8.2% 9.0% 9.0% 9.1%Securities/ Assets 11.5% 11.5% 13.5% 13.2% 12.9%
Asset Quality Ratios:NPAs/ Assets 0.86% 0.94% 1.00% 1.04% 1.10%Reserve/ Loans 1.01% 1.03% 1.24% 1.24% 1.25%Reserve/ NPAs 93% 86% 97% 93% 89%NCOs/ Average Loans 0.11% 0.10% 0.05% 0.08% -0.12%
Annualized Growth Rates:Gross Loans HFI 9.8% 84.3% 7.1% 8.2% 10.7%Deposits 9.8% 84.3% 7.1% 8.2% 10.7%EPS 107.3% -65.3% 0.0% 0.0% 17.0%
Annual Snapshot2014 2013 2012 2011 2010
Per Share Data:Diluted EPS $1.95 $1.70 $1.18 $1.41 $1.34Core EPS $1.99 $1.69 $1.28 $1.52 $1.43Book Value Per Share $20.42 $19.21 $18.08 $17.44 $16.91Tangible Book Value Per Share $14.43 $13.17 $11.98 $11.36 $10.73Dividend Per Share $0.68 $0.61 $0.60 $0.60 $0.60Period End Stock Price $29.81 $25.31 $18.07 $19.55 $22.59Average Diluted Shares (millions) 29.7 29.7 29.0 28.0 27.8Shares Outstanding (millions) 29.8 29.7 29.7 28.1 28.0
Performance Ratios:ROA (Core) 1.24% 1.12% 0.86% 1.20% 1.12%ROE (Core) 9.9% 9.2% 7.2% 8.3% 8.1%NIM 3.50% 3.50% 3.57% 3.83% 4.05%Efficiency Ratio 57.6% 59.3% 60.1% 54.0% 50.4%Fee Income/ Operating Revenue 23.8% 25.8% 26.4% 24.3% 24.3%Effective Tax Rate 23.2% 22.3% 17.5% 23.6% 24.9%Dividend Payout Ratio 34.9% 35.9% 50.8% 42.6% 44.8%
Balance Sheet Ratios:Loans/ Deposits 99.0% 97.1% 92.0% 93.8% 101.1%Loans/ Earning Assets 77.2% 77.9% 73.7% 75.1% 80.8%Tangible Equity/ Assets 9.0% 9.0% 8.2% 8.1% 10.3%Securities/ Assets 13.5% 11.8% 10.4% 9.4% 7.8%
Asset Quality Ratios:NPAs/ Assets 1.00% 1.37% 2.15% 2.67% 1.75%Reserve/ Loans 1.24% 1.30% 1.38% 1.56% 1.53%Reserve/ NPAs 97% 74% 48% 44% 72%NCOs/ Average Loans 0.00% 0.25% 0.78% 0.56% 1.11%
Annual Growth Rates:Gross Loans HFI 8.5% 6.6% 6.9% -6.7% -1.3%Deposits 6.4% 0.9% 9.1% 0.6% 0.4%EPS 14.7% 44.1% -16.3% 5.2% NM
3-Year EPS CAGR 11.4%5-Year EPS CAGR 94.5%Note: All data as calculated by SNL FinancialSource: SNL Financial
59
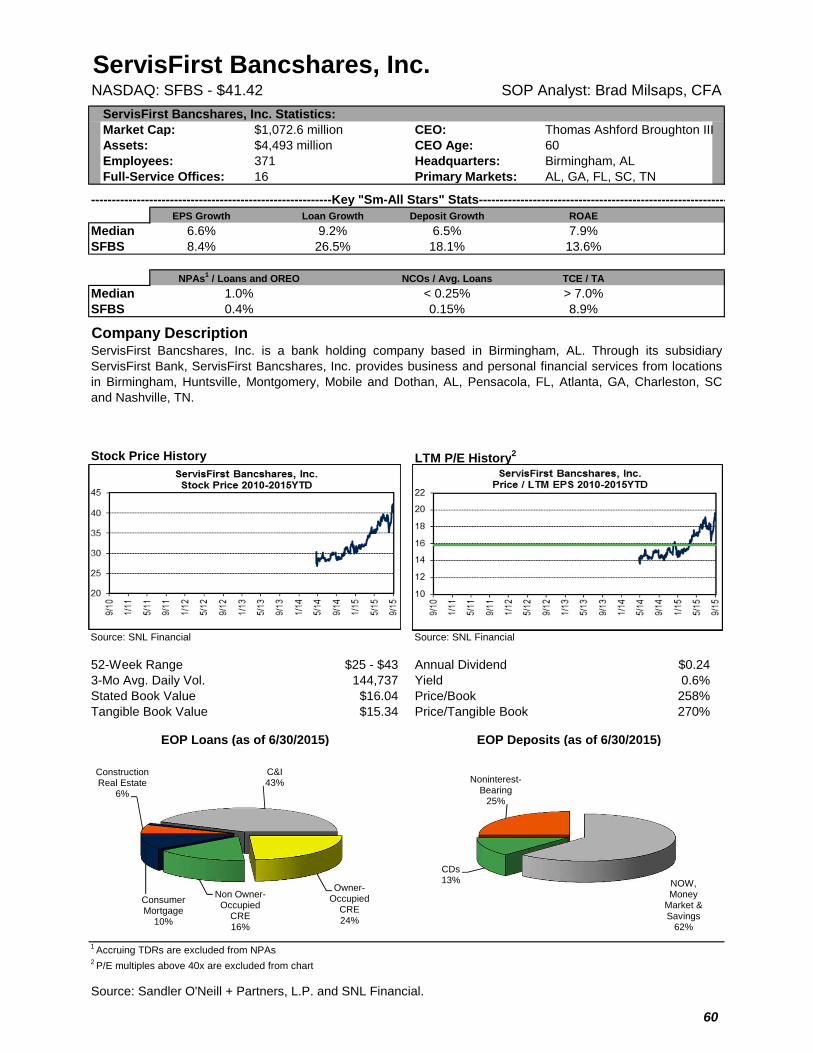
ServisFirst Bancshares, Inc.NASDAQ: SFBS - $41.42 SOP Analyst: Brad Milsaps, CFA
ServisFirst Bancshares, Inc. Statistics:Market Cap: $1,072.6 million CEO: Thomas Ashford Broughton IIIAssets: $4,493 million CEO Age: 60Employees: 371 Headquarters: Birmingham, ALFull-Service Offices: 16 Primary Markets: AL, GA, FL, SC, TN
----------------------------------------------------------Key "Sm-All Stars" Stats------------------------------------------------------------EPS Growth Loan Growth Deposit Growth ROAE
Median 6.6% 9.2% 6.5% 7.9%SFBS 8.4% 26.5% 18.1% 13.6%
NCOs / Avg. Loans TCE / TA
Median < 0.25% > 7.0%SFBS 0.15% 8.9%
Company Description
Stock Price History LTM P/E History2
Source: SNL Financial Source: SNL Financial
52-Week Range $25 - $43 Annual Dividend $0.243-Mo Avg. Daily Vol. 144,737 Yield 0.6%Stated Book Value $16.04 Price/Book 258%Tangible Book Value $15.34 Price/Tangible Book 270%
EOP Loans (as of 6/30/2015) EOP Deposits (as of 6/30/2015)
1 Accruing TDRs are excluded from NPAs2 P/E multiples above 40x are excluded from chart
Source: Sandler O'Neill + Partners, L.P. and SNL Financial.
ServisFirst Bancshares, Inc. is a bank holding company based in Birmingham, AL. Through its subsidiaryServisFirst Bank, ServisFirst Bancshares, Inc. provides business and personal financial services from locationsin Birmingham, Huntsville, Montgomery, Mobile and Dothan, AL, Pensacola, FL, Atlanta, GA, Charleston, SCand Nashville, TN.
NPAs1 / Loans and OREO
1.0%0.4%
Construction Real Estate
6%
C&I43%
Owner-Occupied
CRE24%
Non Owner-Occupied
CRE16%
Consumer Mortgage
10%
NOW, Money
Market & Savings
62%
CDs13%
Noninterest-Bearing
25%
60
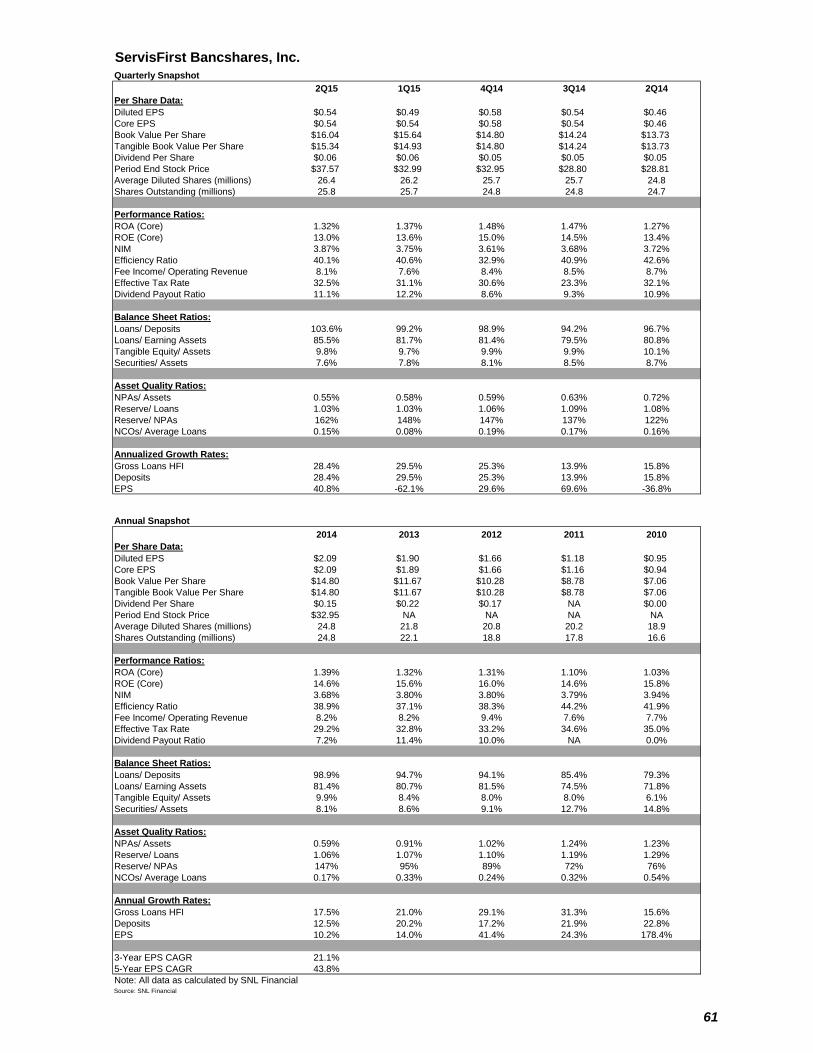
ServisFirst Bancshares, Inc. SFBS
Quarterly Snapshot 0.51
2Q15 1Q15 4Q14 3Q14 2Q14Per Share Data:Diluted EPS $0.54 $0.49 $0.58 $0.54 $0.46Core EPS $0.54 $0.54 $0.58 $0.54 $0.46Book Value Per Share $16.04 $15.64 $14.80 $14.24 $13.73Tangible Book Value Per Share $15.34 $14.93 $14.80 $14.24 $13.73Dividend Per Share $0.06 $0.06 $0.05 $0.05 $0.05Period End Stock Price $37.57 $32.99 $32.95 $28.80 $28.81Average Diluted Shares (millions) 26.4 26.2 25.7 25.7 24.8Shares Outstanding (millions) 25.8 25.7 24.8 24.8 24.7
Performance Ratios:ROA (Core) 1.32% 1.37% 1.48% 1.47% 1.27%ROE (Core) 13.0% 13.6% 15.0% 14.5% 13.4%NIM 3.87% 3.75% 3.61% 3.68% 3.72%Efficiency Ratio 40.1% 40.6% 32.9% 40.9% 42.6%Fee Income/ Operating Revenue 8.1% 7.6% 8.4% 8.5% 8.7%Effective Tax Rate 32.5% 31.1% 30.6% 23.3% 32.1%Dividend Payout Ratio 11.1% 12.2% 8.6% 9.3% 10.9%
Balance Sheet Ratios:Loans/ Deposits 103.6% 99.2% 98.9% 94.2% 96.7%Loans/ Earning Assets 85.5% 81.7% 81.4% 79.5% 80.8%Tangible Equity/ Assets 9.8% 9.7% 9.9% 9.9% 10.1%Securities/ Assets 7.6% 7.8% 8.1% 8.5% 8.7%
Asset Quality Ratios:NPAs/ Assets 0.55% 0.58% 0.59% 0.63% 0.72%Reserve/ Loans 1.03% 1.03% 1.06% 1.09% 1.08%Reserve/ NPAs 162% 148% 147% 137% 122%NCOs/ Average Loans 0.15% 0.08% 0.19% 0.17% 0.16%
Annualized Growth Rates:Gross Loans HFI 28.4% 29.5% 25.3% 13.9% 15.8%Deposits 28.4% 29.5% 25.3% 13.9% 15.8%EPS 40.8% -62.1% 29.6% 69.6% -36.8%
Annual Snapshot2014 2013 2012 2011 2010
Per Share Data:Diluted EPS $2.09 $1.90 $1.66 $1.18 $0.95Core EPS $2.09 $1.89 $1.66 $1.16 $0.94Book Value Per Share $14.80 $11.67 $10.28 $8.78 $7.06Tangible Book Value Per Share $14.80 $11.67 $10.28 $8.78 $7.06Dividend Per Share $0.15 $0.22 $0.17 NA $0.00Period End Stock Price $32.95 NA NA NA NAAverage Diluted Shares (millions) 24.8 21.8 20.8 20.2 18.9Shares Outstanding (millions) 24.8 22.1 18.8 17.8 16.6
Performance Ratios:ROA (Core) 1.39% 1.32% 1.31% 1.10% 1.03%ROE (Core) 14.6% 15.6% 16.0% 14.6% 15.8%NIM 3.68% 3.80% 3.80% 3.79% 3.94%Efficiency Ratio 38.9% 37.1% 38.3% 44.2% 41.9%Fee Income/ Operating Revenue 8.2% 8.2% 9.4% 7.6% 7.7%Effective Tax Rate 29.2% 32.8% 33.2% 34.6% 35.0%Dividend Payout Ratio 7.2% 11.4% 10.0% NA 0.0%
Balance Sheet Ratios:Loans/ Deposits 98.9% 94.7% 94.1% 85.4% 79.3%Loans/ Earning Assets 81.4% 80.7% 81.5% 74.5% 71.8%Tangible Equity/ Assets 9.9% 8.4% 8.0% 8.0% 6.1%Securities/ Assets 8.1% 8.6% 9.1% 12.7% 14.8%
Asset Quality Ratios:NPAs/ Assets 0.59% 0.91% 1.02% 1.24% 1.23%Reserve/ Loans 1.06% 1.07% 1.10% 1.19% 1.29%Reserve/ NPAs 147% 95% 89% 72% 76%NCOs/ Average Loans 0.17% 0.33% 0.24% 0.32% 0.54%
Annual Growth Rates:Gross Loans HFI 17.5% 21.0% 29.1% 31.3% 15.6%Deposits 12.5% 20.2% 17.2% 21.9% 22.8%EPS 10.2% 14.0% 41.4% 24.3% 178.4%
3-Year EPS CAGR 21.1%5-Year EPS CAGR 43.8%Note: All data as calculated by SNL FinancialSource: SNL Financial
61
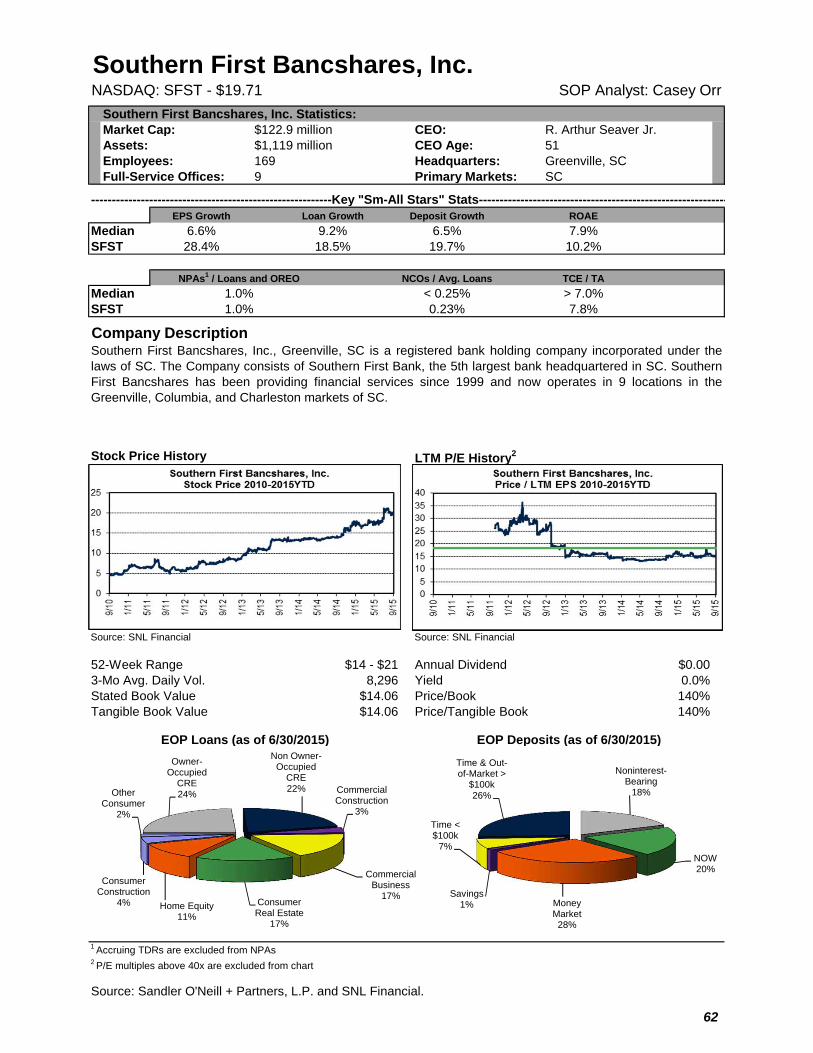
Southern First Bancshares, Inc.NASDAQ: SFST - $19.71 SOP Analyst: Casey Orr
Southern First Bancshares, Inc. Statistics:Market Cap: $122.9 million CEO: R. Arthur Seaver Jr.Assets: $1,119 million CEO Age: 51Employees: 169 Headquarters: Greenville, SCFull-Service Offices: 9 Primary Markets: SC
----------------------------------------------------------Key "Sm-All Stars" Stats------------------------------------------------------------EPS Growth Loan Growth Deposit Growth ROAE
Median 6.6% 9.2% 6.5% 7.9%SFST 28.4% 18.5% 19.7% 10.2%
NCOs / Avg. Loans TCE / TA
Median < 0.25% > 7.0%SFST 0.23% 7.8%
Company Description
Stock Price History LTM P/E History2
Source: SNL Financial Source: SNL Financial
52-Week Range $14 - $21 Annual Dividend $0.003-Mo Avg. Daily Vol. 8,296 Yield 0.0%Stated Book Value $14.06 Price/Book 140%Tangible Book Value $14.06 Price/Tangible Book 140%
EOP Loans (as of 6/30/2015) EOP Deposits (as of 6/30/2015)
1 Accruing TDRs are excluded from NPAs2 P/E multiples above 40x are excluded from chart
Source: Sandler O'Neill + Partners, L.P. and SNL Financial.
Southern First Bancshares, Inc., Greenville, SC is a registered bank holding company incorporated under thelaws of SC. The Company consists of Southern First Bank, the 5th largest bank headquartered in SC. SouthernFirst Bancshares has been providing financial services since 1999 and now operates in 9 locations in theGreenville, Columbia, and Charleston markets of SC.
NPAs1 / Loans and OREO
1.0%1.0%
Owner-Occupied
CRE24%
Non Owner-Occupied
CRE22% Commercial
Construction3%
Commercial Business
17%Consumer Real Estate
17%
Home Equity11%
Consumer Construction
4%
Other Consumer
2%
Noninterest-Bearing
18%
NOW20%
Money Market28%
Savings1%
Time < $100k
7%
Time & Out-of-Market >
$100k26%
62
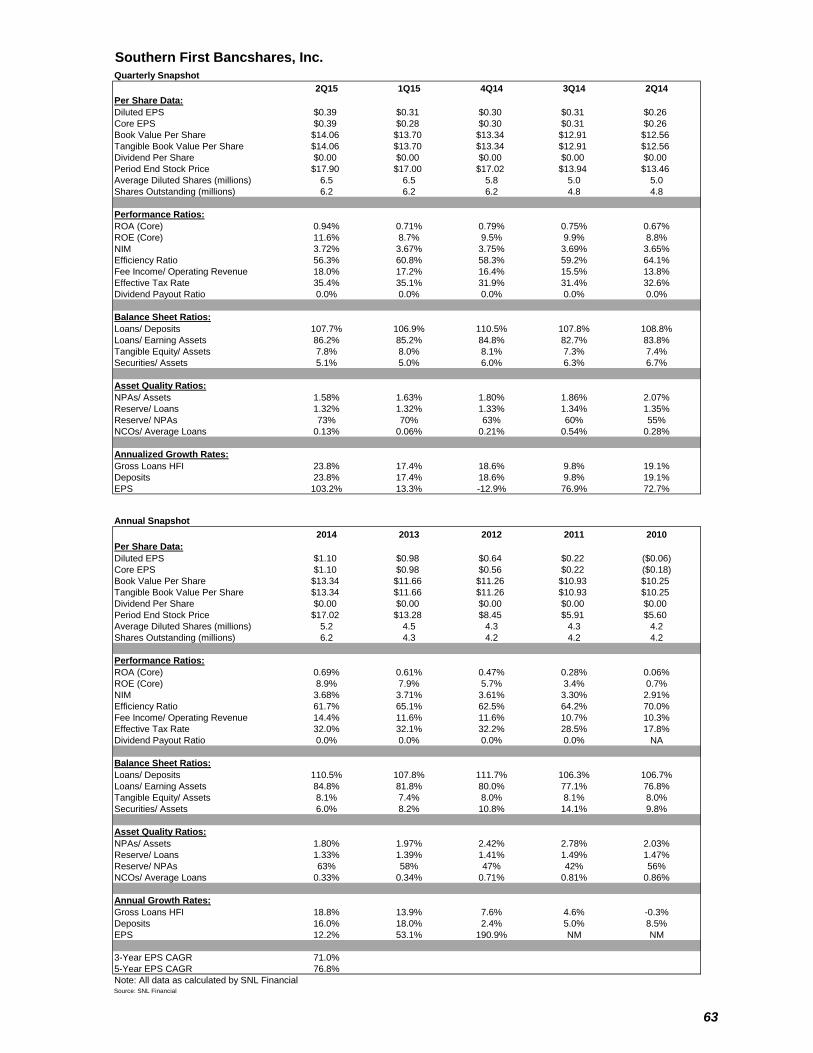
Southern First Bancshares, Inc. SFST
Quarterly Snapshot 0.22
2Q15 1Q15 4Q14 3Q14 2Q14Per Share Data:Diluted EPS $0.39 $0.31 $0.30 $0.31 $0.26Core EPS $0.39 $0.28 $0.30 $0.31 $0.26Book Value Per Share $14.06 $13.70 $13.34 $12.91 $12.56Tangible Book Value Per Share $14.06 $13.70 $13.34 $12.91 $12.56Dividend Per Share $0.00 $0.00 $0.00 $0.00 $0.00Period End Stock Price $17.90 $17.00 $17.02 $13.94 $13.46Average Diluted Shares (millions) 6.5 6.5 5.8 5.0 5.0Shares Outstanding (millions) 6.2 6.2 6.2 4.8 4.8
Performance Ratios:ROA (Core) 0.94% 0.71% 0.79% 0.75% 0.67%ROE (Core) 11.6% 8.7% 9.5% 9.9% 8.8%NIM 3.72% 3.67% 3.75% 3.69% 3.65%Efficiency Ratio 56.3% 60.8% 58.3% 59.2% 64.1%Fee Income/ Operating Revenue 18.0% 17.2% 16.4% 15.5% 13.8%Effective Tax Rate 35.4% 35.1% 31.9% 31.4% 32.6%Dividend Payout Ratio 0.0% 0.0% 0.0% 0.0% 0.0%
Balance Sheet Ratios:Loans/ Deposits 107.7% 106.9% 110.5% 107.8% 108.8%Loans/ Earning Assets 86.2% 85.2% 84.8% 82.7% 83.8%Tangible Equity/ Assets 7.8% 8.0% 8.1% 7.3% 7.4%Securities/ Assets 5.1% 5.0% 6.0% 6.3% 6.7%
Asset Quality Ratios:NPAs/ Assets 1.58% 1.63% 1.80% 1.86% 2.07%Reserve/ Loans 1.32% 1.32% 1.33% 1.34% 1.35%Reserve/ NPAs 73% 70% 63% 60% 55%NCOs/ Average Loans 0.13% 0.06% 0.21% 0.54% 0.28%
Annualized Growth Rates:Gross Loans HFI 23.8% 17.4% 18.6% 9.8% 19.1%Deposits 23.8% 17.4% 18.6% 9.8% 19.1%EPS 103.2% 13.3% -12.9% 76.9% 72.7%
Annual Snapshot2014 2013 2012 2011 2010
Per Share Data:Diluted EPS $1.10 $0.98 $0.64 $0.22 ($0.06)Core EPS $1.10 $0.98 $0.56 $0.22 ($0.18)Book Value Per Share $13.34 $11.66 $11.26 $10.93 $10.25Tangible Book Value Per Share $13.34 $11.66 $11.26 $10.93 $10.25Dividend Per Share $0.00 $0.00 $0.00 $0.00 $0.00Period End Stock Price $17.02 $13.28 $8.45 $5.91 $5.60Average Diluted Shares (millions) 5.2 4.5 4.3 4.3 4.2Shares Outstanding (millions) 6.2 4.3 4.2 4.2 4.2
Performance Ratios:ROA (Core) 0.69% 0.61% 0.47% 0.28% 0.06%ROE (Core) 8.9% 7.9% 5.7% 3.4% 0.7%NIM 3.68% 3.71% 3.61% 3.30% 2.91%Efficiency Ratio 61.7% 65.1% 62.5% 64.2% 70.0%Fee Income/ Operating Revenue 14.4% 11.6% 11.6% 10.7% 10.3%Effective Tax Rate 32.0% 32.1% 32.2% 28.5% 17.8%Dividend Payout Ratio 0.0% 0.0% 0.0% 0.0% NA
Balance Sheet Ratios:Loans/ Deposits 110.5% 107.8% 111.7% 106.3% 106.7%Loans/ Earning Assets 84.8% 81.8% 80.0% 77.1% 76.8%Tangible Equity/ Assets 8.1% 7.4% 8.0% 8.1% 8.0%Securities/ Assets 6.0% 8.2% 10.8% 14.1% 9.8%
Asset Quality Ratios:NPAs/ Assets 1.80% 1.97% 2.42% 2.78% 2.03%Reserve/ Loans 1.33% 1.39% 1.41% 1.49% 1.47%Reserve/ NPAs 63% 58% 47% 42% 56%NCOs/ Average Loans 0.33% 0.34% 0.71% 0.81% 0.86%
Annual Growth Rates:Gross Loans HFI 18.8% 13.9% 7.6% 4.6% -0.3%Deposits 16.0% 18.0% 2.4% 5.0% 8.5%EPS 12.2% 53.1% 190.9% NM NM
3-Year EPS CAGR 71.0%5-Year EPS CAGR 76.8%Note: All data as calculated by SNL FinancialSource: SNL Financial
63
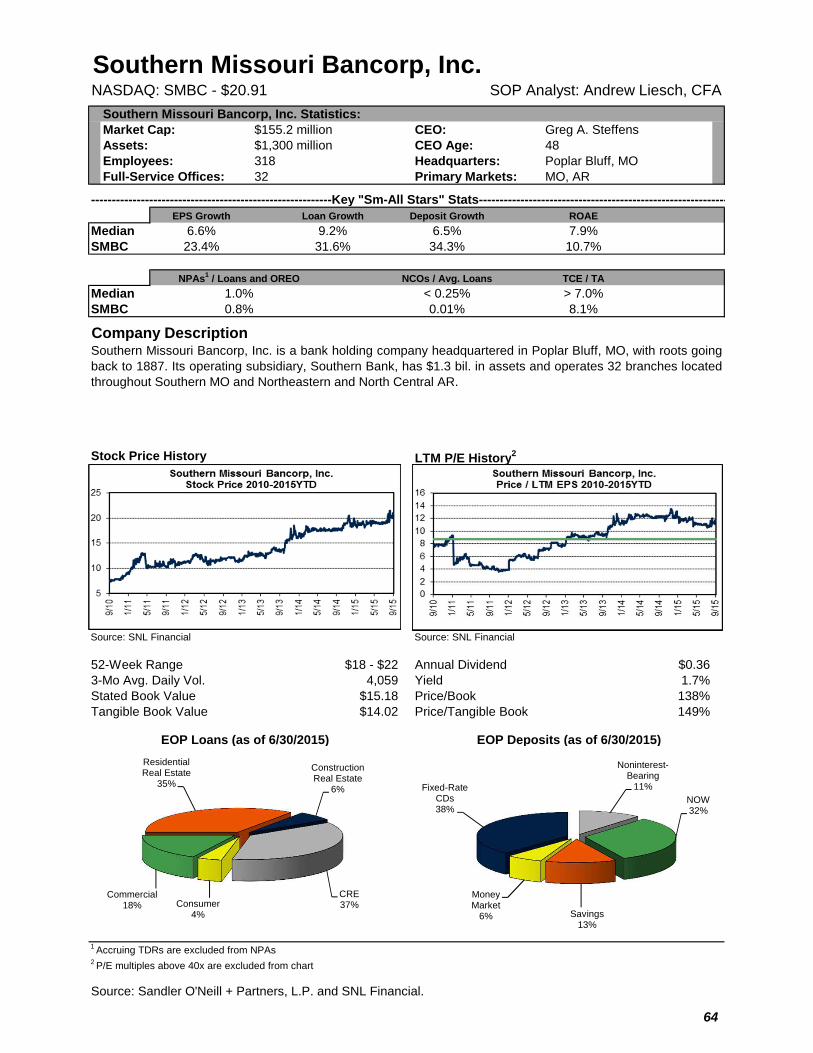
Southern Missouri Bancorp, Inc.NASDAQ: SMBC - $20.91 SOP Analyst: Andrew Liesch, CFA
Southern Missouri Bancorp, Inc. Statistics:Market Cap: $155.2 million CEO: Greg A. SteffensAssets: $1,300 million CEO Age: 48Employees: 318 Headquarters: Poplar Bluff, MOFull-Service Offices: 32 Primary Markets: MO, AR
----------------------------------------------------------Key "Sm-All Stars" Stats------------------------------------------------------------EPS Growth Loan Growth Deposit Growth ROAE
Median 6.6% 9.2% 6.5% 7.9%SMBC 23.4% 31.6% 34.3% 10.7%
NCOs / Avg. Loans TCE / TA
Median < 0.25% > 7.0%SMBC 0.01% 8.1%
Company Description
Stock Price History LTM P/E History2
Source: SNL Financial Source: SNL Financial
52-Week Range $18 - $22 Annual Dividend $0.363-Mo Avg. Daily Vol. 4,059 Yield 1.7%Stated Book Value $15.18 Price/Book 138%Tangible Book Value $14.02 Price/Tangible Book 149%
EOP Loans (as of 6/30/2015) EOP Deposits (as of 6/30/2015)
1 Accruing TDRs are excluded from NPAs2 P/E multiples above 40x are excluded from chart
Source: Sandler O'Neill + Partners, L.P. and SNL Financial.
Southern Missouri Bancorp, Inc. is a bank holding company headquartered in Poplar Bluff, MO, with roots goingback to 1887. Its operating subsidiary, Southern Bank, has $1.3 bil. in assets and operates 32 branches locatedthroughout Southern MO and Northeastern and North Central AR.
NPAs1 / Loans and OREO
1.0%0.8%
Residential Real Estate
35%
Construction Real Estate
6%
CRE37%Consumer
4%
Commercial18%
Noninterest-Bearing
11%NOW32%
Savings13%
Money Market
6%
Fixed-Rate CDs38%
64
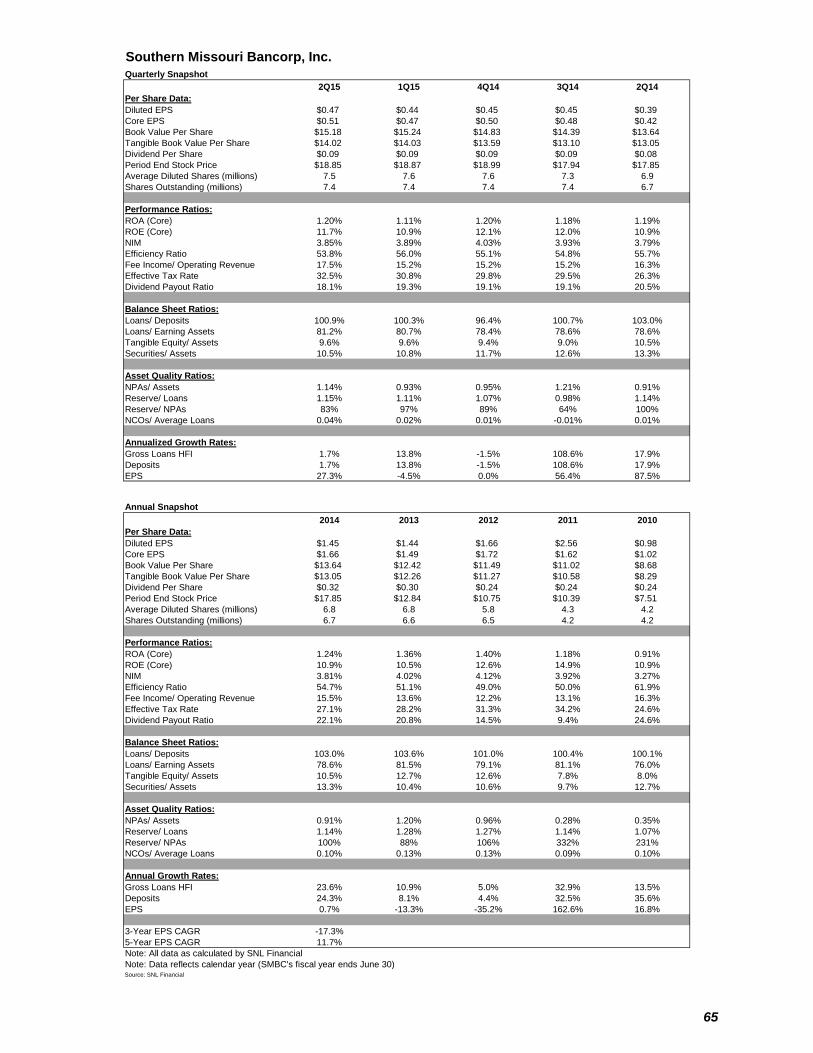
Southern Missouri Bancorp, Inc. SMBC
Quarterly Snapshot 0.32
2Q15 1Q15 4Q14 3Q14 2Q14Per Share Data:Diluted EPS $0.47 $0.44 $0.45 $0.45 $0.39Core EPS $0.51 $0.47 $0.50 $0.48 $0.42Book Value Per Share $15.18 $15.24 $14.83 $14.39 $13.64Tangible Book Value Per Share $14.02 $14.03 $13.59 $13.10 $13.05Dividend Per Share $0.09 $0.09 $0.09 $0.09 $0.08Period End Stock Price $18.85 $18.87 $18.99 $17.94 $17.85Average Diluted Shares (millions) 7.5 7.6 7.6 7.3 6.9Shares Outstanding (millions) 7.4 7.4 7.4 7.4 6.7
Performance Ratios:ROA (Core) 1.20% 1.11% 1.20% 1.18% 1.19%ROE (Core) 11.7% 10.9% 12.1% 12.0% 10.9%NIM 3.85% 3.89% 4.03% 3.93% 3.79%Efficiency Ratio 53.8% 56.0% 55.1% 54.8% 55.7%Fee Income/ Operating Revenue 17.5% 15.2% 15.2% 15.2% 16.3%Effective Tax Rate 32.5% 30.8% 29.8% 29.5% 26.3%Dividend Payout Ratio 18.1% 19.3% 19.1% 19.1% 20.5%
Balance Sheet Ratios:Loans/ Deposits 100.9% 100.3% 96.4% 100.7% 103.0%Loans/ Earning Assets 81.2% 80.7% 78.4% 78.6% 78.6%Tangible Equity/ Assets 9.6% 9.6% 9.4% 9.0% 10.5%Securities/ Assets 10.5% 10.8% 11.7% 12.6% 13.3%
Asset Quality Ratios:NPAs/ Assets 1.14% 0.93% 0.95% 1.21% 0.91%Reserve/ Loans 1.15% 1.11% 1.07% 0.98% 1.14%Reserve/ NPAs 83% 97% 89% 64% 100%NCOs/ Average Loans 0.04% 0.02% 0.01% -0.01% 0.01%
Annualized Growth Rates:Gross Loans HFI 1.7% 13.8% -1.5% 108.6% 17.9%Deposits 1.7% 13.8% -1.5% 108.6% 17.9%EPS 27.3% -4.5% 0.0% 56.4% 87.5%
Annual Snapshot2014 2013 2012 2011 2010
Per Share Data:Diluted EPS $1.45 $1.44 $1.66 $2.56 $0.98Core EPS $1.66 $1.49 $1.72 $1.62 $1.02Book Value Per Share $13.64 $12.42 $11.49 $11.02 $8.68Tangible Book Value Per Share $13.05 $12.26 $11.27 $10.58 $8.29Dividend Per Share $0.32 $0.30 $0.24 $0.24 $0.24Period End Stock Price $17.85 $12.84 $10.75 $10.39 $7.51Average Diluted Shares (millions) 6.8 6.8 5.8 4.3 4.2Shares Outstanding (millions) 6.7 6.6 6.5 4.2 4.2
Performance Ratios:ROA (Core) 1.24% 1.36% 1.40% 1.18% 0.91%ROE (Core) 10.9% 10.5% 12.6% 14.9% 10.9%NIM 3.81% 4.02% 4.12% 3.92% 3.27%Efficiency Ratio 54.7% 51.1% 49.0% 50.0% 61.9%Fee Income/ Operating Revenue 15.5% 13.6% 12.2% 13.1% 16.3%Effective Tax Rate 27.1% 28.2% 31.3% 34.2% 24.6%Dividend Payout Ratio 22.1% 20.8% 14.5% 9.4% 24.6%
Balance Sheet Ratios:Loans/ Deposits 103.0% 103.6% 101.0% 100.4% 100.1%Loans/ Earning Assets 78.6% 81.5% 79.1% 81.1% 76.0%Tangible Equity/ Assets 10.5% 12.7% 12.6% 7.8% 8.0%Securities/ Assets 13.3% 10.4% 10.6% 9.7% 12.7%
Asset Quality Ratios:NPAs/ Assets 0.91% 1.20% 0.96% 0.28% 0.35%Reserve/ Loans 1.14% 1.28% 1.27% 1.14% 1.07%Reserve/ NPAs 100% 88% 106% 332% 231%NCOs/ Average Loans 0.10% 0.13% 0.13% 0.09% 0.10%
Annual Growth Rates:Gross Loans HFI 23.6% 10.9% 5.0% 32.9% 13.5%Deposits 24.3% 8.1% 4.4% 32.5% 35.6%EPS 0.7% -13.3% -35.2% 162.6% 16.8%
3-Year EPS CAGR -17.3%5-Year EPS CAGR 11.7%Note: All data as calculated by SNL FinancialNote: Data reflects calendar year (SMBC's fiscal year ends June 30)Source: SNL Financial
65
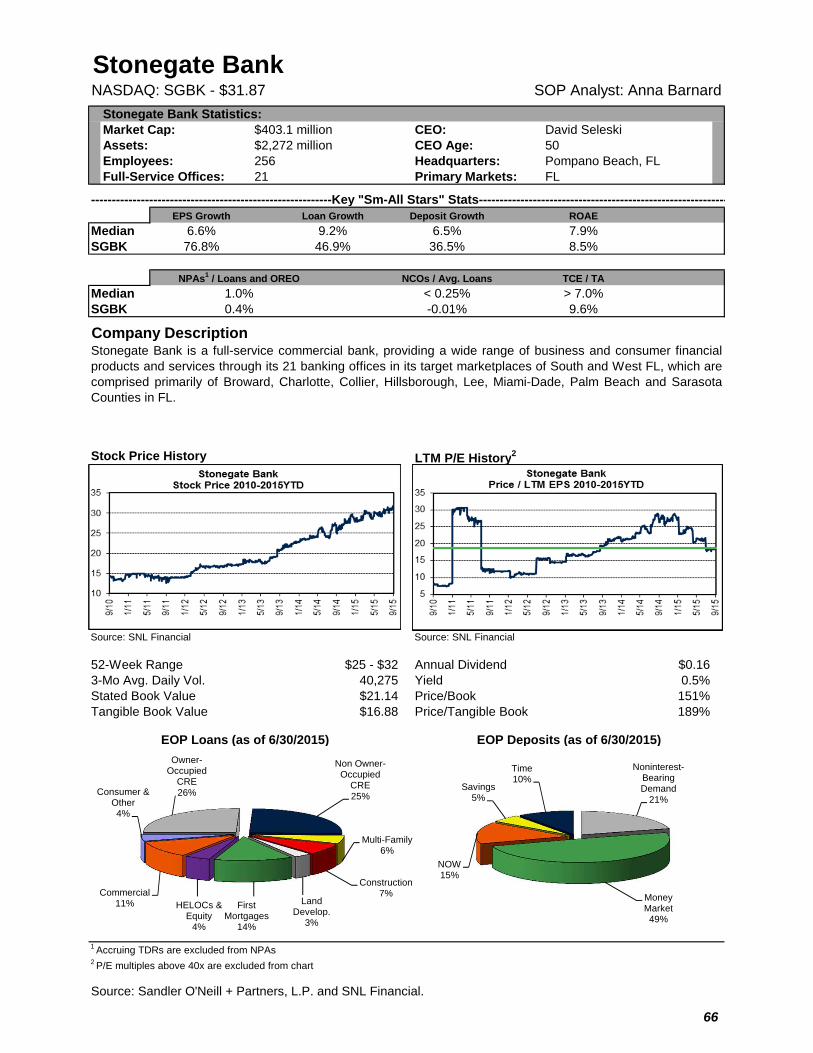
Stonegate BankNASDAQ: SGBK - $31.87 SOP Analyst: Anna Barnard
Stonegate Bank Statistics:Market Cap: $403.1 million CEO: David SeleskiAssets: $2,272 million CEO Age: 50Employees: 256 Headquarters: Pompano Beach, FLFull-Service Offices: 21 Primary Markets: FL
----------------------------------------------------------Key "Sm-All Stars" Stats------------------------------------------------------------EPS Growth Loan Growth Deposit Growth ROAE
Median 6.6% 9.2% 6.5% 7.9%SGBK 76.8% 46.9% 36.5% 8.5%
NCOs / Avg. Loans TCE / TA
Median < 0.25% > 7.0%SGBK -0.01% 9.6%
Company Description
Stock Price History LTM P/E History2
Source: SNL Financial Source: SNL Financial
52-Week Range $25 - $32 Annual Dividend $0.163-Mo Avg. Daily Vol. 40,275 Yield 0.5%Stated Book Value $21.14 Price/Book 151%Tangible Book Value $16.88 Price/Tangible Book 189%
EOP Loans (as of 6/30/2015) EOP Deposits (as of 6/30/2015)
1 Accruing TDRs are excluded from NPAs2 P/E multiples above 40x are excluded from chart
Source: Sandler O'Neill + Partners, L.P. and SNL Financial.
Stonegate Bank is a full-service commercial bank, providing a wide range of business and consumer financialproducts and services through its 21 banking offices in its target marketplaces of South and West FL, which arecomprised primarily of Broward, Charlotte, Collier, Hillsborough, Lee, Miami-Dade, Palm Beach and SarasotaCounties in FL.
NPAs1 / Loans and OREO
1.0%0.4%
Owner-Occupied
CRE26%
Non Owner-Occupied
CRE25%
Multi-Family6%
Construction7%
Land Develop.
3%
First Mortgages
14%
HELOCs & Equity
4%
Commercial11%
Consumer & Other4%
Noninterest-Bearing Demand
21%
Money Market49%
NOW15%
Savings5%
Time10%
66
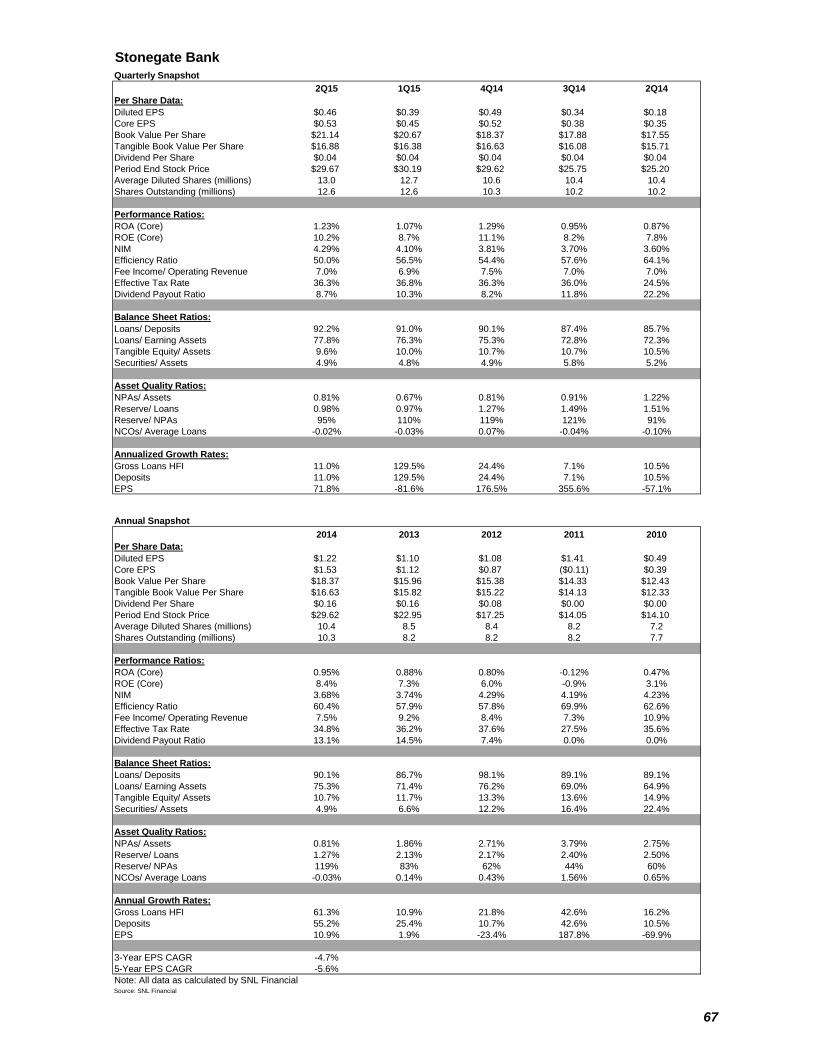
Stonegate Bank SGBK
Quarterly Snapshot 0.21
2Q15 1Q15 4Q14 3Q14 2Q14Per Share Data:Diluted EPS $0.46 $0.39 $0.49 $0.34 $0.18Core EPS $0.53 $0.45 $0.52 $0.38 $0.35Book Value Per Share $21.14 $20.67 $18.37 $17.88 $17.55Tangible Book Value Per Share $16.88 $16.38 $16.63 $16.08 $15.71Dividend Per Share $0.04 $0.04 $0.04 $0.04 $0.04Period End Stock Price $29.67 $30.19 $29.62 $25.75 $25.20Average Diluted Shares (millions) 13.0 12.7 10.6 10.4 10.4Shares Outstanding (millions) 12.6 12.6 10.3 10.2 10.2
Performance Ratios:ROA (Core) 1.23% 1.07% 1.29% 0.95% 0.87%ROE (Core) 10.2% 8.7% 11.1% 8.2% 7.8%NIM 4.29% 4.10% 3.81% 3.70% 3.60%Efficiency Ratio 50.0% 56.5% 54.4% 57.6% 64.1%Fee Income/ Operating Revenue 7.0% 6.9% 7.5% 7.0% 7.0%Effective Tax Rate 36.3% 36.8% 36.3% 36.0% 24.5%Dividend Payout Ratio 8.7% 10.3% 8.2% 11.8% 22.2%
Balance Sheet Ratios:Loans/ Deposits 92.2% 91.0% 90.1% 87.4% 85.7%Loans/ Earning Assets 77.8% 76.3% 75.3% 72.8% 72.3%Tangible Equity/ Assets 9.6% 10.0% 10.7% 10.7% 10.5%Securities/ Assets 4.9% 4.8% 4.9% 5.8% 5.2%
Asset Quality Ratios:NPAs/ Assets 0.81% 0.67% 0.81% 0.91% 1.22%Reserve/ Loans 0.98% 0.97% 1.27% 1.49% 1.51%Reserve/ NPAs 95% 110% 119% 121% 91%NCOs/ Average Loans -0.02% -0.03% 0.07% -0.04% -0.10%
Annualized Growth Rates:Gross Loans HFI 11.0% 129.5% 24.4% 7.1% 10.5%Deposits 11.0% 129.5% 24.4% 7.1% 10.5%EPS 71.8% -81.6% 176.5% 355.6% -57.1%
Annual Snapshot2014 2013 2012 2011 2010
Per Share Data:Diluted EPS $1.22 $1.10 $1.08 $1.41 $0.49Core EPS $1.53 $1.12 $0.87 ($0.11) $0.39Book Value Per Share $18.37 $15.96 $15.38 $14.33 $12.43Tangible Book Value Per Share $16.63 $15.82 $15.22 $14.13 $12.33Dividend Per Share $0.16 $0.16 $0.08 $0.00 $0.00Period End Stock Price $29.62 $22.95 $17.25 $14.05 $14.10Average Diluted Shares (millions) 10.4 8.5 8.4 8.2 7.2Shares Outstanding (millions) 10.3 8.2 8.2 8.2 7.7
Performance Ratios:ROA (Core) 0.95% 0.88% 0.80% -0.12% 0.47%ROE (Core) 8.4% 7.3% 6.0% -0.9% 3.1%NIM 3.68% 3.74% 4.29% 4.19% 4.23%Efficiency Ratio 60.4% 57.9% 57.8% 69.9% 62.6%Fee Income/ Operating Revenue 7.5% 9.2% 8.4% 7.3% 10.9%Effective Tax Rate 34.8% 36.2% 37.6% 27.5% 35.6%Dividend Payout Ratio 13.1% 14.5% 7.4% 0.0% 0.0%
Balance Sheet Ratios:Loans/ Deposits 90.1% 86.7% 98.1% 89.1% 89.1%Loans/ Earning Assets 75.3% 71.4% 76.2% 69.0% 64.9%Tangible Equity/ Assets 10.7% 11.7% 13.3% 13.6% 14.9%Securities/ Assets 4.9% 6.6% 12.2% 16.4% 22.4%
Asset Quality Ratios:NPAs/ Assets 0.81% 1.86% 2.71% 3.79% 2.75%Reserve/ Loans 1.27% 2.13% 2.17% 2.40% 2.50%Reserve/ NPAs 119% 83% 62% 44% 60%NCOs/ Average Loans -0.03% 0.14% 0.43% 1.56% 0.65%
Annual Growth Rates:Gross Loans HFI 61.3% 10.9% 21.8% 42.6% 16.2%Deposits 55.2% 25.4% 10.7% 42.6% 10.5%EPS 10.9% 1.9% -23.4% 187.8% -69.9%
3-Year EPS CAGR -4.7%5-Year EPS CAGR -5.6%Note: All data as calculated by SNL FinancialSource: SNL Financial
67
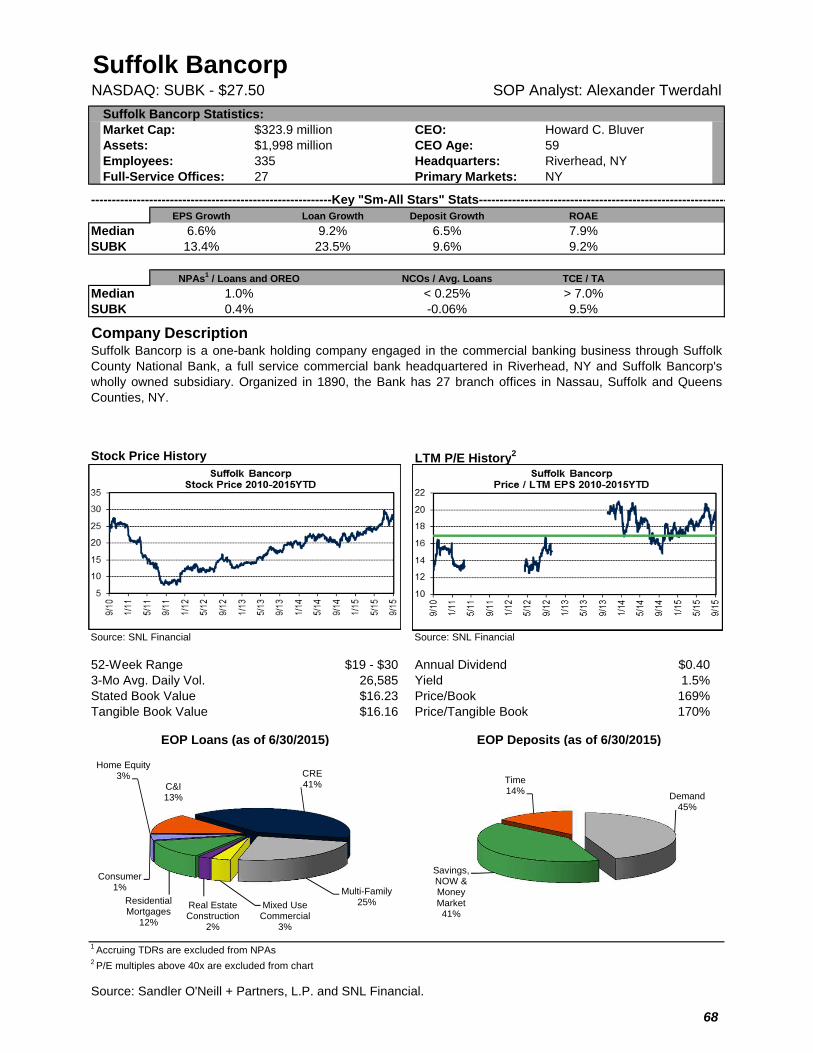
Suffolk BancorpNASDAQ: SUBK - $27.50 SOP Analyst: Alexander Twerdahl
Suffolk Bancorp Statistics:Market Cap: $323.9 million CEO: Howard C. BluverAssets: $1,998 million CEO Age: 59Employees: 335 Headquarters: Riverhead, NYFull-Service Offices: 27 Primary Markets: NY
----------------------------------------------------------Key "Sm-All Stars" Stats------------------------------------------------------------EPS Growth Loan Growth Deposit Growth ROAE
Median 6.6% 9.2% 6.5% 7.9%SUBK 13.4% 23.5% 9.6% 9.2%
NCOs / Avg. Loans TCE / TA
Median < 0.25% > 7.0%SUBK -0.06% 9.5%
Company Description
Stock Price History LTM P/E History2
Source: SNL Financial Source: SNL Financial
52-Week Range $19 - $30 Annual Dividend $0.403-Mo Avg. Daily Vol. 26,585 Yield 1.5%Stated Book Value $16.23 Price/Book 169%Tangible Book Value $16.16 Price/Tangible Book 170%
EOP Loans (as of 6/30/2015) EOP Deposits (as of 6/30/2015)
1 Accruing TDRs are excluded from NPAs2 P/E multiples above 40x are excluded from chart
Source: Sandler O'Neill + Partners, L.P. and SNL Financial.
Suffolk Bancorp is a one-bank holding company engaged in the commercial banking business through SuffolkCounty National Bank, a full service commercial bank headquartered in Riverhead, NY and Suffolk Bancorp'swholly owned subsidiary. Organized in 1890, the Bank has 27 branch offices in Nassau, Suffolk and QueensCounties, NY.
NPAs1 / Loans and OREO
1.0%0.4%
C&I13%
CRE41%
Multi-Family25%Mixed Use
Commercial3%
Real Estate Construction
2%
Residential Mortgages
12%
Home Equity3%
Consumer1%
Demand45%
Savings, NOW & Money Market41%
Time14%
68
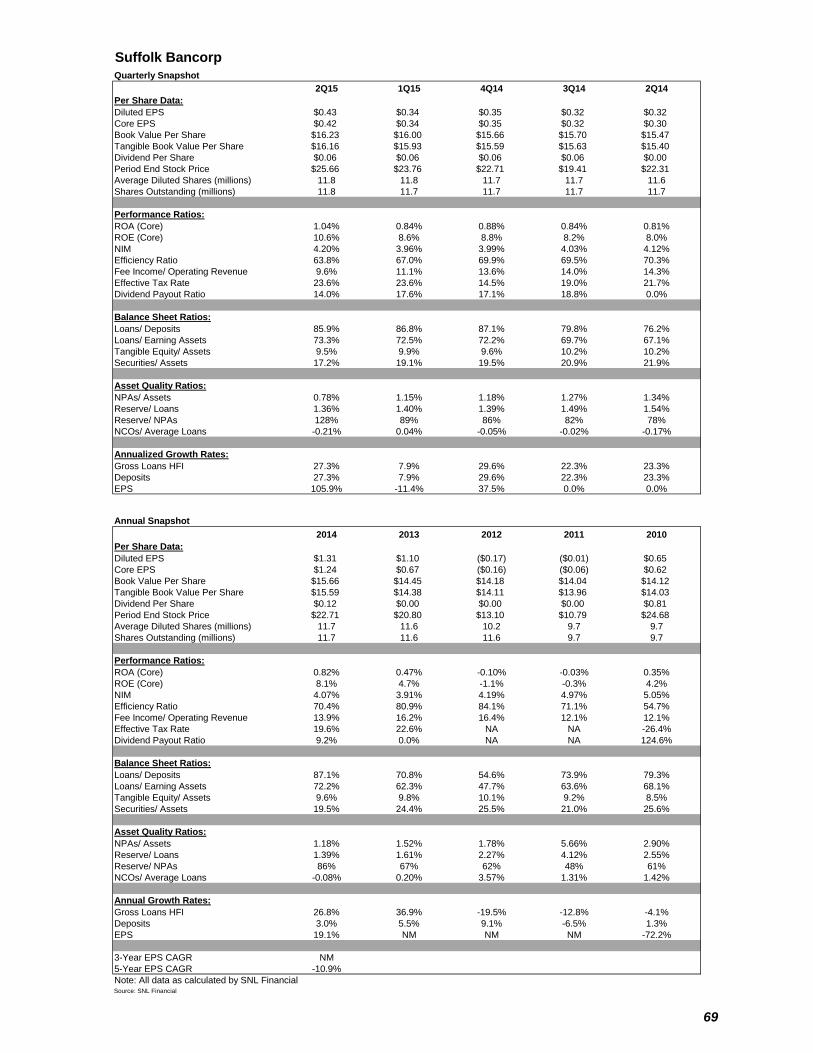
Suffolk Bancorp SUBK
Quarterly Snapshot 0.32
2Q15 1Q15 4Q14 3Q14 2Q14Per Share Data:Diluted EPS $0.43 $0.34 $0.35 $0.32 $0.32Core EPS $0.42 $0.34 $0.35 $0.32 $0.30Book Value Per Share $16.23 $16.00 $15.66 $15.70 $15.47Tangible Book Value Per Share $16.16 $15.93 $15.59 $15.63 $15.40Dividend Per Share $0.06 $0.06 $0.06 $0.06 $0.00Period End Stock Price $25.66 $23.76 $22.71 $19.41 $22.31Average Diluted Shares (millions) 11.8 11.8 11.7 11.7 11.6Shares Outstanding (millions) 11.8 11.7 11.7 11.7 11.7
Performance Ratios:ROA (Core) 1.04% 0.84% 0.88% 0.84% 0.81%ROE (Core) 10.6% 8.6% 8.8% 8.2% 8.0%NIM 4.20% 3.96% 3.99% 4.03% 4.12%Efficiency Ratio 63.8% 67.0% 69.9% 69.5% 70.3%Fee Income/ Operating Revenue 9.6% 11.1% 13.6% 14.0% 14.3%Effective Tax Rate 23.6% 23.6% 14.5% 19.0% 21.7%Dividend Payout Ratio 14.0% 17.6% 17.1% 18.8% 0.0%
Balance Sheet Ratios:Loans/ Deposits 85.9% 86.8% 87.1% 79.8% 76.2%Loans/ Earning Assets 73.3% 72.5% 72.2% 69.7% 67.1%Tangible Equity/ Assets 9.5% 9.9% 9.6% 10.2% 10.2%Securities/ Assets 17.2% 19.1% 19.5% 20.9% 21.9%
Asset Quality Ratios:NPAs/ Assets 0.78% 1.15% 1.18% 1.27% 1.34%Reserve/ Loans 1.36% 1.40% 1.39% 1.49% 1.54%Reserve/ NPAs 128% 89% 86% 82% 78%NCOs/ Average Loans -0.21% 0.04% -0.05% -0.02% -0.17%
Annualized Growth Rates:Gross Loans HFI 27.3% 7.9% 29.6% 22.3% 23.3%Deposits 27.3% 7.9% 29.6% 22.3% 23.3%EPS 105.9% -11.4% 37.5% 0.0% 0.0%
Annual Snapshot2014 2013 2012 2011 2010
Per Share Data:Diluted EPS $1.31 $1.10 ($0.17) ($0.01) $0.65Core EPS $1.24 $0.67 ($0.16) ($0.06) $0.62Book Value Per Share $15.66 $14.45 $14.18 $14.04 $14.12Tangible Book Value Per Share $15.59 $14.38 $14.11 $13.96 $14.03Dividend Per Share $0.12 $0.00 $0.00 $0.00 $0.81Period End Stock Price $22.71 $20.80 $13.10 $10.79 $24.68Average Diluted Shares (millions) 11.7 11.6 10.2 9.7 9.7Shares Outstanding (millions) 11.7 11.6 11.6 9.7 9.7
Performance Ratios:ROA (Core) 0.82% 0.47% -0.10% -0.03% 0.35%ROE (Core) 8.1% 4.7% -1.1% -0.3% 4.2%NIM 4.07% 3.91% 4.19% 4.97% 5.05%Efficiency Ratio 70.4% 80.9% 84.1% 71.1% 54.7%Fee Income/ Operating Revenue 13.9% 16.2% 16.4% 12.1% 12.1%Effective Tax Rate 19.6% 22.6% NA NA -26.4%Dividend Payout Ratio 9.2% 0.0% NA NA 124.6%
Balance Sheet Ratios:Loans/ Deposits 87.1% 70.8% 54.6% 73.9% 79.3%Loans/ Earning Assets 72.2% 62.3% 47.7% 63.6% 68.1%Tangible Equity/ Assets 9.6% 9.8% 10.1% 9.2% 8.5%Securities/ Assets 19.5% 24.4% 25.5% 21.0% 25.6%
Asset Quality Ratios:NPAs/ Assets 1.18% 1.52% 1.78% 5.66% 2.90%Reserve/ Loans 1.39% 1.61% 2.27% 4.12% 2.55%Reserve/ NPAs 86% 67% 62% 48% 61%NCOs/ Average Loans -0.08% 0.20% 3.57% 1.31% 1.42%
Annual Growth Rates:Gross Loans HFI 26.8% 36.9% -19.5% -12.8% -4.1%Deposits 3.0% 5.5% 9.1% -6.5% 1.3%EPS 19.1% NM NM NM -72.2%
3-Year EPS CAGR NM5-Year EPS CAGR -10.9%Note: All data as calculated by SNL FinancialSource: SNL Financial
69
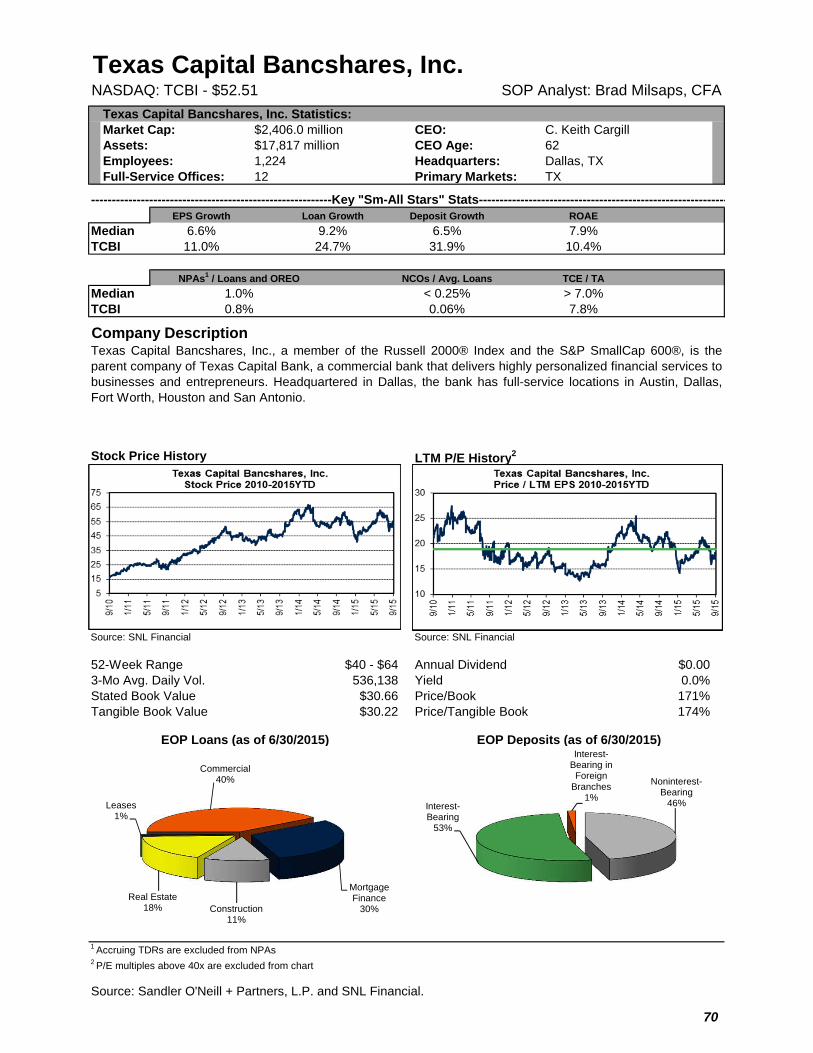
Texas Capital Bancshares, Inc.NASDAQ: TCBI - $52.51 SOP Analyst: Brad Milsaps, CFA
Texas Capital Bancshares, Inc. Statistics:Market Cap: $2,406.0 million CEO: C. Keith CargillAssets: $17,817 million CEO Age: 62Employees: 1,224 Headquarters: Dallas, TXFull-Service Offices: 12 Primary Markets: TX
----------------------------------------------------------Key "Sm-All Stars" Stats------------------------------------------------------------EPS Growth Loan Growth Deposit Growth ROAE
Median 6.6% 9.2% 6.5% 7.9%TCBI 11.0% 24.7% 31.9% 10.4%
NCOs / Avg. Loans TCE / TA
Median < 0.25% > 7.0%TCBI 0.06% 7.8%
Company Description
Stock Price History LTM P/E History2
Source: SNL Financial Source: SNL Financial
52-Week Range $40 - $64 Annual Dividend $0.003-Mo Avg. Daily Vol. 536,138 Yield 0.0%Stated Book Value $30.66 Price/Book 171%Tangible Book Value $30.22 Price/Tangible Book 174%
EOP Loans (as of 6/30/2015) EOP Deposits (as of 6/30/2015)
1 Accruing TDRs are excluded from NPAs2 P/E multiples above 40x are excluded from chart
Source: Sandler O'Neill + Partners, L.P. and SNL Financial.
Texas Capital Bancshares, Inc., a member of the Russell 2000® Index and the S&P SmallCap 600®, is theparent company of Texas Capital Bank, a commercial bank that delivers highly personalized financial services tobusinesses and entrepreneurs. Headquartered in Dallas, the bank has full-service locations in Austin, Dallas,Fort Worth, Houston and San Antonio.
NPAs1 / Loans and OREO
1.0%0.8%
Commercial40%
Mortgage Finance
30%Construction11%
Real Estate18%
Leases1%
Noninterest-Bearing
46%Interest-Bearing
53%
Interest-Bearing in
Foreign Branches
1%
70
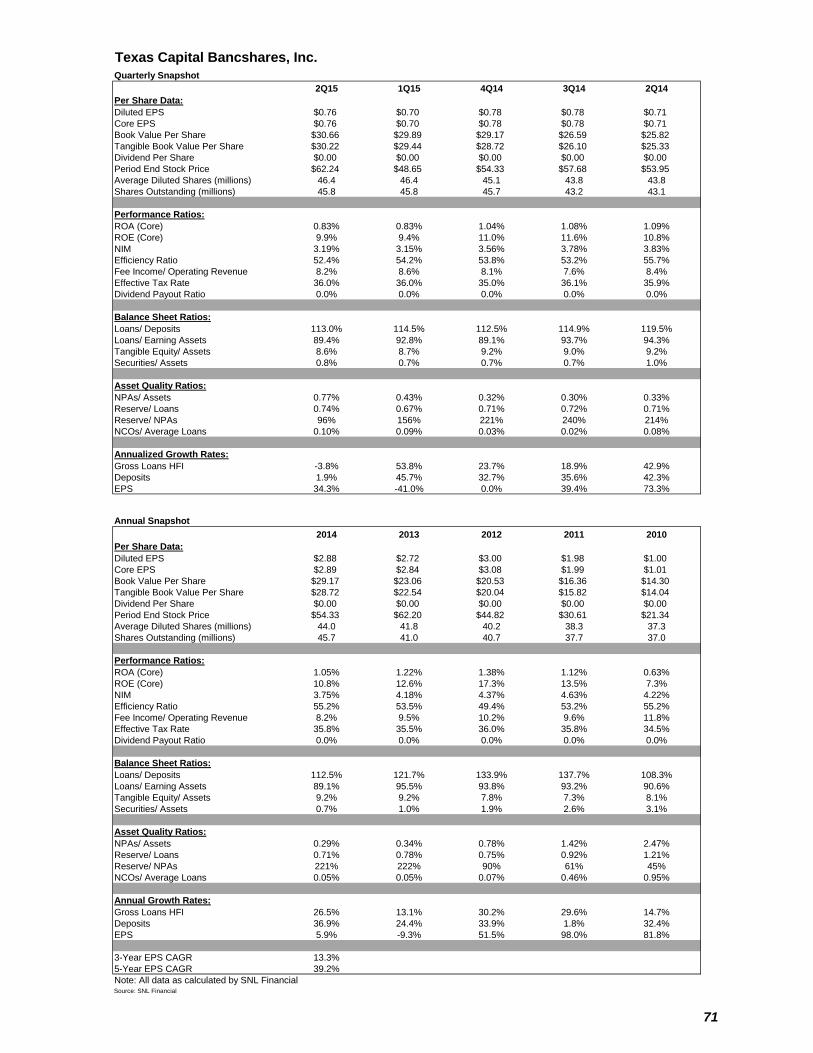
Texas Capital Bancshares, Inc. TCBI
Quarterly Snapshot 0.6
2Q15 1Q15 4Q14 3Q14 2Q14Per Share Data:Diluted EPS $0.76 $0.70 $0.78 $0.78 $0.71Core EPS $0.76 $0.70 $0.78 $0.78 $0.71Book Value Per Share $30.66 $29.89 $29.17 $26.59 $25.82Tangible Book Value Per Share $30.22 $29.44 $28.72 $26.10 $25.33Dividend Per Share $0.00 $0.00 $0.00 $0.00 $0.00Period End Stock Price $62.24 $48.65 $54.33 $57.68 $53.95Average Diluted Shares (millions) 46.4 46.4 45.1 43.8 43.8Shares Outstanding (millions) 45.8 45.8 45.7 43.2 43.1
Performance Ratios:ROA (Core) 0.83% 0.83% 1.04% 1.08% 1.09%ROE (Core) 9.9% 9.4% 11.0% 11.6% 10.8%NIM 3.19% 3.15% 3.56% 3.78% 3.83%Efficiency Ratio 52.4% 54.2% 53.8% 53.2% 55.7%Fee Income/ Operating Revenue 8.2% 8.6% 8.1% 7.6% 8.4%Effective Tax Rate 36.0% 36.0% 35.0% 36.1% 35.9%Dividend Payout Ratio 0.0% 0.0% 0.0% 0.0% 0.0%
Balance Sheet Ratios:Loans/ Deposits 113.0% 114.5% 112.5% 114.9% 119.5%Loans/ Earning Assets 89.4% 92.8% 89.1% 93.7% 94.3%Tangible Equity/ Assets 8.6% 8.7% 9.2% 9.0% 9.2%Securities/ Assets 0.8% 0.7% 0.7% 0.7% 1.0%
Asset Quality Ratios:NPAs/ Assets 0.77% 0.43% 0.32% 0.30% 0.33%Reserve/ Loans 0.74% 0.67% 0.71% 0.72% 0.71%Reserve/ NPAs 96% 156% 221% 240% 214%NCOs/ Average Loans 0.10% 0.09% 0.03% 0.02% 0.08%
Annualized Growth Rates:Gross Loans HFI -3.8% 53.8% 23.7% 18.9% 42.9%Deposits 1.9% 45.7% 32.7% 35.6% 42.3%EPS 34.3% -41.0% 0.0% 39.4% 73.3%
Annual Snapshot2014 2013 2012 2011 2010
Per Share Data:Diluted EPS $2.88 $2.72 $3.00 $1.98 $1.00Core EPS $2.89 $2.84 $3.08 $1.99 $1.01Book Value Per Share $29.17 $23.06 $20.53 $16.36 $14.30Tangible Book Value Per Share $28.72 $22.54 $20.04 $15.82 $14.04Dividend Per Share $0.00 $0.00 $0.00 $0.00 $0.00Period End Stock Price $54.33 $62.20 $44.82 $30.61 $21.34Average Diluted Shares (millions) 44.0 41.8 40.2 38.3 37.3Shares Outstanding (millions) 45.7 41.0 40.7 37.7 37.0
Performance Ratios:ROA (Core) 1.05% 1.22% 1.38% 1.12% 0.63%ROE (Core) 10.8% 12.6% 17.3% 13.5% 7.3%NIM 3.75% 4.18% 4.37% 4.63% 4.22%Efficiency Ratio 55.2% 53.5% 49.4% 53.2% 55.2%Fee Income/ Operating Revenue 8.2% 9.5% 10.2% 9.6% 11.8%Effective Tax Rate 35.8% 35.5% 36.0% 35.8% 34.5%Dividend Payout Ratio 0.0% 0.0% 0.0% 0.0% 0.0%
Balance Sheet Ratios:Loans/ Deposits 112.5% 121.7% 133.9% 137.7% 108.3%Loans/ Earning Assets 89.1% 95.5% 93.8% 93.2% 90.6%Tangible Equity/ Assets 9.2% 9.2% 7.8% 7.3% 8.1%Securities/ Assets 0.7% 1.0% 1.9% 2.6% 3.1%
Asset Quality Ratios:NPAs/ Assets 0.29% 0.34% 0.78% 1.42% 2.47%Reserve/ Loans 0.71% 0.78% 0.75% 0.92% 1.21%Reserve/ NPAs 221% 222% 90% 61% 45%NCOs/ Average Loans 0.05% 0.05% 0.07% 0.46% 0.95%
Annual Growth Rates:Gross Loans HFI 26.5% 13.1% 30.2% 29.6% 14.7%Deposits 36.9% 24.4% 33.9% 1.8% 32.4%EPS 5.9% -9.3% 51.5% 98.0% 81.8%
3-Year EPS CAGR 13.3%5-Year EPS CAGR 39.2%Note: All data as calculated by SNL FinancialSource: SNL Financial
71
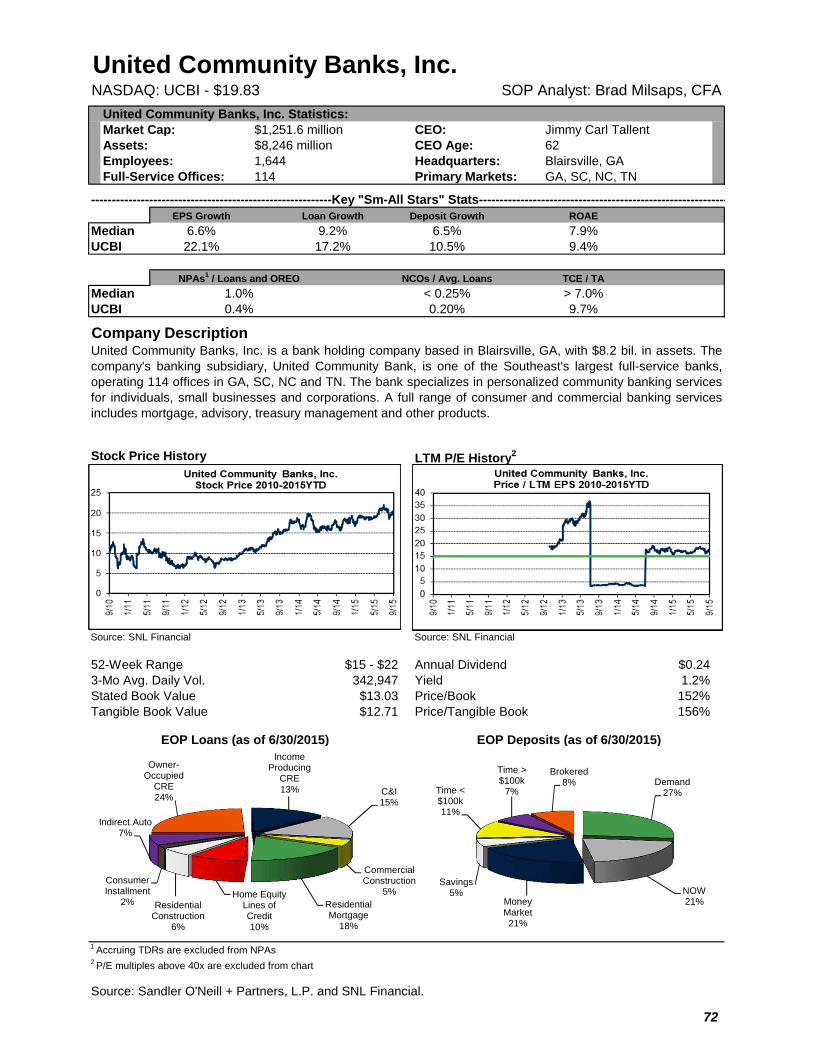
United Community Banks, Inc.NASDAQ: UCBI - $19.83 SOP Analyst: Brad Milsaps, CFA
United Community Banks, Inc. Statistics:Market Cap: $1,251.6 million CEO: Jimmy Carl TallentAssets: $8,246 million CEO Age: 62Employees: 1,644 Headquarters: Blairsville, GAFull-Service Offices: 114 Primary Markets: GA, SC, NC, TN
----------------------------------------------------------Key "Sm-All Stars" Stats------------------------------------------------------------EPS Growth Loan Growth Deposit Growth ROAE
Median 6.6% 9.2% 6.5% 7.9%UCBI 22.1% 17.2% 10.5% 9.4%
NCOs / Avg. Loans TCE / TA
Median < 0.25% > 7.0%UCBI 0.20% 9.7%
Company Description
Stock Price History LTM P/E History2
Source: SNL Financial Source: SNL Financial
52-Week Range $15 - $22 Annual Dividend $0.243-Mo Avg. Daily Vol. 342,947 Yield 1.2%Stated Book Value $13.03 Price/Book 152%Tangible Book Value $12.71 Price/Tangible Book 156%
EOP Loans (as of 6/30/2015) EOP Deposits (as of 6/30/2015)
1 Accruing TDRs are excluded from NPAs2 P/E multiples above 40x are excluded from chart
Source: Sandler O'Neill + Partners, L.P. and SNL Financial.
United Community Banks, Inc. is a bank holding company based in Blairsville, GA, with $8.2 bil. in assets. Thecompany's banking subsidiary, United Community Bank, is one of the Southeast's largest full-service banks,operating 114 offices in GA, SC, NC and TN. The bank specializes in personalized community banking servicesfor individuals, small businesses and corporations. A full range of consumer and commercial banking servicesincludes mortgage, advisory, treasury management and other products.
NPAs1 / Loans and OREO
1.0%0.4%
Owner-Occupied
CRE24%
Income Producing
CRE13% C&I
15%
Commercial Construction
5%Residential Mortgage
18%
Home Equity Lines of Credit10%
Residential Construction
6%
Consumer Installment
2%
Indirect Auto7%
Demand27%
NOW21%Money
Market21%
Savings5%
Time < $100k11%
Time > $100k
7%
Brokered8%
72
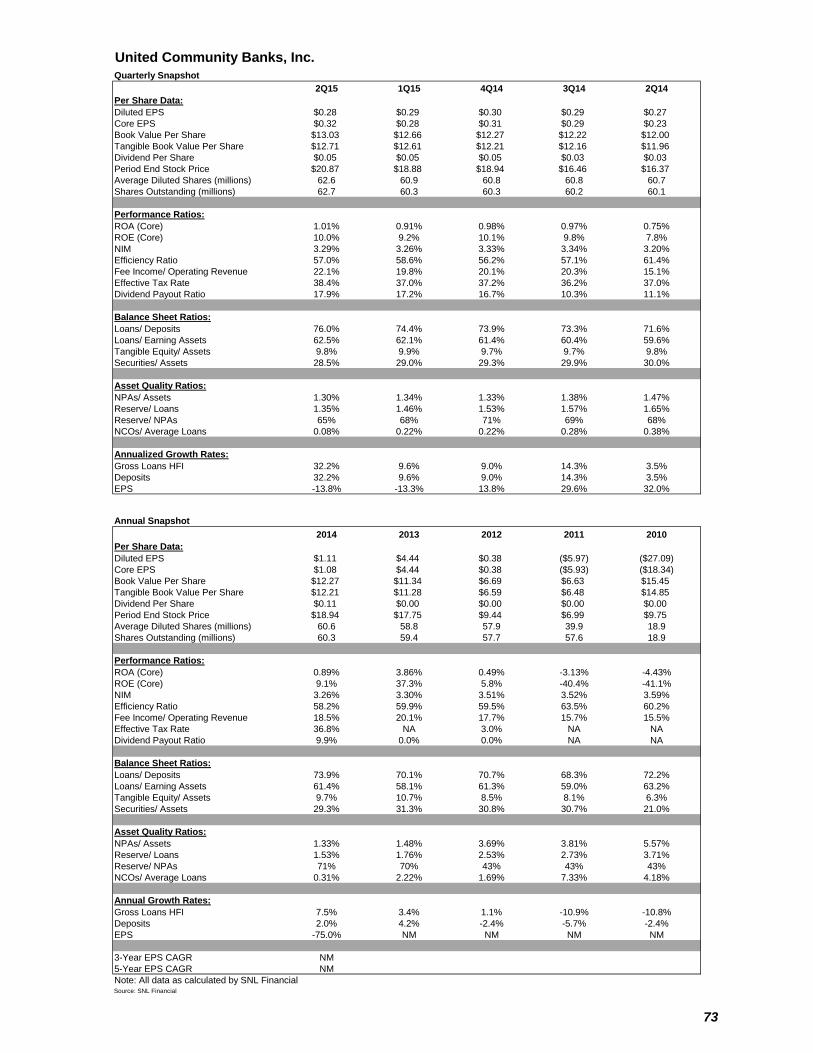
United Community Banks, Inc. UCBI
Quarterly Snapshot 0.25
2Q15 1Q15 4Q14 3Q14 2Q14Per Share Data:Diluted EPS $0.28 $0.29 $0.30 $0.29 $0.27Core EPS $0.32 $0.28 $0.31 $0.29 $0.23Book Value Per Share $13.03 $12.66 $12.27 $12.22 $12.00Tangible Book Value Per Share $12.71 $12.61 $12.21 $12.16 $11.96Dividend Per Share $0.05 $0.05 $0.05 $0.03 $0.03Period End Stock Price $20.87 $18.88 $18.94 $16.46 $16.37Average Diluted Shares (millions) 62.6 60.9 60.8 60.8 60.7Shares Outstanding (millions) 62.7 60.3 60.3 60.2 60.1
Performance Ratios:ROA (Core) 1.01% 0.91% 0.98% 0.97% 0.75%ROE (Core) 10.0% 9.2% 10.1% 9.8% 7.8%NIM 3.29% 3.26% 3.33% 3.34% 3.20%Efficiency Ratio 57.0% 58.6% 56.2% 57.1% 61.4%Fee Income/ Operating Revenue 22.1% 19.8% 20.1% 20.3% 15.1%Effective Tax Rate 38.4% 37.0% 37.2% 36.2% 37.0%Dividend Payout Ratio 17.9% 17.2% 16.7% 10.3% 11.1%
Balance Sheet Ratios:Loans/ Deposits 76.0% 74.4% 73.9% 73.3% 71.6%Loans/ Earning Assets 62.5% 62.1% 61.4% 60.4% 59.6%Tangible Equity/ Assets 9.8% 9.9% 9.7% 9.7% 9.8%Securities/ Assets 28.5% 29.0% 29.3% 29.9% 30.0%
Asset Quality Ratios:NPAs/ Assets 1.30% 1.34% 1.33% 1.38% 1.47%Reserve/ Loans 1.35% 1.46% 1.53% 1.57% 1.65%Reserve/ NPAs 65% 68% 71% 69% 68%NCOs/ Average Loans 0.08% 0.22% 0.22% 0.28% 0.38%
Annualized Growth Rates:Gross Loans HFI 32.2% 9.6% 9.0% 14.3% 3.5%Deposits 32.2% 9.6% 9.0% 14.3% 3.5%EPS -13.8% -13.3% 13.8% 29.6% 32.0%
Annual Snapshot2014 2013 2012 2011 2010
Per Share Data:Diluted EPS $1.11 $4.44 $0.38 ($5.97) ($27.09)Core EPS $1.08 $4.44 $0.38 ($5.93) ($18.34)Book Value Per Share $12.27 $11.34 $6.69 $6.63 $15.45Tangible Book Value Per Share $12.21 $11.28 $6.59 $6.48 $14.85Dividend Per Share $0.11 $0.00 $0.00 $0.00 $0.00Period End Stock Price $18.94 $17.75 $9.44 $6.99 $9.75Average Diluted Shares (millions) 60.6 58.8 57.9 39.9 18.9Shares Outstanding (millions) 60.3 59.4 57.7 57.6 18.9
Performance Ratios:ROA (Core) 0.89% 3.86% 0.49% -3.13% -4.43%ROE (Core) 9.1% 37.3% 5.8% -40.4% -41.1%NIM 3.26% 3.30% 3.51% 3.52% 3.59%Efficiency Ratio 58.2% 59.9% 59.5% 63.5% 60.2%Fee Income/ Operating Revenue 18.5% 20.1% 17.7% 15.7% 15.5%Effective Tax Rate 36.8% NA 3.0% NA NADividend Payout Ratio 9.9% 0.0% 0.0% NA NA
Balance Sheet Ratios:Loans/ Deposits 73.9% 70.1% 70.7% 68.3% 72.2%Loans/ Earning Assets 61.4% 58.1% 61.3% 59.0% 63.2%Tangible Equity/ Assets 9.7% 10.7% 8.5% 8.1% 6.3%Securities/ Assets 29.3% 31.3% 30.8% 30.7% 21.0%
Asset Quality Ratios:NPAs/ Assets 1.33% 1.48% 3.69% 3.81% 5.57%Reserve/ Loans 1.53% 1.76% 2.53% 2.73% 3.71%Reserve/ NPAs 71% 70% 43% 43% 43%NCOs/ Average Loans 0.31% 2.22% 1.69% 7.33% 4.18%
Annual Growth Rates:Gross Loans HFI 7.5% 3.4% 1.1% -10.9% -10.8%Deposits 2.0% 4.2% -2.4% -5.7% -2.4%EPS -75.0% NM NM NM NM
3-Year EPS CAGR NM5-Year EPS CAGR NMNote: All data as calculated by SNL FinancialSource: SNL Financial
73
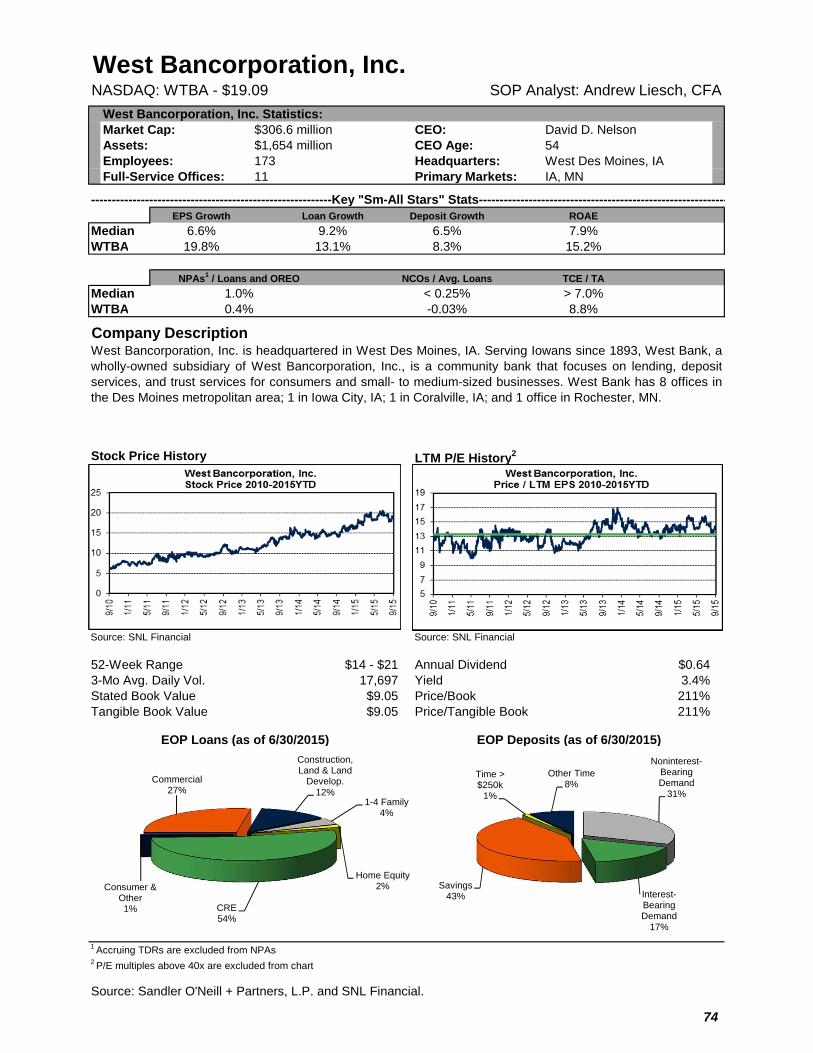
West Bancorporation, Inc.NASDAQ: WTBA - $19.09 SOP Analyst: Andrew Liesch, CFA
West Bancorporation, Inc. Statistics:Market Cap: $306.6 million CEO: David D. NelsonAssets: $1,654 million CEO Age: 54Employees: 173 Headquarters: West Des Moines, IAFull-Service Offices: 11 Primary Markets: IA, MN
----------------------------------------------------------Key "Sm-All Stars" Stats------------------------------------------------------------EPS Growth Loan Growth Deposit Growth ROAE
Median 6.6% 9.2% 6.5% 7.9%WTBA 19.8% 13.1% 8.3% 15.2%
NCOs / Avg. Loans TCE / TA
Median < 0.25% > 7.0%WTBA -0.03% 8.8%
Company Description
Stock Price History LTM P/E History2
Source: SNL Financial Source: SNL Financial
52-Week Range $14 - $21 Annual Dividend $0.643-Mo Avg. Daily Vol. 17,697 Yield 3.4%Stated Book Value $9.05 Price/Book 211%Tangible Book Value $9.05 Price/Tangible Book 211%
EOP Loans (as of 6/30/2015) EOP Deposits (as of 6/30/2015)
1 Accruing TDRs are excluded from NPAs2 P/E multiples above 40x are excluded from chart
Source: Sandler O'Neill + Partners, L.P. and SNL Financial.
West Bancorporation, Inc. is headquartered in West Des Moines, IA. Serving Iowans since 1893, West Bank, awholly-owned subsidiary of West Bancorporation, Inc., is a community bank that focuses on lending, depositservices, and trust services for consumers and small- to medium-sized businesses. West Bank has 8 offices inthe Des Moines metropolitan area; 1 in Iowa City, IA; 1 in Coralville, IA; and 1 office in Rochester, MN.
NPAs1 / Loans and OREO
1.0%0.4%
Commercial27%
Construction, Land & Land
Develop.12%
1-4 Family4%
Home Equity2%
CRE54%
Consumer & Other1%
Noninterest-Bearing Demand
31%
Interest-Bearing Demand
17%
Savings43%
Time > $250k
1%
Other Time8%
74

West Bancorporation, Inc. WTBA
Quarterly Snapshot 0.27
2Q15 1Q15 4Q14 3Q14 2Q14Per Share Data:Diluted EPS $0.33 $0.32 $0.36 $0.32 $0.30Core EPS $0.33 $0.32 $0.34 $0.31 $0.30Book Value Per Share $9.05 $8.96 $8.75 $8.47 $8.25Tangible Book Value Per Share $9.05 $8.96 $8.75 $8.47 $8.25Dividend Per Share $0.16 $0.14 $0.14 $0.12 $0.12Period End Stock Price $19.84 $19.89 $17.02 $14.13 $15.23Average Diluted Shares (millions) 16.1 16.1 16.1 16.0 16.0Shares Outstanding (millions) 16.1 16.0 16.0 16.0 16.0
Performance Ratios:ROA (Core) 1.27% 1.26% 1.39% 1.30% 1.26%ROE (Core) 14.5% 14.4% 15.9% 14.7% 14.6%NIM 3.58% 3.54% 3.65% 3.59% 3.54%Efficiency Ratio 46.9% 48.2% 49.3% 48.3% 48.5%Fee Income/ Operating Revenue 12.4% 12.5% 14.7% 16.5% 16.1%Effective Tax Rate 30.9% 30.8% 2.5% 31.8% 31.5%Dividend Payout Ratio 48.5% 43.8% 38.9% 37.5% 40.0%
Balance Sheet Ratios:Loans/ Deposits 89.1% 86.7% 93.2% 89.9% 85.2%Loans/ Earning Assets 72.9% 71.2% 72.7% 70.5% 69.6%Tangible Equity/ Assets 8.8% 8.7% 8.7% 8.9% 8.6%Securities/ Assets 18.7% 19.9% 21.0% 23.2% 22.8%
Asset Quality Ratios:NPAs/ Assets 0.45% 0.36% 0.35% 0.85% 0.88%Reserve/ Loans 1.18% 1.17% 1.15% 1.23% 1.23%Reserve/ NPAs 262% 323% 326% 144% 139%NCOs/ Average Loans -0.09% -0.09% 0.08% -0.01% 0.08%
Annualized Growth Rates:Gross Loans HFI 11.1% -0.2% 37.8% 2.0% 23.0%Deposits 0.3% 29.9% 21.6% -18.1% 8.5%EPS 12.5% -44.4% 50.0% 26.7% 44.4%
Annual Snapshot2014 2013 2012 2011 2010
Per Share Data:Diluted EPS $1.25 $1.02 $0.92 $0.74 $0.64Core EPS $1.20 $1.02 $0.89 $0.72 $0.64Book Value Per Share $8.75 $7.74 $7.73 $7.09 $6.37Tangible Book Value Per Share $8.75 $7.74 $7.73 $7.09 $6.37Dividend Per Share $0.49 $0.42 $0.36 $0.17 $0.05Period End Stock Price $17.02 $15.82 $10.78 $9.58 $7.79Average Diluted Shares (millions) 16.0 16.6 17.4 17.4 17.4Shares Outstanding (millions) 16.0 16.0 17.4 17.4 17.4
Performance Ratios:ROA (Core) 1.27% 1.17% 1.16% 1.16% 0.86%ROE (Core) 14.6% 13.2% 11.9% 11.1% 9.5%NIM 3.59% 3.48% 3.42% 3.58% 3.04%Efficiency Ratio 49.9% 52.5% 51.5% 49.6% 47.4%Fee Income/ Operating Revenue 15.5% 15.7% 19.5% 17.5% 19.5%Effective Tax Rate 24.9% 30.2% 29.7% 28.5% 28.5%Dividend Payout Ratio 39.2% 41.2% 39.1% 23.0% 7.8%
Balance Sheet Ratios:Loans/ Deposits 93.2% 85.2% 81.7% 87.6% 91.4%Loans/ Earning Assets 72.7% 68.3% 63.6% 65.5% 67.4%Tangible Equity/ Assets 8.7% 8.6% 9.3% 9.7% 11.1%Securities/ Assets 21.0% 24.8% 21.0% 23.2% 20.6%
Asset Quality Ratios:NPAs/ Assets 0.26% 0.73% 1.17% 1.80% 2.55%Reserve/ Loans 1.15% 1.39% 1.67% 1.99% 2.14%Reserve/ NPAs 326% 131% 92% 73% 57%NCOs/ Average Loans 0.09% 0.09% 0.22% 0.34% 0.63%
Annual Growth Rates:Gross Loans HFI 19.4% 6.9% 10.5% -5.6% -12.9%Deposits 9.2% 2.6% 18.5% -1.5% -22.0%EPS 22.5% 10.9% 24.3% 15.6% NM
3-Year EPS CAGR 19.1%5-Year EPS CAGR NMNote: All data as calculated by SNL FinancialSource: SNL Financial
75
APPENDIXWe attest that all of the views expressed in this report accurately reflect our personal views about the securities covered by thisreport as of the date of this report, and that no part of our compensation was, is or will be, directly or indirectly, related to the specificrecommendations or views expressed by us in this report. S/ Mark Fitzgibbon, S/ Casey Orr
IMPORTANT DISCLOSURES:
Sandler O’Neill’s price charts and an explanation of its price targets, valuation methodology,ratings system and related risk factors for the companies covered in this report, along withrequired disclosures regarding certain relationships between those companies and (a) SandlerO’Neill + Partners, L.P. and its affiliates, and (b) the individuals involved in the preparation of thisreport may be obtained by calling Angela Chan or Katherine Esposito at 800-635-6875.
This report has been prepared and issued by Sandler O’Neill. The information contained in this report (exceptinformation regarding Sandler O’Neill and its affiliates) was obtained from various sources which we believe to bereliable, but we do not guarantee its accuracy or completeness. Additional information is available upon request.The information, opinions or recommendations contained in this report speak only as of the date of this report andare subject to change without notice.
Sandler O’Neill generally prohibits research analysts and members of their households from maintaining a financialinterest in securities or options of any company that the analyst covers. Information as to whether Sandler O’Neillwas making a market in securities covered by this report at the time this report was published is available by callingthe toll-free number referred to above.
This report does not constitute an offer, or a solicitation of an offer, to buy or sell any securities or other financialinstruments, including the securities of companies mentioned in this report. This report has been prepared andcirculated for general information only and does not take into account the financial position or particular needs orinvestment objectives of any individual or entity. The securities or strategies discussed in this report may not besuitable for all investors. Investors must make their own determination of the appropriateness of an investment inany securities based on the legal, tax and accounting considerations applicable to such investors and their owninvestment strategy. Investors are cautioned that statements regarding future prospects may not be realized andthat past performance is not necessarily indicative of future performance.
This report or any portion thereof may not be reproduced or redistributed by any person for any purpose without thewritten consent of Sandler O’Neill.
(C) Copyright 2015 Sandler O’Neill + Partners, L.P. All rights reserved.
76
Mark Fitzgibbon, CFA Richard Repetto, CFA Jeffery J. Harte Principal & Principal Principal Director of Research
+ Northeast Banks & Thrifts Mark Fitzgibbon, CFA 212-466-7925 Frank Schiraldi, CFA 212-466-7931
Casey Orr 212-466-8061 Alex Twerdahl 212-466-7916 Anna Barnard 212-466-7921
Robert Haderer, CFA 212-466-7923 Nicholas Cucharale 212-466-7922
+ Midwest Banks & Thrifts R. Scott Siefers 212-466-7924
Brad J. Milsaps, CFA 404-442-2857 Andrew Liesch, CFA 415-978-5031
Matt Forgotson 212-466-8064 Peter Ruiz 404-442-2886
Brendan Nosal 212-466-7918
+ Southeast/Southwest Banks & Thrifts Brad J. Milsaps, CFA 404-442-2857 Stephen Scouten, CFA 404-442-2882
Casey Orr 212-466-8061 Robert Haderer, CFA 212-466-7923
+ West Coast Banks & Thrifts Tim O’Brien 415-978-5033 Aaron Deer 415-978-5032
Brad J. Milsaps, CFA 404-442-2857 Andrew Liesch, CFA 415-978-5031 Alexander Morris 415-978-5034
+ Asset Manager Michael S. Kim 212-466-7722 Andrew Disdier 212-466-7805
+ eFinance
Richard Repetto, CFA 212-466-7906 Michael Adams, CFA 212-466-7962
Collin Cook 212-466-8065
+ Financial Technology & Specialty Finance
Christopher Donat, CFA 212-466-8068 Crispin Love 212-466-7938
+ Insurance Paul Newsome 312-281-3445 John Barnidge 312-281-3412
+ Investment, Global, and Trust Banks Jeffery Harte 312-281-3443 Sumeet Mody 312-281-3414
+ Real Estate Alexander Goldfarb 212-466-7937 Ryan Peterson 212-466-7927