san joaquin valley drainage monitoring program 2000 · san joaquin valley drainage monitoring...
TRANSCRIPT
State of California The Resources Agency
DEPARTMENT OF WATER RESOURCES San Joaquin District
SAN JOAQUIN VALLEY DRAINAGE MONITORING PROGRAM
2000
District Report
September 2003 GRAY DAVIS MARY D. NICHOLS MICHAEL J. SPEAR Governor Secretary for Resources Interim Director State of California The Resources Agency Department of Water Resources
iii
FOREWORD The purpose of this annual report is to share valuable information about agricultural drainage water. This report is distributed to interested parties to expand the understanding of drainage problem areas, groundwater impacts and water quality trends resulting from agricultural drainage practices. The Drainage Monitoring and Evaluation Program is a cooperative effort of State, federal and local agencies. Data on the quality and quantity of drainage water and areal plotting of shallow groundwater are collected, assembled, analyzed, and disseminated. DWR collects shallow groundwater data and monitors about 30 drainage sump systems for flow and water quality constituents including sodium, calcium, total dissolved solids, selenium and other targeted constituents. The constituents are investigated for trends that show the results of irrigation and drainage management practices. Data from over ten other agencies are combined with DWR data and summarized in this report. In addition, a shallow groundwater map is drawn from measurements of over 1,300 wells to show groundwater levels to identify present and potential problem drainage areas due to encroachment into the root zone of crops. In comparison to the 1999 Drainage Monitoring Report, this report includes trend analyses and figures for the cations sodium, calcium, and magnesium. Furthermore, tables listing mineral analytical results for the central and southern area drains are relocated as separate appendices, whereas in past reports the mineral tables were part of the main body. To improve its ongoing data-gathering efforts, the Department of Water Resources invites water resources specialists to participate in discussing and commenting on the scope of this report.
Paula J. Landis, Chief San Joaquin District
v
CONTENTS Page FOREWORD.............................................................................................................................. iii ORGANIZATION...................................................................................................................... ix INTRODUCTION...................................................................................................................... 1 THE DRAINAGE PROBLEM .................................................................................................... 2 DRAINAGE PROBLEM AREAS............................................................................................... 3 2000 DRAINAGE MONITORING PROGRAM........................................................................ 5 Flows .................................................................................................................................... 9
Mineral Constituent Concentrations ........................................................................................ 10
Pesticides............................................................................................................................... 25
Nutrients................................................................................................................................ 25
Trace Elements ...................................................................................................................... 25
Selenium................................................................................................................................ 26
Trends................................................................................................................................... 27
DWR'S FUTURE MONITORING PROGRAM......................................................................... 31 BIBLIOGRAPHY....................................................................................................................... 79 SYMBOLS, ABBREVIATIONS, and FORMULAS ................................................................. 80
Tables
1 Acreages of Present and Potential Drainage Problems, 1991-2000 .................................... 4 2 Drainage Monitoring Stations, 2000.................................................................................. 5 3 Subsurface Drain Flows, 2000 ......................................................................................... 9 4 Summary of Minerals Detected, 2000............................................................................... 11 5 Drainage Water Salt Compositions, 1986 and 2000.......................................................... 12
vi
Tables (continued)
Page 6 Calcium in Subsurface Drains, 1986-2000......................................................................... 16 7 Magnesium in Subsurface Drains, 1986-2000.................................................................... 19 8 Sodium in Subsurface Drains, 1986-2000.......................................................................... 22 9 Selenium in Subsurface Drains, 1986-2000........................................................................ 26 10 Cation Trend Line Data, Central Drains ............................................................................. 28 11 Cation Trend Line Data, Lemoore-Corcoran Stations ........................................................ 29 12 Cation Trend Line Data, Lost-Hills Semitropic Stations...................................................... 30 13 Cation Trend Line Data, Kern Lakebed Stations................................................................ 30
Figures
1 Overview of Sampling Area Locations.............................................................................. 6 2 Central Area Drain Locations ........................................................................................... 7 3 Southern Area Drain Locations......................................................................................... 8 4 Lemoore-Corcoran
Salt Composition Percentages, 2000 ................................................................................ 13 5 Lost Hills-Semitropic
Salt Composition Percentages, 2000 ................................................................................ 13 6 Kern Lakebed
Salt Composition Percentages, 2000 ................................................................................ 14 7 Central Subsurface Drain
Salt Composition Percentages, 2000 ................................................................................ 14 8 Surface Drain CTL 4504
Salt Composition Percentages, 2000 ................................................................................ 15 9 Surface Drain DPS 3235
Salt Composition Percentages, 2000 ................................................................................ 15
vii
Figures (continued)
Page
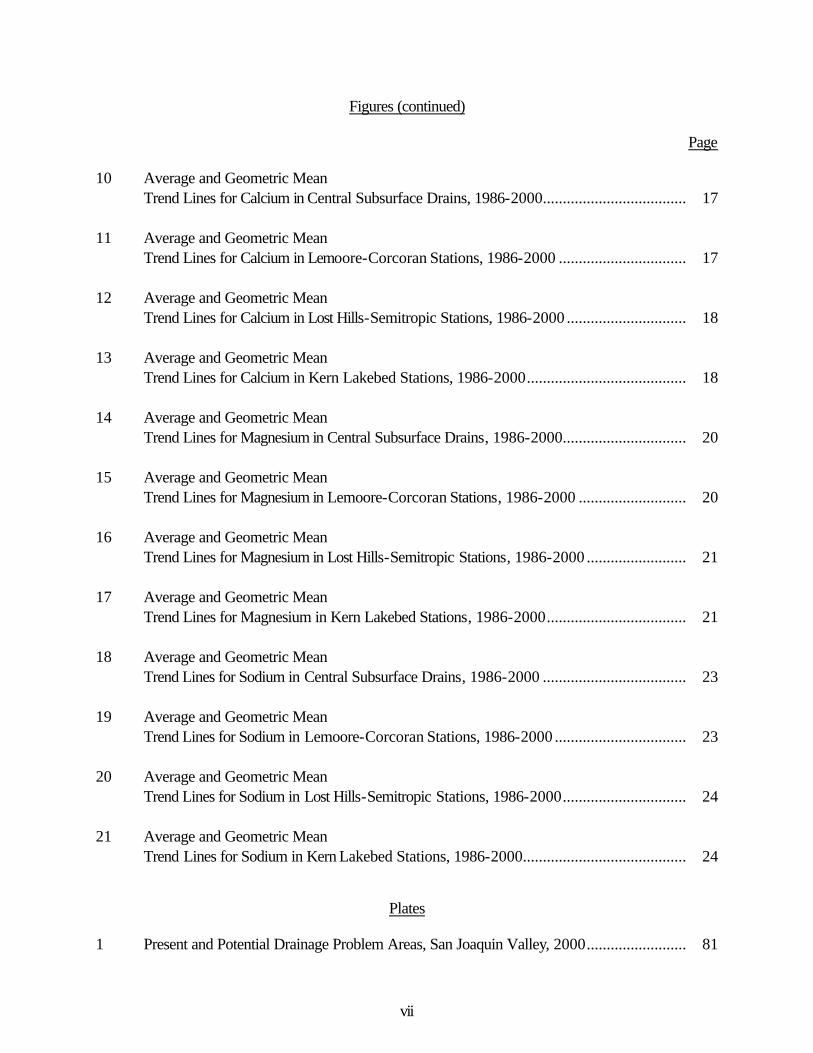
10 Average and Geometric Mean Trend Lines for Calcium in Central Subsurface Drains, 1986-2000.................................... 17
11 Average and Geometric Mean
Trend Lines for Calcium in Lemoore-Corcoran Stations, 1986-2000 ................................ 17 12 Average and Geometric Mean Trend Lines for Calcium in Lost Hills-Semitropic Stations, 1986-2000 .............................. 18 13 Average and Geometric Mean Trend Lines for Calcium in Kern Lakebed Stations, 1986-2000........................................ 18 14 Average and Geometric Mean
Trend Lines for Magnesium in Central Subsurface Drains, 1986-2000............................... 20 15 Average and Geometric Mean Trend Lines for Magnesium in Lemoore-Corcoran Stations, 1986-2000 ........................... 20 16 Average and Geometric Mean Trend Lines for Magnesium in Lost Hills-Semitropic Stations, 1986-2000 ......................... 21 17 Average and Geometric Mean Trend Lines for Magnesium in Kern Lakebed Stations, 1986-2000................................... 21 18 Average and Geometric Mean Trend Lines for Sodium in Central Subsurface Drains, 1986-2000 .................................... 23 19 Average and Geometric Mean Trend Lines for Sodium in Lemoore-Corcoran Stations, 1986-2000 ................................. 23 20 Average and Geometric Mean Trend Lines for Sodium in Lost Hills-Semitropic Stations, 1986-2000............................... 24 21 Average and Geometric Mean Trend Lines for Sodium in Kern Lakebed Stations, 1986-2000......................................... 24
Plates 1 Present and Potential Drainage Problem Areas, San Joaquin Valley, 2000......................... 81
viii
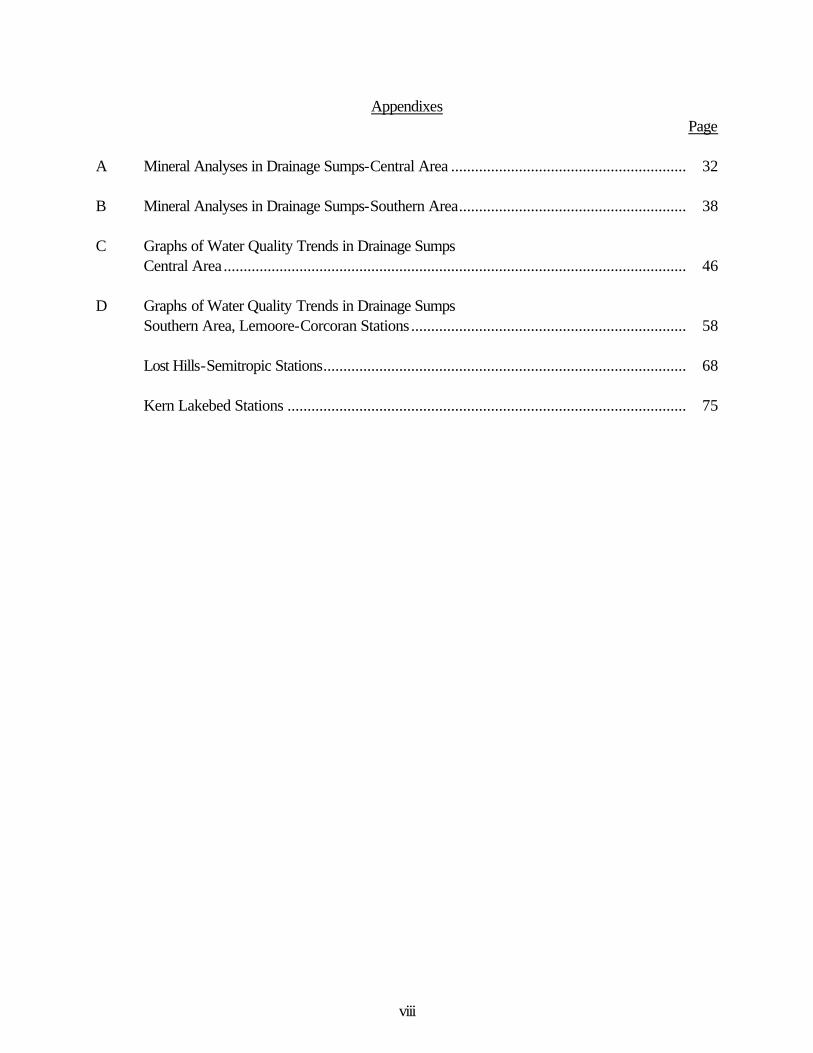
Appendixes Page A Mineral Analyses in Drainage Sumps-Central Area ........................................................... 32 B Mineral Analyses in Drainage Sumps-Southern Area......................................................... 38 C Graphs of Water Quality Trends in Drainage Sumps Central Area.................................................................................................................... 46 D Graphs of Water Quality Trends in Drainage Sumps Southern Area, Lemoore-Corcoran Stations ..................................................................... 58 Lost Hills-Semitropic Stations........................................................................................... 68 Kern Lakebed Stations .................................................................................................... 75
ix
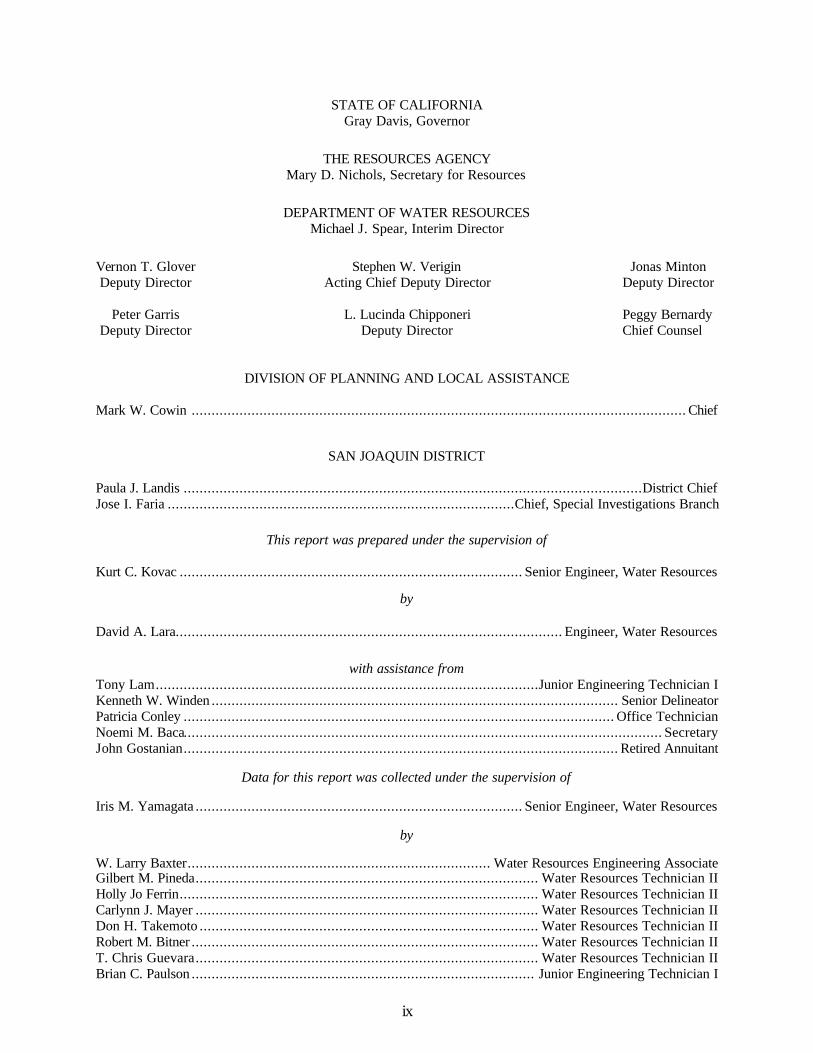
STATE OF CALIFORNIA Gray Davis, Governor
THE RESOURCES AGENCY
Mary D. Nichols, Secretary for Resources
DEPARTMENT OF WATER RESOURCES
Michael J. Spear, Interim Director
Vernon T. Glover Stephen W. Verigin Jonas Minton Deputy Director Acting Chief Deputy Director Deputy Director Peter Garris L. Lucinda Chipponeri Peggy Bernardy Deputy Director Deputy Director Chief Counsel
DIVISION OF PLANNING AND LOCAL ASSISTANCE Mark W. Cowin ............................................................................................................................ Chief
SAN JOAQUIN DISTRICT Paula J. Landis ...................................................................................................................District Chief Jose I. Faria .......................................................................................Chief, Special Investigations Branch
This report was prepared under the supervision of Kurt C. Kovac ...................................................................................... Senior Engineer, Water Resources
by
David A. Lara................................................................................................. Engineer, Water Resources
with assistance from Tony Lam................................................................................................Junior Engineering Technician I Kenneth W. Winden ...................................................................................................... Senior Delineator Patricia Conley ............................................................................................................ Office Technician Noemi M. Baca........................................................................................................................ Secretary John Gostanian............................................................................................................. Retired Annuitant
Data for this report was collected under the supervision of
Iris M. Yamagata .................................................................................. Senior Engineer, Water Resources
by
W. Larry Baxter............................................................................ Water Resources Engineering Associate Gilbert M. Pineda...................................................................................... Water Resources Technician II Holly Jo Ferrin.......................................................................................... Water Resources Technician II Carlynn J. Mayer ...................................................................................... Water Resources Technician II Don H. Takemoto ..................................................................................... Water Resources Technician II Robert M. Bitner ....................................................................................... Water Resources Technician II T. Chris Guevara...................................................................................... Water Resources Technician II Brian C. Paulson ...................................................................................... Junior Engineering Technician I
1
INTRODUCTION In 1959, the California Department of Water Resources began monitoring agricultural drainage water in the San Joaquin Valley. Initial monitoring efforts (1959 to 1963) focused on mineral analyses. In 1963, the monitoring program became part of the San Joaquin Drainage Investigation and included analyses for pesticides both in surface and subsurface drainage waters. From 1966 to 1969, intensive nutrient sampling became a part of the investigation. Although the San Joaquin Drainage Investigation ended in 1970, monitoring continued as a separate departmental activity until 1975 when the Department of Water Resources (DWR), the U.S. Bureau of Reclamation (USBR), and the State Water Resources Control Board (SWRCB) formed the Interagency Drainage Program. The program continued until 1979 when monitoring resumed as a separate activity under DWR’s Agricultural Drainage Program. The discovery in 1983 of migratory bird deaths and deformities linked to high selenium levels in drainage water at Kesterson Reservoir focused national attention on drainage of the San Luis Drain and drainage-related problems. This discovery resulted in an interagency drainage study. In 1984, the San Joaquin Valley Drainage Program (SJVDP) was established to investigate and identify possible solutions to drainage and drainage-related problems. The SJVDP is a cooperative federal-State program established by the Secretary of the Interior and the Governor of California. Cooperating agencies are DWR, California Department of Fish and Game, USBR, U.S. Fish and Wildlife Service, and the U.S. Geological Survey. The SJVDP developed a comprehensive study entitled A Management Plan for Agricultural Subsurface Drainage and Related Problems on the Westside San Joaquin Valley, also known as the “Rainbow Report” (September 1990). This report summarizes the results of subsurface agricultural drainage problems and presents a plan for managing drainage problems. In 1991, federal and State agencies initiated the San Joaquin Valley Drainage Implementation Program to pick up where SJVDP left off. Four federal agencies (USBR, USFWS, USGS, and Natural Resources Conservation Service) and four State agencies (DFG, DWR, Department of Food and Agriculture, and SWRCB) signed a memorandum of understanding and released an implementation strategy in December 1991. They agreed to (1) work together and identify specific tasks associated with responsible parties, (2) seek needed funding and authority, and (3) set schedules for implementing all components of the SJVDP 1990 Plan. The MOU and all the agencies involved recognize that the success of the program depends upon local districts and irrigators to carry out effective drainage management measures. Because drainage is a regional problem, federal and State agencies will continue to coordinate efforts. The DWR drainage monitoring program is continuously being evaluated and modified to meet the needs of the implementation strategy.
2
THE DRAINAGE PROBLEM The San Joaquin Valley, one of the world’s most productive agricultural regions, has experienced mounting problems with the management and disposal of agricultural drainage water. The drainage problem is an outgrowth of naturally saline soils and imported water, as well as the valley’s distinctive geological makeup, which prevents effective natural drainage in certain areas. Soils on the western side of the valley are derived from the marine sediments that make up the Coast Range. These soils, high in salts and trace elements, are similar to those that occur in a marine environment. In addition, much of the valley is underlain by a shallow, clay layer that obstructs vertical movement of irrigation water. As salts and minerals from surface soils are leached into the groundwater, the water table rises to within a few feet of the surface and into the root zone. Unless this water is removed, crops growing in these soils eventually die. In the late 1940s, farmers began installing subsurface drains in fields with drainage problems. By 1965, 330 miles of subsurface drains and 750 miles of open ditch drains were in operation in the valley delivering drainage water to evaporation ponds and other discharge sites. With this drainage network in operation, the main problem became how to manage and dispose of the salty drain water. The original plan was to construct a master drain (the San Luis Drain) to collect the water and route it out of the valley into the Sacramento-San Joaquin River Delta. By 1973, an 87-mile-long section of the San Luis Drain was receiving irrigation runoff and discharging into Kesterson Reservoir. The plan was to extend the drain north to a discharge site in the Delta. Kesterson Reservoir was to regulate discharges going to the Delta and provide a wetland habitat. The San Luis Drain was never completed and drainage accumulated at Kesterson Reservoir. In 1982, federal studies reported high selenium levels in fish taken from Kesterson. In 1983, federal-State studies determined that the bioaccumulation of selenium was causing deformities in embryos of waterfowl nesting at the reservoir. In 1985, the U.S. Department of the Interior ordered a halt to drainage water discharges into the San Luis Drain and Kesterson Reservoir, even though irrigation water deliveries to west side agricultural lands continued. Today, the future of the master drain remains in doubt. Practices of disposing and managing drainage water are being scrutinized for their impacts on the environment. Management practices such as source control, drainage reuse, groundwater management, integrated on-farm drainage management, and others identified in the “Rainbow Report” are being implemented. Monitoring of shallow groundwater and agricultural drainage water is an integral activity to determine the effectiveness of these management practices.
3
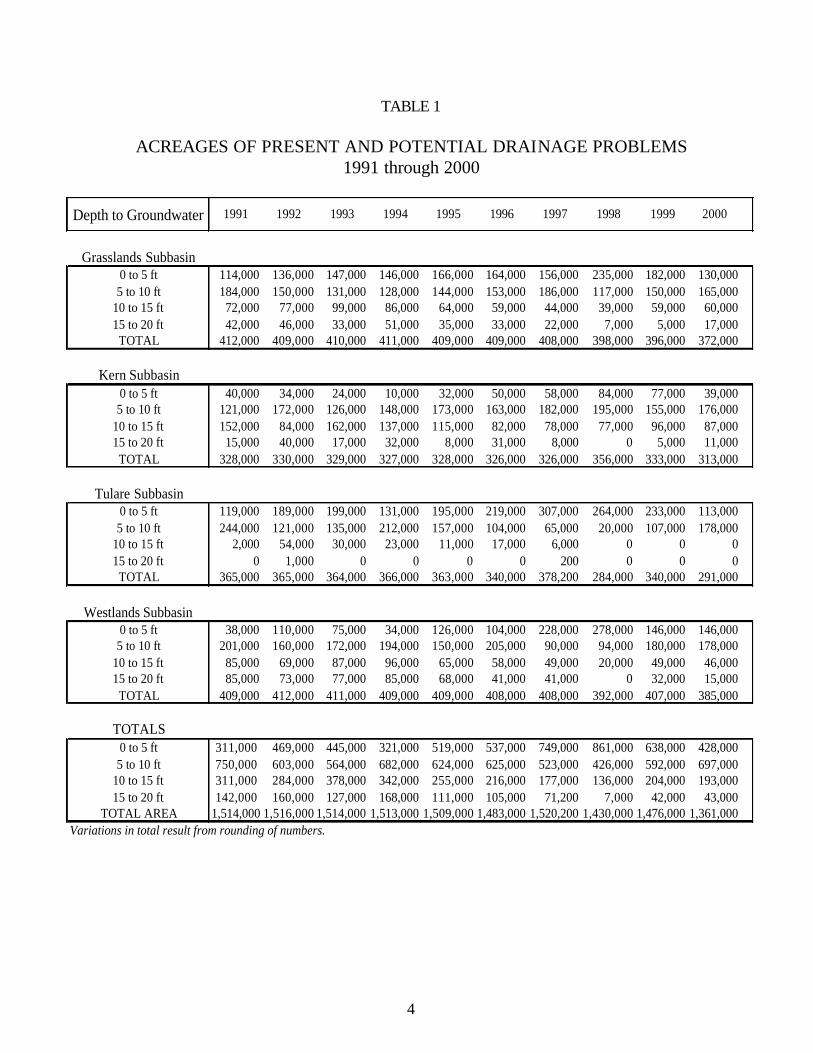
DRAINAGE PROBLEM AREAS The San Joaquin Valley is a rich agricultural region that encompasses large areas with high water tables. Irrigation practices, cropping patterns, seepage from unlined ditches or ponds, soil type, geology, and other factors influence the elevations of these water tables. Since the importation of water for irrigation, inadequate drainage and accumulating salts have been persistent problems in parts of the valley. The poor natural drainage conditions, coupled with rising groundwater levels and increasing soil salinity, have meant that various soils could no longer produce crops, and some farms within the problem area have been abandoned. In this report “present problem area” is defined as a location where the water table is within 5 feet of the ground surface at any time during the year. A "potential problem area" indicates the water table is between 5 and 20 feet below the ground surface. Present and potential drainage problem areas are established by planimetering within specific intervals from DWR's annual "Present and Potential Drainage Problem Area" map (Plate 1). Beginning with the 1991 map, study area boundaries were drawn and a standard method of data collection was established. Within the boundaries a network of monitoring wells interpret the water levels to establish acreage areas of the particular depth-to-water intervals. Plate 1 displays an overview of the respective depth-to-water intervals, as well as the boundaries of study for Grasslands, Westlands, Tulare, and Kern Sub basins. Table 1, Acreages of Present and Potential Drainage Problems, lists the acreage of drainage problems within the study for the years 1991 through 2000. In preparing Plate 1, DWR did not take into account items such as existing drainage systems, wildlife refuges, urban areas, pasture land, native vegetation, data-poor areas, and the outer boundary. This report provides information on the extent of drainage conditions; therefore, other factors must be considered when making projections about areas that will require drainage systems in the future.
4
TABLE 1
ACREAGES OF PRESENT AND POTENTIAL DRAINAGE PROBLEMS 1991 through 2000
0 to 5 ft 114,000 136,000 147,000 146,000 166,000 164,000 156,000 235,000 182,000 130,0005 to 10 ft 184,000 150,000 131,000 128,000 144,000 153,000 186,000 117,000 150,000 165,000
10 to 15 ft 72,000 77,000 99,000 86,000 64,000 59,000 44,000 39,000 59,000 60,00015 to 20 ft 42,000 46,000 33,000 51,000 35,000 33,000 22,000 7,000 5,000 17,000TOTAL 412,000 409,000 410,000 411,000 409,000 409,000 408,000 398,000 396,000 372,000
Kern Subbasin0 to 5 ft 40,000 34,000 24,000 10,000 32,000 50,000 58,000 84,000 77,000 39,0005 to 10 ft 121,000 172,000 126,000 148,000 173,000 163,000 182,000 195,000 155,000 176,000
10 to 15 ft 152,000 84,000 162,000 137,000 115,000 82,000 78,000 77,000 96,000 87,00015 to 20 ft 15,000 40,000 17,000 32,000 8,000 31,000 8,000 0 5,000 11,000TOTAL 328,000 330,000 329,000 327,000 328,000 326,000 326,000 356,000 333,000 313,000
0 to 5 ft 119,000 189,000 199,000 131,000 195,000 219,000 307,000 264,000 233,000 113,0005 to 10 ft 244,000 121,000 135,000 212,000 157,000 104,000 65,000 20,000 107,000 178,000
10 to 15 ft 2,000 54,000 30,000 23,000 11,000 17,000 6,000 0 0 015 to 20 ft 0 1,000 0 0 0 0 200 0 0 0TOTAL 365,000 365,000 364,000 366,000 363,000 340,000 378,200 284,000 340,000 291,000
0 to 5 ft 38,000 110,000 75,000 34,000 126,000 104,000 228,000 278,000 146,000 146,0005 to 10 ft 201,000 160,000 172,000 194,000 150,000 205,000 90,000 94,000 180,000 178,000
10 to 15 ft 85,000 69,000 87,000 96,000 65,000 58,000 49,000 20,000 49,000 46,00015 to 20 ft 85,000 73,000 77,000 85,000 68,000 41,000 41,000 0 32,000 15,000TOTAL 409,000 412,000 411,000 409,000 409,000 408,000 408,000 392,000 407,000 385,000
0 to 5 ft 311,000 469,000 445,000 321,000 519,000 537,000 749,000 861,000 638,000 428,0005 to 10 ft 750,000 603,000 564,000 682,000 624,000 625,000 523,000 426,000 592,000 697,000
10 to 15 ft 311,000 284,000 378,000 342,000 255,000 216,000 177,000 136,000 204,000 193,00015 to 20 ft 142,000 160,000 127,000 168,000 111,000 105,000 71,200 7,000 42,000 43,000
TOTAL AREA 1,514,000 1,516,000 1,514,000 1,513,000 1,509,000 1,483,000 1,520,200 1,430,000 1,476,000 1,361,000
Westlands Subbasin
TOTALS
Variations in total result from rounding of numbers.
20001998 1999
Grasslands Subbasin
Tulare Subbasin
1994 1995 1996 1997Depth to Groundwater 1991 1992 1993
5
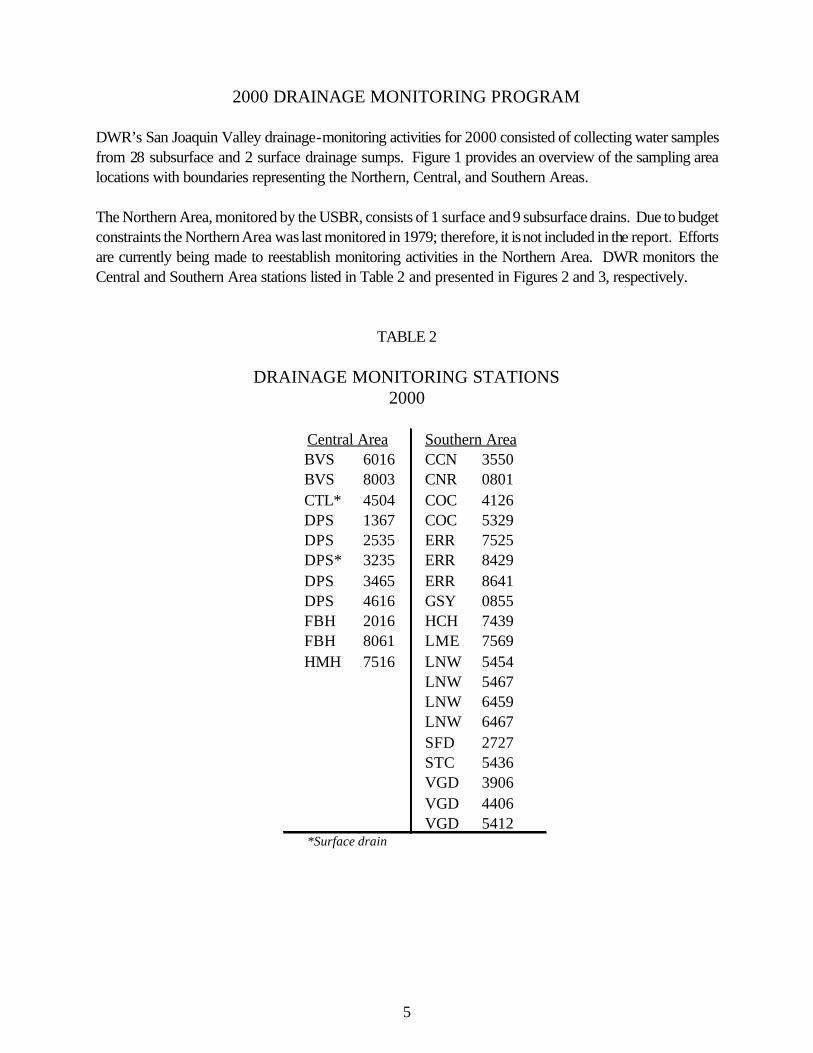
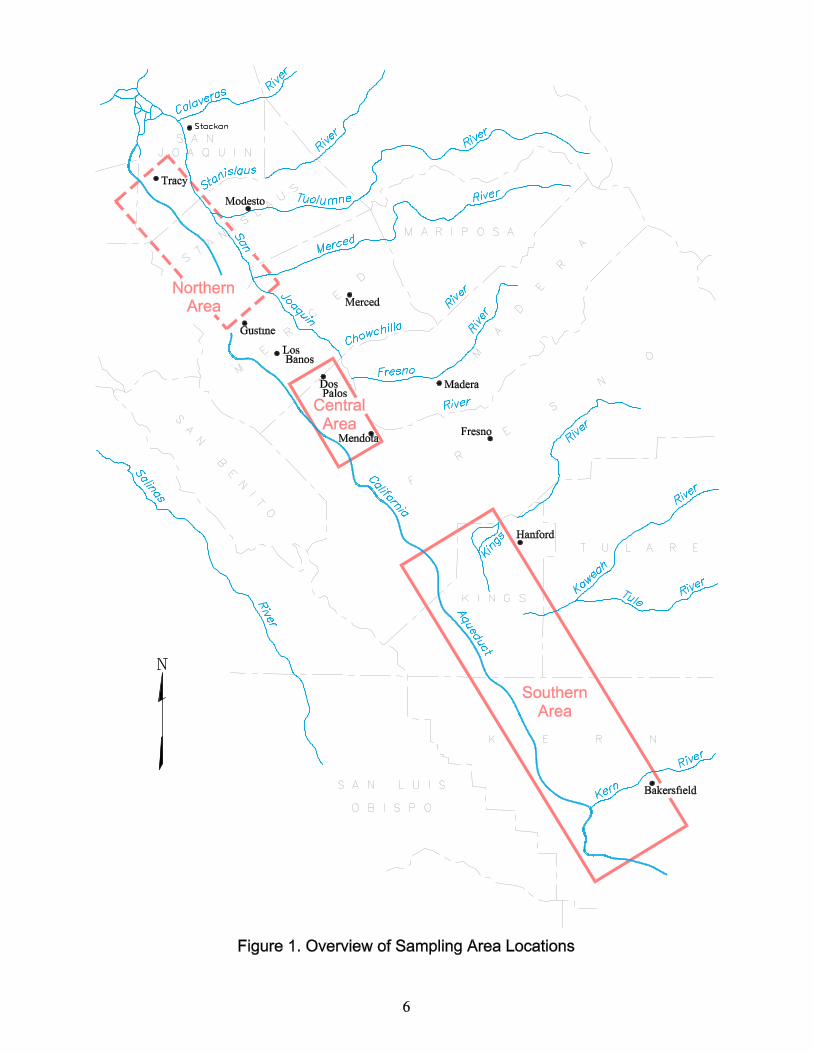
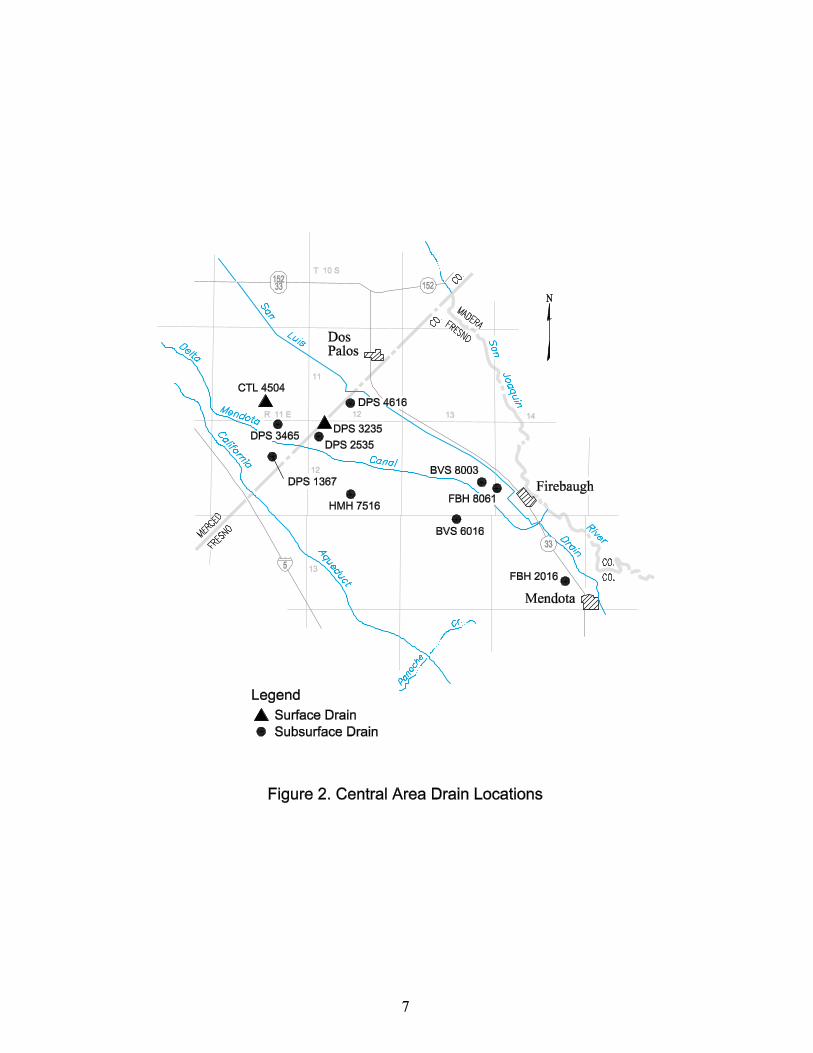
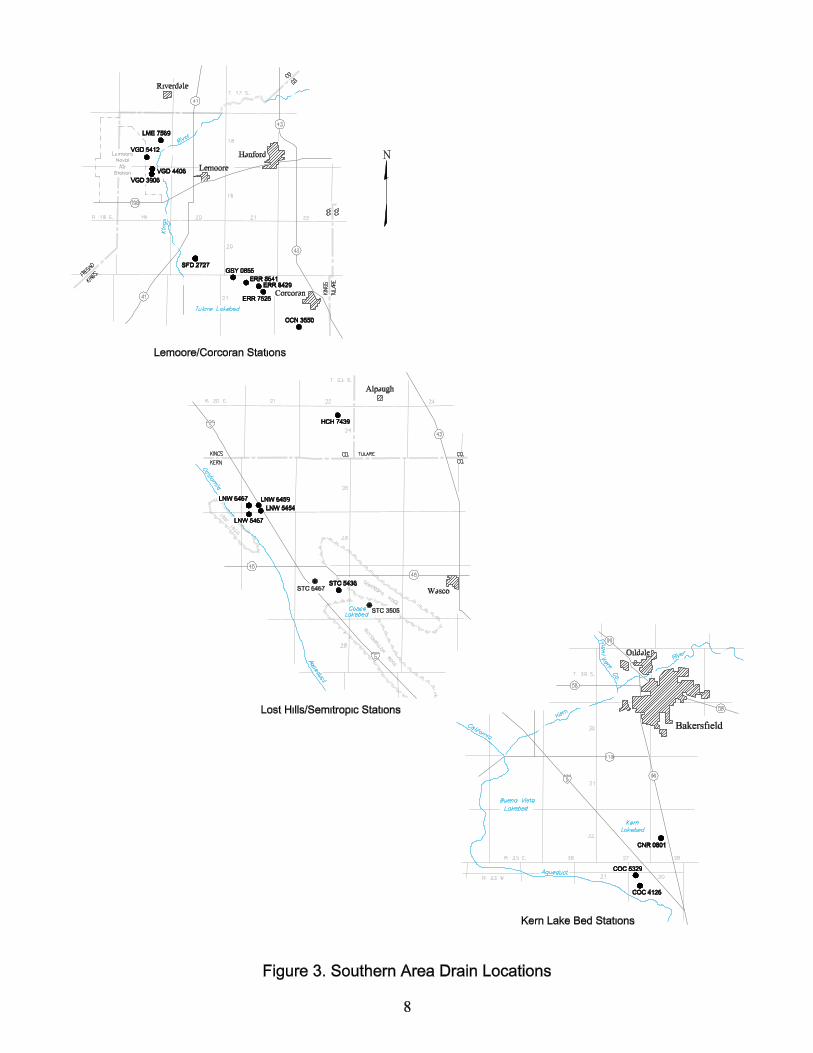
2000 DRAINAGE MONITORING PROGRAM DWR’s San Joaquin Valley drainage-monitoring activities for 2000 consisted of collecting water samples from 28 subsurface and 2 surface drainage sumps. Figure 1 provides an overview of the sampling area locations with boundaries representing the Northern, Central, and Southern Areas. The Northern Area, monitored by the USBR, consists of 1 surface and 9 subsurface drains. Due to budget constraints the Northern Area was last monitored in 1979; therefore, it is not included in the report. Efforts are currently being made to reestablish monitoring activities in the Northern Area. DWR monitors the Central and Southern Area stations listed in Table 2 and presented in Figures 2 and 3, respectively.
TABLE 2
DRAINAGE MONITORING STATIONS 2000
BVS 6016 CCN 3550 BVS 8003 CNR 0801 CTL* 4504 COC 4126 DPS 1367 COC 5329 DPS 2535 ERR 7525 DPS* 3235 ERR 8429 DPS 3465 ERR 8641 DPS 4616 GSY 0855 FBH 2016 HCH 7439 FBH 8061 LME 7569 HMH 7516 LNW 5454
LNW 5467LNW 6459LNW 6467SFD 2727STC 5436VGD 3906VGD 4406VGD 5412
*Surface drain
Central Area Southern Area
9
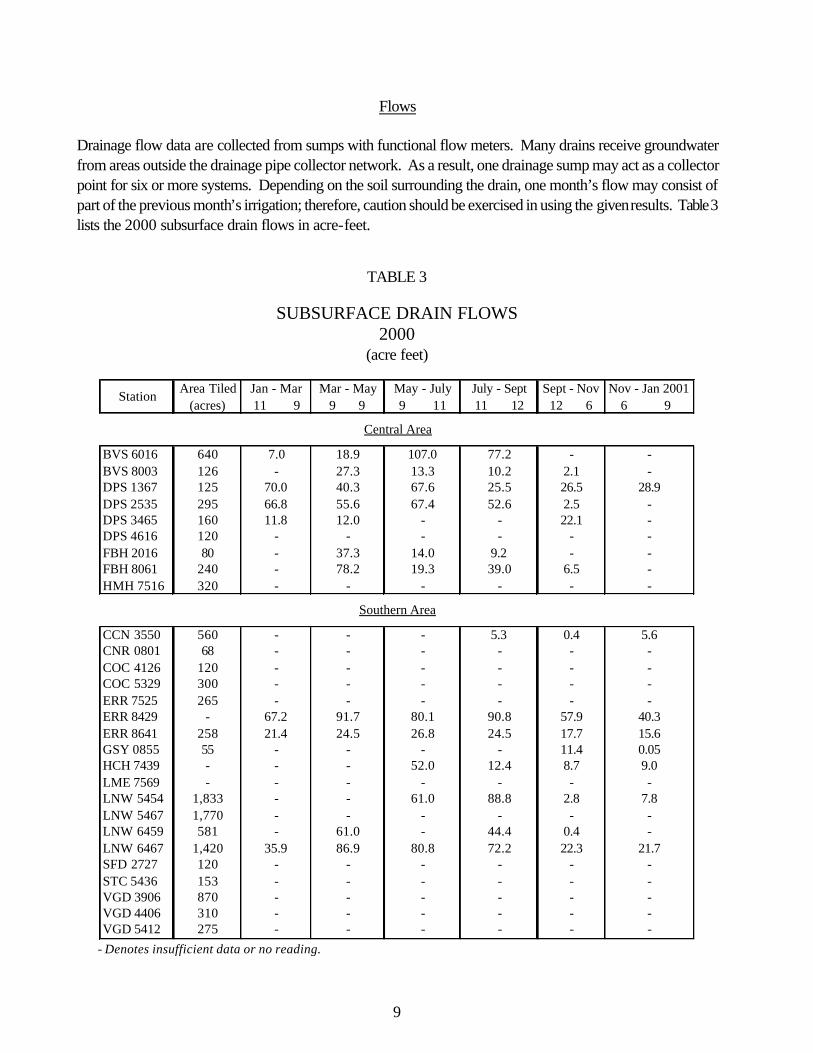
Flows Drainage flow data are collected from sumps with functional flow meters. Many drains receive groundwater from areas outside the drainage pipe collector network. As a result, one drainage sump may act as a collector point for six or more systems. Depending on the soil surrounding the drain, one month’s flow may consist of part of the previous month’s irrigation; therefore, caution should be exercised in using the given results. Table 3 lists the 2000 subsurface drain flows in acre-feet.
TABLE 3
SUBSURFACE DRAIN FLOWS 2000
(acre feet)
Area Tiled Jan - Mar Mar - May May - July July - Sept Sept - Nov Nov - Jan 2001(acres) 11 9 9 9 9 11 11 12 12 6 6 9
BVS 6016 640 7.0 18.9 107.0 77.2 - -BVS 8003 126 - 27.3 13.3 10.2 2.1 -DPS 1367 125 70.0 40.3 67.6 25.5 26.5 28.9DPS 2535 295 66.8 55.6 67.4 52.6 2.5 -DPS 3465 160 11.8 12.0 - - 22.1 -DPS 4616 120 - - - - - -FBH 2016 80 - 37.3 14.0 9.2 - -FBH 8061 240 - 78.2 19.3 39.0 6.5 -HMH 7516 320 - - - - - -
CCN 3550 560 - - - 5.3 0.4 5.6CNR 0801 68 - - - - - -COC 4126 120 - - - - - -COC 5329 300 - - - - - -ERR 7525 265 - - - - - -ERR 8429 - 67.2 91.7 80.1 90.8 57.9 40.3ERR 8641 258 21.4 24.5 26.8 24.5 17.7 15.6GSY 0855 55 - - - - 11.4 0.05HCH 7439 - - - 52.0 12.4 8.7 9.0LME 7569 - - - - - - -LNW 5454 1,833 - - 61.0 88.8 2.8 7.8LNW 5467 1,770 - - - - - -LNW 6459 581 - 61.0 - 44.4 0.4 -LNW 6467 1,420 35.9 86.9 80.8 72.2 22.3 21.7SFD 2727 120 - - - - - -STC 5436 153 - - - - - -VGD 3906 870 - - - - - -VGD 4406 310 - - - - - -VGD 5412 275 - - - - - -
Station
Central Area
Southern Area
- Denotes insufficient data or no reading.
10
Mineral Constituent Concentrations
The report investigates individual minerals and associated salts from a cation perspective. Historical data have provided the opportunity to analyze sodium, calcium, and magnesium for trends. Also, since cations are featured in the report, charts are provided showing the salt composition of the water for a particular area or surface drain. Two averages are presented in the report: arithmetic average and geometric mean. The arithmetic average is the average of all data obtained for the given period, whereas the geometric mean (extensively used by regulatory agencies) gives an average of central tendency that is less influenced by spiked values in the data set. The Southern Area is divided into three sub-areas because evaluation of the Southern Area as a congregate distorts the results of the individual sub-areas. The stations in the sub-areas were determined by their proximity to one another along with the idea that geologic attributes are similar because of proximity. The sub-areas are named Lemoore-Corcoran, Lost Hills-Semitropic, and Kern Lakebed. All natural waters, including drainage water, contain a matrix of dissolved mineral substances that can be divided into two categories: cations and anions. Cations are positively charged ions and are usually metals. Anions are negatively charged ions and are acids, or acid radicals. Common cations monitored are sodium, calcium, magnesium, and potassium. Common anions monitored are bicarbonate, carbonate, sulfate, chloride, nitrate, and boron. Both cations and anions combine to form salts and should be in balance for a given water analysis. The more prevalent salts in the drainage water matrix are sodium sulfate, sodium chloride, calcium carbonate, calcium sulfate, calcium chloride, magnesium sulfate, and magnesium chloride, while potassium chloride, potassium sulfate and others make up the balance. In addition, cations are used to calculate the water quality indices of the sodium adsorption ratio (SAR) and total hardness, as well as determine the physical and chemical properties of soil. The salinity in water is measured as either total dissolved solids (TDS) in milligrams per liter (mg/L) or electrical conductivity (EC) in microsiemens per centimeter (µS/cm). In practice, EC is a measure of the ability to conduct an electrical current through a given solution and is used to indicate the total salt content or TDS for a given water at a specific site. The more salts in the water, the better conductor it becomes. The strength of the electrical current is dependent upon the temperature of the solution and type and concentration of ion within the solution. The standard practice, as used in this report, is to adjust EC measurements to 75oF (25oC). TDS and EC, in conjunction with other parameters such as SAR and total hardness, are used to determine the suitability of water for agriculture. The SAR was established to determine water permeability concerns. The sodium in a high SAR value water replaces the more beneficial calcium and magnesium ions in the soil. This exchange alters the soil structure causing the soil to slake, resulting in a loss of porosity, and reducing the infiltration rate of the applied water through the soil. In general, irrigation waters having SAR values less than 3 are low risk. Some salt tolerant crops may have SAR values as high as 16. Considerable care is recommended for values greater than 6 when reusing agricultural drainage water for irrigation purposes.
11
Total hardness is a water quality parameter used to determine the suitability of water for agriculture. Problems arise with the formation of scale inside pipelines and irrigation equipment with the use of water high in hardness. Hardness refers to the capacity of water to precipitate soap and is defined as the sum of calcium and magnesium concentrations. Even though other polyvalent cations (iron, manganese, copper, lead, zinc, and other trace elements) contribute to hardness, they are usually of minute quantities and are neglected. A summary of the mineral constituents analyzed along with total hardness and SAR values for the stated area, sub-area or surface drain are provided in Table 4. A complete listing of mineral results for each station is given in Appendixes A and B.
TABLE 4
SUMMARY OF MINERALS DETECTED 2000
(milligrams per Liter)
Arithmetic Geometric Arithmetic Geometric Average Mean Average Mean
Boron 0.1 38 11 4.6 2.5 39 11 9.4Calcium 44 410 244 207 221 634 413 400Hardness (as CaCO3) 209 7,450 1,922 1,375 770 2,292 1,659 1,603Magnesium 23 816 286 189 53 291 153 140Nitrate 1.9 86 40 30 5.6 228 109 82Potassium 1.7 22 7.5 6.2 2.1 8.0 4.3 4.0SAR 3.3 57 27 22 0.1 17 9.6 7.9Sodium 122 8,420 2,761 1,878 193 1,710 944 840TDS 739 30,860 11,147 7,769 1,606 8,120 5,124 4,797Lab EC (µS/cm) 1,030 29,900 12,173 9,247 2,010 9,910 6,293 5,969
Boron 3.2 50 23 17 0.2 1.1 0.5 0.4Calcium 63 614 365 280 20 53 31 29Hardness (as CaCO3) 330 2,946 1,590 1,271 98 215 139 134Magnesium 42 343 165 134 11 20 15 15Nitrate 1.4 280 133 63 1.2 5.9 3.5 3.1Potassium 1.8 11 5.3 4.8 1.8 3.2 2.4 2.4SAR 19 97 42 38 1.9 2.7 2.4 2.4Sodium 909 9,210 3,661 3,118 44 84 65 64TDS 2,900 30,000 13,094 11,209 231 550 365 351Lab EC (µS/cm) 4,290 36,500 16,379 14,374 406 926 619 598
Boron 2.4 25 10 7.0 7.5 8.6 8.1 8.0Calcium 336 594 511 501 274 370 337 336Hardness (as CaCO3) 1,785 2,260 2,089 2,085 994 1,340 1,225 1,219Magnesium 123 307 197 189 75 101 93 92Nitrate 165 418 276 268 80 159 124 121Potassium 2.5 61 18 9.2 2.5 5.0 4.4 4.2SAR 4.9 20 11 10 7.7 8.8 8.0 8.0Sodium 505 2,130 1,168 1,034 558 737 647 645TDS 4,254 9,472 6,526 6,279 2,990 3,840 3,574 3,562Lab EC (µS/cm) 4,820 10,580 7,354 7,060 4,020 4,970 4,722 4,709
ElementSouthern Area Central Area
Minimum Maximum Minimum Maximum
Lemoore-Corcoran Stations
Surface Drain DPS 3235
Lost Hills-Semitropic Stations
Kern Lakebed Stations
Subsurface Drains
Surface Drain CTL 4504
No surface drains within the Southern Area.
12
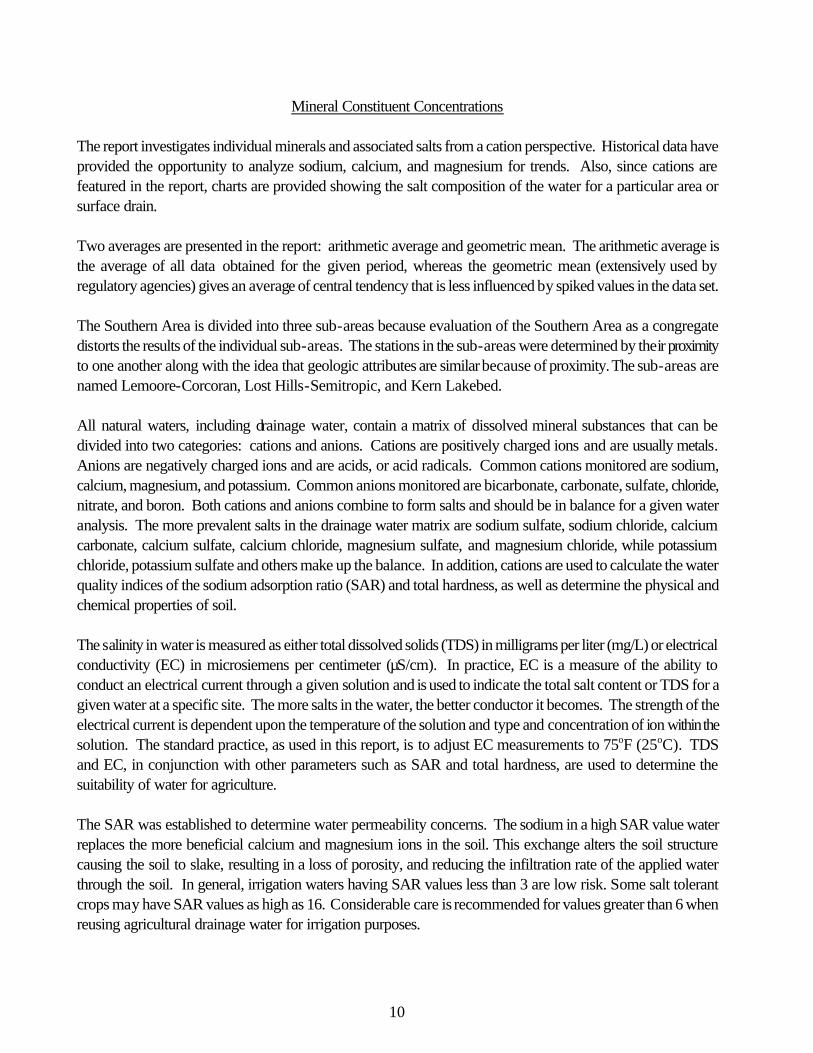
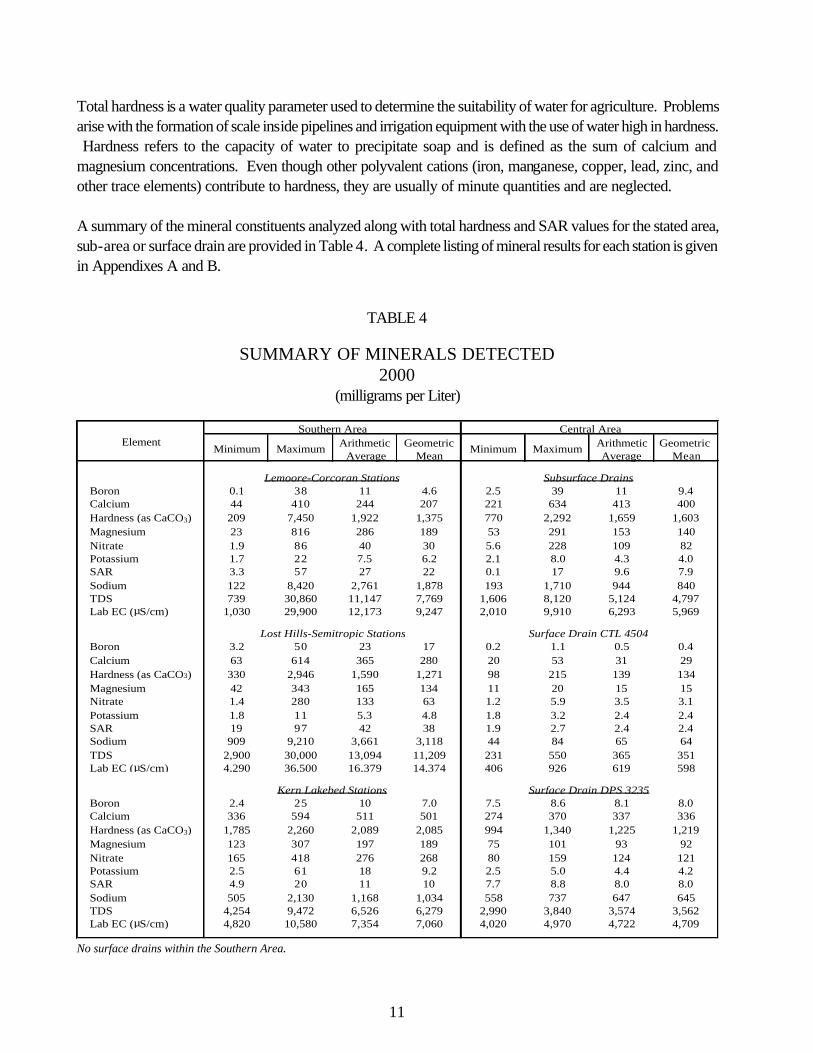
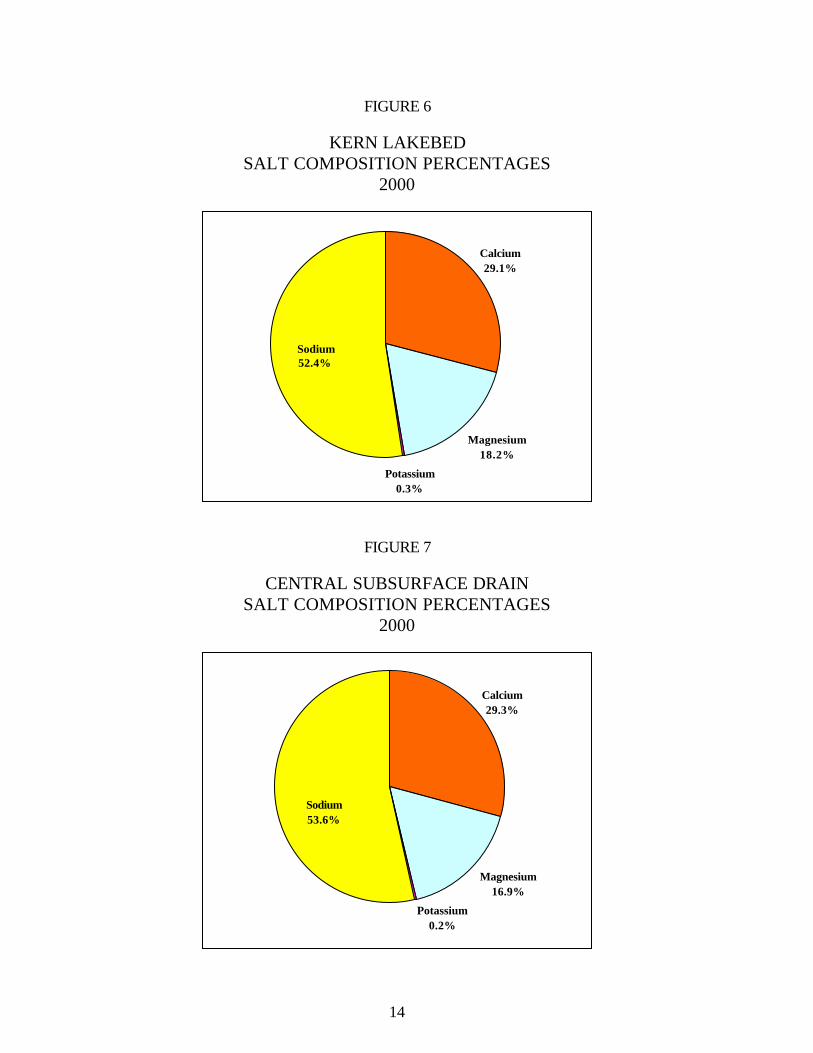
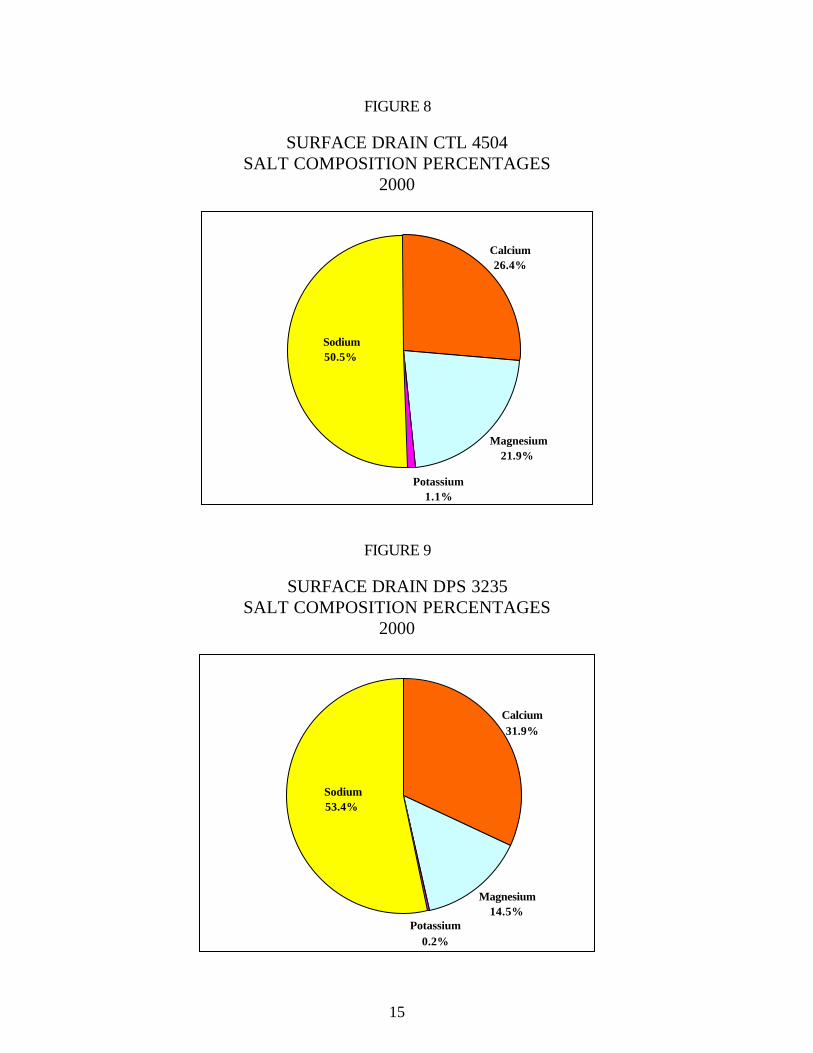
Salt composition charts that show the percentage of salt type for the area, sub-area, and surface drain are provided in Figures 4 through 9. The percentages used to generate the charts were determined from the geometric mean values in Table 4. A comparison of the drainage water salt composition for the years 1986 and 2000 are given in Table 5 and show relatively little change within the subsurface drains. To compare the analyses with one another, the two surface drains are presented separately. Although the constituent concentrations for station DPS 3235 are 10 times that of station DPS 4505, their compositions are relatively identical for 2000. Interestingly, station DPS 3235’s calcium salts decreased 10% from 1986, while the sodium salts increased 7.8%.
TABLE 5
DRAINAGE WATER SALT COMPOSITIONS 1986 and 2000
(value in milliequivalents per Liter)
value % value % value % value %
Calcium 12.6 7.6 10.3 9.6 19.4 26.9 19.9 29.3Magnesium 31.9 19.3 15.6 14.4 13.0 18.0 11.5 16.9Potassium 0.17 0.10 0.16 0.10 0.08 0.10 0.10 0.20Sodium 120.2 72.9 81.6 75.8 39.6 55.0 36.5 53.6
Calcium 12.9 7.5 14.0 8.6 5.3 28.2 1.5 26.4Magnesium 10.3 5.9 11.0 6.8 3.2 17.1 1.2 21.9Potassium 1.71 1.00 1.62 1.00 0.11 0.60 0.06 1.10Sodium 148.1 85.6 135.6 83.6 10.2 54.1 2.8 50.5
Calcium 22.2 24.6 25.0 29.1 16.7 41.9 16.7 31.9Magnesium 16.8 18.6 15.6 18.2 4.9 12.2 7.6 14.5Potassium 0.32 0.40 0.23 0.30 0.12 0.30 0.11 0.20Sodium 51.1 56.5 45.0 52.4 18.2 45.6 28.0 53.4
Lemoore-Corcoran Stations
Surface Drain DPS 3235
Lost Hills-Semitropic Stations
Kern Lakebed Stations
Subsurface Drains
Surface Drain CTL 4504
2000ElementSouthern Area Central Area
1986 2000 1986
13
FIGURE 4
LEMOORE-CORCORAN SALT COMPOSITION PERCENTAGES
2000
Potassium0.1%
Magnesium14.4%
Calcium9.6%
Sodium75.8%
FIGURE 5
LOST HILLS-SEMITROPIC SALT COMPOSITION PERCENTAGES
2000
Sodium83.6%
Potassium1.0%
Magnesium6.8%
Calcium8.6%
14
FIGURE 6
KERN LAKEBED SALT COMPOSITION PERCENTAGES
2000
Calcium29.1%
Magnesium18.2%
Sodium52.4%
Potassium0.3%
FIGURE 7
CENTRAL SUBSURFACE DRAIN SALT COMPOSITION PERCENTAGES
2000
Magnesium16.9%
Sodium53.6%
Potassium0.2%
Calcium29.3%
15
FIGURE 8
SURFACE DRAIN CTL 4504 SALT COMPOSITION PERCENTAGES
2000
Sodium50.5%
Calcium26.4%
Magnesium21.9%
Potassium1.1%
FIGURE 9
SURFACE DRAIN DPS 3235 SALT COMPOSITION PERCENTAGES
2000
Sodium53.4%
Calcium31.9%
Magnesium14.5%
Potassium0.2%
16
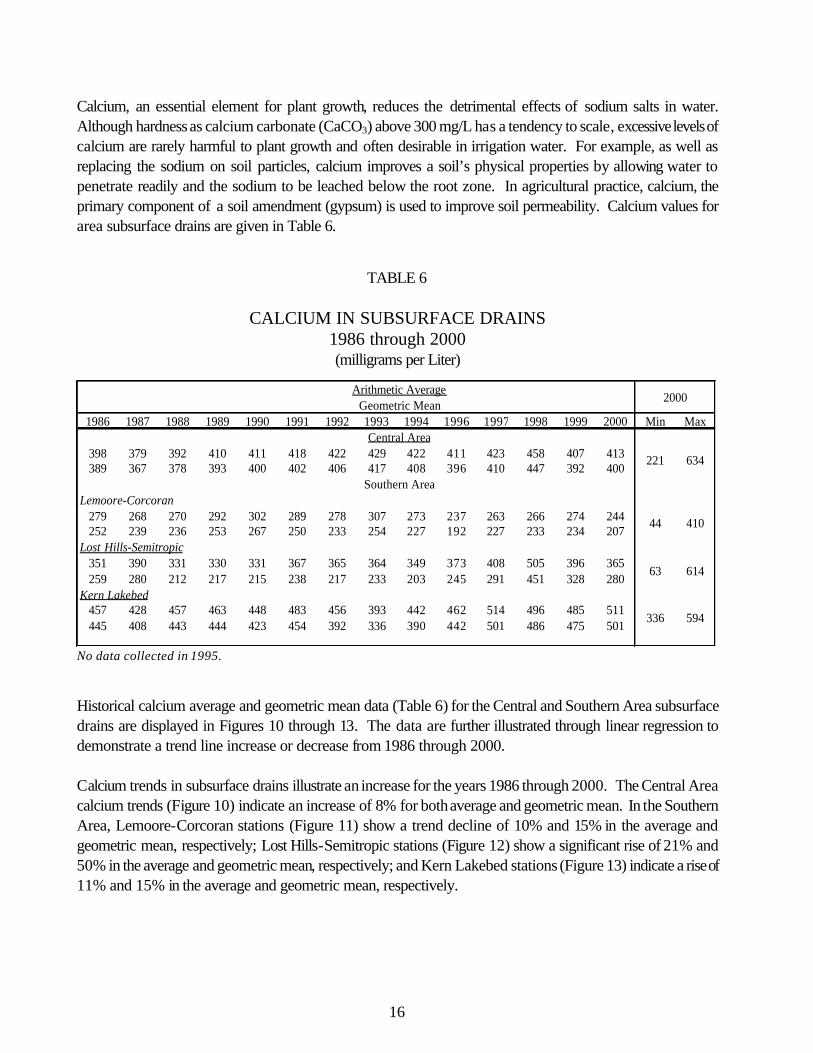
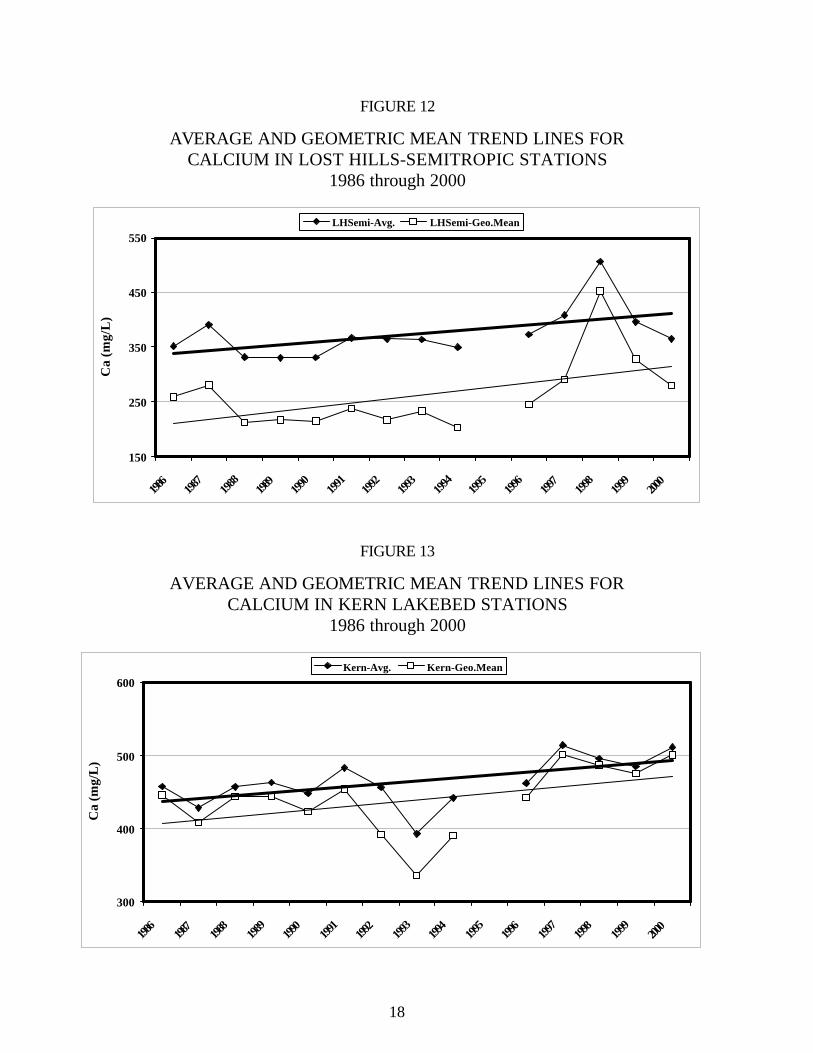
Calcium, an essential element for plant growth, reduces the detrimental effects of sodium salts in water. Although hardness as calcium carbonate (CaCO3) above 300 mg/L has a tendency to scale, excessive levels of calcium are rarely harmful to plant growth and often desirable in irrigation water. For example, as well as replacing the sodium on soil particles, calcium improves a soil’s physical properties by allowing water to penetrate readily and the sodium to be leached below the root zone. In agricultural practice, calcium, the primary component of a soil amendment (gypsum) is used to improve soil permeability. Calcium values for area subsurface drains are given in Table 6.
TABLE 6
CALCIUM IN SUBSURFACE DRAINS 1986 through 2000 (milligrams per Liter)
1986 1987 1988 1989 1990 1991 1992 1993 1994 1996 1997 1998 1999 2000 Min Max
398 379 392 410 411 418 422 429 422 411 423 458 407 413389 367 378 393 400 402 406 417 408 396 410 447 392 400
Lemoore-Corcoran 279 268 270 292 302 289 278 307 273 237 263 266 274 244252 239 236 253 267 250 233 254 227 192 227 233 234 207
Lost Hills-Semitropic351 390 331 330 331 367 365 364 349 373 408 505 396 365259 280 212 217 215 238 217 233 203 245 291 451 328 280
Kern Lakebed457 428 457 463 448 483 456 393 442 462 514 496 485 511445 408 443 444 423 454 392 336 390 442 501 486 475 501
Arithmetic Average2000
Geometric Mean
Central Area
221 634
Southern Area
44 410
63 614
336 594
No data collected in 1995.
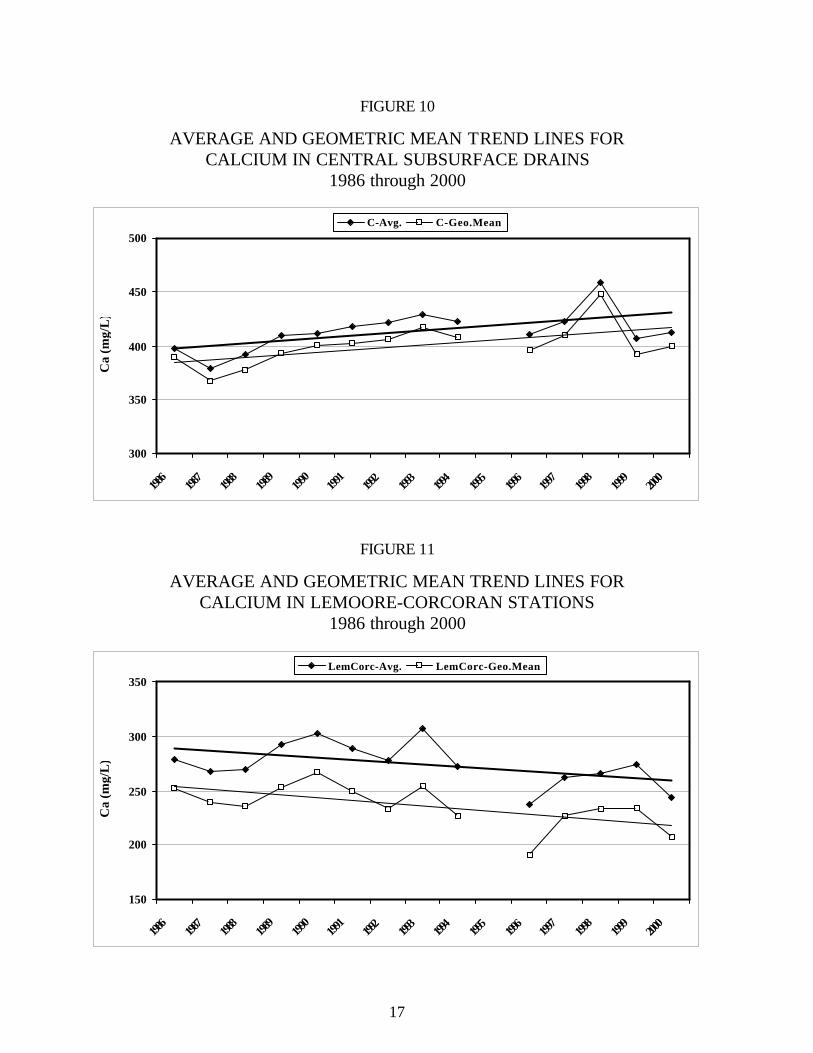
Historical calcium average and geometric mean data (Table 6) for the Central and Southern Area subsurface drains are displayed in Figures 10 through 13. The data are further illustrated through linear regression to demonstrate a trend line increase or decrease from 1986 through 2000. Calcium trends in subsurface drains illustrate an increase for the years 1986 through 2000. The Central Area calcium trends (Figure 10) indicate an increase of 8% for both average and geometric mean. In the Southern Area, Lemoore-Corcoran stations (Figure 11) show a trend decline of 10% and 15% in the average and geometric mean, respectively; Lost Hills-Semitropic stations (Figure 12) show a significant rise of 21% and 50% in the average and geometric mean, respectively; and Kern Lakebed stations (Figure 13) indicate a rise of 11% and 15% in the average and geometric mean, respectively.
17
FIGURE 10
AVERAGE AND GEOMETRIC MEAN TREND LINES FOR CALCIUM IN CENTRAL SUBSURFACE DRAINS
1986 through 2000
300
350
400
450
500
1986
1987
1988
1989
1990
1991
1992
1993
1994
1995
1996
1997
1998
1999
2000
Ca
(mg/
L)
C-Avg. C-Geo.Mean
FIGURE 11
AVERAGE AND GEOMETRIC MEAN TREND LINES FOR CALCIUM IN LEMOORE-CORCORAN STATIONS
1986 through 2000
150
200
250
300
350
1986
1987
1988
1989
1990
1991
1992
1993
1994
1995
1996
1997
1998
1999
2000
Ca
(mg/
L)
LemCorc-Avg. LemCorc-Geo.Mean
18
FIGURE 12
AVERAGE AND GEOMETRIC MEAN TREND LINES FOR CALCIUM IN LOST HILLS-SEMITROPIC STATIONS
1986 through 2000
150
250
350
450
550
1986
1987
1988
1989
1990
1991
1992
1993
1994
1995
1996
1997
1998
1999
2000
Ca
(mg/
L)
LHSemi-Avg. LHSemi-Geo.Mean
FIGURE 13
AVERAGE AND GEOMETRIC MEAN TREND LINES FOR CALCIUM IN KERN LAKEBED STATIONS
1986 through 2000
300
400
500
600
1986
1987
1988
1989
1990
1991
1992
1993
1994
1995
1996
1997
1998
1999
2000
Ca
(mg/
L)
Kern-Avg. Kern-Geo.Mean
19
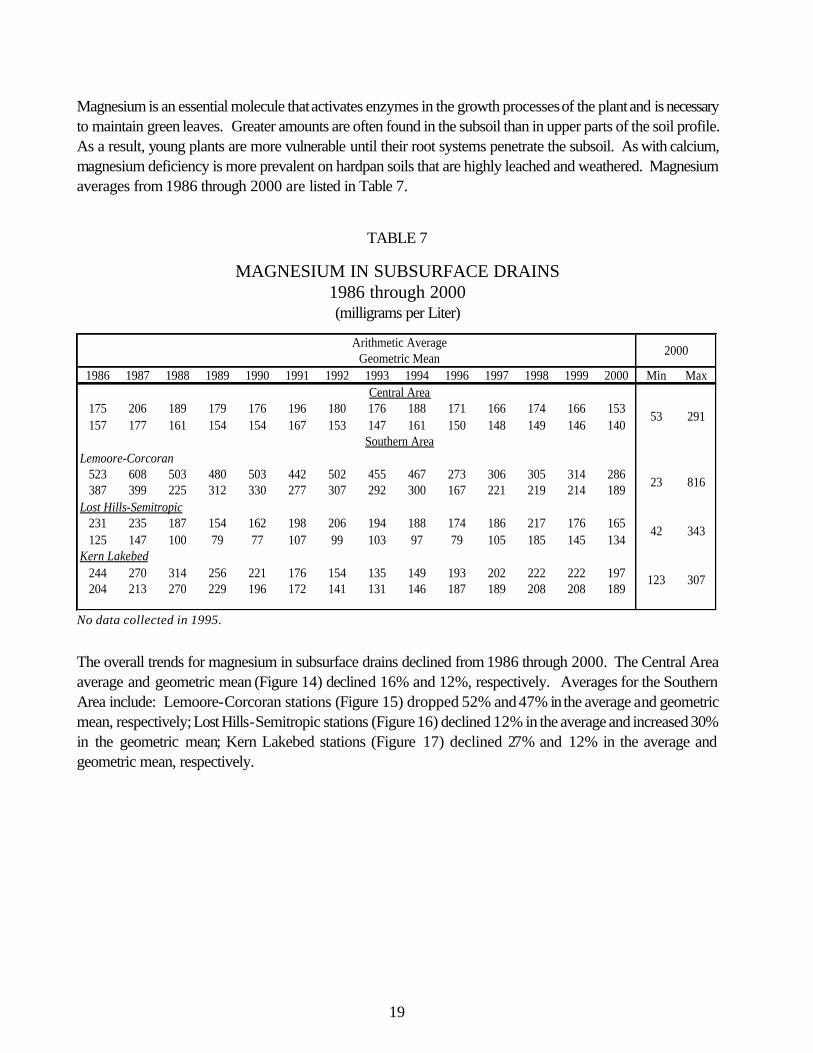
Magnesium is an essential molecule that activates enzymes in the growth processes of the plant and is necessary to maintain green leaves. Greater amounts are often found in the subsoil than in upper parts of the soil profile. As a result, young plants are more vulnerable until their root systems penetrate the subsoil. As with calcium, magnesium deficiency is more prevalent on hardpan soils that are highly leached and weathered. Magnesium averages from 1986 through 2000 are listed in Table 7.
TABLE 7
MAGNESIUM IN SUBSURFACE DRAINS 1986 through 2000 (milligrams per Liter)
1986 1987 1988 1989 1990 1991 1992 1993 1994 1996 1997 1998 1999 2000 Min Max
175 206 189 179 176 196 180 176 188 171 166 174 166 153157 177 161 154 154 167 153 147 161 150 148 149 146 140
Lemoore-Corcoran 523 608 503 480 503 442 502 455 467 273 306 305 314 286387 399 225 312 330 277 307 292 300 167 221 219 214 189
Lost Hills-Semitropic231 235 187 154 162 198 206 194 188 174 186 217 176 165125 147 100 79 77 107 99 103 97 79 105 185 145 134
Kern Lakebed244 270 314 256 221 176 154 135 149 193 202 222 222 197204 213 270 229 196 172 141 131 146 187 189 208 208 189
Arithmetic Average 2000 Geometric Mean
Central Area
53 291
Southern Area
23 816
42 343
123 307
No data collected in 1995.
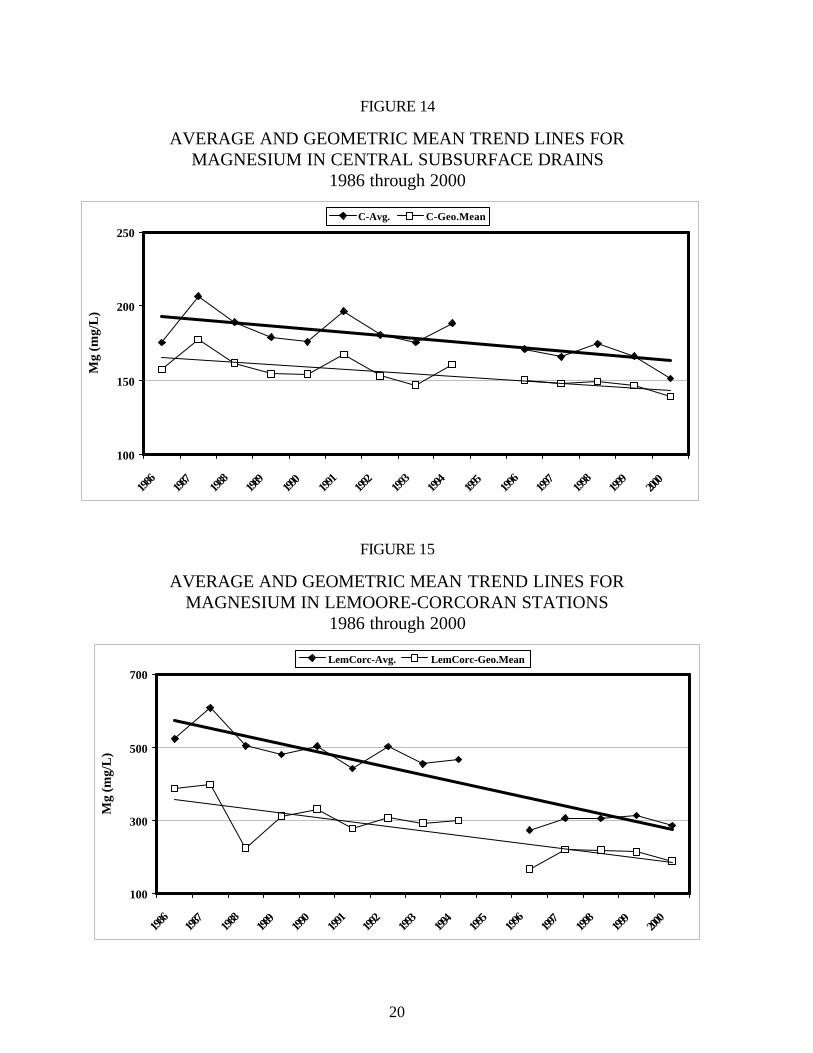
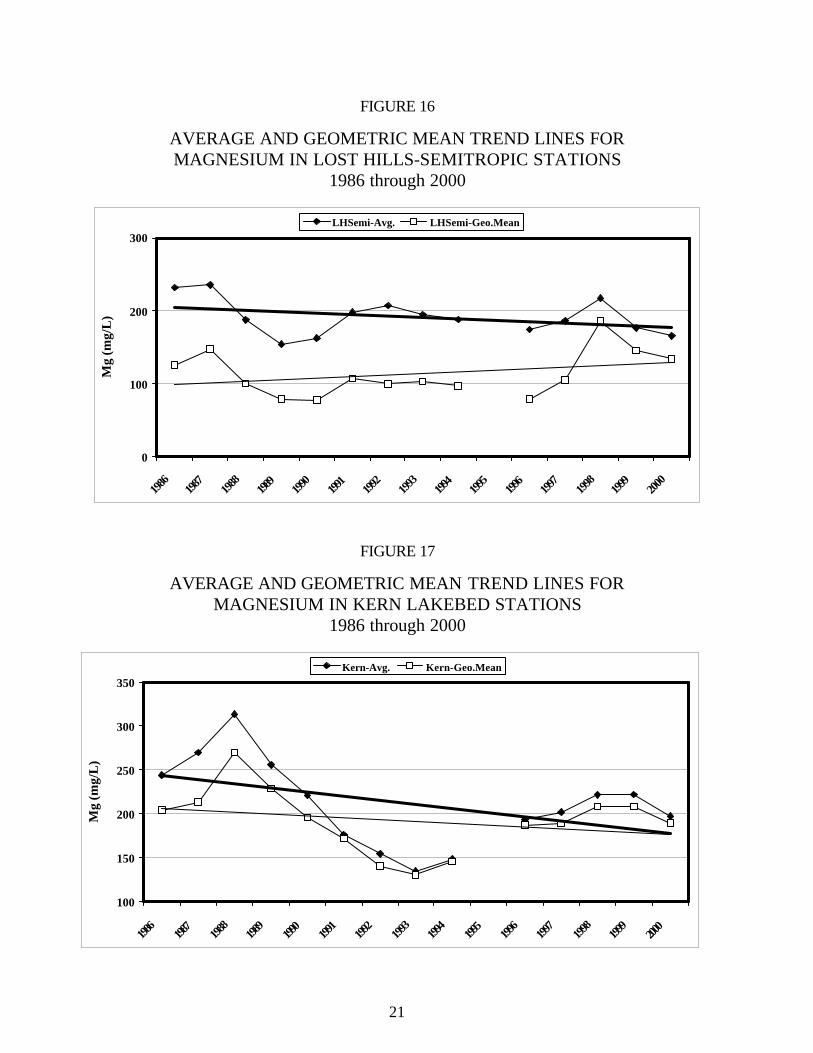
The overall trends for magnesium in subsurface drains declined from 1986 through 2000. The Central Area average and geometric mean (Figure 14) declined 16% and 12%, respectively. Averages for the Southern Area include: Lemoore-Corcoran stations (Figure 15) dropped 52% and 47% in the average and geometric mean, respectively; Lost Hills-Semitropic stations (Figure 16) declined 12% in the average and increased 30% in the geometric mean; Kern Lakebed stations (Figure 17) declined 27% and 12% in the average and geometric mean, respectively.
20
FIGURE 14
AVERAGE AND GEOMETRIC MEAN TREND LINES FOR MAGNESIUM IN CENTRAL SUBSURFACE DRAINS
1986 through 2000
100
150
200
250
1986
1987
1988
1989
1990
1991
1992
1993
1994
1995
1996
1997
1998
1999
2000
Mg
(mg/
L)
C-Avg. C-Geo.Mean
FIGURE 15
AVERAGE AND GEOMETRIC MEAN TREND LINES FOR MAGNESIUM IN LEMOORE-CORCORAN STATIONS
1986 through 2000
100
300
500
700
1986
1987
1988
1989
1990
1991
1992
1993
1994
1995
1996
1997
1998
1999
2000
Mg
(mg/
L)
LemCorc-Avg. LemCorc-Geo.Mean
21
FIGURE 16
AVERAGE AND GEOMETRIC MEAN TREND LINES FOR MAGNESIUM IN LOST HILLS-SEMITROPIC STATIONS
1986 through 2000
0
100
200
300
1986
1987
1988
1989
1990
1991
1992
1993
1994
1995
1996
1997
1998
1999
2000
Mg
(mg/
L)
LHSemi-Avg. LHSemi-Geo.Mean
FIGURE 17
AVERAGE AND GEOMETRIC MEAN TREND LINES FOR MAGNESIUM IN KERN LAKEBED STATIONS
1986 through 2000
100
150
200
250
300
350
1986
1987
1988
1989
1990
1991
1992
1993
1994
1995
1996
1997
1998
1999
2000
Mg
(mg/
L)
Kern-Avg. Kern-Geo.Mean
22
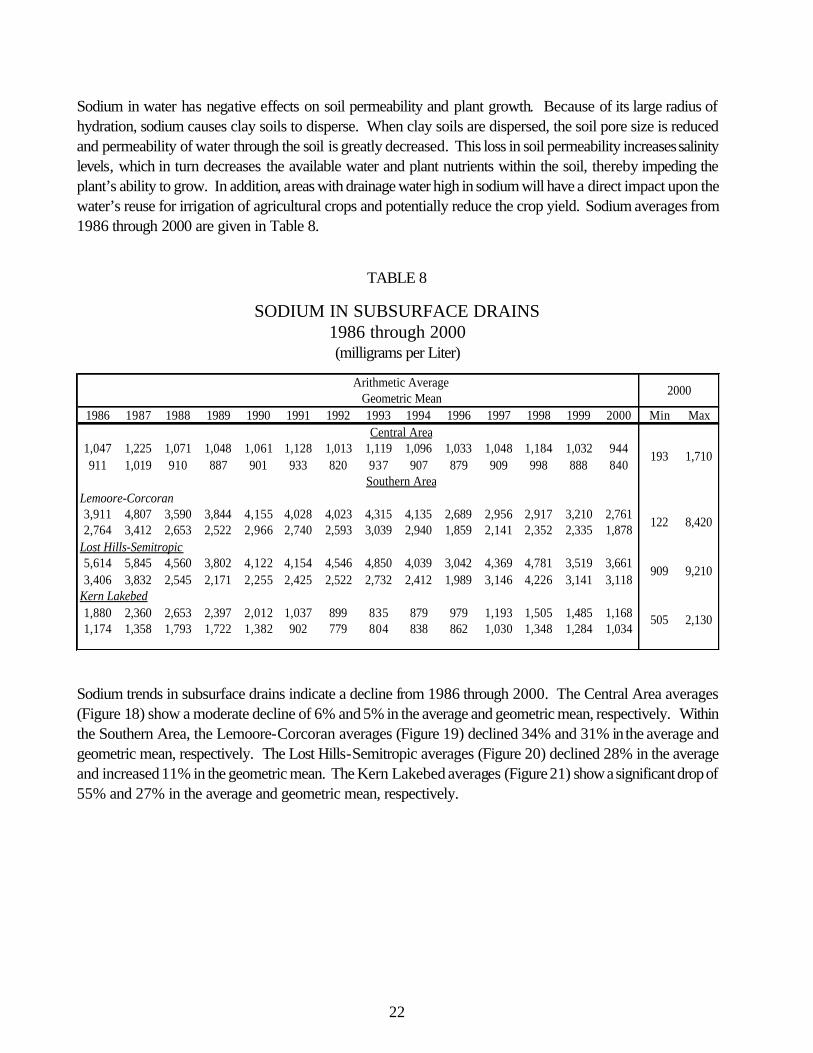
Sodium in water has negative effects on soil permeability and plant growth. Because of its large radius of hydration, sodium causes clay soils to disperse. When clay soils are dispersed, the soil pore size is reduced and permeability of water through the soil is greatly decreased. This loss in soil permeability increases salinity levels, which in turn decreases the available water and plant nutrients within the soil, thereby impeding the plant’s ability to grow. In addition, areas with drainage water high in sodium will have a direct impact upon the water’s reuse for irrigation of agricultural crops and potentially reduce the crop yield. Sodium averages from 1986 through 2000 are given in Table 8.
TABLE 8
SODIUM IN SUBSURFACE DRAINS 1986 through 2000 (milligrams per Liter)
1986 1987 1988 1989 1990 1991 1992 1993 1994 1996 1997 1998 1999 2000 Min Max
1,047 1,225 1,071 1,048 1,061 1,128 1,013 1,119 1,096 1,033 1,048 1,184 1,032 944911 1,019 910 887 901 933 820 937 907 879 909 998 888 840
Lemoore-Corcoran 3,911 4,807 3,590 3,844 4,155 4,028 4,023 4,315 4,135 2,689 2,956 2,917 3,210 2,7612,764 3,412 2,653 2,522 2,966 2,740 2,593 3,039 2,940 1,859 2,141 2,352 2,335 1,878
Lost Hills-Semitropic5,614 5,845 4,560 3,802 4,122 4,154 4,546 4,850 4,039 3,042 4,369 4,781 3,519 3,6613,406 3,832 2,545 2,171 2,255 2,425 2,522 2,732 2,412 1,989 3,146 4,226 3,141 3,118
Kern Lakebed1,880 2,360 2,653 2,397 2,012 1,037 899 835 879 979 1,193 1,505 1,485 1,1681,174 1,358 1,793 1,722 1,382 902 779 804 838 862 1,030 1,348 1,284 1,034
Arithmetic Average 2000 Geometric Mean
Central Area
193 1,710
Southern Area
122 8,420
909 9,210
505 2,130
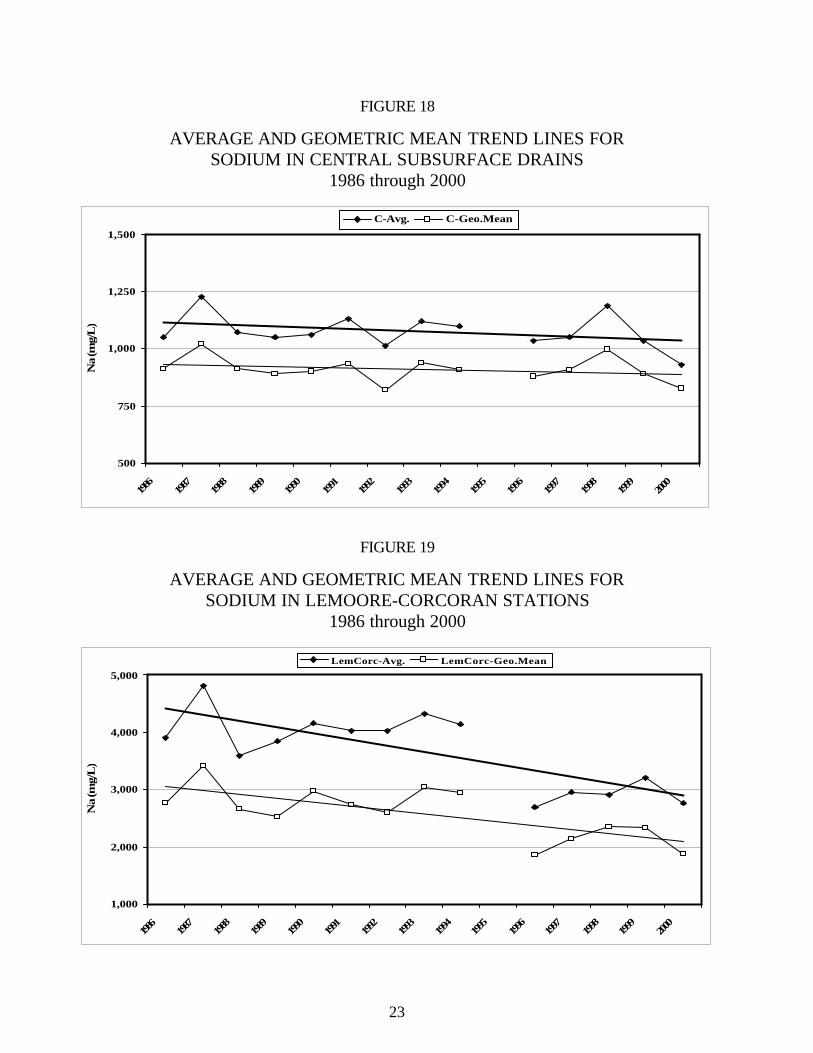
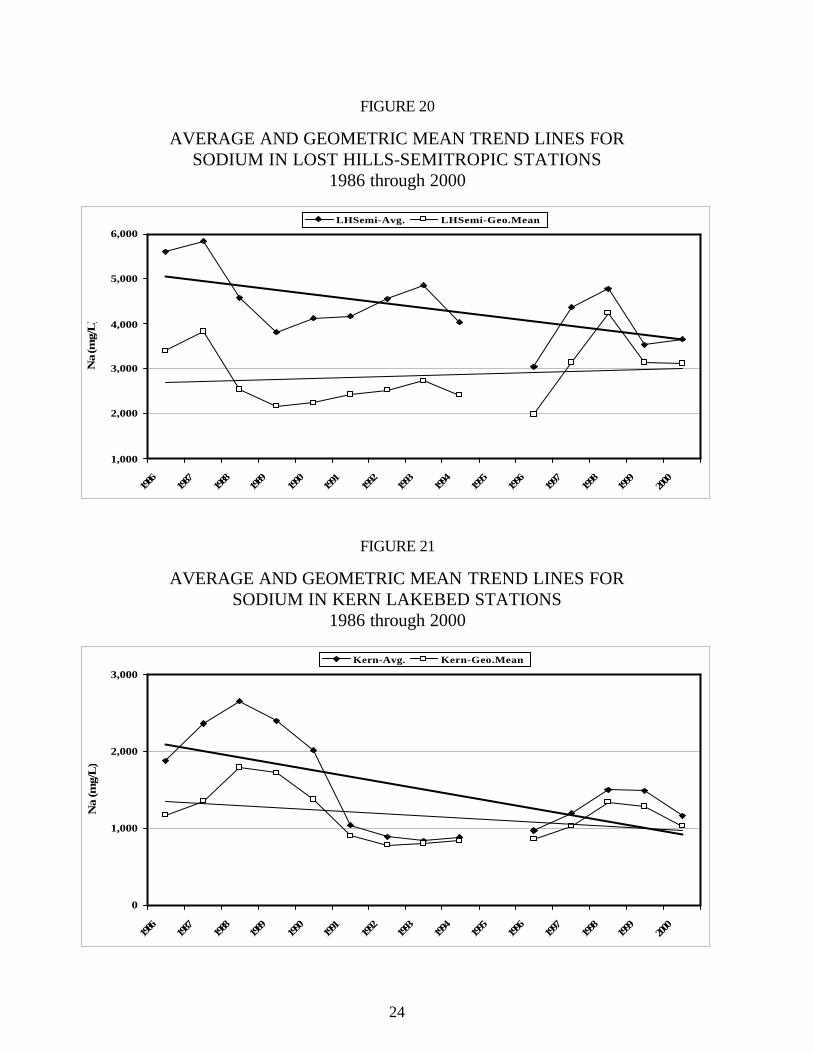
Sodium trends in subsurface drains indicate a decline from 1986 through 2000. The Central Area averages (Figure 18) show a moderate decline of 6% and 5% in the average and geometric mean, respectively. Within the Southern Area, the Lemoore-Corcoran averages (Figure 19) declined 34% and 31% in the average and geometric mean, respectively. The Lost Hills-Semitropic averages (Figure 20) declined 28% in the average and increased 11% in the geometric mean. The Kern Lakebed averages (Figure 21) show a significant drop of 55% and 27% in the average and geometric mean, respectively.
23
FIGURE 18
AVERAGE AND GEOMETRIC MEAN TREND LINES FOR SODIUM IN CENTRAL SUBSURFACE DRAINS
1986 through 2000
500
750
1,000
1,250
1,500
1986
1987
1988
1989
1990
1991
1992
1993
1994
1995
1996
1997
1998
1999
2000
Na
(mg/
L)
C-Avg. C-Geo.Mean
FIGURE 19
AVERAGE AND GEOMETRIC MEAN TREND LINES FOR SODIUM IN LEMOORE-CORCORAN STATIONS
1986 through 2000
1,000
2,000
3,000
4,000
5,000
1986
1987
1988
1989
1990
1991
1992
1993
1994
1995
1996
1997
1998
1999
2000
Na
(mg/
L)
LemCorc-Avg. LemCorc-Geo.Mean
24
FIGURE 20
AVERAGE AND GEOMETRIC MEAN TREND LINES FOR SODIUM IN LOST HILLS-SEMITROPIC STATIONS
1986 through 2000
1,000
2,000
3,000
4,000
5,000
6,000
1986
1987
1988
1989
1990
1991
1992
1993
1994
1995
1996
1997
1998
1999
2000
Na
(mg/
L)
LHSemi-Avg. LHSemi-Geo.Mean
FIGURE 21
AVERAGE AND GEOMETRIC MEAN TREND LINES FOR SODIUM IN KERN LAKEBED STATIONS
1986 through 2000
0
1,000
2,000
3,000
1986
1987
1988
1989
1990
1991
1992
1993
1994
1995
1996
1997
1998
1999
2000
Na
(mg/
L)
Kern-Avg. Kern-Geo.Mean
25
Pesticides
Extensive sampling and analyses by federal and State agencies prior to 1986 have shown that pesticides are not often detected in valley subsurface water. As a result, the drainage-monitoring program did not include testing for pesticides in 2000.
Nutrients The drainage-monitoring program has not sampled subsurface drains for nutrients since 1987, when total ammonia and organic nitrogen, dissolved nitrate and nitrite, dissolved ammonia, dissolved orthophosphate, and total phosphorous were last analyzed. Originally, nutrient data were to be analyzed for correlation of nutrient values versus the time of year when sampled. This relationship was difficult to evaluate due to: 1. Over-irrigation, which leads to increased leaching of salts from soils. 2. Variable commercial fertilizer application rates. 3. Yearly sample value fluctuations. 4. Variable soil types. Thus, nutrient trends are not examined in the report.
Trace Elements Trace elements occur naturally in rock and soil. Included are aluminum, barium, cadmium, cobalt, copper, iron, lead, mercury, silver, and zinc, which historically have been very low or undetectable in drainage sump water; consequently, they have not been sampled since 1987. Selenium is the only trace element sampled for in 2000.
26
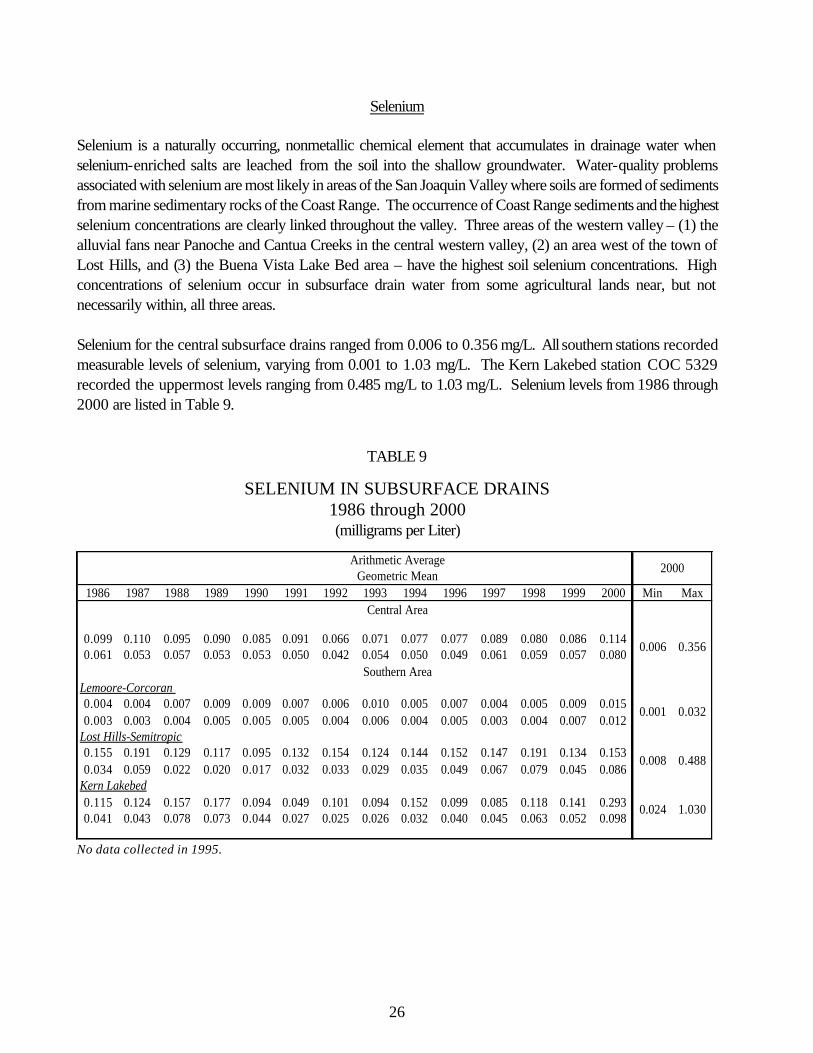
Selenium Selenium is a naturally occurring, nonmetallic chemical element that accumulates in drainage water when selenium-enriched salts are leached from the soil into the shallow groundwater. Water-quality problems associated with selenium are most likely in areas of the San Joaquin Valley where soils are formed of sediments from marine sedimentary rocks of the Coast Range. The occurrence of Coast Range sediments and the highest selenium concentrations are clearly linked throughout the valley. Three areas of the western valley – (1) the alluvial fans near Panoche and Cantua Creeks in the central western valley, (2) an area west of the town of Lost Hills, and (3) the Buena Vista Lake Bed area – have the highest soil selenium concentrations. High concentrations of selenium occur in subsurface drain water from some agricultural lands near, but not necessarily within, all three areas. Selenium for the central subsurface drains ranged from 0.006 to 0.356 mg/L. All southern stations recorded measurable levels of selenium, varying from 0.001 to 1.03 mg/L. The Kern Lakebed station COC 5329 recorded the uppermost levels ranging from 0.485 mg/L to 1.03 mg/L. Selenium levels from 1986 through 2000 are listed in Table 9.
TABLE 9
SELENIUM IN SUBSURFACE DRAINS 1986 through 2000 (milligrams per Liter)
1986 1987 1988 1989 1990 1991 1992 1993 1994 1996 1997 1998 1999 2000 Min Max
0.099 0.110 0.095 0.090 0.085 0.091 0.066 0.071 0.077 0.077 0.089 0.080 0.086 0.1140.061 0.053 0.057 0.053 0.053 0.050 0.042 0.054 0.050 0.049 0.061 0.059 0.057 0.080
Lemoore-Corcoran 0.004 0.004 0.007 0.009 0.009 0.007 0.006 0.010 0.005 0.007 0.004 0.005 0.009 0.0150.003 0.003 0.004 0.005 0.005 0.005 0.004 0.006 0.004 0.005 0.003 0.004 0.007 0.012
Lost Hills-Semitropic0.155 0.191 0.129 0.117 0.095 0.132 0.154 0.124 0.144 0.152 0.147 0.191 0.134 0.1530.034 0.059 0.022 0.020 0.017 0.032 0.033 0.029 0.035 0.049 0.067 0.079 0.045 0.086
Kern Lakebed0.115 0.124 0.157 0.177 0.094 0.049 0.101 0.094 0.152 0.099 0.085 0.118 0.141 0.2930.041 0.043 0.078 0.073 0.044 0.027 0.025 0.026 0.032 0.040 0.045 0.063 0.052 0.098
2000
0.024 1.030
0.001 0.032
0.008 0.488
Southern Area
0.006 0.356
Arithmetic Average Geometric Mean
Central Area
No data collected in 1995.
27
Trends
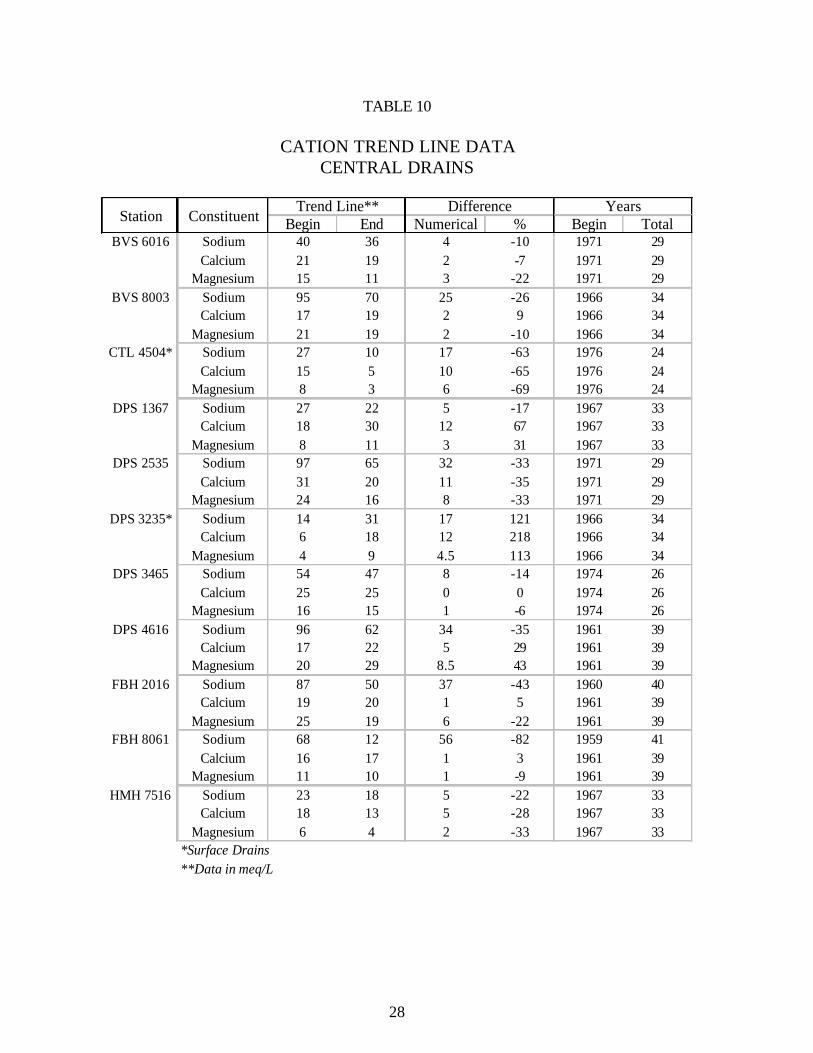
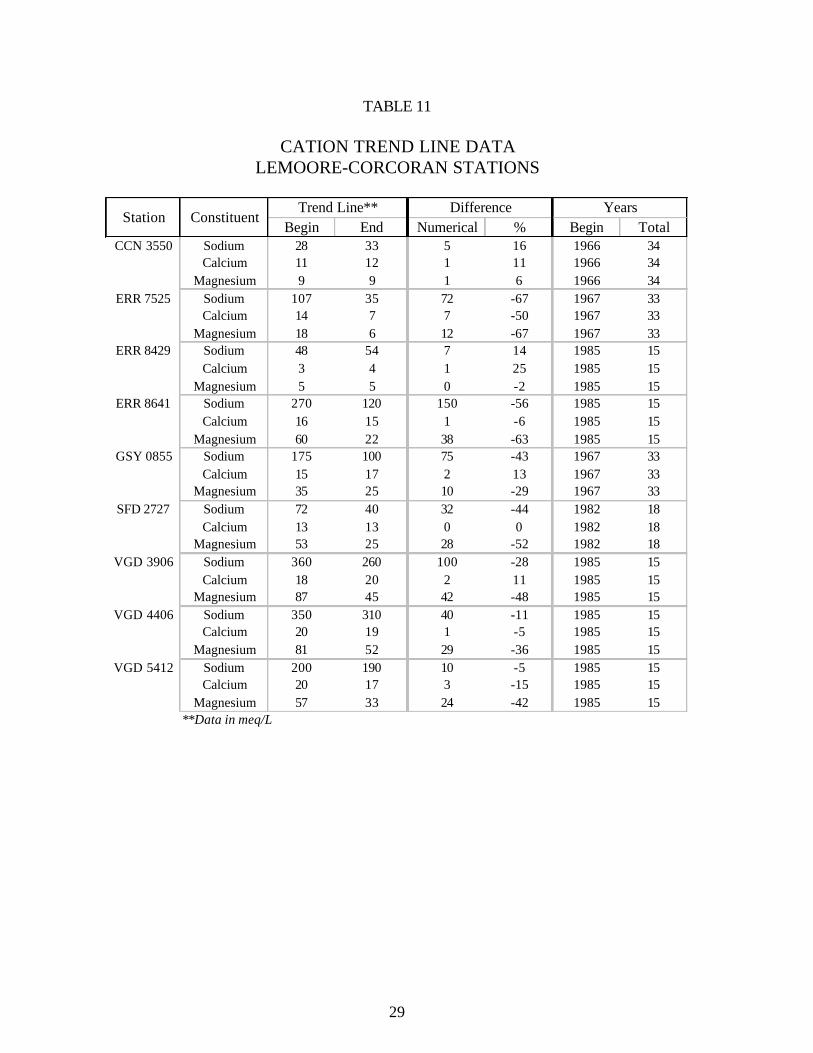
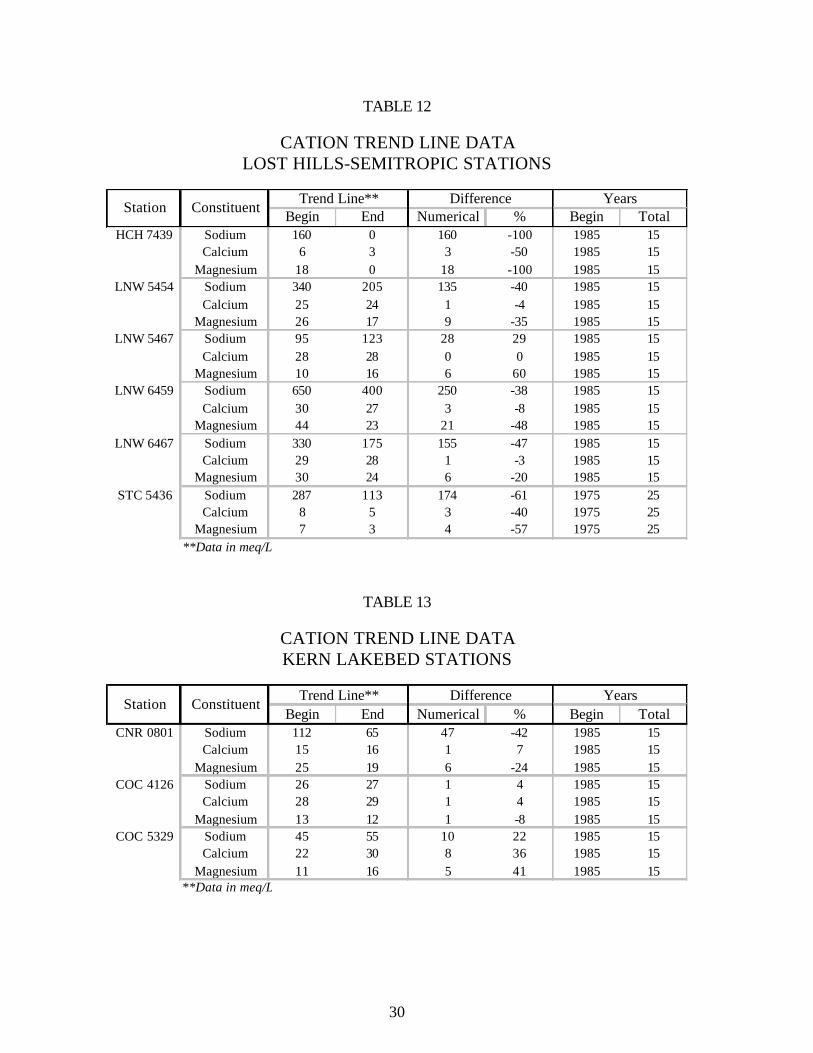
Water quality trends are examined (in milliequivalents per liter) for the cations sodium, calcium, and magnesium. The trend line of each constituent is recognized with a beginning and ending period of analyses. Through linear regression the data are interpreted to form a line that charts a change of each constituent over time. The percentage increase or decrease of a trend line is evaluated by the numerical difference between the point of beginning and ending of the linear regression. Included are the first year of analyses and total sampled years the data represent. Tables 9 through 12 show the trend data for the central and southern area drains. In addition, a graphed figure representing each central and southern station are given in Appendixes C and D, respectively. All eleven central subsurface drains show a decline in sodium. Station FBH 8061 showed the greatest decline of 82% that spanned over a 41-year period. Calcium levels rose in six stations with station DPS 1367 showing the greatest increase at 67%. Magnesium declined in seven stations with the greatest decrease of 32% for stations DPS 2535 and HMH 7516. The two surface drains in the Central Area contrast one another. Over a 24-year period, station CTL 4504’s sodium, calcium, and magnesium levels declined 63%, 65%, and 69%, respectively. In contrast, station DPS 3235 increased 121%, 218%, and 113 % in sodium, calcium, and magnesium, respectively, over a 34-year trend of analyses. Sodium declined at seven of the nine Lemoore-Corcoran stations with station ERR 7525 showing the greatest decrease of 67% over a 33-year period. The greatest calcium increase of 25% is recorded for station ERR 8429. The greatest drop in calcium of 50% is noted for station ERR 7525. Magnesium declined in eight stations with station ERR 7525 showing the greatest decrease of 67%. Five of the six Lost Hills-Semitropic stations declined in sodium, calcium, and magnesium. Over a span of 15 years, station HCH 7439’s sodium, calcium, and magnesium concentrations declined more than any of the other sub-area stations at 100%, 50%, and 100%, respectively. Station LNW 5467 showed an increase in sodium and magnesium at 29% and 60%, respectively, while calcium remained unchanged. The trends for the three stations in the Kern Lakebed sub-area varied. Station CNR 0801’s sodium and magnesium concentrations declined 42% and 24%, while the calcium rose 7%. Sodium and calcium concentrations rose 4% each and magnesium declined 8% for station COC 4126. Lastly, station COC 5329’s sodium, calcium, and magnesium concentrations all rose 22%, 36%, and 41 %, respectively.
28
TABLE 10
CATION TREND LINE DATA CENTRAL DRAINS
Begin End Numerical % Begin TotalBVS 6016 Sodium 40 36 4 -10 1971 29
Calcium 21 19 2 -7 1971 29Magnesium 15 11 3 -22 1971 29
BVS 8003 Sodium 95 70 25 -26 1966 34Calcium 17 19 2 9 1966 34
Magnesium 21 19 2 -10 1966 34CTL 4504* Sodium 27 10 17 -63 1976 24
Calcium 15 5 10 -65 1976 24Magnesium 8 3 6 -69 1976 24
DPS 1367 Sodium 27 22 5 -17 1967 33Calcium 18 30 12 67 1967 33
Magnesium 8 11 3 31 1967 33DPS 2535 Sodium 97 65 32 -33 1971 29
Calcium 31 20 11 -35 1971 29Magnesium 24 16 8 -33 1971 29
DPS 3235* Sodium 14 31 17 121 1966 34Calcium 6 18 12 218 1966 34
Magnesium 4 9 4.5 113 1966 34DPS 3465 Sodium 54 47 8 -14 1974 26
Calcium 25 25 0 0 1974 26Magnesium 16 15 1 -6 1974 26
DPS 4616 Sodium 96 62 34 -35 1961 39Calcium 17 22 5 29 1961 39
Magnesium 20 29 8.5 43 1961 39FBH 2016 Sodium 87 50 37 -43 1960 40
Calcium 19 20 1 5 1961 39Magnesium 25 19 6 -22 1961 39
FBH 8061 Sodium 68 12 56 -82 1959 41Calcium 16 17 1 3 1961 39
Magnesium 11 10 1 -9 1961 39HMH 7516 Sodium 23 18 5 -22 1967 33
Calcium 18 13 5 -28 1967 33Magnesium 6 4 2 -33 1967 33
*Surface Drains**Data in meq/L
YearsStation Constituent
Trend Line** Difference
29
TABLE 11
CATION TREND LINE DATA LEMOORE-CORCORAN STATIONS
Begin End Numerical % Begin TotalCCN 3550 Sodium 28 33 5 16 1966 34
Calcium 11 12 1 11 1966 34Magnesium 9 9 1 6 1966 34
ERR 7525 Sodium 107 35 72 -67 1967 33Calcium 14 7 7 -50 1967 33
Magnesium 18 6 12 -67 1967 33ERR 8429 Sodium 48 54 7 14 1985 15
Calcium 3 4 1 25 1985 15Magnesium 5 5 0 -2 1985 15
ERR 8641 Sodium 270 120 150 -56 1985 15Calcium 16 15 1 -6 1985 15
Magnesium 60 22 38 -63 1985 15GSY 0855 Sodium 175 100 75 -43 1967 33
Calcium 15 17 2 13 1967 33Magnesium 35 25 10 -29 1967 33
SFD 2727 Sodium 72 40 32 -44 1982 18Calcium 13 13 0 0 1982 18
Magnesium 53 25 28 -52 1982 18VGD 3906 Sodium 360 260 100 -28 1985 15
Calcium 18 20 2 11 1985 15Magnesium 87 45 42 -48 1985 15
VGD 4406 Sodium 350 310 40 -11 1985 15Calcium 20 19 1 -5 1985 15
Magnesium 81 52 29 -36 1985 15VGD 5412 Sodium 200 190 10 -5 1985 15
Calcium 20 17 3 -15 1985 15Magnesium 57 33 24 -42 1985 15
**Data in meq/L
Station ConstituentYearsDifferenceTrend Line**
30
TABLE 12
CATION TREND LINE DATA LOST HILLS-SEMITROPIC STATIONS
Begin End Numerical % Begin TotalHCH 7439 Sodium 160 0 160 -100 1985 15
Calcium 6 3 3 -50 1985 15Magnesium 18 0 18 -100 1985 15
LNW 5454 Sodium 340 205 135 -40 1985 15Calcium 25 24 1 -4 1985 15
Magnesium 26 17 9 -35 1985 15LNW 5467 Sodium 95 123 28 29 1985 15
Calcium 28 28 0 0 1985 15Magnesium 10 16 6 60 1985 15
LNW 6459 Sodium 650 400 250 -38 1985 15Calcium 30 27 3 -8 1985 15
Magnesium 44 23 21 -48 1985 15LNW 6467 Sodium 330 175 155 -47 1985 15
Calcium 29 28 1 -3 1985 15Magnesium 30 24 6 -20 1985 15
STC 5436 Sodium 287 113 174 -61 1975 25Calcium 8 5 3 -40 1975 25
Magnesium 7 3 4 -57 1975 25**Data in meq/L
Trend Line** Difference YearsStation Constituent
TABLE 13
CATION TREND LINE DATA KERN LAKEBED STATIONS
Begin End Numerical % Begin TotalCNR 0801 Sodium 112 65 47 -42 1985 15
Calcium 15 16 1 7 1985 15Magnesium 25 19 6 -24 1985 15
COC 4126 Sodium 26 27 1 4 1985 15Calcium 28 29 1 4 1985 15
Magnesium 13 12 1 -8 1985 15COC 5329 Sodium 45 55 10 22 1985 15
Calcium 22 30 8 36 1985 15Magnesium 11 16 5 41 1985 15
**Data in meq/L
Trend Line** Difference YearsStation Constituent
31
DWR’S FUTURE MONITORING PROGRAM
Plans are being formulated to modify and redirect activities of DWR’S ongoing monitoring program. Currently, a plan is being developed to replace non-functioning flow accumulator meters on existing sumps and to install flow accumulators on new sumps. This work involves cooperation and participation from water and drainage districts and from willing growers. Protocols to collect data from the various districts are being refined so that data can be obtained and evaluated in a timely manner. The two databases that store groundwater and sump data are being refined. Also, the 2001 report will involve evaluation of anion trends, as well as a 2001 Electrical Conductivity map. In addition, plans are being made to solicit regulatory agencies for appropriate drainage data that can be included in the annual report. Lastly, water quality sampling will be modified yearly to address specific constituent issues.
32
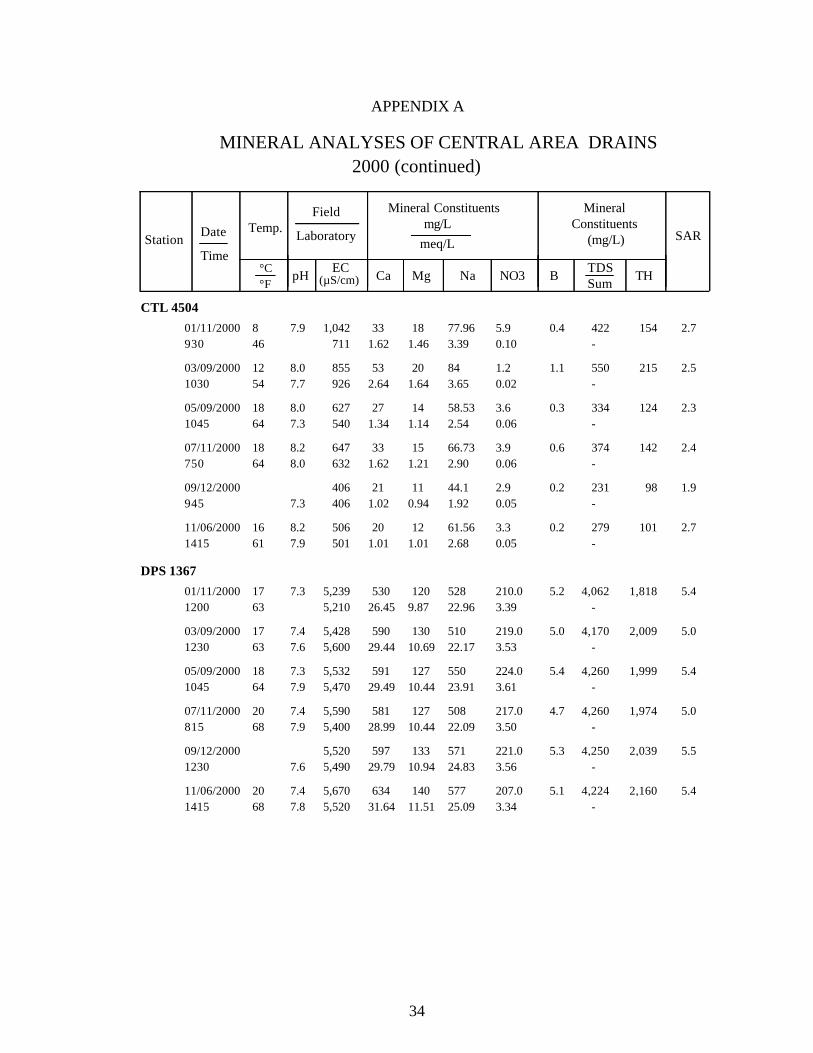
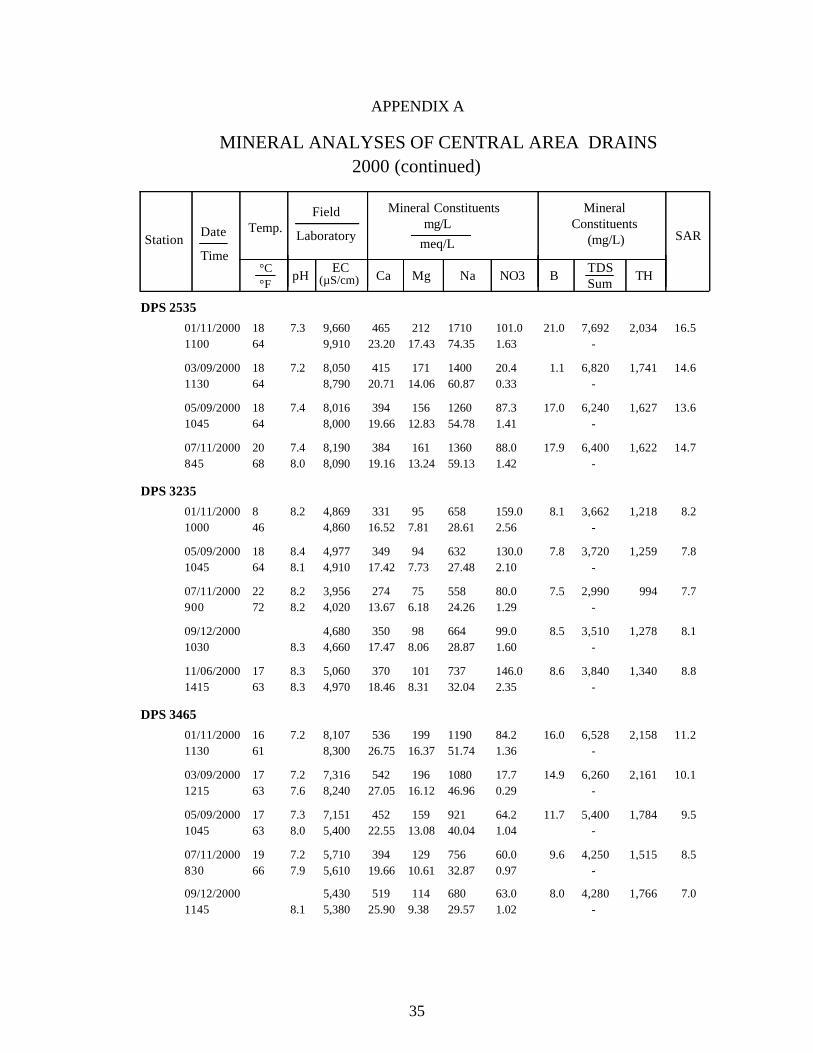
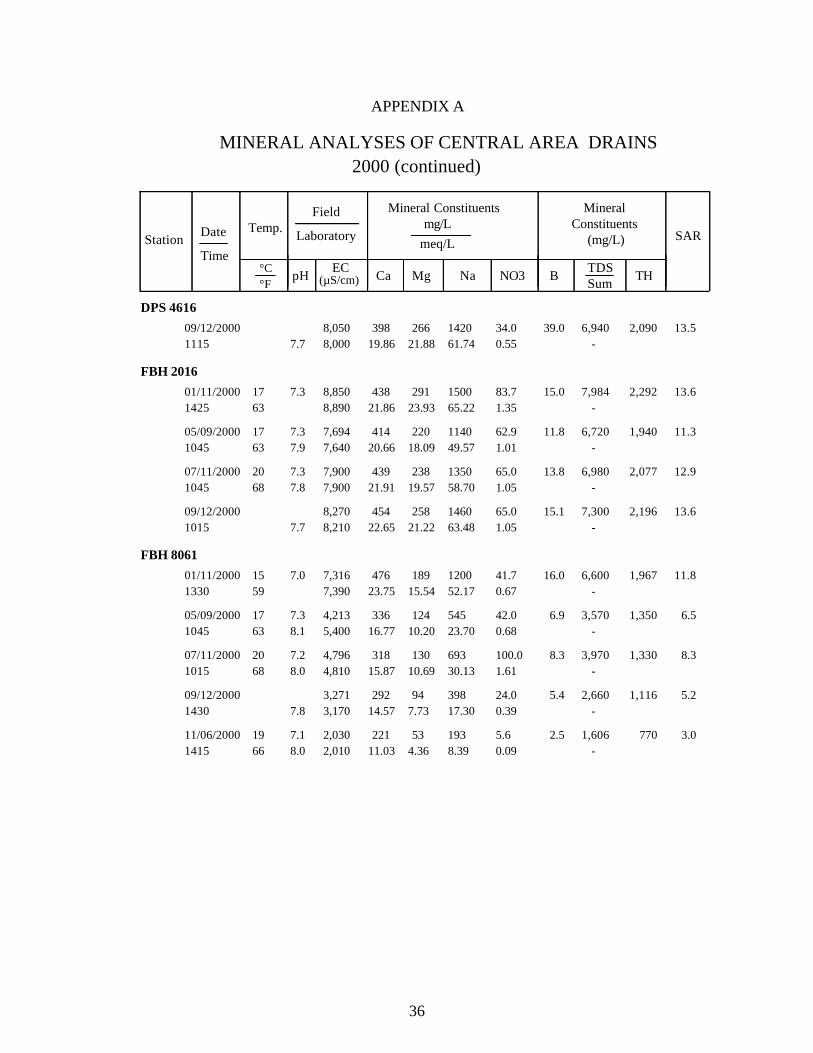
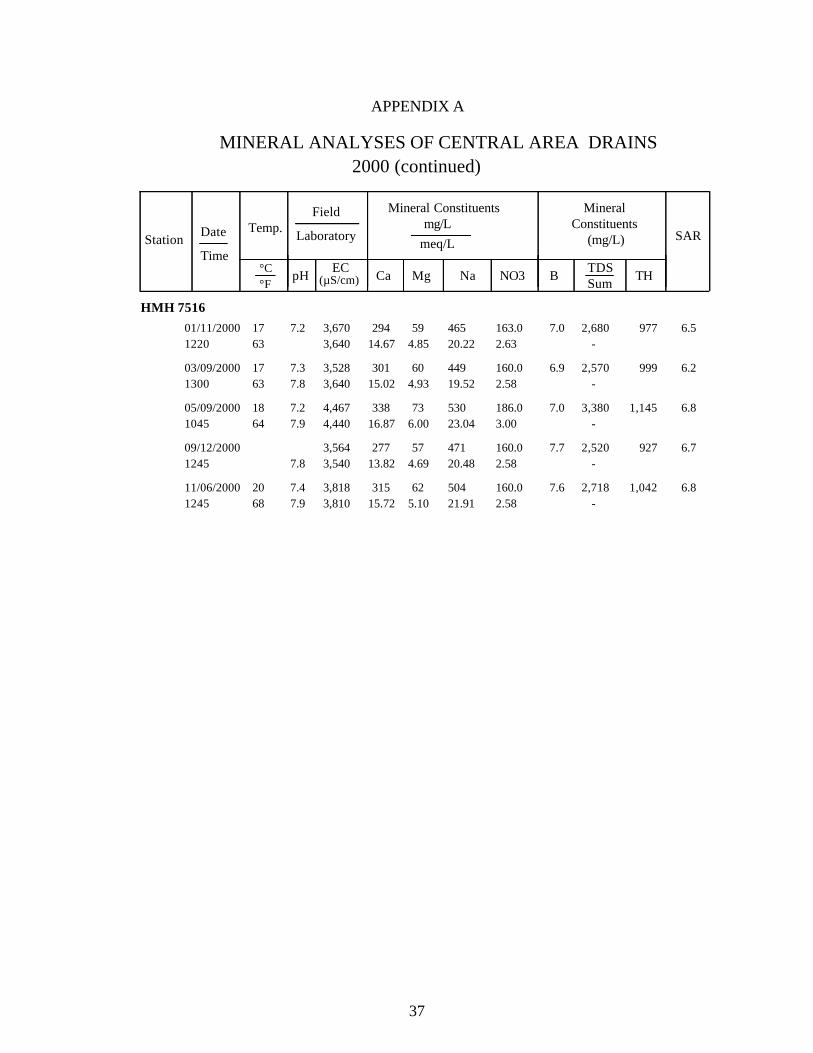
APPENDIX A
MINERAL ANALYSES IN DRAINAGE SUMPS
CENTRAL AREA
Station Date
Time
Temp.Field
Laboratory
pH EC Ca Mg Na NO3 B TDSSum TH
SAR
Mineral Constituentsmg/L
meq/L
MineralConstituents
(mg/L)
(µS/cm) °C °F
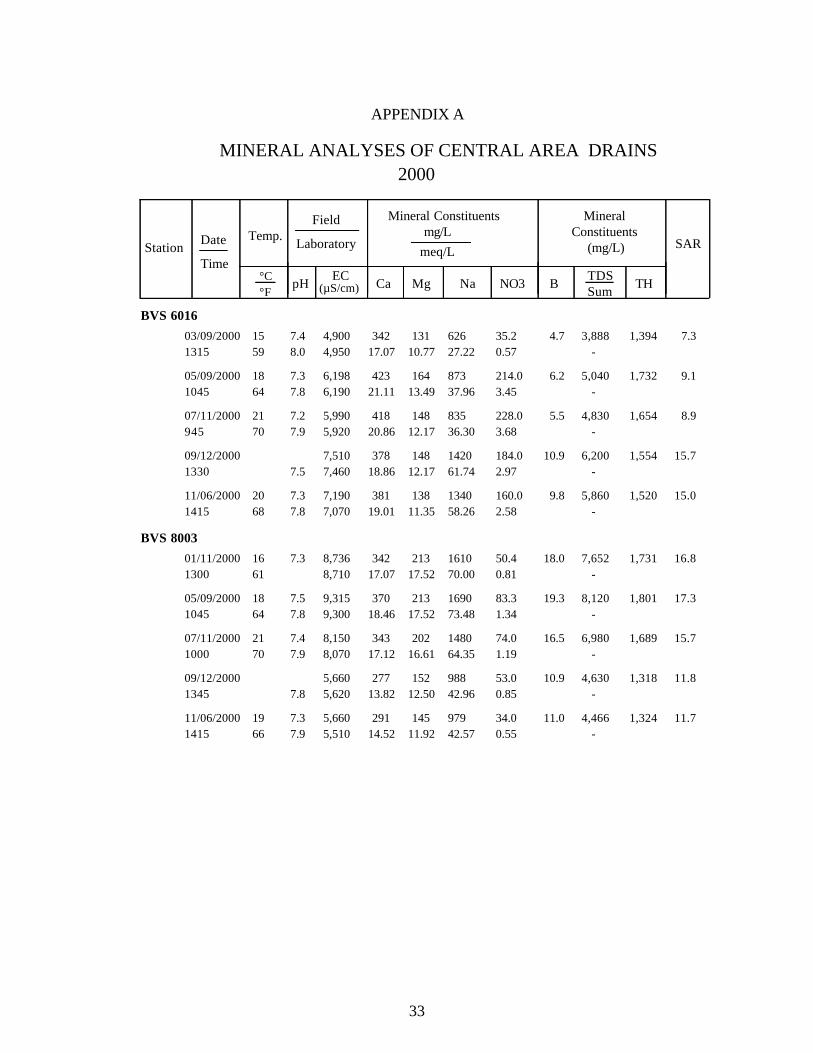
APPENDIX A
MINERAL ANALYSES OF CENTRAL AREA DRAINS2000
BVS 60164,9004,950
7.48.0
342 131 7.34.7 3,88817.07 27.22 0.57
1,39459 10.77
626 35.2-
03/09/20001315
15
6,1986,190
7.37.8
423 164 9.16.2 5,04021.11 37.96 3.45
1,73264 13.49
873 214.0-
05/09/20001045
18
5,9905,920
7.27.9
418 148 8.95.5 4,83020.86 36.30 3.68
1,65470 12.17
835 228.0-
07/11/2000945
21
7,5107,4607.5
378 148 15.710.9 6,20018.86 61.74 2.97
1,55412.17
1420 184.0-
09/12/20001330
7,1907,070
7.37.8
381 138 15.09.8 5,86019.01 58.26 2.58
1,52068 11.35
1340 160.0-
11/06/20001415
20
BVS 80038,7368,710
7.3 342 213 16.818.0 7,65217.07 70.00 0.81
1,73161 17.52
1610 50.4-
01/11/20001300
16
9,3159,300
7.57.8
370 213 17.319.3 8,12018.46 73.48 1.34
1,80164 17.52
1690 83.3-
05/09/20001045
18
8,1508,070
7.47.9
343 202 15.716.5 6,98017.12 64.35 1.19
1,68970 16.61
1480 74.0-
07/11/20001000
21
5,6605,6207.8
277 152 11.810.9 4,63013.82 42.96 0.85
1,31812.50
988 53.0-
09/12/20001345
5,6605,510
7.37.9
291 145 11.711.0 4,46614.52 42.57 0.55
1,32466 11.92
979 34.0-
11/06/20001415
19
33
Station Date
Time
Temp.Field
Laboratory
pH EC Ca Mg Na NO3 B TDSSum TH
SAR
Mineral Constituentsmg/L
meq/L
MineralConstituents
(mg/L)
(µS/cm) °C °F
APPENDIX A
MINERAL ANALYSES OF CENTRAL AREA DRAINS2000 (continued)
CTL 45041,042
7117.9 33 18 2.70.4 422
1.62 3.39 0.10154
46 1.4677.96 5.9
-01/11/2000930
8
855926
8.07.7
53 20 2.51.1 5502.64 3.65 0.02
21554 1.64
84 1.2-
03/09/20001030
12
627540
8.07.3
27 14 2.30.3 3341.34 2.54 0.06
12464 1.14
58.53 3.6-
05/09/20001045
18
647632
8.28.0
33 15 2.40.6 3741.62 2.90 0.06
14264 1.21
66.73 3.9-
07/11/2000750
18
4064067.3
21 11 1.90.2 2311.02 1.92 0.05
980.94
44.1 2.9-
09/12/2000945
506501
8.27.9
20 12 2.70.2 2791.01 2.68 0.05
10161 1.01
61.56 3.3-
11/06/20001415
16
DPS 13675,2395,210
7.3 530 120 5.45.2 4,06226.45 22.96 3.39
1,81863 9.87
528 210.0-
01/11/20001200
17
5,4285,600
7.47.6
590 130 5.05.0 4,17029.44 22.17 3.53
2,00963 10.69
510 219.0-
03/09/20001230
17
5,5325,470
7.37.9
591 127 5.45.4 4,26029.49 23.91 3.61
1,99964 10.44
550 224.0-
05/09/20001045
18
5,5905,400
7.47.9
581 127 5.04.7 4,26028.99 22.09 3.50
1,97468 10.44
508 217.0-
07/11/2000815
20
5,5205,4907.6
597 133 5.55.3 4,25029.79 24.83 3.56
2,03910.94
571 221.0-
09/12/20001230
5,6705,520
7.47.8
634 140 5.45.1 4,22431.64 25.09 3.34
2,16068 11.51
577 207.0-
11/06/20001415
20
34
Station Date
Time
Temp.Field
Laboratory
pH EC Ca Mg Na NO3 B TDSSum TH
SAR
Mineral Constituentsmg/L
meq/L
MineralConstituents
(mg/L)
(µS/cm) °C °F
APPENDIX A
MINERAL ANALYSES OF CENTRAL AREA DRAINS2000 (continued)
DPS 25359,6609,910
7.3 465 212 16.521.0 7,69223.20 74.35 1.63
2,03464 17.43
1710 101.0-
01/11/20001100
18
8,0508,790
7.2 415 171 14.61.1 6,82020.71 60.87 0.33
1,74164 14.06
1400 20.4-
03/09/20001130
18
8,0168,000
7.4 394 156 13.617.0 6,24019.66 54.78 1.41
1,62764 12.83
1260 87.3-
05/09/20001045
18
8,1908,090
7.48.0
384 161 14.717.9 6,40019.16 59.13 1.42
1,62268 13.24
1360 88.0-
07/11/2000845
20
DPS 32354,8694,860
8.2 331 95 8.28.1 3,66216.52 28.61 2.56
1,21846 7.81
658 159.0-
01/11/20001000
8
4,9774,910
8.48.1
349 94 7.87.8 3,72017.42 27.48 2.10
1,25964 7.73
632 130.0-
05/09/20001045
18
3,9564,020
8.28.2
274 75 7.77.5 2,99013.67 24.26 1.29
99472 6.18
558 80.0-
07/11/2000900
22
4,6804,6608.3
350 98 8.18.5 3,51017.47 28.87 1.60
1,2788.06
664 99.0-
09/12/20001030
5,0604,970
8.38.3
370 101 8.88.6 3,84018.46 32.04 2.35
1,34063 8.31
737 146.0-
11/06/20001415
17
DPS 34658,1078,300
7.2 536 199 11.216.0 6,52826.75 51.74 1.36
2,15861 16.37
1190 84.2-
01/11/20001130
16
7,3168,240
7.27.6
542 196 10.114.9 6,26027.05 46.96 0.29
2,16163 16.12
1080 17.7-
03/09/20001215
17
7,1515,400
7.38.0
452 159 9.511.7 5,40022.55 40.04 1.04
1,78463 13.08
921 64.2-
05/09/20001045
17
5,7105,610
7.27.9
394 129 8.59.6 4,25019.66 32.87 0.97
1,51566 10.61
756 60.0-
07/11/2000830
19
5,4305,3808.1
519 114 7.08.0 4,28025.90 29.57 1.02
1,7669.38
680 63.0-
09/12/20001145
35
Station Date
Time
Temp.Field
Laboratory
pH EC Ca Mg Na NO3 B TDSSum TH
SAR
Mineral Constituentsmg/L
meq/L
MineralConstituents
(mg/L)
(µS/cm) °C °F
APPENDIX A
MINERAL ANALYSES OF CENTRAL AREA DRAINS2000 (continued)
DPS 46168,0508,0007.7
398 266 13.539.0 6,94019.86 61.74 0.55
2,09021.88
1420 34.0-
09/12/20001115
FBH 20168,8508,890
7.3 438 291 13.615.0 7,98421.86 65.22 1.35
2,29263 23.93
1500 83.7-
01/11/20001425
17
7,6947,640
7.37.9
414 220 11.311.8 6,72020.66 49.57 1.01
1,94063 18.09
1140 62.9-
05/09/20001045
17
7,9007,900
7.37.8
439 238 12.913.8 6,98021.91 58.70 1.05
2,07768 19.57
1350 65.0-
07/11/20001045
20
8,2708,2107.7
454 258 13.615.1 7,30022.65 63.48 1.05
2,19621.22
1460 65.0-
09/12/20001015
FBH 80617,3167,390
7.0 476 189 11.816.0 6,60023.75 52.17 0.67
1,96759 15.54
1200 41.7-
01/11/20001330
15
4,2135,400
7.38.1
336 124 6.56.9 3,57016.77 23.70 0.68
1,35063 10.20
545 42.0-
05/09/20001045
17
4,7964,810
7.28.0
318 130 8.38.3 3,97015.87 30.13 1.61
1,33068 10.69
693 100.0-
07/11/20001015
20
3,2713,1707.8
292 94 5.25.4 2,66014.57 17.30 0.39
1,1167.73
398 24.0-
09/12/20001430
2,0302,010
7.18.0
221 53 3.02.5 1,60611.03 8.39 0.09
77066 4.36
193 5.6-
11/06/20001415
19
36
Station Date
Time
Temp.Field
Laboratory
pH EC Ca Mg Na NO3 B TDSSum TH
SAR
Mineral Constituentsmg/L
meq/L
MineralConstituents
(mg/L)
(µS/cm) °C °F
APPENDIX A
MINERAL ANALYSES OF CENTRAL AREA DRAINS2000 (continued)
HMH 75163,6703,640
7.2 294 59 6.57.0 2,68014.67 20.22 2.63
97763 4.85
465 163.0-
01/11/20001220
17
3,5283,640
7.37.8
301 60 6.26.9 2,57015.02 19.52 2.58
99963 4.93
449 160.0-
03/09/20001300
17
4,4674,440
7.27.9
338 73 6.87.0 3,38016.87 23.04 3.00
1,14564 6.00
530 186.0-
05/09/20001045
18
3,5643,5407.8
277 57 6.77.7 2,52013.82 20.48 2.58
9274.69
471 160.0-
09/12/20001245
3,8183,810
7.47.9
315 62 6.87.6 2,71815.72 21.91 2.58
1,04268 5.10
504 160.0-
11/06/20001245
20
37
38
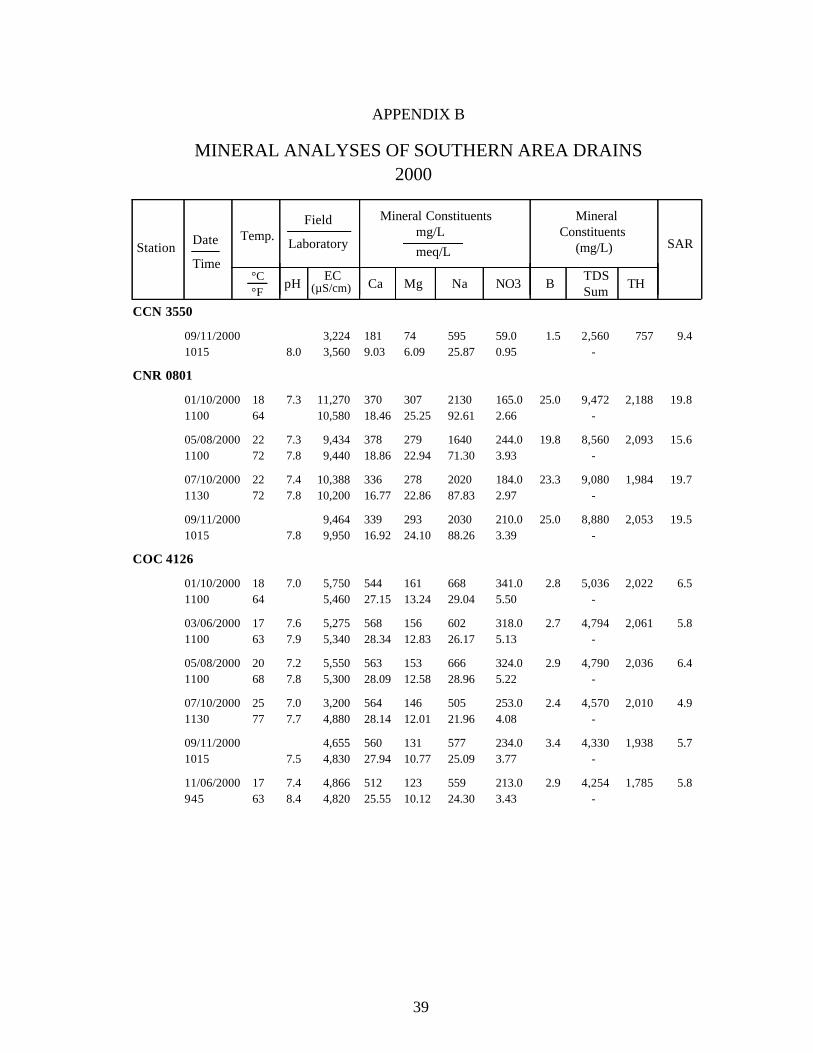
APPENDIX B
MINERAL ANALYSES IN DRAINAGE SUMPS
SOUTHERN AREA
Station Date
Time
Temp.Field
Laboratory
pH EC Ca Mg Na NO3 B TDSSum TH
SAR
Mineral Constituentsmg/Lmeq/L
MineralConstituents
(mg/L)
(µS/cm) °C °F
APPENDIX B
MINERAL ANALYSES OF SOUTHERN AREA DRAINS2000
CCN 3550
3,2243,5608.0
181 74 9.41.5 2,5609.03 25.87 0.95
7576.09
595 59.0-
09/11/20001015
CNR 0801
11,27010,580
7.3 370 307 19.825.0 9,47218.46 92.61 2.66
2,18864 25.25
2130 165.0-
01/10/20001100
18
9,4349,440
7.37.8
378 279 15.619.8 8,56018.86 71.30 3.93
2,09372 22.94
1640 244.0-
05/08/20001100
22
10,38810,200
7.47.8
336 278 19.723.3 9,08016.77 87.83 2.97
1,98472 22.86
2020 184.0-
07/10/20001130
22
9,4649,9507.8
339 293 19.525.0 8,88016.92 88.26 3.39
2,05324.10
2030 210.0-
09/11/20001015
COC 4126
5,7505,460
7.0 544 161 6.52.8 5,03627.15 29.04 5.50
2,02264 13.24
668 341.0-
01/10/20001100
18
5,2755,340
7.67.9
568 156 5.82.7 4,79428.34 26.17 5.13
2,06163 12.83
602 318.0-
03/06/20001100
17
5,5505,300
7.27.8
563 153 6.42.9 4,79028.09 28.96 5.22
2,03668 12.58
666 324.0-
05/08/20001100
20
3,2004,880
7.07.7
564 146 4.92.4 4,57028.14 21.96 4.08
2,01077 12.01
505 253.0-
07/10/20001130
25
4,6554,8307.5
560 131 5.73.4 4,33027.94 25.09 3.77
1,93810.77
577 234.0-
09/11/20001015
4,8664,820
7.48.4
512 123 5.82.9 4,25425.55 24.30 3.43
1,78563 10.12
559 213.0-
11/06/2000945
17
39
Station Date
Time
Temp.Field
Laboratory
pH EC Ca Mg Na NO3 B TDSSum TH
SAR
Mineral Constituentsmg/Lmeq/L
MineralConstituents
(mg/L)
(µS/cm) °C °F
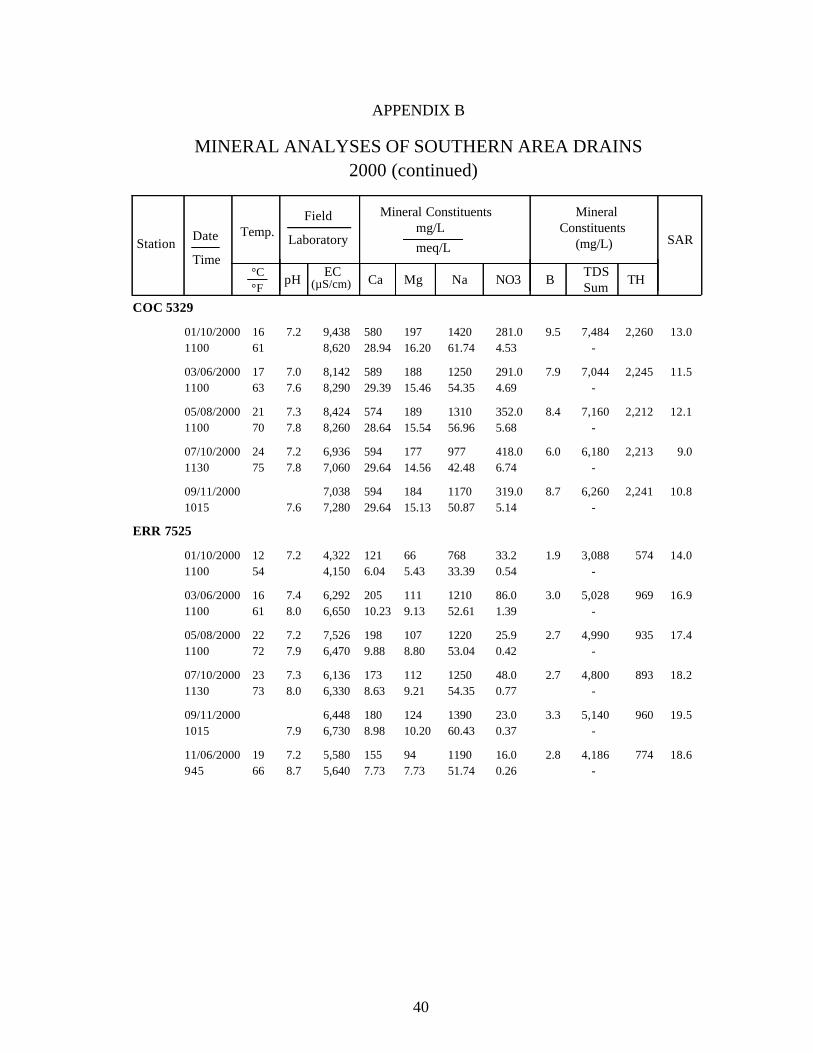
APPENDIX B
MINERAL ANALYSES OF SOUTHERN AREA DRAINS2000 (continued)
COC 5329
9,4388,620
7.2 580 197 13.09.5 7,48428.94 61.74 4.53
2,26061 16.20
1420 281.0-
01/10/20001100
16
8,1428,290
7.07.6
589 188 11.57.9 7,04429.39 54.35 4.69
2,24563 15.46
1250 291.0-
03/06/20001100
17
8,4248,260
7.37.8
574 189 12.18.4 7,16028.64 56.96 5.68
2,21270 15.54
1310 352.0-
05/08/20001100
21
6,9367,060
7.27.8
594 177 9.06.0 6,18029.64 42.48 6.74
2,21375 14.56
977 418.0-
07/10/20001130
24
7,0387,2807.6
594 184 10.88.7 6,26029.64 50.87 5.14
2,24115.13
1170 319.0-
09/11/20001015
ERR 7525
4,3224,150
7.2 121 66 14.01.9 3,0886.04 33.39 0.54
57454 5.43
768 33.2-
01/10/20001100
12
6,2926,650
7.48.0
205 111 16.93.0 5,02810.23 52.61 1.39
96961 9.13
1210 86.0-
03/06/20001100
16
7,5266,470
7.27.9
198 107 17.42.7 4,9909.88 53.04 0.42
93572 8.80
1220 25.9-
05/08/20001100
22
6,1366,330
7.38.0
173 112 18.22.7 4,8008.63 54.35 0.77
89373 9.21
1250 48.0-
07/10/20001130
23
6,4486,7307.9
180 124 19.53.3 5,1408.98 60.43 0.37
96010.20
1390 23.0-
09/11/20001015
5,5805,640
7.28.7
155 94 18.62.8 4,1867.73 51.74 0.26
77466 7.73
1190 16.0-
11/06/2000945
19
40
Station Date
Time
Temp.Field
Laboratory
pH EC Ca Mg Na NO3 B TDSSum TH
SAR
Mineral Constituentsmg/Lmeq/L
MineralConstituents
(mg/L)
(µS/cm) °C °F
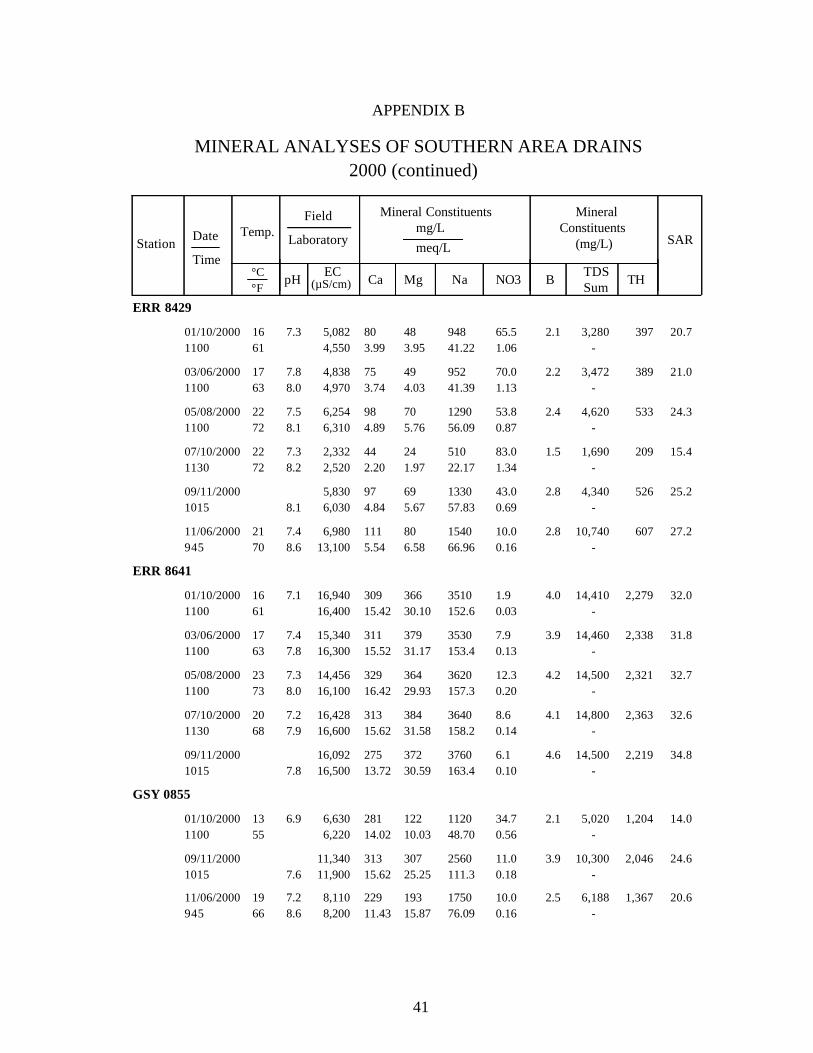
APPENDIX B
MINERAL ANALYSES OF SOUTHERN AREA DRAINS2000 (continued)
ERR 8429
5,0824,550
7.3 80 48 20.72.1 3,2803.99 41.22 1.06
39761 3.95
948 65.5-
01/10/20001100
16
4,8384,970
7.88.0
75 49 21.02.2 3,4723.74 41.39 1.13
38963 4.03
952 70.0-
03/06/20001100
17
6,2546,310
7.58.1
98 70 24.32.4 4,6204.89 56.09 0.87
53372 5.76
1290 53.8-
05/08/20001100
22
2,3322,520
7.38.2
44 24 15.41.5 1,6902.20 22.17 1.34
20972 1.97
510 83.0-
07/10/20001130
22
5,8306,0308.1
97 69 25.22.8 4,3404.84 57.83 0.69
5265.67
1330 43.0-
09/11/20001015
6,98013,100
7.48.6
111 80 27.22.8 10,7405.54 66.96 0.16
60770 6.58
1540 10.0-
11/06/2000945
21
ERR 8641
16,94016,400
7.1 309 366 32.04.0 14,41015.42 152.6 0.03
2,27961 30.10
3510 1.9-
01/10/20001100
16
15,34016,300
7.47.8
311 379 31.83.9 14,46015.52 153.4 0.13
2,33863 31.17
3530 7.9-
03/06/20001100
17
14,45616,100
7.38.0
329 364 32.74.2 14,50016.42 157.3 0.20
2,32173 29.93
3620 12.3-
05/08/20001100
23
16,42816,600
7.27.9
313 384 32.64.1 14,80015.62 158.2 0.14
2,36368 31.58
3640 8.6-
07/10/20001130
20
16,09216,5007.8
275 372 34.84.6 14,50013.72 163.4 0.10
2,21930.59
3760 6.1-
09/11/20001015
GSY 0855
6,6306,220
6.9 281 122 14.02.1 5,02014.02 48.70 0.56
1,20455 10.03
1120 34.7-
01/10/20001100
13
11,34011,9007.6
313 307 24.63.9 10,30015.62 111.3 0.18
2,04625.25
2560 11.0-
09/11/20001015
8,1108,200
7.28.6
229 193 20.62.5 6,18811.43 76.09 0.16
1,36766 15.87
1750 10.0-
11/06/2000945
19
41
Station Date
Time
Temp.Field
Laboratory
pH EC Ca Mg Na NO3 B TDSSum TH
SAR
Mineral Constituentsmg/Lmeq/L
MineralConstituents
(mg/L)
(µS/cm) °C °F
APPENDIX B
MINERAL ANALYSES OF SOUTHERN AREA DRAINS2000 (continued)
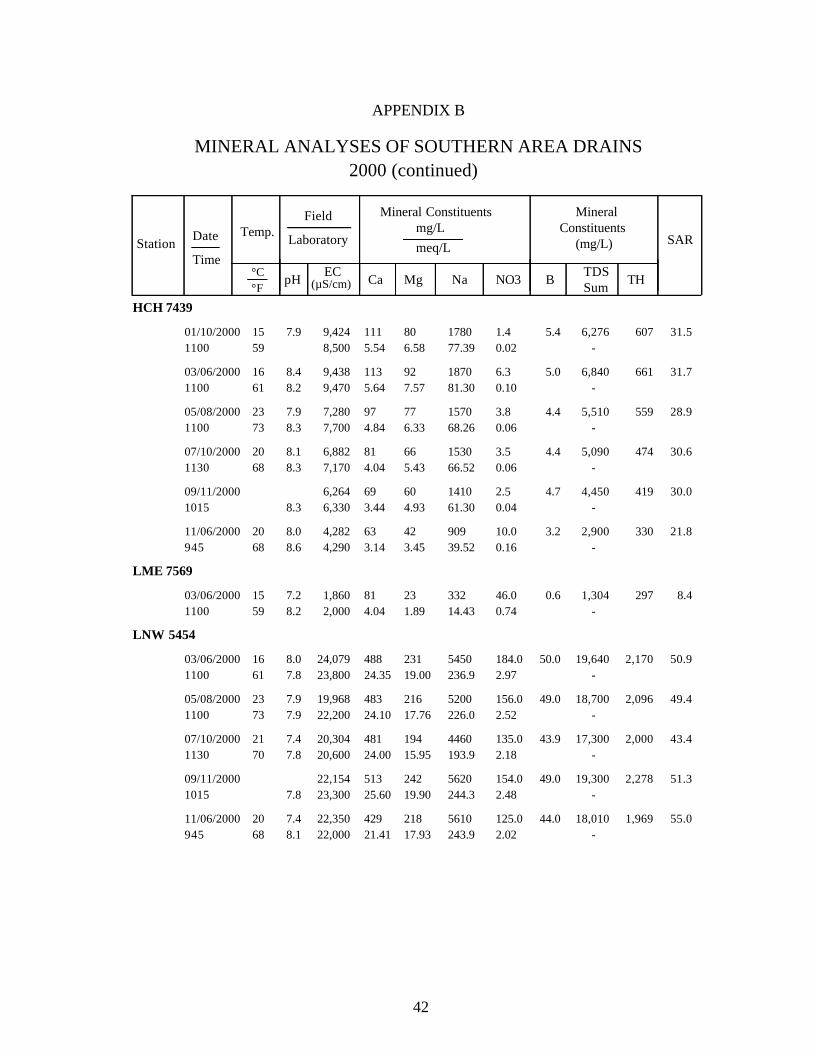
HCH 7439
9,4248,500
7.9 111 80 31.55.4 6,2765.54 77.39 0.02
60759 6.58
1780 1.4-
01/10/20001100
15
9,4389,470
8.48.2
113 92 31.75.0 6,8405.64 81.30 0.10
66161 7.57
1870 6.3-
03/06/20001100
16
7,2807,700
7.98.3
97 77 28.94.4 5,5104.84 68.26 0.06
55973 6.33
1570 3.8-
05/08/20001100
23
6,8827,170
8.18.3
81 66 30.64.4 5,0904.04 66.52 0.06
47468 5.43
1530 3.5-
07/10/20001130
20
6,2646,3308.3
69 60 30.04.7 4,4503.44 61.30 0.04
4194.93
1410 2.5-
09/11/20001015
4,2824,290
8.08.6
63 42 21.83.2 2,9003.14 39.52 0.16
33068 3.45
909 10.0-
11/06/2000945
20
LME 7569
1,8602,000
7.28.2
81 23 8.40.6 1,3044.04 14.43 0.74
29759 1.89
332 46.0-
03/06/20001100
15
LNW 5454
24,07923,800
8.07.8
488 231 50.950.0 19,64024.35 236.9 2.97
2,17061 19.00
5450 184.0-
03/06/20001100
16
19,96822,200
7.97.9
483 216 49.449.0 18,70024.10 226.0 2.52
2,09673 17.76
5200 156.0-
05/08/20001100
23
20,30420,600
7.47.8
481 194 43.443.9 17,30024.00 193.9 2.18
2,00070 15.95
4460 135.0-
07/10/20001130
21
22,15423,3007.8
513 242 51.349.0 19,30025.60 244.3 2.48
2,27819.90
5620 154.0-
09/11/20001015
22,35022,000
7.48.1
429 218 55.044.0 18,01021.41 243.9 2.02
1,96968 17.93
5610 125.0-
11/06/2000945
20
42
Station Date
Time
Temp.Field
Laboratory
pH EC Ca Mg Na NO3 B TDSSum TH
SAR
Mineral Constituentsmg/Lmeq/L
MineralConstituents
(mg/L)
(µS/cm) °C °F
APPENDIX B
MINERAL ANALYSES OF SOUTHERN AREA DRAINS2000 (continued)
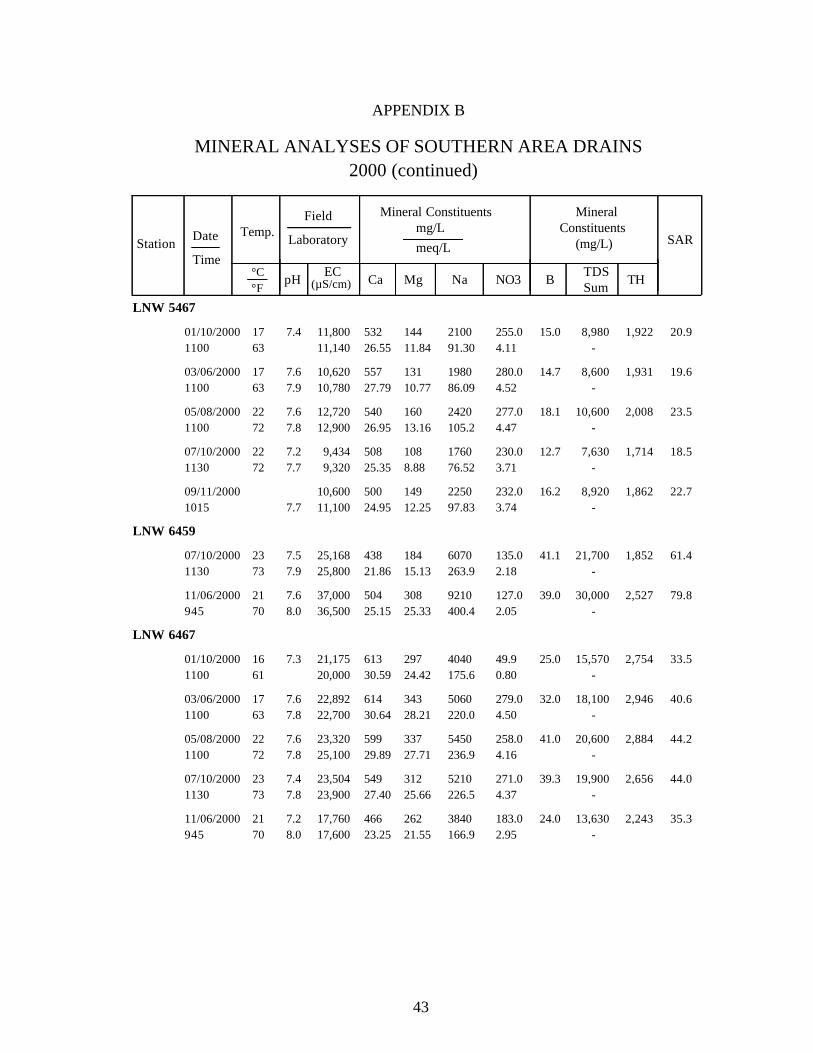
LNW 5467
11,80011,140
7.4 532 144 20.915.0 8,98026.55 91.30 4.11
1,92263 11.84
2100 255.0-
01/10/20001100
17
10,62010,780
7.67.9
557 131 19.614.7 8,60027.79 86.09 4.52
1,93163 10.77
1980 280.0-
03/06/20001100
17
12,72012,900
7.67.8
540 160 23.518.1 10,60026.95 105.2 4.47
2,00872 13.16
2420 277.0-
05/08/20001100
22
9,4349,320
7.27.7
508 108 18.512.7 7,63025.35 76.52 3.71
1,71472 8.88
1760 230.0-
07/10/20001130
22
10,60011,1007.7
500 149 22.716.2 8,92024.95 97.83 3.74
1,86212.25
2250 232.0-
09/11/20001015
LNW 6459
25,16825,800
7.57.9
438 184 61.441.1 21,70021.86 263.9 2.18
1,85273 15.13
6070 135.0-
07/10/20001130
23
37,00036,500
7.68.0
504 308 79.839.0 30,00025.15 400.4 2.05
2,52770 25.33
9210 127.0-
11/06/2000945
21
LNW 6467
21,17520,000
7.3 613 297 33.525.0 15,57030.59 175.6 0.80
2,75461 24.42
4040 49.9-
01/10/20001100
16
22,89222,700
7.67.8
614 343 40.632.0 18,10030.64 220.0 4.50
2,94663 28.21
5060 279.0-
03/06/20001100
17
23,32025,100
7.67.8
599 337 44.241.0 20,60029.89 236.9 4.16
2,88472 27.71
5450 258.0-
05/08/20001100
22
23,50423,900
7.47.8
549 312 44.039.3 19,90027.40 226.5 4.37
2,65673 25.66
5210 271.0-
07/10/20001130
23
17,76017,600
7.28.0
466 262 35.324.0 13,63023.25 166.9 2.95
2,24370 21.55
3840 183.0-
11/06/2000945
21
43
Station Date
Time
Temp.Field
Laboratory
pH EC Ca Mg Na NO3 B TDSSum TH
SAR
Mineral Constituentsmg/Lmeq/L
MineralConstituents
(mg/L)
(µS/cm) °C °F
APPENDIX B
MINERAL ANALYSES OF SOUTHERN AREA DRAINS2000 (continued)
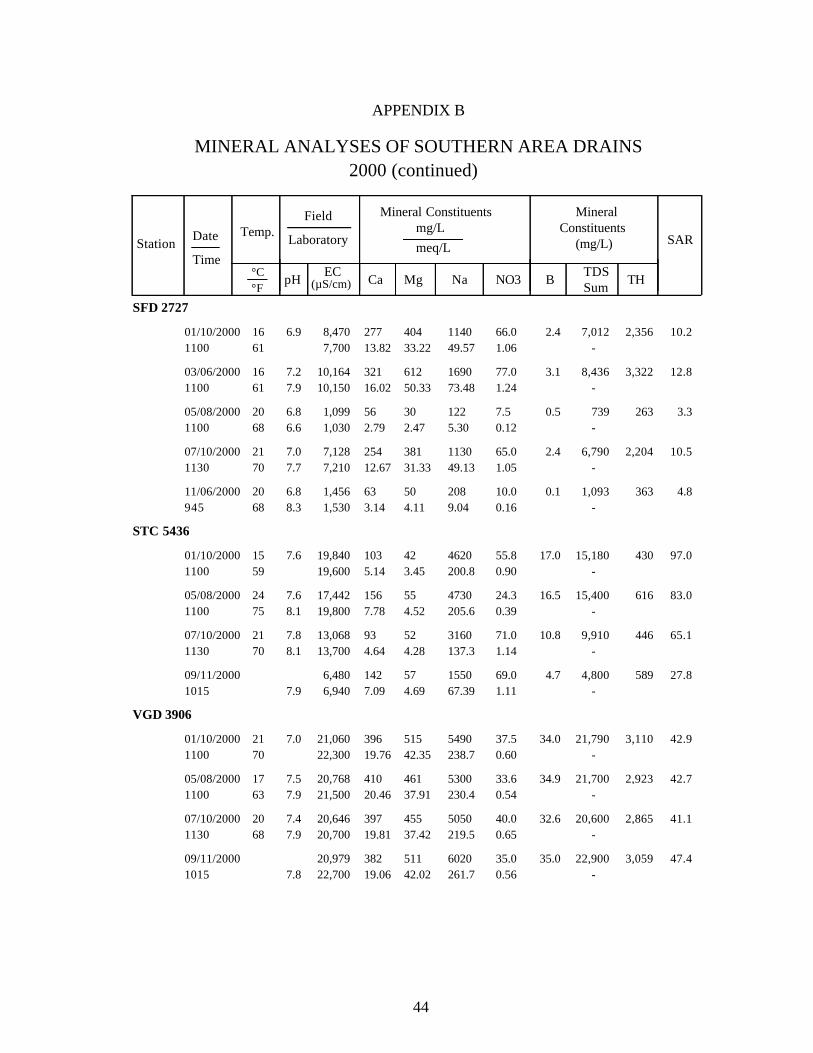
SFD 2727
8,4707,700
6.9 277 404 10.22.4 7,01213.82 49.57 1.06
2,35661 33.22
1140 66.0-
01/10/20001100
16
10,16410,150
7.27.9
321 612 12.83.1 8,43616.02 73.48 1.24
3,32261 50.33
1690 77.0-
03/06/20001100
16
1,0991,030
6.86.6
56 30 3.30.5 7392.79 5.30 0.12
26368 2.47
122 7.5-
05/08/20001100
20
7,1287,210
7.07.7
254 381 10.52.4 6,79012.67 49.13 1.05
2,20470 31.33
1130 65.0-
07/10/20001130
21
1,4561,530
6.88.3
63 50 4.80.1 1,0933.14 9.04 0.16
36368 4.11
208 10.0-
11/06/2000945
20
STC 5436
19,84019,600
7.6 103 42 97.017.0 15,1805.14 200.8 0.90
43059 3.45
4620 55.8-
01/10/20001100
15
17,44219,800
7.68.1
156 55 83.016.5 15,4007.78 205.6 0.39
61675 4.52
4730 24.3-
05/08/20001100
24
13,06813,700
7.88.1
93 52 65.110.8 9,9104.64 137.3 1.14
44670 4.28
3160 71.0-
07/10/20001130
21
6,4806,9407.9
142 57 27.84.7 4,8007.09 67.39 1.11
5894.69
1550 69.0-
09/11/20001015
VGD 3906
21,06022,300
7.0 396 515 42.934.0 21,79019.76 238.7 0.60
3,11070 42.35
5490 37.5-
01/10/20001100
21
20,76821,500
7.57.9
410 461 42.734.9 21,70020.46 230.4 0.54
2,92363 37.91
5300 33.6-
05/08/20001100
17
20,64620,700
7.47.9
397 455 41.132.6 20,60019.81 219.5 0.65
2,86568 37.42
5050 40.0-
07/10/20001130
20
20,97922,7007.8
382 511 47.435.0 22,90019.06 261.7 0.56
3,05942.02
6020 35.0-
09/11/20001015
44
Station Date
Time
Temp.Field
Laboratory
pH EC Ca Mg Na NO3 B TDSSum TH
SAR
Mineral Constituentsmg/Lmeq/L
MineralConstituents
(mg/L)
(µS/cm) °C °F
APPENDIX B
MINERAL ANALYSES OF SOUTHERN AREA DRAINS2000 (continued)
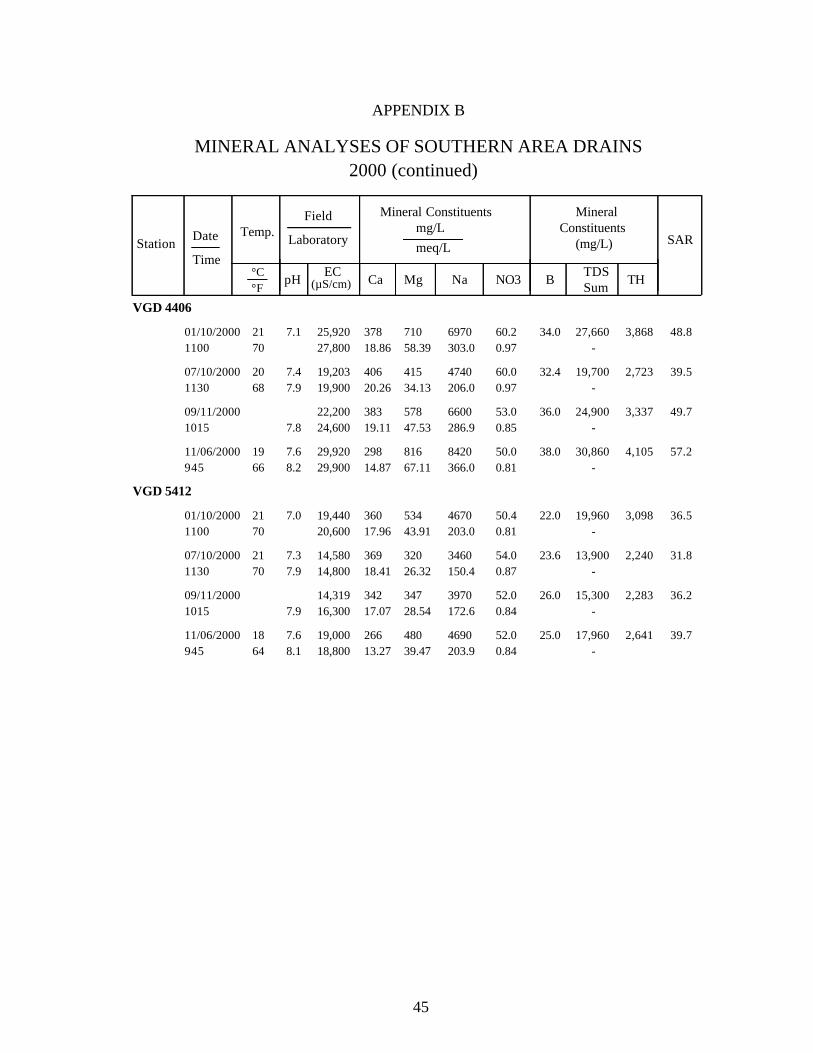
VGD 4406
25,92027,800
7.1 378 710 48.834.0 27,66018.86 303.0 0.97
3,86870 58.39
6970 60.2-
01/10/20001100
21
19,20319,900
7.47.9
406 415 39.532.4 19,70020.26 206.0 0.97
2,72368 34.13
4740 60.0-
07/10/20001130
20
22,20024,6007.8
383 578 49.736.0 24,90019.11 286.9 0.85
3,33747.53
6600 53.0-
09/11/20001015
29,92029,900
7.68.2
298 816 57.238.0 30,86014.87 366.0 0.81
4,10566 67.11
8420 50.0-
11/06/2000945
19
VGD 5412
19,44020,600
7.0 360 534 36.522.0 19,96017.96 203.0 0.81
3,09870 43.91
4670 50.4-
01/10/20001100
21
14,58014,800
7.37.9
369 320 31.823.6 13,90018.41 150.4 0.87
2,24070 26.32
3460 54.0-
07/10/20001130
21
14,31916,3007.9
342 347 36.226.0 15,30017.07 172.6 0.84
2,28328.54
3970 52.0-
09/11/20001015
19,00018,800
7.68.1
266 480 39.725.0 17,96013.27 203.9 0.84
2,64164 39.47
4690 52.0-
11/06/2000945
18
45
46
APPENDIX C
GRAPHS OF WATER QUALITY CATION TRENDS IN DRAINAGE SUMPS
CENTRAL AREA
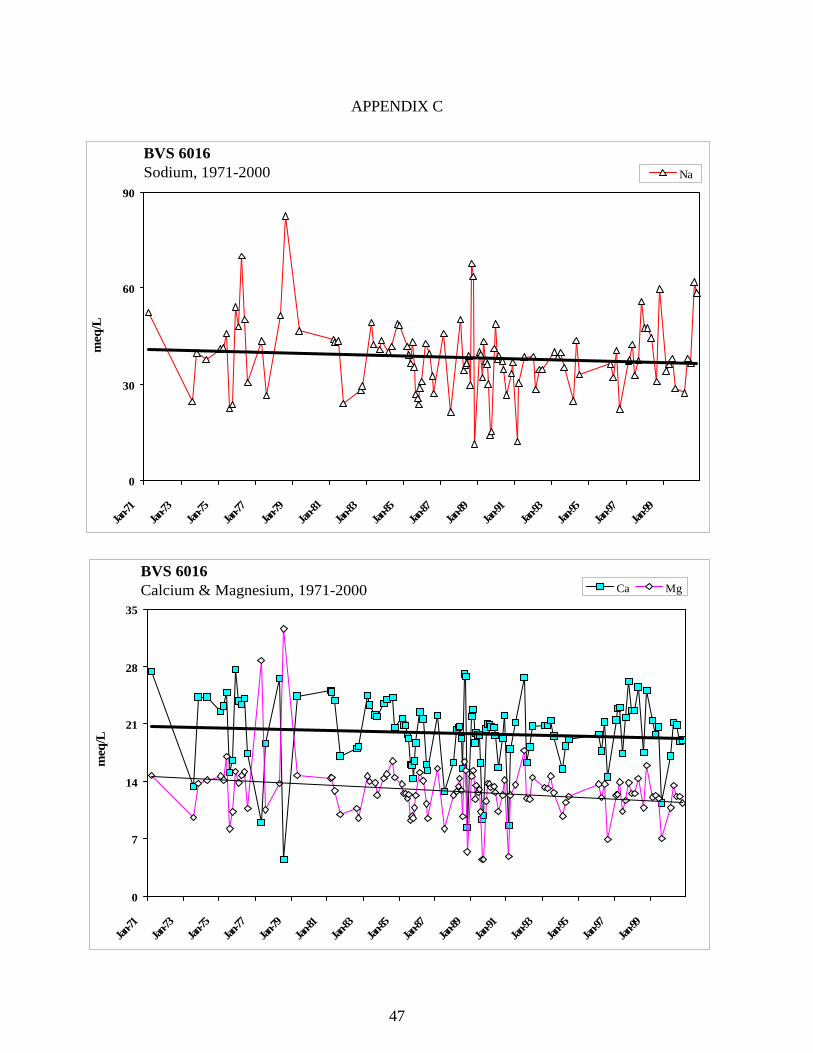
47
APPENDIX C
BVS 6016Calcium & Magnesium, 1971-2000
0
7
14
21
28
35
Jan-71
Jan-73
Jan-75
Jan-77
Jan-79
Jan-81
Jan-83
Jan-85
Jan-87
Jan-89
Jan-91
Jan-93
Jan-95
Jan-97
Jan-99
meq
/L
Ca Mg
BVS 6016Sodium, 1971-2000
0
30
60
90
Jan-71
Jan-73
Jan-75
Jan-77
Jan-79
Jan-81
Jan-83
Jan-85
Jan-87
Jan-89
Jan-91
Jan-93
Jan-95
Jan-97
Jan-99
meq
/L
Na
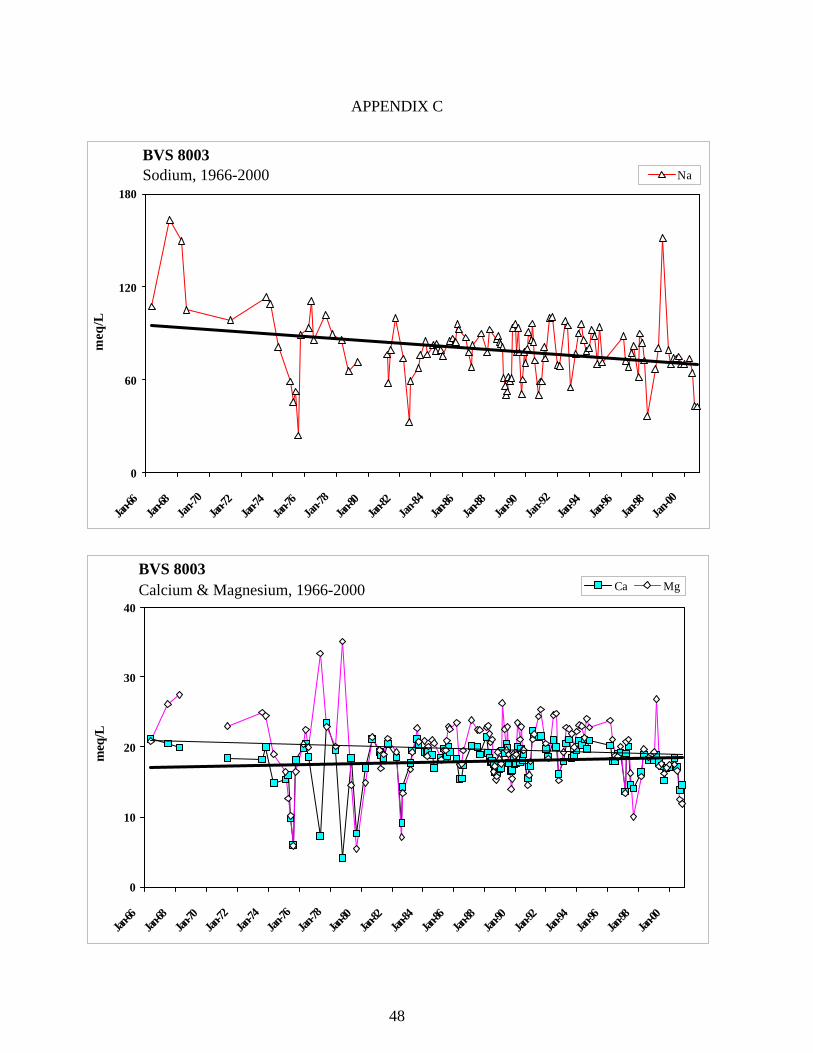
48
APPENDIX C
BVS 8003Sodium, 1966-2000
0
60
120
180
Jan-66
Jan-68
Jan-70
Jan-72
Jan-74
Jan-76
Jan-78
Jan-80
Jan-82
Jan-84
Jan-86
Jan-88
Jan-90
Jan-92
Jan-94
Jan-96
Jan-98
Jan-00
meq
/L
Na
BVS 8003Calcium & Magnesium, 1966-2000
0
10
20
30
40
Jan-66
Jan-68
Jan-70
Jan-72
Jan-74
Jan-76
Jan-78
Jan-80
Jan-82
Jan-84
Jan-86
Jan-88
Jan-90
Jan-92
Jan-94
Jan-96
Jan-98
Jan-00
meq
/L
Ca Mg
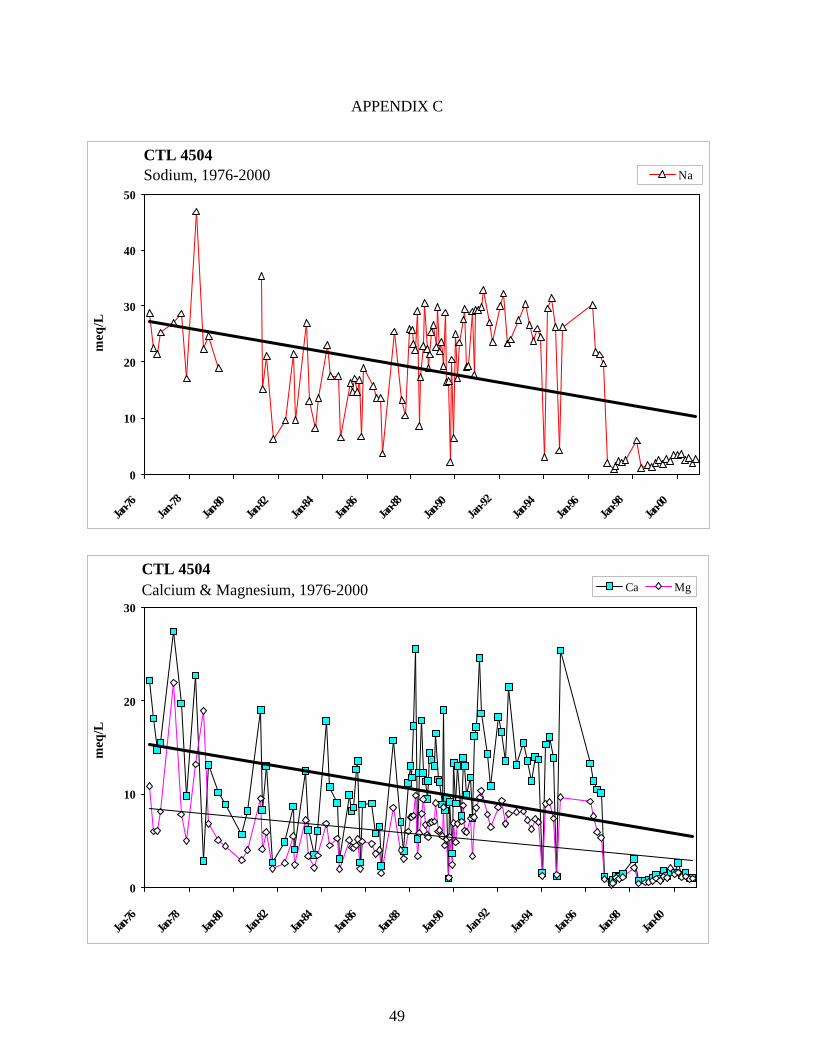
49
APPENDIX C
CTL 4504Sodium, 1976-2000
0
10
20
30
40
50
Jan-76
Jan-78
Jan-80
Jan-82
Jan-84
Jan-86
Jan-88
Jan-90
Jan-92
Jan-94
Jan-96
Jan-98
Jan-00
meq
/L
Na
CTL 4504Calcium & Magnesium, 1976-2000
0
10
20
30
Jan-76
Jan-78
Jan-80
Jan-82
Jan-84
Jan-86
Jan-88
Jan-90
Jan-92
Jan-94
Jan-96
Jan-98
Jan-00
meq
/L
Ca Mg
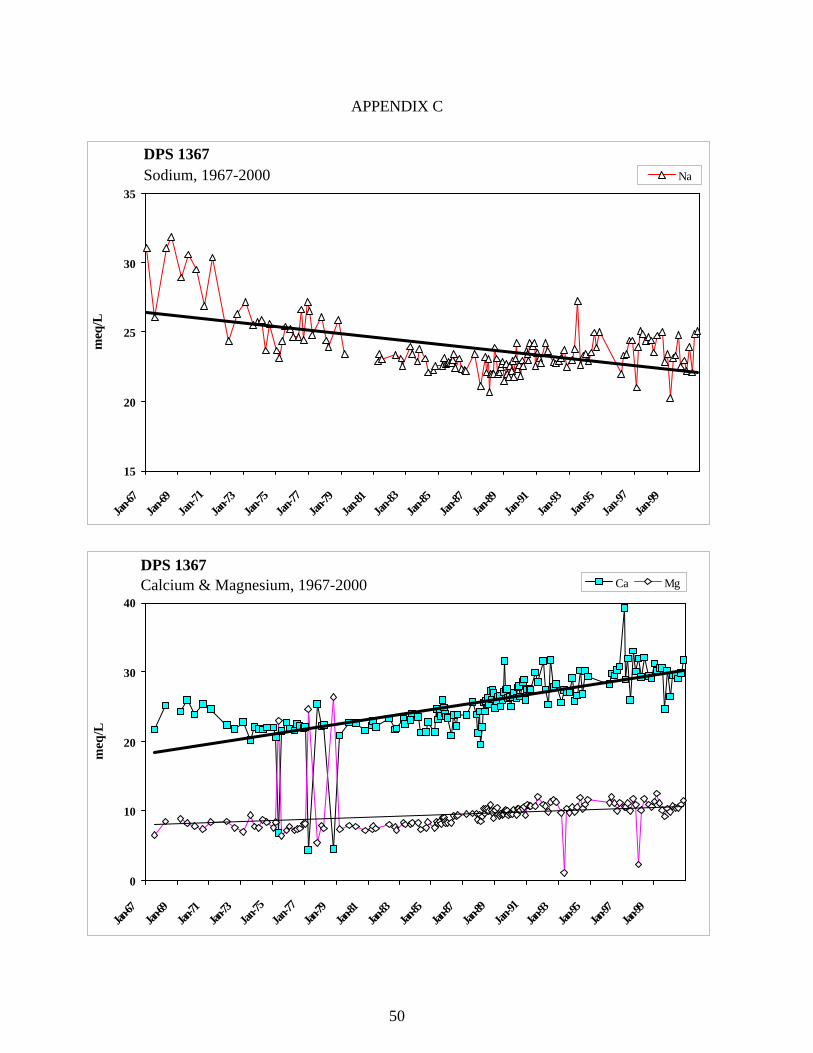
50
APPENDIX C
DPS 1367Sodium, 1967-2000
15
20
25
30
35
Jan-67
Jan-69
Jan-7
1Jan
-73Jan
-75Jan
-77Jan
-79Jan
-81Jan
-83Jan
-85Jan
-87Jan
-89Jan
-91Jan
-93Jan
-95Ja
n-97
Jan-99
meq
/L
Na
DPS 1367Calcium & Magnesium, 1967-2000
0
10
20
30
40
Jan-67
Jan-69
Jan-71
Jan-73
Jan-75
Jan-77
Jan-79
Jan-81
Jan-83
Jan-85
Jan-87
Jan-89
Jan-91
Jan-93
Jan-95
Jan-97
Jan-99
meq
/L
Ca Mg
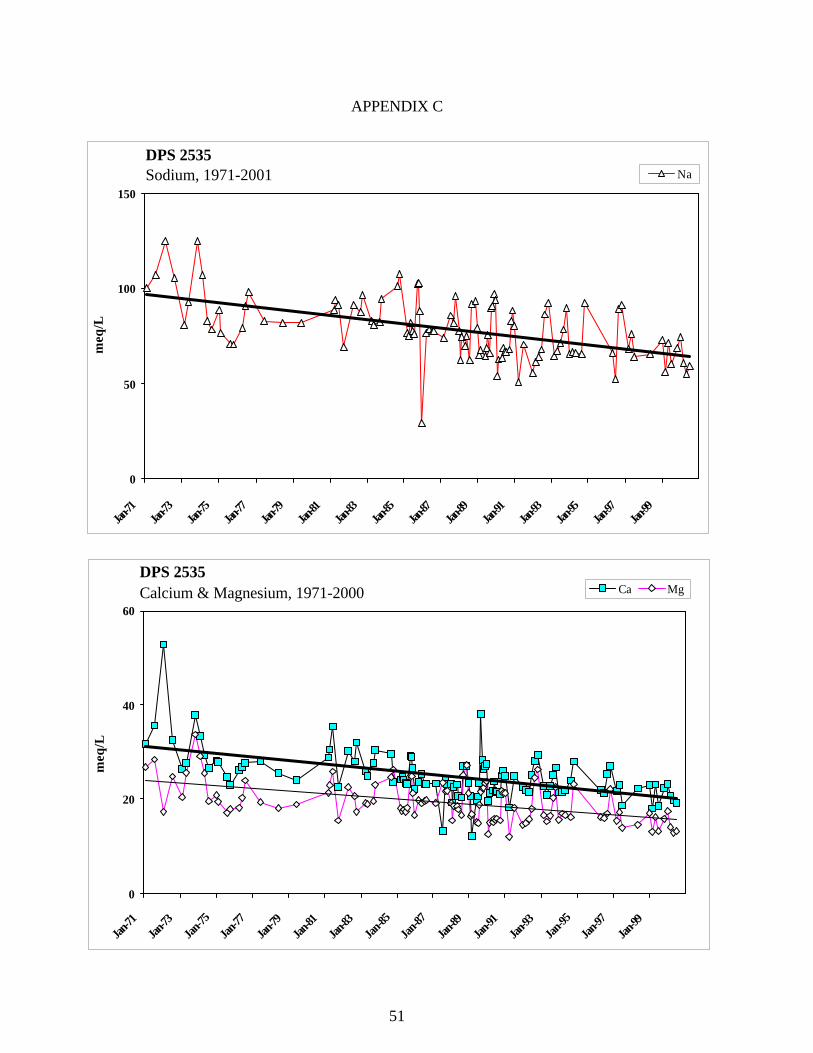
51
APPENDIX C
DPS 2535Sodium, 1971-2001
0
50
100
150
Jan-71
Jan-73
Jan-75
Jan-77
Jan-79
Jan-81
Jan-83
Jan-85
Jan-87
Jan-89
Jan-91
Jan-93
Jan-95
Jan-97
Jan-99
meq
/L
Na
DPS 2535Calcium & Magnesium, 1971-2000
0
20
40
60
Jan-71
Jan-73
Jan-75
Jan-77
Jan-79
Jan-81
Jan-83
Jan-85
Jan-87
Jan-89
Jan-91
Jan-93
Jan-95
Jan-97
Jan-99
meq
/L
Ca Mg
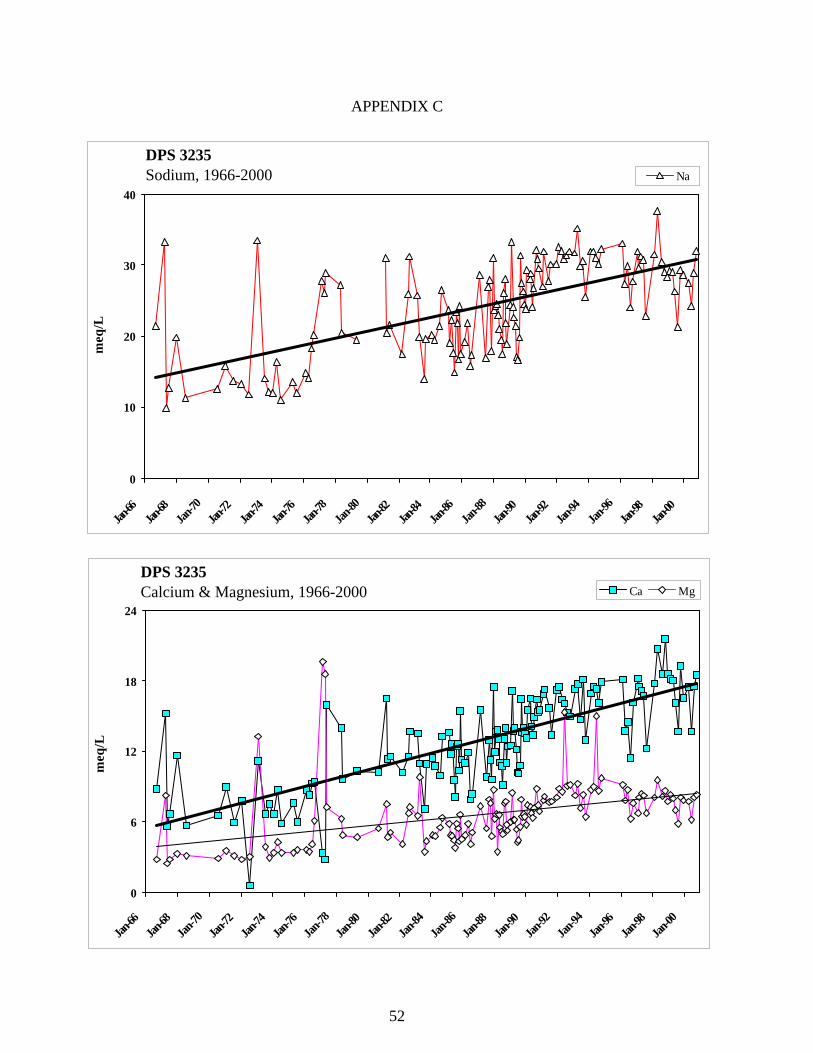
52
APPENDIX C
DPS 3235Sodium, 1966-2000
0
10
20
30
40
Jan-66
Jan-68
Jan-70
Jan-72
Jan-74
Jan-76
Jan-78
Jan-80
Jan-82
Jan-84
Jan-86
Jan-88
Jan-90
Jan-92
Jan-94
Jan-96
Jan-98
Jan-00
meq
/L
Na
DPS 3235Calcium & Magnesium, 1966-2000
0
6
12
18
24
Jan-66
Jan-68
Jan-70
Jan-72
Jan-74
Jan-76
Jan-78
Jan-80
Jan-82
Jan-84
Jan-86
Jan-88
Jan-90
Jan-92
Jan-94
Jan-96
Jan-98
Jan-00
meq
/L
Ca Mg
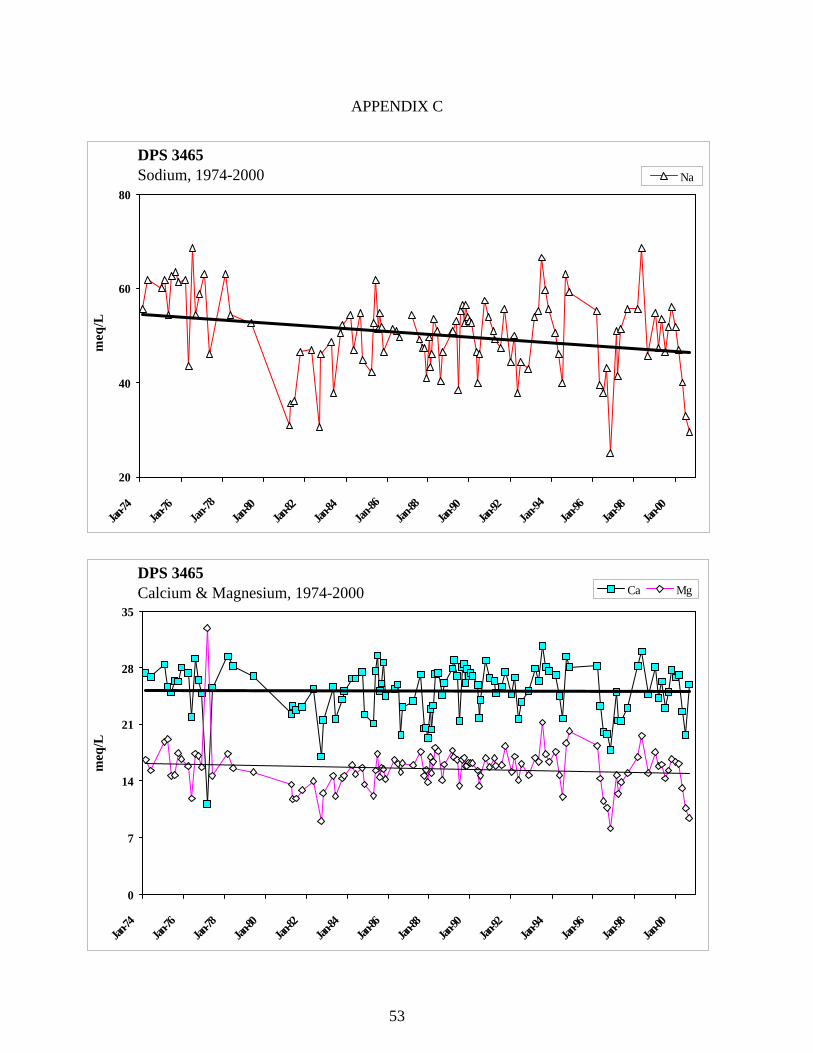
53
APPENDIX C
DPS 3465Sodium, 1974-2000
20
40
60
80
Jan-74
Jan-76
Jan-78
Jan-80
Jan-82
Jan-84
Jan-86
Jan-88
Jan-90
Jan-92
Jan-94
Jan-96
Jan-98
Jan-00
meq
/L
Na
DPS 3465Calcium & Magnesium, 1974-2000
0
7
14
21
28
35
Jan-74
Jan-76
Jan-78
Jan-80
Jan-82
Jan-84
Jan-86
Jan-88
Jan-90
Jan-92
Jan-94
Jan-96
Jan-98
Jan-00
meq
/L
Ca Mg
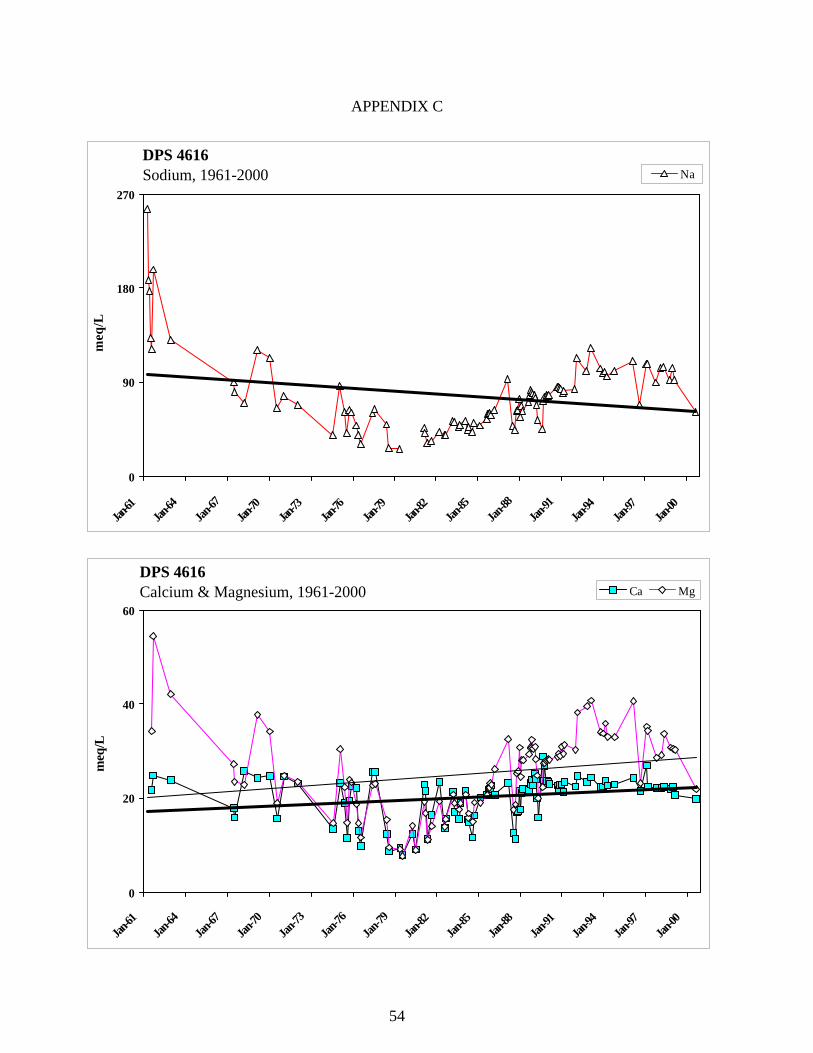
54
APPENDIX C
DPS 4616Sodium, 1961-2000
0
90
180
270
Jan-61
Jan-64
Jan-67
Jan-70
Jan-73
Jan-76
Jan-79
Jan-82
Jan-85
Jan-88
Jan-91
Jan-94
Jan-97
Jan-00
meq
/L
Na
DPS 4616Calcium & Magnesium, 1961-2000
0
20
40
60
Jan-61
Jan-64
Jan-67
Jan-70
Jan-73
Jan-76
Jan-79
Jan-82
Jan-85
Jan-88
Jan-91
Jan-94
Jan-97
Jan-00
meq
/L
Ca Mg
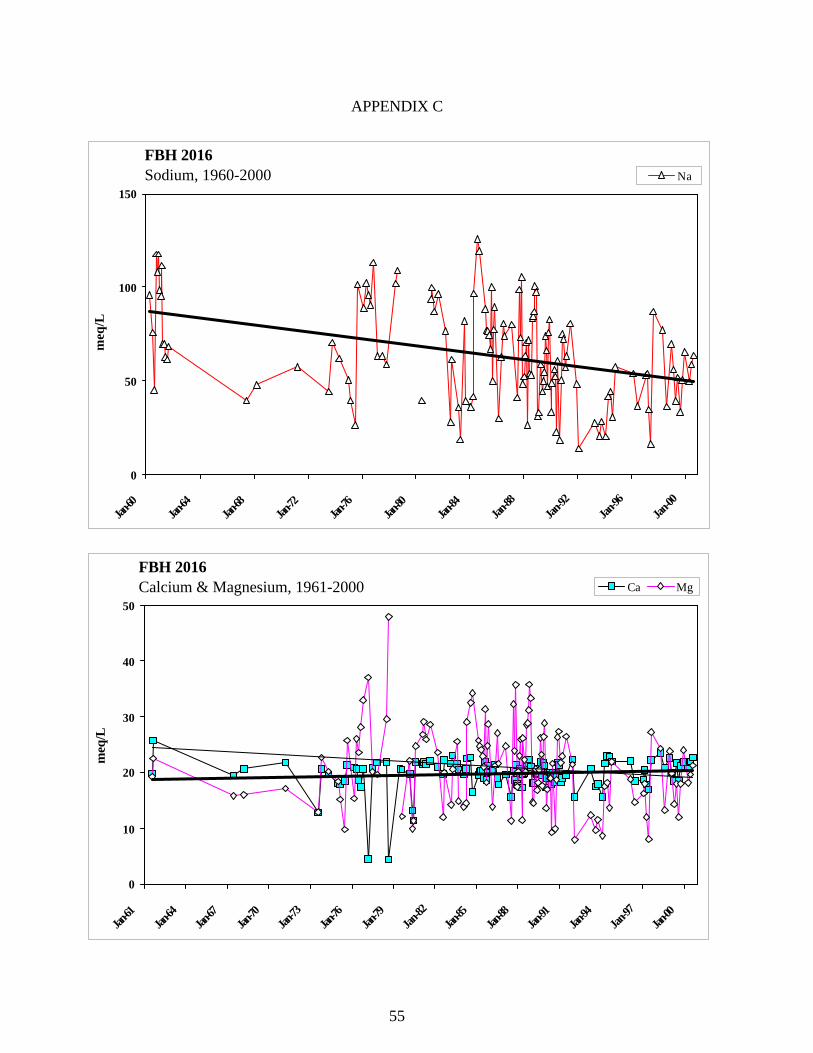
55
APPENDIX C
FBH 2016Sodium, 1960-2000
0
50
100
150
Jan-60
Jan-64
Jan-68
Jan-72
Jan-76
Jan-80
Jan-84
Jan-88
Jan-92
Jan-96
Jan-00
meq
/L
Na
FBH 2016Calcium & Magnesium, 1961-2000
0
10
20
30
40
50
Jan-61
Jan-64
Jan-67
Jan-70
Jan-73
Jan-76
Jan-79
Jan-82
Jan-85
Jan-88
Jan-91
Jan-94
Jan-97
Jan-00
meq
/L
Ca Mg
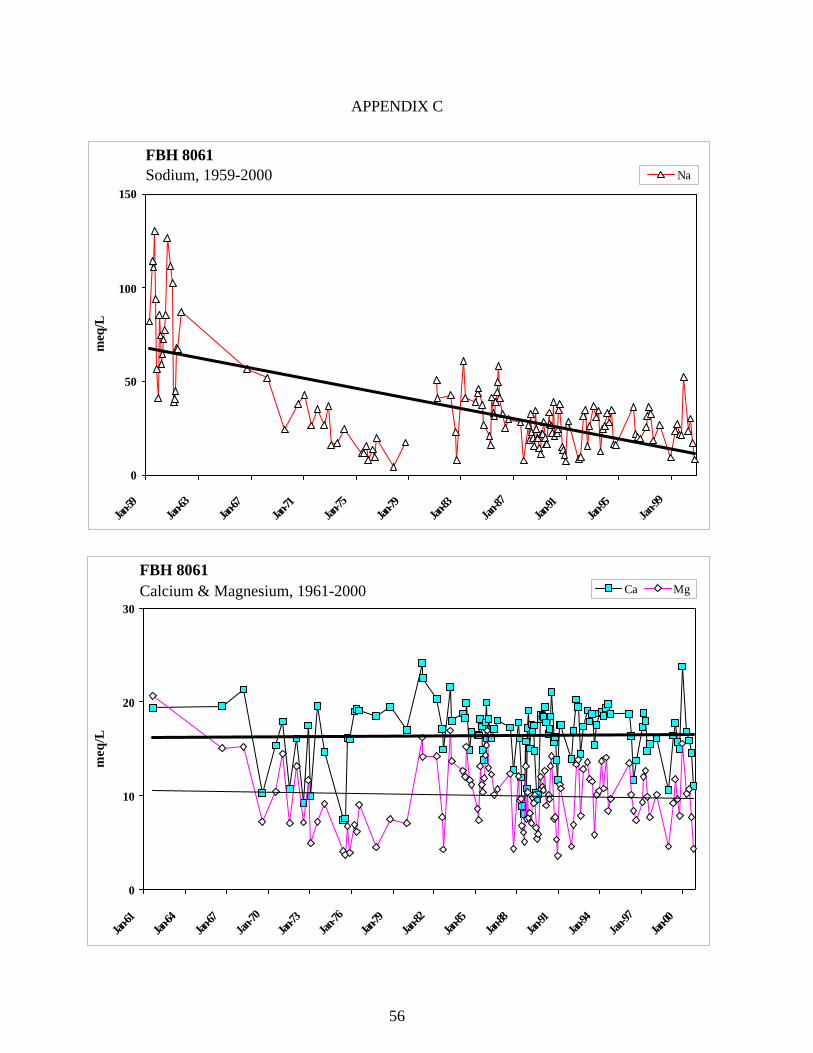
56
APPENDIX C
FBH 8061Sodium, 1959-2000
0
50
100
150
Jan-59
Jan-63
Jan-67
Jan-71
Jan-75
Jan-79
Jan-83
Jan-87
Jan-91
Jan-95
Jan-99
meq
/L
Na
FBH 8061Calcium & Magnesium, 1961-2000
0
10
20
30
Jan-61
Jan-64
Jan-67
Jan-70
Jan-73
Jan-76
Jan-79
Jan-82
Jan-85
Jan-88
Jan-91
Jan-94
Jan-97
Jan-00
meq
/L
Ca Mg
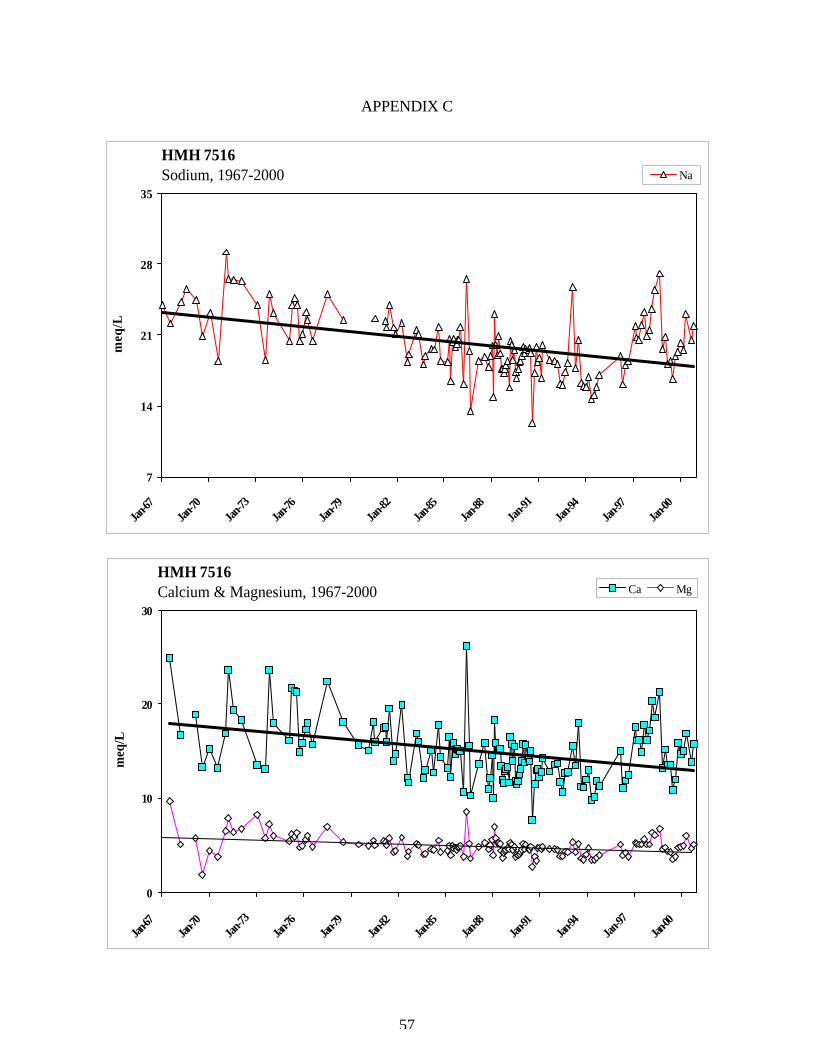
57
APPENDIX C
HMH 7516Sodium, 1967-2000
7
14
21
28
35
Jan-67
Jan-70
Jan-73
Jan-76
Jan-79
Jan-82
Jan-85
Jan-88
Jan-91
Jan-94
Jan-97
Jan-00
meq
/L
Na
HMH 7516Calcium & Magnesium, 1967-2000
0
10
20
30
Jan-67
Jan-70
Jan-73
Jan-76
Jan-79
Jan-82
Jan-85
Jan-88
Jan-91
Jan-94
Jan-97
Jan-00
meq
/L
Ca Mg
58
APPENDIX D
GRAPHS OF WATER QUALITY CATION TRENDS IN DRAINAGE SUMPS
SOUTHERN AREA
LEMOORE-CORCORAN STATIONS
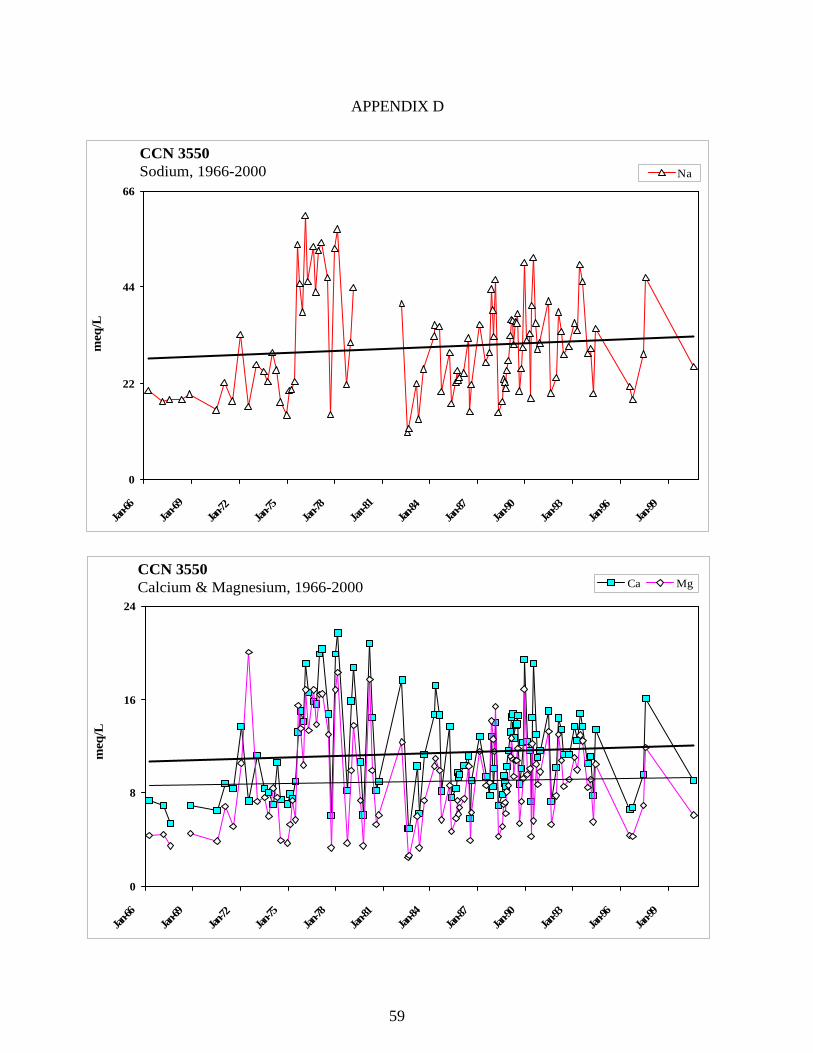
59
APPENDIX D
CCN 3550Calcium & Magnesium, 1966-2000
0
8
16
24
Jan-66
Jan-69
Jan-72
Jan-75
Jan-78
Jan-81
Jan-84
Jan-87
Jan-90
Jan-93
Jan-96
Jan-99
meq
/L
Ca Mg
CCN 3550Sodium, 1966-2000
0
22
44
66
Jan-66
Jan-69
Jan-72
Jan-75
Jan-78
Jan-81
Jan-84
Jan-87
Jan-90
Jan-93
Jan-96
Jan-99
meq
/L
Na
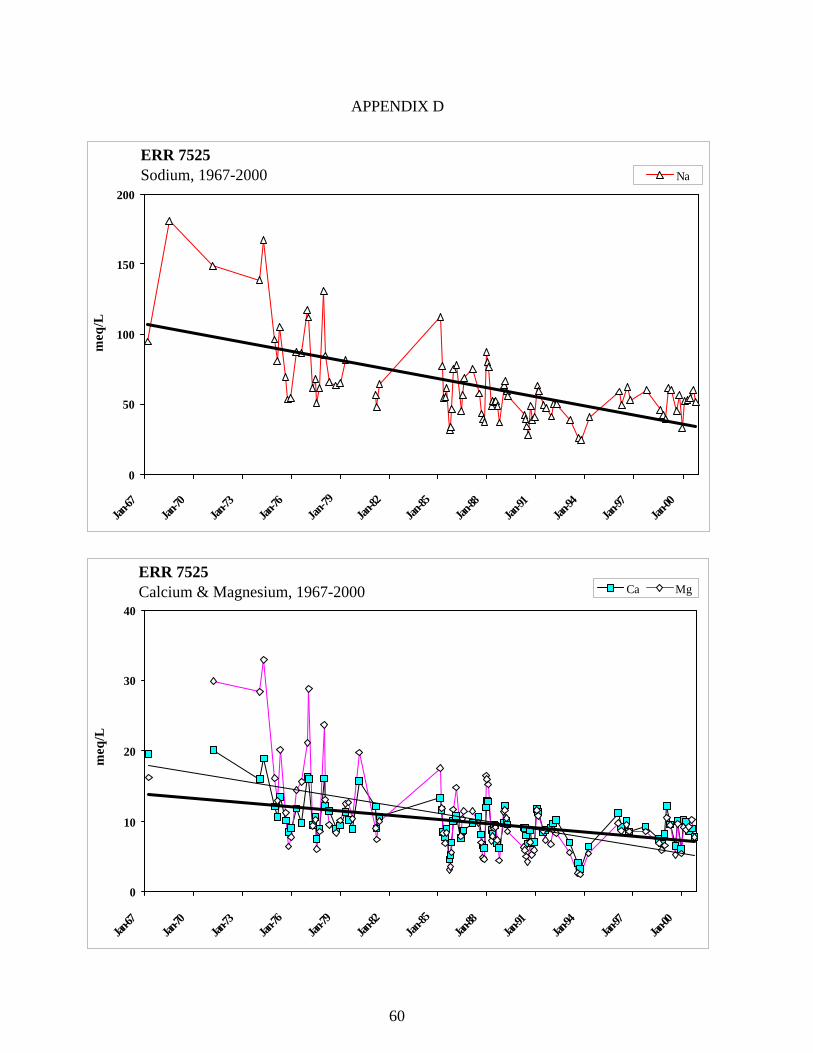
60
APPENDIX D
ERR 7525Sodium, 1967-2000
0
50
100
150
200
Jan-67
Jan-70
Jan-73
Jan-76
Jan-79
Jan-82
Jan-85
Jan-88
Jan-91
Jan-94
Jan-97
Jan-00
meq
/L
Na
ERR 7525Calcium & Magnesium, 1967-2000
0
10
20
30
40
Jan-67
Jan-70
Jan-73
Jan-76
Jan-79
Jan-82
Jan-85
Jan-88
Jan-91
Jan-94
Jan-97
Jan-00
meq
/L
Ca Mg
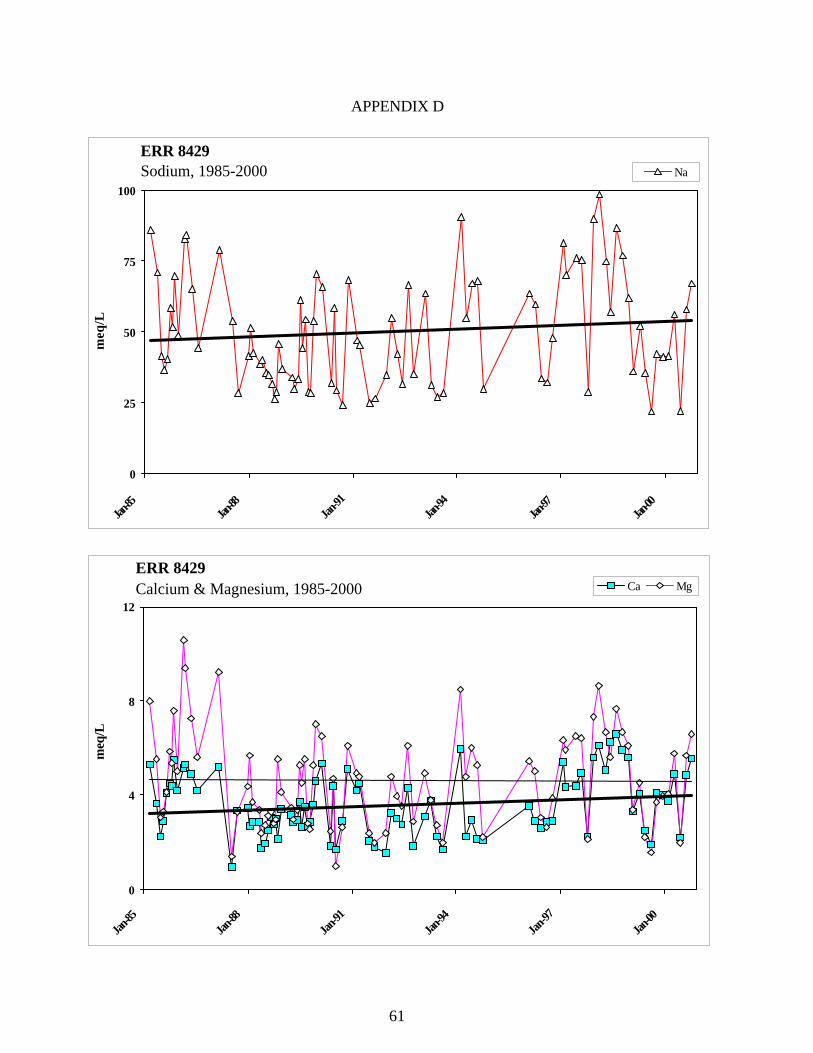
61
APPENDIX D
ERR 8429Sodium, 1985-2000
0
25
50
75
100
Jan-85
Jan-88
Jan-91
Jan-94
Jan-97
Jan-00
meq
/L
Na
ERR 8429Calcium & Magnesium, 1985-2000
0
4
8
12
Jan-85
Jan-88
Jan-91
Jan-94
Jan-97
Jan-00
meq
/L
Ca Mg
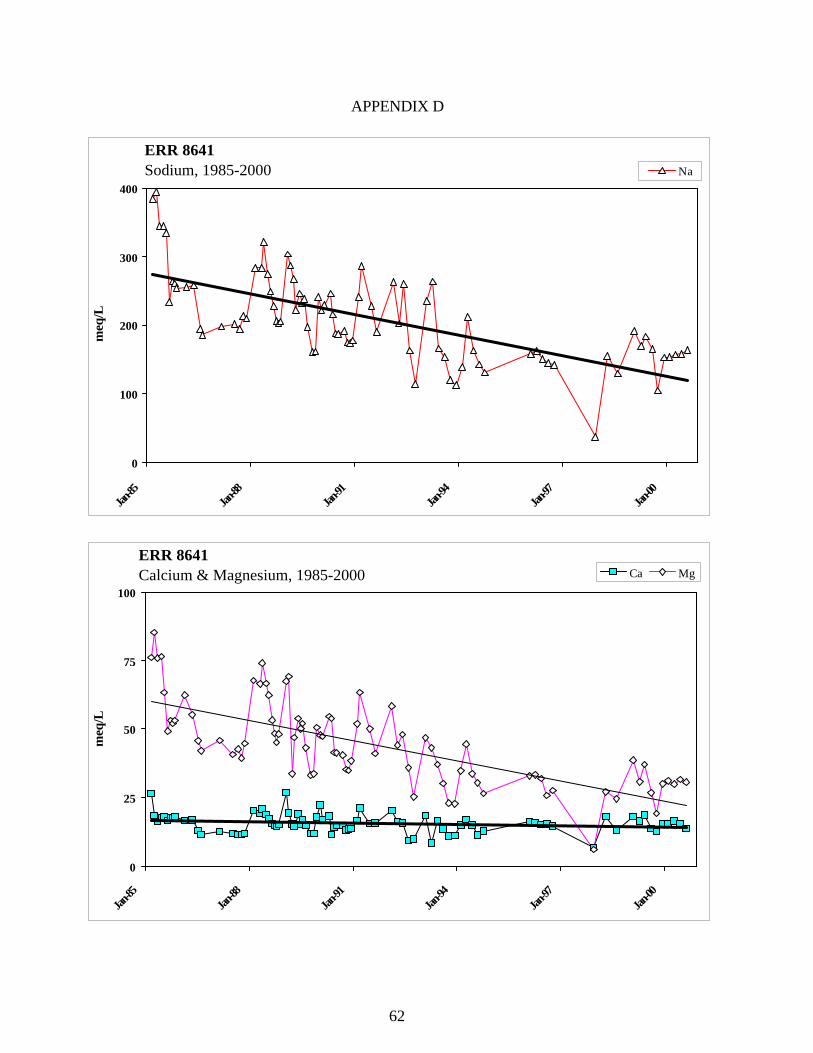
62
APPENDIX D
ERR 8641Sodium, 1985-2000
0
100
200
300
400
Jan-85
Jan-88
Jan-91
Jan-94
Jan-97
Jan-00
meq
/L
Na
ERR 8641Calcium & Magnesium, 1985-2000
0
25
50
75
100
Jan-85
Jan-88
Jan-91
Jan-94
Jan-97
Jan-00
meq
/L
Ca Mg
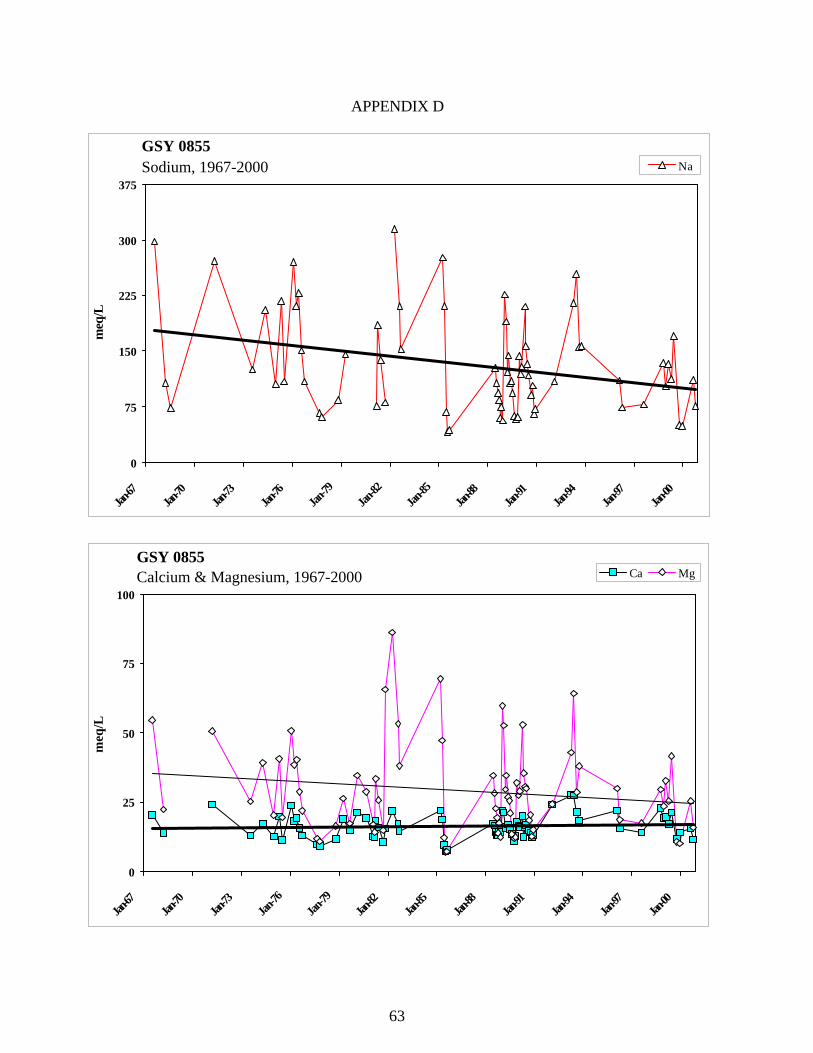
63
APPENDIX D
GSY 0855Sodium, 1967-2000
0
75
150
225
300
375
Jan-67
Jan-70
Jan-73
Jan-76
Jan-79
Jan-82
Jan-85
Jan-88
Jan-91
Jan-94
Jan-97
Jan-00
meq
/L
Na
GSY 0855Calcium & Magnesium, 1967-2000
0
25
50
75
100
Jan-67
Jan-70
Jan-73
Jan-76
Jan-79
Jan-82
Jan-85
Jan-88
Jan-91
Jan-94
Jan-97
Jan-00
meq
/L
Ca Mg
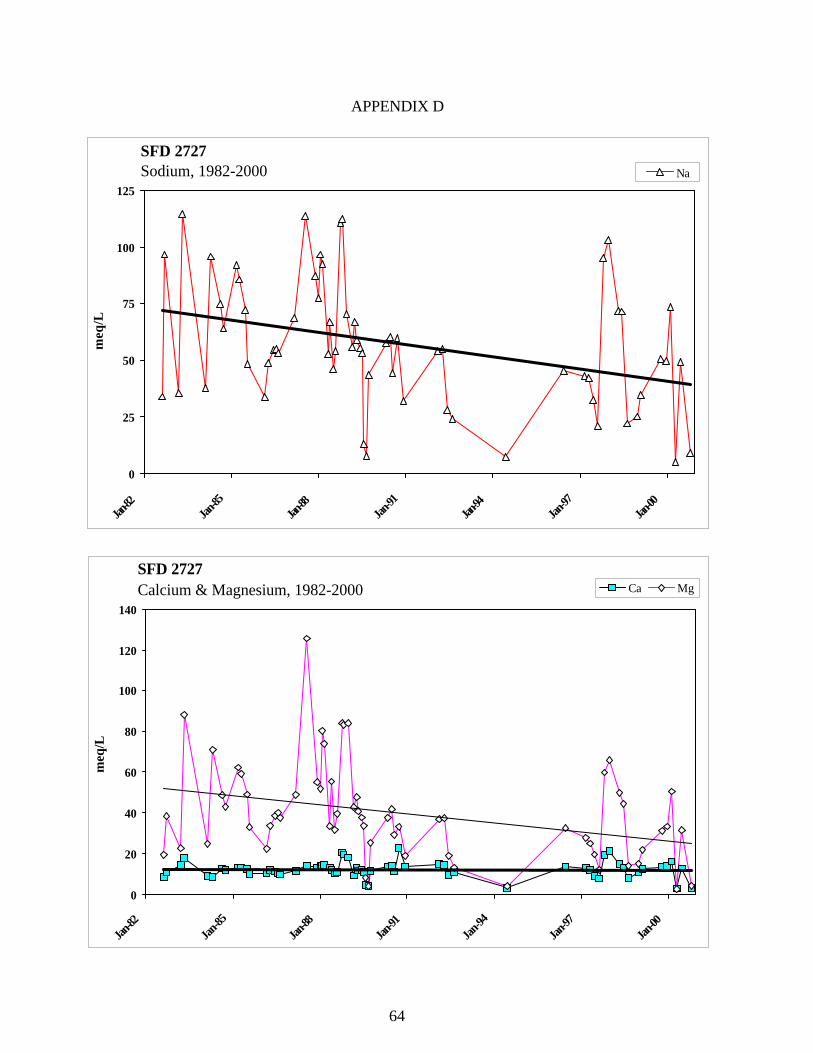
64
APPENDIX D
SFD 2727Sodium, 1982-2000
0
25
50
75
100
125
Jan-82
Jan-85
Jan-88
Jan-91
Jan-94
Jan-97
Jan-00
meq
/L
Na
SFD 2727Calcium & Magnesium, 1982-2000
0
20
40
60
80
100
120
140
Jan-82
Jan-85
Jan-88
Jan-91
Jan-94
Jan-97
Jan-00
meq
/L
Ca Mg
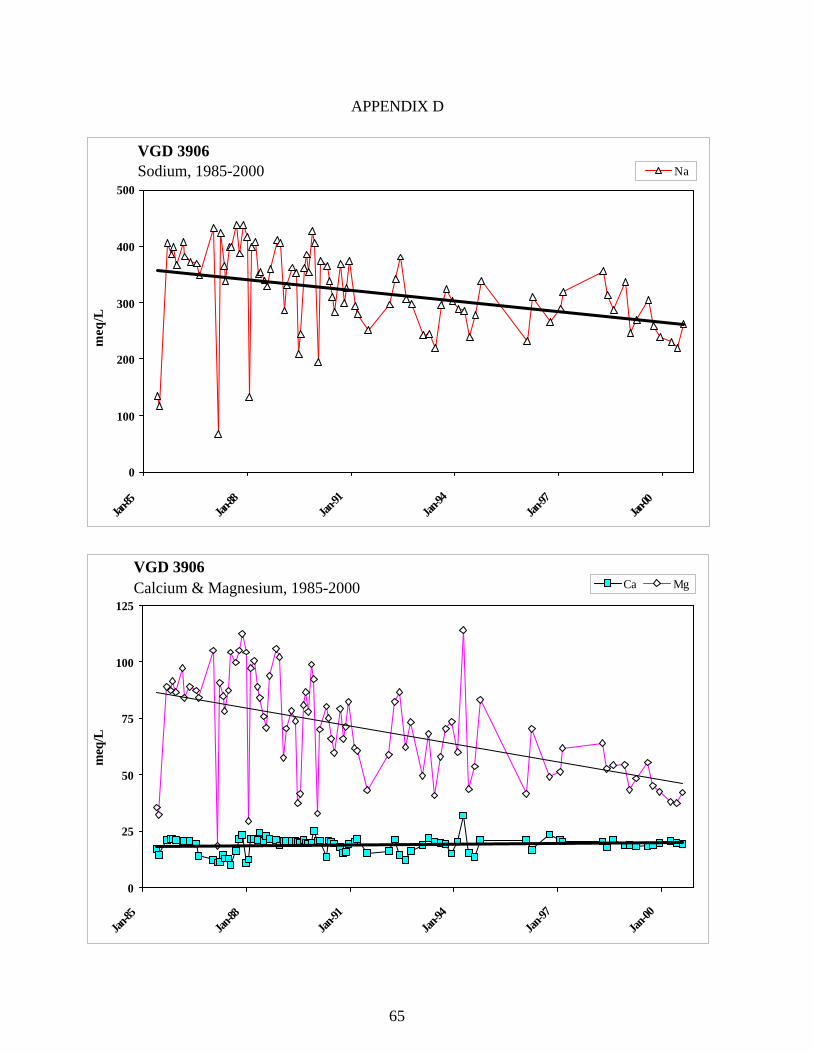
65
APPENDIX D
VGD 3906Sodium, 1985-2000
0
100
200
300
400
500
Jan-85
Jan-88
Jan-91
Jan-94
Jan-97
Jan-00
meq
/L
Na
VGD 3906Calcium & Magnesium, 1985-2000
0
25
50
75
100
125
Jan-85
Jan-88
Jan-91
Jan-94
Jan-97
Jan-00
meq
/L
Ca Mg
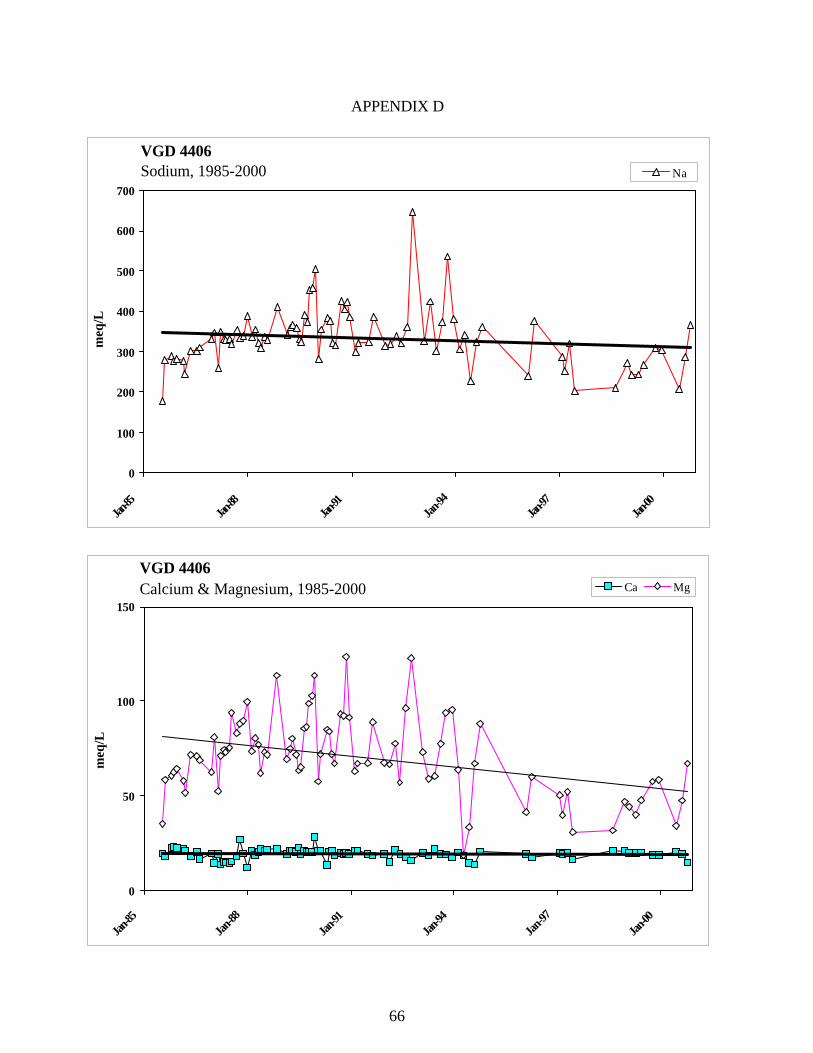
66
APPENDIX D
VGD 4406Sodium, 1985-2000
0
100
200
300
400
500
600
700
Jan-85
Jan-88
Jan-91
Jan-94
Jan-97
Jan-00
meq
/L
Na
VGD 4406Calcium & Magnesium, 1985-2000
0
50
100
150
Jan-85
Jan-88
Jan-91
Jan-94
Jan-97
Jan-00
meq
/L
Ca Mg
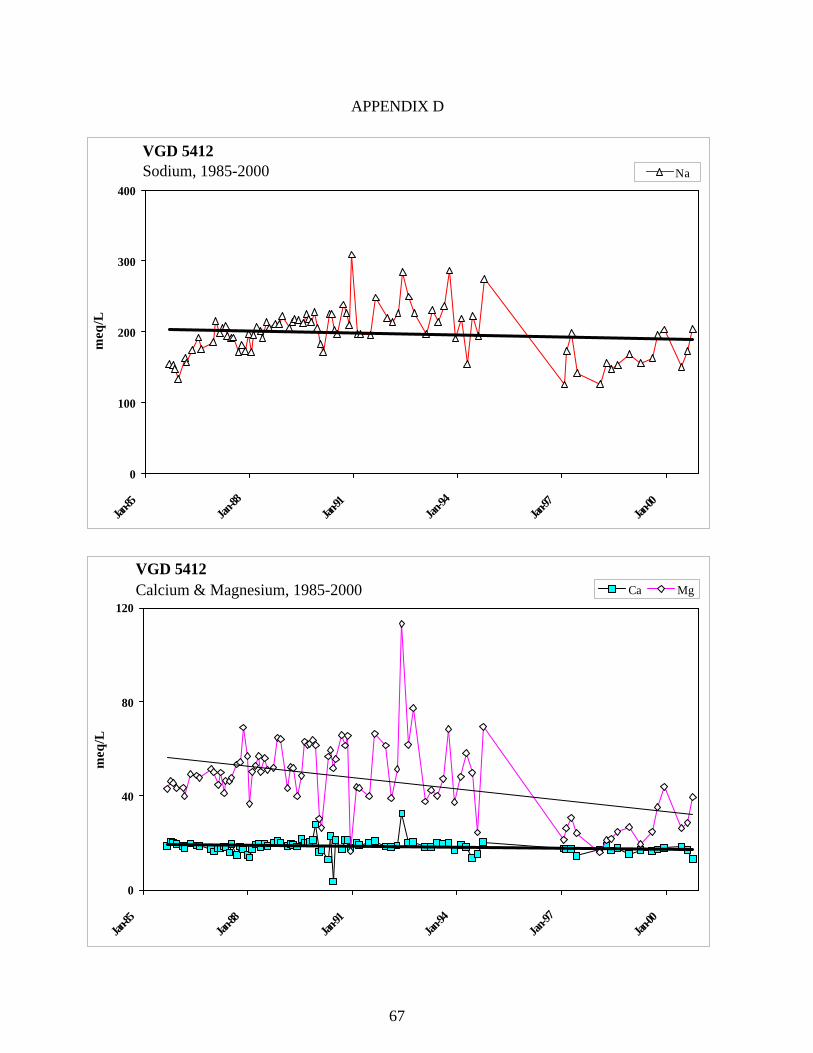
67
APPENDIX D
VGD 5412Sodium, 1985-2000
0
100
200
300
400
Jan-85
Jan-88
Jan-91
Jan-94
Jan-97
Jan-00
meq
/L
Na
VGD 5412Calcium & Magnesium, 1985-2000
0
40
80
120
Jan-85
Jan-88
Jan-91
Jan-94
Jan-97
Jan-00
meq
/L
Ca Mg
68
APPENDIX D
GRAPHS OF WATER QUALITY CATION TRENDS IN DRAINAGE SUMPS
SOUTHERN AREA
LOST HILLS-SEMITROPIC STATIONS
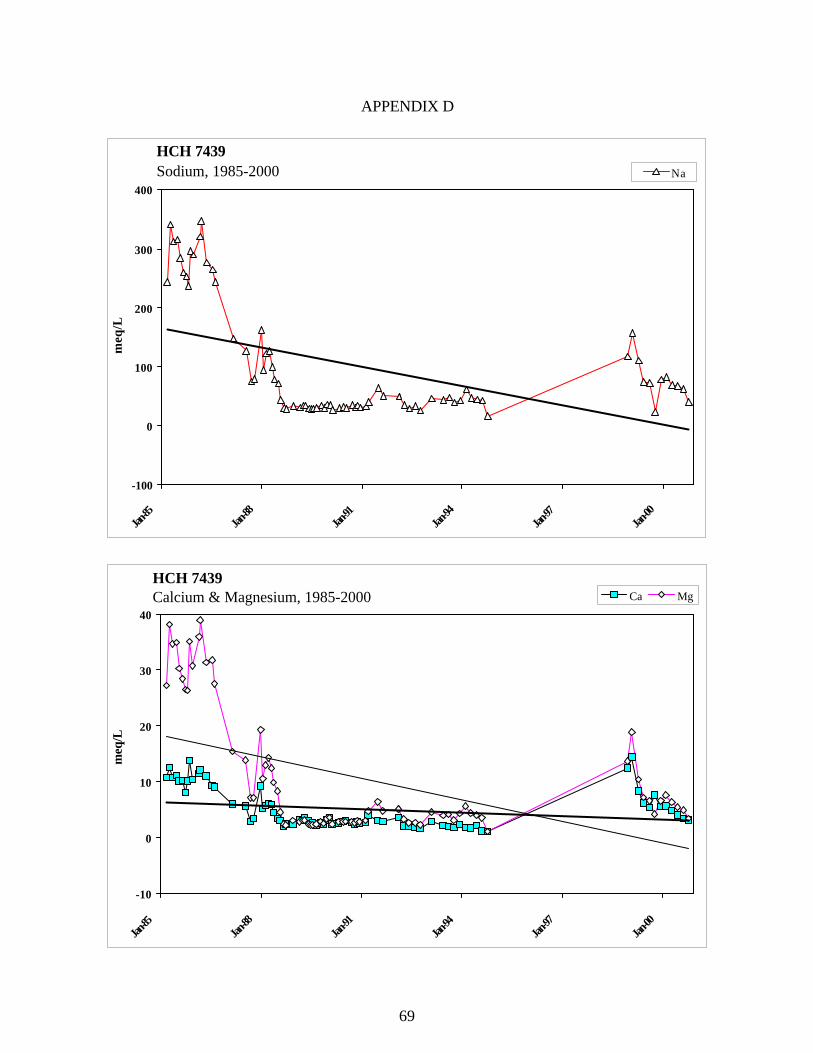
69
APPENDIX D
HCH 7439Sodium, 1985-2000
-100
0
100
200
300
400
Jan-85
Jan-88
Jan-91
Jan-94
Jan-97
Jan-00
meq
/L
Na
HCH 7439Calcium & Magnesium, 1985-2000
-10
0
10
20
30
40
Jan-85
Jan-88
Jan-91
Jan-94
Jan-97
Jan-00
meq
/L
Ca Mg
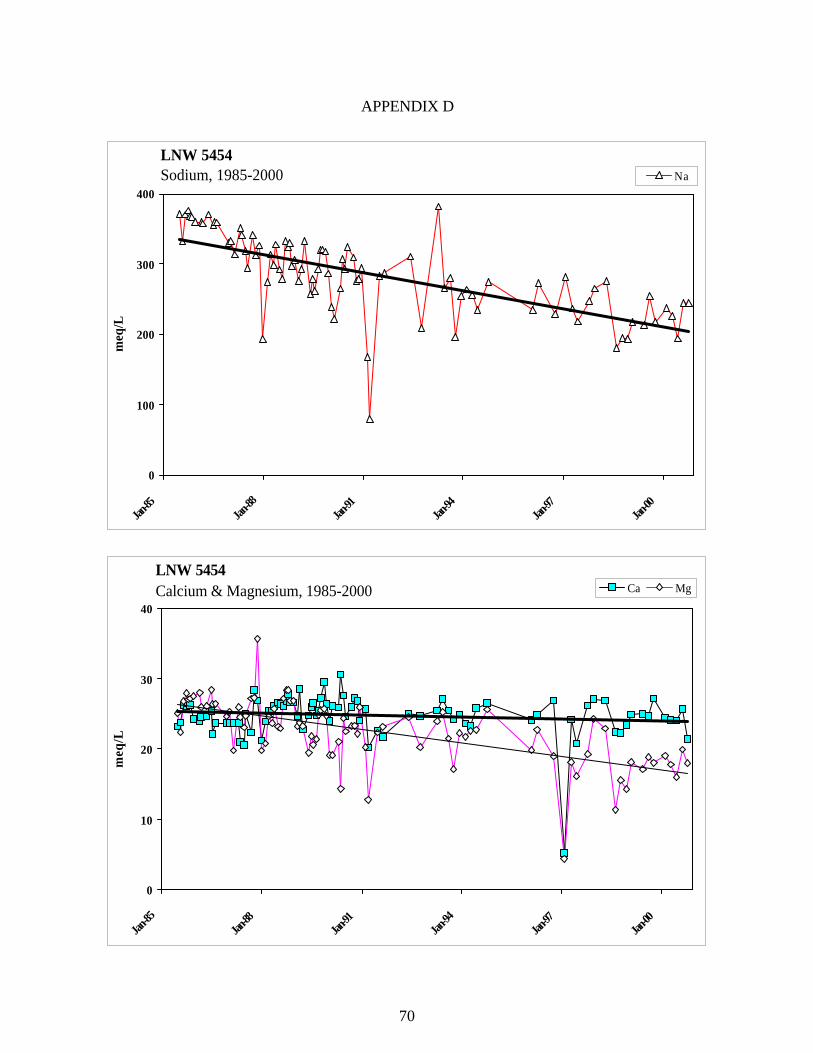
70
APPENDIX D
LNW 5454Sodium, 1985-2000
0
100
200
300
400
Jan-85
Jan-88
Jan-91
Jan-94
Jan-97
Jan-00
meq
/L
Na
LNW 5454Calcium & Magnesium, 1985-2000
0
10
20
30
40
Jan-85
Jan-88
Jan-91
Jan-94
Jan-97
Jan-00
meq
/L
Ca Mg
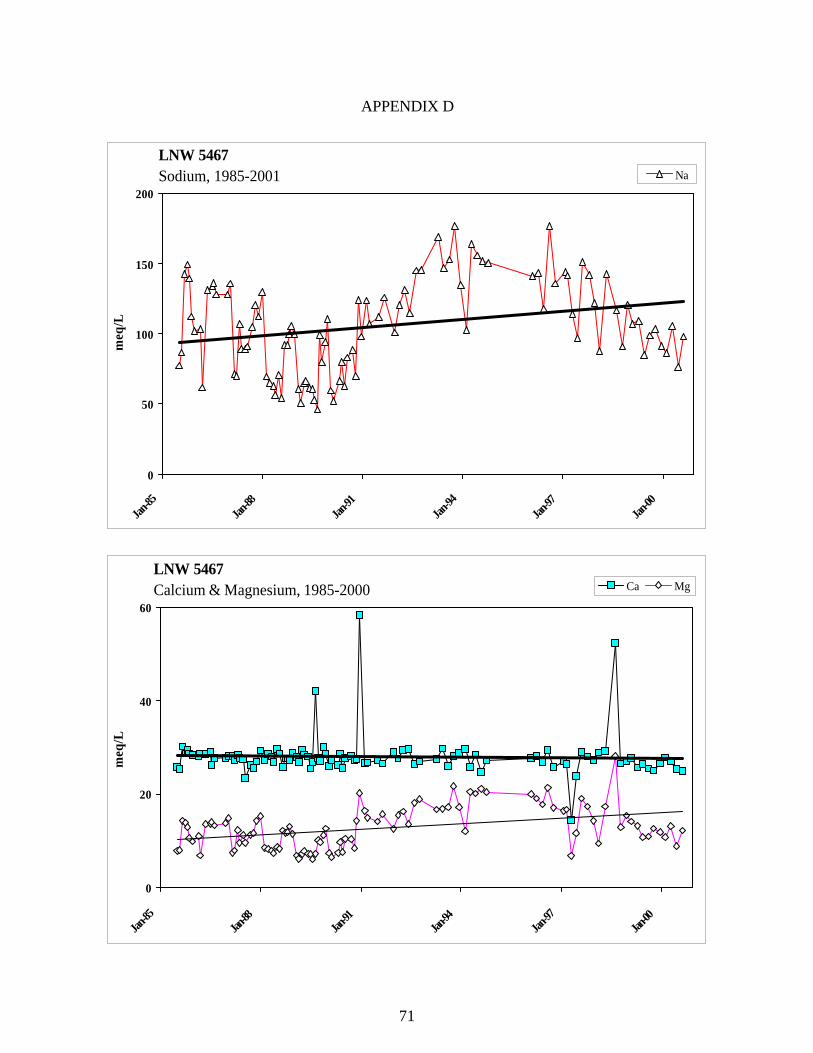
71
APPENDIX D
LNW 5467Sodium, 1985-2001
0
50
100
150
200
Jan-85
Jan-88
Jan-91
Jan-94
Jan-97
Jan-00
meq
/L
Na
LNW 5467Calcium & Magnesium, 1985-2000
0
20
40
60
Jan-85
Jan-88
Jan-91
Jan-94
Jan-97
Jan-00
meq
/L
Ca Mg
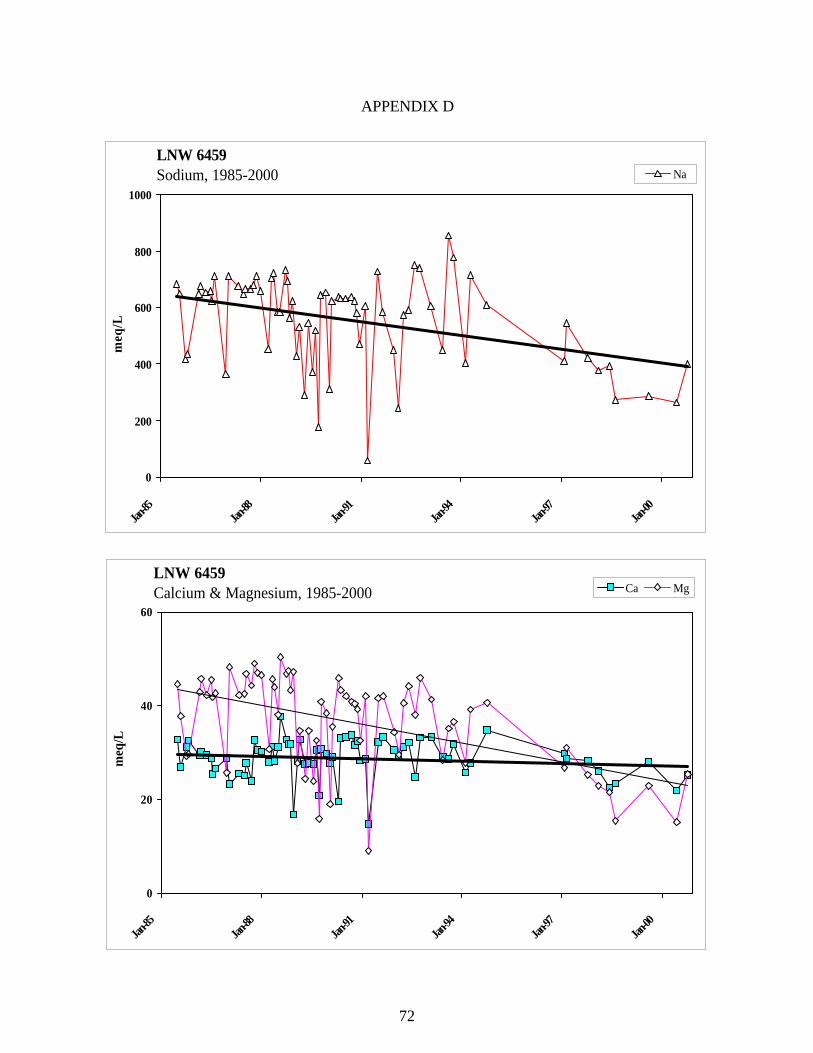
72
APPENDIX D
LNW 6459Calcium & Magnesium, 1985-2000
0
20
40
60
Jan-85
Jan-88
Jan-91
Jan-94
Jan-97
Jan-00
meq
/L
Ca Mg
LNW 6459Sodium, 1985-2000
0
200
400
600
800
1000
Jan-85
Jan-88
Jan-91
Jan-94
Jan-97
Jan-00
meq
/L
Na
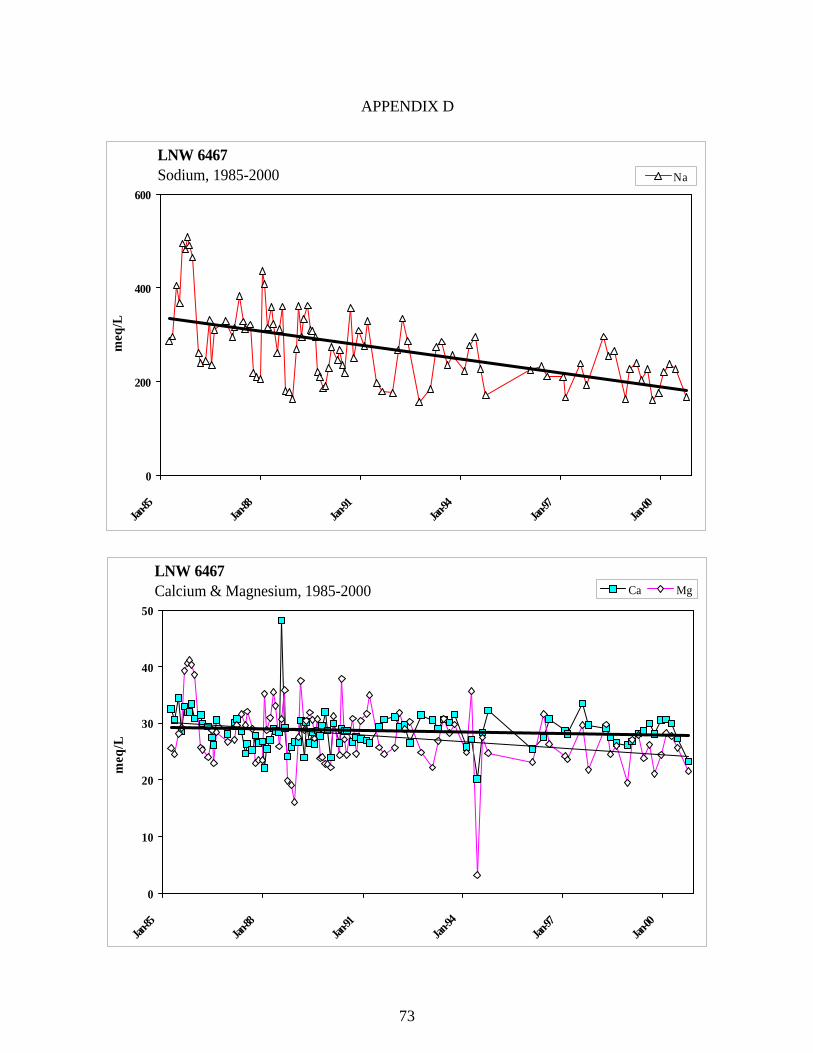
73
APPENDIX D
LNW 6467Sodium, 1985-2000
0
200
400
600
Jan-85
Jan-88
Jan-91
Jan-94
Jan-97
Jan-00
meq
/L
Na
LNW 6467Calcium & Magnesium, 1985-2000
0
10
20
30
40
50
Jan-85
Jan-88
Jan-91
Jan-94
Jan-97
Jan-00
meq
/L
Ca Mg
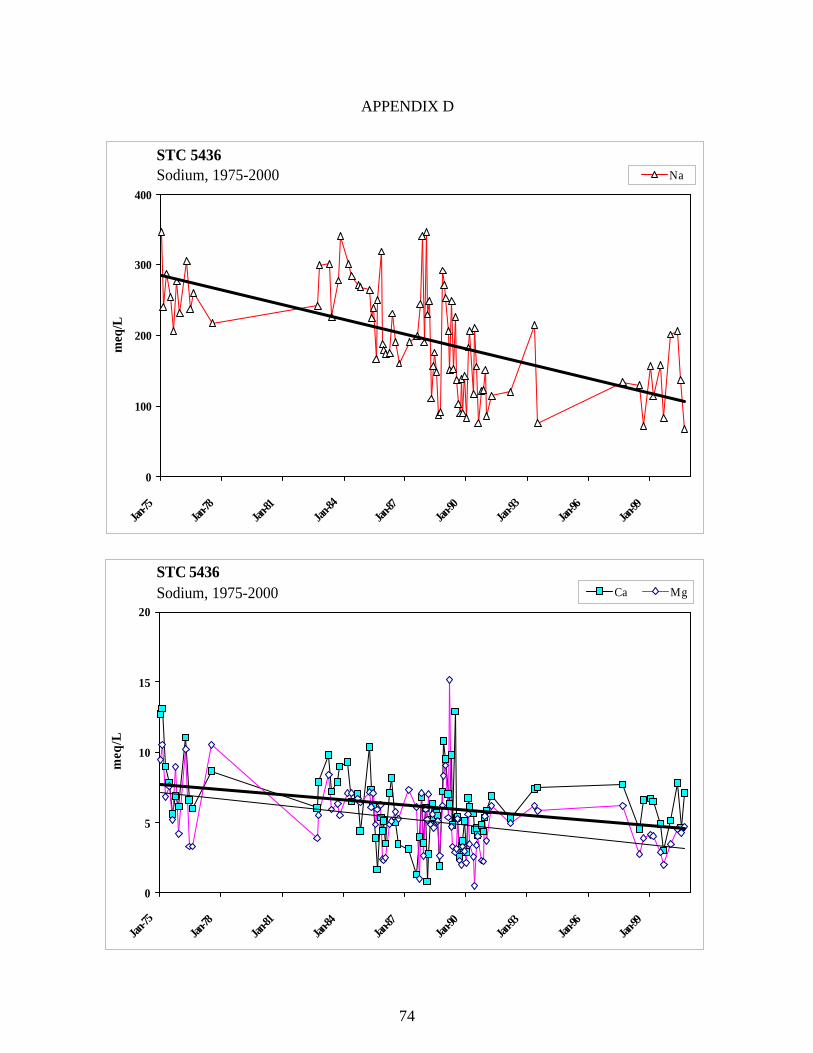
74
APPENDIX D
STC 5436Sodium, 1975-2000
0
100
200
300
400
Jan-75
Jan-78
Jan-81
Jan-84
Jan-87
Jan-90
Jan-93
Jan-96
Jan-99
meq
/L
Na
STC 5436Sodium, 1975-2000
0
5
10
15
20
Jan-75
Jan-78
Jan-81
Jan-84
Jan-87
Jan-90
Jan-93
Jan-96
Jan-99
meq
/L
Ca Mg
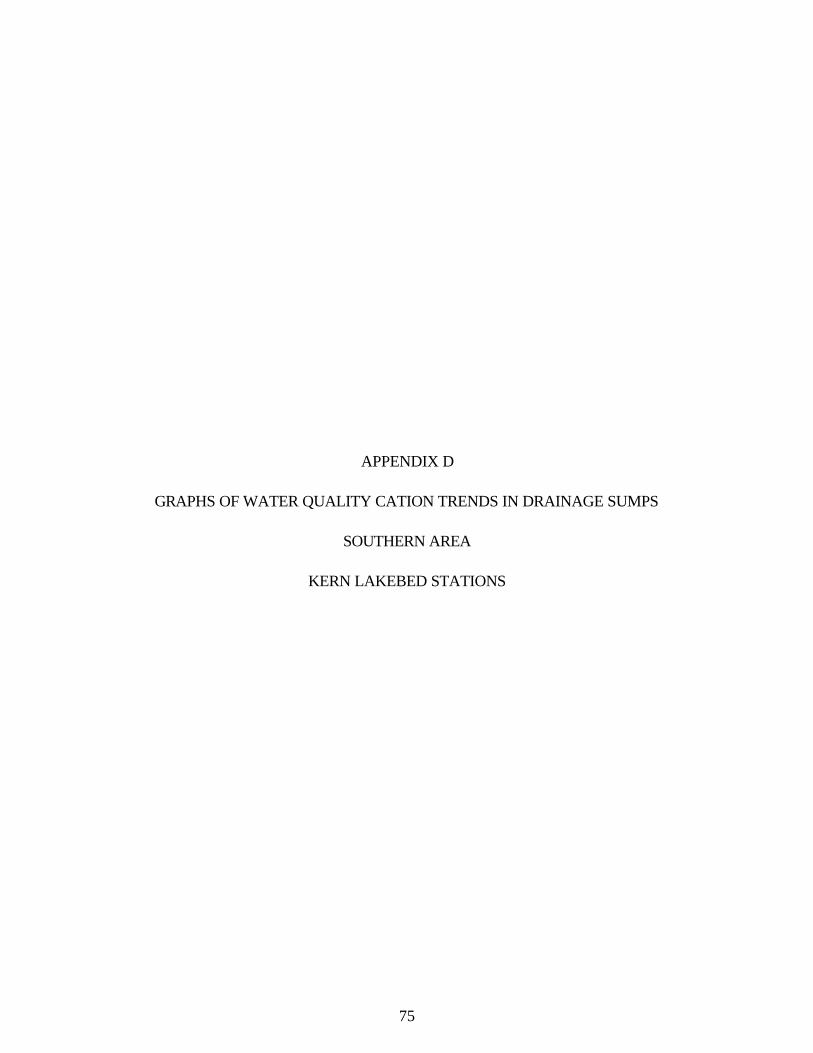
75
APPENDIX D
GRAPHS OF WATER QUALITY CATION TRENDS IN DRAINAGE SUMPS
SOUTHERN AREA
KERN LAKEBED STATIONS
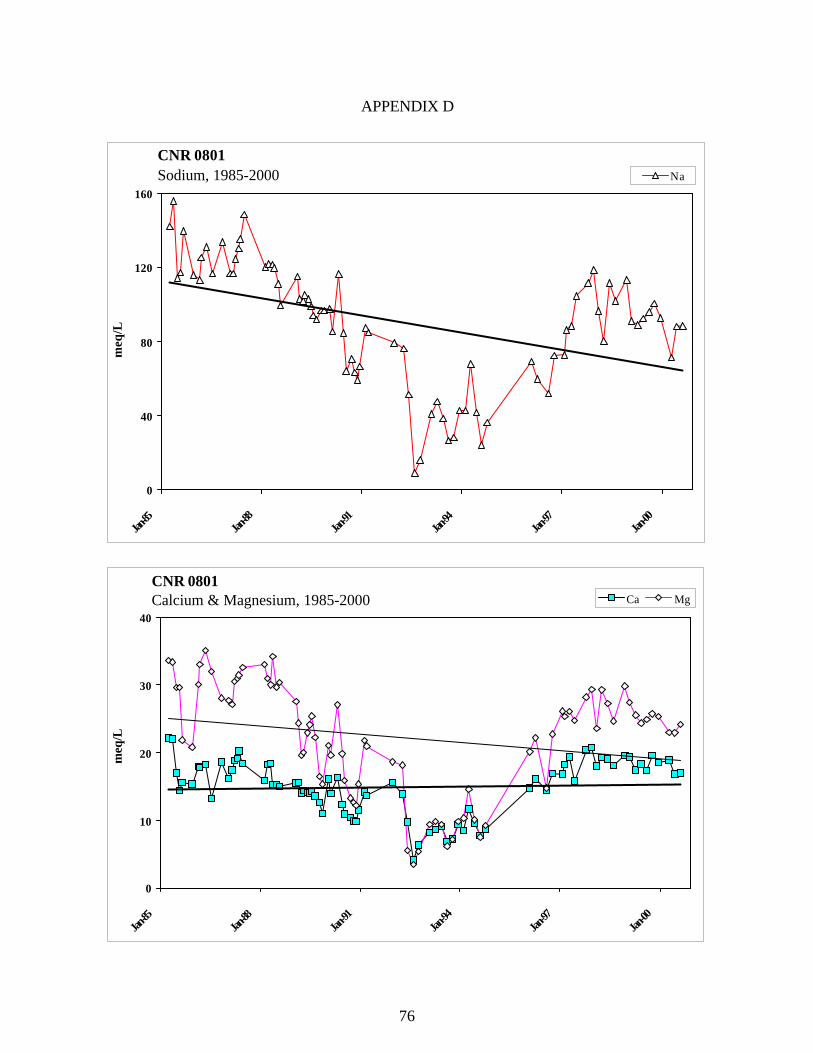
76
APPENDIX D
CNR 0801Sodium, 1985-2000
0
40
80
120
160
Jan-85
Jan-88
Jan-91
Jan-94
Jan-97
Jan-00
meq
/L
Na
CNR 0801Calcium & Magnesium, 1985-2000
0
10
20
30
40
Jan-85
Jan-88
Jan-91
Jan-94
Jan-97
Jan-00
meq
/L
Ca Mg
77
APPENDIX D
COC 4126Sodium, 1986-2000
0
10
20
30
40
50
Jan-86
Jan-89
Jan-92
Jan-95
Jan-98
meq
/L
Na
COC 4126Calcium & Magnesium, 1985-2000
0
7
14
21
28
35
Jan-86
Jan-88
Jan-90
Jan-92
Jan-94
Jan-96
Jan-98
Jan-00
meq
/L
Ca Mg
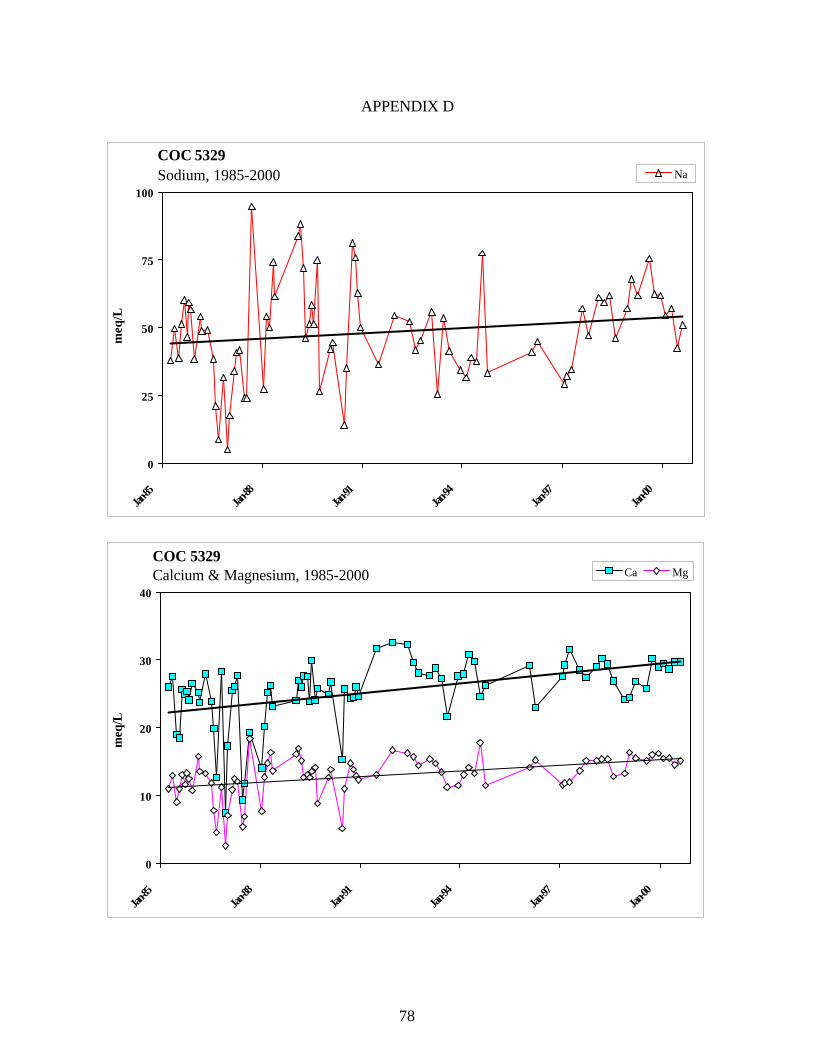
78
APPENDIX D
COC 5329Sodium, 1985-2000
0
25
50
75
100
Jan-85
Jan-88
Jan-91
Jan-94
Jan-97
Jan-00
meq
/L
Na
COC 5329Calcium & Magnesium, 1985-2000
0
10
20
30
40
Jan-85
Jan-88
Jan-91
Jan-94
Jan-97
Jan-00
meq
/L
Ca Mg
79
BIBLIOGRAPHY
Ayers, R.S. and D.W. Westcot. Water Quality for Agriculture. Food and Agriculture Organization of the United Nations. Rome, Italy 1985. California Department of Water Resources. Introduction to Water Quality Course Manual. Division of Planning, Sacramento, California. 1978. California Regional Water Quality Control Board, Central Valley Region. The Designated Level Methodology for Waste Classification and Cleanup Level Determination. Fresno, California. 1989. Doorenbos, J. and W.O. Pruitt. Guidelines for Predicting Crop Water Requirements. Food and Agriculture Organization of the United Nations. Rome, Italy 1977. Hem, John D. Study and Interpretation of the Chemical Characteristics of Natural Water. U.S. Government Printing Office, Washington, DC. 1970. San Joaquin Valley Interagency Drainage Program. Agricultural Drainage and Salt
Management in the San Joaquin Valley, Final Report. Fresno, California. 1979. San Joaquin Valley Drainage Program. A Management Plan for Agricultural Subsurface Drainage and Related Problems on the Westside San Joaquin Valley. Sacramento, California. 1990.
Tchobanoglous, George and Edward D. Schroeder, University of California at Davis.
Water Quality-Characteristics-Modeling-Modification. Addison-Wesley Publishing, Canada. 1985
United States Bureau of Reclamation, et al. A Strategy for Implementation of the
Management Plan for Agricultural Subsurface Drainage and Related Problems on the Westside San Joaquin Valley. A joint effort by the U.S. Bureau of Reclamation, Fish
and Wildlife Service, Soil Conservation Service, and Geological Survey; and the California Department of Water Resources, Department of Fish and Game,
Department of Food and Agriculture, and State Water Resources Control Board. 1991. United States Geological Survey. Water-Quality Data for Shallow Wells in the Western and Southern Tulare Basin, San Joaquin Valley, California, May to August 1989. Open-file Report 92-655. Sacramento, California. 1993. University of California, SJVDIP. Final Report-Evaluation of the 1990 Drainage Management Plan for the Westside San Joaquin Valley, California. January 2000 Prepared by SJVDIP and the University of California Ad Hoc Coordination Committee Utah State University Foundation. Characteristics and Pollution Problems of Irrigation
Return Flow. Robert S. Kerr Water Research Center, Ada, Oklahoma. 1969.
80
SYMBOLS, ABBREVIATIONS, AND FORMULAS Time Pacific Standard Time on a 24-hour clock Temp. Temperature of water at time of sampling in degrees Celsius (οC) and degrees
Fahrenheit (οF) pH Measure of acidity (<7) or alkalinity (>7) of water EC (µS/cm) Electrical conductance in microsiemens per centimeter at 25 οC
TDS Gravimetric determination of total dissolved solids at 180 oC Mineral constituents:
B Boron Ca Calcium CaCO3 Calcium carbonate Cl Chloride K Potassium Mg Magnesium Na Sodium NO3 Nitrate (unfiltered) SO4 Sulfate T. Alk. Total alkalinity TH Total hardness Se Selenium
Formulas:
SAR Sodium adsorption ratio (developed by U.S. Salinity Laboratory):
SAR = ( ) ( )
2MgCa
Na
+
Na, Ca, and Mg represent the concentrations in milliequivalents per liter. Geometric Mean The geometric mean G of a set of N numbers X1, X2, X3, . . ., XN is the Nth root
of the product of the numbers:
G = N NXXXX ,...,,, 321
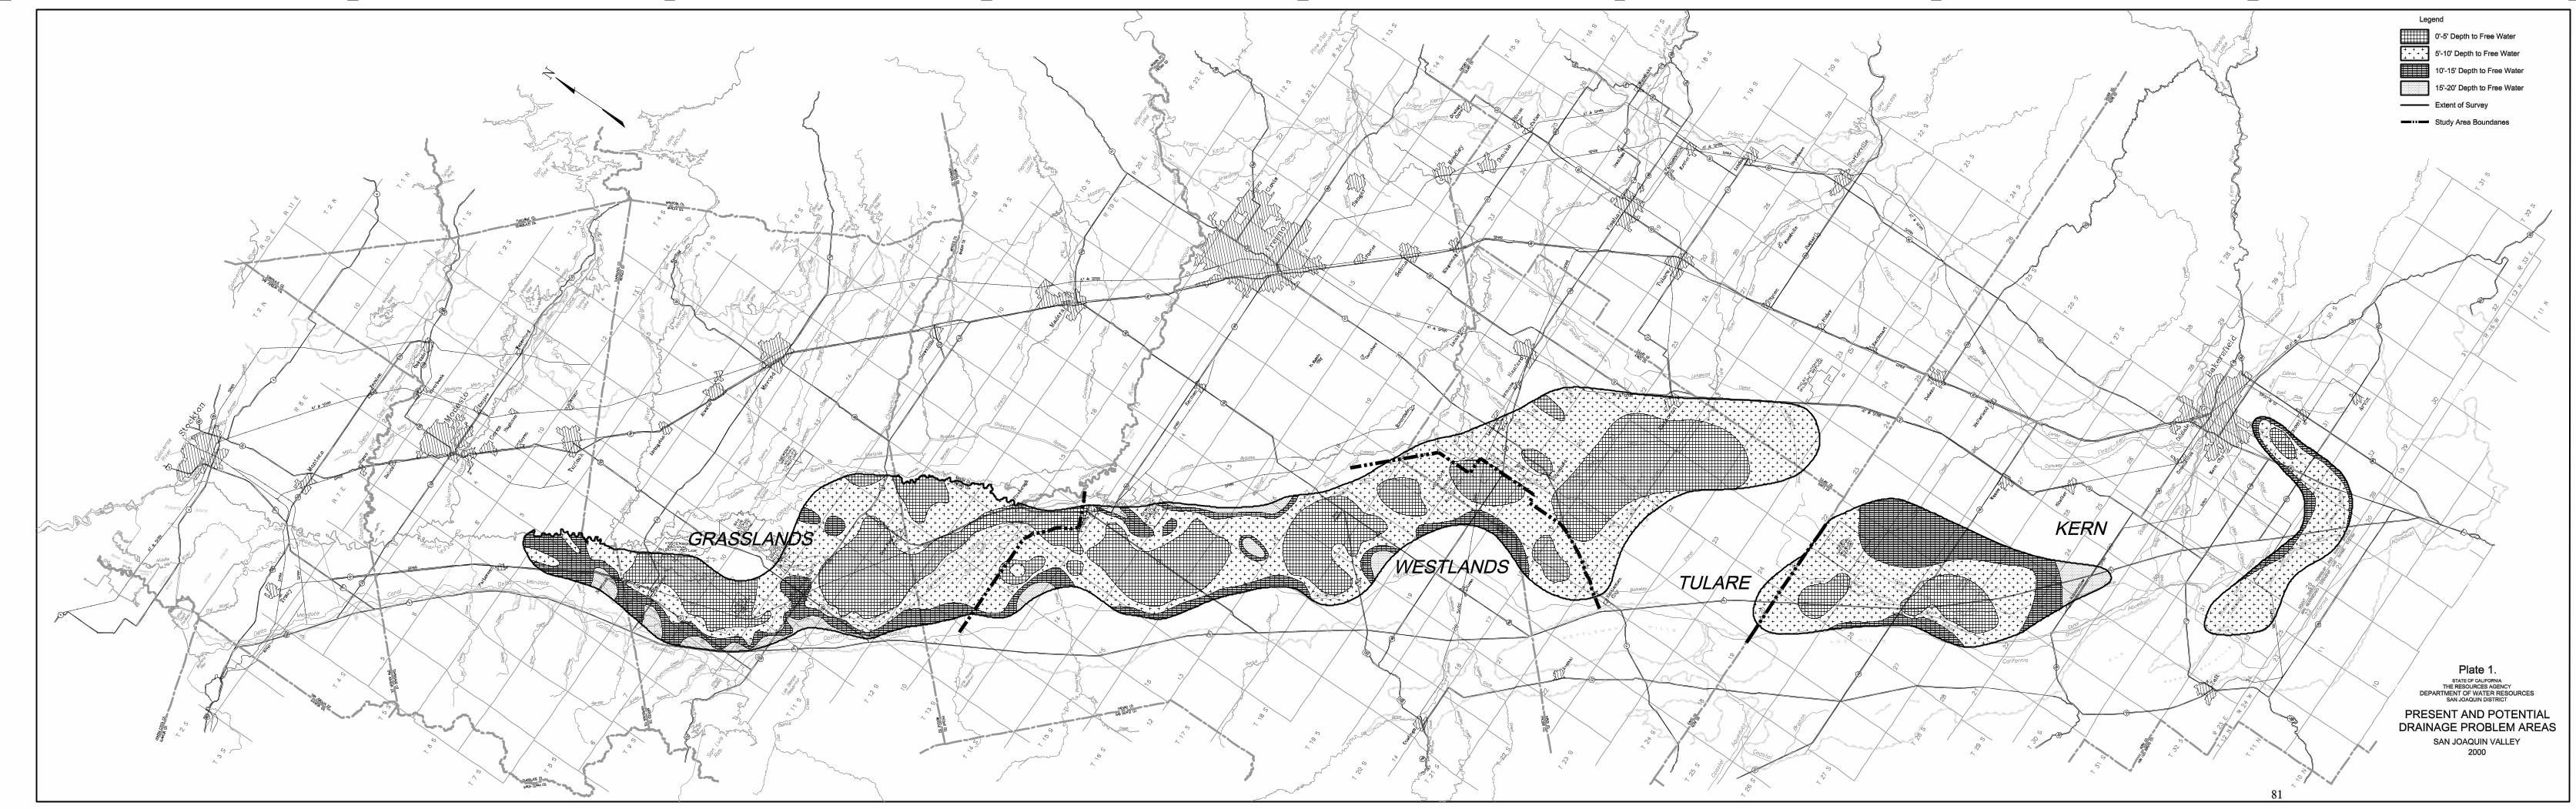
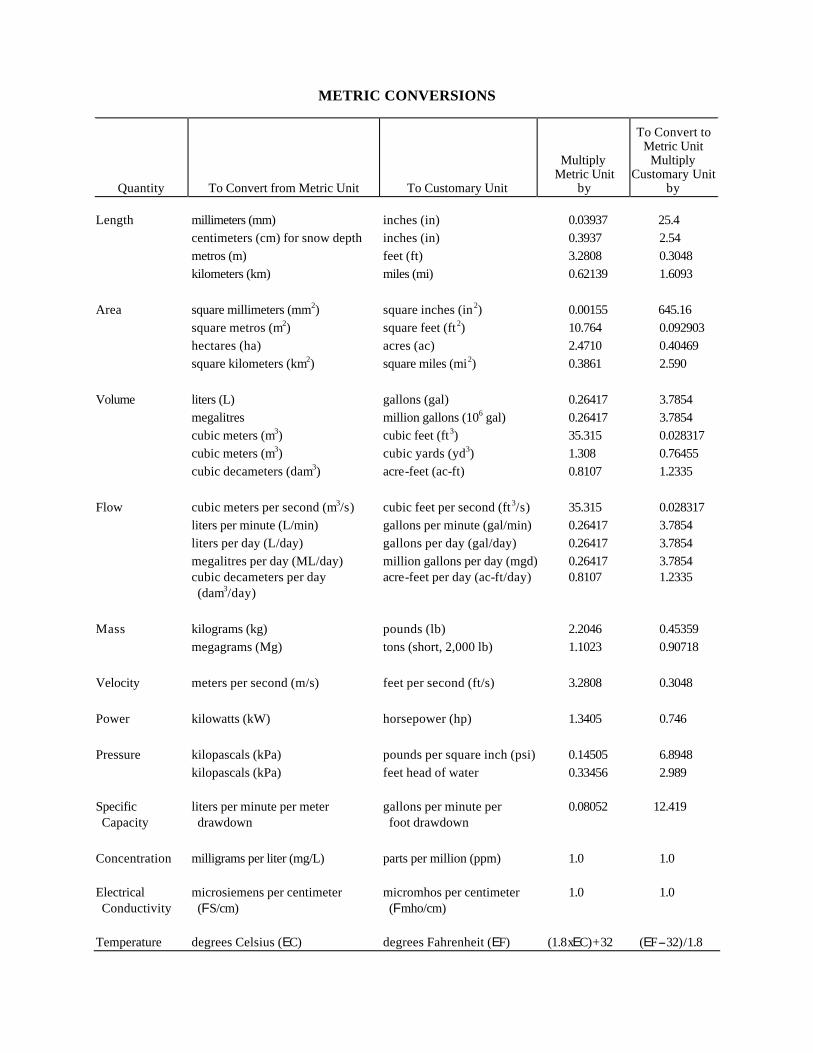
METRIC CONVERSIONS
Quantity
To Convert from Metric Unit
To Customary Unit
Multiply
Metric Unit by
To Convert to
Metric Unit Multiply
Customary Unit by
Length millimeters (mm) inches (in) 0.03937 25.4
centimeters (cm) for snow depth inches (in) 0.3937 2.54 metros (m) feet (ft) 3.2808 0.3048 kilometers (km) miles (mi) 0.62139 1.6093
Area square millimeters (mm2) square inches (in2) 0.00155 645.16
square metros (m2) square feet (ft2) 10.764 0.092903 hectares (ha) acres (ac) 2.4710 0.40469 square kilometers (km2) square miles (mi2) 0.3861 2.590
Volume liters (L) gallons (gal) 0.26417 3.7854
megalitres million gallons (106 gal) 0.26417 3.7854 cubic meters (m3) cubic feet (ft3) 35.315 0.028317 cubic meters (m3) cubic yards (yd3) 1.308 0.76455 cubic decameters (dam3) acre-feet (ac-ft) 0.8107 1.2335
Flow cubic meters per second (m3/s) cubic feet per second (ft3/s) 35.315 0.028317
liters per minute (L/min) gallons per minute (gal/min) 0.26417 3.7854 liters per day (L/day) gallons per day (gal/day) 0.26417 3.7854 megalitres per day (ML/day) million gallons per day (mgd) 0.26417 3.7854 cubic decameters per day acre-feet per day (ac-ft/day) 0.8107 1.2335 (dam3/day)
Mass kilograms (kg) pounds (lb) 2.2046 0.45359
megagrams (Mg) tons (short, 2,000 lb) 1.1023 0.90718 Velocity meters per second (m/s) feet per second (ft/s) 3.2808 0.3048 Power kilowatts (kW) horsepower (hp) 1.3405 0.746 Pressure kilopascals (kPa) pounds per square inch (psi) 0.14505 6.8948
kilopascals (kPa) feet head of water 0.33456 2.989 Specific liters per minute per meter gallons per minute per 0.08052 12.419 Capacity drawdown foot drawdown Concentration milligrams per liter (mg/L) parts per million (ppm) 1.0 1.0 Electrical microsiemens per centimeter micromhos per centimeter 1.0 1.0 Conductivity (FS/cm) (Fmho/cm) Temperature degrees Celsius (EC) degrees Fahrenheit (EF) (1.8xEC)+32 (EF--32)/1.8