san diego convention center and stadium project meetings … · 2016-08-24 · san diego convention...
TRANSCRIPT

San Diego Convention Center and Stadium Project Meetings Market and Impact Analysis Submitted to: Conventional Wisdom Corp. David O’Neal Chairman 2703 Rew Circle Ocoee, Florida 34761 August 23, 2016
w w w . h u n d e n p a r t n e r s . c o m
August 23, 2016 Conventional Wisdom Corp. David O’Neal Chairman 2703 Rew Circle Ocoee, Florida 34761
Dear Mr. O’Neal,
As you know, Conventional Wisdom Corp. engaged Hunden Strategic Partners (HSP) to perform a convention and meetings market analysis for the proposed San Diego Convention Center and Stadium Project initiated by the NFL San Diego Chargers franchise. The study has determined demand and projected impacts associated with the Project, specifically with relation to attendance, room nights generated, and potential incremental hotel rates associated with compression from the convention activity, as well as compression from NFL games. The attached is our final report.
This deliverable has been prepared under the following general assumptions and limiting conditions: § The findings presented herein reflect analysis of primary and secondary sources of information
that are assumed to be correct. HSP utilized sources deemed to be reliable, but cannot guarantee their accuracy.
§ No responsibility is taken for changes in market conditions after the date of this report and no obligation is assumed to revise this report to reflect events or conditions occurring after the date of this report.
§ HSP has no control over the timing of the Project opening. § Macroeconomic events affecting travel and the economy cannot be predicted and may impact
the development and performance of the project.
We have enjoyed serving you on this engagement and look forward to providing you with continuing service.
Sincerely yours,
Robin Scott Hunden
Hunden Strategic Partners

TABLE OF CONTENTS
----------- Executive Summary
Chapter 1 Demand and Impact
Appendix A Convention Industry Overview and Trends
Appendix B Convention Market Competitive and Comparable Analysis
Appendix C Influence of Comparable Downtown Stadiums
Appendix D Meeting Planner Interviews
Appendix E Hotel Market Analysis
Appendix F Comparable Convention City Hotel Tax Rate Data

Chargers Stadium and Convention Center Study Executive Summary - Page 2
PROJECT OVERVIEW Conventional Wisdom Corp. (Client) contracted with Hunden Strategic Partners (HSP) to perform a multi-pronged study related to the proposed San Diego Convention Center and Stadium Project initiated by the San Diego Chargers NFL franchise (Project). The study included an analysis of the likely market that the Project would penetrate for meetings, conferences and conventions, the experience of other similar facilities and cities, and the ultimate impact that the Project would have on the City of San Diego.
HSP conducted market research to determine the number and type of events that have the following characteristics:
! Interested in holding conventions and meetings in San Diego,
! Require dates between August 1st and January 31st, and
! Require up to 150,000 square feet of exhibition space (between August and January), and/or will use the entire facility with approximately 260,000 square feet of exhibition space.
HSP profiled the proposed mix-use Project, focusing on the convention facilities, as well as the potential opportunities and constraints provided by NFL usage. HSP also analyzed the loss of room nights and related impact, if the Project is not built.
The results of the study provide a better understanding of the market for conventions and similar events. The market analysis helps inform the demand and projected impact associated with the Project, specifically in relation to attendance, room nights generated, and potential incremental hotel room rates associated with increased demand from the convention activity, as well as from NFL games.
San Diego Convention Center and Stadium Project
The ballot measure supporting this Project calls for approximately 385,000 square feet of net leasable exhibit hall, meeting room and ballroom space. An initial, preliminary conceptual design for the project – subject to change – allocates the space as follows:
! 130,000 square foot exhibit hall,
! 30,000 square feet of swing space
! 100,000 square feet of stadium event level exhibit space,
! 63,000 square feet of ballroom space,
! 80,000 square feet of meeting rooms,
The Project would include approximately 61,000 seats, including club seats, loge seats, suites and other premium seat options. There is an expansion option to increase seating capacity to approximately 72,000 seats.

Chargers Stadium and Convention Center Study Executive Summary - Page 3
KEY FINDINGS Based on HSP’s research of the market, the performance of the existing facility, meeting planner interviews, experience in other markets, and analysis of similar situations, the following conclusions have been reached:
! More than 200,000 San Diego Hotel Room Nights Annually. Based on the analysis, the Project will induce and retain more than 2 million new hotel room nights to City of San Diego hotels in the first ten years of operation and average approximately 225,000 room nights per year by stabilization. Most of these additional hotel room nights will be due to new conventions and other groups coming to San Diego that currently are not able to be accommodated. Others will be due to the impact of Chargers home games, major concerts and other sporting events to be scheduled. In total, San Diego hotel room revenue is expected to increase by more than $750 million over the first ten years.
! Event Demand Leads to Major ADR Increases. Strong demand that pushes occupancy and rates higher and ripples out to surrounding areas generated by large events will increase hotel room revenue by nearly $200 million over the first ten-year period.
! Major Hotel Tax Revenue Increase. HSP expects hotel tax revenue of more than $125 million over the first ten years solely due to the Project.
! Hundreds of New Events. The new Project is expected to be available for non-NFL events 95 percent of days per year, leading to more than 100 events per year, nearly all of which will be new to the City of San Diego, except existing NFL and college bowl games.
! Hundreds of Thousands of Attendees. HSP estimates that the Project’s events will attract more than 200,000 non-Sports and Entertainment attendees per year and more than 900,000 total attendees per year.
! Consistent Convention Activity in Multiple Venues is Preferred. Given that the existing convention venue and the Project would likely be managed to maximize combined impact and market penetration, the Project helps continue, and respond to, a major trend in the convention industry of pursuing and hosting numerous overlapping or back-to-back mid-sized conventions that provide consistent hotel usage. This is in contrast to the prior “space race” where cities have attempted to lure the few largest conventions. The drawback to this “space race” strategy is that there is often a large time gap between major events. Cities like San Francisco, Seattle and Indianapolis – all successful convention cities – have adjusted their focus to filling the calendar with consistent medium-sized conventions that can occur simultaneously or back-to-back. Convention centers today and their major hotel partners have recognized that having a “two-piston” convention engine, where one mid-sized show is occurring while another moves in or out, is more likely to lead to consistently full-hotels.
! Football Schedule Allows for Long-Term Convention Bookings During Peak Times. HSP conducted an analysis of the calendar associated with groups that would likely come to a San Diego convention facility if dates were available. HSP also analyzed a draft, theoretical and conservatively projected long-range schedule for the Chargers. The NFL has worked well with

Chargers Stadium and Convention Center Study Executive Summary - Page 4
other cities that have or had convention needs associated with stadium spaces, such as Houston, Indianapolis, Seattle and St. Louis. The San Diego Chargers intend to work with the NFL to establish that during each season, one Sunday per month could be booked and blocked long term and more than a year in advance for conventions, along with every Monday and Thursday from mid-September through mid-November. The team and league will also enable three of these long-term bookings to be secured during the critical mid-September to mid-November eight-week time period (one each month), which is a busy time for conventions. This provides calendar availability and certainty for 67 percent or more of the days in this critical time period, as well as 100 percent availability from February through August (and possibly January – August, if there is no post-season play). For dates that become available after the NFL calendar is issued, the facility can sell available dates to groups that have shorter booking windows. These groups tend to pay more in hotel rates as the hotels are already filled with other long-term bookings.
! Football Calendar Dovetails Well with Convention Facilities During Holidays. Given that the Chargers are likely to play during and around holiday weekends such as Thanksgiving, Christmas and New Year’s, and conventions almost universally avoid scheduling during these times, HSP’s analysis suggests that, relative to a convention-only facility, those holiday periods at the proposed Project would likely be occupied with NFL or other events, such as concerts or the circus, during many of these periods, generating hotel room nights that would not otherwise be generated at a convention-only center.
! Benefits of a Downtown Convention and Sports Facility. The City of San Diego has experienced the positive impact of having the MLB San Diego Padres located downtown, which played a major role in revitalizing downtown and the Gaslamp Quarter’s restaurants, shopping, hotels and the overall convention environment. HSP’s analysis of other cities where the NFL stadium moved downtown shows the positive impact such a move can make on the downtown area, the overall city’s image and economy. It also makes for a fun and impactful pre- and post-game environment.
In conclusion, HSP’s analysis shows that the proposed Project would have a major positive impact on the City of San Diego’s hotels and the overall local economy.
TABLE OF CONTENTS ----------- Executive Summary
Chapter 1 Demand and Impact
Appendix A Convention Industry Overview and Trends
Appendix B Convention Market Competitive and Comparable Analysis
Appendix C Influence of Comparable Downtown Stadiums
Appendix D Meeting Planner Interviews
Appendix E Hotel Market Analysis
Appendix F Comparable Convention City Hotel Tax Rate Data

Chargers Stadium and Convention Center Study Chapter 1 - Page 2
DEMAND & IMPACT PROJECTIONS This chapter shows the expected level of demand and impact generated from the proposed Project. The projections in this analysis include the net new events, attendance, daytrips, hotel room nights, hotel revenue (as well as other spending impacts) in the city resulting from the Project.
The projection assumes that the Project is operated and marketed in a manner consistent with or better than the existing San Diego Convention Center.
Convention Center
The first table shows the breakdown of available convention dates. Other than certain dates for NFL games, the facility will be open and available for group business. As mentioned previously, the NFL and Chargers have indicated they will work to allow multiple long-term bookings during the NFL seasons for all Mondays through Thursdays as well as one weekend per month during the critical mid-September to mid-November convention season. While some dates during the season will not be known to be available until the NFL schedule is released, those dates will be available for short-term bookings, also known as “backfill” dates.

Chargers Stadium and Convention Center Study Chapter 1 - Page 3
Table 1-1
Potential Convention Booking Days Analysis
NFL Season Days
Percent of Available
Convention Days Long-Term Booking Days 94 67%Short-Term Booking Days 29 21%Total Bookable Convention Days 123 87%
NFL Days 18 13%Total Convention Days 141 100%Available Convention Days 141Holiday Periods 12Total Days (Sept - Jan) 153
Non-NFL Season Days
Percent of Available
Convention Days
Long-Term Booking Days 203 100%Total Bookable Convention Days 203 100%Holiday Periods 9Total Days 212
Total Year Days
Percent of Available
Convention DaysTotal Long-Term Bookable Days 297 86%Total Short-Term Bookable Days 29 8%Total Bookable Days 326 95%NFL Days 18 5%Total Convention Days 344 100%Holiday Period Days 21Total Days 365
Source: HSP
As shown, of the total available convention days that could be booked in the year, the Project would be able to book 95 percent to those dates. Nearly all of those, 86 percent of total potential dates, would be able to be booked long-term in advance of the event, while only nine percent of dates would fall in the short-term booking category. The dates needed by the NFL (18) total only five percent of days in the year. The NFL actually takes up fewer dates than the 21 days that are not bookable for conventions due to major holiday weekends or periods. However, the benefit of this combined facility is that it would likely be booked for an NFL or other sporting event (such as a bowl game or other event) during the November and December holiday periods. In this regard, hotels that otherwise would be struggling for demand during these periods would be full due to sports events.

Chargers Stadium and Convention Center Study Chapter 1 - Page 4
The table below shows the events by type projected for the Project.
Table 1-2 Event Demand Projections
Event Type
Conventions, Conferences and Trade ShowsEntire FacilityAll but Multipurpose Exhibition SpacePartial Exhibit, Ballroom & Meeting Rooms
Total
Event Demand Projections
Year 1 Year 2 Year 3 Year 4 Year 5 Year 6 Year 7 Year 8 Year 9 Year 10
3 4 5 5 5 5 5 5 5 59 11 13 15 15 15 15 15 15 156 7 8 10 10 10 10 10 10 10
18 22 26 30 30 30 30 30 30 30
Consumer ShowsEntire FacilityAll but Multipurpose Exhibition SpacePartial Exhibit, Ballroom & Meeting Rooms
Total
2 3 3 3 3 3 3 3 3 32 3 3 3 3 3 3 3 3 30 0 0 0 0 0 0 0 0 0
4 5 6 6 6 6 6 6 6 6
Corporate EventsAll but Multipurpose Exhibition SpacePartial Exhibit, Ballroom & Meeting Rooms
Total
2 3 3 4 4 4 4 4 4 412 15 19 22 24 24 24 24 24 24
14 18 22 26 28 28 28 28 28 28
Sports & Entertainment Events (including NFL)Entire Facility
Football Field Only
Football Field and Partial Remainder of Building
Total
8 8 8 8 8 8 8 8 8 8
6 6 6 6 6 6 6 6 6 6
0 0 0 0 0 0 0 0 0 0
14 14 14 14 14 14 14 14 14 14
BanquetsFull ballroomTwo-thirds of ballroomOne-third of ballroom
Total
2 2 2 2 2 2 2 2 2 22 2 2 2 2 2 2 2 2 2
14 16 18 19 19 19 19 19 19 19
18 20 22 24 24 24 24 24 24 24
Meetings Room EventsAll meeting roomsTwo-thirds of meeting roomsOne-third of meeting rooms
Total
4 5 6 6 6 6 6 6 6 65 7 9 10 10 10 10 10 10 109 12 15 16 16 16 16 16 16 16
18 24 30 32 32 32 32 32 32 32
Total All Events 86 103 120 132 134 134 134 134 134 134
Source: HSP
The number of events projected will increase from 86 in Year 1 to 134 by stabilization. The number of events that will take up a majority of the building is 39, which includes eight assumed NFL game day events. When considering that there are 52 weeks in a year and a maximum-occupied facility can reasonable accommodate approximately 46 weeks/weekends per year (when subtracting major holiday periods), the projection is reasonable and perhaps conservative, given HSP’s analysis of the market’s desire to hold events in the City of San Diego. HSP assumed four total sports and entertainment events would be held, which could be concerts, other major spectator events or other sporting events, such as bowl games.
The next table shows the number of attendees projected in the first ten years.

Chargers Stadium and Convention Center Study Chapter 1 - Page 5
Table 1-3 Projected Attendance (Individuals, Not Attendee Days)
Event Type Year 1 Year 2 Year 3 Year 4 Year 5 Year 6 Year 7 Year 8 Year 9 Year 10
Conventions, Conferences and Trade Shows 31,800 39,500 47,200 53,000 53,000 53,000 53,000 53,000 53,000 53,000Consumer Shows 28,900 43,400 43,400 43,400 43,400 43,400 43,400 43,400 43,400 43,400Corporate Events 15,500 20,400 24,300 29,100 31,000 31,000 31,000 31,000 31,000 31,000Sports & Entertainment Events (including NFL) 686,000 686,000 686,000 686,000 686,000 686,000 686,000 686,000 686,000 686,000Banquets 39,500 42,600 45,800 47,400 47,400 47,400 47,400 47,400 47,400 47,400Meetings Room Events 27,700 36,300 45,000 47,300 47,300 47,300 47,300 47,300 47,300 47,300
Total All Events 829,400 868,200 891,700 906,200 908,100 908,100 908,100 908,100 908,100 908,100
Non-Sports/Entertainment Attendance 143,400 182,200 205,700 220,200 222,100 222,100 222,100 222,100 222,100 222,100
Source: HSP
A total of 143,400 non-sports/entertainment attendees are projected in the first year, ramping up to 222,100 by stabilization. When including sports and entertainment attendees, the total exceeds 900,000 by stabilization.
The next table shows the projected share of attendees coming to events that are likely to bring a spouse, partner or other family member. In a location that is not as attractive a destination, there would be very limited spousal attendance. However, in locations like San Diego, San Francisco, Hawaii and others, the allure of the destination brings added visitation by family members. An extended stay before or after the event is typical, although HSP’s analysis is conservative and did not count extended stays.
Table 1-4
Estimated Spouse Ratio
Conventions, Conferences and Trade Shows 35%Consumer Shows 35%Corporate Events 25%Sports & Entertainment Events (including NFL) 10%Banquets 33%Meetings Room Events 25%
Source: HSP
These spousal, partner or other family attendees are not counted as part of the ticketed or official event attendance.
The next table shows the total estimated attendee and spouse “days.” Attendee days are a product of the number of attendees multiplied by the number of days in their event, which was conservatively estimated to only match the number of nights they would stay. For example, if an event is three days and two nights, the model only counts the number of nights.

Chargers Stadium and Convention Center Study Chapter 1 - Page 6
Table 1-5 Total Attendee & Spouse Days
Year 1 Year 2 Year 3 Year 4 Year 5 Year 6 Year 7 Year 8 Year 9 Year 10
Conventions, Conferences and Trade ShowsEntire Facility 31,590 42,120 52,650 52,650 68,250 68,250 68,250 68,250 68,250 68,250 All but Multipurpose Exhibition Space 58,793 71,858 84,923 97,988 97,988 97,988 97,988 97,988 97,988 97,988 Partial Exhibit, Ballroom & Meeting Rooms 15,444 18,018 20,592 25,740 25,740 25,740 25,740 25,740 25,740 25,740
Total 105,827 131,996 158,165 176,378 191,978 191,978 191,978 191,978 191,978 191,978
Consumer ShowsEntire Facility 42,120 63,180 63,180 63,180 63,180 63,180 63,180 63,180 63,180 63,180 All but Multipurpose Exhibition Space 28,220 42,331 42,331 42,331 42,331 42,331 42,331 42,331 42,331 42,331 Partial Exhibit, Ballroom & Meeting Rooms - - - - - - - - - -
Total 70,340 105,511 105,511 105,511 105,511 105,511 105,511 105,511 105,511 105,511
Corporate EventsAll but Multipurpose Exhibition Space 7,275 10,913 10,913 14,550 14,550 14,550 14,550 14,550 14,550 14,550 Partial Exhibit, Ballroom & Meeting Rooms 18,188 22,734 28,797 33,344 36,375 36,375 36,375 36,375 36,375 36,375
Total 25,463 33,647 39,709 47,894 50,925 50,925 50,925 50,925 50,925 50,925
Sports & Entertainment Events (including NFL)Entire Facility 589,600 589,600 589,600 589,600 589,600 589,600 589,600 589,600 589,600 589,600 Football Field Only 165,000 165,000 165,000 165,000 165,000 165,000 165,000 165,000 165,000 165,000 Football Field and Partial Remainder of Building - - - - - - - - - -
Total 754,600 754,600 754,600 754,600 754,600 754,600 754,600 754,600 754,600 754,600
BanquetsFull ballroom 14,000 14,000 14,000 14,000 14,000 14,000 14,000 14,000 14,000 14,000 Two-thirds of ballroom 9,100 9,100 9,100 9,100 9,100 9,100 9,100 9,100 9,100 9,100 One-third of ballroom 29,400 33,600 37,800 39,900 39,900 39,900 39,900 39,900 39,900 39,900
Total 52,500 56,700 60,900 63,000 63,000 63,000 63,000 63,000 63,000 63,000
Meetings Room EventsAll meeting rooms 30,000 37,500 45,000 45,000 45,000 45,000 45,000 45,000 45,000 45,000 Two-thirds of meeting rooms 15,625 21,875 28,125 31,250 31,250 31,250 31,250 31,250 31,250 31,250 One-third of meeting rooms 9,750 13,000 16,250 17,333 17,333 17,333 17,333 17,333 17,333 17,333
Total 55,375 72,375 89,375 93,583 93,583 93,583 93,583 93,583 93,583 93,583
Total All Events 1,064,104 1,154,828 1,208,259 1,240,965 1,259,596 1,259,596 1,259,596 1,259,596 1,259,596 1,259,596
Source: HSP
As shown, the number of visitor days is projected at just over one million in the first year, then increase to more than 1.2 million by stabilization.
The next table shows the projected share of attendees by event type that are spending the night and requiring lodging. The balance includes those who are either daytrippers or are spending the night with friends or family.
Table 1-6
Percent of Attendees Requiring Hotel Lodging
Conventions, Conferences and Trade Shows 90%Consumer Shows 6%Corporate Events 40%Sports & Entertainment Events (including NFL) 15%Banquets 10%Meetings Room Events 33%
Source: HSP

Chargers Stadium and Convention Center Study Chapter 1 - Page 7
Certain event types generate a high rate of hotel room nights, while other more local events, such as consumer shows, do not. High rate of hotel room nights occur with conventions and tradeshows, where most attendees are coming for several days and spending the night in hotels. For example, an estimated 20 percent of fans attending Chargers games are from outside the market, but HSP lowered the estimate of lodgers to 15 percent for all sports/entertainment events to be conservative. The ratio of visiting attendees is due to the attractiveness of San Diego combined with the desire of many opposing team fans to see their team play in an attractive environment.
The next table shows the total estimated daytrips. Daytrips result from the percentage of attendees who come just for the day, by event type. Nearly all, except NFL attendees and consumer show attendees, will be from outside the immediate area.
Table 1-7 Total Daytripper Days
Year 1 Year 2 Year 3 Year 4 Year 5 Year 6 Year 7 Year 8 Year 9 Year 10
Conventions, Conferences and Trade ShowsEntire Facility 3,159 4,212 5,265 5,265 6,825 6,825 6,825 6,825 6,825 6,825 All but Multipurpose Exhibition Space 5,879 7,186 8,492 9,799 9,799 9,799 9,799 9,799 9,799 9,799 Partial Exhibit, Ballroom & Meeting Rooms 1,544 1,802 2,059 2,574 2,574 2,574 2,574 2,574 2,574 2,574
Total 10,583 13,200 15,816 17,638 19,198 19,198 19,198 19,198 19,198 19,198
Consumer ShowsEntire Facility 39,593 59,389 59,389 59,389 59,389 59,389 59,389 59,389 59,389 59,389 All but Multipurpose Exhibition Space 26,527 39,791 39,791 39,791 39,791 39,791 39,791 39,791 39,791 39,791 Partial Exhibit, Ballroom & Meeting Rooms - - - - - - - - - -
Total 66,120 99,180 99,180 99,180 99,180 99,180 99,180 99,180 99,180 99,180
Corporate EventsAll but Multipurpose Exhibition Space 4,365 6,548 6,548 8,730 8,730 8,730 8,730 8,730 8,730 8,730 Partial Exhibit, Ballroom & Meeting Rooms 10,913 13,641 17,278 20,006 21,825 21,825 21,825 21,825 21,825 21,825
Total 15,278 20,188 23,826 28,736 30,555 30,555 30,555 30,555 30,555 30,555
Sports & Entertainment Events (including NFL)Entire Facility 501,160 501,160 501,160 501,160 501,160 501,160 501,160 501,160 501,160 501,160 Football Field Only 140,250 140,250 140,250 140,250 140,250 140,250 140,250 140,250 140,250 140,250 Football Field and Partial Remainder of Building - - - - - - - - - -
Total 641,410 641,410 641,410 641,410 641,410 641,410 641,410 641,410 641,410 641,410
BanquetsFull ballroom 12,600 12,600 12,600 12,600 12,600 12,600 12,600 12,600 12,600 12,600 Two-thirds of ballroom 8,190 8,190 8,190 8,190 8,190 8,190 8,190 8,190 8,190 8,190 One-third of ballroom 26,460 30,240 34,020 35,910 35,910 35,910 35,910 35,910 35,910 35,910
Total 47,250 51,030 54,810 56,700 56,700 56,700 56,700 56,700 56,700 56,700
Meetings Room EventsAll meeting rooms 20,100 25,125 30,150 30,150 30,150 30,150 30,150 30,150 30,150 30,150 Two-thirds of meeting rooms 10,469 14,656 18,844 20,938 20,938 20,938 20,938 20,938 20,938 20,938 One-third of meeting rooms 6,533 8,710 10,888 11,613 11,613 11,613 11,613 11,613 11,613 11,613
Total 37,101 48,491 59,881 62,701 62,701 62,701 62,701 62,701 62,701 62,701
Total All Events 817,741 873,499 894,923 906,365 909,744 909,744 909,744 909,744 909,744 909,744
Percent of Total Visitor Days 76.8% 75.6% 74.1% 73.0% 72.2% 72.2% 72.2% 72.2% 72.2% 72.2%
Source: HSP
The number of daytrips is expected to increase from more than 817,000 in Year 1 to nearly 910,000 by stabilization. The percentage of total visitor days represented by daytrips is 72.2 percent by stabilization.
The next table shows the total estimated overnights. This is a result of the percentage of attendees who come and stay overnight, by event type.

Chargers Stadium and Convention Center Study Chapter 1 - Page 8
Table 1-8 Total Overnighter Days
Year 1 Year 2 Year 3 Year 4 Year 5 Year 6 Year 7 Year 8 Year 9 Year 10
Conventions, Conferences and Trade ShowsEntire Facility 28,431 37,908 47,385 47,385 61,425 61,425 61,425 61,425 61,425 61,425 All but Multipurpose Exhibition Space 52,913 64,672 76,430 88,189 88,189 88,189 88,189 88,189 88,189 88,189 Partial Exhibit, Ballroom & Meeting Rooms 13,900 16,216 18,533 23,166 23,166 23,166 23,166 23,166 23,166 23,166
Total 95,244 118,796 142,348 158,740 172,780 172,780 172,780 172,780 172,780 172,780
Consumer ShowsEntire Facility 2,527 3,791 3,791 3,791 3,791 3,791 3,791 3,791 3,791 3,791 All but Multipurpose Exhibition Space 1,693 2,540 2,540 2,540 2,540 2,540 2,540 2,540 2,540 2,540 Partial Exhibit, Ballroom & Meeting Rooms - - - - - - - - - -
Total 4,220 6,331 6,331 6,331 6,331 6,331 6,331 6,331 6,331 6,331
Corporate EventsAll but Multipurpose Exhibition Space 2,910 4,365 4,365 5,820 5,820 5,820 5,820 5,820 5,820 5,820 Partial Exhibit, Ballroom & Meeting Rooms 7,275 9,094 11,519 13,338 14,550 14,550 14,550 14,550 14,550 14,550
Total 10,185 13,459 15,884 19,158 20,370 20,370 20,370 20,370 20,370 20,370
Sports & Entertainment Events (including NFL)Entire Facility 88,440 88,440 88,440 88,440 88,440 88,440 88,440 88,440 88,440 88,440 Football Field Only 24,750 24,750 24,750 24,750 24,750 24,750 24,750 24,750 24,750 24,750 Football Field and Partial Remainder of Building - - - - - - - - - -
Total 113,190 113,190 113,190 113,190 113,190 113,190 113,190 113,190 113,190 113,190
BanquetsFull ballroom 1,400 1,400 1,400 1,400 1,400 1,400 1,400 1,400 1,400 1,400 Two-thirds of ballroom 910 910 910 910 910 910 910 910 910 910 One-third of ballroom 2,940 3,360 3,780 3,990 3,990 3,990 3,990 3,990 3,990 3,990
Total 5,250 5,670 6,090 6,300 6,300 6,300 6,300 6,300 6,300 6,300
Meetings Room EventsAll meeting rooms 9,900 12,375 14,850 14,850 14,850 14,850 14,850 14,850 14,850 14,850 Two-thirds of meeting rooms 5,156 7,219 9,281 10,313 10,313 10,313 10,313 10,313 10,313 10,313 One-third of meeting rooms 3,218 4,290 5,363 5,720 5,720 5,720 5,720 5,720 5,720 5,720
Total 18,274 23,884 29,494 30,883 30,883 30,883 30,883 30,883 30,883 30,883
Total All Events 246,363 281,329 313,336 334,600 349,853 349,853 349,853 349,853 349,853 349,853
Percent of Total Visitor Days 23.2% 24.4% 25.9% 27.0% 27.8% 27.8% 27.8% 27.8% 27.8% 27.8%
Source: HSP
The number of overnights is expected to increase from approximately 246,000 in Year 1 to more than 349,000 by stabilization. The percentage of total visitor days represented by overnighters is 27.6 percent by stabilization.
The next table shows the total estimated room nights, after making assumptions for the number of guests per room night. While many corporate visitors travel and stay in a hotel alone, many group and leisure visitors do not.
Chargers Stadium and Convention Center Study Chapter 1 - Page 9
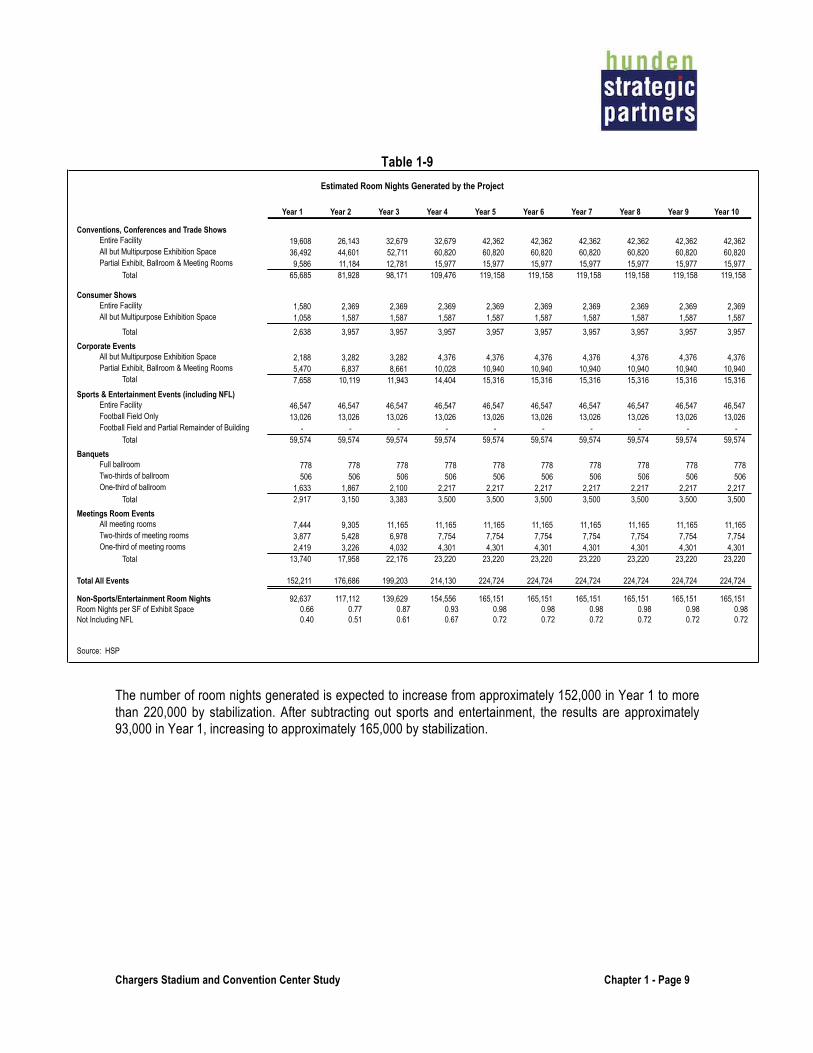
Table 1-9 Estimated Room Nights Generated by the Project
Conventions, Conferences and Trade ShowsEntire FacilityAll but Multipurpose Exhibition SpacePartial Exhibit, Ballroom & Meeting Rooms
Total
Consumer ShowsEntire FacilityAll but Multipurpose Exhibition Space
Estimated Room Nights Generated by the Project
Year 1 Year 2 Year 3 Year 4 Year 5 Year 6 Year 7 Year 8 Year 9 Year 10
19,608 26,143 32,679 32,679 42,362 42,362 42,362 42,362 42,362 42,362 36,492 44,601 52,711 60,820 60,820 60,820 60,820 60,820 60,820 60,820 9,586 11,184 12,781 15,977 15,977 15,977 15,977 15,977 15,977 15,977
65,685 81,928 98,171 109,476 119,158 119,158 119,158 119,158 119,158 119,158
1,580 2,369 2,369 2,369 2,369 2,369 2,369 2,369 2,369 2,369 1,058 1,587 1,587 1,587 1,587 1,587 1,587 1,587 1,587 1,587
Total
Corporate EventsAll but Multipurpose Exhibition SpacePartial Exhibit, Ballroom & Meeting Rooms
Total
Sports & Entertainment Events (including NFL)Entire FacilityFootball Field OnlyFootball Field and Partial Remainder of Building
Total
BanquetsFull ballroomTwo-thirds of ballroomOne-third of ballroom
Total
Meetings Room EventsAll meeting roomsTwo-thirds of meeting roomsOne-third of meeting rooms
Total
2,638 3,957 3,957 3,957 3,957 3,957 3,957 3,957 3,957 3,957
2,188 3,282 3,282 4,376 4,376 4,376 4,376 4,376 4,376 4,376 5,470 6,837 8,661 10,028 10,940 10,940 10,940 10,940 10,940 10,940 7,658 10,119 11,943 14,404 15,316 15,316 15,316 15,316 15,316 15,316
46,547 46,547 46,547 46,547 46,547 46,547 46,547 46,547 46,547 46,547 13,026 13,026 13,026 13,026 13,026 13,026 13,026 13,026 13,026 13,026
- - - - - - - - - - 59,574 59,574 59,574 59,574 59,574 59,574 59,574 59,574 59,574 59,574
778 778 778 778 778 778 778 778 778 778 506 506 506 506 506 506 506 506 506 506
1,633 1,867 2,100 2,217 2,217 2,217 2,217 2,217 2,217 2,217 2,917 3,150 3,383 3,500 3,500 3,500 3,500 3,500 3,500 3,500
7,444 9,305 11,165 11,165 11,165 11,165 11,165 11,165 11,165 11,165 3,877 5,428 6,978 7,754 7,754 7,754 7,754 7,754 7,754 7,754 2,419 3,226 4,032 4,301 4,301 4,301 4,301 4,301 4,301 4,301
13,740 17,958 22,176 23,220 23,220 23,220 23,220 23,220 23,220 23,220
Total All Events
Non-Sports/Entertainment Room NightsRoom Nights per SF of Exhibit SpaceNot Including NFL
Source: HSP
152,211 176,686 199,203 214,130 224,724 224,724 224,724 224,724 224,724 224,724
92,637 117,112 139,629 154,556 165,151 165,151 165,151 165,151 165,151 165,151 0.66 0.77 0.87 0.93 0.98 0.98 0.98 0.98 0.98 0.980.40 0.51 0.61 0.67 0.72 0.72 0.72 0.72 0.72 0.72
The number of room nights generated is expected to increase from approximately 152,000 in Year 1 to more than 220,000 by stabilization. After subtracting out sports and entertainment, the results are approximately 93,000 in Year 1, increasing to approximately 165,000 by stabilization.

Chargers Stadium and Convention Center Study Chapter 1 - Page 10
IMPACT ANALYSIS The incremental impact of the Project will increase economic activity and result in additional room nights, restaurant spending, retail spending, increased fiscal impact, income, earnings and employment for the City of City of San Diego economy.
The net new and recaptured direct spending discussed earlier is considered to be the Direct Impact, which is is in addition to any natural growth.
From the direct spending figures, further impact analyses will be completed.
! Indirect Impacts are the supply of goods and services resulting from the initial direct spending. For example, a convention attendee’s direct expenditure on a hotel room causes the hotel to purchase linens and other items from suppliers. The portion of these hotel purchases that are within the local economy is considered an indirect economic impact.
! Induced Impacts embody the change in local spending due to the personal expenditures by employees whose incomes are affected by direct and indirect spending. For example, a waitress at a restaurant may have more personal income as a result of the convention attendee’s visit. The amount of the increased income that the employee spends in the area is considered an induced impact.
! Fiscal Impacts represent the incremental tax revenue collected by the community due to the net new economic activity. Fiscal impacts provide an offset to the potential public expenditures required to support the development.
! Earnings and Employment Impacts include the incremental employment provided not only onsite, but due to the spending associated with it. For example, the direct, indirect and induced impacts generate spending, support new and ongoing businesses and ultimately result in ongoing employment for citizens.
There are a variety of impacts to the city’s hotels from the Project, including increases in existing visitor spending due to better facilities, new group attendee spending, new exhibitor spending, new corporate transient spending and new leisure spending.
The following table summarizes the daytrip and overnight visitor activity expected over ten years.
Table 1-10 Net New Visitors and Room Nights
Year 1 Year 2 Year 3 Year 4 Year 5
New Daytrip Visitor Days 677,491 733,249 754,673 766,115 769,494
New Overnighter Days 246,363 281,329 313,336 334,600 349,853
New Room Nights 152,211 176,686 199,203 214,130 224,724
Source: Hunden Strategic Partners
Net New Visitors and Room Nights
Year 10 Total
769,494 7,548,490
349,853 3,274,746
224,724 2,090,577

Chargers Stadium and Convention Center Study Chapter 1 - Page 11
As shown, over ten years, more than 7.5 million daytrip visitor days and nearly 3.2 million overnights are expected to be new to the City of San Diego. New room nights from the overnights are projected to total nearly 2.1 million over the ten-year period.
Impact Projections
While the basis for the impact projections is the number of room nights to the City of San Diego, additional impact occurs as well, from the compression of these room nights on an already highly occupied hotel set. This will cause increased room rates during events, especially NFL games and large conventions. Both the new room nights and increased rates generate increased revenue for City of San Diego hotels. In addition, hundreds of thousands of daytrips will result in money being spent in the City of San Diego hotels before and after events at the Project, whether on game days, during consumer shows or before/after other events like banquets, meetings and conferences.
Increased Hotel Rate Analysis
The next table shows the increase in hotel revenue due to ADR (average daily rate), also known in the industry as compression, from major events. HSP selected only those events that would either take up most or all of the building and generate significant room nights, as well as NFL games. Smaller conventions, conferences, trade shows, consumer shows, banquets and meetings were not included.
HSP identified other cities with downtown NFL stadiums to better understand the impact of home games on room rates. The following table summarizes hotel compression rates due to NFL home and away games for comparable NFL markets with downtown stadiums for selected dates, where comparisons were available for the upcoming season. While the increased rates occur most strongly in the downtown area surrounding the stadiums, the ripple effects of the rate increases push out to all city hotels during “city-wide” events.

Chargers Stadium and Convention Center Study Chapter 1 - Page 12
Table 1-11 Hotel Compression Due to NFL Home/Away Games*
Comparable Market Hotel Type Hotel Property # of Rooms Home Rate Home Date Away Rate Away Date Increase/DecreaseFull Service/Luxury Four Seasons Baltimore 257 559.00$ 10/9/16 489.00$ 10/23/16 13%
Stadium Hotel Holiday Inn Express Baltimore at the Stadiums 123 279.00$ 10/9/16 205.00$ 10/23/16 27%
Convention Center Hotel Hilton Baltimore 757 159.00$ 10/9/16 165.00$ 10/23/16 -4%
Select Service Residence Inn 188 189.00$ 10/9/16 239.00$ 10/23/16 -26%
Boutique Kimpton Hotel Monaco 202 249.00$ 10/9/16 249.00$ 10/23/16 0%
Average 305 287.00$ 269.40$ 6%
Full Service/Luxury The Westin Convention Center 616 289.00$ 12/4/16 349.00$ 10/16/16 -21%
Convention Center Hotel Wyndham Grand Pittsburgh 712 304.00$ 12/4/16 304.00$ 10/16/16 0%
Select Service Holiday Inn Express and Suites 135 282.00$ 12/4/16 209.00$ 10/16/16 26%
Boutique Kimpton Hotel Monaco 248 305.00$ 12/4/16 279.00$ 10/16/16 9%
Average 428 295.00$ 285.25$ 3%
Full Service/Luxury The Westin 575 174.00$ 9/11/16 161.00$ 9/18/16 7%
Convention Center Hotel JW Marriott 1005 389.00$ 9/11/16 229.00$ 9/18/16 41%
Select Service Holiday Inn Express Indianapolis Downtown 108 192.00$ 9/11/16 160.00$ 9/18/16 17%
Boutique The Alexander 209 207.00$ 9/11/16 170.00$ 9/18/16 18%
Average 240.50$ 180.00$ 25%
Full Service/Luxury Fairmont Olympic Hotel 450 349.00$ 10/16/16 319.00$ 10/23/16 9%
Stadium Hotel Silver Cloud Hotel - Seattle Stadium 211 499.00$ 10/16/16 289.00$ 10/23/16 42%
Convention Center Hotel Westin Seattle 891 249.00$ 10/16/16 249.00$ 10/23/16 0%
Select Service Hilton Garden Inn Seattle Downtown 222 229.00$ 10/16/16 229.00$ 10/23/16 0%
Boutique The Maxwell Hotel 139 219.00$ 10/16/16 169.00$ 10/23/16 23%
Average 383 309.00$ 251.00$ 19%
Full Service/Luxury Hilton Nashville Downtown 330 479.00$ 10/23/16 379.00$ 11/20/16 21%
Convention Center Hotel Omni Nashville 800 499.00$ 10/23/16 399.00$ 11/20/16 20%
Select Service Holiday Inn Express 287 419.00$ 10/23/16 299.00$ 11/20/16 29%
Boutique Union Station Hotel 125 529.00$ 10/23/16 409.00$ 11/20/16 23%
Average 386 481.50$ 371.50$ 23%
Comparable Market Average 320.36$ 270.41$ 12.3%Rate Differential 49.95$
* For home game dates when hotels are not sold out as of 7/15/16
Source: Expedia.com Advertised Rate, Smith Travel Research
Baltimore
Pittsburgh
Seattle
Nashville
Indianapolis
As the table shows, using a simple average, rates increased by $49.95, or 12.3 percent, during home game football weekends. While rates in the City of San Diego may increase by more or less, this sampling provides a solid indication that home games in downtown facilities provide room night compression.
HSP notes that NFL games are also more likely to generate in-bound tourism when the city is a compelling destination. San Diego has both an ideal climate when many other cities are cold during the NFL season and is a popular destination generally. Internal data from the Chargers suggest that home game attendance is made up of a significant portion of visiting fans. These visiting fans’ spending provides significant impact to the City of San Diego. With the new stadium located downtown in a walkable environment, HSP expects even more inbound fans to games. HSP expects that existing out-of-town fans will continue to come, but will spend more on downtown hotel rooms, and additional fans will come that are not coming today, due to the improved location.
The following table shows the projection of room revenue from incremental spending on existing room nights.

Chargers Stadium and Convention Center Study Chapter 1 - Page 13
Table 1-12 Projection of Room Revenue from Incremental Spending on Existing Room Nights Projection of Room Revenue from Incremental Spending on Existing Room Nights
Year 1 Year 2 Year 3 Year 4 Year 5 Year 6 Year 7 Year 8 Year 9 Year 10Number of Impacted Hotel Rooms (all SD Hotels) 44,326 44,326 44,326 44,326 44,326 44,326 44,326 44,326 44,326 44,326 Estimated Annual Occupancy (all SD Hotels 72.0% 72.0% 72.0% 72.0% 72.0% 72.0% 72.0% 72.0% 72.0% 72.0%Estimated Annual Rate (all SD Hotels) 160.68$ 164.70$ 168.81$ 173.03$ 177.36$ 181.79$ 186.34$ 191.00$ 195.77$ 200.67$ Annual Room Nights in Impacted Group Hotels (000s) 11,649 11,649 11,649 11,649 11,649 11,649 11,649 11,649 11,649 11,649 Annual Room Revenue in Impacted Group Hotels (000s) 1,871,730$ 1,871,730 1,871,730 1,871,730 1,871,730 1,871,730 1,871,730 1,871,730 1,871,730 1,871,730 Estimated Nights per Year of Intense Compression 25 30 35 38 41 41 41 41 41 41 Average Estimated ADR Increase due to Compression 14.67$ 15.03$ 15.41$ 15.79$ 16.19$ 16.59$ 17.01$ 17.43$ 17.87$ 18.32$ Increase in Room Revenue from Compression (000s) 11,478$ 14,240$ 17,133$ 19,250$ 21,116$ 21,644$ 22,185$ 22,739$ 23,308$ 23,891$
Source: HSP
HSP assumed that during major events, considered “city-wide” events, that rooms would become more scarce, allowing hotel yield managers to increase rates, as is the standard practice in the industry. The rate during these compression periods was assumed to increase an average of nearly $15 per occupied room in the first year. The increase on the one-third of rooms (approximately 15,000) located downtown is expected to be more than $25. Based on the number of existing occupied room nights during these intense compression nights, HSP estimated an increase in hotel revenue for existing hotels’ occupied rooms beginning at $11.5 million and increasing to nearly $24 million by Year 10.
The daily spending by visitors and the overnight spending by overnight visitors all contribute to the economic impact of the Project. Spending by category, conservatively estimated based on a number of inputs, was populated in the model. Other spending includes entertainment, such as concerts and tours, as well as other non-specified spending. These are shown in the next table.
Table 1-13 Estimated Spending Per Visitor per Day
Year 1 Year 2 Year 3 Year 4 Year 5 Year 6 Year 7 Year 8 Year 9 Year 10Spending per New Visitor - OvernightOnsite Food & Beverage $18.49 $18.95 $19.43 $19.91 $20.41 $20.92 $21.44 $21.98 $22.53 $23.09Offsite Food & Beverage $43.13 $44.21 $45.31 $46.44 $47.60 $48.79 $50.01 $51.26 $52.55 $53.86Total Food & Beverage $61.62 $63.16 $64.74 $66.36 $68.01 $69.71 $71.46 $73.24 $75.07 $76.95
Lodging Spending $149.52 $155.79 $161.65 $166.78 $171.59 $175.88 $180.28 $184.78 $189.40 $194.14Retail Spending $21.51 $22.04 $22.59 $23.16 $23.74 $24.33 $24.94 $25.56 $26.20 $26.86Transportation Spending $11.81 $12.11 $12.41 $12.72 $13.04 $13.37 $13.70 $14.04 $14.40 $14.76Other Spending $6.14 $6.30 $6.45 $6.62 $6.78 $6.95 $7.12 $7.30 $7.49 $7.67Total Direct Spending $250.60 $259.40 $267.84 $275.64 $283.16 $290.24 $297.50 $304.94 $312.56 $320.37
Spending per Visitor - Day TripOnsite Food & Beverage $12.94 $13.27 $13.60 $13.94 $14.29 $14.64 $15.01 $15.39 $15.77 $16.16Offsite Food & Beverage $23.72 $24.31 $24.92 $25.54 $26.18 $26.84 $27.51 $28.20 $28.90 $29.62Total Food & Beverage $36.66 $37.58 $38.52 $39.48 $40.47 $41.48 $42.52 $43.58 $44.67 $45.79
Retail Spending $14.41 $14.77 $15.14 $15.52 $15.90 $16.30 $16.71 $17.13 $17.56 $17.99Transportation Spending $9.45 $9.69 $9.93 $10.18 $10.43 $10.69 $10.96 $11.24 $11.52 $11.80Other Spending $5.53 $5.67 $5.81 $5.95 $6.10 $6.26 $6.41 $6.57 $6.74 $6.91Total Direct Spending $66.05 $67.70 $69.40 $71.13 $72.91 $74.73 $76.60 $78.52 $80.48 $82.49
Source: HSP
The per-person per-day spending for overnight guests totals more than $250 in Year 1 and increases with inflation, assumed at 2.5 percent. The daily spending per person for day trips is expected to be approximately $66 in the first year.
The table below shows the direct net new spending, based on the analysis.

Chargers Stadium and Convention Center Study Chapter 1 - Page 14
Table 1-14 Direct Net New Spending to San Diego (000s)
Year 1 Year 2 Year 3 Year 4 Year 5
Food & Beverage $40,019 $45,323 $49,354 $52,450 $54,936Lodging $48,314 $58,068 $67,782 $75,056 $81,147Retail $15,060 $17,031 $18,504 $19,636 $20,543Transportation $9,314 $10,511 $11,384 $12,055 $12,591Other $5,260 $5,927 $6,407 $6,776 $7,069Total $117,967 $136,861 $153,430 $165,974 $176,286
Source: Hunden Strategic Partners
Direct Net New Spending to San Diego (000s)
Year 10 Total
$62,155 $538,061$91,810 $767,567$23,243 $201,455$14,245 $123,692$7,998 $69,525
$199,451 $1,700,300
Spending on lodging and food/beverage are the largest components of direct net new spending to the City of San Diego; however, the impact on hotels is the focus. Between the new room nights generated and the increased ADR from compression, more than $91 million in annual new hotel revenue is expected by Year 10, totaling more than $767 million over the first ten years.
The following table shows the new earnings associated with the new economic activity.
Table 1-15 Net New Earnings from Direct New Spending (000s)
Year 1 Year 2 Year 3 Year 4 Year 5
Net New Earnings from Direct New Spending (000s)
Year 10 TotalNet New EarningsFrom Direct $38,391 $44,434 $49,671 $53,639 $56,896From Indirect $12,786 $14,844 $16,654 $18,023 $19,150From Induced $14,033 $16,275 $18,239 $19,726 $20,948Total $65,211 $75,553 $84,563 $91,388 $96,994
Source: Hunden Strategic Partners
$64,373 $549,574$21,666 $184,631$23,700 $202,082
$109,740 $936,287
Over ten years, the new earnings generated by the new spending is expected to total more than $936 million.
The following table shows the new full-time equivalent employment (FTE) associated with the new economic activity.
Table 1-16 Net New Full-Time Equivalent Jobs from New Earnings
Year 1 Year 2 Year 3 Year 4 Year 5
Net New Full-Time Equivalent Jobs from New Earnings
Year 10
Net New FTE JobsFrom Direct 2,105 2,366 2,568 2,697 2,784 From Indirect 714 802 869 913 942 From Induced 838 942 1,021 1,072 1,106 Total 3,657 4,110 4,458 4,681 4,831
Source: Hunden Strategic Partners
2,784 942
1,106 4,831

Chargers Stadium and Convention Center Study Chapter 1 - Page 15
The number of full-time equivalent supported jobs by the Project is expected to be more than 4,800 by stabilization.
Fiscal Impact
The fiscal impact of the Project is the benefit to the community via taxes generated. HSP has estimated the net new hotel taxes generated by City of San Diego hotels due to the Project.
The following table shows the projections of new hotel room taxes from City of San Diego hotels generated over the first ten years of operation.
Table 1-17 Fiscal Impact - Net New Hotel Tax from New Lodging Spending at San Diego Hotels due to Project (000s)
Year 1 Year 2 Year 3 Year 4 Year 5
Fiscal Impact - Net New Hotel Tax from New Lodging Spending at San Diego Hotels due to Project (000s)
Year 10 Total Existing Hotel Occupancy Tax (10.5%) $5,073 $6,097 $7,117 $7,881 $8,520Deposit to SD Tourism and Marketing Fund (2.0%) $966 $1,161 $1,356 $1,501 $1,623Proposed Hotel Occupancy Tax (4.0%) $1,933 $2,323 $2,711 $3,002 $3,246Total $7,972 $9,581 $11,184 $12,384 $13,389
$9,640 $80,595$1,836 $15,351$3,672 $30,703$15,149 $126,649
Source: Hunden Strategic Partners
In total, taxes generated from the City of San Diego hotel room revenues are expected to increase by more than $126 million during the first ten-year period.
The following table shows the summary of estimated ten-year impacts for the Project.

Chargers Stadium and Convention Center Study Chapter 1 - Page 16
Table 1-18
Summary of 10-Year Estimated Impacts
Net New Spending (millions)Direct $1,700Indirect $571Induced $672Total $2,943
Net New Earnings (millions)From Direct $550From Indirect $185From Induced $202Total $936
New Hotel Tax from New Downtown Hotel Revenue (millions)Existing Hotel Occupancy Tax (10.5%) $80.6Deposit to SD Tourism and Marketing Fund (2.0%) $15.4Proposed Hotel Occupancy Tax (4.0%) $30.7Total $126.6
Source: Hunden Strategic Partners
The net new spending for the Project totals $2.9 billion over the first ten-year period, including more than $930 million in new earnings, and more than $126 million in new hotel taxes generated at City of San Diego hotels.

TABLE OF CONTENTS ----------- Executive Summary
Chapter 1 Demand and Impact
Appendix A Convention Industry Overview and Trends
Appendix B Convention Market Competitive and Comparable Analysis
Appendix C Influence of Comparable Downtown Stadiums
Appendix D Meeting Planner Interviews
Appendix E Hotel Market Analysis
Appendix F Comparable Convention City Hotel Tax Rate Data
Chargers Stadium and Convention Center Study Appendix A - Page 2
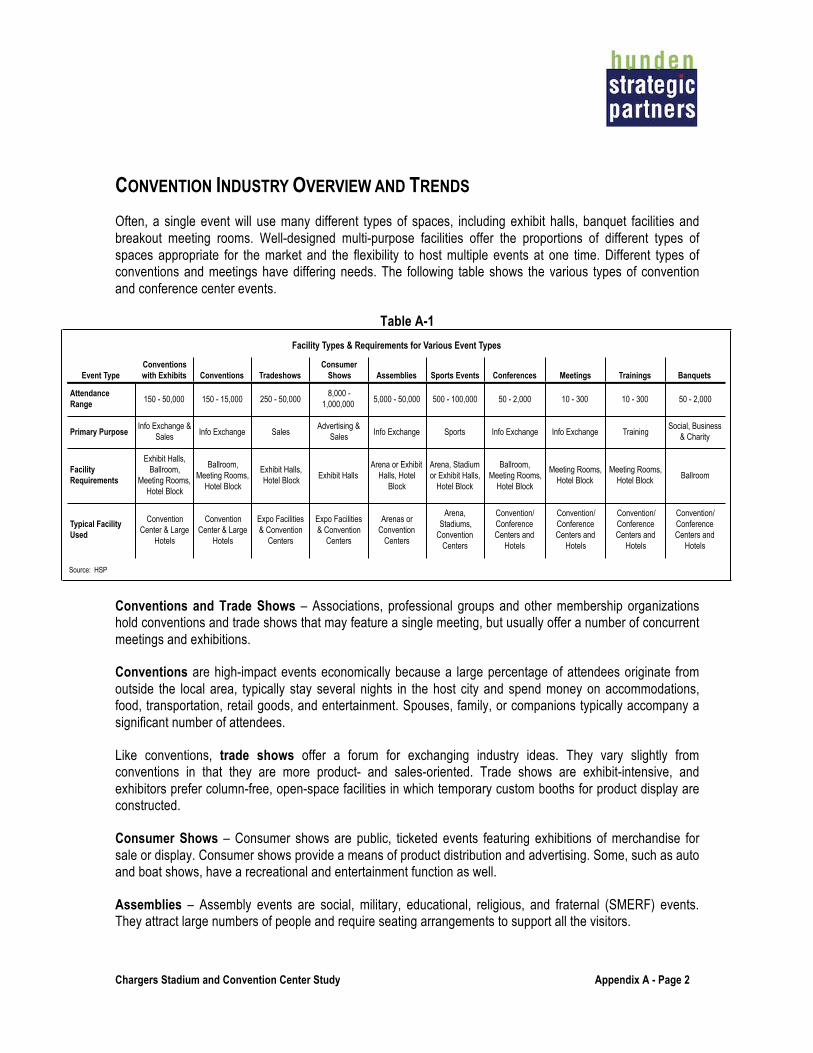
CONVENTION INDUSTRY OVERVIEW AND TRENDS Often, a single event will use many different types of spaces, including exhibit halls, banquet facilities and breakout meeting rooms. Well-designed multi-purpose facilities offer the proportions of different types of spaces appropriate for the market and the flexibility to host multiple events at one time. Different types of conventions and meetings have differing needs. The following table shows the various types of convention and conference center events.
Table A-1 Facility Types & Requirements for Various Event Types
Event TypeConventions with Exhibits Conventions Tradeshows
Consumer Shows Assemblies Sports Events Conferences Meetings Trainings Banquets
Attendance Range 150 - 50,000 150 - 15,000 250 - 50,000
8,000 - 1,000,000 5,000 - 50,000 500 - 100,000 50 - 2,000 10 - 300 10 - 300 50 - 2,000
Primary PurposeInfo Exchange &
Sales Info Exchange SalesAdvertising &
Sales Info Exchange Sports Info Exchange Info Exchange TrainingSocial, Business
& Charity
Facility Requirements
Exhibit Halls, Ballroom,
Meeting Rooms, Hotel Block
Ballroom, Meeting Rooms,
Hotel Block
Exhibit Halls, Hotel Block Exhibit Halls
Arena or Exhibit Halls, Hotel
Block
Arena, Stadium or Exhibit Halls,
Hotel Block
Ballroom, Meeting Rooms,
Hotel Block
Meeting Rooms, Hotel Block
Meeting Rooms, Hotel Block Ballroom
Typical Facility Used
Convention Center & Large
Hotels
Convention Center & Large
Hotels
Expo Facilities & Convention
Centers
Expo Facilities & Convention
Centers
Arenas or Convention
Centers
Arena, Stadiums,
Convention Centers
Convention/ Conference Centers and
Hotels
Convention/ Conference Centers and
Hotels
Convention/ Conference Centers and
Hotels
Convention/ Conference Centers and
Hotels
Source: HSP
Conventions and Trade Shows – Associations, professional groups and other membership organizations hold conventions and trade shows that may feature a single meeting, but usually offer a number of concurrent meetings and exhibitions.
Conventions are high-impact events economically because a large percentage of attendees originate from outside the local area, typically stay several nights in the host city and spend money on accommodations, food, transportation, retail goods, and entertainment. Spouses, family, or companions typically accompany a significant number of attendees.
Like conventions, trade shows offer a forum for exchanging industry ideas. They vary slightly from conventions in that they are more product- and sales-oriented. Trade shows are exhibit-intensive, and exhibitors prefer column-free, open-space facilities in which temporary custom booths for product display are constructed.
Consumer Shows – Consumer shows are public, ticketed events featuring exhibitions of merchandise for sale or display. Consumer shows provide a means of product distribution and advertising. Some, such as auto and boat shows, have a recreational and entertainment function as well.
Assemblies – Assembly events are social, military, educational, religious, and fraternal (SMERF) events. They attract large numbers of people and require seating arrangements to support all the visitors.

Chargers Stadium and Convention Center Study Appendix A - Page 3
Sports and Entertainment – Includes a variety of sports at any level of competition that can be played indoors. Typically, such events are held in arenas or stadiums; however, many events, including boxing, wrestling, cheerleading, and basketball, can be held in exhibit facilities with temporary seating/stands.
Conferences – Conferences are meetings typically held by associations, professional groups, educational institutions, and other membership organizations. These events usually require space for general sessions, food service facilities and breakout rooms.
Corporate, Training and Other Meetings – Corporate meetings include training seminars, professional and technical conferences, business/job fairs, incentive trips and management meetings.
Banquets – Banquets are typically locally generated events, from social and wedding events to the annual Chamber of Commerce event, which can be the largest of its kind in a given city.
The following figure shows the comparison of supply and demand growth beginning in 1987.
Figure A-1
100
120
140
160
180
200
220
240
1987
19
88
1989
19
90
1991
19
92
1993
19
94
1995
19
96
1997
19
98
1999
20
00
2001
20
02
2003
20
04
2005
20
06
2007
20
08
2009
20
10
2011
20
12
2013
20
14
Inde
x
National Exhibit Space Supply & Demand
Exhibit Space Supply Growth Net Square Feet of Paid Exhibit Space Source: MEHD 2009, HSP
While demand is now increasing at a higher rate than supply, the gap in the supply/demand index still provides meeting and event planners an edge in negotiations. The increase in supply has led to increased competition amongst convention centers. Most existing facilities are in some form of expansion or renovation

Chargers Stadium and Convention Center Study Appendix A - Page 4
to update aging facilities, add new technology features and services and add space to attract larger events. The following table shows a comparison of past and current technology trends.
Table A-2 Convention Facilities Technology Status
Ten-Year ComparisonType Ten Years Ago Today
FacilityFacility Website 87% 100%Internet Access 77% 100%Wireless Internet 60% 94%Teleconferencing 58% 72%Video Conferencing 50% 66%Social Media Presence 0% 54%Security Access Cards 43% 44%
Online Event PlanningBooking Events 20% 19%Ordering Supplies for Events 18% 31%Booking Accommodations 16% 23%
Source: PricewaterhouseCoopers
Industry investment in technology during the next five years will be necessary to enhance business and individuals' experiences and drive demand for services. Ultimately, technology will need to be used as a tool that enhances business and individuals' experiences to drive demand for services.
The following table shows meeting duration as a percentage of total events.
Table A-3
Duration0.5 day1.0 day1.5 days2.0 days2.5 days3.0 days3.5 days4.0 days4.5 days5.0 days
More than 5 days
Source: Meetings Media, HSP
Typical Meeting Duration
Percent of Total8%14%7%16%14%20%7%5%4%4%2%
Source: Meetings Media, HSP
Typical Meeting Duration

Chargers Stadium and Convention Center Study Appendix A - Page 5
The importance of a quality hotel package increases the longer the duration of meetings and events. Without a good hotel package, these longer meetings and events are very difficult to secure.
The next set of tables presents the trend of important industry metrics such as exhibit hall demand, occupancy, attendance, room nights and critical financial information from surveyed participants by PricewaterhouseCoopers.
Table A-4 U.S. Convention Center Characteristics
Exhibit Hall Events
Average Number Events Average Attendance
SizeAverage Event
CountAverage Total Attendance
Average Number of Room Nights
Conventions / Trade Shows
Consumer Shows Total
Conventions / Trade Shows
Consumer Shows
Less than 100,000 square feet 322 218,300 34,200 27 22 49 1,600 3,300100,000 to 500,000 square feet 370 627,000 182,000 45 24 69 3,600 9,500More than 500,000 square feet 219 1,119,200 927,500 54 24 78 9,100 17,500
Source: PricewaterhouseCoopers
Convention Center All Events
As shown, the 2013 annual attendance of consumer shows is greater at smaller convention centers with less than 100,000 square feet of exhibit space than that of convention or trade shows. The number of annual exhibit event attendance is nearly split evenly between the two types of events for mid-sized convention centers. Larger convention centers, with more than 500,000 square feet of exhibit space, are opposite of their smaller counterparts, with convention and trade show attendance accounting for the largest portion of the annual exhibit event attendance. In general, convention centers should generate from .25 to .75 room nights per square foot of exhibit space. The average for larger convention centers is about .50 to .60 room nights per square foot of exhibit space.
The following table shows annual exhibit hall occupancy broken down by conventions / trade shows, consumer shows and other events.

Chargers Stadium and Convention Center Study Appendix A - Page 6
Figure A-2
19%$27%$
38%$11%$
11%$
8%$13%$
11%$6%$
0%
10%
20%
30%
40%
50%
60%
Less than 100,000 square feet 100,000 to 500,000 square feet More than 500,000 square feet
Annual Exhibit Hall Occupancy
Conventions / Trade Shows Consumer Shows Other Events
Source: PricewaterhouseCoopers
As the amount of exhibit space increases so does its utilization by convention and trade shows. Occupancy was higher in the larger facilities, led by convention and trade show occupancy. Exhibit hall occupancy, which can only practically reach 70 percent due to move in/out days and holidays, ranged from 42 percent in smaller buildings to 51 percent in larger buildings, on average.
The following figure shows the seasonality of conventions.

Chargers Stadium and Convention Center Study Appendix A - Page 7
Figure A-3
0%
2%
4%
6%
8%
10%
12%
14%
16%
18%
20%
January February March April May June July August September October November December
Perc
ent o
f Con
vent
ions
Occ
urin
g
Seasonality of U.S. Conventions
Source: Meetings Market Report

Chargers Stadium and Convention Center Study Appendix A - Page 8
Meeting Planner Preferences
This table shows the factors for host city selections ranked by importance.
Table A-5
Factor1 = Very
Important2 = Moderately
Important3 = Not
Important
Hotel room prices and quality 80% 13% 7%Hotel room availability and capacity 80% 12% 8%Convention center and exhibition hall size and quality 76% 15% 9%
Facilities "under one roof" (i.e. meeting rooms , exhibit halls, hotels in one facility complex or connected) 61% 27% 12%Labor costs and service issues 58% 36% 7%Proximity of HQ hotel(s) to the convention center 54% 28% 19%Destination appeal to attendees 48% 41% 11%
Concentration of our members, clients or industry professionals in the city and region 48% 41% 11%Airport capacity and airfares 48% 37% 15%Total population, demographics 27% 38% 35%Road and highway access 26% 49% 24%Climate / weather 17% 54% 29%Cultural and entertainment amenities 13% 57% 30%
Source: R7M Research & Consulting
Event Site-Selection Trends - Factors for Host City Selection
The quality and availability of hotels and convention facilities are the most important considerations.

Chargers Stadium and Convention Center Study Appendix A - Page 9
The following table shows specific selection factors for selecting a meeting destination.
Table A-6
ConventionAssociation
MeetingCorporate Meeting
Number, Size and Quality of Meeting Rooms 93% 69% 81%
Negotiable Food, Beverage and Room Rates 87% 80% 79%
Cost of Hotel or Meeting Facility 82% 80% 80%
Number, Size and Quality of Sleeping Rooms 79% 54% 72%
Quality of Food Service 70% 63% 70%
Source: Meetings Market Report
Important Factors when Selecting a U.S. Meeting Destination
As shown, this reinforces the importance of the availability of the right spaces and the fees for those spaces as primary factors.
This table highlights changes in event and meeting planner’s events and shows.
Table A-7
Changes in Event & Meeting Planner's Events and Shows
Changes PercentageIncreased Negotiations 72%Requiring more telecom/internet bandwidth and related services 72%Shorter booking windows, they are booking closer to the event dates 68%Requiring higher-quality food and beverage 52%Event attendance is growing 40%Events are getting larger in terms of space requirements 40%Requiring attendance promotion assistance 32%Short Events in terms of total number of days 28%Events attendance is declining 20%Events are getting smaller in terms of space requirements 20%Asking for more Public Relations assistance and outreach to city and regional leaders 16%Shorter event day periods 12%Focusing more on event design and ambiance 12%Longerevent day periods 8%Longer booking windows, they are booking futher from the event dates 8%Other 4%
Source: Red 7 Media Research & Consulting
As shown, event and meeting planners are utilizing their leverage, being in a buyer’s market, to increase negotiations for better deals. Their events and shows are requiring more telecom/internet bandwidth and higher-quality food and beverage.
Chargers Stadium and Convention Center Study Appendix A - Page 10
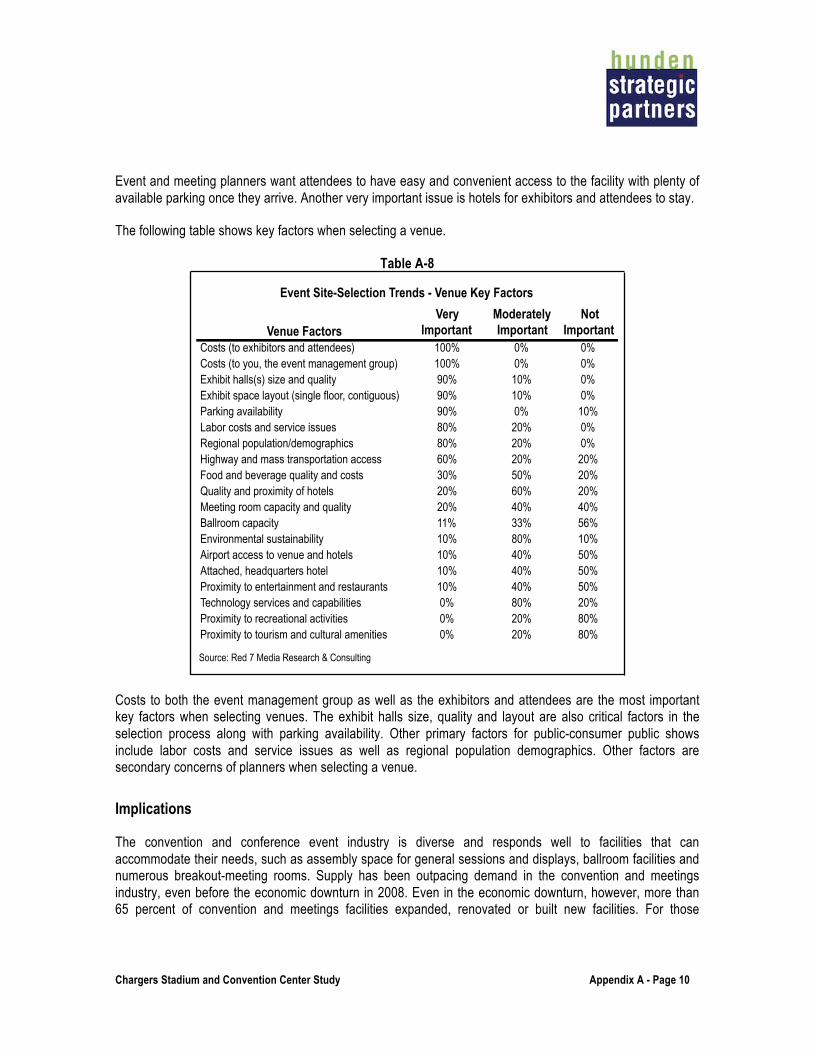
Event and meeting planners want attendees to have easy and convenient access to the facility with plenty of available parking once they arrive. Another very important issue is hotels for exhibitors and attendees to stay.
The following table shows key factors when selecting a venue.
Table A-8
Event Site-Selection Trends - Venue Key Factors
Venue FactorsVery
ImportantModerately Important
Not Important
Costs (to exhibitors and attendees) 100% 0% 0%Costs (to you, the event management group) 100% 0% 0%Exhibit halls(s) size and quality 90% 10% 0%Exhibit space layout (single floor, contiguous) 90% 10% 0%Parking availability 90% 0% 10%Labor costs and service issues 80% 20% 0%Regional population/demographics 80% 20% 0%Highway and mass transportation access 60% 20% 20%Food and beverage quality and costs 30% 50% 20%Quality and proximity of hotels 20% 60% 20%Meeting room capacity and quality 20% 40% 40%Ballroom capacity 11% 33% 56%Environmental sustainability 10% 80% 10%Airport access to venue and hotels 10% 40% 50%Attached, headquarters hotel 10% 40% 50%Proximity to entertainment and restaurants 10% 40% 50%Technology services and capabilities 0% 80% 20%Proximity to recreational activities 0% 20% 80%Proximity to tourism and cultural amenities 0% 20% 80%
Source: Red 7 Media Research & Consulting
Costs to both the event management group as well as the exhibitors and attendees are the most important key factors when selecting venues. The exhibit halls size, quality and layout are also critical factors in the selection process along with parking availability. Other primary factors for public-consumer public shows include labor costs and service issues as well as regional population demographics. Other factors are secondary concerns of planners when selecting a venue.
Implications
The convention and conference event industry is diverse and responds well to facilities that can accommodate their needs, such as assembly space for general sessions and displays, ballroom facilities and numerous breakout-meeting rooms. Supply has been outpacing demand in the convention and meetings industry, even before the economic downturn in 2008. Even in the economic downturn, however, more than 65 percent of convention and meetings facilities expanded, renovated or built new facilities. For those

Chargers Stadium and Convention Center Study Appendix A - Page 11
communities with the right mix of facilities and attractiveness, the return on investment can be quite measurable, in jobs, business activity and tax revenue.
Since 2013, the meetings and convention business has been expanding at a rapid pace, in many cases faster than the growth in corporate or leisure business. However, events are shorter today than in the past and companies often send fewer attendees or booth attendants/salespeople. Overall, the industry today is about the same size as is was in 2000, yet with many more facilities and adjacent hotel packages to choose from.
Important factors in the decision process of choosing a convention or meeting site include availability of nearby hotel rooms, cost of travel, and meeting space in the facility and hotels. The most important types of meeting space now are the number of breakout meeting rooms and ballrooms. Expo and exhibition space are still important, but less so now than in the past. Higher rated business (e.g. corporate, medical, associations that are willing to pay more for better facilities and experiences) needs many breakout rooms and high quality ballrooms to conduct their trainings and other meetings.
Is investment in this industry worth it? For those that construct and manage the right set of facilities within an attractive market, yes. Those that put the right package together (hotels and the right kinds of function space in a walkable environment) will generate new meetings and event business. Enhancing the ‘fun’ side of the community, such as a nearby downtown or entertainment/restaurant district, will provide the community more to sell against its competitors. Ultimately, those cities with a competitive package will generate a constant flow of group and event business that will support a number of hotels, restaurants and jobs.

TABLE OF CONTENTS ----------- Executive Summary
Chapter 1 Demand and Impact
Appendix A Convention Industry Overview and Trends
Appendix B Convention Market Competitive and Comparable Analysis
Appendix C Influence of Comparable Downtown Stadiums
Appendix D Meeting Planner Interviews
Appendix E Hotel Market Analysis
Appendix F Comparable Convention City Hotel Tax Rate Data

Chargers Stadium and Convention Center Study Appendix B – Page 2
CONVENTION MARKET COMPETITIVE AND COMPARABLE ANALYSIS This appendix provides an analysis of existing convention centers and exposition halls that are connected or adjacent to professional football stadiums. While these cities differ in size, function space and hotel offerings, the facilities are similar in their types of spaces, have similarly sized meeting and event facilities and are comparable in that they all utilize professional football stadiums for non-football events. The focus in this chapter is specifically regarding the benefits and challenges of such an arrangement during the NFL season. S
The following table lists the comparable convention centers, cities, and size statistics.
Table B-1 Comparable Stadium & Convention Center Complexes
Facility Location
Combined Metropolitan
Population 2015
Annual Visitors in Millions
Total Function
Space (SF)
Total Exhibit
Space (SF)
Total Ballroom
Space (SF)
Total Meeting Space
Stadium Field Space
Number of Breakout Room
Georgia World Congress Center and Georgia Dome Atlanta 6,365,108 51.0 1,759,818 1,366,000 58,722 233,096 102,000 106Moscone Center North, South and West ** San Francisco 8,713,914 24.6 916,571 538,660 81,119 296,792 -- 87NRG Convention Center and NRG Stadium Houston 6,855,069 17.5 880,765 706,213 0 77,352 97,200 59Indiana Convention Center and Lucas Oil Stadium Indianapolis 2,372,530 26.0 912,551 558,000 57,072 114,479 183,000 87America's Center and Dome at America's Center Saint Louis 2,916,447 23.9 659,741 358,000 27,625 129,116 145,000 98CenturyLink Event Center and CenturyLink Field Seattle 4,602,591 38.1 355,555 255,555 0 0 100,000 0
Proposed San Diego Convention/Stadium San Diego 3,299,521 34.3 385,000 250,000 64,500 70,500 100,000 64
** This facility is not attached to a stadium. Figures represent pre-expansion.Source: Various Event Facilities and CVBs, Hunden Strategic Partners
San Francisco, California
San Francisco is a major cultural, commercial, and financial center on the West Coast of the U.S. The city is well known as both one of the most expensive cities to live in or visit, while also being one of the most popular cities to live in or visit. Approximately 25 million visitors travel to San Francisco annually according to San Francisco Travel, the official tourism agency for the city. The San Francisco Bay area includes San Jose, Oakland, Berkeley, Palo Alto, and the high-tech industry known as Silicon Valley, However, all of the important media is headquartered in San Francisco. The historic and urban core of the entire region is downtown San Francisco. San Francisco is the nation's second most densely populated city (after New York) and is the hub of the nation's fifth largest metropolitan area, with 8,7 million people in 2015.
The Moscone Center only books conventions and conferences, in order to serve its purpose of generating room nights and maximizing revenues for the city’s hotels. Trade and consumer shows go elsewhere in the metro region such as San Mateo. The bulk of the conventions tend to revolve around the medical and technology fields, especially given the site of Silicon Valley only 40 miles southeast of the center. Nearly every convention is a national association convention or large corporate business meeting, which are booked years in advance.

Chargers Stadium and Convention Center Study Appendix B – Page 3
The San Francisco Moscone Center is the city’s major convention center located downtown that has three separate, non-contiguous exhibition halls and three separate buildings, two of which are attached through underground corridors. The North and South Halls are underground, with the Yerba Buena Gardens sitting atop the North Hall at street level. The buildings are on three adjacent blocks in the South of Market neighborhood. The three buildings consist of more than 20 square blocks and has more than 916,000 square feet of function space.
In 2015, the center hosted 44 conventions, which accounted for nearly 1.2 million hotel room nights. Downtown San Francisco has approximately 32,000 hotel rooms in the area and approximately 65,000 rooms in the city.
The following figure shows an aerial view of the Moscone South and North buildings.
Figure B-1
Moscone South was the original facility and opened in 1981. Moscone South's exhibit level is underground and covers one city block. The South Hall has 260,560 square feet of column-free exhibit space that can be separated into three sections (A, B & C). The exhibit halls are attached to the Moscone North's exhibit halls through a 225-foot concourse and can be closed off for separate conventions. The Moscone South complex includes the Gateway Ballroom. Also above ground is the Esplanade Level, which encompasses a 14,000 square-foot lobby, a 42,675 square-foot flexible ballroom and a 2,870 square-foot breakout room.
Moscone North opened in 1992 as an underground expansion of Moscone Center. Moscone North's exhibit level also covers an 11-acre city block. The North Hall features an 181,440 square-foot exhibit hall that can be separated into a large hall (D) and a smaller hall (E). Attendees can flow into the Moscone South exhibit level or be separated in the case of different simultaneous events. However, management always tries to sell

Chargers Stadium and Convention Center Study Appendix B – Page 4
Moscone South and North wings together for single events, rather than splitting them into separate meetings. The lower level also includes breakout meeting rooms. Like the Moscone South facility, the North facility includes a 15,300 square-foot street-level lobby that is column-free and naturally lighted, complete with its own semi-circular drive for multiple shuttle busses. The North and South blocks have entry drives that mirror each other along Howard Street for a convenient single-area entry-point.
Moscone West opened in 2003 and is a three-floor complex on the block just west of the Moscone North site. The street-level plan is an exhibition space with small meeting rooms around the periphery. The second and third floors include a wraparound view of the downtown area with nearly 100,000 square feet of carpeted meeting space that has the ability to be divided into as many as 19 meeting rooms. The second and third floor lobbies have 28,261 square feet of pre-function space. All loading docks are located below street level.
Over the next three years, the Moscone Center is undergoing a $350 million expansion project that will join the two largest currently disconnected exhibit halls into one large underground hall featuring 580,000 contiguous square feet. New ballroom and meeting room space will be built above a portion of both the North and South Moscone blocks, which is where the majority of the construction and expansion are taking place. Howard Street will still run between the two blocks and on top of the new contiguous exhibition hall.
The Moscone Center has found that conventions are growing faster than the facility can keep up, and in numerous cases, are in danger of losing large annual conventions. The potential lost business was the key driver for the expansion to combine the South and North buildings into one contiguous space of 580,000 square feet, with new above-grade buildings featuring more meeting space. Conventions and conferences prefer the above-ground sense of light and security from the street level or below-grade level, which is why the West building is usually the first building to be reserved years in advance. The sales staff can either reserve the entire three-block center for a convention, or separate the buildings. Typically, Moscone South and North are sold together, and after the expansion project, will effectively be one single building.
As long as the path between the two convention spaces is short and easy, two convention centers can certainly work together to host one large event. Two non-contiguous centers are not preferred but are, nevertheless, very doable, as long as the second convention center also has full kitchen and food service capabilities.
Overhead skywalks that can attach two conference or convention buildings are a desirable plan to keep people from feeling isolated from the other part of the convention. Visitors would prefer to walk if there is a direct and safe connection, rather than rely on shuttles between buildings.
Houston, Texas
The Houston metropolitan area in southeast Texas is the fifth largest in the nation and has approximately six million people. Houston has a robust economy heavily based in industrial sectors such as energy, oil, aeronautics and transportation. In addition, the Houston area is a hub for academic and medical research institutions, and in terms of business, only New York City is home to more Fortune 500 companies than Houston. The area has professional sports in every major league except the National Hockey League.
The following figure shows NRG Park and the surrounding area.

Chargers Stadium and Convention Center Study Appendix B – Page 5
Figure B-2
Houston’s NRG Park, which includes the NRG Stadium, NRG Center, NRG Arena and NRG Astrodome, holds the primary facilities that provide the exposition function for the area. NRG Center is the focus of this analysis as it holds the largest exhibition spaces and hosts the majority of exposition-type events as well as conventions.
NRG Center has 11 exhibit hall divisions each with at least 37,500 square feet of space and the largest divisible space being 166,000 square feet. The NRG Arena also has 706,000 square feet of contiguous space to supplement the NRG Center. Having space this large and a 70,000-seat climate-controlled stadium allows for a few annual meetings that cannot be held elsewhere. Those meetings tend to be religious organizations and direct-selling groups that hold annual meetings and congresses.
Sporting events, consumer shows and trade shows contribute a large number of use days to each of the facilities in NRG Park. Sporting events are concentrated between NRG Stadium, Astrodome and Arena and they include professional and high school football, college basketball, cheer competitions and even athletic runs on the park grounds. Consumer shows and trade shows range from multiple car shows and gun and knife shows to health and beauty expos and home and garden shows. Many family shows from Disney, Sesame Street and Lego also fill NRG Park’s schedule. Other local events such as high school graduations reserve the NRG Center to host their ceremony, as well.
NGP Park also hosted the Offshore Technology Conference, which was rated number 19 on the Tradeshow 250 list in 2014. Energy professionals gather to exchange ideas to advance technology and science concerning offshore environmental efforts. This event is held annually in Houston and attracted nearly 75,000 attendees in 2014 and 68,000 in 2015 (down due to the oil and gas industry) and more than 2,500 exhibitors during the four-day event in May 2014. This event uses the entire property.
With the collection of assets NRG Park has to offer, large events are well accommodated. One very high profile event is the Houston Livestock Show and Rodeo. The event contains 20 days of livestock shows, rodeos, concerts and other activities that continually attracts more than two million people each year. Other large events include many sporting events such as NCAA Playoffs, NFL Houston Texans home games, and others. NRG Park also hosts many popular artists in concert each year to keep their schedule full and varied.
The physical layout of NRG Park is like an island complex of large buildings on 350 acres, and the rest of the site is dedicated to parking. The parking lots before, during and after Texans football games are entirely reserved and filled to near capacity with tailgating parties. Even small amounts of asphalt for marshaling, security and staff parking take up enough space that render the other buildings unusable for events.

Chargers Stadium and Convention Center Study Appendix B – Page 6
The manor in which the management at NRG Center keeps its schedule full during the NFL season is that they have an agreement with the Texans and the NFL that guarantees one weekend per month is a “protected” week. During that week, the NFL may not schedule a home game for the Texans, but instead they must have a bye week or play on the road. This ensures that some of the biggest conventions and shows can still go on as scheduled years in advance. Once these “protected” dates are set, and the NFL schedule is released in April, NRG Center and Stadium begin filing the calendar with other shows that can have a more flexible schedule. Some of these are smaller corporate conventions that have some flexibility. The NRG Center finds itself busy with a full schedule of events throughout the year, including during the NFL season. NRG Park is a campus that teams with people and energy consistently, with the only quiet days reserved for event setup and tear-down.
In all, the entire complex hosts approximately 500 events per year. The facilities are completely booked for the first quarter of the year, and during the NFL season, the protected weeks are booked to capacity and the calendar is filled in with short-term and other local annual business.
George R. Brown Convention Center
Houston is a city that features two very large convention and exhibition facilities. Downtown Houston’s George R. Brown Convention Center (GRB) is owned and run by “Houston First”, while NRG Park is owned by Harris County . The Harris County Sports and Convention Corporation (HCSCC) was created with the purpose of managing, operating and maintaining the sports and entertainment complex. The GRB, while hosting mostly conference, conventions and meetings than NRG Park, due to its ballroom and breakout rooms as well as thousands of hotel rooms within walking distance, does still host some consumer shows and sporting events that are similar in caliber. GRB hosts car shows and cheer events, multiple gun and knife shows, and many trade shows for weddings and quinceaneras, snack food wholesalers and retails and a restaurant industry marketplace.
The following figure shows the George R. Brown Convention Center.

Chargers Stadium and Convention Center Study Appendix B – Page 7
Figure B-3
The GRB hosted two events that made the Tradeshow 250 list for 2014, as well. The Ace Spring Convention & Exhibits event for Ace Hardware Corporation took place in February and ranked 63rd on the list. Ace Spring Convention & Exhibits attracted 5,600 attendees and 1,200 exhibitors and employed more than 5,500 personnel. American Public Transportation Association’s Annual Meeting & EXPO also hosted its nearly 10,000 attendees at the GRB in October 2014. This event was ranked 78th on the Tradeshow 250 list for 2014 and is held once every three years. It is the world’s largest public transportation exhibition.
In light of Houston’s local dynamic of having a downtown convention center and a similarly-sized exhibition facility at NRG Center, reasons are apparent for different events to use one or the other. NRG Park has hotels in the area, however, none of them are attached or walkable to the NRG Park facilities.
NRG Park has established itself has a complex for large format events that need expansive column-free space. NRG Park’s lack of ballroom space, breakout meeting rooms and walkable hotel rooms has helped to establish the GRB as the primary convention center. NRG Park. The market dynamic between the two facilities keeps most of the professional association conventions downtown at GRB, while the NRG Park facilities fulfill the other expo hall needs that a large city can generate.
Without NRG Park very large events such as the Offshore Technology Conference would likely not be accommodated in the city if it were not for such a convention center-stadium complex. The multiple convention centers allow for multiple events to take place in the city at once. NRG has various sized buildings for use, and there are some groups that enjoy having an entire facility dedicated exclusively to their event. If a meeting planner for an event wants to feel like “the only game in town”, then a city with separate non-contiguous event halls can be appealing for those groups.

Chargers Stadium and Convention Center Study Appendix B – Page 8
Seattle, Washington
Seattle is the largest city in the Pacific Northwest region of the U.S. and, like San Francisco, is experiencing a rapid urban population growth within the city limits. The greater metropolitan area, which stretches around the Puget Sound from Tacoma in the south to Mount Vernon in the north, near the Canadian border, has more than 4.6 million people, good for 13th largest metro area in the United States. More than 38 million tourists visit King County annually according to the CVB.
The city is home to the Mariners Major League Baseball franchise, who play at Safeco Field, the only retractable roof stadium that is not climate controlled, and the NFL’s Seahawks, who play at CenturyLink Field just south of the downtown skyline.
Seattle's CenturyLink Field Event Center is a 225,000-square foot exposition facility that occupies the block between the 67,000-seat CenturyLink Field and Safeco Field to the south. The Event Center building is connected to the football stadium at ground level, and are both managed by the same entity, known as First and Goal Inc. The stadium is owned by the Washington State Public Stadium Authority. A multi-story parking garage sits along the east side of the facility.
The following figure shows the stadiums complex with the Event Center.
Figure B-4
The Event Center consists of 30,000 square feet of pre-function space on the concourse, a 90,000-square-foot East Hall exhibit floor, and a 165,000-square-foot West Hall exhibit floor. The concourse straddles the two large exhibit halls and overlooks the West Hall. The complex is used for most of Seattle’s largest and most numerous trade and consumer shows including the Boat Show, Home Show, RV show and Auto Show.

Chargers Stadium and Convention Center Study Appendix B – Page 9
The complex is attached to CenturyLink Field, a 69,000-seat outdoor facility with a roof that covers approximately 90 percent of all seats. Events held there are typically NFL games, MLS soccer games, and large music concerts. During the NFL season, the CenturyLink Event Center exposition space is used for Touchdown City, which is the name for the indoor pre-game festivities during home game days. Touchdown City includes live music, food vendors, large TVs showing the early NFL games, and inflatable bounce playscapes for children.
AEG Live and First & Goal formed a partnership to create a new theater within the Event Center space called WaMu Theater. The theater space can be assembled on an as-needed basis within the Event Center building. When not being utilized, the 104-foot wide stage and all seating can be dismantled and stored in the stadium. Depending on the seating configuration, the capacity can range from 3,300 up to 7,000. The event Center opened in November 2006, and the facility averages approximately one concert per month.
The following figure shows the WaMu Theater setup.
Figure B-5
Consumer shows tend to be more flexible on their dates, and all four of the largest consumer shows take place during the NFL season when the Seahawks are traveling for away-games. The following list shows the top eleven consumer shows and their attendance from 2015.
The highlighted events represent shows that took place during the NFL season.

Chargers Stadium and Convention Center Study Appendix B – Page 10
Table B-2
WaMu Theater Top Eleven Consumer ShowsEvent 2015 AttendanceDog Show 5,652Golf & Outdoor Expo 9,033Ski Dazzle 4,254Tast of Washington 3,274Northwest Women's Show 9,361Pacific Marine Expo 8,000Auto Show 29,946Boat Show 52,956Home Show #1 22,411Home Show #2 5,966RV Show 15,856
Source: CenturyLink Field Event Center, HSP
Few hotels are located nearby, which is a key reason for the lack of professional association conventions. There are, however, many restaurants and pubs nearby to the north of the stadium that are popular, mostly with fans at Mariners and Seahawks games.
Washington State Convention Center
The CenturyLink Field Event Center is the city's second-largest space for conventions and trade shows after the Washington State Convention Center (WSCC). The WSCC is located 1.5 miles north of CenturyLink Field on the northern end of the downtown business district. The WSCC currently consists of 61 meeting rooms, four ballrooms, and six exhibit halls. It totals 205,700 square feet of exhibit space, 54,000 square feet of ballroom space and 97,800 square feet of meeting space, which includes a conference center. The area around the WSCC is tremendously dense and tight, which can hamper trucks needed for large shows and events, combined with problems for parking from attendees.
In 2015, a $1.4 billion convention center expansion was announced for the Washington State Convention Center in downtown Seattle, Washington. The project has since increased to $1.6 billion. The proposed non-contiguous convention center development will be adjacent and an approximately six-minute walk to the existing convention center. The project will be funded by bonds, which will be repaid by revenue from hotel taxes. The project is expected to break ground in the second half of 2017 and be complete in 2020.
The following figure shows the proposed location of the WSCC expansion. This is a similar campus situation as is being proposed in San Diego.

Chargers Stadium and Convention Center Study Appendix B – Page 11
Figure B-6
The new center will be constructed in order to accommodate demand that the WSCC is currently turning away or cannot accommodate. The expansion will add roughly 435,000 square feet of functional space and 800 parking spaces to downtown.
The following table summarizes the current and proposed function space.
Table B-2
Washington State Convention Center Function Space SummaryExisting SF Expansion SF Total SF
Exhibit Space 205,700 250,000 455,700
Ballroom Level 54,564 60,000 114,564
Meeting 97,830 125,000 222,830
Total Function Space 358,094 435,000 793,094
Walkable Hotel Rooms (within 0.3 mi) 7,113
Source: STR, WSCC Website, Hunden Strategic Partners
The expansion of the WSCC will bring the total function space to 793,094 square feet. The expansion will add a 250,000-square foot exhibition hall, 60,000 square feet of ballroom space, and 125,000 square feet of

Chargers Stadium and Convention Center Study Appendix B – Page 12
meeting space. Included in the exhibit space is a 100,000-square foot flex hall that will be used for various uses.
The convention center expansion is only one part of the city’s vision. The development plan also outlines a 428-unit, 30-story apartment tower and 16-story office building on the adjacent land parcels. The new mix-use area has already had an impact on hotels in Seattle; nine hotels were completed in 2015 and more are under construction.
The following figure shows a rendering of the multi-level WSCC expansion convention facilities.
Figure B-7
The existing and proposed convention centers are within walking distance from more than 7,000 hotel rooms, and a 16-minute walk from the harbor front and aquarium. Pike Place Market is a 12-minute walk from the convention center and a host to numerous restaurants and retailers. Westlake Center is a five-minute walk away from the convention center and is home to additional dining options. Pacific Place houses countless retailers and is only a three-minute walk away from the convention center.
The downtown area of Seattle supports two non-contiguous expo facilities, and the CenturyLink Event Center appears to work primarily due to the lack of space at the city’s primary convention center, both indoors and in handling traffic outside of the center. This setup allows the traffic-heavy consumer-driven shows to have a home where there are already numerous parking garages, and drives locals to the Pioneer Square part of downtown on non-event days at CenturyLink Field or Safeco Field. CenturyLink Event Center is relatively small for a large city expo hall, and is not a true convention center with meeting rooms or a ballroom, limiting its use during the entire year, not only during the NFL season. However, the popular WaMu Theater temporary theater setup is an exciting and inventive use for the otherwise unusable calendar days at the Event Center. The stadium’s adjoining Event Center has a use that is helpful in bringing more people downtown for events and concerts, although considering how often the event space sits unused, it is not a very efficient use of the low-density space in a high-density city.

Chargers Stadium and Convention Center Study Appendix B – Page 13
Indianapolis, Indiana
Indianapolis is the capital and largest city in Indiana. With a greater metro area of approximately 2.4 million people, ranking it 29th in the United States. The city ranks in the top 25 U.S. cities in visitation with just more than 26 million guests in 2015 according to the CVB.
The first Indiana Convention Center (ICC) building opened in 1972 with a ballroom a few meeting rooms, and a relatively small exhibition hall, and the city began slowly selling itself. The City added to the Convention Center in 1984 in part by including the Hoosier Dome (subsequently RCA Dome). The dome, beyond hosting the NFL Indianapolis Colts, also served as a convention exhibit hall, as it was adjacent to the exhibit halls of the Indiana Convention Center and accessible via an air-lock, much like the setup in St. Louis.
In 2008, a new 66,000-seat retractable-roof Lucas Oil Stadium (LOS) opened, designed for the NFL Colts, NCAA Final Four tournaments as well as for conventions. The new facility contained 2.5 times more floor space in its concourses than the one it replaced and cost nearly one billion dollars. The project was paid for by a hotel and restaurant tax within the county.
LOS and Union Station are both attached to the expanded ICC by a street-level and underground tunnel. The city also nurtured construction of a new 1,000-room headquarter hotel near White River State Park in 2011. Finally, in 2012, the city marked a new benchmark when Indianapolis hosted Super Bowl XLVI and opened the Georgia Street Walkway, a pedestrian street that became the temporary Super Bowl Village. Georgia Street Walkway is a three-block long street that connects the ICC and Bankers Life Fieldhouse, and crosses through the city’s entertainment district, effectively linking pedestrians to all of the major destinations and venues within a few steps. Parking problems are alleviated by the fact that once a car is parked in any downtown spot, a visitor can easily walk anywhere they desire, which is rare for more developed and older cities. Following the Super Bowl, the city received rave reviews by the national sports media. The walkability of the vibrant and energetic downtown, and friendly volunteers, are what impressed sportswriters and tourists the most. This walkability is similar to what is expected to occur in San Diego if the Project is built.
Indianapolis has overachieved in its accomplishments for a city of its size and geography. The city has no interesting topography to speak of, no major bodies of water, no scenic mountain peaks, and is hampered by seasonally extreme Midwestern weather patterns.
Instead, the major reason for the city's success as a convention destination is because of the density and walkability of its downtown attractions in relation to the stadiums, arena, hotels, and the Indiana Convention Center. The overall downtown plan is the major selling point for conventions. While many large city downtown districts have these same types of attractions, convention centers and stadiums, it is rare that they all are connected by a skywalk system and within an easy walk of each other. The combination of the convention center and a climate-controlled stadium as a connected entity increases the probability of securing large convention events.
While only about one dozen events actually use both the stadium and the connected convention facilities, both Lucas Oil Stadium and the Indiana Convention Center facility assist each other in the events that they each attract. A cooperative relationship exists between the ICC, LOS, NFL and the Colts organization.

Chargers Stadium and Convention Center Study Appendix B – Page 14
The Indiana Convention Center complex originally opened in 1972 with three exhibition spaces plus a ballroom and meeting rooms. Subsequent expansions in 1983, 1993, 2000, and 2011 have expanded the site to include nearly six square blocks of the city's downtown, not including the connected Lucas Oil Stadium one block to the south. Today, the Indiana Convention Center contains 1,300,000 square feet of space in total, including 566,000 square feet of column-free exhibit space and nearly 140,000 square feet of meeting space.
The current configuration of the Indiana Convention Center includes 71 meeting rooms, 11 exhibit halls that can be opened into two large contiguous exhibit spaces, three ballrooms totaling 33,335 square feet, including the Sagamore Ballroom. A total of over 7,100 hotel rooms are within easy walking distance of the center, including 4,716 rooms in hotels that are attached to the center from indoor skywalks.
Lucas Oil Stadium is a 66,000-seat retractable-roof stadium that is home to the NFL's Indianapolis Colts, Big Ten championship game, multiple NCAA men's basketball tournaments, high school football championships, marching band championship at the state and national levels, and the annual Drum Corps International Championships. The stadium can also hold soccer matches, as was the case in 2013 when 42,000 people attended a game between Chelsea and Inter Milan. The stadium is connected to the Convention Center via an at-grade enclosed tunnel that dips below street-level to connect to the stadium across South Street. The stadium's total usable space includes 183,000 square-feet (95,000 square feet of which is the stadium floor), 40,000 square feet of exhibit space and twelve meeting rooms underneath the north grandstands.
The following figure shows an aerial view of the Indiana Convention Center and Lucas Oil Stadium, along with Victory Field, a 15,000-seat baseball stadium.

Chargers Stadium and Convention Center Study Appendix B – Page 15
Figure B-8
Large conventions include the FDIC International annual conference expo in April, the National FFA convention (in which it alternates with Louisville) and Gen Con, one of the largest and most prominent gaming conventions in North America, with attendance in 2014 of 56,614.
The ICC hosts hundreds of shows independently of LOS. In LOS, there are 12 days of marching band tournaments that draw 20,000 people to downtown Indy from across the nation. The stadium features 40,000 square-feet of meeting and exhibit space, and another 12 meeting rooms, which are all used for every football game. The stadium management explained in interviews that another 40,000 square feet would be preferable, but for a stadium to have any extra space the way LOS does, is very rare. Those spaces are used for trucks during concerts and Supercross, pre and halftime show prep, press and media, on-site food buffets, cheerleading shows at Christmas, and much more. The ability to park trucks indoors is tremendously valuable.
The fact that the stadium is linked to the convention center gives the sales team an advantage in securing the largest conventions, in addition to the Colts, NCAA basketball Men’s Final Four and Big Ten championship games. Conventions like the Future Farmers of America (FFA), church meetings, and GenCon, among the largest gaming conventions in the Western Hemisphere, each bring in 50,000 to 60,000 people. These mega-events are described as “city-wide events”.

Chargers Stadium and Convention Center Study Appendix B – Page 16
A partial list of the largest event that use both the convention center and stadium are as follows: § JamFest Volleyball in January § Wastewater Treatment Convention in February § Worktruck Show in March § Nike Volleyball Tournament in March § FDIC meetings in May § USA Volleyball in June § GenCon in July § Drum Corps Int’l Championships in August § Future Farmers of America in October § Percussive Arts Society in December
Other stadium uses include a very successful stadium tours program and the Quarterbacks room is rented out about 50 times annually for meetings. In all, the stadium is in use up to 150 days of the year, of which 30 days use the stadium floor including football games.
LOS has an agreement to the NFL similar to the agreements in Houston and St. Louis, in that they can request up to four reserved weekends in which the NFL cannot schedule a home Colts game, as long as those weeks are not back-to-back.
The Indianapolis model of a convention center and stadium has worked mostly because of the independence with which both structures can handle their own events, and cooperate when needed. The latest efforts on the part of the city are to expand the number of large destination cities that will fly non-stop to Indianapolis, which at this time numbers 42.
Atlanta, Georgia
Atlanta, Georgia is the largest metropolitan area in the United States’ South region, with 6.4 million people in its rapidly growing greater metropolitan area. Its business, leisure and convention offerings attracted 51 million visitors in 2015. The city is the economic and cultural hub of Georgia and much of the region between the Appalachian Mountains and northern Florida, including portions of Alabama, South Carolina, and eastern Tennessee.
The city began its ascendancy to major-league status in the 1960s when the Milwaukee Braves moved to Atlanta. National cable upstart stations in the form of CNN, TBS, TNT and The Weather Channel made Atlanta a media hub beginning in the late 1970s and early 1980s. Soaring population growth since that time as a "Sun-Belt City" has continued through today, and is home to big-league professional sports teams including Major League Baseball's Atlanta Braves, the National Basketball Association Atlanta Hawks, the NFL Atlanta Falcons and the Atlanta United FC MLS soccer club, of which the latter two franchises call the 1992 Georgia Dome home, and are set to begin playing at a new $1.4 billion 71,000-seat stadium called

Chargers Stadium and Convention Center Study Appendix B – Page 17
Mercedes-Benz Stadium. The new stadium, designed by Populous, is a retractable-roof multipurpose stadium that is under construction immediately south of the current Georgia Dome site and is scheduled to open in 2017. The unique design of the roof resembles a pinwheel, which allows sunlight to enter into the stadium above the field only, keeping the seating under the cover of the permanent roof. This design will allow for indoor events such as NCAA basketball games and conventions, while the open roof can allow for sunlit football and soccer experiences.
The Georgia Dome stadium often coordinates efforts with the Georgia World Congress Center (GWCC), the nation's third-largest convention facility, in hosting large conventions. The campus also includes the CNN Center and Phillips Arena, home of the Atlanta Hawks NBA team, and a 21-acre Centennial Olympic Park, created for the 1996 Summer Olympic Games. The entire multiple-square-block complex of stadiums, parks, plazas, and convention center are located just west of the city's downtown core within walking distance of downtown Atlanta hotels that total 10,000 rooms.
The following figure shows an aerial view of the GWCC. The new stadium can be seen under construction.
Figure B-9
The GWCC encompasses 3.9 million square feet, including 12 exhibit halls, 105 meeting rooms, and two ballrooms. Also included is the Sidney Marcus auditorium that can seat 1,740. The complex is made up of three buildings set side by side, called Buildings A, B and C. The first building, Building A, was opened in 1976 as the first state-owned convention hall in the U.S. The center is operated by the Georgia World Congress Center Authority, which later developed the 21-acre Centennial Olympic Park and Georgia Dome.
The first phase, Building A, opened with 320,000 square feet of exhibit space. Additional phases were built in 1985, 1992, and 2002. The total exhibit space includes 1.4 million square feet and can accommodate many

Chargers Stadium and Convention Center Study Appendix B – Page 18
simultaneous conventions or one single large convention. The largest ballroom features 33,000 square feet. By itself, the center welcomes over one million visitors annually. Although it counts as one complex and one connected building, there are actually three landscaped plazas and grand entry concourses, so that the center can host one enormous convention or three very large conventions simultaneously, while still offering each convention their own building.
In Atlanta, the key to making a singular location work for multiple large crowds is to be close enough to ample parking opportunities, transit, and yet allow enough space between the various venues, so that each event has the required room and distance to carry off their event. The GWCC often has three, four, or more events simultaneously occurring, not to mention meetings in various large downtown ballrooms and meeting halls. Atlanta is a world leader in hosting conferences, meetings and large conventions.
St. Louis, Missouri
The greater metropolitan area of Saint Louis has a population of 2.9 million people, ranking it 21st in the nation. The iconic 630-foot tall Gateway Arch is the city's trademark, and remains the most significant and famous attraction for the nearly 24 million annual visitors to the metro area. The city is also known as possibly the most sophisticated baseball city nationwide as the city's Cardinals are often ranked atop the standings. From the late 1800s to 1955, the Cardinals were the western and southernmost Major League Baseball team, and as a result, the Cardinals enjoy a fan base that reaches throughout the United States Western and Southern regions. In 1904, the city also hosted the World's Fair in Forest Park, a crowning achievement in the city's past.
Throughout the 1970s, the urban area of the city suffered from urban decay more than most other cities, as poor southerners migrated north to find factory jobs and inhabited a very old housing supply dating from the 1800s and early 1900s. Racial divides and middle-class movement to the suburbs in St. Louis County left the city in desperate need of revitalization. Subsequent downtown renewal efforts, mostly beginning in the 1960s, resulted in many new central city developments including; two new stadiums for the Cardinals baseball team (1966 and 2006), the aforementioned Gateway Arch (1965), the Cervantes Convention Center Convention center (1977), the conversion of the one-time largest and busiest Union Station train depot into a festival marketplace (1985), a downtown shopping mall called St. Louis Centre (1986), the 19,000 seat Scottrade Center arena (1994), and the 67,000-seat Edward Jones Dome (1995). The city's effort was rewarded when the Los Angeles Rams relocated to St. Louis in 1995.
The Edward Jones Dome, formerly the Trans World Dome named after TWA airlines, was built adjacent to the Cervantes Convention Center and given the new name of America's Center and Edward Jones Dome at America's Center. For twenty years, the NFL's Rams had a home in Saint Louis and included two Super Bowl appearances and one Super Bowl victory. Once the Rams made the decision to move to Los Angeles in early 2016, Edward Jones exercised its right to terminate its naming-rights sponsorship.
The following figure shows an aerial view of America’s Center and the Dome at America’s Center.

Chargers Stadium and Convention Center Study Appendix B – Page 19
Figure B-10
The America's Center has 7,200 hotel rooms and over 100 restaurants within its walking distance, and contains over 1.2 million square feet of total space. That total includes 358,000 square feet of exhibit space in five exhibition halls, a 28,000 square foot ballroom, a 1,400-seat Ferrara Theatre, and 88 meeting rooms in addition to the Dome. Another 70 meeting rooms and ballroom are located nearby in the numerous hotels. The largest headquarter hotels are the 917-room Marriott St. Louis Grand Hotel and the 910-room Hyatt Regency at the Arch.
During the tenure of the Rams in St. Louis, the center had an average of 15 events large enough to utilize both the dome and exhibit halls. St. Louis’s America’s Center was under the same agreement that Houston is under, in which convention planners can reserve one weekend per month during the NFL season for large conventions, which can be slated as far out as five years. Having the dome in place as part of the main convention hall allowed the center to attract more and larger events with larger general sessions.
Although St. Louis modeled its domed stadium and convention center combination after Indianapolis, there are a few differences that combined to relegate its accomplishments to experience lower success rates than Indianapolis. Part of the problem is that St. Louis is an old factory city that had a strong labor union, which pushed exhibit and convention prices higher for the same size of events. Indiana is a right to work state, which allows for less expensive rates and fewer work rules for the same types of events. Another issue is that St. Louis has a strong summertime tourism season to begin with, partially because of the presence of a Six Flags theme park and the St. Louis Cardinals baseball team, both of which are nearly daily events from which the community gains a strong identity. The city relies less on its convention industry for its metro-wide tourism influx and transient hotel room-nights than Indianapolis, which has neither a theme park nor a major league baseball franchise. Similar situations are found in other mid-sized cities such as Cincinnati, Kansas City,

Chargers Stadium and Convention Center Study Appendix B – Page 20
Minneapolis, and Tampa-St. Petersburg. All of these cities have baseball, theme parks, and only modestly-sized convention centers, which are generally land-locked in terms of expansion possibilities. Transient hotel rates are higher than group-rates. Because these cities have higher numbers of corporate and leisure visitors occupying their hotel blocks, the downtown hotels are less enthusiastic about reserving significant hotel blocks for large conventions.
The facility was able to operate both NFL games and conduct most of its convention business without great issue.
Implications
Two convention facilities can work separately and together as long as both have first-rate services and food kitchens. A safe, walkable link between the two is preferable, as well as having a headquarter hotel, also linked.
Having an NFL team representing a city with a stadium shown on television in multiple annual nationwide telecasts with high ratings is a positively-branded commercial for that city. All viewers are reminded that the city is in the big-leagues of American cities. Certain assumptions about the cosmopolitan flair of a big-league city go along with the label of being a “Big League” city. The NFL television and radio coverage provides a national identity and a constant reminder in the average U.S. household that all of the city’s cultural centers, museums, zoos, and historic districts combined cannot achieve. Only the Walt Disney theme parks and Las Vegas lineup of casinos and attractions can match the near-universal appeal. Cities like Indianapolis, Cincinnati, Jacksonville and Pittsburgh would have a much shallower chance at achieving national attention if not for their NFL teams, not to mention Green Bay. Even cities with Major League Baseball teams struggle to move the needle the same way at a national scale, as they cannot access the kind of metropolitan name-recognition during the 162-game baseball season that the NFL provides in a 17-week season. And that is because all of the other major league sports have largely become regionalized, while the NFL teams are all followed closely each week by the average fan, nationwide.
The NFL matters to a nation of people, not just sports fans, unlike any other subject outside of Washington politics. A stadium with meeting rooms and exhibit space adds ease and value to the building, especially during significantly larger sporting events such as the Super Bowl or college bowl games.

TABLE OF CONTENTS ----------- Executive Summary
Chapter 1 Demand and Impact
Appendix A Convention Industry Overview and Trends
Appendix B Convention Market Competitive and Comparable Analysis
Appendix C Influence of Comparable Downtown Stadiums
Appendix D Meeting Planner Interviews
Appendix E Hotel Market Analysis
Appendix F Comparable Convention City Hotel Tax Rate Data

Chargers Stadium and Convention Center Study Appendix C – Page 2
Influence of Comparable Downtown NFL Stadiums
Detroit Lions and Ford Field
The Detroit Lions played in the Pontiac Silverdome from 1975 through 2001, 30 miles from downtown Detroit. For fans traveling from Flint or any of the northern Detroit suburbs, this arrangement worked well enough. But for Downtown Detroit, it was only another reason for people to stay away from the city. This all changed when the Detroit Lions began play in the $430 million downtown climate-controlled 65,000-seat stadium in August of 2002, and along with next-door’s Comerica Park for the MLB’s Tigers, opened in 2000, sports fans have been coming back downtown in tens of thousands. The stadium's design incorporates a six-story former Hudson’s warehouse, which was constructed in the 1920s.
The stadiums were placed wisely near two freeways and within walking distance of three historic districts. Ford Field has seen some development immediately adjacent to it. In 2005, a five-story, 115,000-square-foot office building that houses the accounting firm PricewaterhouseCoopers, and an adjacent five-story, 1,200-space parking deck, were built for $40 million.
The city’s top destination for nightlife is historic Greektown, filled with two-dozen nightclubs, restaurants, and a casino-hotel, about three blocks south of Ford Field. On the west side, Grand Circus Park historic district is two blocks west of Ford Field and contains more of a mix of new restaurants, along with offices and some small retail boutiques. Both of those historic districts have undergone continued rebirth, and the presence of Ford Field has especially benefitted Grand Circus Park, which a decade ago was nearly devoid of any business. The city is piggybacking on its successes by building the new Arena District, a mixed-use development anchored by the 20,000-seat Little Caesars Arena, the new home of the NHL’s Red Wings, north along Woodward Avenue next to the Fox Theater, which was renovated by the owner of Little Caesar’s Pizza chain and whose corporate headquarters are in the same building. Quicken Loans also moved its headquarters and 4,000 of its suburban employees into a renovated building in Grand Circus Park.
So while the 1970s saw the city renovate and repurpose its riverfront area by building office buildings, a convention center, and parks or plazas, the core of the city’s downtown still suffered. Going to a sporting event in downtown becomes more of an event if patrons can make a day of the experience. Rather than getting in the car and driving home after a game, a downtown stadium experience enhances all of downtown because ticket holders, and even non-ticket holders have many choices of things to do, eat, and places to go. A football game feels more like a community event when the entire downtown can join in on the festival-like atmosphere. Downtown Detroit has witnessed a continuing revival that is unparalleled to this day in the city, and there are many examples that show it came largely as a result of relocating the Lions back downtown, especially in the cold winter months, while the Tigers brought people into downtown during the summer.
As is key in San Diego and Indianapolis, a downtown that is easily walkable from one venue, hotel or attraction to another is an undeniably important, and Detroit is literally putting the pieces together. Ford Field and Comerica Park are demand generators carefully placed in a former quiet warehouse backwater that have connected formerly separated and disparate commercial districts.

Chargers Stadium and Convention Center Study Appendix C – Page 3
The following is an aerial view of the downtown, showing how the stadiums are amassed closely around other attractions. Note: all of the maps are scaled consistent with each other for the purpose of comparing distances.
Figure C-1

Chargers Stadium and Convention Center Study Appendix C – Page 4
Indianapolis Colts and RCA Dome/Lucas Oil Stadium
The NFL’s Baltimore Colts came to Indianapolis in the winter of 1983, when the city built an NFL-caliber stadium without a team to play in it. Indianapolis was one of the first cities to realize that people actually want to be in a downtown if it is hassle-free and safe. This was at a time when most companies were still fleeing downtowns for new suburban campuses, closer to the homes of the executives, and stadiums were being build along suburban freeways. The new Indiana Convention Center and its expansion with the 62,000-seat “Hoosier Dome” was the catalyst in the continued evolution of Indianapolis from an under-achieving city and metropolitan area into one of the nation’s top convention and sports cities.
In the case of Indianapolis, the city had purchased nearly worthless, brownfield land just two blocks southeast of the city’s financial and retail districts. When the convention center began truly to expand, it found itself in the heart of the urban core. However, the convention center did not simply expand without gaining large volumes of business. The historic Union Station, only one block from the new Hoosier Dome, was opened as a festival marketplace in 1986, two years after the first Colts season in Indianapolis. The programming of events at the dome and convention center, plus the large playground of shops and restaurants first gave residents of the city something to visit and do while in the center city. Almost overnight, the Wholesale District converted empty storefronts into nightclubs, many of which still thrive thirty years later.
In 1995, the two-block long, and 18-year planned downtown mall, finally opened, connecting the city’s financial district with the hotels and historic brick Wholesale District. The 80-store mall on two floors contained Nordstrom and another regional department store. As part of the mall’s presence, many national chains of upscale restaurants opened along the street-level exterior of the mall, and pushed the city’s atmosphere to a new level. In 1997, the NBA’s Pacers also decided to build their new arena in the Wholesale district, only three blocks from the Convention Center’s front doors. Conseco Fieldhouse opened in 1999 and is still regarded as one of the best arenas in the nation. In 1996, Victory Field, a popular and classicly-designed 15,000-seat baseball ballpark opened for the AAA Indians next to the convention center and new White River State Park, an urban green space with museums, the headquarters of the NCAA, a zoo, and other attractions.
The Colts, behind Peyton Manning, began a long streak of winning seasons, and a new larger stadium was needed to satisfy financial demands of the team. The old Hoosier Dome (later, RCA Dome) had the smallest capacity in the NFL. The city achieved a new level of national attention when Lucas Oil Stadium opened in 2008, seating 66,000 people in a retractable-roofed stadium that could host the NCAA final Four, Big Ten football championships, conventions, concerts, marching band competitions, and many other events. The stadium was placed only one block south of the former RCA Dome, connected by underground tunnel so it could be used for conventions and other “campus” events. The RCA Dome was dismantled and the extra room allowed the city’s convention center to expand once again.
The street that connects Conseco Fieldhouse and the Indiana Convention Center was developed as a pedestrian-friendly street when it opened as part of Super Bowl Village in 2012. Nearly every sector of downtown Indianapolis has been experiencing growth since the Hoosier Dome first opened for the 1984 season. A close-knit (and often connected) series of physical developments that are a healthy mix of uses, from office to retail and entertainment, to residential, makes downtown Indianapolis one of the most dynamic city centers in which to live or visit, and the sporting facilities are at the backbone of the health and growth of downtown.

Chargers Stadium and Convention Center Study Appendix C – Page 5
Once the populace of Indianapolis saw there was a reason to come downtown, they collectively enjoyed it and began seeking more reasons and demanding more developments in which to stroll, shop, dance, live, or just linger. Other projects followed such as a new downtown Zoo, Botanical Garden, bicycle and recreation trail loop called the Cultural Trail, an expanded Central Library, more historic districts recognized, a 1.5-mile landscaped canal walk, and thousands of residential units have been built. Growth seems to have been natural since that time, but has come as the result of civic leadership that realized that downtown’s success drives the city’s success.
The lesson learned from Indianapolis in particular is that a walkable city, where the attractions, hotels, and venues are all within a quick few blocks’ walk, or even just across the street, or are connected by skyways, adds greatly to the perception of freedom and enjoyment while a visitor in the urban core. Connectivity is the key to this success, and Indianapolis’ downtown has strung together their notable places, entertainment, and districts together in such as way that allows guests to not have to need an automobile. NCAA and NFL coaches, press, employees, and fans regularly state that the setting and layout of the buildings is perfectly suited for large sporting events like no other city in the United States. However, some cities are moving in this direction, and downtown San Diego could be one of a handful of cities that can host the NFL, NCAA Final Four (if an enclosable roof is in place), the Super Bowl and College Bowl Games, along with Atlanta, Houston, San Antonio, North Texas, Detroit, Minneapolis, Indianapolis, New Orleans, and St. Louis.
The following is an aerial view of the downtown, showing how the stadiums are amassed closely around other attractions.

Chargers Stadium and Convention Center Study Appendix C – Page 6
Figure C-2

Chargers Stadium and Convention Center Study Appendix C – Page 7
Charlotte Panthers and Bank of America Stadium
The NFL granted a football team to Carolina, based in Charlotte, to begin play in the fall of 1996. The city’s growth has come later than most large cities, but is outpacing nearly every other large city. The Uptown district (Charlotte’s ”downtown”) was beginning its growth spurt in the late 1980s and the majority of the growth has occurred since 75,000-seat Bank of America Stadium opened in the same year. Uptown Charlotte has seen unprecedented construction of skyscrapers and ancillary categories such as residential, retail, entertainment, hotels and sports venues in the 2000s and it continues. Today, the city’s skyscrapers contain 113,800 workers in the CBD, up from 70,000 in 1990, and 26,000 people now live downtown, double the number from a decade ago.
Uptown Charlotte is home to seven Fortune 500 companies. Certainly not all development subsequent to Bank of America Stadium’s opening is as a direct consequence of building the NFL stadium in Uptown. However, the city’s choice to build subsequent arenas and stadiums in the same district has been purposeful. After a fateful decision in the 1980s to build their first pro-team arena (Charlotte Coliseum, home of the NBA Hornets expansion team) in the suburbs near the airport failed to lead to continued large crowds or any significant adjacent development, the old coliseum, once the largest in the NBA with 23,500 seats, was demolished. The city lost its team once-popular team to New Orleans. The city was granted another expansion franchise with Michael Jordan as a part-owner, and the second time around, the city built the Time Warner Cable Arena, home of the new Charlotte Hornets franchise, in Uptown with a station on the city’s light rail line, and within walking distance of all of the new developments in the urban core.
In 2015, the 10,200-seat BB&T Ballpark, the new home of the AAA Minor-league Charlotte Knights baseball team, were both built right in the thick of district’s building to take advantage of the area’s 214 restaurants and 50 nightspots. That ballpark was voted best new stadium in Minor League Baseball, due to its location downtown, and its outfield backdrop of high-rises. The district is deliberately being developed as a dense core to the city because the proximity and shared energy of the various mix of venues, attractions and buildings. The city has historically been a small provincial Southern city without a true urban core suited for a large city, so one has had to be invented, and each block is carefully planned to be part of the grand mosaic of a great working urban fabric. If the stadium had been built in the suburbs, it would have been a lost opportunity for Uptown. Charlotte’s urban core has become a city where the whole is greater than the sum of its parts.
The following is an aerial view of the downtown, showing how the stadiums are amassed closely around other attractions.

Chargers Stadium and Convention Center Study Appendix C – Page 8
Figure C-3

Chargers Stadium and Convention Center Study Appendix C – Page 9
Pittsburgh Steelers and Heinz Field
Although the Steelers did not move more than a block away from the old Three Rivers Stadium, a 1970 “cookie-cutter” multi-use stadium that housed both the NFL Steelers and Pirates of Major League Baseball, the multi-faceted planning and construction of the North Shore of Pittsburgh redirected that city’s downtown growth.
Pittsburgh had essentially the same multi-use stadium along their north shore of the Monongahela River as Philadelphia, St. Louis, Cincinnati, Atlanta, and Seattle’s Kingdome, all designed between 1962 and 1969. The New York Mets and Jets, and Oakland A’s and Raiders had essentially the same stadium design as well, and the 1982 Metrodome in Minneapolis was also very similar, but with a fabric inflated dome. San Diego’s Qualcomm Stadium is a variation on this theme, also having been opened in 1967 during the same design period as the others.
Three Rivers Stadium in Pittsburgh was demolished in 2000 as two new sport-specific stadiums were rising simultaneously along the North Shore of downtown Pittsburgh. Both stadium designs are far superior to the former stadium, featuring open ends of the stands to reveal views of the skyline, both with their own parking lots and structures, and having two stadiums separated by a few blocks allows for a “bookend” factor that invited other mixed-use developments on the land in between the stadiums and on either side. What the city realized and capitalized on was a new opportunity, and opened up the riverfront for new development to take advantage of the crowds from the games. The city also aimed to create an extension of downtown by making the area a nearly 24/7 type of environment, with workers, tourists, fans, bikers and runners, diners, and visitors all having something to do.
The result was a myriad of attractions and new places such as modern loft-styled residences and office with fist-floor dining options strung along the river’s northern shore. There is also a multi-level recreational trail, a large water feature called Water Steps, an indoor-outdoor concert venue for both small and large-scale music concerts at Stage AE, the Carnegie Science Center, and a casino. Three yellow suspension bridges allow pedestrians and bikers to easily walk to and from downtown’s Golden Triangle, and the subway also connects each of the area’s attractions. The view from PNC Park and the stadium itself, home of the MLB Pirates, makes it considered either the most or second-most beautiful ballpark in the MLB. A primary reason is its placement on the River within yards of a spectacular backdrop of city skyscrapers.
The following is an aerial view of the downtown, showing how the stadiums are amassed closely around other attractions. A map of San Diego follows, again for the purpose of comparing spatial arrangements in the city cores.

Chargers Stadium and Convention Center Study Appendix C – Page 10
Figure C-4
Every time the Steelers or Pirates are on national television, the scenes of sports highlights include scenes of the city and its beauty. No amount of money could buy that kind of positive publicity. So while football did not leave and come back to Pittsburgh, a pair of new stadiums gave the city an opportunity to expand their urban offerings. San Diego is, in effect, in the same situation, where the expansion of East Village and the Gas Lamp
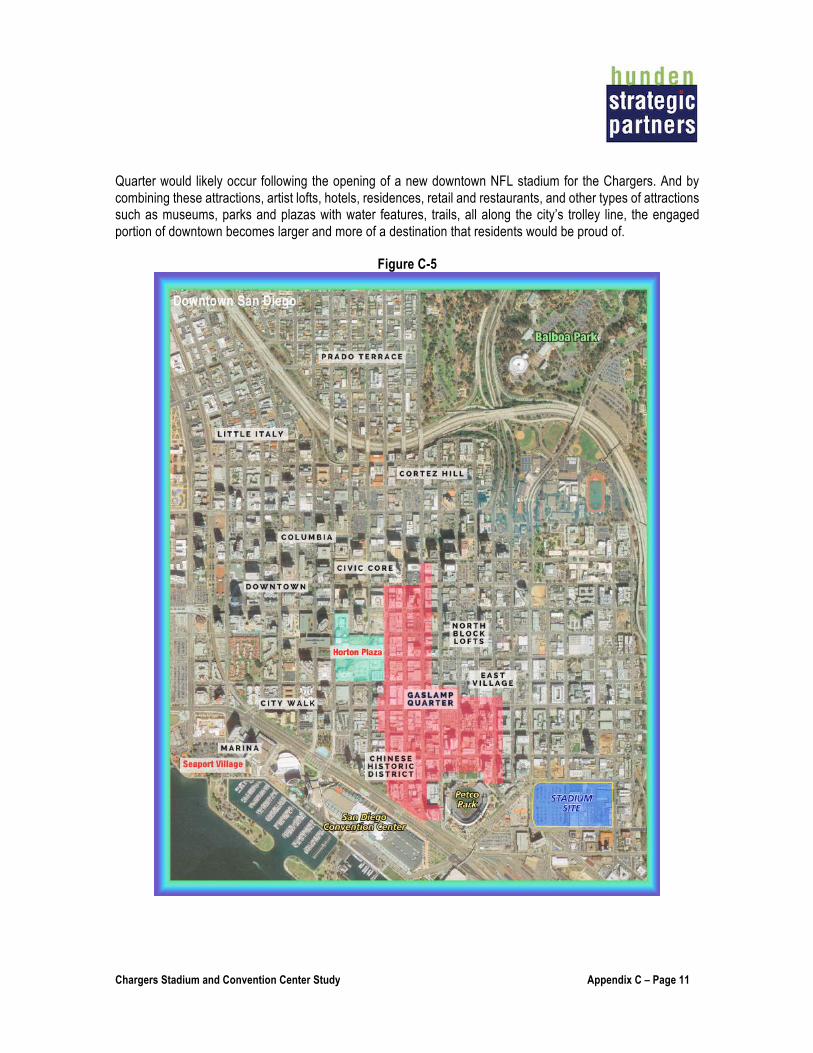
Chargers Stadium and Convention Center Study Appendix C – Page 11
Quarter would likely occur following the opening of a new downtown NFL stadium for the Chargers. And by combining these attractions, artist lofts, hotels, residences, retail and restaurants, and other types of attractions such as museums, parks and plazas with water features, trails, all along the city’s trolley line, the engaged portion of downtown becomes larger and more of a destination that residents would be proud of.
Figure C-5

Chargers Stadium and Convention Center Study Appendix C – Page 12
As shown by the map below, San Diego is in a position to bring up to 70,000 people downtown for home games in the autumn and winter months, not to mention the 100+ other events expected to occur onsite throughout the year that would bring thousands of additional new visitors to San Diego.

TABLE OF CONTENTS ----------- Executive Summary
Chapter 1 Demand and Impact
Appendix A Convention Industry Overview and Trends
Appendix B Convention Market Competitive and Comparable Analysis
Appendix C Influence of Comparable Downtown Stadiums
Appendix D Meeting Planner Interviews
Appendix E Hotel Market Analysis
Appendix F Comparable Convention City Hotel Tax Rate Data

Chargers Stadium and Convention Center Study Appendix D - Page 2
MEETING PLANNER & FACILITY INTERVIEW FINDINGS
Overview
HSP’s focus was to discuss the proposed Project with groups that would physically fit within the building, had a preference or history meeting in West Coast cities, had not met in San Diego in the past 20 years, and typically meet during the NFL season.
Based on historical event data, HSP identified organizations that have hosted events on the West Coast within the last 20 years and would fit within the space proposed in the new San Diego facility. HSP interviewed groups that have historically held events during the NFL season to accurately understand the needs and scheduling flexibility of these events.
The meeting planners and events were culled from a list of 40,000 shows that would consider, or had held, events on the West Coast in the past. HSP then reduced the list as follows:
§ Duplicate events were removed, § Events held in San Diego previously were removed, § Exhibition space needed was set to include 100,000 – 250,000 square feet, and § Those meeting outside of the NFL season were removed (August 31 – January 31), leaving
approximately 40 percent of the remaining events.
A list of 130 event planners resulted. HSP has called all groups at least once and has had approximately 20 full interviews to date.
The takeaways from those conversations are summarized in the following section.
Event Needs
HSP interviewed event organizers about their events needs as it relates to exhibit hall, ballroom and meeting space requirements. In addition, HSP inquired about any additional event needs that are required or recommended in convention centers, with general comments. The following are takeaways from those conversations:
§ Column-free exhibit space is desired, but is relatively rare in the marketplace. Some associations have aircraft and equipment that desires column-free space. Having the opportunity to present major pieces of equipment on a stadium floor, which is column-free and includes taller ceilings than a traditional convention exhibit hall has some appeal.
§ Flexibility in spaces is key with today’s planners. There is a much greater emphasis from meeting planners on larger and flexible ballrooms and many more breakout meeting rooms. While exhibit space is still needed, the focus of the industry and meeting planners is for a balanced facility. Convention centers across the US have not been adding exhibit space as much as they have been right-sizing their facilities with larger and more flexible ballrooms and
Chargers Stadium and Convention Center Study Appendix D - Page 3
more banks of meeting rooms. The proposed facility, when described to meeting planners, was well received because of the balance, sizing and flexibility of spaces.
§ Ballrooms are typically needed for general sessions and speakers. Large ballrooms are among two major room types that are the most important to meeting planners today, along with the need for numerous breakout meeting rooms. The proposed ballroom will be among the largest in the western U.S. and would meet the needs of most conventions.
§ Some events that are too large for the facility would consider non-contiguous spaces to host their event if the hotel package is within walking distance. Many organizations stated that with the right planning and accommodations, a non-contiguous center would be acceptable.
§ Breakout room requirements vary greatly depending upon the event. The number of breakout rooms required by planners HSP spoke with ranged from five up to 50. Higher rates groups are those willing and able to spend more for their events and hotels, such as medical, biotech, legal, finance, insurance, real estate and other higher end professions. These groups require more numerous breakouts and the proposed facility would meet the needs of nearly all groups contacted.
Meeting planners stated that their events needed a combination of exhibit space, ballroom space, and breakout rooms. The most prevalent desire regarding space with meeting planners was for large column spans in the exhibit space and ease of flow between different spaces, which the proposed Project includes. Based on interviews with cities like San Francisco that have had to manage these flow issues, larger shows that want to use multiple facilities are acceptable. Seattle is embarking on a similar effort with its second and new convention center component. While such divided facilities may be a challenge in cities without strong destination appeal, they have worked in concert when necessary in stronger destinations like San Francisco. San Diego is perhaps the city with the most destination appeal relative to its available convention space, based on HSP’s interviews. Events are eager to host an event there and are simply looking for space and calendar availability.
Date Flexibility
Due to date restrictions and security measures set by the NFL, the proposed Project will require the sales staff to assess the date patterns for each event. For critical events, the building’s booking staff will be able to block out certain NFL weekends years in advance in order to accommodate long-term booking needs of events and hotels. This is a significant positive factor for the Project and based on interviews with other facilities, works out well for planning the most impactful events long in advance, even though they occur during the NFL season.
HSP interviewed event planners to better understand when they book their events, scheduling restrictions, flexibility on booking and any additional information about booking expectations and needs. The following are implications from the conversations:
§ Groups are booking dates typically three to seven years out for scheduling purposes. Organizations and associations need to coordinate schedule arrangements with attendees, cities, venues and all hotels that will be used for the event.
§ Meeting planners prefer not to commit to a new/proposed facility more than a few years in advance in case the facility is not completed on time. Given the need to develop the proposed

Chargers Stadium and Convention Center Study Appendix D - Page 4
Project quickly to meet the NFL’s expectations of a stadium for the team locally, this completion risk is mitigated relative to alternate convention center proposals that have no hard completion date requirement. Professionally, meeting planners cannot risk booking a venue that may not be complete. Based on HSP’s analysis, the Proposed Project, if approved would be able to be developed and opened much sooner than any other proposal currently being considered.
§ Some organizations and associations have strict scheduling criteria that require all events to take place on the same week of month every year. Others have more date flexibility and will have a two- to three-month range to schedule the event.
§ For some larger events, there is not flexibility for a four- to six-month confirmation window for the following reasons: § Hotel Booking. Having separate contracts with each hotel in the event city and with
fluctuating room-rates each day and week would require the organization to renegotiate every hotel contract. Hotels have penalties for date changes and other room block changes leading up to the date of events.
§ Military, medical, and international attendees have structured schedules. For example, medical associations involve doctors that block-off the event days in their schedules a year in advance.
§ Vacation Time. For some events, attendees need advanced notice for scheduling vacation time. Association and organizations need advanced notice for scheduling of their attendees.
§ Marketing. Marketing materials are created a year in advance and must promote exact dates.
§ Competitive Events – Attendees attend multiple events in the same industry, and those events are scheduled so that they do not overlap.
Conversations with meeting planners indicated that all large events need a minimum of one-year confirmation for exact event dates for a variety of reasons.
For those dates not able to be committed to far in advance, other groupd would previously have had no opportunity to meet in San Diego would have that opportunity. These groups also help fill up hotels and then can establish a beachhead and grow their event in San Diego. Some events are looking to “graduate” from larger meeting hotels to a smaller convention space and may be able to book within a shorter window. The booking team will need to establish a pool of such groups that have shorter booking windows and cue them up as the NFL schedule is released.
City Selection
HSP interviewed meeting planners to also gain an understanding of the event venue decision-making process, and identified the key factors that play into the selection. Takeaways from the interviews are summarized below.
§ The majority of events are held on a geographic rotation-model to appeal to all members’ home locations, destination appeal and for scheduling purposes. Many organizations and associations have a three- to four-year rotation of regions, while others rotate yearly to new cities. A few have

Chargers Stadium and Convention Center Study Appendix D - Page 5
implemented policies that do not allow booking back-to-back in certain areas or regions of the nation.
§ Price, destination appeal, ease of access, airport access and walkable hotel options are key factors in decision-making process. Medical, military and worldwide associations need access to an international airport, which is a major factor in cities and venues they book in.
§ Shuttle rebates are a crucial amenity outside of the convention center space if the city is not walkable.
§ Free Wi-Fi is a must and has been a deal-breaker for events. § Each event has unique individual needs that are considered in the decision-making process
(healthy food, environmentally friendly, etc.). For example, Best Western’s convention representatives will only work with locations that allow them to use an Indian caterer; one-third of their members are Indian.
San Diego, as to be expected, is viewed as an attractive destination to meeting planners and, historically, has been viewed in a positive light. Meeting planners reported good experiences with both the space and the staff at the San Diego Convention Center. Price and space availability have been the two prohibiting factors for groups bringing their events to San Diego. Some meeting planners reported that San Francisco and San Diego must be booked too far in advance for their events. As such, an alternative convention venue would be attractive if dates can be identified that work for both parties.
Hotel
In addition to facility needs, date flexibility, and city selection, HSP also inquired about hotel requirements for meeting planners, regarding quantity, rate, and headquarter hotel options. Takeaways from those discussions are summarized below.
§ A headquarters hotel is preferred but not required for all organizations, if enough hotel rooms are within a walkable distance. Many organizations, associations and convention centers have worked with hotels to provide shuttle services to the event.
§ Preferred range for average daily rate is $150 to $200. § There are benefits to shorter-term booking for hotels, as it allows for greater rate compression
and opportunity. Often, hotels commit to lower than hoped for rates far in the future for conventions (several years out), even while short-term bookers in all segments (groups, corporate and leisure) are willing and able to pay much higher rates in a rising rate environment as has been the case in the past seven years. By not locking in discounted rates years in advance, hotels have the potential to generate higher revenue and profit with shorter-term booking. Rates have risen much faster than the inflation rate for many years and so short-term bookings can be very positive for hotels relative to a locked in long-term rate that was based on 2.5 percent inflation from a negotiation years prior.
§ Corporate meeting business could be very lucrative and additive to the current market mix. Corporate shows are big revenue producers and "extraordinary" in terms of cash generated from F+B, technology, and audio/visual rentals. These shows typically book on a six-month cycle and can include sales meetings and product launches. Booking them, however, requires a lot of

Chargers Stadium and Convention Center Study Appendix D - Page 6
effort: 100 leads typically result in five bookings, but, again, they are profitable and often prestigious.
§ There are industry and trade groups that are willing to accept "either/or" bookings, just to be in a prime location like San Diego. Cultivating this business will require some effort on the part of the building operator/booking team.
§ Events will pay more for destination venues with easy access and walkable rooms. A majority of the event planners indicated that Southern California, specifically San Diego, is a location where the event planner will consider higher prices because of the destination appeal that will help draw attendees. Attendees are more willing to accept higher than preferred costs when the host city has destination appeal. Other destination markets include Honolulu, Orlando and Las Vegas.
Conversations indicated that hotel commitments are one of the key reasons that there is limited flexibility for potential even date uncertainty. Headquarter hotel rooms are a vital event component for meeting planners, and these rooms must be booked and confirmed well in advance of events.
Comparable and Competitive Facilities
HSP conducted an analysis of existing convention centers and exposition halls that provide insights into non-contiguous convention spaces as well as those connected or adjacent to NFL stadiums. While these cities differ in size, function space and hotel offerings, the facilities are similar in their types of spaces, have similarly sized meeting and event facilities and are comparable in that they all utilize NFL stadiums for non-football events.
Below are key points from conversations with those facility representatives and relevant CVBs: Contiguous vs. Non-Contiguous § Conventions are often growing over time, although not always in terms of exhibit space, so
convention centers often need to expand in flexible ways to retain growing events. Many meetings and conventions simply outgrow their space within several years, although this is highly dependent upon the economy, the industry and other factors.
§ Contiguous space is typically preferred to non-contiguous space for very large events, according to interviews. For many groups, it is frustrating to have non-contiguous space, which is why San Francisco's Moscone Center is excavating the space between their two main underground exhibit halls and connecting them as a single large room. However, for groups that can fit into one of the two buildings, they appreciate “owning” the building versus having to share it with another overlapping group.
§ Having two convention centers can alleviate a backlog of meetings and events. Groups will be content as long as they have very nicely appointed, attached spaces and hotel package for their meetings, with enough breakout rooms and a large-enough ballroom.
Sharing or Using an NFL Facility for Conventions § There are events that use both a stadium and convention center and prefer such a setup. These
include religious meetings, direct sales groups, sports-oriented events and others.

Chargers Stadium and Convention Center Study Appendix D - Page 7
§ Having a top-notch stadium adds a “wow” factor to the convention center, and the entire city's downtown. The national visibility achieved by NFL game days on television increases destination appeal that leads some groups to want to locate their meetings at the convention center/stadium. The attached stadium can be another attraction that attracts more meetings and conventions. Stadium tours and meetings for VIPs in the stadium's club levels are an added attraction and activity during off-times. Events occur in the stadium clubs and lounges are typically booked 50 or more times per year.
§ Stadiums as convention facilities can also accommodate events that require major seating capacity as well as those requiring higher ceilings than at a traditional convention center. Examples include other sporting events, marching band competitions, concerts, hook and ladder/fire engine related shows, religious events and other larger format events.
§ A stadium with meeting rooms and exhibit space adds ease and value to the building, especially during significantly larger sporting events such as the Super Bowl or college bowl games.
§ For dates that become available that were not pre-booked and protected under the date commitment, there are a number of events that have flexibility. While the preference is room night generating events and those will be sought out first, there are also impactful events such as auto, boat, RV and other public consumers shows and concerts. For example, to deal with this situation, the CenturyLink Event Center in Seattle has a portable theater seating 3,300 to 7,000 that can be put up or taken down within the exhibit hall. This allows the event center to be used without much set-up or teardown time and can be scheduled within a few months of the show date.
Based on HSP’s interviews, many groups want to be in San Diego, but there are simply no open dates in the existing facility. By opening up a new facility, most groups would have date options that could be accommodated.

TABLE OF CONTENTS ----------- Executive Summary
Chapter 1 Demand and Impact
Appendix A Convention Industry Overview and Trends
Appendix B Convention Market Competitive and Comparable Analysis
Appendix C Influence of Comparable Downtown Stadiums
Appendix D Meeting Planner Interviews
Appendix E Hotel Market Analysis
Appendix F Comparable Convention City Hotel Tax Rate Data

Chargers Stadium and Convention Center Study Appendix E - Page 2
SAN DIEGO HOTEL MARKET ANALYSIS This appendix describes the number of hotel rooms, hotels and hotel tax collected from all San Diego hotels, and then focuses specifically on the 15,000 (approximately one-third) of rooms located downtown near the proposed Project.
The table below shows key statistics for hotels within San Diego’s taxing jurisdiction.
Table E-1
2015 San Diego Hotel Key Statistics
Total Properties 310Total Rooms 44,326 Total Room Revenue $1,871,729,562Revenue per Room $42,226Revenue per Available Room per Day $116Implied Avg. Daily Rate @ 72% Occ. $161
Source: City of San Diego, HSP
San Diego has 310 hotels with more than 44,000 rooms. The total hotel room revenue generated by the hotels in 2015 was $1.87 billion, or $42,226 per room, which translates to $116 per available room per day. Assuming an occupancy rate of 72 percent, the implied average daily rate was $161.
The next table shows the hotel tax collections for San Diego hotels during the past five years.
Table E-2
TOT Received by City of San Diego
Year TOT ReceivedChange from
Prior Year
2011 $143,734,329 --2012 $155,313,170 8.1%2013 $161,405,472 3.9%2014 $176,031,840 9.1%2015 $196,531,604 11.6%
Source: City of San Diego

Chargers Stadium and Convention Center Study Appendix E - Page 3
As shown, the hotel tax collections have increased from $144 million to nearly $200 million between 2011 and 2015. The increase from 2014 to 2015 was nearly 12 percent. Clearly the hotel economy, which is the primary indicator of inbound, overnight tourism, has been increasing mightily during this period.
The following table shows a summary of the downtown San Diego hotels.
Table E-3
Lodging Summary: Downtown San Diego
Chain Scale Rooms % of Total Rooms Hotels Rooms per
HotelAvg. Opening
YearAvg. Age in Years
Luxury 2,057 14% 3 686 Mar-70 46Upper Upscale 6,899 46% 14 493 May-95 21Upscale 2,223 15% 11 202 Dec-02 14Upper Midscale 536 4% 4 134 Jun-90 26Midscale 221 1% 3 74 Nov-59 57Economy / Independent 2,922 20% 26 112 Jun-71 45Total / Average 14,858 100% 61 244 Aug-83 33
Source: Smith Travel Research, Hunden Strategic Partners
There are nearly 15,000 hotel rooms in downtown San Diego amongst 61 properties, an average of 244 rooms per hotel. The market is dominated by Upper Upscale (traditional full-service) hotels, which account for 46 percent of total rooms in the market. The average age of the properties is 33 years, with averages for individual classes ranging from 14 to 57 years.
The following two tables summarizes downtown San Diego by number of rooms. Neither table includes bed and breakfast properties.
The following table shows downtown San Diego hotels with more than 150 rooms.

Chargers Stadium and Convention Center Study Appendix E - Page 4
Table E-4 Downtown San Diego Hotels with more than 150 Rooms
PropertyGrand Hyatt Manchester San Diego
Marriott San Diego Marquis & Marina
Hilton San Diego Bayfront
Wyndham San Diego Bayside
Omni San Diego Hotel
Westin San Diego Gaslamp Quarter
Westin San Diego
Hard Rock Hotel San Diego
Embassy Suites San Diego Bay Downtown
Doubletree San Diego Downtown
Pendry San Diego
Golden West Hotel
Marriott San Diego Gaslamp Quarter
Marriott Coronado Island Resort & Spa
Hilton San Diego Gaslamp Quarter
Luxury Collection The US Grant San Diego
Renaissance San Diego Downtown Hotel
Springhill Suites San Diego Downtown Bayfront
Courtyard San Diego Downtown
Residence Inn San Diego Downtown Gaslamp Quarter
Kimpton Hotel Solamar
Westgate Hotel
Four Points by Sheraton San Diego Downtown
The Sofia Hotel
Kimpton Hotel Palomar San Diego
Hotel Indigo San Diego Gaslamp Quarter
500 West Hotel
Hilton Garden Inn San Diego Downtown Bayside
Porto Vista Hotel
Plaza Hotel
The Declan Suites San Diego
Hampton Inn San Diego Downtown
Homewood Suites San Diego Downtown Bayside
Andaz San Diego
Total
Source: HSP, Smith Travel Research
Downtown San Diego Hotels with more than 150 Rooms
Rooms Chain Scale Opened1,628 Luxury Dec-92
1,360 Upper Upscale Jun-84
1,190 Upper Upscale Dec-08
600 Upper Upscale Jun-68
511 Upper Upscale Apr-04
450 Upper Upscale Sep-87
436 Upper Upscale Mar-91
415 Upper Upscale Nov-07
341 Upper Upscale Aug-88
333 Upscale Mar-90
317 Indep U/C
310 Indep Jun-13
306 Upper Upscale Jun-88
300 Upper Upscale Jun-88
286 Upper Upscale May-00
270 Luxury Jun-10
258 Upper Upscale Dec-02
253 Upscale Feb-16
245 Upscale Oct-99
240 Upscale Nov-09
235 Upper Upscale Apr-05
223 Indep Jun-70
220 Upscale Oct-69
212 Indep Jun-26
211 Upper Upscale Jan-09
210 Upscale Jul-09
208 Indep Jun-05
204 Upscale U/C
191 Indep Jun-85
185 Indep Jun-06
178 Indep Jan-90
177 Upper Midscale May-01
160 Upscale U/C
159 Luxury May-07
12,822

Chargers Stadium and Convention Center Study Appendix E - Page 5
A total of 34 hotels with 12,822 rooms in the downtown San Diego supply more than 150 rooms each. The two largest hotels total nearly 2,988 rooms, or approximately 23 percent of this supply set. Fourteen of the 34 hotels are upper upscale (full-service) properties, accounting for approximately 41 percent of the total set, while the other 20 hotels were classified as Luxury, Independent or Upscale, accounting for approximately 59 percent of this set’s hotels.
In total, there are a total of 61 hotels and 14,858 rooms in the downtown San Diego hotel market. The total downtown hotel market primarily is made up of Independent and Upper Upscale classified properties. Together, these two categories account for 36 of the 61 hotels, or approximately 59%.
Largest San Diego Group Hotels
In order to best understand the hotel market in San Diego that would be influenced most by major events, HSP profiled selected hotels in the local area. HSP chose a set of primary competitive and relevant hotels that impact the market to analyze the performance of the local market. The primary factors considered were location, quality, amenities, size and brand.
The following table shows a summary of the hotels in the downtown San Diego competitive set arranged by number of hotel rooms.

Chargers Stadium and Convention Center Study Appendix E - Page 6
Table E-5
Downtown San Diego Competitve Set Hotels
Property Distance Rooms Chain Scale OpenedGrand Hyatt Manchester San Diego 1 1,628 Luxury Dec-92Marriott San Diego Marquis & Marina 0.9 1,360 Upper Upscale Jun-84Hilton San Diego Bayfront 0.5 1,190 Upper Upscale Dec-08Wyndham San Diego Bayside 1.5 600 Upper Upscale Jun-68Omni San Diego Hotel 0.4 511 Upper Upscale Apr-04Westin San Diego Gaslamp Quarter 0.8 450 Upper Upscale Sep-87Westin San Diego 1.1 436 Upper Upscale Mar-91Hard Rock Hotel San Diego 0.5 415 Upper Upscale Nov-07Embassy Suites San Diego Bay Downtown 1.2 341 Upper Upscale Aug-88Doubletree San Diego Downtown 1.3 333 Upscale Mar-90Marriott San Diego Gaslamp Quarter 0.4 306 Upper Upscale Jun-88Marriott Coronado Island Resort & Spa 1.2 300 Upper Upscale Jun-88Hilton San Diego Gaslamp Quarter 0.6 286 Upper Upscale May-00Luxury Collection The US Grant San Diego 0.8 270 Luxury Jun-10Renaissance San Diego Downtown Hotel 1.2 258 Upper Upscale Dec-02Springhill Suites San Diego Downtown Bayfront 0.5 253 Upscale Feb-16Courtyard San Diego Downtown 0.8 245 Upscale Oct-99Residence Inn San Diego Downtown Gaslamp Quarter 0.5 240 Upscale Nov-09Kimpton Hotel Solamar 0.5 235 Upper Upscale Apr-05Westgate Hotel 0.9 223 Indep Jun-70Four Points by Sheraton San Diego Downtown 1.3 220 Upscale Oct-69Kimpton Hotel Palomar San Diego 0.8 211 Upper Upscale Jan-09Hotel Indigo San Diego Gaslamp Quarter 0.4 210 Upscale Jul-09Porto Vista Hotel 1.5 191 Indep Jun-85The Declan Suites San Diego 0.9 178 Indep Jan-90Hampton Inn San Diego Downtown 1.5 177 Upper Midscale May-01Andaz San Diego 0.6 159 Luxury May-07Total/Average 0.87 11,226 -- Mar-92
Source: STR
The largest hotel is the Grand Hyatt Manchester San Diego (1,628 rooms) followed by the Marriott San Diego Marquis & Marina (1,360 rooms). Typically, hotels with more than 400 rooms are considered to be “group” hotels. There are only eight such properties, with three dominating the list with more than 1,100 rooms each.
The following figure shows a map of the entire downtown San Diego hotel market, including the larger hotels.

Chargers Stadium and Convention Center Study Appendix E - Page 7
Figure E-1
As shown, many of the larger hotels are located near the San Diego Convention Center along the San Diego Bay, while many of the smaller hotels are scattered throughout downtown San Diego.
Performance
HSP used Smith Travel Research data to analyze the 11,000-hotel-room set most influenced by downtown events and tourism, such as conventions and sports.

Chargers Stadium and Convention Center Study Appendix E - Page 8
The following table shows the performance data for the San Diego competitive set of hotels from 2011 through 2015.
Table E-6
YearAnnual
Avg. Available Rooms
Available Room Nights
% Change
Room Nights Sold % Change % Occ. % Change ADR % Change RevPar % Change
2011 11,018 4,021,633 -- 3,057,479 -- 76.0 -- $171.77 -- $130.59 --2012 11,020 4,022,301 0.0% 3,120,179 2.1% 77.6 2.0% $181.32 5.6% $140.65 7.7%2013 11,022 4,023,030 0.0% 3,156,277 1.2% 78.5 1.1% $182.21 0.5% $142.95 1.6%2014 11,024 4,023,766 0.0% 3,260,761 3.3% 81.0 3.3% $190.62 4.6% $154.48 8.1%2015 11,046 4,031,931 0.2% 3,290,896 0.9% 81.6 0.7% $205.62 7.9% $167.83 8.6%
2016 YTD (May) 11,101 1,687,283 0.1% 1,364,639 2.2% 80.9 2.2% $209.06 -0.5% $169.08 1.7%
Historical Supply, Demand, Occupancy, ADR, and RevPar for Competitive Hotels
CAGR* (2011-2015) 0.1% 0.1% -- 1.9% -- 1.8% -- 4.9% -- 7.1% --
*Compound Annual Growth Rate
Sources: Smith Travel Research, Hunden Strategic Partners
Demand for room nights increased every year from 2011 to 2015, while occupancy has increased from its 2011 level of 76 percent to 81.6 percent in 2015. The occupancy rate has increased by nearly six percentage points since 2011 and is now at such a high threshold that more hotels will be developed by the market to accommodate the demand that is not able to be accommodated. As occupancy continues to improve, the market will have more unmet demand, which will help support and validate more hotel rooms being added to the market. Between 2011 and 2015 the average daily rate increased from $172 to $206.
Revenue per available room (RevPAR), which is the product of occupancy and rate, increased to more than $167 in 2015 and is expected to increase in 2016. With occupancy about as high as it can get, given that certain days of week and times of year will always be less occupied (Sunday nights, certain holiday periods), hotels are able to increase rates and still capture the same amount of occupancy.
The following figure shows the room revenue changes by month (year-over-year).

Chargers Stadium and Convention Center Study Appendix E - Page 9
Figure E-2
-35.0%
-25.0%
-15.0%
-5.0%
5.0%
15.0%
25.0%
35.0%
Monthly Year-Over-Year Competitive Set Room Revenue Change
Source: Smith Travel Research, Hunden Strategic Partners
Any data point greater than zero is a positive indicator for the competitive set. As shown, the competitive set’s room revenue growth has been positive nearly every month during the last five years.
The following figure shows the Revenue Per Available Room (RevPAR), which is the product of occupancy and rate.

Chargers Stadium and Convention Center Study Appendix E - Page 10
Figure E-3
$60.00 $70.00 $80.00 $90.00
$100.00 $110.00 $120.00 $130.00 $140.00 $150.00 $160.00 $170.00 $180.00 $190.00 $200.00 $210.00
Jan 10
Apr 1
0 Jul
10
Oct 10
Jan 11
Apr 1
1 Jul
11
Oct 11
Jan 12
Apr 1
2 Jul
12
Oct 12
Jan 13
Apr 1
3 Jul
13
Oct 13
Jan 14
Apr 1
4 Jul
14
Oct 14
Jan 15
Apr 1
5 Jul
15
Oct 15
Jan 16
Apr 1
6
Revenue Per Available Room
Source: STR Source: Smith Travel Research, Hunden Strategic Partners
The black line above shows the 12-month moving average. The figure above shows RevPAR fluctuating seasonally between January of 2010 and April of 2016. As shown, the 12-month moving average has increased through the time period from approximately $120 to $168.
The following figure displays the seasonality of occupancy for 2015.
Figure E-4
55%
60%
65%
70%
75%
80%
85%
90%
95%
Jan Feb Mar Apr May Jun Jul Aug Sep Oct Nov Dec
Seasonality of Occupancy January 2010 - May 2016
Max Average MinSource: Smith Travel Research
In terms of occupancy, June, July and August are the busiest months, averaging more than 80 percent. ComicCon typically occurs in July, which boosts performance to nearly 100 percent during the four to five days of the event. The spring and fall months average between 75 and 85 percent, which is still very strong. January, November and December are the slowest months of the year with approximately 71, 72 and 62 percent occupancy, respectively. However, compared with most markets’ low season performance, the San

Chargers Stadium and Convention Center Study Appendix E - Page 11
Diego market’s low season is still quite strong. The seasonality is similar to most northern markets where occupancy rates are lower in the cold winter months and then increase during the late spring and summer months. The San Diego market peaks during the summer season. However, unlike northern markets, San Diego’s hotel performance shines in February and March, when many vacationers or snowbirds spend time in the area.
The following figure shows the seasonality of rate from 2010 through 2016.
Figure E-5
$140
$150
$160
$170
$180
$190
$200
$210
$220
$230
$240
Jan Feb Mar Apr May Jun Jul Aug Sep Oct Nov Dec
Seasonality of Rate January 2010 - May 2016
Max Average MinSource: Smith Travel Research
As shown, there is not much fluctuation of the average ADR by month throughout the period, save for December. The average ADR fluctuates from approximately $149 to $203. Prices are highest during the summer months (July especially and the busy October convention month) and then drop in January and December. The maximum average daily rate peaks in July at nearly $230. ComicCon typically occurs in July, which boosts rates to extreme levels during the several days of that key event.
The following figure shows the seasonality of RevPAR, which is the product of rate and occupancy, and suggests overall revenue.

Chargers Stadium and Convention Center Study Appendix E - Page 12
Figure E-6
$80
$100
$120
$140
$160
$180
$200
$220
Jan Feb Mar Apr May Jun Jul Aug Sep Oct Nov Dec
Seasonality of RevPAR January 2010 - May 2016
Max Average MinSource: Smith Travel Research
As with the other performance indicators, RevPAR data is consistent with the analysis of the prior graphs. RevPAR is highest during June and July when rate and occupancy are high or at their peaks. October is also a peak time and is often busy with conventions. December shows the weakest performance.
The following figure shows the occupancy by day of the week during the 12 months of 2015.

Chargers Stadium and Convention Center Study Appendix E - Page 13
Figure E-7
50%
55%
60%
65%
70%
75%
80%
85%
90%
95%
100%
SUN MON TUES WED THURS FRI SAT
Occupancy by Day of Week June 2015 - May 2016
Max Average MinSource: Smith Travel Research
Occupancy is strongest on Friday and Saturday, suggesting high leisure weekend visitation, and averages 90 percent on Saturdays, which is an incredibly strong number. Occupancy is lowest on Sunday nights, which is typical for nearly all markets. While many markets show the highest demand during the weekdays due to corporate transient travel, San Diego’s hotel market is more dominated by leisure travelers.
One key item to note is the ability of conventions to fill the typically low Sunday night periods. There are many group events and conventions that will book using a Sunday night as part of the date mix in order to capitalize on the lower rates and occupancies of hotels on that night. The proposed Project would add a convention and event facility that will drive events that would fill these Sunday nights, as has been shown in Chapter 1. HSP expects that will the number of groups that want to come to San Diego, but have not been able to fit into the calendar, the new facility will offer them every Sunday night from February through August, as well as many Sundays during the NFL season. This will help fill those weaker Sunday nights and help the viability of existing and future hotels.
The following figure shows the average daily rate by day of week.

Chargers Stadium and Convention Center Study Appendix E - Page 14
Figure E-8
$140
$160
$180
$200
$220
$240
$260
$280
Sun Mon Tues Wed Thurs Fri Sat
Average Daily Rate by Day of Week June 2015 - May 2016
Max Average MinSource: Smith Travel Research
Rates are highest on Mondays, Tuesdays and Saturdays. While average rates fluctuate by approximately $12, maximum rates for this market are highest on Saturday, around $266 per night.
Unaccommodated Demand
Unaccommodated demand is defined as demand that would have been captured by the market but for a lack of available or quality rooms. This demand is deferred to later dates, accepts lesser-preferred accommodations, moves just outside the competitive set, moves its business to another area, or cancels plans altogether. Therefore, as new properties are added to the market, it is expected that this demand will be accommodated by the new supply, suggesting that when new hotels are added, they do not cannibalize existing market demand, but accommodate previously unaccommodated demand. While it is not possible to accurately predict all unaccommodated demand, a decent figure can be inferred from occupancy data.
The following table shows the occupancy by day of the week per month for the twelve months starting April 2015. Days of the week with occupancy between 75 and 80 percent are shown in yellow, suggesting mild displacement and unaccommodated demand, while orange shows days with 80 to 90 percent occupancy, suggesting very likely displacement. Days in red are for times when occupancy was beyond 90 percent for the set, suggesting near-certain displacement.

Chargers Stadium and Convention Center Study Appendix E - Page 15
Table E-7
Sunday Monday Tuesday Wednesday Thursday Friday Saturday AvgJun - 15 74.7% 79.4% 87.5% 93.6% 86.9% 86.9% 94.5% 86.0%Jul - 15 77.1% 78.3% 83.3% 85.2% 86.3% 96.0% 97.3% 86.5%Aug - 15 76.6% 85.7% 89.6% 82.7% 81.2% 92.1% 98.5% 86.7%Sep - 15 78.3% 68.4% 82.6% 87.8% 82.1% 79.0% 93.7% 82.0%Oct - 15 78.6% 84.3% 89.1% 83.5% 81.7% 84.1% 90.9% 84.7%Nov - 15 53.2% 56.6% 62.5% 75.7% 84.2% 91.6% 87.9% 71.9%Dec - 15 59.2% 62.7% 64.1% 66.6% 68.1% 70.4% 80.1% 67.2%Jan - 16 57.9% 75.5% 84.2% 85.4% 82.2% 78.4% 78.0% 76.8%Feb - 16 71.4% 78.4% 88.2% 89.1% 81.5% 77.1% 83.3% 81.2%Mar - 16 74.2% 86.5% 90.5% 88.5% 80.2% 79.2% 90.2% 84.4%Apr - 16 81.1% 95.1% 94.7% 80.9% 69.6% 77.3% 88.0% 83.7%May - 16 77.4% 76.1% 70.9% 68.3% 73.4% 87.8% 96.8% 78.3%Average 71.3% 77.1% 82.0% 82.2% 79.7% 83.4% 89.9%
Sources: Smith Travel Research
Occupancy Percent by Day of Week by Month - April 2015 - March 2016
Each cell is an average of four specific dates. For example, Saturdays in August averaged 98.5 percent occupancy across all 11,000 rooms in the set. As shown, Saturday occupancy stays above 93 percent through the summer months. June, July and August occupancy in the summer consistently remained above 86 percent. During November 2015, occupancy averaged approximately 67 percent per month, the lowest in the year. Weekday occupancy is strongest on Tuesday and Wednesday at more than 82 percent.
The following table shows the ADR by day of the week per month for 2015. The yellow cells represent ADR values from $180 to $190, the orange cells represent values from $190 to $200, and the red cells are all values above $200.

Chargers Stadium and Convention Center Study Appendix E - Page 16
Table E-8
Sunday Monday Tuesday Wednesday Thursday Friday Saturday Avg
Jun - 15 212.65 211.50 215.08 227.78 209.86 195.74 211.11 212.20Jul - 15 210.56 207.69 210.72 224.56 233.55 241.22 266.80 229.82Aug - 15 193.73 197.12 196.86 185.51 179.85 191.09 213.30 195.22Sep - 15 194.96 187.24 200.78 211.16 209.31 191.03 208.15 201.39Oct - 15 232.14 223.52 229.24 217.96 213.30 219.36 224.72 222.58Nov - 15 180.09 172.06 190.99 210.86 215.31 208.68 204.97 199.03Dec - 15 145.61 147.84 159.34 164.64 181.04 157.32 154.71 159.80Jan - 16 179.22 189.51 199.29 198.69 195.95 176.66 178.65 187.96Feb - 16 205.18 217.76 224.35 227.22 211.39 192.35 202.59 212.30Mar - 16 208.38 214.07 219.85 209.80 194.17 182.43 201.46 205.08Apr - 16 229.34 247.17 249.07 226.16 196.84 183.76 202.96 219.37May - 16 229.81 222.95 195.15 186.36 204.08 230.95 255.09 219.86Average 203.87 206.09 208.95 208.58 204.53 199.79 211.62
Sources: Smith Travel Research
ADR by Day of Week by Month - April 2015 - March 2016
The highest average daily rates occur on Saturday’s in July and May, at $266.80 and $255.09, respectively. The market has variance on a monthly basis, from an average of $159.80 in December to an average of $229.82 in July. The days of the week with the lowest ADR are Sunday’s and Friday’s, with an average of $203.87 and $199.79, respectively. Overall, Saturday’s have the highest ADR during the week at $211.62.
The following figure shows the estimate of unaccommodated room nights over the past five years for the competitive set of hotels only.

Chargers Stadium and Convention Center Study Appendix E - Page 17
Figure E-9
-50,000
100,000 150,000 200,000 250,000 300,000 350,000 400,000
2011 2012 2013 2014 2015
Estimated Unaccommodated Room Nights
Source: Hunden Strategic Partners
As previously mentioned, an unaccommodated room night is a night when a traveler seeking accommodations within the market must either cancel their stay or settle for accommodations of lesser quality because the desired facilities have no vacancies. The number of estimated unaccommodated room nights is determined in any month when occupancy is higher than 66 percent, which occurred on several occasions over the past five years. When rooms sell out or nearly do so, rates can be increased and the viability of new hotels is more likely. Based on HSP estimates, the number of unaccommodated room nights for the competitive set peaked in 2015 with more than 314,911 rooms. Based on this figure, HSP estimates that the market in the downtown area is already undersupplied by 1,200 rooms.
Conclusions
The hotel market in San Diego is extremely strong and has been showing increases in demand for the past five years. This has occurred against a backdrop of little supply growth, which has allowed existing hoteliers to generate ever more profits from rising rates and occupancy levels. Even the slowest months would be considered healthy in most markets, while the strongest months and days are nearly sold out consistently. The only weak spots are on Sunday nights and during December generally. A new convention facility that is also bringing and NFL team downtown, as well as likely college bowl games, will help fill Sunday nights with group events throughout most of the year, providing a strong lift throughout, but especially many Sunday nights as well as during the slower months of November, December and January.

TABLE OF CONTENTS ----------- Executive Summary
Chapter 1 Demand and Impact
Appendix A Convention Industry Overview and Trends
Appendix B Convention Market Competitive and Comparable Analysis
Appendix C Influence of Comparable Downtown Stadiums
Appendix D Meeting Planner Interviews
Appendix E Hotel Market Analysis
Appendix F Comparable Convention City Hotel Tax Rate Data

Chargers and Convention Center Study Appendix F - Page 2
COMPARABLE CONVENTION CITY HOTEL TAX RATE DATA HSP used various sources to compile a list displaying the applicable total tax rate paid on hotel rooms in the top 25 convention cities in the country.
The following table shows these rates sorted highest to lowest, and includes their rank based on convention events. Cities highlighted in light green are other competitive West Coast convention cities, plus Phoenix, which is typically included in western convention rotation decisions.
Figure F-1
Top 25 Convention Cities' Hotel Tax (2015)
CityHotel Tax
RateColumbus 17.50%
Chicago 17.39%Indianapolis 17.00%
Houston 17.00%San Antonio 16.75%
Cleveland 16.50%San Francisco 16.45%
Atlanta 16.00%New Orleans 15.75%
Seattle 15.60%Los Angeles 15.50%Portland, OR 15.30%
Charlotte 15.25%Nashville 15.25%
Long Beach 15.00%Dallas 15.00%Boston 14.95%Denver 14.75%
New York 14.75%Washington, DC 14.50%
Minneapolis 13.40%Phoenix 12.57%Orlando 12.50%
San Diego 12.50%Las Vegas 12.00%
Tampa 12.00%
As shown, Columbus, Ohio has the highest applicable hotel tax rate among the top convention cities. On the low end, Tampa has a hotel tax rate of 12 percent. San Diego’s current total hotel tax rate falls in the bottom quintile of the top 25 convention destinations. With the proposed increase to either 15.5 percent or 16.5 percent, San Diego’s rate would still be below the highest quintile and similar to the rates in most other

Chargers and Convention Center Study Appendix F - Page 3
competitive cities. One also should consider the destination appeal of the cities with the top rates. San Diego is a destination that is extremely appealing and has high occupancy and hotel rates. It compares very favorably to many lesser destinations on this list with high hotel tax rates.
All things considered, HSP believes that neither of the proposed hotel tax rates would put San Diego at a competitive disadvantage.