samsung electronics september, 2001. company overview divisional highlights contentscontents q2 2001...
TRANSCRIPT
Samsung ElectronicsSamsung Electronics
SeptemberSeptember, 2001, 2001
Company OverviewCompany Overview
Divisional Highlights Divisional Highlights
ContentsContentsContentsContents
Q2 2001 ResultsQ2 2001 Results

Company OverviewCompany OverviewCompany OverviewCompany Overview
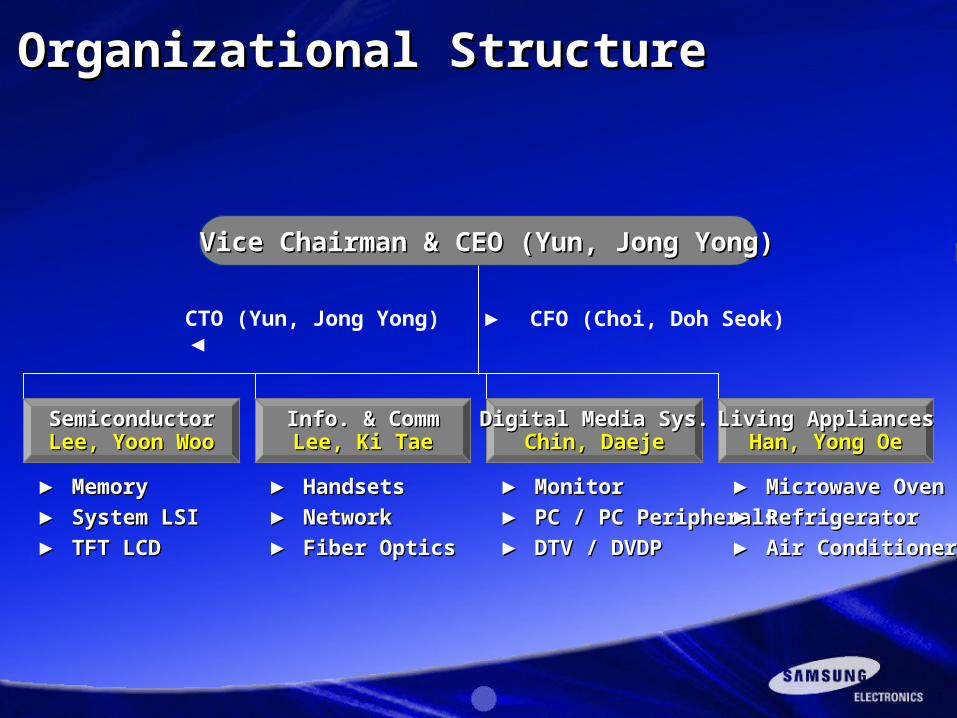
Vice Chairman & CEO (Yun, Jong Yong)Vice Chairman & CEO (Yun, Jong Yong)
▶ CFO (Choi, Doh Seok)CTO (Yun, Jong Yong) ◀
Organizational StructureOrganizational Structure
SemiconductorSemiconductorLee, Yoon WooLee, Yoon Woo
▶ ▶ MemoryMemory
▶ ▶ System LSISystem LSI
▶ ▶ TFT LCDTFT LCD
Info. & CommInfo. & CommLee, Ki TaeLee, Ki Tae
▶ ▶ HandsetsHandsets
▶ ▶ NetworkNetwork
▶ ▶ Fiber OpticsFiber Optics
Digital Media Sys.Digital Media Sys.Chin, DaejeChin, Daeje
▶ ▶ MonitorMonitor
▶ ▶ PC / PC PeripheralsPC / PC Peripherals
▶ ▶ DTV / DVDPDTV / DVDP
Living AppliancesLiving AppliancesHan, Yong OeHan, Yong Oe
▶ ▶ Microwave OvenMicrowave Oven
▶ ▶ RefrigeratorRefrigerator
▶ ▶ Air ConditionerAir Conditioner
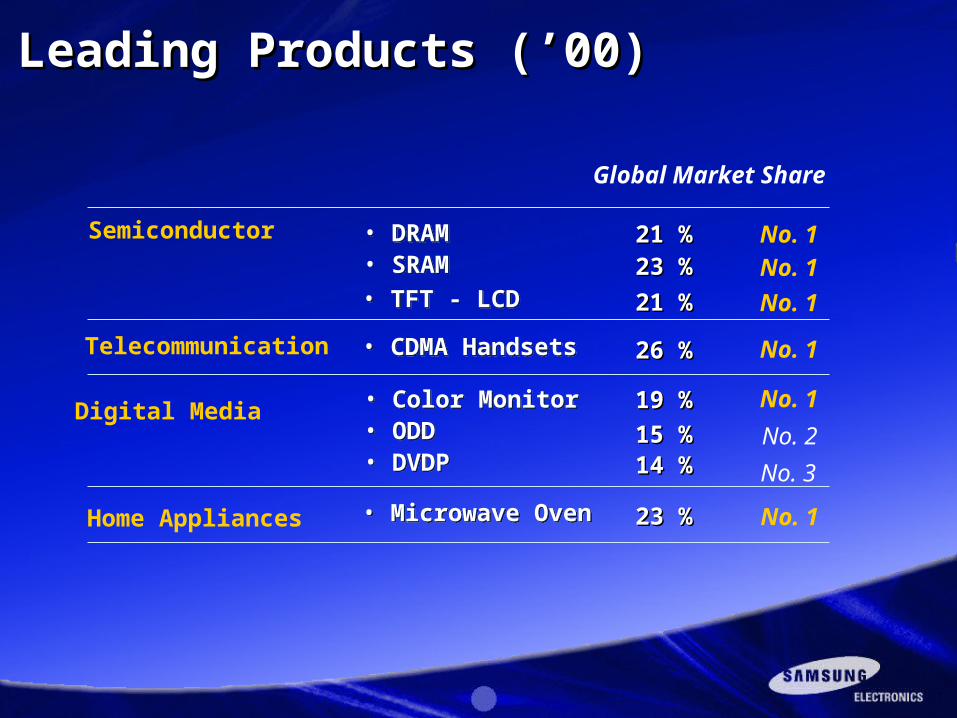
Global Market Share
No. 126 %26 %• CDMA Handsets • CDMA Handsets
No. 1No. 1
21 %21 %23 %23 %
• DRAM• SRAM
• DRAM• SRAM
No. 121 %21 %• TFT - LCD • TFT - LCD
Telecommunication
Semiconductor
No. 1
No. 215 %15 %
19 %19 %• Color Monitor• ODD• DVDP
• Color Monitor• ODD• DVDP
No. 123 %23 %• Microwave Oven • Microwave Oven
Digital Media
Home Appliances
14 %14 % No. 3
Leading Products (’00)Leading Products (’00)
Q2 2001 ResultsQ2 2001 ResultsQ2 2001 ResultsQ2 2001 Results
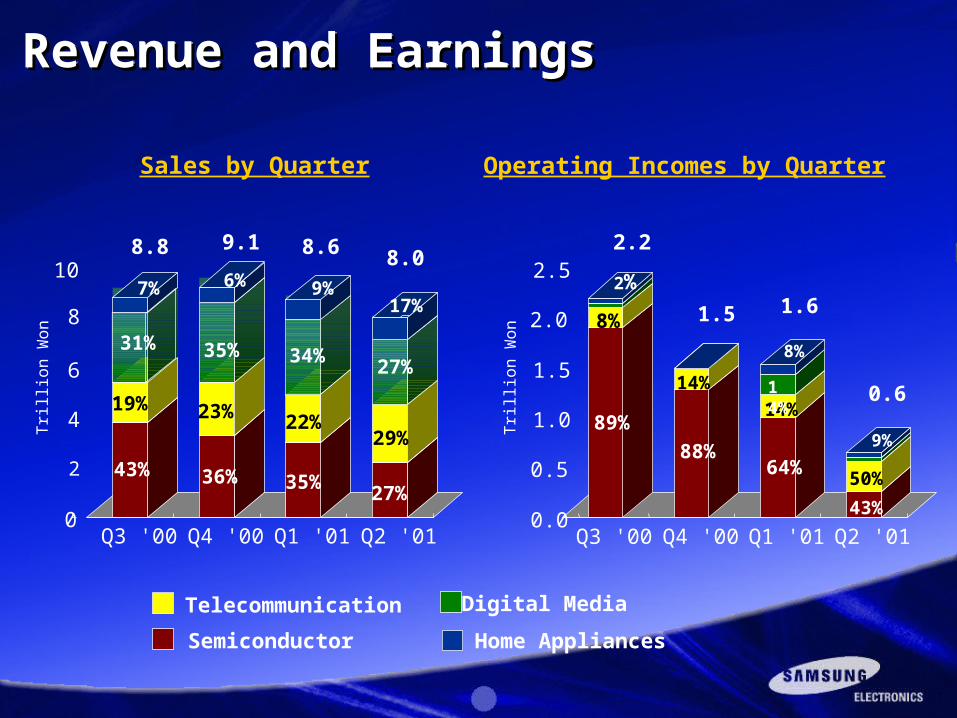
Sales by Quarter Operating Incomes by Quarter
Revenue and EarningsRevenue and EarningsRevenue and EarningsRevenue and Earnings
Digital MediaTelecommunication
Semiconductor Home Appliances
0
2
4
6
8
10
Q3 '00 Q4 '00 Q1 '01 Q2 '01
Tri
l lion W
on
0.0
0.5
1.0
1.5
2.0
2.5
Q3 '00 Q4 '00 Q1 '01 Q2 '01Tri
l lion W
on
8.8 9.1 8.6 8.02.2
1.5 1.6
0.6
43% 36% 35%27%
19% 23% 22%29%
89%
88%64%
43%
8%
14%
14%
50%
31% 35% 34% 27%
7% 9%17%
2%
14%
8%
9%
6%
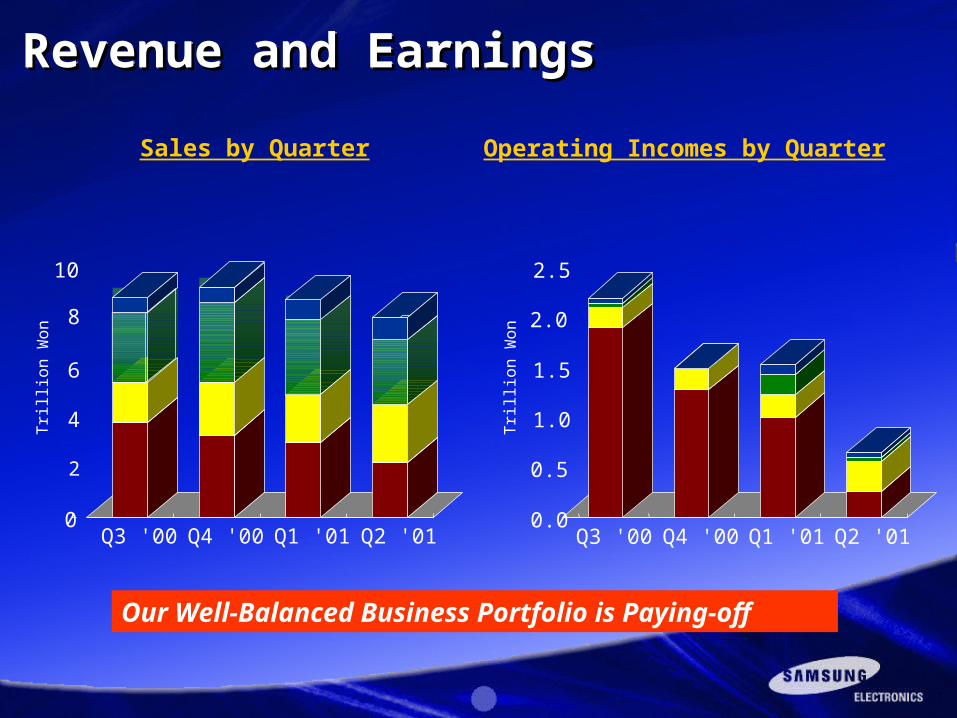
Revenue and EarningsRevenue and EarningsRevenue and EarningsRevenue and Earnings
Our Well-Balanced Business Portfolio is Paying-off
0
2
4
6
8
10
Q3 '00 Q4 '00 Q1 '01 Q2 '01
Sales by Quarter Operating Incomes by Quarter
Tri
l lion W
on
0.0
0.5
1.0
1.5
2.0
2.5
Q3 '00 Q4 '00 Q1 '01 Q2 '01Tri
l lion W
on
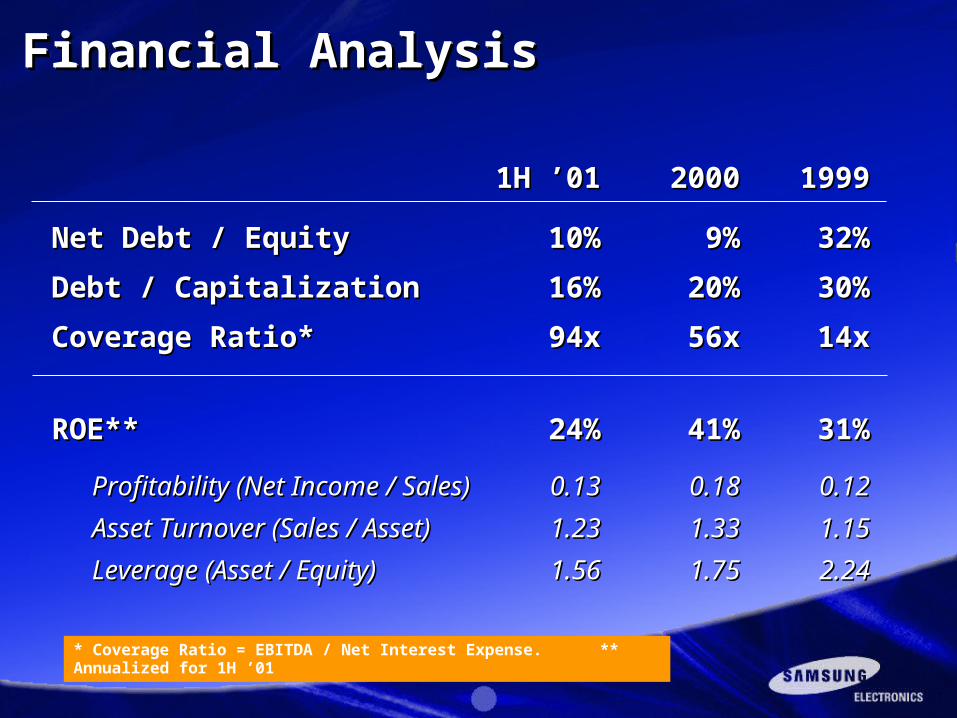
11H ’01H ’01 20002000 19991999
Net Debt / EquityNet Debt / Equity 10%10% 9%9% 32%32%
Debt / CapitalizationDebt / Capitalization 16%16% 20%20% 30%30%
Coverage Ratio*Coverage Ratio* 94x94x 56x56x 14x14x
ROE**ROE** 24%24% 41%41% 31%31%
Profitability (Net Income / Sales)Profitability (Net Income / Sales) 0.130.13 0.180.18 0.120.12
Asset Turnover (Sales / Asset)Asset Turnover (Sales / Asset) 1.231.23 1.331.33 1.151.15
Leverage (Asset / Equity)Leverage (Asset / Equity) 1.561.56 1.751.75 2.242.24
* Coverage Ratio = EBITDA / Net Interest Expense. ** Annualized for 1H ’01
Financial AnalysisFinancial AnalysisFinancial AnalysisFinancial Analysis
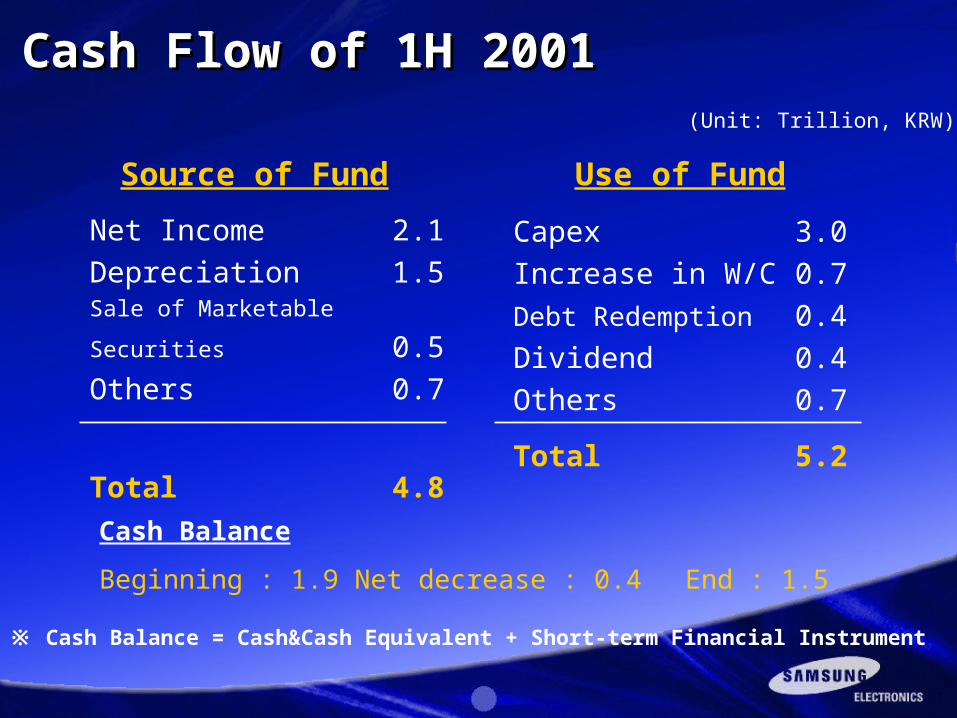
Net Income 2.1
Depreciation 1.5
Sale of Marketable Securities 0.5
Others 0.7
Total 4.8
(Unit: Trillion, KRW)
Source of Fund Use of Fund
Capex 3.0
Increase in W/C 0.7
Debt Redemption 0.4
Dividend 0.4
Others 0.7
Total 5.2
Cash Balance
Beginning : 1.9 Net decrease : 0.4 End : 1.5
※ Cash Balance = Cash&Cash Equivalent + Short-term Financial Instrument
Cash Flow of 1H 2001Cash Flow of 1H 2001Cash Flow of 1H 2001Cash Flow of 1H 2001
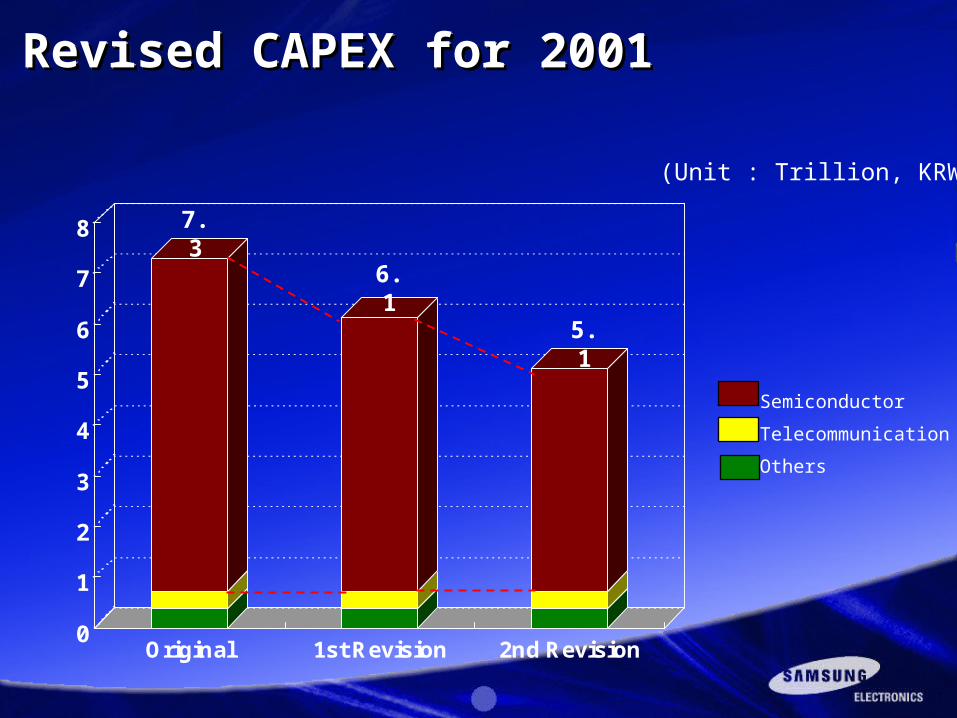
Revised CAPEX for 2001Revised CAPEX for 2001Revised CAPEX for 2001Revised CAPEX for 2001
0
1
2
3
4
5
6
7
8
Original 1st Revision 2nd Revision
Semiconductor
Telecommunication
Others
7.3
6.1
5.1
(Unit : Trillion, KRW)
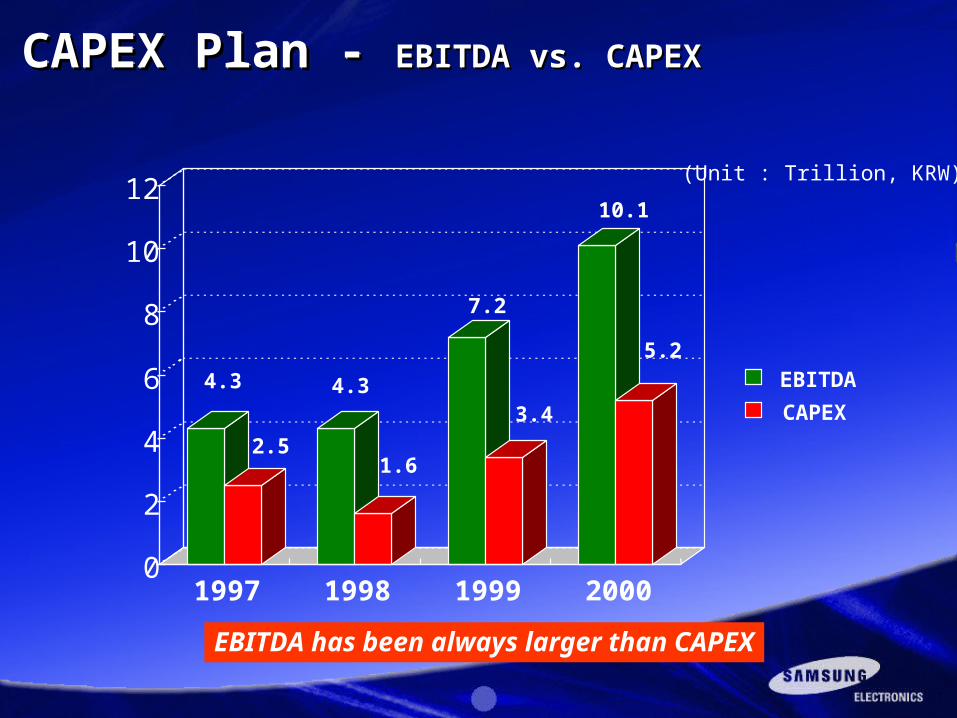
CAPEX Plan - CAPEX Plan - EBITDA vs. CAPEXEBITDA vs. CAPEXCAPEX Plan - CAPEX Plan - EBITDA vs. CAPEXEBITDA vs. CAPEX
EBITDA has been always larger than CAPEX
(Unit : Trillion, KRW)
0
2
4
6
8
10
12
1997 1998 1999 2000
EBITDA
CAPEX
4.3
2.5
4.3
1.6
7.2
3.4
10.1
5.2
Divisional HighlightsDivisional Highlights
- Semiconductor Division- Semiconductor Division
Divisional HighlightsDivisional Highlights
- Semiconductor Division- Semiconductor Division
DRAM Demand and SupplyDRAM Demand and SupplyDRAM Demand and SupplyDRAM Demand and Supply
800
900
1000
1100
1200
1300
1400
1500
1600
1700
Q1 '01 Q2 '01 Q3 '01 Q4 '01 Q1 '02
-6%
-4%
-2%
0%
2%
4%
6%
8%
Demand
Supply
Sufficiencyrate
( Unit : Million )
( Source : Company Data )
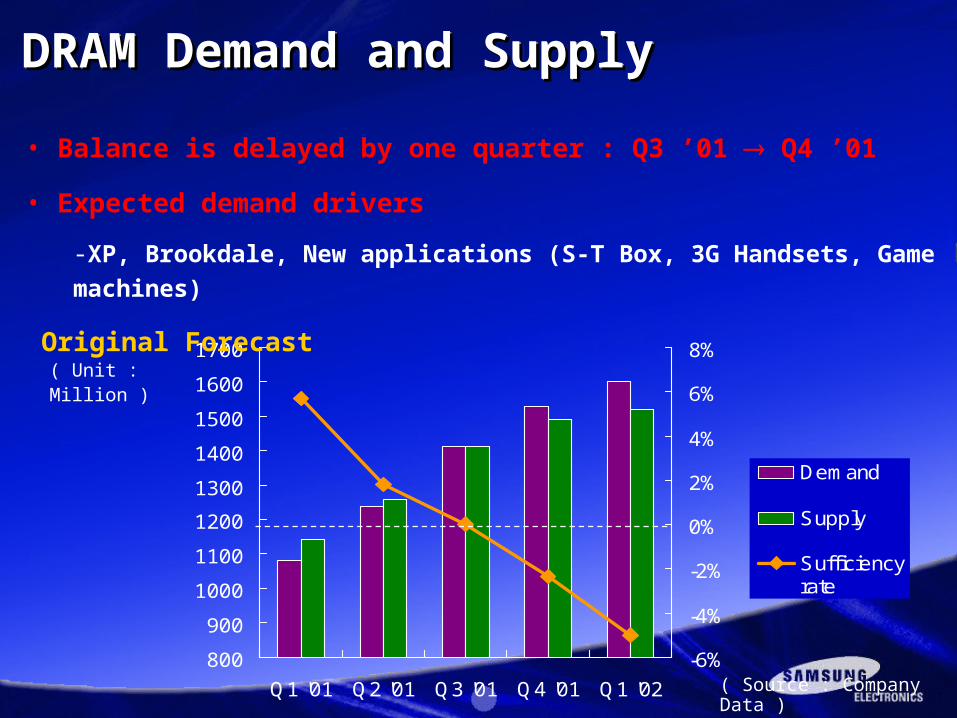
• Balance is delayed by one quarter : Q3 ’01 Q4 ’01
• Expected demand drivers
-XP, Brookdale, New applications (S-T Box, 3G Handsets, Game machines)
Original Forecast
DRAM Demand and SupplyDRAM Demand and SupplyDRAM Demand and SupplyDRAM Demand and Supply
800
900
1000
1100
1200
1300
1400
1500
1600
Q1 '01 Q2 '01 Q3 '01 Q4 '01 Q1 '02
-6%
-4%
-2%
0%
2%
4%
6%
8%
Demand
Supply
Sufficiencyrate
( Unit : Million )
( Source : Company Data )
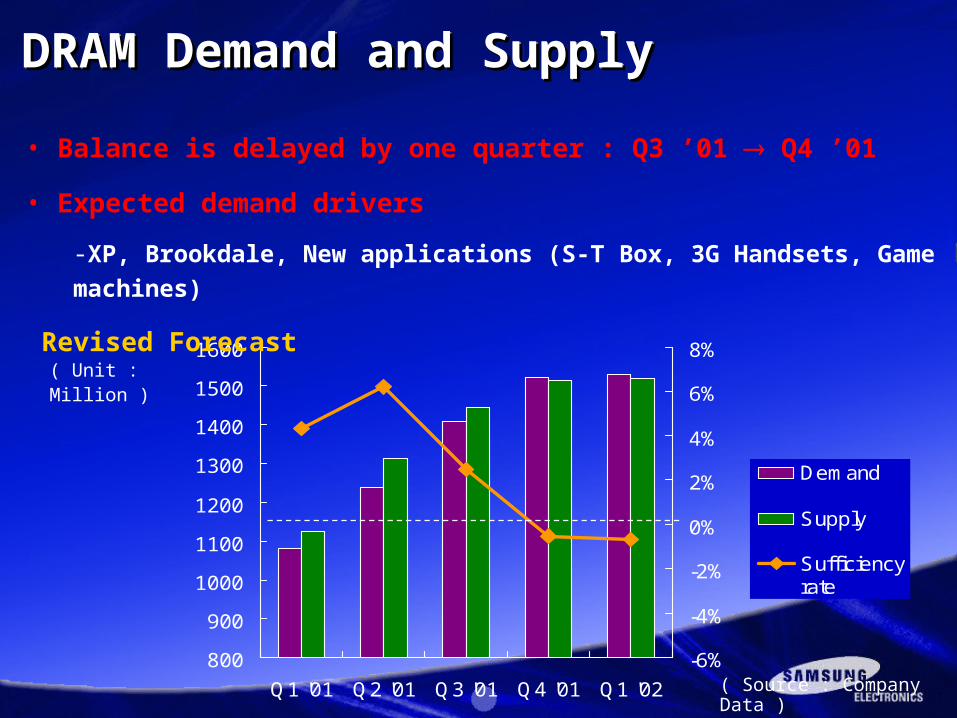
• Balance is delayed by one quarter : Q3 ’01 Q4 ’01
• Expected demand drivers
-XP, Brookdale, New applications (S-T Box, 3G Handsets, Game machines)
Revised Forecast
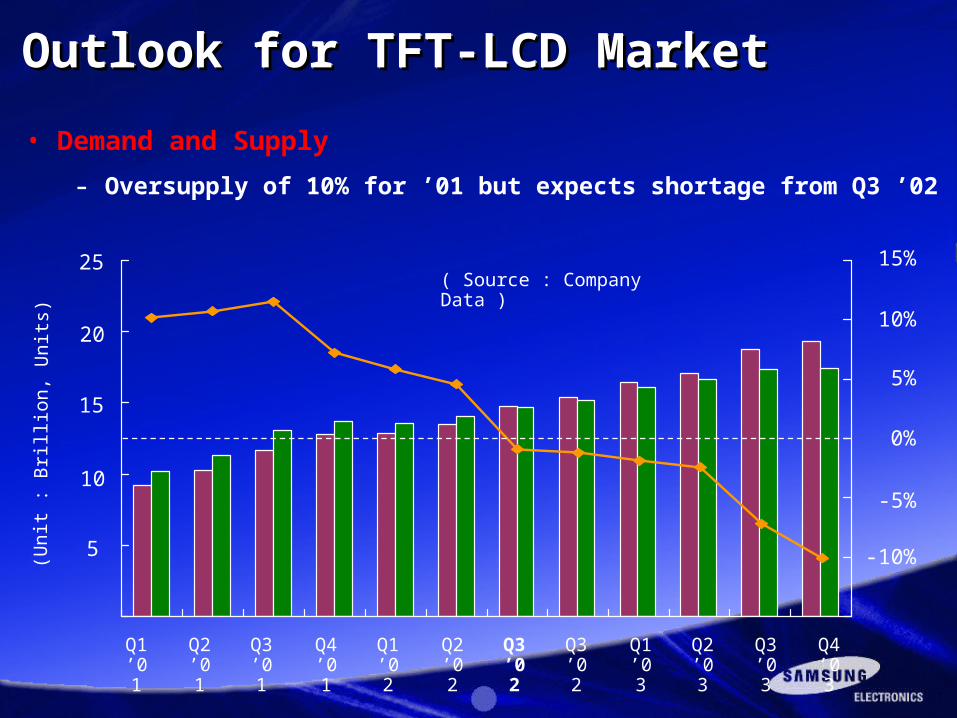
• Demand and Supply
- Oversupply of 10% for ’01 but expects shortage from Q3 ’02
Outlook for TFT-LCD MarketOutlook for TFT-LCD MarketOutlook for TFT-LCD MarketOutlook for TFT-LCD Market
( Source : Company Data )25
20
15
10
5
(Unit
: B
ril l i
on, U
nit
s)
15%
10%
5%
0%
-5%
-10%
Q1 ’01
Q2 ’01
Q3 ’01
Q4 ’01
Q1 ’02
Q2 ’02
Q3 ’02
Q3 ’02
Q1 ’03
Q2 ’03
Q3 ’03
Q4 ’03
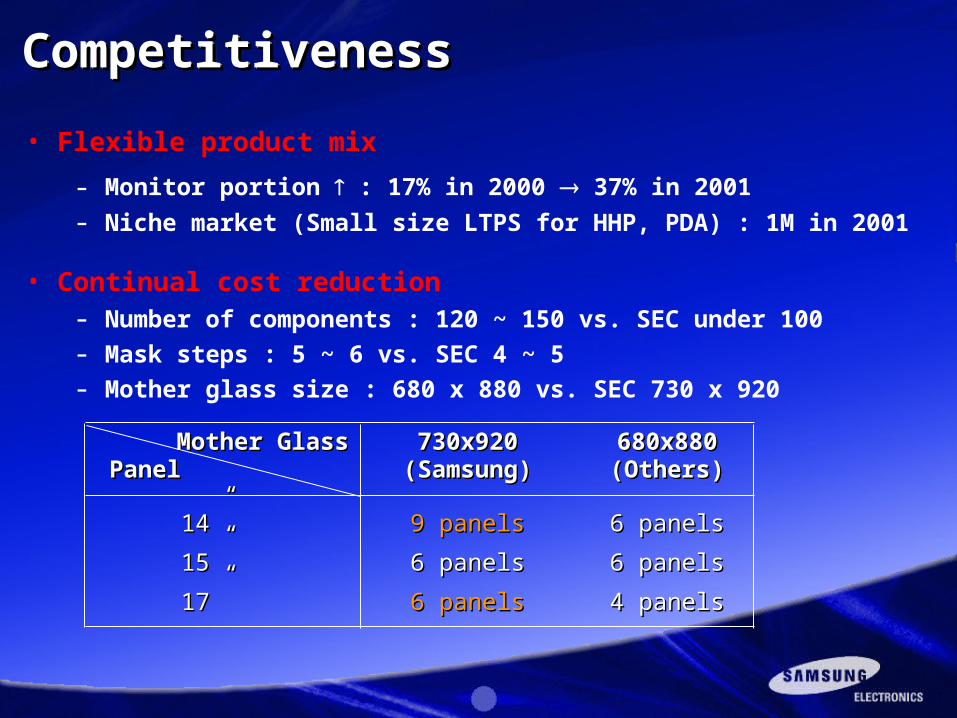
• Flexible product mix
- Monitor portion : 17% in 2000 37% in 2001
- Niche market (Small size LTPS for HHP, PDA) : 1M in 2001
• Continual cost reduction - Number of components : 120 ~ 150 vs. SEC under 100
- Mask steps : 5 ~ 6 vs. SEC 4 ~ 5
- Mother glass size : 680 x 880 vs. SEC 730 x 920
Competitiveness Competitiveness Competitiveness Competitiveness
Mother GlassMother Glass 730x920730x920 680x880680x880PanelPanel (Samsung)(Samsung) (Others)(Others)
14”14” 9 panels9 panels 6 panels6 panels
15”15” 6 panels6 panels 6 panels6 panels
17”17” 6 panels6 panels 4 panels4 panels
Divisional HighlightsDivisional Highlights
- Telecommunication Division- Telecommunication Division
Divisional HighlightsDivisional Highlights
- Telecommunication Division- Telecommunication Division
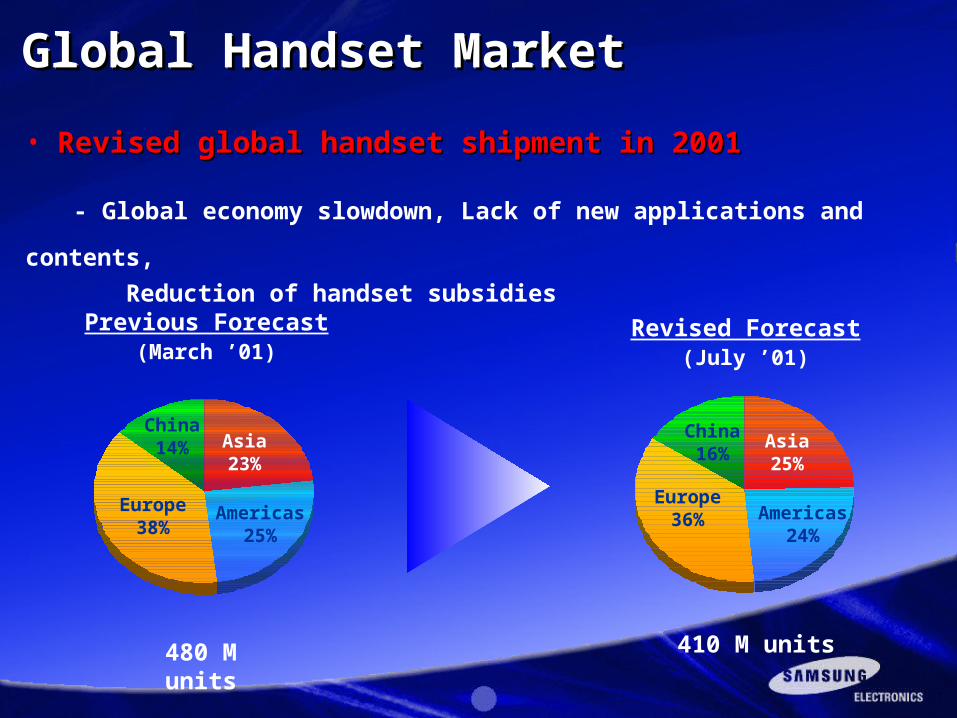
Revised Forecast(July ’01)
Previous Forecast(March ’01)
480 M units
Global Handset MarketGlobal Handset MarketGlobal Handset MarketGlobal Handset Market
• Revised global handset shipment in 2001Revised global handset shipment in 2001
- Global economy slowdown, Lack of new applications and contents,
Reduction of handset subsidies
Asia23%
Americas25%
Europe38%
China14%
410 M units
Asia25%
Americas24%
Europe36%
China16%
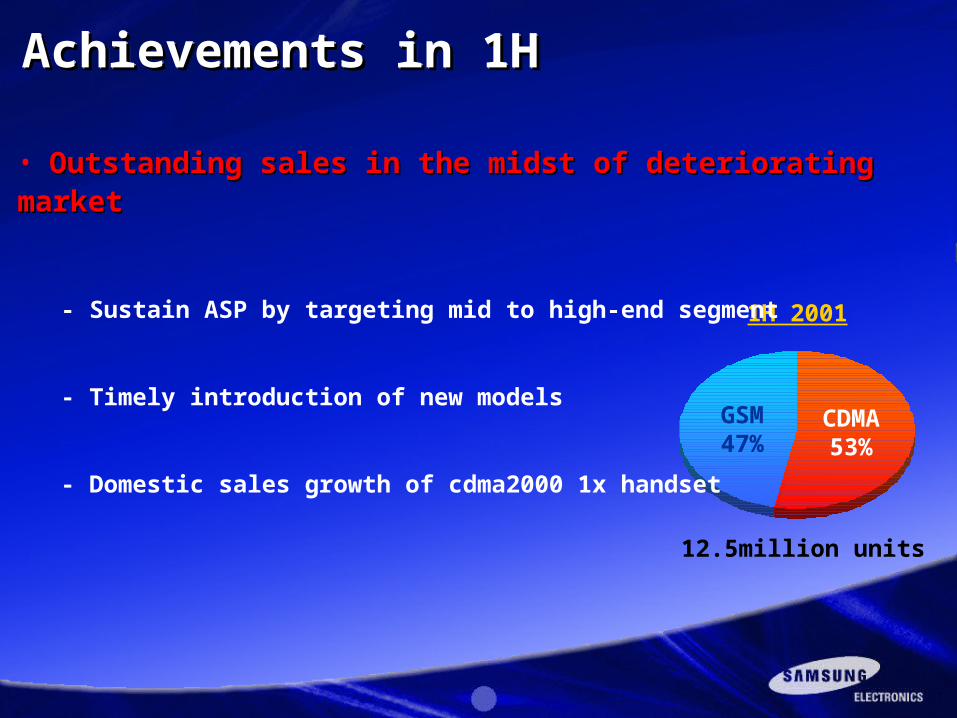
1H 2001
12.5million units
CDMA53%
GSM47%
Achievements in 1HAchievements in 1HAchievements in 1HAchievements in 1H
• Outstanding sales in the midst of deteriorating marketOutstanding sales in the midst of deteriorating market
- Sustain ASP by targeting mid to high-end segment
- Timely introduction of new models
- Domestic sales growth of cdma2000 1x handset
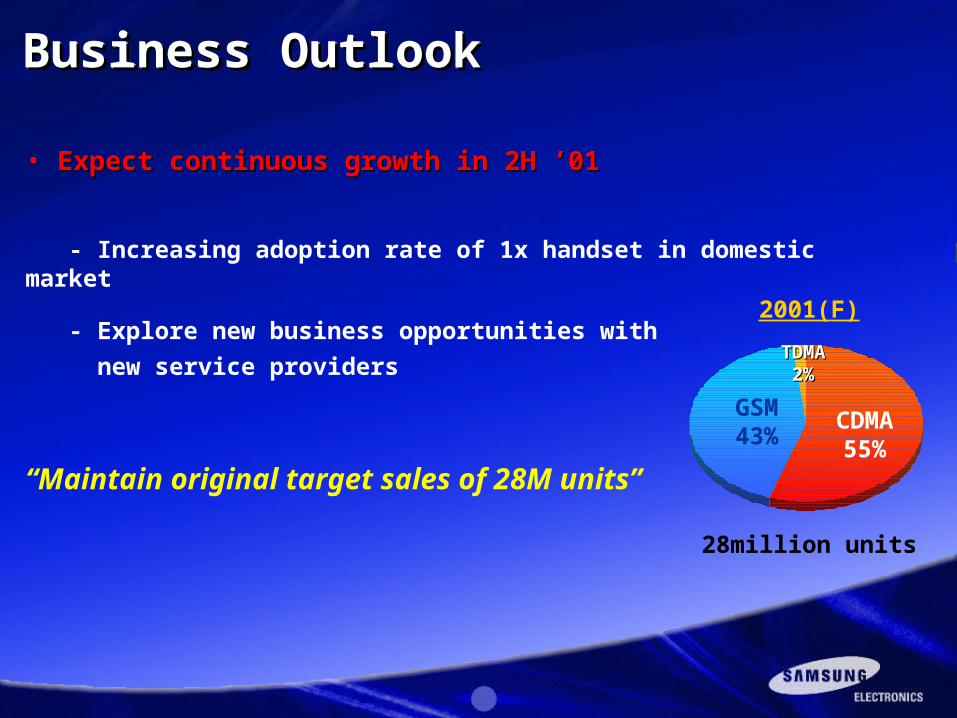
2001(F)
28million units
CDMA55%
GSM43%
Business OutlookBusiness OutlookBusiness OutlookBusiness Outlook
• Expect continuous Expect continuous ggrowthrowth in 2H ’01 in 2H ’01
- Increasing adoption rate of 1x handset in domestic market
- Explore new business opportunities with
new service providers
“Maintain original target sales of 28M units”
TDMATDMA2%2%
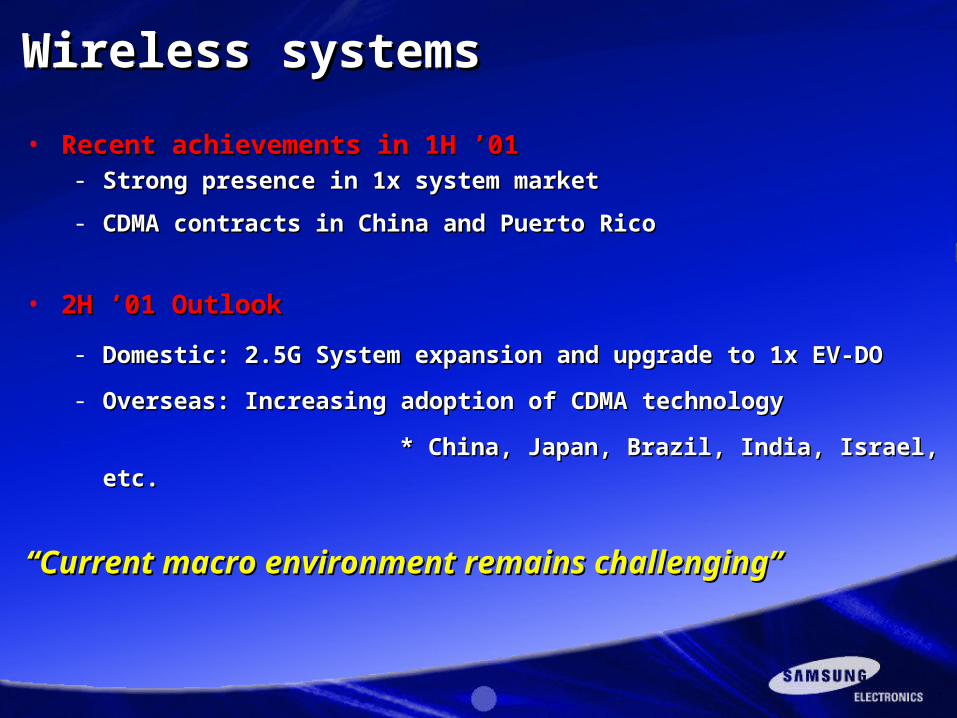
• Recent achievements in 1H ’01Recent achievements in 1H ’01- Strong presence in 1x system marketStrong presence in 1x system market
- CDMA contracts in China and Puerto Rico CDMA contracts in China and Puerto Rico
• 2H ’01 Outlook2H ’01 Outlook
- Domestic: 2.5G System expansion and upgrade to 1x EV-DODomestic: 2.5G System expansion and upgrade to 1x EV-DO
- Overseas: Increasing adoption of CDMA technologyOverseas: Increasing adoption of CDMA technology
* China, Japan, Brazil, India, Israel, etc.* China, Japan, Brazil, India, Israel, etc.
““Current macro environment remains challenging”Current macro environment remains challenging”
Wireless systemsWireless systemsWireless systemsWireless systems

Divisional HighlightsDivisional Highlights
- Digital Media Division- Digital Media Division
Divisional HighlightsDivisional Highlights
- Digital Media Division- Digital Media Division
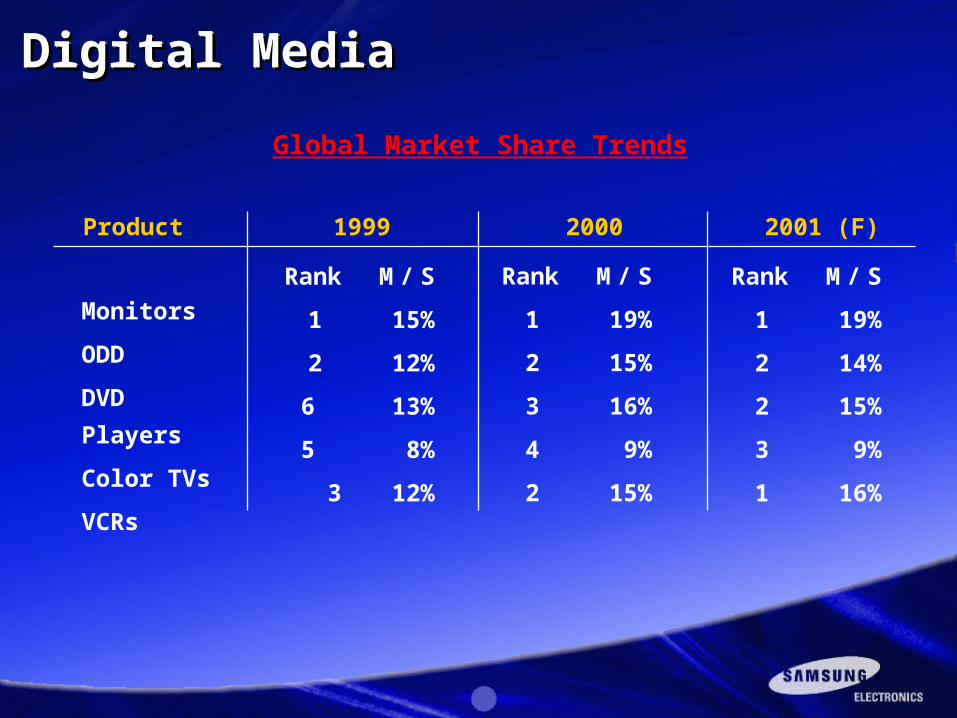
Global Market Share Trends
Rank M / S
1 15%
2 12%
6 13%
5 8%
3 12%
Product 1999 2000 2001 (F)
Digital MediaDigital MediaDigital MediaDigital Media
Rank M / S
1 19%
2 15%
3 16%
4 9%
2 15%
Rank M / S
1 19%
2 14%
2 15%
3 9%
1 16%
Monitors
ODD
DVD Players
Color TVs
VCRs
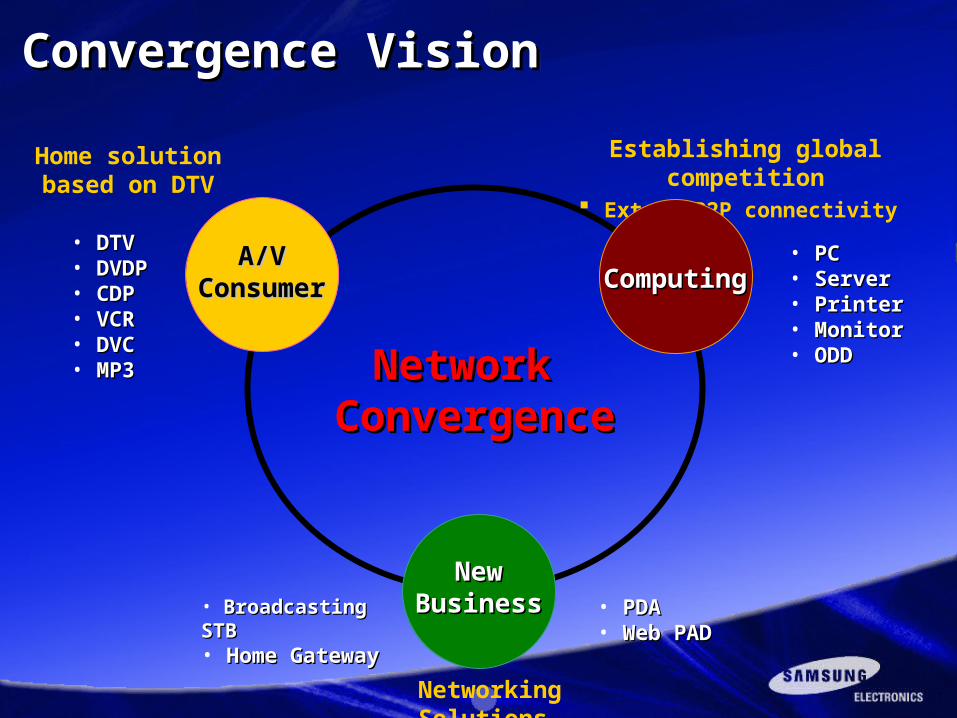
Network Network ConvergenceConvergence
• BBroadcasting STBroadcasting STB• Home GatewayHome Gateway
• PDAPDA• Web PAD Web PAD
NewNewBusinessBusiness
Networking Solutions
Establishing global competition Extend P2P connectivity
• PCPC• ServerServer• PrinterPrinter• MonitorMonitor• ODDODD
ComputingComputing
Home solution based on DTV
A/VA/VConsumerConsumer
• DTVDTV• DVDPDVDP• CDPCDP• VCRVCR• DVCDVC• MP3MP3
Convergence VisionConvergence VisionConvergence VisionConvergence Vision

THANK YOUTHANK YOUTHANK YOUTHANK YOU