sam’s club data and sap bi infrastructure sam’s club characteristics and key figure definitions,...
TRANSCRIPT

Sam’s Club Data and SAP BI Infrastructure
Lorraine R. Gardiner, PhD. [email protected]
Professor, Department of Accounting and MIS California State University, Chico
January 31, 2010

2
Table of Contents Faculty Summary ....................................................................................................................................... 3
Teradata Source Data ........................................................................................................................... 3
InfoObject Definitions ............................................................................................................................. 6
InfoCubes ................................................................................................................................................ 8
Query Tips ............................................................................................................................................. 11
Sam’s Club Small InfoArea ............................................................................................................. 11
No Calculated/Restricted Key Figures .......................................................................................... 11
Store Visits and Line Item InfoCube Incomparability .................................................................. 12
Store Visit Distribution over Time .................................................................................................. 13
Metadata Issues ............................................................................................................................... 14
Unassigned Values for Characteristics (“#”) ................................................................................ 14
Query Performance .......................................................................................................................... 15
Technical Appendix .................................................................................................................................. 16
DSO Definitions .................................................................................................................................... 16
Data Flow .............................................................................................................................................. 16
Data Source Fields ........................................................................................................................... 17
Transformations: PSA to DSO ....................................................................................................... 18
Transformations: DSO to InfoCube ............................................................................................... 19
Query Performance Enhancement .................................................................................................... 20

3
Faculty Summary
The SAP BI infrastructure to support class exercises using Sam’s Club data includes two
InfoCubes, one with general store visits data and another with product-related line item details.
The InfoCubes are loaded with data extracted from a database on the University of Arkansas
Teradata server containing approximately 2.6 million visits with 15.3 million associated line
items. For performance and exercise scope purposes, the data loaded into the SAP BI
InfoCubes were restricted to 11 of the 72 item categories represented in the line items details1.
The resulting store visit and line item InfoCubes contain 1.4 and 3.1 million records,
respectively.
Using these InfoCubes, Dr. Jim Mensching has created an extensive set of curriculum content
emphasizing returns fraud investigation and control. His materials include assignments,
solutions and “how to” videos. The data in the InfoCubes is, however, rich enough to support
faculty in designing additional cases or exercises with emphases besides returns fraud (e.g.,
margin analysis).
Teradata Source Data
The University of Arkansas Enterprise Systems Teradata source (UA_SAMSCLUB_SMALL )
contains store visit information of seven stores from 7/31/2005 through 11/03/2006. The ERD
and metadata are provided in Figure 1 and Table 1 below, based on a similar dataset
(UA_SAMSCLUB).
Figure 1: ERD (Source:
http://enterprise.waltoncollege.uark.edu/1682.asp)
1 Approximately 2.2 million of the line items are not associated with an item category.

4

5
Table 1: Metadata (Source:
http://enterprise.waltoncollege.uark.edu/1682.asp)
6
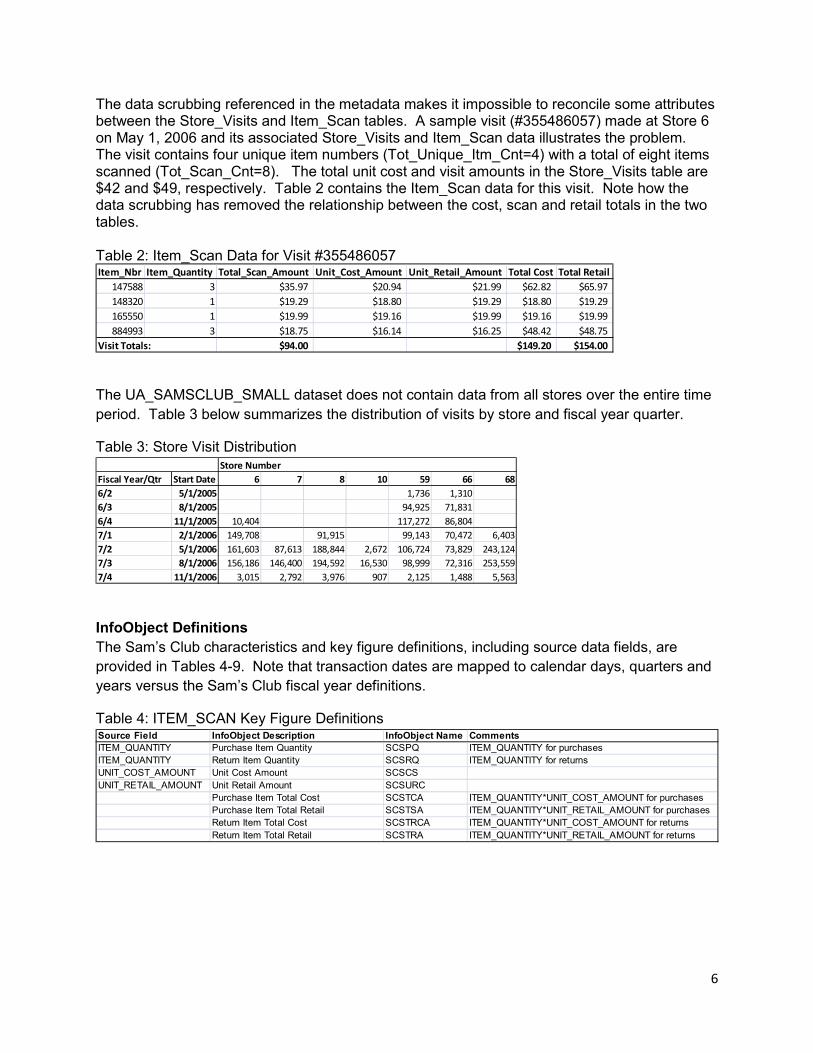
The data scrubbing referenced in the metadata makes it impossible to reconcile some attributes between the Store_Visits and Item_Scan tables. A sample visit (#355486057) made at Store 6 on May 1, 2006 and its associated Store_Visits and Item_Scan data illustrates the problem. The visit contains four unique item numbers (Tot_Unique_Itm_Cnt=4) with a total of eight items scanned (Tot_Scan_Cnt=8). The total unit cost and visit amounts in the Store_Visits table are $42 and $49, respectively. Table 2 contains the Item_Scan data for this visit. Note how the data scrubbing has removed the relationship between the cost, scan and retail totals in the two tables. Table 2: Item_Scan Data for Visit #355486057 Item_Nbr Item_Quantity Total_Scan_Amount Unit_Cost_Amount Unit_Retail_Amount Total Cost Total Retail
147588 3 $35.97 $20.94 $21.99 $62.82 $65.97
148320 1 $19.29 $18.80 $19.29 $18.80 $19.29
165550 1 $19.99 $19.16 $19.99 $19.16 $19.99
884993 3 $18.75 $16.14 $16.25 $48.42 $48.75
$94.00 $149.20 $154.00Visit Totals: The UA_SAMSCLUB_SMALL dataset does not contain data from all stores over the entire time
period. Table 3 below summarizes the distribution of visits by store and fiscal year quarter.
Table 3: Store Visit Distribution
Fiscal Year/Qtr Start Date 6 7 8 10 59 66 68
6/2 5/1/2005 1,736 1,310
6/3 8/1/2005 94,925 71,831
6/4 11/1/2005 10,404 117,272 86,804
7/1 2/1/2006 149,708 91,915 99,143 70,472 6,403
7/2 5/1/2006 161,603 87,613 188,844 2,672 106,724 73,829 243,124
7/3 8/1/2006 156,186 146,400 194,592 16,530 98,999 72,316 253,559
7/4 11/1/2006 3,015 2,792 3,976 907 2,125 1,488 5,563
Store Number
InfoObject Definitions
The Sam’s Club characteristics and key figure definitions, including source data fields, are
provided in Tables 4-9. Note that transaction dates are mapped to calendar days, quarters and
years versus the Sam’s Club fiscal year definitions.
Table 4: ITEM_SCAN Key Figure Definitions Source Field InfoObject Description InfoObject Name Comments
ITEM_QUANTITY Purchase Item Quantity SCSPQ ITEM_QUANTITY for purchases
ITEM_QUANTITY Return Item Quantity SCSRQ ITEM_QUANTITY for returns
UNIT_COST_AMOUNT Unit Cost Amount SCSCS
UNIT_RETAIL_AMOUNT Unit Retail Amount SCSURC
Purchase Item Total Cost SCSTCA ITEM_QUANTITY*UNIT_COST_AMOUNT for purchases
Purchase Item Total Retail SCSTSA ITEM_QUANTITY*UNIT_RETAIL_AMOUNT for purchases
Return Item Total Cost SCSTRCA ITEM_QUANTITY*UNIT_COST_AMOUNT for returns
Return Item Total Retail SCSTRA ITEM_QUANTITY*UNIT_RETAIL_AMOUNT for returns

7
Table 5: STORE_VISITS Key Figure Definitions Source Field InfoObject Description InfoObject Name Comments
SALES_TAX_AMT Purchase Sales Tax Amount SCSSTA SALES_TAX_AMT for purchases
SALES_TAX_AMT Returns Sales Tax Amount SCSRSTA SALES_TAX_AMT for returns
TENDER_AMT Purchase Tender Amount SCSTT TENDER_AMT for purchases
TENDER_AMT Return Tender Amount SCSRTA TENDER_AMT for returns
TOT_SCAN_CNT Purchase Total Scan Count SCSTSC TOT_SCAN_CNT for purchases
TOT_SCAN_CNT Return Total Scan Count SCSTRSC TOT_SCAN_CNT for returns
TOT_UNIQUE_ITM_CNT Purchase Unique Item Count SCSUIC TOT_UNIQUE_ITM_CNT for purchases
TOT_UNIQUE_ITM_CNT Return Unique Item Count SCSRUIC TOT_UNIQUE_ITM_CNT for returns
TOT_UNIT_COST Purchase Total Unit Cost SCSTUC TOT_UNIT_COST for purchases
TOT_UNIT_COST Return Total Unit Cost SCSRTUC TOT_UNIT_COST for returns
TOTAL_VISIT_AMT Purchase Total Visit Amount SCSTS TOTAL_VISIT_AMT for purchases
TOTAL_VISIT_AMT Return Total Visit Amount SCSRTS TOTAL_VISIT_AMT for returns
Table 6: ITEM_DESC Characteristic Definitions Source Field InfoObject Description InfoObject Name
BRAND_NAME Item Brand Name SCSBNT4
BUYER_ID Item Buyer ID SCSBID
CATEGORY_NBR Item Category Number SCSCN
COLOR_DESC Item Color SCSCLR
CREATE_DATE Item Create Date SCSCD
EFFECTIVE_DATE Item Effective Date SCSED
ITEM_NBR Item Number SCSMA
MFG_NBR Item Manufacturer Number SCSMF
SIZE_DESC Item Size SCSSZ
SUB_CATEGORY_NBR Item Sub Category Number SCSSCT4
UPC Item UPC SCSUPS
VENDOR_NBR Item Vendor Number SCSVE
Table 7: MEMBER_INDEX Characteristic Definitions Source Field InfoObject Description InfoObject Name
ELITE_STAT_CODE Member Elite Status Code SCSESC
ISSUING_CLUB_NBR Member Issuing Club Number SCSIC
JOIN_DATE Member Join Data SCSJD
LAST_RENEWAL_DATE Member Renewal Date SCSRD
MEMBER_STATUS_CD Member Status Code SCSMSC
MEMBER_TYPE Member Type SCSMT
MEMBERSHIP_NBR Membership Number SCSME
ZIP_CODE Member Postal Code SCSPC
Table 8: STORE_INFORMATION Characteristic
Definitions
Source Field InfoObject Description InfoObject Name
CITY Store Info Store City SCSCTY
DISTRICT_NBR Store Info Store District SCSDN
GEOGRAPHIC_ZONE Store Info Geographic Zone SCSGZ
MANGER_NAME Store Info Store Manager SCSMG
OPEN_DATE Store Info Open Date SCSOD
OPEN_SUNDAY_FLAG Store Info Open Sunday SCSOS
REGION_NBR Store Info Store Region SCSRE
STATE Store Info Store State SCSST
STORE_NBR Store SCSRL
ZIP_CODE Store Info Store Zip Code SCSZC
Table 9: STORE_VISITS Characteristic Definitions Source Field InfoObject Description InfoObject Name
CARD_HOLDER_NBR Store Visits Card Holder Number SCSCHN
MEMBER_CODE Store Visits Member Code SCSMC
OPERATOR_NBR Store Visits Operator Number SCSON
REFUND_CODE Store Visits Return or Sale SCSRC
REGISTER_NBR Store Visits Register Number SCSRN
TAX_COLLECT_CODE Store Visits Tax Collect Code SCSITC
TENDER_TYPE Store Visits Payment Type SCSMP
TRANSACTION_DATE Calendar Day 0CALDAY
VISIT_NBR Visit Number SCSVN

8
InfoCubes
The data extracted from UA_SAMSCLUB_SMALL includes all stores and dates but is restricted
to the 11 item categories shown in Table 10. My teammate on the Sam’s Club project, Dr. Jim
Mensching, created the category descriptions based on the associated subcategory
descriptions.
Table 10: Item Categories Item Category Number Item Category Description
2 PERSONAL CARE
3 SCHOOL SUPPLIES
6 ELECTRONIC COMMUNICATION
24 FLOWERS
40 NON-ALCOHOLIC DRINKS
42 FOOD PRODUCTS
48 WHEAT AND CORN PRODUCTS
49 SPICES
52 SODAS
79 FOOD SERVICE ITEMS
87 SPECIAL ORDER - VISION WEAR
Both InfoCubes are highly detailed, including data at the transaction level to facilitate drilldowns
in student exercises. The store visits and line item InfoCube structures are provided in Figures
2 and 3 below. The characteristic and navigational short names appear in the star schema, BEX
Analyzer and Query Designer rather than the longer InfoObject descriptions in Tables 4-9
above.
The Store Visits InfoCube (SCSC2) includes member, store, time, and visit dimensions for
analysis of key figures based on the Sam’s Club STORE_VISITS Teradata table attributes.
Each dimension includes the base characteristic (e.g., Membership Number) plus its
navigational attributes (e.g., Membership Type). It is important to note that the store visit key
figures cannot be analyzed by item since they are pre-rolled across all items for each visit in the
STORE_VISITS table. As the name suggests, the Line Item InfoCube (SCSC3) includes an
item dimension in addition to member, store, time and visit dimensions to facilitate analysis of
key figures derived from measures in the Teradata ITEM_SCAN table.

9
Figure 2: Store Visits InfoCube (SCSC2) Star Schema

10
Figure 3: Line Item InfoCube (SCSC3) Star Schema

11
Query Tips
Sam’s Club Small InfoArea
The store visits and line item InfoCubes can be accessed for running existing queries or
creating new ones by either searching for the technical names (SCSC2 or SCSC3) or navigating
to the Sam’s Club Small InfoArea (see below) on the University of Arkansas BI server.
No Calculated/Restricted Key Figures
The abbreviated data models from BEx Query Designer (shown below) illustrate that there are
no calculated and restricted key figures associated with either InfoCube. The omission of
calculated and restricted key figures is intentional to allow faculty to ask students to determine
what derived key figures might be useful.

12
Please ask your students not to create calculated and restricted key figures for these InfoCubes
since they will be available for all subsequent queries. Rather, encourage students to use either
local formulas in Analyzer or formulas in Query Designer (shown below) since neither will be
directly available for other students’ queries.
Local Formula in
Analyzer
Formula in Query
Designer
Store Visits and Line Item InfoCube Incomparability
Comparisons between the measurements in the two InfoCubes cannot be made for two
reasons. The first is the scrubbing of the cost and sales data inherent in the source Teradata
dataset. The second relates to the item category restrictions placed on the data extractions.
While the store visit records were restricted to those containing items from the 11 product

13
categories listed in Table 10 above, store visit measurements such as the total scan count could
include additional categories. For this reason, the total item quantities are larger in the Store
Visits InfoCube, as shown in the query results provided below.
Store Visits InfoCube Totals Store Purchase Tot Scan Ct Return Tot Scan Ct
6 Extreme Retailers ATLANTA 3,364,343 EA 9,906 EA
7 Extreme Retailers ATLANTA 1,475,656 EA 1,897 EA
8 Extreme Retailers AUGUSTA 2,816,260 EA 6,880 EA
10 Extreme Retailers BATON ROUGE 26,045 EA 696 EA
59 Extreme Retailers JACKSON 2,861,311 EA 5,834 EA
66 Extreme Retailers KANSAS CITY 2,344,717 EA 5,520 EA
68 Extreme Retailers KANSAS CITY 2,154,318 EA 4,454 EA
Overall Result 15,042,650 EA 35,187 EA
Line Item InfoCube Totals Store Purchase Item Qty Return Item Qty
6 Extreme Retailers ATLANTA 772,429 EA 4,604 EA
7 Extreme Retailers ATLANTA 354,990 EA 1,290 EA
8 Extreme Retailers AUGUSTA 719,594 EA 4,131 EA
10 Extreme Retailers BATON ROUGE 24,316 EA 561 EA
59 Extreme Retailers JACKSON 695,768 EA 3,577 EA
66 Extreme Retailers KANSAS CITY 549,045 EA 2,677 EA
68 Extreme Retailers KANSAS CITY 539,150 EA 2,278 EA
Overall Result 3,655,292 EA 19,118 EA
Store Visit Distribution over Time
The uneven distribution of visits by store over time in the Teradata UA_SAMSCLUB_SMALL
dataset (Table 3 above) can distort analysis conclusions if not understood. Totals across
returns and purchases (calculated with local query formulas) are summarized below by month
for each store. Stores 59 and 66 are the only stores with visit data every month. Given that the
transaction dates start at 7/31/2005, these two stores have significantly smaller totals for July
2005. All stores have smaller totals for November 2006 due to the end date of 11/03/2006.
Store Visits InfoCube Scan Count Totals Total Scan Count
Calendar Year/Month\Store 6 7 8 10 59 66 68 Overall Result
07.2005 9,160 EA 9,482 EA 18,642 EA
08.2005 173,824 EA 160,581 EA 334,405 EA
09.2005 160,600 EA 148,003 EA 308,603 EA
10.2005 158,731 EA 156,352 EA 315,083 EA
11.2005 166,171 EA 154,753 EA 320,924 EA
12.2005 246,964 EA 204,549 EA 451,513 EA
01.2006 78,082 EA 166,325 EA 126,165 EA 370,572 EA
02.2006 329,102 EA 173,376 EA 130,157 EA 632,635 EA
03.2006 340,443 EA 195,049 EA 189,893 EA 144,367 EA 3,298 EA 873,050 EA
04.2006 343,551 EA 342,186 EA 187,199 EA 144,355 EA 9,602 EA 1,026,893 EA
05.2006 379,278 EA 386,759 EA 2 EA 210,577 EA 161,264 EA 343,989 EA 1,481,869 EA
06.2006 391,052 EA 167,305 EA 380,967 EA 535 EA 216,592 EA 161,306 EA 386,248 EA 1,704,005 EA
07.2006 379,904 EA 375,014 EA 367,165 EA 2,321 EA 205,185 EA 157,062 EA 372,396 EA 1,859,047 EA
08.2006 379,595 EA 318,012 EA 382,332 EA 4,105 EA 203,268 EA 159,531 EA 371,799 EA 1,818,642 EA
09.2006 369,801 EA 300,757 EA 375,941 EA 6,968 EA 196,640 EA 162,989 EA 337,125 EA 1,750,221 EA
10.2006 366,279 EA 300,660 EA 374,056 EA 11,742 EA 191,022 EA 159,291 EA 315,093 EA 1,718,143 EA
11.2006 17,162 EA 15,805 EA 18,685 EA 1,068 EA 11,618 EA 10,030 EA 19,222 EA 93,590 EA
Overall Result 3,374,249 EA 1,477,553 EA 2,823,140 EA 26,741 EA 2,867,145 EA 2,350,237 EA 2,158,772 EA 15,077,837 EA

14
Line Item InfoCube Item Quantity Totals Total Item Quantity
Calendar Year/Month\Store 6 7 8 10 59 66 68 Overall Result
07.2005 2,518 EA 2,496 EA 5,014 EA
08.2005 48,144 EA 42,132 EA 90,276 EA
09.2005 42,382 EA 35,657 EA 78,039 EA
10.2005 39,830 EA 35,669 EA 75,499 EA
11.2005 41,581 EA 34,165 EA 75,746 EA
12.2005 55,937 EA 44,322 EA 100,259 EA
01.2006 16,880 EA 39,591 EA 28,271 EA 84,742 EA
02.2006 75,315 EA 41,638 EA 28,737 EA 145,690 EA
03.2006 79,688 EA 50,714 EA 44,834 EA 32,453 EA 1,708 EA 209,397 EA
04.2006 76,790 EA 87,097 EA 43,353 EA 32,291 EA 4,939 EA 244,470 EA
05.2006 88,384 EA 97,606 EA 2 EA 49,346 EA 37,529 EA 83,839 EA 356,706 EA
06.2006 92,487 EA 39,242 EA 97,069 EA 535 EA 52,178 EA 38,288 EA 95,070 EA 414,869 EA
07.2006 89,669 EA 91,980 EA 93,221 EA 2,210 EA 50,932 EA 38,212 EA 92,456 EA 458,680 EA
08.2006 88,123 EA 79,785 EA 102,599 EA 3,797 EA 51,892 EA 40,694 EA 94,713 EA 461,603 EA
09.2006 84,460 EA 70,870 EA 95,844 EA 6,568 EA 47,290 EA 39,476 EA 83,812 EA 428,320 EA
10.2006 81,142 EA 70,728 EA 94,520 EA 10,800 EA 45,120 EA 38,912 EA 79,670 EA 420,892 EA
11.2006 4,095 EA 3,675 EA 5,055 EA 965 EA 2,779 EA 2,418 EA 5,221 EA 24,208 EA
Overall Result 777,033 EA 356,280 EA 723,725 EA 24,877 EA 699,345 EA 551,722 EA 541,428 EA 3,674,410 EA
Metadata Issues
The characteristic master data is limited by the absence or brevity of metadata for certain
Teradata dataset attributes. For example, member attributes have values but no description for
their meaning (e.g., Membership Type = A). In some cases, only a portion of the characteristic
values in the master data have metadata descriptions. For example, the Teradata Tender_Type
metadata contains definitions for six values but there are nine values in the
UA_SAMSCLUB_SMALL dataset. As a result, the master data for Payment Type contains no
descriptions for the last three types, as shown below.
Payment Type Example Payment Type Purchase Item Qty Return Item Qty
0 CASH 1,103,978 EA 14,130 EA
1 CHECK 1,554,611 EA 482 EA
3 GIFT CARD 414,773 EA 2,264 EA
4 DISCOVER 15,374 EA 198 EA
5 BUSINESS CREDIT 95,950 EA 709 EA
6 PERSONAL CREDIT 183,480 EA 841 EA
7 7 12,119 EA 313 EA
8 8 5,510 EA 110 EA
9 9 269,497 EA 71 EA
Overall Result 3,655,292 EA 19,118 EA
Unassigned Values for Characteristics (“#”)
Students will need to understand that “#” as a characteristic value means “unassigned.” The
unassigned values occur due to missing data in the Teradata dataset. For example, there are
175,205 members in the Teradata MEMBER_INDEX used to build master data for the
Membership Number characteristic but many more (304,327) in the STORE_VISITS table. This
results in a significant number of records with unassigned values for important characteristics,
as shown in the Membership Type example below.

15
Membership Type Example Membership Type Purchase Item Qty Return Item Qty
1 37 EA 0 EA
3 17 EA 0 EA
A 20,606 EA 212 EA
D 1,343 EA 4 EA
E 12,005 EA 169 EA
G 440 EA 1 EA
H 76 EA 1 EA
V 1,236,664 EA 5,567 EA
W 1,138,209 EA 4,805 EA
X 327,325 EA 2,046 EA
Y 9,138 EA 54 EA
Z 2,133 EA 38 EA
# 907,299 EA 6,221 EA
Query Performance
Since the Sam’s Club InfoCubes contain transaction detail, query performance was a high
priority in their design. Additionally, pre-filled aggregates for common rollups (e.g., store and
month) exist for each InfoCube to improve query speed. If faculty encounter rollups for an
exercise that are unreasonably slow, contact the author of this report. If appropriate, additional
aggregates will be built. Aggregates, however, cannot improve query performance for
transaction detail analysis. To improve the response time for detail requests such as Visit
Number or Membership Number, encourage students to filter on characteristics or place
restrictive conditions on key figure values.

16
Technical Appendix Consistent with industry practice, the architecture includes two DataStore Objects (DSOs)
containing historical details from which InfoCube data marts can be built. While the existing
Store Visit and Line Item InfoCubes have the same granularity as the DSOs, it is important to
note that other, more aggregated InfoCubes could be built and easily loaded from the existing
DSOs, if desired.
DSO Definitions
The DSO key fields are consistent with the primary keys in the respective
UA_SAMSCLUB_SMALL Store_Visits and Item_Scan tables. Additionally, key figures are
populated for purchases and returns using transformations involving the Refund_Code and
original quantities from the PSA.
Data Flow
The data flow for each InfoCube is provided below. Transactional data extractions into .csv file
from UA_SAMSCLUB_SMALL were used to populate the PSA tables. From there, Data
Transfer Processes loaded data into the DSOs and subsequent InfoCubes, executing the
necessary transformations. [Master data flows are not shown but were straightforward loads of
characteristics with texts and attributes, as needed, from the respective
UA_SAMSCLUB_SMALL tables.

17
Data Source Fields
For both the store visit and line item PSA tables, all the fields are in internal format except the
Membership_Nbr. This field requires the ALPHA conversion method from external to internal
format because, as noted in the Faculty Summary, there are many member numbers that are
not in the UA_SAMSCLUB_SMALL Member_Index table. For this reason, the ALPHA
conversion did not occur in a master data load for the missing numbers. Failure to request the
ALPHA conversion results in activation problems in the DSO.

18
Transformations: PSA to DSO
The transformations for the store visits and line item DSOs are shown below. Of particular note are the
transformations using Refund_Code that populate the purchase and return key figure data upon
execution. An example is provided for Purchase Tender Amount that typifies the purchase/return key
figure transformations.

19
The Purchase Tender Amount formula is conditioned on a Refund_Code value of zero (purchase) and
also forces all values to be positive. Formulas for return-based key figures are conditioned on
Refund_Code values of 1.
Transformations: DSO to InfoCube
The store visits transformations are all direct or time-based while those for the line item InfoCube
require four simple transformation (Quantity*Unit Cost or Unit Retail).

20
Query Performance Enhancement
Since both InfoCubes are highly granular, particular attention was paid to query speed in the
InfoCube design and maintenance of aggregates. All dimensions are designated as line item.
As an example, a Store dimension line item designation is shown below.
Additionally, each InfoCube is partitioned on month, from May 2005 through November 2006.
Finally, each InfoCube has a number of aggregates that reflect the most likely query requests.
The author will supplement the aggregate collection, as needed, to improve performance. The
current set of aggregates for each InfoCube is shown below.

21
Store Visit InfoCube
Aggregates
Line Item InfoCube Aggregates