sampling procedures for inspection by variables ...cpip.dfl.com.cn/stdfdld/dfl200900092.pdf · 12...
TRANSCRIPT
Reference numberISO 3951-1:2005(E)
© ISO 2005
INTERNATIONAL STANDARD
ISO3951-1
First edition2005-04-01
Sampling procedures for inspection by variables — Part 1: Specification for single sampling plans indexed by acceptance quality limit (AQL) for lot-by-lot inspection for a single quality characteristic and a single AQL
Règles d'échantillonnage pour les contrôles par mesures —
Partie 1: Spécifications pour les plans d'échantillonnage simples indexés d'après le niveau de qualité acceptable (NQA) pour le contrôle lot par lot pour une caractéristique de qualité unique et un NQA unique
Copyright International Organization for Standardization Reproduced by IHS under license with ISO
Not for ResaleNo reproduction or networking permitted without license from IHS
--`,,`,,,-`-`,,`,,`,`,,`---
ISO 3951-1:2005(E)
PDF disclaimer This PDF file may contain embedded typefaces. In accordance with Adobe's licensing policy, this file may be printed or viewed but shall not be edited unless the typefaces which are embedded are licensed to and installed on the computer performing the editing. In downloading this file, parties accept therein the responsibility of not infringing Adobe's licensing policy. The ISO Central Secretariat accepts no liability in this area.
Adobe is a trademark of Adobe Systems Incorporated.
Details of the software products used to create this PDF file can be found in the General Info relative to the file; the PDF-creation parameters were optimized for printing. Every care has been taken to ensure that the file is suitable for use by ISO member bodies. In the unlikely event that a problem relating to it is found, please inform the Central Secretariat at the address given below.
© ISO 2005 All rights reserved. Unless otherwise specified, no part of this publication may be reproduced or utilized in any form or by any means, electronic or mechanical, including photocopying and microfilm, without permission in writing from either ISO at the address below or ISO's member body in the country of the requester.
ISO copyright office Case postale 56 • CH-1211 Geneva 20 Tel. + 41 22 749 01 11 Fax + 41 22 749 09 47 E-mail [email protected] Web www.iso.org
Published in Switzerland
ii © ISO 2005 – All rights reserved
Copyright International Organization for Standardization Reproduced by IHS under license with ISO
Not for ResaleNo reproduction or networking permitted without license from IHS
--`,,`,,,-`-`,,`,,`,`,,`---
ISO 3951-1:2005(E)
© ISO 2005 – All rights reserved iii
Contents Page
Foreword............................................................................................................................................................. v Introduction ...................................................................................................................................................... vii 1 Scope...................................................................................................................................................... 1 2 Normative references ........................................................................................................................... 2 3 Terms and definitions........................................................................................................................... 2 4 Symbols ................................................................................................................................................. 5 5 Acceptance quality limit (AQL)............................................................................................................ 7 5.1 Principle ................................................................................................................................................. 7 5.2 Use.......................................................................................................................................................... 7 5.3 Specifying AQLs ................................................................................................................................... 7 5.4 Preferred AQLs...................................................................................................................................... 7 5.5 Caution................................................................................................................................................... 7 5.6 Limitation ............................................................................................................................................... 7 6 Switching rules for normal, tightened and reduced inspection....................................................... 7 7 Relation to ISO 2859-1 .......................................................................................................................... 8 7.1 Similarities ............................................................................................................................................. 8 7.2 Differences............................................................................................................................................. 8 8 Limiting quality protection................................................................................................................... 9 8.1 Use of individual plans ......................................................................................................................... 9 8.2 Consumer's risk quality tables ............................................................................................................ 9 8.3 Producer's risk tables........................................................................................................................... 9 8.4 Operating characteristic curves .......................................................................................................... 9 9 Planning ............................................................................................................................................... 10 10 Choice between variables and attributes ......................................................................................... 10 11 Choice between the “s” and “σσσσ” methods ....................................................................................... 11 12 Choice of inspection level and AQL.................................................................................................. 11 13 Choice of sampling plan..................................................................................................................... 11 13.1 Standard plans .................................................................................................................................... 11 13.2 Special plans ....................................................................................................................................... 12 14 Preliminary operations ....................................................................................................................... 12 15 Standard procedure for the “s” method ........................................................................................... 12 15.1 Obtaining a plan, sampling and preliminary calculations .............................................................. 12 15.2 Acceptability criteria for single specification limits........................................................................ 13 15.3 Graphical method for a single specification limit............................................................................ 14 15.4 Acceptability criterion for combined control of double specification limits ................................ 15 16 Standard procedure for the “σσσσ” method........................................................................................... 21 16.1 Obtaining a plan, sampling and preliminary calculations .............................................................. 21 16.2 Acceptability criteria for a single specification limit....................................................................... 21 16.3 Acceptability criterion for combined control of double specification limits ................................ 22 17 Procedure during continuing inspection.......................................................................................... 23 18 Normality and outliers ........................................................................................................................ 24 18.1 Normality.............................................................................................................................................. 24 18.2 Outliers................................................................................................................................................. 24
Copyright International Organization for Standardization Reproduced by IHS under license with ISO
Not for ResaleNo reproduction or networking permitted without license from IHS
--`,,`,,,-`-`,,`,,`,`,,`---
ISO 3951-1:2005(E)
iv © ISO 2005 – All rights reserved
19 Records ................................................................................................................................................24 19.1 Control charts ......................................................................................................................................24 19.2 Lots that are not accepted..................................................................................................................24 20 Operation of switching rules..............................................................................................................24 21 Discontinuation and resumption of inspection................................................................................25 22 Switching between the “s” and “σσσσ” methods...................................................................................25 22.1 Estimating the process standard deviation......................................................................................25 22.2 State of statistical control ..................................................................................................................26 22.3 Switching from the “s” method to the “σσσσ” method..........................................................................26 22.4 Switching from the “σσσσ” method to the “s” method..........................................................................26 23 Chart A — Sample-size code letters of standard single sampling plans for specified
quality levels ........................................................................................................................................26 24 Charts B to R (Figures 5 to 19) — Operating characteristic curves and tabulated values for
sample-size code letter B to R: “s” method .......................................................................................28 25 Charts s-D to s-R (Figures 20 to 32) — Acceptance curves for combined control of double
specification limits: “s” method ..........................................................................................................56 Annex A (normative) Tables for determining the appropriate sample size ................................................69 Annex B (normative) Form k single sampling plans for the “s” method ......................................................71 Annex C (normative) Form k single sampling plans for the “σ” method .....................................................75 Annex D (normative) Values of fs for maximum sample standard deviation (MSSD) ...............................79
Annex E (normative) Values of fσ for maximum process standard deviation (MPSD) .............................83
Annex F (normative) Estimating the process fraction nonconforming for sample size 3: “s” method..................................................................................................................................................84
Annex G (normative) Type p* single sampling plans ....................................................................................87 Annex H (normative) Values of cu for upper control limit on the sample standard deviation .................88
Annex I (normative) Supplementary acceptability constants for qualifying towards reduced inspection.............................................................................................................................................89
Annex J (normative) Procedures for obtaining s and σ ................................................................................90 Annex K (informative) Consumer's risk qualities ..........................................................................................92 Annex L (informative) Producer's risks ..........................................................................................................96 Annex M (informative) Operating characteristics for the “σ” method........................................................100 Annex N (informative) Estimating the process fraction nonconforming for sample sizes 3
and 4 — “s” method............................................................................................................................101 Bibliography....................................................................................................................................................103
Copyright International Organization for Standardization Reproduced by IHS under license with ISO
Not for ResaleNo reproduction or networking permitted without license from IHS
--`,,`,,,-`-`,,`,,`,`,,`---
ISO 3951-1:2005(E)
© ISO 2005 – All rights reserved v
Foreword
ISO (the International Organization for Standardization) is a worldwide federation of national standards bodies (ISO member bodies). The work of preparing International Standards is normally carried out through ISO technical committees. Each member body interested in a subject for which a technical committee has been established has the right to be represented on that committee. International organizations, governmental and non-governmental, in liaison with ISO, also take part in the work. ISO collaborates closely with the International Electrotechnical Commission (IEC) on all matters of electrotechnical standardization.
International Standards are drafted in accordance with the rules given in the ISO/IEC Directives, Part 2.
The main task of technical committees is to prepare International Standards. Draft International Standards adopted by the technical committees are circulated to the member bodies for voting. Publication as an International Standard requires approval by at least 75 % of the member bodies casting a vote.
Attention is drawn to the possibility that some of the elements of this document may be the subject of patent rights. ISO shall not be held responsible for identifying any or all such patent rights.
ISO 3951-1 was prepared by Technical Committee ISO/TC 69, Applications of statistical methods, Subcommittee SC 5, Acceptance sampling.
This first edition of ISO 3951-1 cancels and replaces ISO 3951:1989, of which it constitutes a technical revision. The most significant differences between ISO 3951-1:2003 and ISO 3951:1989 are as follows.
The acronym AQL now stands for Acceptance Quality Limit rather than Acceptable Quality Level, in order to reflect more accurately its function.
The coverage of this part of ISO 3951 is constrained to a single, normally distributed variable with a single class of nonconformity. This part of ISO 3951 includes the case of combined control of double specification limits, but procedures for separate or complex control of double specification limits are deferred to ISO 3951-2. More general procedures that can be used for multiple characteristics and/or multiple AQLs are also given in ISO 3951-2.
The plans have been modified so that their operating characteristic curves more closely match those of the plans in ISO 2859-1. The sample sizes for both the “s” method and the “σ ” method are constant along rows of the master tables.
All acceptability constants (see Annexes B, C, G and I) have been revised and tabulated to three decimal places for an extended range of AQLs corresponding to ISO 2859-1:1999.
All tabulated values of operating characteristics have been recalculated and related directly to reduced inspection as well as to normal and tightened inspection.
The annex containing the general statistical theory has been removed. It is planned ultimately to reintroduce this within a guidance document to sampling procedures for inspection by variables.
Tables that are required for implementing the procedures have been relocated into annexes.
The annex dealing with the “R” method has been eliminated, now that the availability of calculators with a standard deviation function key is so widespread. Data for acceptance sampling by variables is often substantially more expensive to acquire than data for sampling by attributes, and the “s” method makes more efficient use of this data.
Copyright International Organization for Standardization Reproduced by IHS under license with ISO
Not for ResaleNo reproduction or networking permitted without license from IHS
--`,,`,,,-`-`,,`,,`,`,,`---
ISO 3951-1:2005(E)
vi © ISO 2005 – All rights reserved
ISO 3951 currently consists of the following parts, under the general title Sampling procedures for inspection by variables:
Part 1: Specification for single sampling plans indexed by acceptance quality limit (AQL) for lot-by-lot inspection for a single quality characteristic and a single AQL
Part 2: General specification for single sampling plans indexed by acceptance quality limit (AQL) for lot-by-lot inspection of independent quality characteristics
The following parts are under preparation:
Part 3: Double sampling schemes indexed by acceptance quality limit (AQL) for lot-by-lot inspection
Part 5: Sequential sampling plans indexed by acceptance quality limit (AQL) for inspection by variables
Copyright International Organization for Standardization Reproduced by IHS under license with ISO
Not for ResaleNo reproduction or networking permitted without license from IHS
--`,,`,,,-`-`,,`,,`,`,,`---
ISO 3951-1:2005(E)
© ISO 2005 – All rights reserved vii
Introduction
This part of ISO 3951 specifies an acceptance sampling system of single sampling plans for inspection by variables. It is indexed in terms of the Acceptance Quality Limit (AQL), and is designed for users who have simple requirements. A more comprehensive and technical treatment is given in ISO 3951-2. This part of ISO 3951 is complementary to ISO 2859-1.
The objectives of the methods laid down in this part of ISO 3951 are to ensure that lots of an acceptable quality have a high probability of acceptance, and that the probability of not accepting inferior lots is as high as practicable. This is achieved by means of the switching rules, which provide:
a) automatic protection to the consumer (by means of a switch to tightened inspection or discontinuation of sampling inspection) should a deterioration in quality be detected;
b) an incentive (at the discretion of the responsible authority) to reduce inspection costs (by means of a switch to a smaller sample size) if consistently good quality is achieved.
In this part of ISO 3951, the acceptability of a lot is implicitly determined from an estimate of the percentage of nonconforming items in the process, based on a random sample of items from the lot.
This part of ISO 3951 is intended for application to a continuing series of lots of discrete products all supplied by one producer using one production process. If there are different producers or production processes, this part of ISO 3951 is applied to each one separately.
This part of ISO 3951 is intended for application to a single quality characteristic that is measurable on a continuous scale. For two or more such quality characteristics, see ISO 3951-2.
It is assumed in this part of ISO 3951 that measurement error is negligible. For information on allowing for measurement error, see Reference [17] in the Bibliography.
For double specification limits, this part of ISO 3951 treats combined control. For other types of control, see ISO 3951-2.
Inspection by variables for percent nonconforming items, as described in the present document, includes several possible modes, the combination of which leads to a presentation that may appear quite complex to the user:
unknown standard deviation, or originally unknown then estimated with fair precision, or known since the start of inspection;
a single specification limit, or combined control of double specification limits;
normal inspection, tightened inspection or reduced inspection.
Fourteen annexes are provided. Annexes A to I provide the tables needed to support the procedures. Annex J indicates how the sample standard deviation, “s”, and the presumed known value of the process standard deviation, “σ”, should be determined. Annex K provides the statistical theory underlying the calculation of the consumer's risks, together with tables showing these risks for normal, tightened and reduced inspection as well as for the “s” and “σ” methods. Annex L provides similar information for the producer's risks. Annex M gives the general formula for the operating characteristic of the “σ” method. Annex N provides the statistical theory underlying the estimation of the process fraction nonconforming under the “s” method for sample sizes 3 and 4, which for technical reasons are treated differently from the other sample sizes in this part of ISO 3951.
Copyright International Organization for Standardization Reproduced by IHS under license with ISO
Not for ResaleNo reproduction or networking permitted without license from IHS
--`,,`,,,-`-`,,`,,`,`,,`---
ISO 3951-1:2005(E)
viii © ISO 2005 – All rights reserved
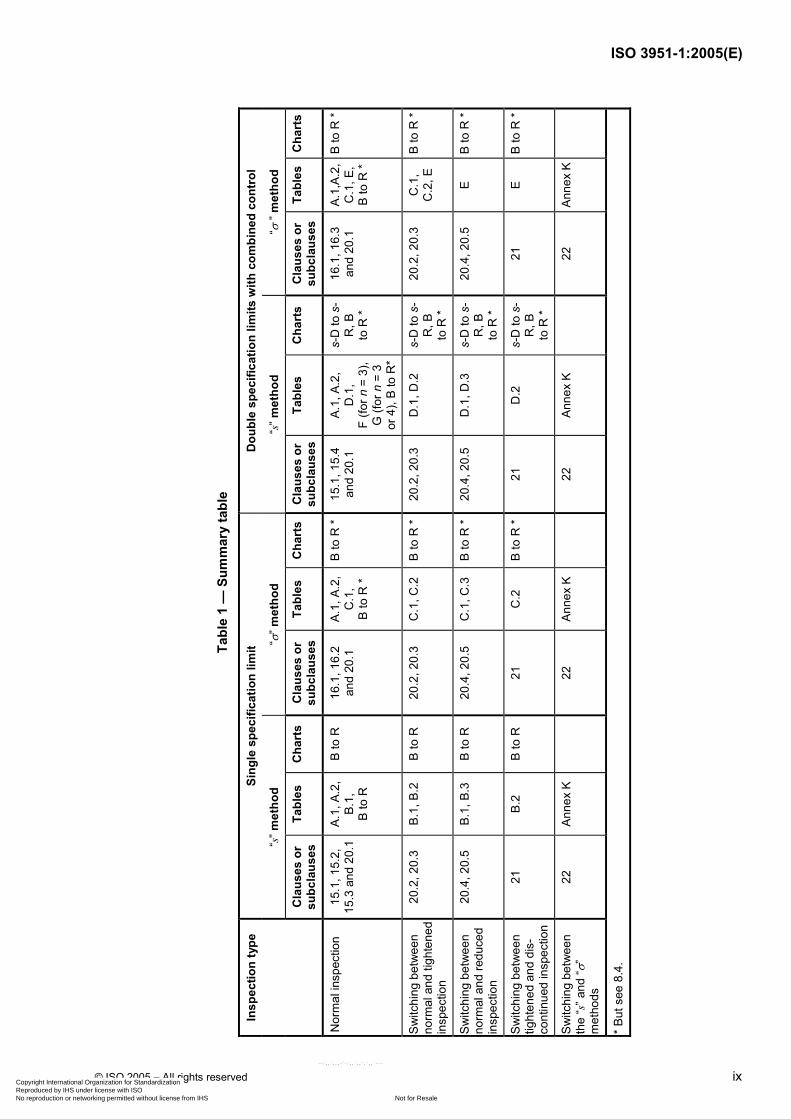
Table 1 is intended to facilitate the use of this part of ISO 3951 by directing users to the paragraphs and tables concerning any situation with which they may be confronted. Table 1 only deals with Clauses 15, 16, 20, 21 and 22; in every case, it is necessary to have first read the other clauses.
Copyright International Organization for Standardization Reproduced by IHS under license with ISO
Not for ResaleNo reproduction or networking permitted without license from IHS
--`,,`,,,-`-`,,`,,`,`,,`---
ISO 3951-1:2005(E)
© ISO 2005 – All rights reserved ix
Tabl
e 1
— S
umm
ary
tabl
e
Sing
le s
peci
ficat
ion
limit
Dou
ble
spec
ifica
tion
limits
with
com
bine
d co
ntro
l
“s” m
etho
d “σ
” met
hod
“s” m
etho
d “σ
” m
etho
d
Insp
ectio
n ty
pe
Cla
uses
or
subc
laus
es
Tabl
es
Cha
rts
Cla
uses
or
subc
laus
es
Tabl
es
Cha
rts
Cla
uses
or
subc
laus
esTa
bles
C
hart
s C
laus
es o
r su
bcla
uses
Ta
bles
C
hart
s
Nor
mal
insp
ectio
n 15
.1, 1
5.2,
15
.3 a
nd 2
0.1
A.1,
A.2
, B.
1,
B to
R
B to
R
16.1
, 16.
2
and
20.1
A.
1, A
.2,
C.1
, B
to R
*
B to
R *
15.1
, 15.
4 an
d 20
.1
A.1,
A.2
, D
.1,
F (fo
r n =
3),
G (f
or n
= 3
or
4),
B to
R*
s-D
to s
-R
, B
to R
*
16.1
, 16.
3 an
d 20
.1
A.1,
A.2,
C
.1, E
, B
to R
*
B to
R *
Switc
hing
bet
wee
n no
rmal
and
tigh
tene
d in
spec
tion
20.2
, 20.
3 B.
1, B
.2
B to
R
20.2
, 20.
3 C
.1, C
.2
B to
R *
20.2
, 20.
3 D
.1, D
.2
s-D
to s
-R
, B
to R
*
20.2
, 20.
3 C
.1,
C.2
, E
B to
R *
Switc
hing
bet
wee
n no
rmal
and
redu
ced
insp
ectio
n
20.4
, 20.
5 B.
1, B
.3
B to
R
20.4
, 20.
5 C
.1, C
.3
B to
R *
20.4
, 20.
5 D
.1, D
.3
s-D
to s
-R
, B
to R
*
20.4
, 20.
5 E
B to
R *
Switc
hing
bet
wee
n tig
hten
ed a
nd d
is-
cont
inue
d in
spec
tion
21
B.2
B to
R
21
C.2
B
to R
*21
D
.2
s-D
to s
-R
, B
to R
*
21
E B
to R
*
Switc
hing
bet
wee
n th
e “s
” and
“ σ”
met
hods
22
Anne
x K
22
An
nex
K
22
Anne
x K
22
An
nex
K
* But
see
8.4
.
Copyright International Organization for Standardization Reproduced by IHS under license with ISO
Not for ResaleNo reproduction or networking permitted without license from IHS
--`,,`,,,-`-`,,`,,`,`,,`---

Copyright International Organization for Standardization Reproduced by IHS under license with ISO
Not for ResaleNo reproduction or networking permitted without license from IHS
--`,,`,,,-`-`,,`,,`,`,,`---
INTERNATIONAL STANDARD ISO 3951-1:2005(E)
© ISO 2005 – All rights reserved 1
Sampling procedures for inspection by variables —
Part 1: Specification for single sampling plans indexed by acceptance quality limit (AQL) for lot-by-lot inspection for a single quality characteristic and a single AQL
CAUTION —The procedures in this part of ISO 3951 are not suitable for application to lots that have been screened previously for nonconforming items.
1 Scope
This part of ISO 3951 specifies an acceptance sampling system of single sampling plans for inspection by variables, in which the acceptability of a lot is implicitly determined from an estimate of the percentage of nonconforming items in the process, based on a random sample of items from the lot.
This part of ISO 3951 is primarily designed for application under the following conditions:
a) where the inspection procedure is to be applied to a continuing series of lots of discrete products all supplied by one producer using one production process;
b) where only a single quality characteristic x of these products is taken into consideration, which must be measurable on a continuous scale;
c) where the measurement error is negligible, i.e. with a standard deviation no more than 10 % of the process standard deviation;
d) where production is stable (under statistical control) and the quality characteristic x is distributed according to a normal distribution or a close approximation to the normal distribution;
e) where a contract or standard defines an upper specification limit U, a lower specification limit L, or both; an item is qualified as conforming if and only if its measured quality characteristic x satisfies the appropriate one of the following inequalities:
1) x W L (i.e. the lower specification limit is not violated);
2) x u U (i.e. the upper specification limit is not violated);
3) x W L and x u U (i.e. neither the lower nor the upper specification limit is violated).
Inequalities 1) and 2) are called cases with a single specification limit, and 3) a case with double specification limits.
If double specification limits apply, it is assumed in this part of ISO 3951 that conformance to both specification limits is equally important to the integrity of the product; in such cases it is appropriate to apply a single AQL to the combined percentage of product outside the two specification limits. This is referred to as combined control.
Copyright International Organization for Standardization Reproduced by IHS under license with ISO
Not for ResaleNo reproduction or networking permitted without license from IHS
--`,,`,,,-`-`,,`,,`,`,,`---
ISO 3951-1:2005(E)
2 © ISO 2005 – All rights reserved
2 Normative references
The following referenced documents are indispensable for the application of this document. For dated references, only the edition cited applies. For undated references, the latest edition of the referenced document (including any amendments) applies.
ISO 2859-1, Sampling procedures for inspection by attributes — Part 1: Sampling schemes indexed by acceptance quality limit (AQL) for lot-by-lot inspection
ISO 3534-1, Statistics — Vocabulary and symbols — Part 1: Probability and statistical terms
ISO 3534-2, Statistics — Vocabulary and symbols — Part 2: Applied statistics
3 Terms and definitions
For the purposes of this document, the terms and definitions given in ISO 2859-1, ISO 3534-1, and ISO 3534-2 apply.
3.1 inspection by variables inspection by measuring the magnitude of a characteristic of an item
[ISO 3534-2]
3.2 sampling inspection inspection of selected items in the group under consideration
[ISO 3534-2]
3.3 acceptance sampling inspection acceptance sampling sampling inspection (3.2) to determine whether or not to accept a lot or other amount of product, material or service
[ISO 3534-2]
3.4 acceptance sampling inspection by variables acceptance sampling inspection (3.3) in which the acceptability of the process is determined statistically from measurements on a specified quality characteristic of each item in a sample from a lot
3.5 process fraction nonconforming rate at which nonconforming items are generated by a process, expressed as a proportion
3.6 acceptance quality limit (AQL) worst tolerable process fraction nonconforming (3.5) when a continuing series of lots is submitted for acceptance sampling (3.3)
NOTE See Clause 5.
3.7 quality level quality expressed as a rate of occurrence of nonconforming units
Copyright International Organization for Standardization Reproduced by IHS under license with ISO
Not for ResaleNo reproduction or networking permitted without license from IHS
--`,,`,,,-`-`,,`,,`,`,,`---
ISO 3951-1:2005(E)
© ISO 2005 – All rights reserved 3
3.8 limiting quality LQ quality level (3.7), when a lot is considered in isolation, which, for the purposes of acceptance sampling inspection (3.3), is limited to a low probability of acceptance
[ISO 3534-2]
NOTE 1 In this part of ISO 3951, the probability of acceptance is limited to 10 %.
NOTE 2 See 13.1.
3.9 nonconformity nonfulfilment of a requirement
[ISO 9000]
3.10 nonconforming unit unit with one or more nonconformities
[ISO 3534-2]
3.11 “s” method acceptance sampling plan acceptance sampling (3.3) plan by variables using the sample standard deviation
[ISO 3534-2]
NOTE See Clause 15.
3.12 “σ” method acceptance sampling plan acceptance sampling (3.3) plan by variables using the presumed value of the process standard deviation
[ISO 3534-2]
NOTE See Clause 16.
3.13 specification limit conformance boundary specified for a characteristic
[ISO 3534-2]
3.14 lower specification limit L specification limit [3.13] that defines the lower conformance boundary
[ISO 3534-2]
3.15 upper specification limit U specification limit (3.13) that defines the upper conformance boundary
[ISO 3534-2]
Copyright International Organization for Standardization Reproduced by IHS under license with ISO
Not for ResaleNo reproduction or networking permitted without license from IHS
--`,,`,,,-`-`,,`,,`,`,,`---
ISO 3951-1:2005(E)
4 © ISO 2005 – All rights reserved
3.16 combined control requirement when both upper and lower limits are specified for the quality characteristic and an AQL (3.6) is given that applies to the combined percent nonconforming beyond the two limits
NOTE 1 See 5.3.
NOTE 2 The use of combined control implies that nonconformity beyond either specification limit (3.13) is believed to be of equal, or at least roughly equal, importance to the lack of integrity of the product.
3.17 acceptability constant k constant depending on the specified value of the acceptance quality limit (3.6) and the sample size, used in the criteria for accepting the lot in an acceptance sampling (3.3) plan by variables
[ISO 3534-2]
NOTE See 15.2 and 16.2.
3.18 quality statistic Q function of the specification limit (3.13), the sample mean, and the sample or process standard deviation, used in assessing the acceptability of a lot
[ISO 3534-2]
NOTE 1 For the case of a single specification limit (3.13), the lot may be sentenced on the result of comparing Q with the acceptability constant (3.17) k.
NOTE 2 See 15.2 and 16.2.
3.19 lower quality statistic QL function of the lower specification limit (3.14), the sample mean, and the sample or process standard deviation
NOTE 1 For a single lower specification limit (3.14), the lot is sentenced on the result of comparing QL with the acceptability constant (3.17) k.
[ISO 3534-2]
NOTE 2 See Clause 4, 15.2 and 16.2.
3.20 upper quality statistic QU function of the upper specification limit (3.15), the sample mean, and the sample or process standard deviation
NOTE 1 For a single upper specification limit (3.15) the lot is sentenced on the result of comparing QU with the acceptability constant (3.17) k.
[ISO 3534-2]
NOTE 2 See Clause 4, 15.2 and 16.2.
Copyright International Organization for Standardization Reproduced by IHS under license with ISO
Not for ResaleNo reproduction or networking permitted without license from IHS
--`,,`,,,-`-`,,`,,`,`,,`---
ISO 3951-1:2005(E)
© ISO 2005 – All rights reserved 5
3.21 maximum sample standard deviation MSSD smax largest sample standard deviation for a given sample-size code letter and acceptance quality limit (3.6) for which it is possible to satisfy the acceptance criterion for the combined control of double specification limits (3.13) when the process variability is unknown
NOTE See 15.4.
3.22 maximum process standard deviation MPSD σmax largest process standard deviation for a given sample-size code letter and acceptance quality limit (3.6) for which it is possible to satisfy the acceptance criterion for the combined control of double specification limits (3.13) under tightened inspection when the process variability is known
NOTE See 16.3.
3.23 switching rule instruction within an acceptance sampling (3.3) scheme for changing from one acceptance sampling (3.3) plan to another of greater or lesser severity based on demonstrated quality history
[ISO 3534-2]
NOTE 1 See Clause 20.
NOTE 2 Normal, tightened or reduced inspection, or discontinuation of inspection, are examples of “greater or lesser severity”.
3.24 measurement Set of operations to determine the value of some quantity
[ISO 3534-2]
4 Symbols
cU factor for determining the upper control limit for the sample standard deviation (see Annex H)
fs factor that relates the maximum sample standard deviation to the difference between U and L (see Annex D)
fσ factor that relates the maximum process standard deviation under tightened inspection to the difference between U and L (see Annex E)
k acceptability constant for the “s” method or Annex C for the “σ” method (see Annex B)
L lower specification limit (as a suffix to a variable, denotes its value at L)
µ process mean
N lot size (number of items in a lot)
n sample size (number of items in a sample)
Copyright International Organization for Standardization Reproduced by IHS under license with ISO
Not for ResaleNo reproduction or networking permitted without license from IHS
--`,,`,,,-`-`,,`,,`,`,,`---
ISO 3951-1:2005(E)
6 © ISO 2005 – All rights reserved
p estimate of the process fraction nonconforming
Lp estimate of the process fraction nonconforming below the lower specification limit
Up estimate of the process fraction nonconforming above the upper specification limit
p* maximum acceptable value for the estimate of the process fraction nonconforming
Pa probability of acceptance
Q quality statistic
QL lower quality statistic
NOTE 1 QL is defined as ( ) /x L s− when the process standard deviation is unknown, and as ( ) /x L σ− when it is presumed to be known.
QU upper quality statistic
NOTE 2 QU is defined as ( ) /U x s− when the process standard deviation is unknown, and as ( ) /U x σ− when it is presumed to be known.
s sample standard deviation of the measured values of the quality characteristic (also an estimate of the standard deviation of the process), i.e.
2( )
1
n
jj
x x
sn
−
=−
∑
(See also Annex J.)
smax maximum sample standard deviation (MSSD)
σ standard deviation of a process that is under statistical control
NOTE 3 σ2 the square of the process standard deviation, is known as the process variance.
σmax maximum process standard deviation (MPSD)
U upper specification limit (as a suffix to a variable, denotes its value at U)
xj measured value of the quality characteristic for the jth item of the sample
x arithmetic mean of the measured values of the quality characteristic in the sample, i.e.
1
n
jj
x
xn
==
∑
Copyright International Organization for Standardization Reproduced by IHS under license with ISO
Not for ResaleNo reproduction or networking permitted without license from IHS
--`,,`,,,-`-`,,`,,`,`,,`---
ISO 3951-1:2005(E)
© ISO 2005 – All rights reserved 7
5 Acceptance quality limit (AQL)
5.1 Principle
The AQL is the quality level that is the worst tolerable process fraction nonconforming when a continuing series of lots is submitted for acceptance sampling. Although individual lots with quality as bad as the acceptance quality limit may be accepted with fairly high probability, the designation of an acceptance quality limit does not suggest that this is a desirable quality level. The sampling schemes found in this part of ISO 3951, with their rules for switching and for discontinuation of sampling inspection, are designed to encourage suppliers to keep the process fractions nonconforming consistently better than the respective AQLs. Otherwise, there is a high risk that the inspection severity will be switched to tightened inspection, under which the criteria for lot acceptance become more demanding. Once on tightened inspection, unless action is taken to improve the process, it is very likely that the rule requiring discontinuation of sampling inspection will be invoked pending such improvement.
5.2 Use
The AQL, together with the sample-size code letter, is used to index the sampling plans in this part of ISO 3951.
5.3 Specifying AQLs
The AQL to be used will be designated in the product specification, contract or by the responsible authority. Where both upper and lower specification limits are given, this part of ISO 3951 addresses only the case of an overall AQL applying to the combined percent nonconforming beyond the two limits; this is known as “combined control”. (See ISO 3951-2 for “separate” and “complex” control of double specification limits.)
5.4 Preferred AQLs
The sixteen AQLs given in this part of ISO 3951, ranging in value from 0,01 % to 10 % nonconforming, are described as preferred AQLs. If, for any product or service, an AQL is designated other than a preferred AQL, then this part of ISO 3951 is not applicable (see 13.2).
5.5 Caution
From the above definition of the AQL, it follows that the desired protection can only be assured when a continuing series of lots is provided for inspection.
5.6 Limitation
The designation of an AQL shall not imply that the supplier has the right to supply knowingly any nonconforming product.
6 Switching rules for normal, tightened and reduced inspection
Switching rules discourage the producer from operating at a quality level that is worse than the AQL. This part of ISO 3951 specifies a switch to tightened inspection when inspection results indicate that the AQL is being exceeded. It further specifies a discontinuation of sampling inspection altogether if tightened inspection fails to stimulate the producer into rapidly improving his production process.
Tightened inspection and the discontinuation rule are integral, and therefore obligatory, procedures of this part of ISO 3951 if the protection implied by the AQL is to be maintained.
Copyright International Organization for Standardization Reproduced by IHS under license with ISO
Not for ResaleNo reproduction or networking permitted without license from IHS
--`,,`,,,-`-`,,`,,`,`,,`---
ISO 3951-1:2005(E)
8 © ISO 2005 – All rights reserved
This part of ISO 3951 also provides the possibility of switching to reduced inspection when inspection results indicate that the quality level is stable and reliable at a level better than the AQL. This practice is, however, optional (at the discretion of the responsible authority).
If there is sufficient evidence from the control charts (see 19.1) that the variability is in statistical control, consideration should be given to switching to the “σ” method. If this appears advantageous, the consistent value of s (the sample standard deviation) shall be taken as σ (see Clause 22).
When it has been necessary to discontinue acceptance sampling inspection, inspection under this part of ISO 3951 shall not be resumed until action has been taken by the producer to improve the quality of the submitted product.
Details of the operation of the switching rules are given in Clauses 20, 21 and 22.
7 Relation to ISO 2859-1
7.1 Similarities
a) This part of ISO 3951 is complementary to ISO 2859-1; the two documents share a common philosophy and, as far as possible, their procedures and vocabulary are the same.
b) Both use the AQL to index the sampling plans, and the preferred values used in this part of ISO 3951 are identical with those given for percent nonconforming in ISO 2859-1 (i.e. from 0,01 % to 10 %).
c) In both International Standards, lot size and inspection level (inspection level II in default of other instructions) determine a sample-size code letter. Then general tables give the sample size to be taken and the acceptability criterion, indexed by the sample-size code letter and the AQL. Separate tables are given for the “s” and “σ” methods, and for normal, tightened and reduced inspection.
d) The switching rules are essentially equivalent.
7.2 Differences
a) Determination of acceptability: Acceptability for an ISO 2859-1 attributes sampling plan for percent nonconforming is determined by the number of nonconforming items found in the sample. Acceptability for a plan for inspection by variables is based on the distance of the estimated value of the process mean from the specification limit(s) in terms of the estimated or presumed value of the process standard deviation. In this part of ISO 3951, two methods are considered: the “s” method for use when the process standard deviation σ is unknown, and the “σ” method for use when σ is presumed to be known. In the case of a single specification limit, the acceptability may be calculated from a formula (see 15.2 and 16.2), but for the “s” method it is also easily established by a graphical method (see 15.3). In the case of combined control of double specification limits under the “s” method, this part of ISO 3951 provides only for a graphical method of determining acceptability (see 15.4); for combined control of double specification limits under the “σ” method, a numerical method is given.
b) Normality: In ISO 2859 there is no requirement relating to the distribution of the characteristics. However, in this part of ISO 3951 it is necessary for the efficient operation of the plans that the measurements be distributed according to a normal distribution or a close approximation to a normal distribution.
c) Operating characteristic curves (OC curves): The OC curves of the variables plans in this part of ISO 3951 are not identical to those of the corresponding attributes plans in ISO 2859-1. The curves have been matched as closely as possible subject to a number of pragmatic constraints, such as keeping the sample size the same for a given code letter, and inspection method regardless of the AQL.
d) Producer's risk: For process quality precisely at the AQL, the producer's risk that a lot will not be accepted tends to decrease with one-step increases in sample size coupled with one-step decreases in AQL, i.e. down diagonals of the master tables running from top right to bottom left. The progressions of probabilities are similar, but not identical, to those in ISO 2859-1. (The producer's risks of the plans are given in Annex L.)
Copyright International Organization for Standardization Reproduced by IHS under license with ISO
Not for ResaleNo reproduction or networking permitted without license from IHS
--`,,`,,,-`-`,,`,,`,`,,`---
ISO 3951-1:2005(E)
© ISO 2005 – All rights reserved 9
e) Sample sizes: The variables sample sizes corresponding to given code letters are usually smaller than the attributes sample sizes for the same letters. This is particularly true for the “σ ” method. (See Table A.2.)
f) Double sampling plans: Double sampling plans are presented separately, in ISO 3951-3.
g) Multiple sampling plans: No multiple sampling plans are given in this part of ISO 3951.
h) Average Outgoing Quality Limit (AOQL): The AOQL concept applies when 100 % inspection and rectification is feasible for non-accepted lots. It follows that the AOQL concept cannot be applied under destructive or expensive testing. As variables plans are generally used under these circumstances, no tables of AOQL have been included in this part of ISO 3951.
8 Limiting quality protection
8.1 Use of individual plans
This part of ISO 3951 is intended to be used as a system employing tightened, normal and reduced inspections on a continuing series of lots to provide consumer protection, while assuring the producer that acceptance will be very likely to occur if quality is better than the AQL.
Some users may select specific individual plans from this part of ISO 3951 and use them without the switching rules. For example, a purchaser may be using the plans for verification purposes only. This is not the intended application of the system given in this part of ISO 3951 and its use in this way should not be referred to as “inspection in compliance with ISO 3951-1”. When used in such a way, this part of ISO 3951 simply represents a collection of individual plans indexed by the AQL. The operating characteristic curves and other measures of a plan so chosen shall be assessed individually from the tables provided.
8.2 Consumer's risk quality tables
If the series of lots is not long enough to allow the switching rules to be applied, it may be desirable to limit the selection of sampling plans to those, associated with a designated AQL value, that give a consumer's risk quality not worse than the specified limiting quality protection. Sampling plans for this purpose can be selected by choosing a consumer's risk quality (CRQ) and a consumer's risk to be associated with it. Annex K gives values of consumer's risk quality for the “s” method and “σ” methods corresponding to a consumer's risk of 10 %.
However, application of this part of ISO 3951 to isolated lots is deprecated, as the theory of sampling by variables applies to a process. For isolated or short series of lots, it is appropriate and more efficient to use plans for sampling by attributes, such as from ISO 2859-2. (See Reference [5].)
8.3 Producer's risk tables
Annex L gives the probability of non-acceptance under the “s” and “σ” methods for lots produced when the process fraction nonconforming equals the AQL. This probability is called the producer's risk.
8.4 Operating characteristic curves
The tables for consumer's risk quality and producer's risk provide information about only two points on the operating characteristic curves. The degree of consumer protection provided by an individual sampling plan at any process quality may, however, be judged from its operating characteristic (OC) curve. OC curves for the normal inspection “s” method sampling plans of this part of ISO 3951 are given in Charts B to R, which should be consulted when choosing a sampling plan. Also given are tables of process qualities at nine standard probabilities of acceptance for all of the “s” method sampling plans in this part of ISO 3951.
Copyright International Organization for Standardization Reproduced by IHS under license with ISO
Not for ResaleNo reproduction or networking permitted without license from IHS
--`,,`,,,-`-`,,`,,`,`,,`---
ISO 3951-1:2005(E)
10 © ISO 2005 – All rights reserved
These OC curves and tables apply to a single specification limit under the “s” method. Most of them also provide a good approximation to the “σ” method, and to the case of combined control of double specification limits, particularly for the larger sample sizes. If more accurate OC values are required for the “σ” method, refer to Annex M.
9 Planning
The choice of the most suitable variables plan, if one exists, requires experience, judgement and some knowledge both of statistics and the product to be inspected. Clauses 10 to 13 of this part of ISO 3951 are intended to help those responsible for specifying sampling plans in making this choice. They suggest the considerations that should be borne in mind when deciding whether a variables plan would be suitable, and the choices to be made when selecting an appropriate standard plan.
10 Choice between variables and attributes
The first question to consider is whether it is desirable to inspect by variables rather than by attributes. The following points should be taken into account.
a) In terms of economics, it is necessary to compare the total cost of the relatively simple inspection of a larger number of items by means of an attributes scheme with the generally more elaborate procedure required by a variables scheme, which is usually more time-consuming and costly per item.
b) In terms of the knowledge gained, the advantage lies with inspection by variables, as the information obtained indicates more precisely how good the product is. Earlier warning may therefore be given if the quality is slipping.
c) An attributes scheme can be more readily understood and accepted. For example, it may at first be difficult to accept that, when inspecting by variables, a lot can be rejected on measurements taken of a sample that does not contain any nonconforming items. (See the examples in 15.4.2 and 15.4.4.)
d) A comparison of the size of the samples required for the same AQL from standard plans for inspection by attributes (i.e. from ISO 2859-1) and the standard plans in this part of ISO 3951 is given in Table A.2. It will be seen that the smallest samples are required by the “σ” method (used when the process standard deviation is presumed to be known). The sample sizes for the “s” method (used when the process standard deviation is unknown) are also in general substantially smaller than for sampling by attributes.
e) Inspection by variables is particularly appropriate in conjunction with the use of control charts for variables.
f) Variables sampling has a substantial advantage when the inspection process is expensive, for example in the case of destructive testing.
g) A variables scheme becomes relatively more complicated to operate as the number of measurements to be taken on each item increases. (For two or more quality characteristics, this part of ISO 3951 does not apply. See ISO 3951-2 for details.)
h) The use of this part of ISO 3951 is only applicable when there is reason to believe that the distribution of measurements of the quality characteristic is normal. In case of doubt, the responsible authority should be consulted.
NOTE 1 ISO 5479 gives detailed procedures for tests for departure from normality.
NOTE 2 Departure from normality is also dealt with in ISO 2854:1976, Clause 2, which provides examples of graphical methods that can be used to verify that the distribution of the data is sufficiently normal to justify the use of sampling by variables.
Copyright International Organization for Standardization Reproduced by IHS under license with ISO
Not for ResaleNo reproduction or networking permitted without license from IHS
--`,,`,,,-`-`,,`,,`,`,,`---
ISO 3951-1:2005(E)
© ISO 2005 – All rights reserved 11
11 Choice between the “s” and “σ” methods
If it is desired to apply inspection by variables, the next question is whether to use the “s” method or the “σ” method. The “σ” method is the most economical in terms of sample size but, before this method may be employed, the value of σ has to be established.
Initially, it will be necessary to begin with the “s” method but, subject to the agreement of the responsible authority and provided the quality remains satisfactory, the standard switching rules will permit a switch to reduced inspection and the use of a smaller sample size.
The question then is, if the variability is under control and lots continue to be accepted, whether it will be economical to change to the “σ” method. The size of the sample will generally be smaller and the acceptability criterion simpler under the “σ” method (see 16.2). On the other hand, it will still be necessary to calculate the sample standard deviation, s, for record purposes and to keep the control charts up to date. (See Clause 19.) The calculation of s can appear daunting at first sight, but the difficulty is more apparent than real; this is especially true if a calculator or computer is available. Methods of determining s and σ are given in Annex J.
12 Choice of inspection level and AQL
For a standard sampling plan, the inspection level in conjunction with the size of the lots and the AQL determines the size of the sample to be taken, and governs the severity of the inspection. The appropriate OC curve from Charts B to R (see Clause 24) or appropriate table from Tables B to R (see Clause 24) show the extent of the risk that is involved in such a plan.
The choice of inspection level and AQL is governed by a number of factors, but is mainly a balance between the total cost of inspection and the consequences of nonconforming items passing into service.
The normal practice is to use inspection level II, unless special circumstances indicate that another level is more appropriate.
13 Choice of sampling plan
13.1 Standard plans
The standard procedure can be used only when the production of lots is continuous.
This standard procedure, with its semi-automatic steps from lot size to sample size, using inspection level II and beginning with the “s” method, has been found in practice to produce workable sampling plans; but it rests on the assumption that the order of priority is first the AQL, second the sample size and last, the limiting quality.
The acceptability of this system is due to the fact that the consumer is protected by the switching rules (see Clauses 20, 21 and 22), which quickly increase the severity of inspection and finally terminate inspection altogether if the quality of the process remains worse than the AQL.
NOTE It is pointed out that the limiting quality is the quality which, if offered for inspection, would have a 10 % probability of acceptance. The actual risk taken by the consumer varies according to the probability that goods of such a low quality are offered for inspection.
However, if, in certain circumstances, the limiting quality has a higher priority than the sample size (for example, when only a limited number of lots is being produced), a suitable plan in this part of ISO 3951 may be selected by using Chart A (see Clause 23). Construct a vertical line through the acceptable value for the limiting quality and a horizontal line through the desired quality with a 95 percent probability of acceptance (i.e. approximately equal to the AQL). The point of intersection of these two lines will lie on, or under, a line indexed with the sample-size code letter of a standard normal inspection plan, which meets the specified requirements. This should be verified by inspecting the OC curve from among Charts B to R (see Clause 24) relating to this code letter and AQL.
Copyright International Organization for Standardization Reproduced by IHS under license with ISO
Not for ResaleNo reproduction or networking permitted without license from IHS
--`,,`,,,-`-`,,`,,`,`,,`---
ISO 3951-1:2005(E)
12 © ISO 2005 – All rights reserved
EXAMPLE Suppose that an acceptable value for the limiting quality is 1,5 % nonconforming and that the desired quality with a 95 % probability of acceptance is 0,15 % nonconforming. A vertical line on Chart A at 1,5 % nonconforming and a horizontal line at 0,15 % nonconforming intersect just below the sloping line indexed by the letter L. Examining Chart L, it is seen that a plan with sample-size code letter L and AQL 0,15% meets the requirements.
If the lines intersect at a point above the line marked R in Chart A, this implies that a sample of over 250 would be necessary for the “s” method and the specification cannot be met by any of the plans in this part of ISO 3951.
13.2 Special plans
If standard plans are not acceptable, it will be necessary to devise a special plan. It then has to be decided which combination of AQL, limiting quality, and sample size is most suitable, remembering that these are not independent since, when any two have been chosen, the third follows.
This choice is not completely unfettered; the fact that the size of the sample is necessarily a whole number imposes some limitations. If a special scheme is necessary, it should be devised only with the assistance of a statistician experienced in quality control.
14 Preliminary operations
Before starting inspection by variables,
a) check that production is considered to be continuous and that the distribution of the quality characteristic can be considered to be normal;
NOTE 1 For tests for departure from normality, see ISO 5479.
NOTE 2 If lots have been screened for nonconforming items prior to acceptance sampling, then the distribution will have been truncated and this part of ISO 3951 will not be applicable.
b) check whether the “s” method is to be used initially or whether the standard deviation is stable and known, in which case the “σ” method should be used;
c) check that the inspection level to be used has been designated. If none has been given, inspection level II shall be used;
d) check, for a quality characteristic with double specification limits, that nonconformities beyond each limit are of equal importance. If this is not the case, refer to ISO 3951-2;
e) check that an AQL has been designated, and that it is one of the preferred AQLs for use with this part of ISO 3951. If it is not, then the tables are not applicable.
15 Standard procedure for the “s” method
15.1 Obtaining a plan, sampling and preliminary calculations
The procedure for obtaining and implementing a plan is as follows.
a) With the inspection level given (normally this will be II) and with the lot size, obtain the sample-size code letter using Table A.1.
b) For a single specification limit, enter Table B.1, B.2 or B.3 as appropriate with this code letter and the AQL, and obtain the sample size n and the acceptability constant k. For combined control of double specification limits when the sample size is 5 or more, find the appropriate acceptance curve from among Charts s-D to s-R.
Copyright International Organization for Standardization Reproduced by IHS under license with ISO
Not for ResaleNo reproduction or networking permitted without license from IHS
--`,,`,,,-`-`,,`,,`,`,,`---
ISO 3951-1:2005(E)
© ISO 2005 – All rights reserved 13
c) Take a random sample of size n, measure the characteristic x in each item and then calculate ,x the sample mean and s, the sample standard deviation (see Annex J). If x is outside the specification limit(s), the lot can be judged unacceptable without even calculating s. It is, however, necessary to calculate s for record purposes.
15.2 Acceptability criteria for single specification limits
If single specification limits are given, calculate the quality statistic
UU xQ
s−
=
or
Lx LQ
s−
=
as appropriate, then compare the quality statistic (QU or QL) with the acceptability constant k obtained from either Table B.1, B.2 or B.3 for normal, tightened or reduced inspection respectively. If the quality statistic is greater than or equal to the acceptability constant, the lot is acceptable; if less, then it is not acceptable.
Thus, if only the upper specification limit U is given, the lot is
acceptable if QU W k,
not acceptable if QU u k,
or, if only the lower specification limit L is given, the lot is
acceptable if QL W k,
not acceptable if QL u k.
EXAMPLE 1 Single, upper specification limit
The maximum temperature of operation for a certain device is specified as 60 °C. Production is inspected in lots of 100 items. Inspection level II, normal inspection with AQL = 2,5 % is to be used. From Table A.1, the sample-size code letter is F; from Table B.1 it is seen that a sample size of 13 is required and that the acceptability constant k is 1,405. Suppose that the measurements are as follows: 53 °C; 57 °C; 49 °C; 58 °C; 59 °C; 54 °C; 58 °C; 56 °C; 50 °C; 50 °C; 55 °C; 54 °C; 57 °C; compliance with the acceptability criterion is to be determined.
Information needed Values obtained
Sample size: n 13
Sample mean: 1
1 n
jj
x xn =
= ∑ 54,615 °C
Sample standard deviation: 2
1( ) /( 1)
n
jj
s x x n=
= − −∑ 3,330 °C
(See J.1.2, Annex J.)
Specification limit (upper): U 60 °C
Copyright International Organization for Standardization Reproduced by IHS under license with ISO
Not for ResaleNo reproduction or networking permitted without license from IHS
--`,,`,,,-`-`,,`,,`,`,,`---
ISO 3951-1:2005(E)
14 © ISO 2005 – All rights reserved
Upper quality statistic: U ( ) /Q U x s= − 1,617
Acceptability constant: k (see Table B.1) 1,405
Acceptability criterion: Is QU W k? Yes (1,617 > 1,405)
The lot meets the acceptability criterion, and is therefore acceptable.
EXAMPLE 2 Single, lower specification limit, requiring the use of an arrow in the master table.
A certain pyrotechnic delay mechanism has a specified minimum delay time of 4,0 s. Production is inspected in lots of 1 000 items and inspection level II, normal inspection, is to be used with an AQL of 0,1 % applied to the lower limit. From Table A.1 it is seen that the sample-size code letter is J, and from Table A.2 it is seen that the sample size is 35 for the “s” method. However, on entering Table B.1 with sample-size code letter J and AQL 0,1 %, it is found that there is an arrow pointing to the cell below. This means that an entirely suitable plan is unavailable, and the next best plan is given by sample-size code letter K, i.e. sample size 50 and acceptability constant k = 2,569. A random sample of size 50 is drawn. Suppose the sample delay times, in seconds, are as follows:
6,95 6,04 6,68 6,63 6,65 6,52 6,59 6,86 6,57 6,91
6,40 6,44 6,34 6,04 6,15 6,29 6,63 6,70 6,67 6,67
6,44 7,15 6,70 6,59 6,51 6,80 5,94 5,92 6,56 6,53
6,35 7,17 6,83 6,25 6,96 7,00 6,38 6,83 6,29 6,39
6,80 5,84 6,16 6,25 6,57 6,71 6,77 6,55 6,87 6,25
Compliance with the acceptability criterion is to be determined.
Information needed Values obtained
Sample size: n 50
Sample mean: 1
1 n
jj
x xn =
= ∑ 6,542 s
Sample standard deviation: 2
1( ) /( 1)
n
jj
s x x n=
= − −∑ 0,3120 s
(See J.1.2, Annex J.)
Lower specification limit: L 4,0 s
Lower quality statistic: L ( ) /Q x L s= − 8,147
Acceptability constant: k (see Table B.1) 2,569
Acceptability criterion: Is QL W k? Yes (8,147 > 2,569)
The lot meets the acceptability criteria, so it is acceptable.
15.3 Graphical method for a single specification limit
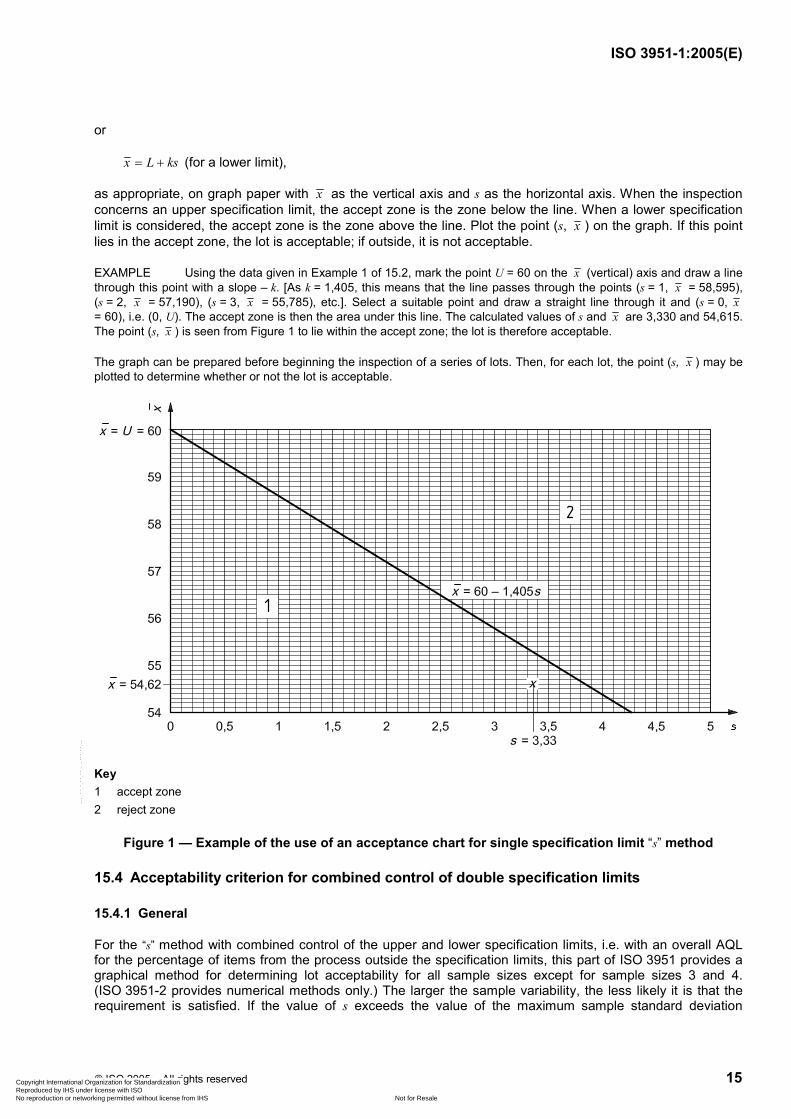
When a graphical criterion is desired, draw the line
x U ks= − (for an upper limit)
Copyright International Organization for Standardization Reproduced by IHS under license with ISO
Not for ResaleNo reproduction or networking permitted without license from IHS
--`,,`,,,-`-`,,`,,`,`,,`---
ISO 3951-1:2005(E)
© ISO 2005 – All rights reserved 15
or
x L ks= + (for a lower limit),
as appropriate, on graph paper with x as the vertical axis and s as the horizontal axis. When the inspection concerns an upper specification limit, the accept zone is the zone below the line. When a lower specification limit is considered, the accept zone is the zone above the line. Plot the point (s, x ) on the graph. If this point lies in the accept zone, the lot is acceptable; if outside, it is not acceptable.
EXAMPLE Using the data given in Example 1 of 15.2, mark the point U = 60 on the x (vertical) axis and draw a line through this point with a slope – k. [As k = 1,405, this means that the line passes through the points (s = 1, x = 58,595), (s = 2, x = 57,190), (s = 3, x = 55,785), etc.]. Select a suitable point and draw a straight line through it and (s = 0, x = 60), i.e. (0, U). The accept zone is then the area under this line. The calculated values of s and x are 3,330 and 54,615. The point (s, x ) is seen from Figure 1 to lie within the accept zone; the lot is therefore acceptable.
The graph can be prepared before beginning the inspection of a series of lots. Then, for each lot, the point (s, x ) may be plotted to determine whether or not the lot is acceptable.
Key 1 accept zone 2 reject zone
Figure 1 — Example of the use of an acceptance chart for single specification limit “s” method
15.4 Acceptability criterion for combined control of double specification limits
15.4.1 General
For the “s” method with combined control of the upper and lower specification limits, i.e. with an overall AQL for the percentage of items from the process outside the specification limits, this part of ISO 3951 provides a graphical method for determining lot acceptability for all sample sizes except for sample sizes 3 and 4. (ISO 3951-2 provides numerical methods only.) The larger the sample variability, the less likely it is that the requirement is satisfied. If the value of s exceeds the value of the maximum sample standard deviation
Copyright International Organization for Standardization Reproduced by IHS under license with ISO
Not for ResaleNo reproduction or networking permitted without license from IHS
--`,,`,,,-`-`,,`,,`,`,,`---
ISO 3951-1:2005(E)
16 © ISO 2005 – All rights reserved
(MSSD) obtained from Table D.1, D.2 or D.3, no further calculation or reference to graphs is required, since the lot shall be immediately judged unacceptable.
Numerical methods are provided for the combined control of double specification limits for sample sizes 3 and 4.
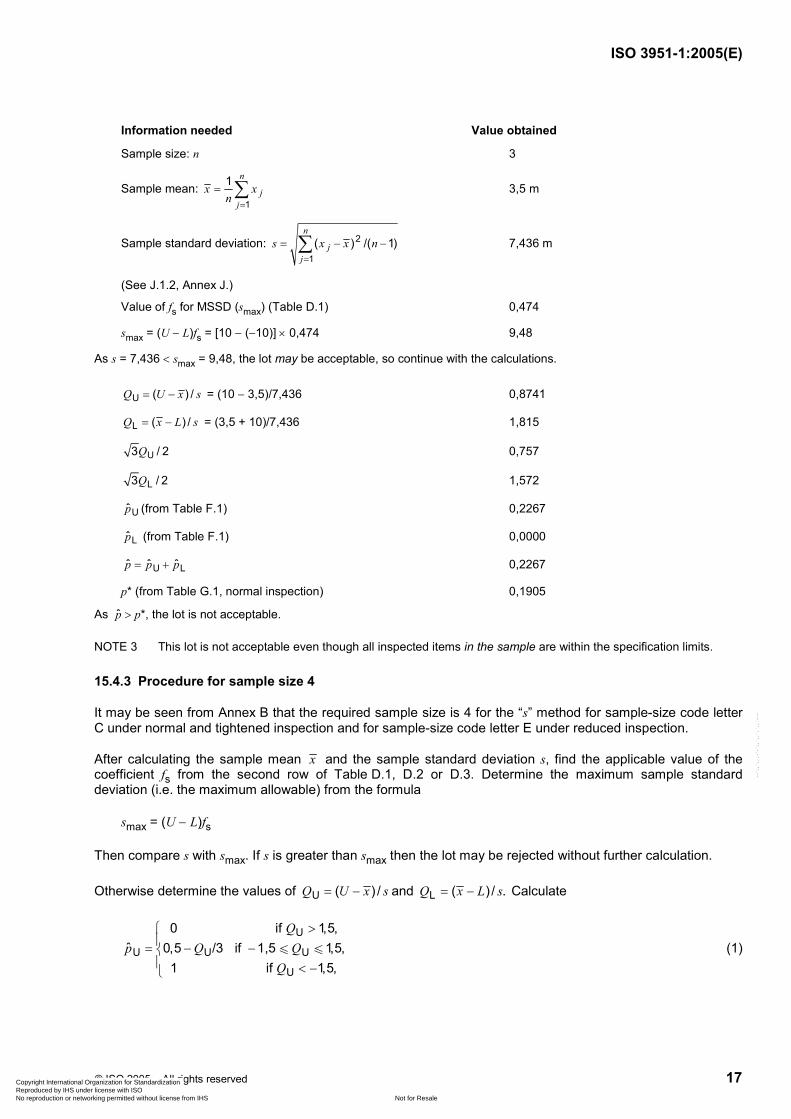
15.4.2 Procedure for sample size 3
It may be seen from Annex B that the required sample size is 3 for the “s” method for sample-size code letter B under normal and tightened inspection and for sample-size code letters B to D under reduced inspection.
After calculating the sample mean x and the sample standard deviation s, find the applicable value of the coefficient fs from the first row of Table D.1, D.2 or D.3. Determine the maximum sample standard deviation (i.e. the maximum allowable) from the formula
smax = (U − L)fs
Then compare s with smax. If s is greater than smax then the lot may be rejected without further calculation.
Otherwise, determine the values of U ( ) /Q U x s= − and L ( ) / .Q x L s= − Multiply QU and QL by 3 / 2 (i.e. approximately 0,866) and use Table F.1 to determine the estimates Up and Lp of the fraction of items in the process that are nonconforming beyond the upper and lower limits respectively.
NOTE 1 Negative values of Q correspond to estimates of the process fraction nonconforming in excess of 0,5 at that specification limit and will consequently always result in lot non-acceptance under the provisions of this part of ISO 3951. However, in order to obtain a numerical value for record-keeping purposes, the estimate of the process fraction nonconforming can be obtained by entering Table F.1 with the absolute value of 3 / 2Q and subtracting the result from 1,0. For example if QU = −0,156 then U3 / 2Q = −0,135; entering Table F.1 with 0,135 gives an estimate of 0,4569; subtracting this from 1,0 gives Up = 0,5431.
NOTE 2 The basis of Table F.1 is given in Annex K. Instead of using Table F.1, the estimate of the process fraction nonconforming beyond each specification limit when n = 3 may be calculated directly as
0 if 2 / 3,2ˆ arc sin (1 3 / 2) / 2 if 2 / 3 2 / 3,
1 if 2 / 3.
Q
p Q Q
Q
>= − − π
< −
u u
These two estimates must be added to obtain the estimate U Lˆ ˆ ˆp p p= + of the overall process fraction nonconforming. If p does not exceed the applicable maximum allowable value, p*, given in Table G.1, the lot is considered to be
acceptable; otherwise, the lot is considered to be not acceptable.
EXAMPLE Determination of acceptability for combined control of double specification limits when the sample size is 3.
Torpedoes supplied in batches of 100 are to be inspected for accuracy in the horizontal plane. Positive or negative angular errors are equally unacceptable, so combined control of the double specification limits is appropriate. The specification limits are set at 10 m either side of the target point at a distance of 1 km, with an AQL of 4 %. Because testing is destructive and very costly, it has been agreed between the producer and the responsible authority that special inspection level S-2 is to be used. From Table A.1, the sample-size code letter is found to be B. From Table A.2, it is seen that a sample of size 3 is required. Three torpedoes are tested, yielding errors of −5,0 m, 6,7 m and 8,8 m. Compliance with the acceptability criterion under normal inspection is to be determined.
Copyright International Organization for Standardization Reproduced by IHS under license with ISO
Not for ResaleNo reproduction or networking permitted without license from IHS
--`,,`,,,-`-`,,`,,`,`,,`---
ISO 3951-1:2005(E)
© ISO 2005 – All rights reserved 17
Information needed Value obtained
Sample size: n 3
Sample mean: 1
1 n
jjx x
n =
= ∑ 3,5 m
Sample standard deviation: 2
1( ) /( 1)
n
jjs x x n
=
= − −∑ 7,436 m
(See J.1.2, Annex J.)
Value of fs for MSSD (smax) (Table D.1) 0,474
smax = (U − L)fs = [10 − (−10)] × 0,474 9,48
As s = 7,436 < smax = 9,48, the lot may be acceptable, so continue with the calculations.
U ( ) /Q U x s= − = (10 − 3,5)/7,436 0,8741
L ( ) /Q x L s= − = (3,5 + 10)/7,436 1,815
U3 / 2Q 0,757
L3 / 2Q 1,572
Up (from Table F.1) 0,2267
Lp (from Table F.1) 0,0000
U Lˆ ˆ ˆp p p= + 0,2267
p* (from Table G.1, normal inspection) 0,1905
As p > p*, the lot is not acceptable.
NOTE 3 This lot is not acceptable even though all inspected items in the sample are within the specification limits.
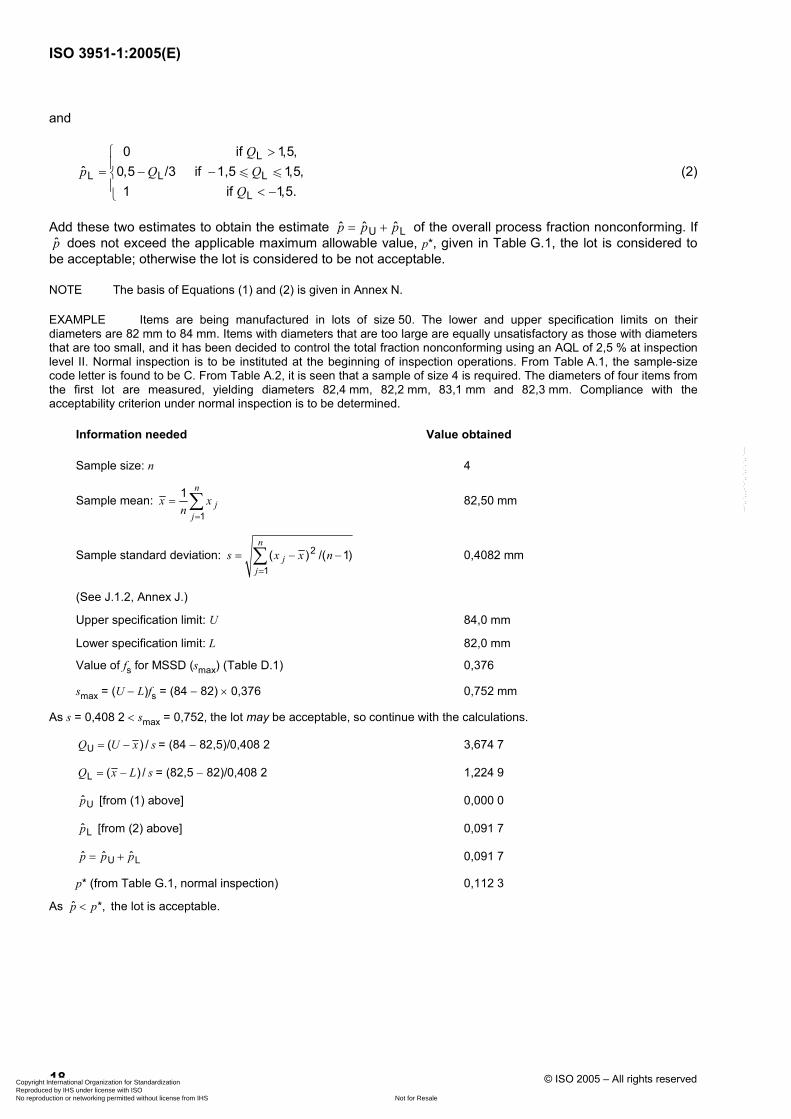
15.4.3 Procedure for sample size 4
It may be seen from Annex B that the required sample size is 4 for the “s” method for sample-size code letter C under normal and tightened inspection and for sample-size code letter E under reduced inspection.
After calculating the sample mean x and the sample standard deviation s, find the applicable value of the coefficient fs from the second row of Table D.1, D.2 or D.3. Determine the maximum sample standard deviation (i.e. the maximum allowable) from the formula
smax = (U − L)fs
Then compare s with smax. If s is greater than smax then the lot may be rejected without further calculation.
Otherwise determine the values of U ( ) /Q U x s= − and L ( ) / .Q x L s= − Calculate
U
U U U
U
0 if 1,5,ˆ 0,5 /3 if 1,5 1,5,
1 if 1,5,
Qp Q Q
Q
>= − − < −
u u (1)
Copyright International Organization for Standardization Reproduced by IHS under license with ISO
Not for ResaleNo reproduction or networking permitted without license from IHS
--`,,`,,,-`-`,,`,,`,`,,`---
ISO 3951-1:2005(E)
18 © ISO 2005 – All rights reserved
and
L
L L L
L
0 if 1,5,ˆ 0,5 /3 if 1,5 1,5,
1 if 1,5.
Qp Q Q
Q
>= − − < −
u u (2)
Add these two estimates to obtain the estimate U Lˆ ˆ ˆp p p= + of the overall process fraction nonconforming. If p does not exceed the applicable maximum allowable value, p*, given in Table G.1, the lot is considered to
be acceptable; otherwise the lot is considered to be not acceptable.
NOTE The basis of Equations (1) and (2) is given in Annex N.
EXAMPLE Items are being manufactured in lots of size 50. The lower and upper specification limits on their diameters are 82 mm to 84 mm. Items with diameters that are too large are equally unsatisfactory as those with diameters that are too small, and it has been decided to control the total fraction nonconforming using an AQL of 2,5 % at inspection level II. Normal inspection is to be instituted at the beginning of inspection operations. From Table A.1, the sample-size code letter is found to be C. From Table A.2, it is seen that a sample of size 4 is required. The diameters of four items from the first lot are measured, yielding diameters 82,4 mm, 82,2 mm, 83,1 mm and 82,3 mm. Compliance with the acceptability criterion under normal inspection is to be determined.
Information needed Value obtained
Sample size: n 4
Sample mean: 1
1 n
jj
x xn =
= ∑ 82,50 mm
Sample standard deviation: 2
1( ) /( 1)
n
jj
s x x n=
= − −∑ 0,4082 mm
(See J.1.2, Annex J.)
Upper specification limit: U 84,0 mm
Lower specification limit: L 82,0 mm
Value of fs for MSSD (smax) (Table D.1) 0,376
smax = (U − L)fs = (84 − 82) × 0,376 0,752 mm
As s = 0,408 2 < smax = 0,752, the lot may be acceptable, so continue with the calculations.
U ( ) /Q U x s= − = (84 − 82,5)/0,408 2 3,674 7
L ( ) /Q x L s= − = (82,5 − 82)/0,408 2 1,224 9
Up [from (1) above] 0,000 0
Lp [from (2) above] 0,091 7
U Lˆ ˆ ˆp p p= + 0,091 7
p* (from Table G.1, normal inspection) 0,112 3
As ˆ *,p p< the lot is acceptable.
Copyright International Organization for Standardization Reproduced by IHS under license with ISO
Not for ResaleNo reproduction or networking permitted without license from IHS
--`,,`,,,-`-`,,`,,`,`,,`---
ISO 3951-1:2005(E)
© ISO 2005 – All rights reserved 19
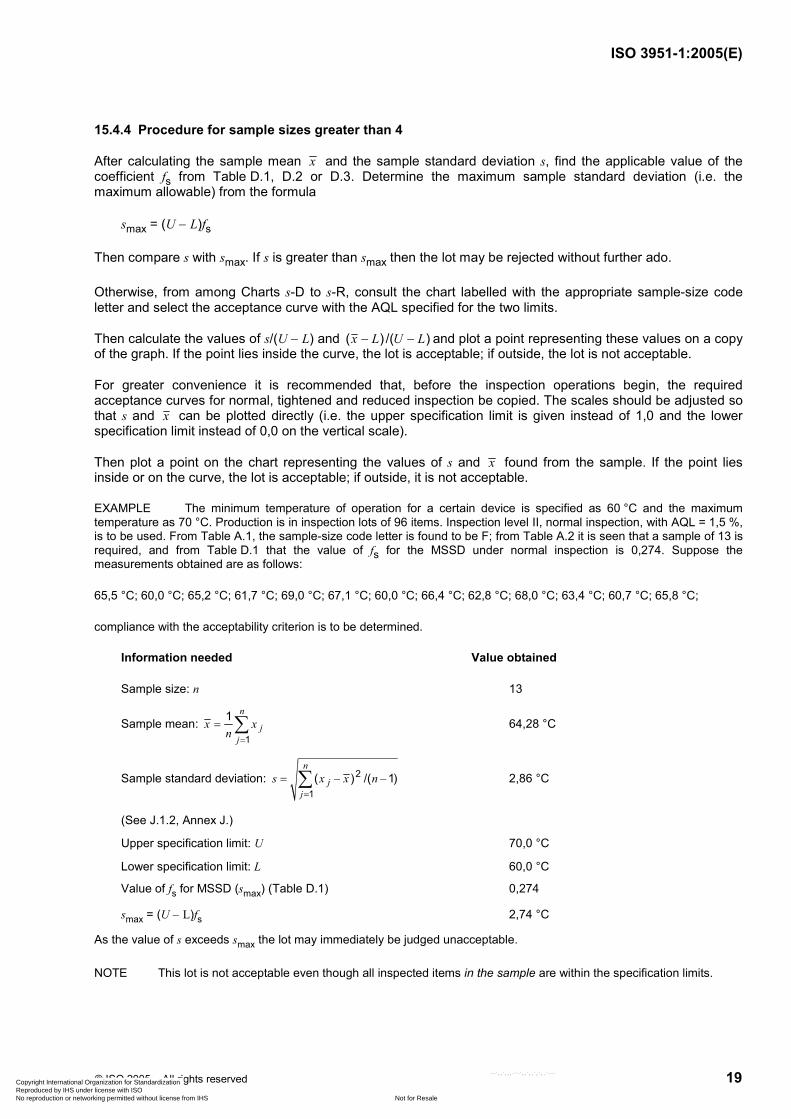
15.4.4 Procedure for sample sizes greater than 4
After calculating the sample mean x and the sample standard deviation s, find the applicable value of the coefficient fs from Table D.1, D.2 or D.3. Determine the maximum sample standard deviation (i.e. the maximum allowable) from the formula
smax = (U − L)fs
Then compare s with smax. If s is greater than smax then the lot may be rejected without further ado.
Otherwise, from among Charts s-D to s-R, consult the chart labelled with the appropriate sample-size code letter and select the acceptance curve with the AQL specified for the two limits.
Then calculate the values of s/(U − L) and ( ) /( )x L U L− − and plot a point representing these values on a copy of the graph. If the point lies inside the curve, the lot is acceptable; if outside, the lot is not acceptable.
For greater convenience it is recommended that, before the inspection operations begin, the required acceptance curves for normal, tightened and reduced inspection be copied. The scales should be adjusted so that s and x can be plotted directly (i.e. the upper specification limit is given instead of 1,0 and the lower specification limit instead of 0,0 on the vertical scale).
Then plot a point on the chart representing the values of s and x found from the sample. If the point lies inside or on the curve, the lot is acceptable; if outside, it is not acceptable.
EXAMPLE The minimum temperature of operation for a certain device is specified as 60 °C and the maximum temperature as 70 °C. Production is in inspection lots of 96 items. Inspection level II, normal inspection, with AQL = 1,5 %, is to be used. From Table A.1, the sample-size code letter is found to be F; from Table A.2 it is seen that a sample of 13 is required, and from Table D.1 that the value of fs for the MSSD under normal inspection is 0,274. Suppose the measurements obtained are as follows:
65,5 °C; 60,0 °C; 65,2 °C; 61,7 °C; 69,0 °C; 67,1 °C; 60,0 °C; 66,4 °C; 62,8 °C; 68,0 °C; 63,4 °C; 60,7 °C; 65,8 °C;
compliance with the acceptability criterion is to be determined.
Information needed Value obtained
Sample size: n 13
Sample mean: 1
1 n
jj
x xn =
= ∑ 64,28 °C
Sample standard deviation: 2
1( ) /( 1)
n
jj
s x x n=
= − −∑ 2,86 °C
(See J.1.2, Annex J.)
Upper specification limit: U 70,0 °C
Lower specification limit: L 60,0 °C
Value of fs for MSSD (smax) (Table D.1) 0,274
smax = (U − L)fs 2,74 °C
As the value of s exceeds smax the lot may immediately be judged unacceptable.
NOTE This lot is not acceptable even though all inspected items in the sample are within the specification limits.
Copyright International Organization for Standardization Reproduced by IHS under license with ISO
Not for ResaleNo reproduction or networking permitted without license from IHS
--`,,`,,,-`-`,,`,,`,`,,`---
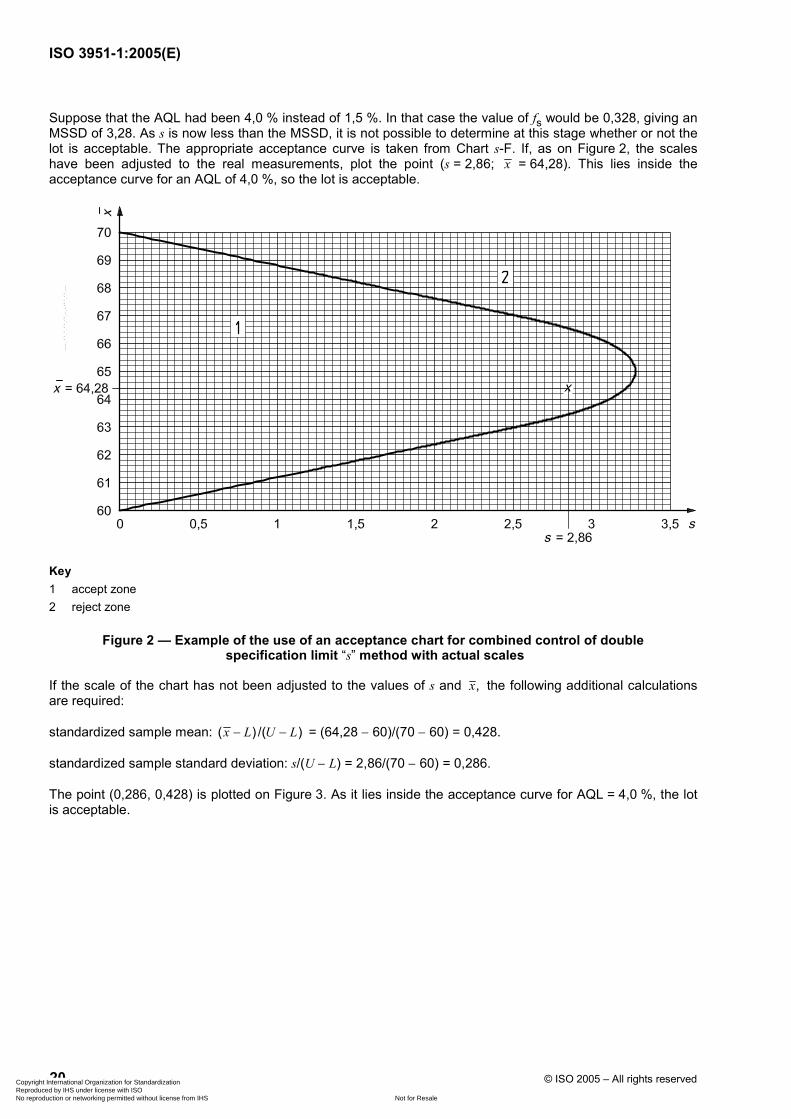
ISO 3951-1:2005(E)
20 © ISO 2005 – All rights reserved
Suppose that the AQL had been 4,0 % instead of 1,5 %. In that case the value of fs would be 0,328, giving an MSSD of 3,28. As s is now less than the MSSD, it is not possible to determine at this stage whether or not the lot is acceptable. The appropriate acceptance curve is taken from Chart s-F. If, as on Figure 2, the scales have been adjusted to the real measurements, plot the point (s = 2,86; x = 64,28). This lies inside the acceptance curve for an AQL of 4,0 %, so the lot is acceptable.
Key 1 accept zone 2 reject zone
Figure 2 — Example of the use of an acceptance chart for combined control of double specification limit “s” method with actual scales
If the scale of the chart has not been adjusted to the values of s and ,x the following additional calculations are required:
standardized sample mean: ( ) /( )x L U L− − = (64,28 − 60)/(70 − 60) = 0,428.
standardized sample standard deviation: s/(U − L) = 2,86/(70 − 60) = 0,286.
The point (0,286, 0,428) is plotted on Figure 3. As it lies inside the acceptance curve for AQL = 4,0 %, the lot is acceptable.
Copyright International Organization for Standardization Reproduced by IHS under license with ISO
Not for ResaleNo reproduction or networking permitted without license from IHS
--`,,`,,,-`-`,,`,,`,`,,`---
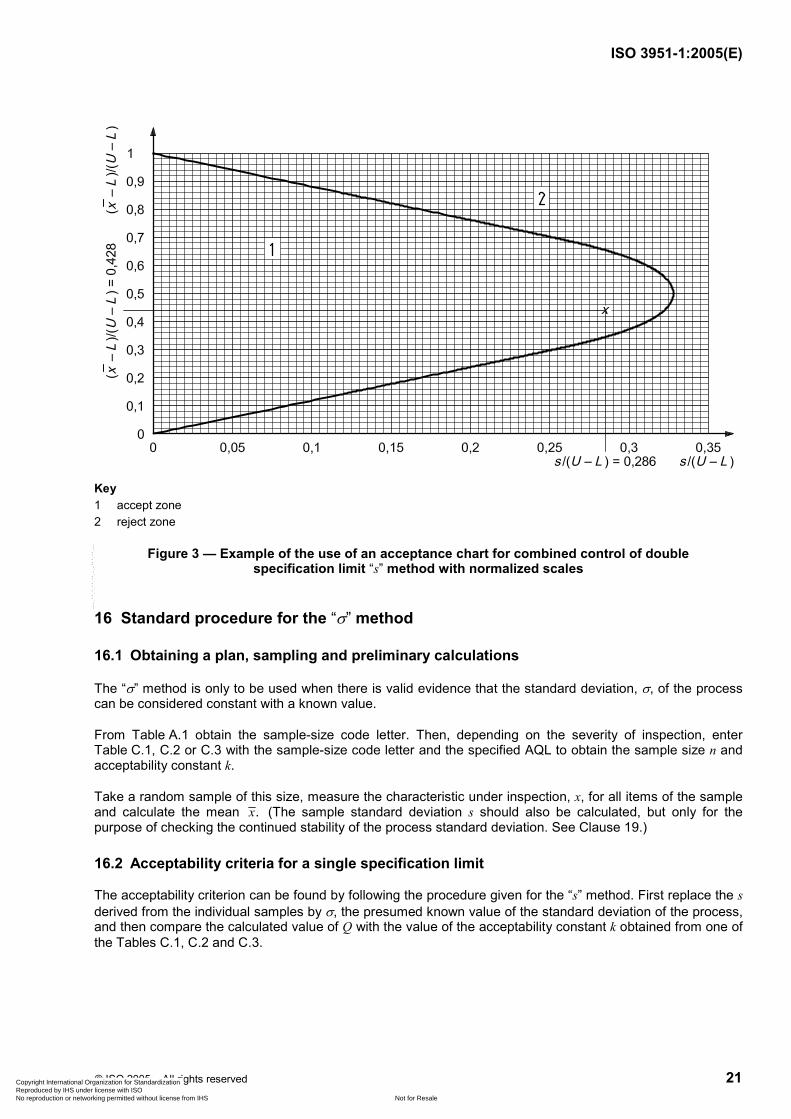
ISO 3951-1:2005(E)
© ISO 2005 – All rights reserved 21
Key 1 accept zone 2 reject zone
Figure 3 — Example of the use of an acceptance chart for combined control of double specification limit “s” method with normalized scales
16 Standard procedure for the “σ” method
16.1 Obtaining a plan, sampling and preliminary calculations
The “σ” method is only to be used when there is valid evidence that the standard deviation, σ, of the process can be considered constant with a known value.
From Table A.1 obtain the sample-size code letter. Then, depending on the severity of inspection, enter Table C.1, C.2 or C.3 with the sample-size code letter and the specified AQL to obtain the sample size n and acceptability constant k.
Take a random sample of this size, measure the characteristic under inspection, x, for all items of the sample and calculate the mean .x (The sample standard deviation s should also be calculated, but only for the purpose of checking the continued stability of the process standard deviation. See Clause 19.)
16.2 Acceptability criteria for a single specification limit
The acceptability criterion can be found by following the procedure given for the “s” method. First replace the s derived from the individual samples by σ, the presumed known value of the standard deviation of the process, and then compare the calculated value of Q with the value of the acceptability constant k obtained from one of the Tables C.1, C.2 and C.3.
Copyright International Organization for Standardization Reproduced by IHS under license with ISO
Not for ResaleNo reproduction or networking permitted without license from IHS
--`,,`,,,-`-`,,`,,`,`,,`---
ISO 3951-1:2005(E)
22 © ISO 2005 – All rights reserved
Note, for example, that the acceptability criterion U [ ( ) / ] Q U x kσ= − W for an upper specification may be written as x U kσ−u . As U, k and σ are all known in advance, the acceptance value U [ ]x U kσ= − should therefore be determined before inspection begins. For an upper specification limit, a lot will be
acceptable if U [= ];x x U kσ−u not acceptable if U [= ].x x U kσ> −
Similarly, for a lower specification limit, a lot will be
acceptable if L [ ];x x L kσ= +W not acceptable if L [ ].x x L kσ< = +
EXAMPLE The specified minimum yield point for certain steel castings is 400 N/mm2. A lot of 500 items is submitted for inspection. Inspection level II, normal inspection, with AQL = 1,5 %, is to be used. The value of σ is considered to be 21 N/mm2. From Table A.1 it is seen that the sample-size code letter is H. Then, from Table C.1, it is seen that for an AQL of 1,5 % the sample size n is 12 and the acceptability constant k is 1,613. Assume that the yield points of the sample specimens are 431; 417; 469; 407; 450; 452; 427; 411; 429; 420; 400; 445. Compliance with the acceptability criterion is to be determined.
Information needed Value obtained
Acceptability constant: k 1,613
Known: σ 21 N/mm2
Product: kσ 33,9 N/mm2
Specification limit: L 400 N/mm2
Acceptance value: Lx L kσ= + 433,9 N/mm2
Sum of measurement results: 1
n
jj
x=
∑ 5 184 N/mm2
Sample size: n 12
Sample mean: 1
1 n
jj
x xn =
= ∑ 429,8 N/mm2
Acceptability criterion: is L ?x xW No
The sample mean of the lot does not meet the acceptability criterion, so the lot is not acceptable.
16.3 Acceptability criterion for combined control of double specification limits
For combined control of the upper and the lower specification limits, i.e. where there is an overall AQL for the percentage of the process outside the specification limits, the following procedure is recommended.
a) Before sampling, enter Table E.1 with the AQL to determine the value of the factor fσ
b) Calculate the maximum allowable value of the process standard deviation, using the formula σmax = (U − L)fσ for the MPSD.
c) Compare the value of the process standard deviation σ with σmax. If σ exceeds σmax the process is unacceptable and sampling inspection is pointless until it is demonstrated that the process variability has been adequately reduced.
d) If σ u σmax then use the lot size and given inspection level to determine the sample-size code letter from Table A.1.
e) From the sample-size code letter and inspection severity (i.e. whether inspection is normal, tightened or reduced) determine the sample size, n, and acceptability constant, k, from Table C.1, C.2 or C.3 as appropriate.
Copyright International Organization for Standardization Reproduced by IHS under license with ISO
Not for ResaleNo reproduction or networking permitted without license from IHS
--`,,`,,,-`-`,,`,,`,`,,`---
ISO 3951-1:2005(E)
© ISO 2005 – All rights reserved 23
f) Calculate the upper allowable bound, U,x to sample means from the formula U ,x U kσ= − and the lower allowable bound Lx from the formula L .x L kσ= +
g) Select a random sample of size n from the lot and calculate the sample mean x . The acceptability criterion is: If L U,x x xu u the lot is acceptable; if Lx x< or U,x x> the lot is not acceptable.
EXAMPLE The specification for electrical resistance of a certain electrical component is (520 ± 50) Ω. Production is at a rate of 2 500 items per inspection lot. Inspection level II, normal inspection, with a single AQL of 4 %, is to be used for the two specification limits (470 and 570). The value of σ is known to be 21,0. Entering Table A.1 with the lot size and inspection level, it is found that the sample-size code letter is K; from Table A.2 it is seen that a sample size of 18 is required under normal inspection. Suppose the values of the sample resistance, in ohms, are as follows: 515; 491; 479; 507; 543; 521; 536; 483; 509; 514; 507; 484; 526; 552; 499; 530; 512; 492.
Information needed Value obtained
Factor from Table E.1: fσ 0,223
Upper specification limit: U 570 Ω
Lower specification limit: L 470 Ω
Maximum process standard deviation, σmax = (U − L) fσ 22,3 Ω
Known: σ 21,0 Ω
(As σ is less than σmax, the sample is analysed further for lot acceptability.)
Sample size: n 18
Acceptability constant (from Table C.1) 1,340
Upper bound for x : Ux U kσ= − 541,9 Ω
Lower bound for x : Lx L kσ= + 498,1 Ω
Sum of measurement results: 1
n
jj
x=
∑ 9 200 Ω
Sample mean: 1
1 n
jj
x xn =
= ∑ 511,1 Ω
As x at 511,1 Ω lies between the acceptance limits for x of 498,1 Ω and 541,9 Ω, the lot is acceptable.
All the calculations other than the last two lines should be completed before sampling begins.
If, for example, σ had been known to be 25, then σ exceeds the MPSD and therefore sampling inspection should not even have taken place.
17 Procedure during continuing inspection
As a variables sampling inspection plan can only operate efficiently if
a) the characteristic being inspected is normally distributed,
b) records are kept,
c) the switching rules are obeyed,
it is necessary to ensure that these requirements are being met.
Copyright International Organization for Standardization Reproduced by IHS under license with ISO
Not for ResaleNo reproduction or networking permitted without license from IHS
--`,,`,,,-`-`,,`,,`,`,,`---
ISO 3951-1:2005(E)
24 © ISO 2005 – All rights reserved
18 Normality and outliers
18.1 Normality
The responsible authority should check for normality before sampling begins. In case of doubt, a statistician should advise whether the distribution appears suitable for sampling by variables, or whether use should be made of the tests for departure from normality given in ISO 5479 or in ISO 2854:1976, Clause 2.
18.2 Outliers
An outlier (or an outlying observation) is a datum that appears to deviate markedly from other observations in the sample in which it occurs. A single outlier, even when it lies within specification limits, will produce an increase in variability and change the mean and may consequently lead to non-acceptance of the lot (see, for example, ISO 5725-2). When outliers are detected, the disposition of the lot should be a matter for negotiation between the vendor and purchaser.
19 Records
19.1 Control charts
One of the advantages of inspection by variables is that trends in the quality level of the product can be detected and a warning given before an unacceptable standard is reached, but this is only possible if adequate records are kept.
Whatever the method used, “s” or “σ”, records should be kept of the values of x and s, preferably in the form of control charts (see ISO 7870 and ISO 8258).
This procedure should be applied especially with the “σ” method in order to verify that the values of s obtained from the samples fall within the limits of the prescribed value of σ.
For combined control of double specification limits, the values of the MSSD, given in Table D.1, D.2 or D.3, should be plotted on the s control chart, as an indication of an unacceptable value.
NOTE Control charts are used to detect trends. The ultimate decision as to the acceptability of an individual lot is governed by the procedures given in Clauses 15 and 16.
19.2 Lots that are not accepted
Particular care shall be taken to record all lots that are not accepted and to see that switching rules are implemented. Any lot not accepted by the sampling plan shall not be resubmitted either in whole or in part without the permission of the responsible authority.
20 Operation of switching rules
The standard switching rules are as follows.
a) Normal inspection is used at the start of inspection (unless otherwise designated) and shall continue to be used during the course of inspection until tightened inspection becomes necessary or reduced inspection is allowed.
b) Tightened inspection shall be instituted when two lots on original normal inspection are not accepted within any five or fewer successive lots.
Copyright International Organization for Standardization Reproduced by IHS under license with ISO
Not for ResaleNo reproduction or networking permitted without license from IHS
--`,,`,,,-`-`,,`,,`,`,,`---
ISO 3951-1:2005(E)
© ISO 2005 – All rights reserved 25
Tightened inspection is generally achieved by increasing the value of the acceptability constant k. The values are tabulated in Table B.2 for the “s” method and Table C.2 for the “σ” method. For neither method is there a change in the size of the sample in switching from normal to tightened inspection, unless the AQL is so small that the tables indicate, with a downward arrow, that an increase in sample size is necessary.
c) Tightened inspection shall be relaxed when five successive lots on original inspection have been accepted on tightened inspection; then normal inspection shall be reinstated.
d) Reduced inspection may be instituted after ten successive lots have been accepted under normal inspection, provided that
1) these lots would have been acceptable if the AQL had been one step tighter;
NOTE If a value of k for this tighter AQL is not given in Table B.1 (“s” method) or Table C.1 (“σ” method), refer to Table I.1.
2) production is in statistical control;
3) reduced inspection is considered desirable by the responsible authority.
Reduced inspection is conducted on a much smaller sample than normal inspection and the value of the acceptability constant is also decreased. The values of n and k for reduced inspection are given in Table B.3 for the “s” method and Table C.3 for the “σ” method.
e) Reduced inspection shall cease and normal inspection be reinstated if any of the following occur on original inspection:
1) a lot is not accepted;
2) production becomes irregular or delayed;
3) reduced inspection is no longer considered desirable by the responsible authority.
21 Discontinuation and resumption of inspection
If the cumulative number of lots not accepted in a sequence of consecutive lots on original tightened inspection reaches 5, the acceptance procedures of this part of ISO 3951 shall be discontinued.
Inspection under the provisions of this part of ISO 3951 shall not be resumed until action has been taken by the supplier to improve the quality of the submitted product or service, and the responsible authority has agreed that this action is likely to be effective. Tightened inspection shall then be used as if 20 b) had been invoked.
22 Switching between the “s” and “σ” methods
22.1 Estimating the process standard deviation
While this part of ISO 3951 is being used, the weighted root mean square of the values of s shall be calculated periodically as estimates of the process standard deviation σ for both the “s” and the “σ” methods. (See J.2 in Annex J.) The value of σ shall be re-estimated at five lot intervals, unless the responsible authority specifies another interval. The estimate shall be based on the preceding 10 lots, unless the responsible authority specifies another number of lots.
Copyright International Organization for Standardization Reproduced by IHS under license with ISO
Not for ResaleNo reproduction or networking permitted without license from IHS
--`,,`,,,-`-`,,`,,`,`,,`---
ISO 3951-1:2005(E)
26 © ISO 2005 – All rights reserved
22.2 State of statistical control
Calculate the upper control limit for each of the 10 lots (or other number of lots specified by the responsible authority) from the expression cuσ, where cu is a factor that depends on the sample size n and is given in Table H.1. If none of the sample standard deviations, sj, exceeds the corresponding control limit, then the process may be considered to be in a state of statistical control; otherwise the process shall be considered to be out of statistical control.
NOTE 1 If the sample sizes from the lots are all equal, then the value of cuσ is common to all the lots.
NOTE 2 If the sample sizes from each lot vary, it is not necessary to calculate cuσ for those lots for which the sample standard deviation, sj, is less than or equal to σ.
22.3 Switching from the “s” method to the “σ” method
If the process is considered to be in a state of statistical control under the “s” method, then the“σ” method may be instituted using the latest value of σ.
NOTE This switch is made at the discretion of the responsible authority.
22.4 Switching from the “σ” method to the “s” method
It is recommended that a control chart for s be kept, even under the “σ” method. Once the process is considered to be out of statistical control, inspection shall be switched to the “s” method.
23 Chart A — Sample-size code letters of standard single sampling plans for specified quality levels
Figure 4 shows sample-size code letters of standard single sampling plans for specified quality levels at 95 % and 10 % probabilities of acceptance (in percent nonconforming).
Copyright International Organization for Standardization Reproduced by IHS under license with ISO
Not for ResaleNo reproduction or networking permitted without license from IHS
--`,,`,,,-`-`,,`,,`,`,,`---
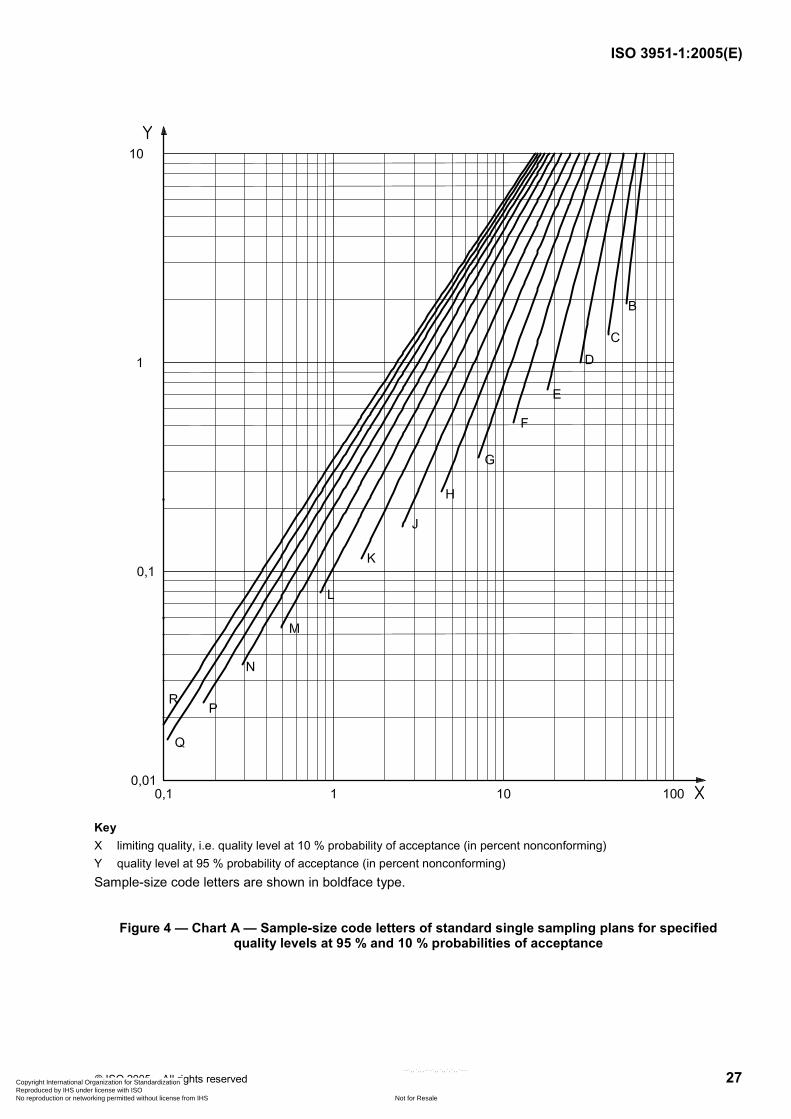
ISO 3951-1:2005(E)
© ISO 2005 – All rights reserved 27
Key X limiting quality, i.e. quality level at 10 % probability of acceptance (in percent nonconforming) Y quality level at 95 % probability of acceptance (in percent nonconforming) Sample-size code letters are shown in boldface type.
Figure 4 — Chart A — Sample-size code letters of standard single sampling plans for specified quality levels at 95 % and 10 % probabilities of acceptance
Copyright International Organization for Standardization Reproduced by IHS under license with ISO
Not for ResaleNo reproduction or networking permitted without license from IHS
--`,,`,,,-`-`,,`,,`,`,,`---
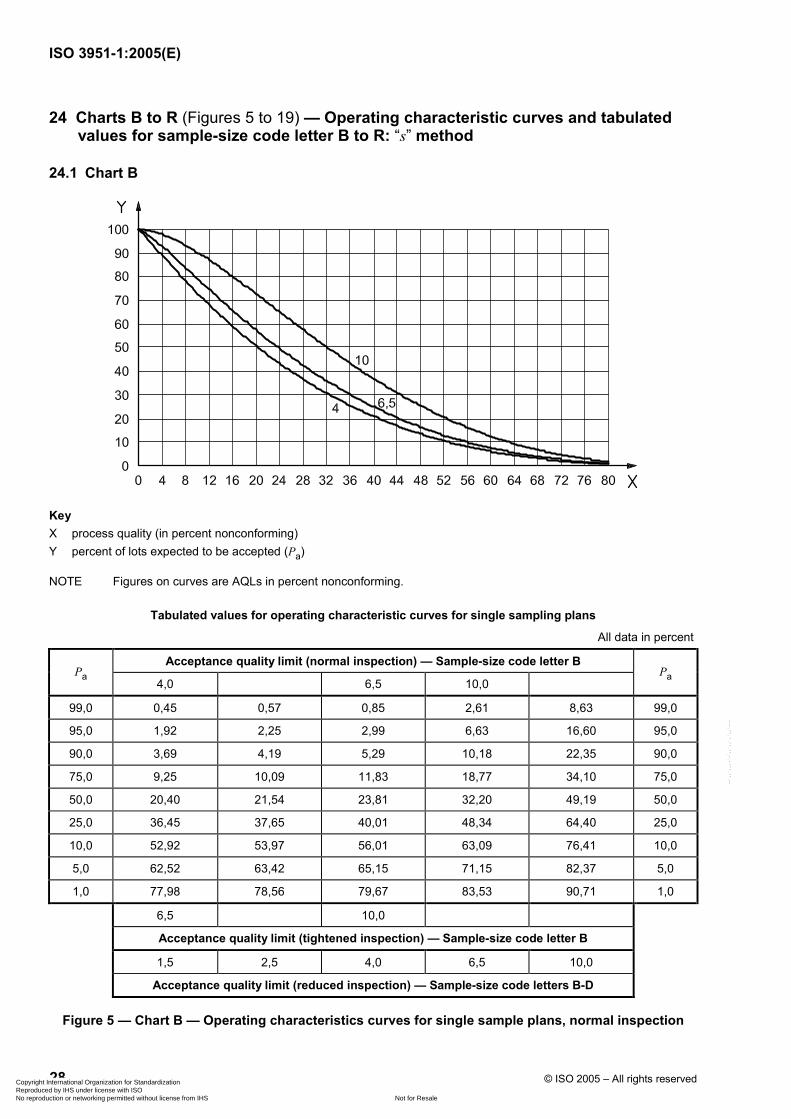
ISO 3951-1:2005(E)
28 © ISO 2005 – All rights reserved
24 Charts B to R (Figures 5 to 19) — Operating characteristic curves and tabulated values for sample-size code letter B to R: “s” method
24.1 Chart B
Key X process quality (in percent nonconforming) Y percent of lots expected to be accepted (Pa)
NOTE Figures on curves are AQLs in percent nonconforming.
Tabulated values for operating characteristic curves for single sampling plans
All data in percent
Acceptance quality limit (normal inspection) — Sample-size code letter B Pa
4,0 6,5 10,0 Pa
99,0 0,45 0,57 0,85 2,61 8,63 99,0
95,0 1,92 2,25 2,99 6,63 16,60 95,0
90,0 3,69 4,19 5,29 10,18 22,35 90,0
75,0 9,25 10,09 11,83 18,77 34,10 75,0
50,0 20,40 21,54 23,81 32,20 49,19 50,0
25,0 36,45 37,65 40,01 48,34 64,40 25,0
10,0 52,92 53,97 56,01 63,09 76,41 10,0
5,0 62,52 63,42 65,15 71,15 82,37 5,0
1,0 77,98 78,56 79,67 83,53 90,71 1,0
6,5 10,0
Acceptance quality limit (tightened inspection) — Sample-size code letter B
1,5 2,5 4,0 6,5 10,0
Acceptance quality limit (reduced inspection) — Sample-size code letters B-D
Figure 5 — Chart B — Operating characteristics curves for single sample plans, normal inspection
Copyright International Organization for Standardization Reproduced by IHS under license with ISO
Not for ResaleNo reproduction or networking permitted without license from IHS
--`,,`,,,-`-`,,`,,`,`,,`---
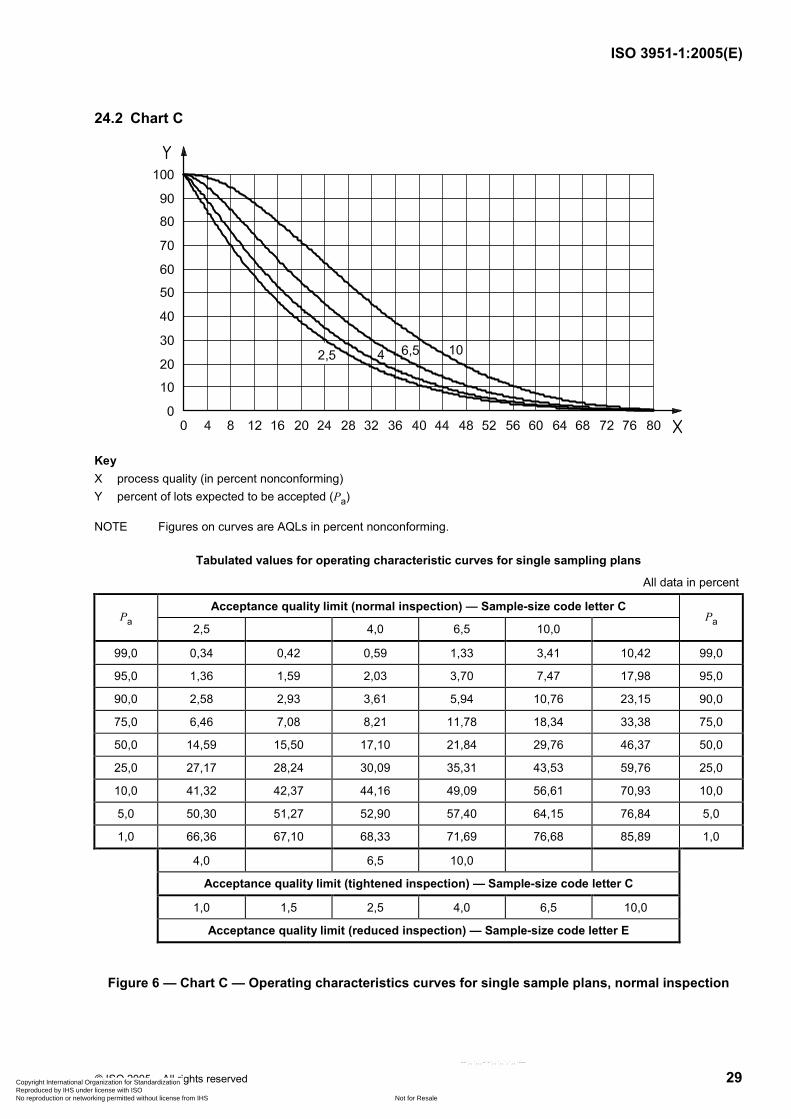
ISO 3951-1:2005(E)
© ISO 2005 – All rights reserved 29
24.2 Chart C
Key X process quality (in percent nonconforming) Y percent of lots expected to be accepted (Pa)
NOTE Figures on curves are AQLs in percent nonconforming.
Tabulated values for operating characteristic curves for single sampling plans
All data in percent
Acceptance quality limit (normal inspection) — Sample-size code letter C Pa
2,5 4,0 6,5 10,0 Pa
99,0 0,34 0,42 0,59 1,33 3,41 10,42 99,0
95,0 1,36 1,59 2,03 3,70 7,47 17,98 95,0
90,0 2,58 2,93 3,61 5,94 10,76 23,15 90,0
75,0 6,46 7,08 8,21 11,78 18,34 33,38 75,0
50,0 14,59 15,50 17,10 21,84 29,76 46,37 50,0
25,0 27,17 28,24 30,09 35,31 43,53 59,76 25,0
10,0 41,32 42,37 44,16 49,09 56,61 70,93 10,0
5,0 50,30 51,27 52,90 57,40 64,15 76,84 5,0
1,0 66,36 67,10 68,33 71,69 76,68 85,89 1,0
4,0 6,5 10,0
Acceptance quality limit (tightened inspection) — Sample-size code letter C
1,0 1,5 2,5 4,0 6,5 10,0
Acceptance quality limit (reduced inspection) — Sample-size code letter E
Figure 6 — Chart C — Operating characteristics curves for single sample plans, normal inspection
Copyright International Organization for Standardization Reproduced by IHS under license with ISO
Not for ResaleNo reproduction or networking permitted without license from IHS
--`,,`,,,-`-`,,`,,`,`,,`---
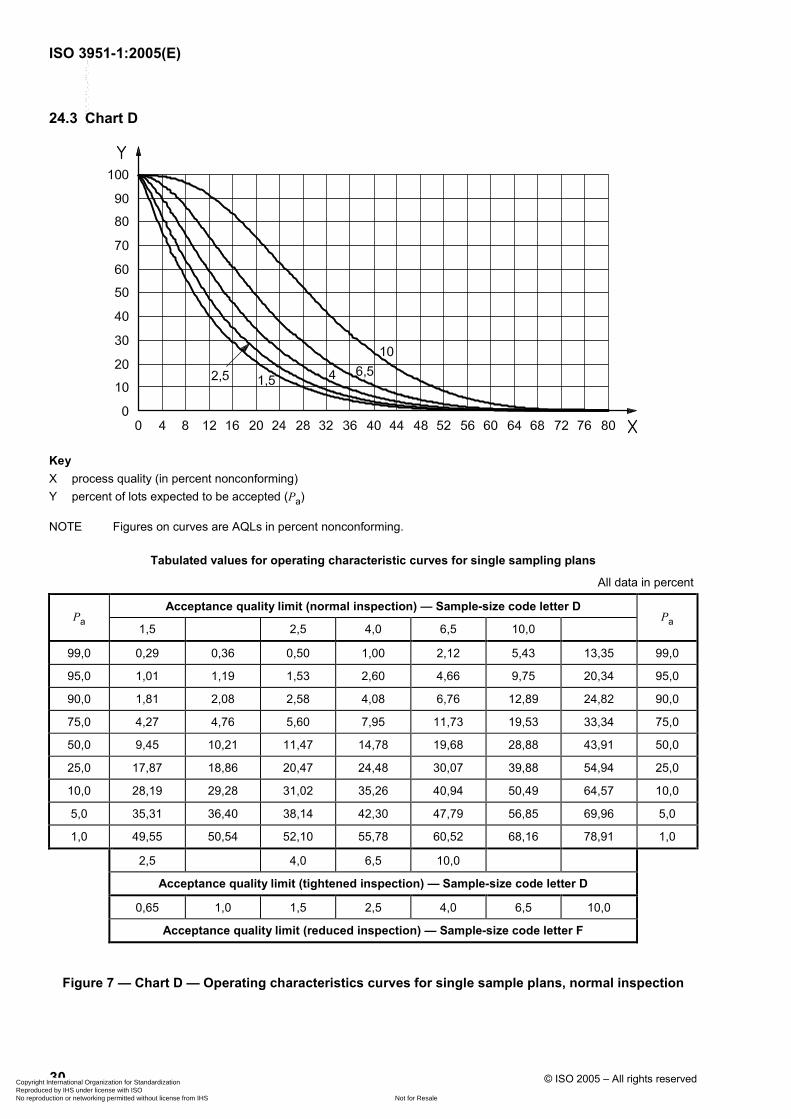
ISO 3951-1:2005(E)
30 © ISO 2005 – All rights reserved
24.3 Chart D
Key X process quality (in percent nonconforming) Y percent of lots expected to be accepted (Pa)
NOTE Figures on curves are AQLs in percent nonconforming.
Tabulated values for operating characteristic curves for single sampling plans
All data in percent
Acceptance quality limit (normal inspection) — Sample-size code letter D Pa
1,5 2,5 4,0 6,5 10,0 Pa
99,0 0,29 0,36 0,50 1,00 2,12 5,43 13,35 99,0
95,0 1,01 1,19 1,53 2,60 4,66 9,75 20,34 95,0
90,0 1,81 2,08 2,58 4,08 6,76 12,89 24,82 90,0
75,0 4,27 4,76 5,60 7,95 11,73 19,53 33,34 75,0
50,0 9,45 10,21 11,47 14,78 19,68 28,88 43,91 50,0
25,0 17,87 18,86 20,47 24,48 30,07 39,88 54,94 25,0
10,0 28,19 29,28 31,02 35,26 40,94 50,49 64,57 10,0
5,0 35,31 36,40 38,14 42,30 47,79 56,85 69,96 5,0
1,0 49,55 50,54 52,10 55,78 60,52 68,16 78,91 1,0
2,5 4,0 6,5 10,0
Acceptance quality limit (tightened inspection) — Sample-size code letter D
0,65 1,0 1,5 2,5 4,0 6,5 10,0
Acceptance quality limit (reduced inspection) — Sample-size code letter F
Figure 7 — Chart D — Operating characteristics curves for single sample plans, normal inspection
Copyright International Organization for Standardization Reproduced by IHS under license with ISO
Not for ResaleNo reproduction or networking permitted without license from IHS
--`,,`,,,-`-`,,`,,`,`,,`---

ISO 3951-1:2005(E)
© ISO 2005 – All rights reserved 31
(Blank page)
Copyright International Organization for Standardization Reproduced by IHS under license with ISO
Not for ResaleNo reproduction or networking permitted without license from IHS
--`,,`,,,-`-`,,`,,`,`,,`---
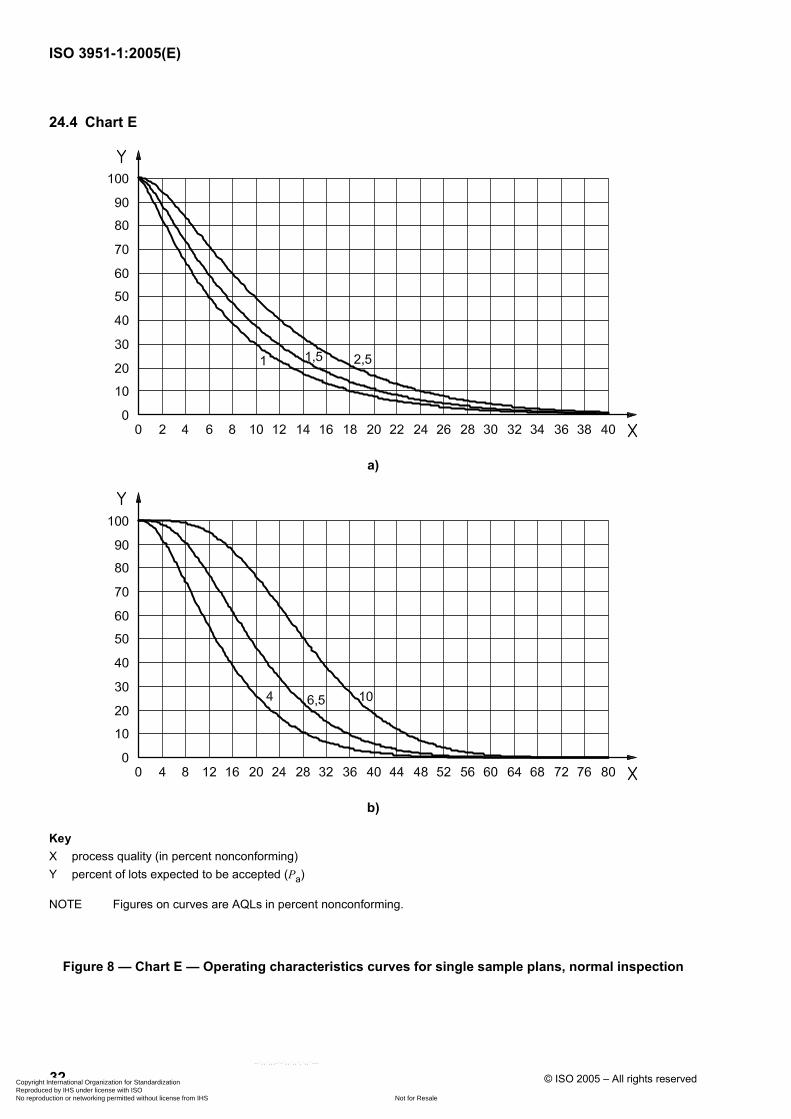
ISO 3951-1:2005(E)
32 © ISO 2005 – All rights reserved
24.4 Chart E
a)
b)
Key X process quality (in percent nonconforming) Y percent of lots expected to be accepted (Pa)
NOTE Figures on curves are AQLs in percent nonconforming.
Figure 8 — Chart E — Operating characteristics curves for single sample plans, normal inspection
Copyright International Organization for Standardization Reproduced by IHS under license with ISO
Not for ResaleNo reproduction or networking permitted without license from IHS
--`,,`,,,-`-`,,`,,`,`,,`---
ISO 3951-1:2005(E)
© ISO 2005 – All rights reserved 33
Tabulated values for operating characteristic curves for single sampling plans
All data in percent
Acceptance quality limit (normal inspection) — Sample-size code letter E Pa
1,0 1,5 2,5 4,0 6,5 10,0 Pa
99,0 0,24 0,30 0,41 0,78 1,51 3,40 7,63 12,27 99,0
95,0 0,74 0,88 1,13 1,88 3,19 6,13 11,91 17,74 95,0
90,0 1,26 1,47 1,83 2,86 4,56 8,15 14,78 21,20 90,0
75,0 2,81 3,17 3,77 5,38 7,83 12,55 20,50 27,78 75,0
50,0 6,00 6,58 7,51 9,86 13,18 19,05 28,18 36,08 50,0
25,0 11,32 12,13 13,39 16,43 20,48 27,19 36,98 45,08 25,0
10,0 18,20 19,17 20,66 24,15 28,61 35,67 45,52 53,42 10,0
5,0 23,24 24,27 25,84 29,48 34,03 41,10 50,74 58,35 5,0
1,0 34,16 35,23 36,84 40,48 44,92 51,59 60,41 67,20 1,0
1,5 2,5 4,0 6,5 10,0
Acceptance quality limit (tightened inspection) — Sample-size code letter E
0,40 0,65 1,0 1,5 2,5 4,0 6,5 10,0
Acceptance quality limit (reduced inspection) — Sample-size code letter G
Figure 8 (continued)
Copyright International Organization for Standardization Reproduced by IHS under license with ISO
Not for ResaleNo reproduction or networking permitted without license from IHS
--`,,`,,,-`-`,,`,,`,`,,`---
ISO 3951-1:2005(E)
34 © ISO 2005 – All rights reserved
24.5 Chart F
a)
b)
Key X process quality (in percent nonconforming) Y percent of lots expected to be accepted (Pa)
NOTE Figures on curves are AQLs in percent nonconforming.
Figure 9 — Chart F — Operating characteristics curves for single sample plans, normal inspection
Copyright International Organization for Standardization Reproduced by IHS under license with ISO
Not for ResaleNo reproduction or networking permitted without license from IHS
--`,,`,,,-`-`,,`,,`,`,,`---

ISO 3951-1:2005(E)
© ISO 2005 – All rights reserved 35
Tabulated values for operating characteristic curves for single sampling plans
All data in percent
Acceptance quality limit (normal inspection) — Sample-size code letter F Pa
0,65 1,0 1,5 2,5 4,0 6,5 10,0 Pa
99,0 0,19 0,23 0,31 0,56 1,01 2,10 4,37 6,80 9,49 12,85 99,0
95,0 0,51 0,61 0,78 1,27 2,08 3,80 7,01 10,18 13,52 17,53 95,0
90,0 0,84 0,98 1,22 1,90 2,95 5,08 8,84 12,41 16,08 20,42 90,0
75,0 1,79 2,03 2,43 3,49 5,04 7,93 12,63 16,84 21,02 25,83 75,0
50,0 3,72 4,12 4,75 6,35 8,52 12,29 17,97 22,78 27,40 32,59 50,0
25,0 7,00 7,58 8,48 10,65 13,45 18,01 24,48 29,72 34,60 39,97 25,0
10,0 11,40 12,14 13,27 15,91 19,19 24,30 31,22 36,63 41,59 46,94 10,0
5,0 14,75 15,57 16,83 19,70 23,19 28,52 35,57 41,00 45,90 51,16 5,0
1,0 22,46 23,39 24,81 27,96 31,67 37,15 44,15 49,40 54,07 59,00 1,0
1,0 1,5 2,5 4,0 6,5 10,0
Acceptance quality limit (tightened inspection) — Sample-size code letter F
0,25 0,40 0,65 1,0 1,5 2,5 4,0 6,5 10,0
Acceptance quality limit (reduced inspection) — Sample-size code letter H
Figure 9 (continued)
Copyright International Organization for Standardization Reproduced by IHS under license with ISO
Not for ResaleNo reproduction or networking permitted without license from IHS
--`,,`,,,-`-`,,`,,`,`,,`---
ISO 3951-1:2005(E)
36 © ISO 2005 – All rights reserved
24.6 Chart G
a)
b)
Key X process quality (in percent nonconforming) Y percent of lots expected to be accepted (Pa)
NOTE Figures on curves are AQLs in percent nonconforming.
Figure 10 — Chart G — Operating characteristics curves for single sample plans, normal inspection
Copyright International Organization for Standardization Reproduced by IHS under license with ISO
Not for ResaleNo reproduction or networking permitted without license from IHS
--`,,`,,,-`-`,,`,,`,`,,`---
ISO 3951-1:2005(E)
© ISO 2005 – All rights reserved 37
Tabulated values for operating characteristic curves for single sampling plans
All data in percent
Acceptance quality limit (normal inspection) — Sample-size code letter G Pa
0,40 0,65 1,0 1,5 2,5 4,0 6,5 10,0 Pa
99,0 0,14 0,17 0,22 0,39 0,69 1,35 2,65 4,01 5,48 7,30 9,20 11,26 99,0
95,0 0,35 0,42 0,53 0,86 1,38 2,43 4,33 6,15 8,05 10,31 12,60 15,02 95,0
90,0 0,56 0,66 0,82 1,26 1,94 3,25 5,51 7,61 9,74 12,24 14,73 17,33 90,0
75,0 1,15 1,31 1,58 2,28 3,28 5,11 8,01 10,58 13,10 15,98 18,78 21,66 75,0
50,0 2,34 2,60 3,03 4,11 5,55 8,01 11,67 14,74 17,65 20,90 23,99 27,11 50,0
25,0 4,37 4,77 5,40 6,90 8,84 11,95 16,32 19,83 23,06 26,58 29,87 33,16 25,0
10,0 7,15 7,68 8,51 10,43 12,80 16,44 21,34 25,15 28,58 32,26 35,65 39,00 10,0
5,0 9,33 9,94 10,89 13,04 15,64 19,56 24,71 28,64 32,15 35,87 39,28 42,61 5,0
1,0 14,54 15,29 16,42 18,95 21,90 26,20 31,65 35,69 39,23 42,94 46,28 49,53 1,0
0,65 1,0 1,5 2,5 4,0 6,5 10,0
Acceptance quality limit (tightened inspection) — Sample-size code letter G
0,15 0,25 0,40 0,65 1,0 1,5 2,5 4,0 6,5 10,0
Acceptance quality limit (reduced inspection) — Sample-size code letter J
Figure 10 (continued)
Copyright International Organization for Standardization Reproduced by IHS under license with ISO
Not for ResaleNo reproduction or networking permitted without license from IHS
--`,,`,,,-`-`,,`,,`,`,,`---
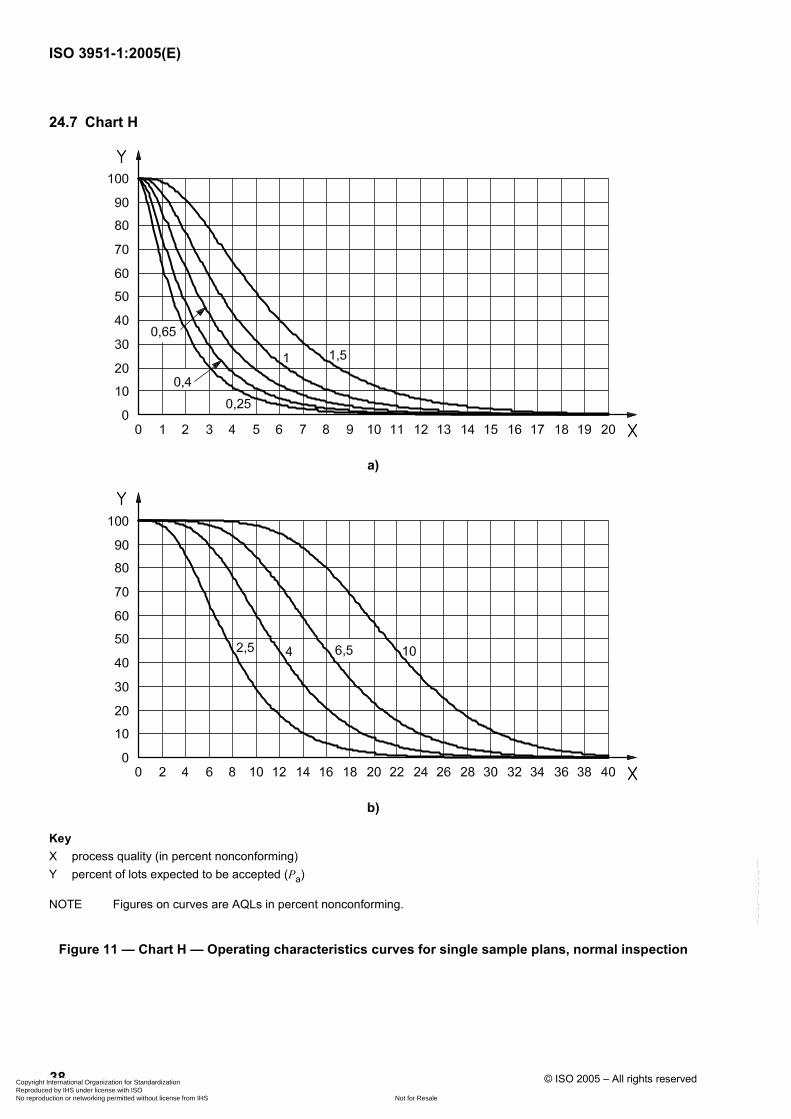
ISO 3951-1:2005(E)
38 © ISO 2005 – All rights reserved
24.7 Chart H
a)
b)
Key X process quality (in percent nonconforming) Y percent of lots expected to be accepted (Pa)
NOTE Figures on curves are AQLs in percent nonconforming.
Figure 11 — Chart H — Operating characteristics curves for single sample plans, normal inspection
Copyright International Organization for Standardization Reproduced by IHS under license with ISO
Not for ResaleNo reproduction or networking permitted without license from IHS
--`,,`,,,-`-`,,`,,`,`,,`---
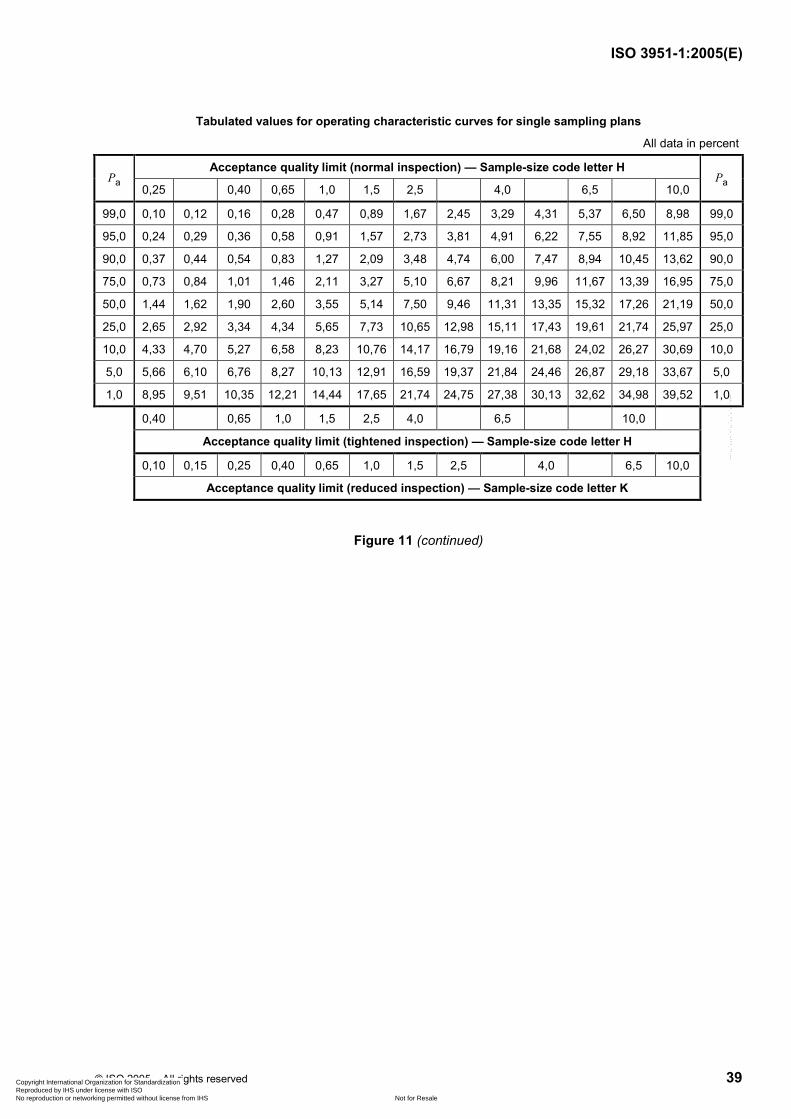
ISO 3951-1:2005(E)
© ISO 2005 – All rights reserved 39
Tabulated values for operating characteristic curves for single sampling plans
All data in percent
Acceptance quality limit (normal inspection) — Sample-size code letter H Pa
0,25 0,40 0,65 1,0 1,5 2,5 4,0 6,5 10,0 Pa
99,0 0,10 0,12 0,16 0,28 0,47 0,89 1,67 2,45 3,29 4,31 5,37 6,50 8,98 99,0
95,0 0,24 0,29 0,36 0,58 0,91 1,57 2,73 3,81 4,91 6,22 7,55 8,92 11,85 95,0
90,0 0,37 0,44 0,54 0,83 1,27 2,09 3,48 4,74 6,00 7,47 8,94 10,45 13,62 90,0
75,0 0,73 0,84 1,01 1,46 2,11 3,27 5,10 6,67 8,21 9,96 11,67 13,39 16,95 75,0
50,0 1,44 1,62 1,90 2,60 3,55 5,14 7,50 9,46 11,31 13,35 15,32 17,26 21,19 50,0
25,0 2,65 2,92 3,34 4,34 5,65 7,73 10,65 12,98 15,11 17,43 19,61 21,74 25,97 25,0
10,0 4,33 4,70 5,27 6,58 8,23 10,76 14,17 16,79 19,16 21,68 24,02 26,27 30,69 10,0
5,0 5,66 6,10 6,76 8,27 10,13 12,91 16,59 19,37 21,84 24,46 26,87 29,18 33,67 5,0
1,0 8,95 9,51 10,35 12,21 14,44 17,65 21,74 24,75 27,38 30,13 32,62 34,98 39,52 1,0
0,40 0,65 1,0 1,5 2,5 4,0 6,5 10,0
Acceptance quality limit (tightened inspection) — Sample-size code letter H
0,10 0,15 0,25 0,40 0,65 1,0 1,5 2,5 4,0 6,5 10,0
Acceptance quality limit (reduced inspection) — Sample-size code letter K
Figure 11 (continued)
Copyright International Organization for Standardization Reproduced by IHS under license with ISO
Not for ResaleNo reproduction or networking permitted without license from IHS
--`,,`,,,-`-`,,`,,`,`,,`---
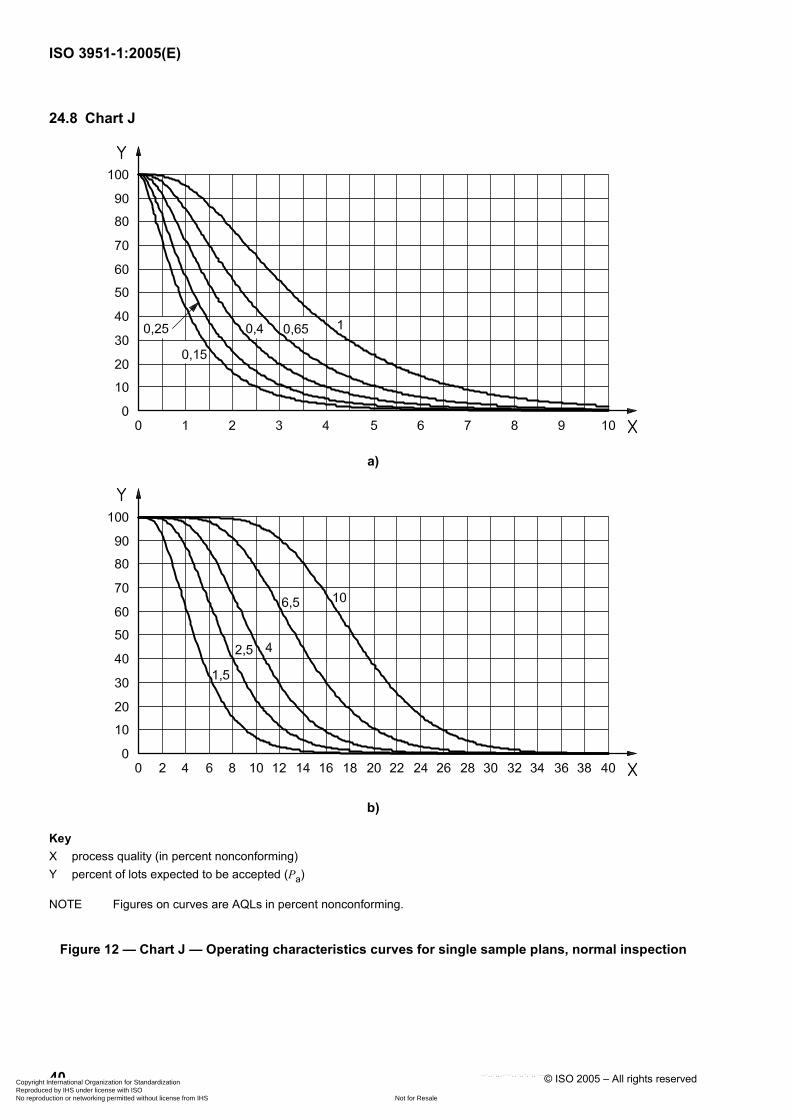
ISO 3951-1:2005(E)
40 © ISO 2005 – All rights reserved
24.8 Chart J
a)
b)
Key X process quality (in percent nonconforming) Y percent of lots expected to be accepted (Pa)
NOTE Figures on curves are AQLs in percent nonconforming.
Figure 12 — Chart J — Operating characteristics curves for single sample plans, normal inspection
Copyright International Organization for Standardization Reproduced by IHS under license with ISO
Not for ResaleNo reproduction or networking permitted without license from IHS
--`,,`,,,-`-`,,`,,`,`,,`---
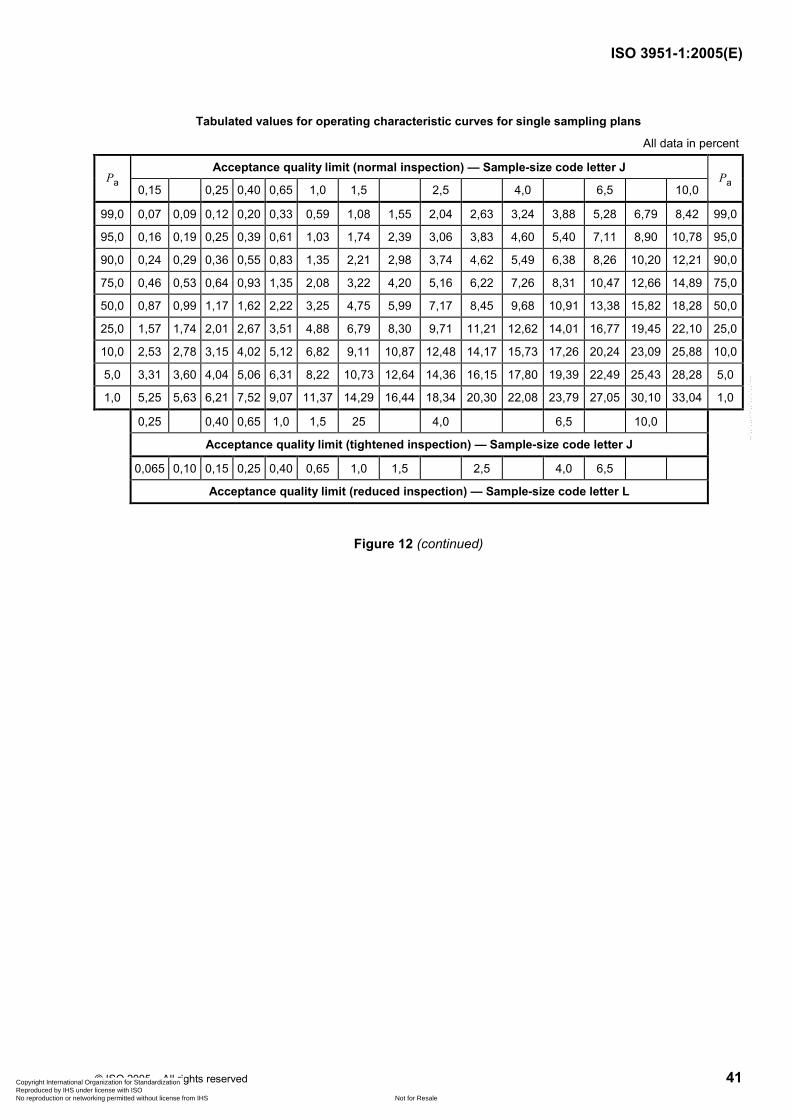
ISO 3951-1:2005(E)
© ISO 2005 – All rights reserved 41
Tabulated values for operating characteristic curves for single sampling plans
All data in percent
Acceptance quality limit (normal inspection) — Sample-size code letter J Pa
0,15 0,25 0,40 0,65 1,0 1,5 2,5 4,0 6,5 10,0 Pa
99,0 0,07 0,09 0,12 0,20 0,33 0,59 1,08 1,55 2,04 2,63 3,24 3,88 5,28 6,79 8,42 99,0
95,0 0,16 0,19 0,25 0,39 0,61 1,03 1,74 2,39 3,06 3,83 4,60 5,40 7,11 8,90 10,78 95,0
90,0 0,24 0,29 0,36 0,55 0,83 1,35 2,21 2,98 3,74 4,62 5,49 6,38 8,26 10,20 12,21 90,0
75,0 0,46 0,53 0,64 0,93 1,35 2,08 3,22 4,20 5,16 6,22 7,26 8,31 10,47 12,66 14,89 75,0
50,0 0,87 0,99 1,17 1,62 2,22 3,25 4,75 5,99 7,17 8,45 9,68 10,91 13,38 15,82 18,28 50,0
25,0 1,57 1,74 2,01 2,67 3,51 4,88 6,79 8,30 9,71 11,21 12,62 14,01 16,77 19,45 22,10 25,0
10,0 2,53 2,78 3,15 4,02 5,12 6,82 9,11 10,87 12,48 14,17 15,73 17,26 20,24 23,09 25,88 10,0
5,0 3,31 3,60 4,04 5,06 6,31 8,22 10,73 12,64 14,36 16,15 17,80 19,39 22,49 25,43 28,28 5,0
1,0 5,25 5,63 6,21 7,52 9,07 11,37 14,29 16,44 18,34 20,30 22,08 23,79 27,05 30,10 33,04 1,0
0,25 0,40 0,65 1,0 1,5 25 4,0 6,5 10,0
Acceptance quality limit (tightened inspection) — Sample-size code letter J
0,065 0,10 0,15 0,25 0,40 0,65 1,0 1,5 2,5 4,0 6,5
Acceptance quality limit (reduced inspection) — Sample-size code letter L
Figure 12 (continued)
Copyright International Organization for Standardization Reproduced by IHS under license with ISO
Not for ResaleNo reproduction or networking permitted without license from IHS
--`,,`,,,-`-`,,`,,`,`,,`---
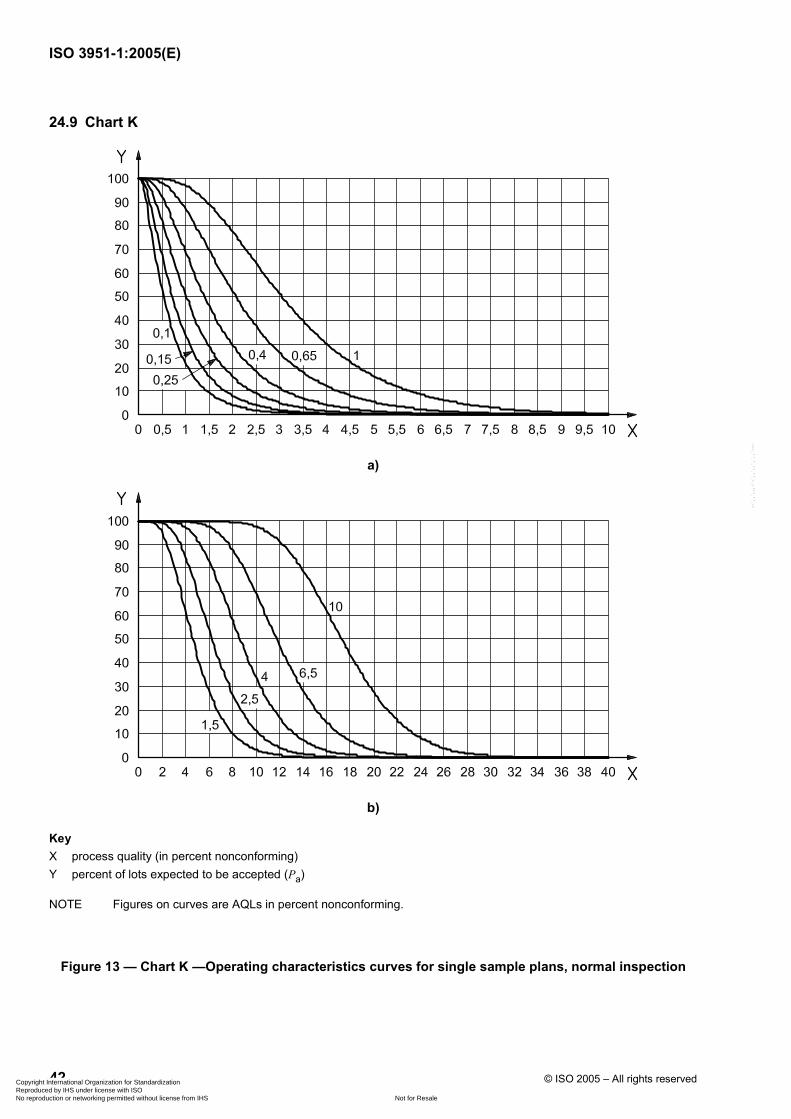
ISO 3951-1:2005(E)
42 © ISO 2005 – All rights reserved
24.9 Chart K
a)
b)
Key X process quality (in percent nonconforming) Y percent of lots expected to be accepted (Pa)
NOTE Figures on curves are AQLs in percent nonconforming.
Figure 13 — Chart K —Operating characteristics curves for single sample plans, normal inspection
Copyright International Organization for Standardization Reproduced by IHS under license with ISO
Not for ResaleNo reproduction or networking permitted without license from IHS
--`,,`,,,-`-`,,`,,`,`,,`---

ISO 3951-1:2005(E)
© ISO 2005 – All rights reserved 43
Tabulated values for operating characteristic curves for single sampling plans All data in percent
Acceptance quality limit (normal inspection) — Sample-size code letter K Pa
0,10 0,15 0,25 0,40 0,65 1,0 1,5 2,5 4,0 6,5 10,0 Pa
99,0 0,06 0,07 0,09 0,15 0,24 0,42 0,74 1,05 1,36 1,74 2,12 2,51 3,36 4,28 5,24 7,33 8,99 99,0
95,0 0,12 0,14 0,17 0,27 0,42 0,70 1,17 1,59 2,01 2,50 2,98 3,48 4,53 5,63 6,76 9,18 11.05 95,0
90,0 0,17 0,19 0,24 0,37 0,56 0,90 1,46 1,96 2,44 3,00 3,55 4,11 5,27 6,47 7,70 10,29 12,28 90,0
75,0 0,30 0,34 0,42 0,61 0,88 1,36 2,10 2,73 3,34 4,02 4,69 5,35 6,71 8,09 9,48 12,26 14,53 75,0
50,0 0,53 0,61 0,72 1,01 1,41 2,07 3,05 3,86 4,62 5,46 6,26 7,05 8,63 10,21 11,78 14,96 17,32 50,0
25,0 0,93 1,04 1,21 1,63 2,18 3,07 4,32 5,33 6,25 7,25 8,19 9,11 10,92 12,69 14,43 17,89 20,42 25,0
10,0 1,46 1,62 1,86 2,42 3,13 4,25 5,78 6,98 8,05 9,20 10,26 11,30 13,30 15,24 17,12 20,80 23,46 10,0
5,0 1,89 2,08 2,36 3,02 3,85 5,12 6,82 8,12 9,29 10,52 11,66 12,76 14,88 16,91 18,86 22,67 25,38 5,0
1,0 2,97 3,22 3,60 4,47 5,52 7,08 9,11 10,63 11,97 13,35 14,62 15,84 18,14 20,32 22,39 26,39 29,20 1,0
0,15 0,25 0,40 0,65 1,0 1,5 2,5 4,0 6,5 10,0
Acceptance quality limit (tightened inspection) — Sample-size code letter K
0,04 0,065 0,010 0,15 0,25 0,40 0,65 1,0 1,5 2,5 4,0
Acceptance quality limit (reduced inspection) — Sample-size code letter M
Figure 13 (continued)
Copyright International Organization for Standardization Reproduced by IHS under license with ISO
Not for ResaleNo reproduction or networking permitted without license from IHS
--`,,`,,,-`-`,,`,,`,`,,`---
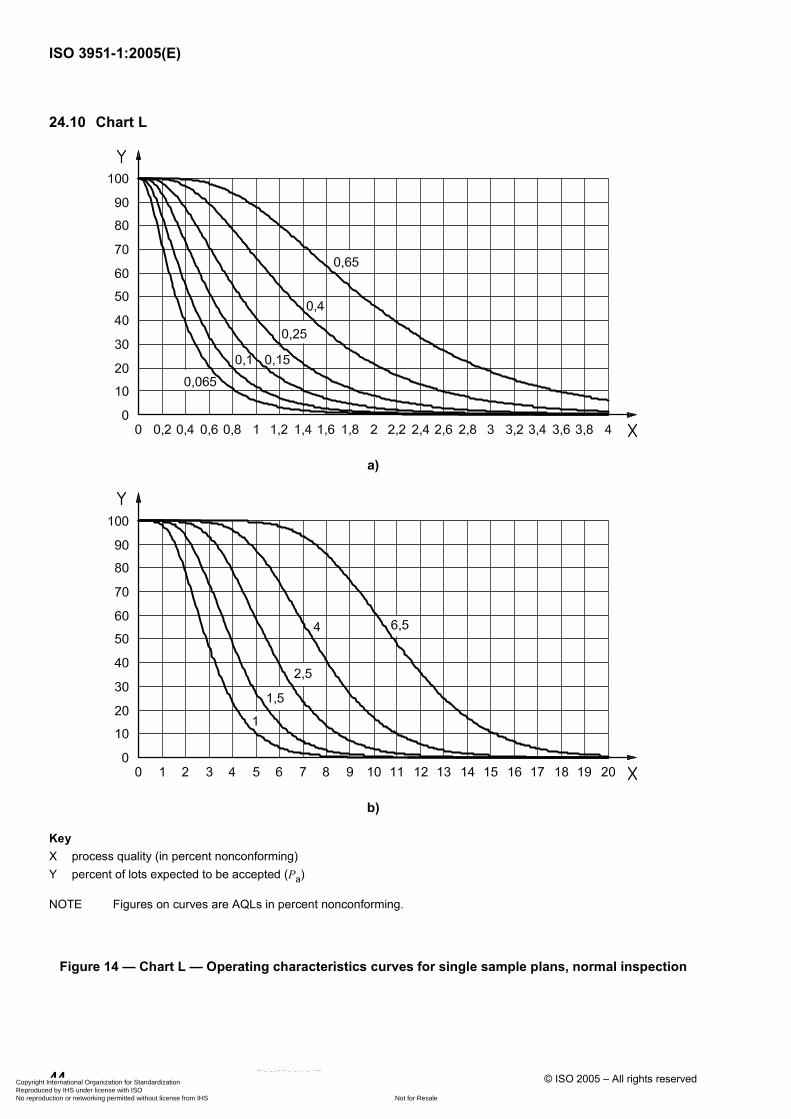
ISO 3951-1:2005(E)
44 © ISO 2005 – All rights reserved
24.10 Chart L
a)
b)
Key X process quality (in percent nonconforming) Y percent of lots expected to be accepted (Pa)
NOTE Figures on curves are AQLs in percent nonconforming.
Figure 14 — Chart L — Operating characteristics curves for single sample plans, normal inspection
Copyright International Organization for Standardization Reproduced by IHS under license with ISO
Not for ResaleNo reproduction or networking permitted without license from IHS
--`,,`,,,-`-`,,`,,`,`,,`---
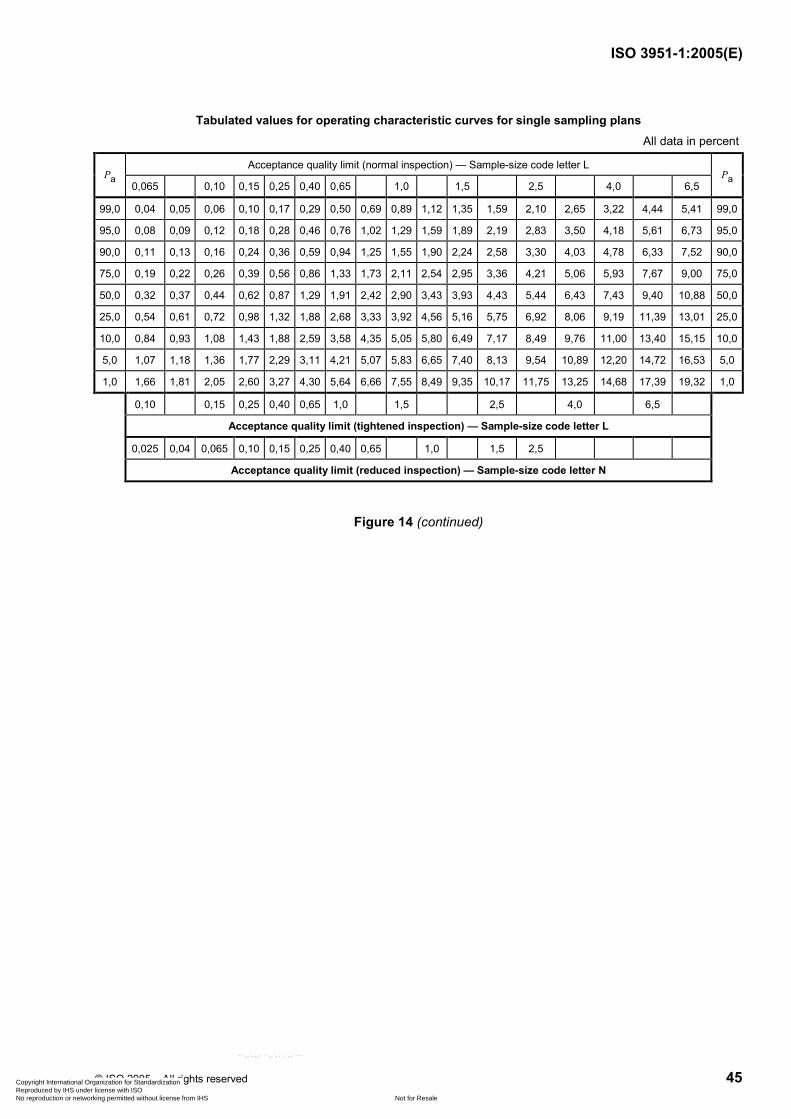
ISO 3951-1:2005(E)
© ISO 2005 – All rights reserved 45
Tabulated values for operating characteristic curves for single sampling plans All data in percent
Acceptance quality limit (normal inspection) — Sample-size code letter L Pa
0,065 0,10 0,15 0,25 0,40 0,65 1,0 1,5 2,5 4,0 6,5 Pa
99,0 0,04 0,05 0,06 0,10 0,17 0,29 0,50 0,69 0,89 1,12 1,35 1,59 2,10 2,65 3,22 4,44 5,41 99,0
95,0 0,08 0,09 0,12 0,18 0,28 0,46 0,76 1,02 1,29 1,59 1,89 2,19 2,83 3,50 4,18 5,61 6,73 95,0
90,0 0,11 0,13 0,16 0,24 0,36 0,59 0,94 1,25 1,55 1,90 2,24 2,58 3,30 4,03 4,78 6,33 7,52 90,0
75,0 0,19 0,22 0,26 0,39 0,56 0,86 1,33 1,73 2,11 2,54 2,95 3,36 4,21 5,06 5,93 7,67 9,00 75,0
50,0 0,32 0,37 0,44 0,62 0,87 1,29 1,91 2,42 2,90 3,43 3,93 4,43 5,44 6,43 7,43 9,40 10,88 50,0
25,0 0,54 0,61 0,72 0,98 1,32 1,88 2,68 3,33 3,92 4,56 5,16 5,75 6,92 8,06 9,19 11,39 13,01 25,0
10,0 0,84 0,93 1,08 1,43 1,88 2,59 3,58 4,35 5,05 5,80 6,49 7,17 8,49 9,76 11,00 13,40 15,15 10,0
5,0 1,07 1,18 1,36 1,77 2,29 3,11 4,21 5,07 5,83 6,65 7,40 8,13 9,54 10,89 12,20 14,72 16,53 5,0
1,0 1,66 1,81 2,05 2,60 3,27 4,30 5,64 6,66 7,55 8,49 9,35 10,17 11,75 13,25 14,68 17,39 19,32 1,0
0,10 0,15 0,25 0,40 0,65 1,0 1,5 2,5 4,0 6,5
Acceptance quality limit (tightened inspection) — Sample-size code letter L
0,025 0,04 0,065 0,10 0,15 0,25 0,40 0,65 1,0 1,5 2,5
Acceptance quality limit (reduced inspection) — Sample-size code letter N
Figure 14 (continued)
Copyright International Organization for Standardization Reproduced by IHS under license with ISO
Not for ResaleNo reproduction or networking permitted without license from IHS
--`,,`,,,-`-`,,`,,`,`,,`---
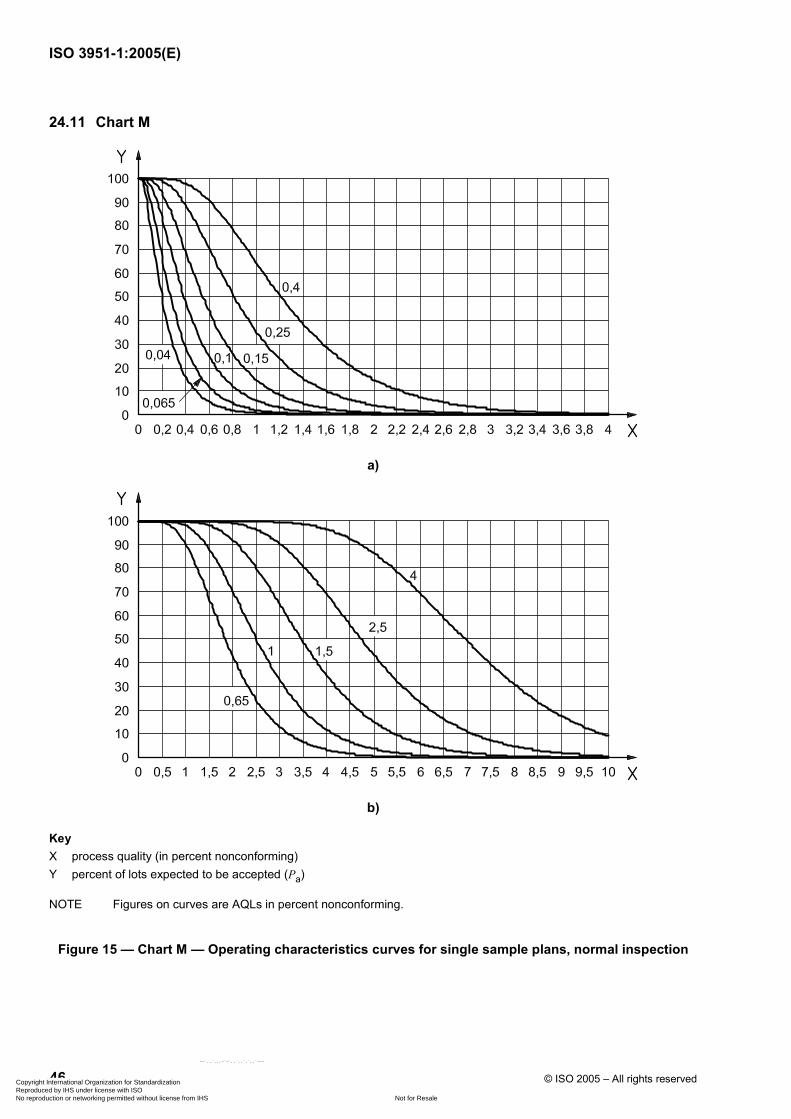
ISO 3951-1:2005(E)
46 © ISO 2005 – All rights reserved
24.11 Chart M
a)
b)
Key X process quality (in percent nonconforming) Y percent of lots expected to be accepted (Pa)
NOTE Figures on curves are AQLs in percent nonconforming.
Figure 15 — Chart M — Operating characteristics curves for single sample plans, normal inspection
Copyright International Organization for Standardization Reproduced by IHS under license with ISO
Not for ResaleNo reproduction or networking permitted without license from IHS
--`,,`,,,-`-`,,`,,`,`,,`---
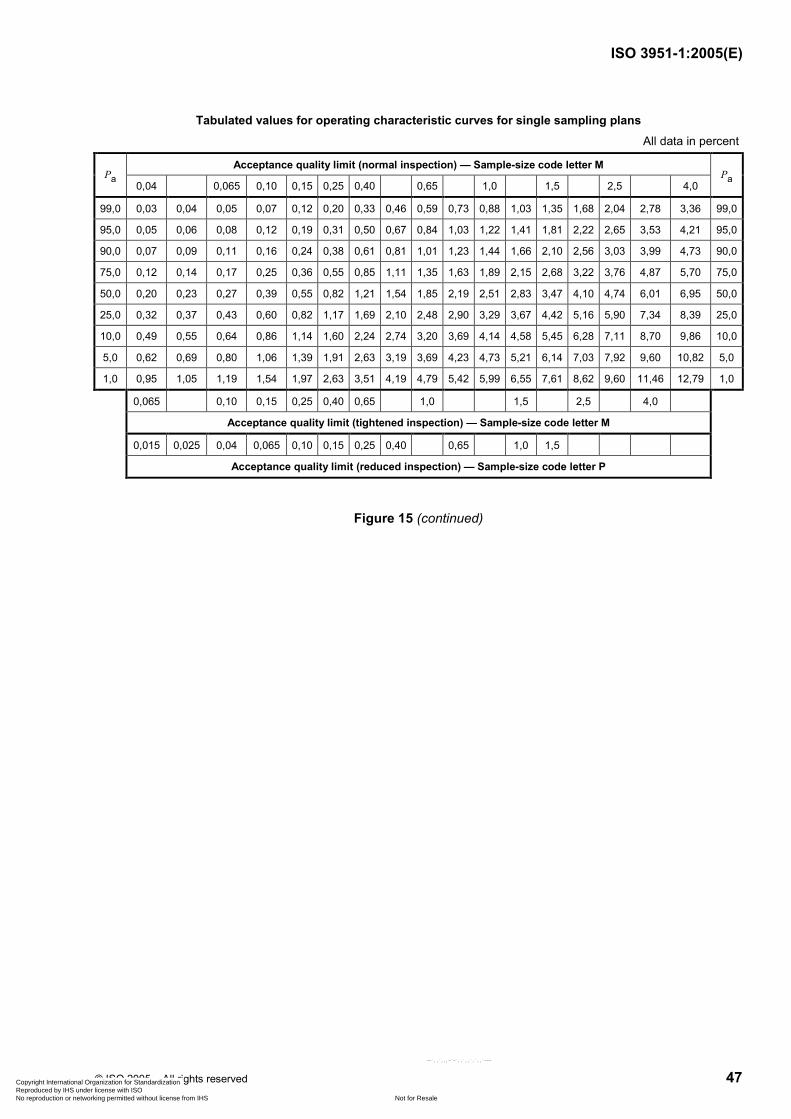
ISO 3951-1:2005(E)
© ISO 2005 – All rights reserved 47
Tabulated values for operating characteristic curves for single sampling plans All data in percent
Acceptance quality limit (normal inspection) — Sample-size code letter M Pa
0,04 0,065 0,10 0,15 0,25 0,40 0,65 1,0 1,5 2,5 4,0 Pa
99,0 0,03 0,04 0,05 0,07 0,12 0,20 0,33 0,46 0,59 0,73 0,88 1,03 1,35 1,68 2,04 2,78 3,36 99,0
95,0 0,05 0,06 0,08 0,12 0,19 0,31 0,50 0,67 0,84 1,03 1,22 1,41 1,81 2,22 2,65 3,53 4,21 95,0
90,0 0,07 0,09 0,11 0,16 0,24 0,38 0,61 0,81 1,01 1,23 1,44 1,66 2,10 2,56 3,03 3,99 4,73 90,0
75,0 0,12 0,14 0,17 0,25 0,36 0,55 0,85 1,11 1,35 1,63 1,89 2,15 2,68 3,22 3,76 4,87 5,70 75,0
50,0 0,20 0,23 0,27 0,39 0,55 0,82 1,21 1,54 1,85 2,19 2,51 2,83 3,47 4,10 4,74 6,01 6,95 50,0
25,0 0,32 0,37 0,43 0,60 0,82 1,17 1,69 2,10 2,48 2,90 3,29 3,67 4,42 5,16 5,90 7,34 8,39 25,0
10,0 0,49 0,55 0,64 0,86 1,14 1,60 2,24 2,74 3,20 3,69 4,14 4,58 5,45 6,28 7,11 8,70 9,86 10,0
5,0 0,62 0,69 0,80 1,06 1,39 1,91 2,63 3,19 3,69 4,23 4,73 5,21 6,14 7,03 7,92 9,60 10,82 5,0
1,0 0,95 1,05 1,19 1,54 1,97 2,63 3,51 4,19 4,79 5,42 5,99 6,55 7,61 8,62 9,60 11,46 12,79 1,0
0,065 0,10 0,15 0,25 0,40 0,65 1,0 1,5 2,5 4,0
Acceptance quality limit (tightened inspection) — Sample-size code letter M
0,015 0,025 0,04 0,065 0,10 0,15 0,25 0,40 0,65 1,0 1,5
Acceptance quality limit (reduced inspection) — Sample-size code letter P
Figure 15 (continued)
Copyright International Organization for Standardization Reproduced by IHS under license with ISO
Not for ResaleNo reproduction or networking permitted without license from IHS
--`,,`,,,-`-`,,`,,`,`,,`---
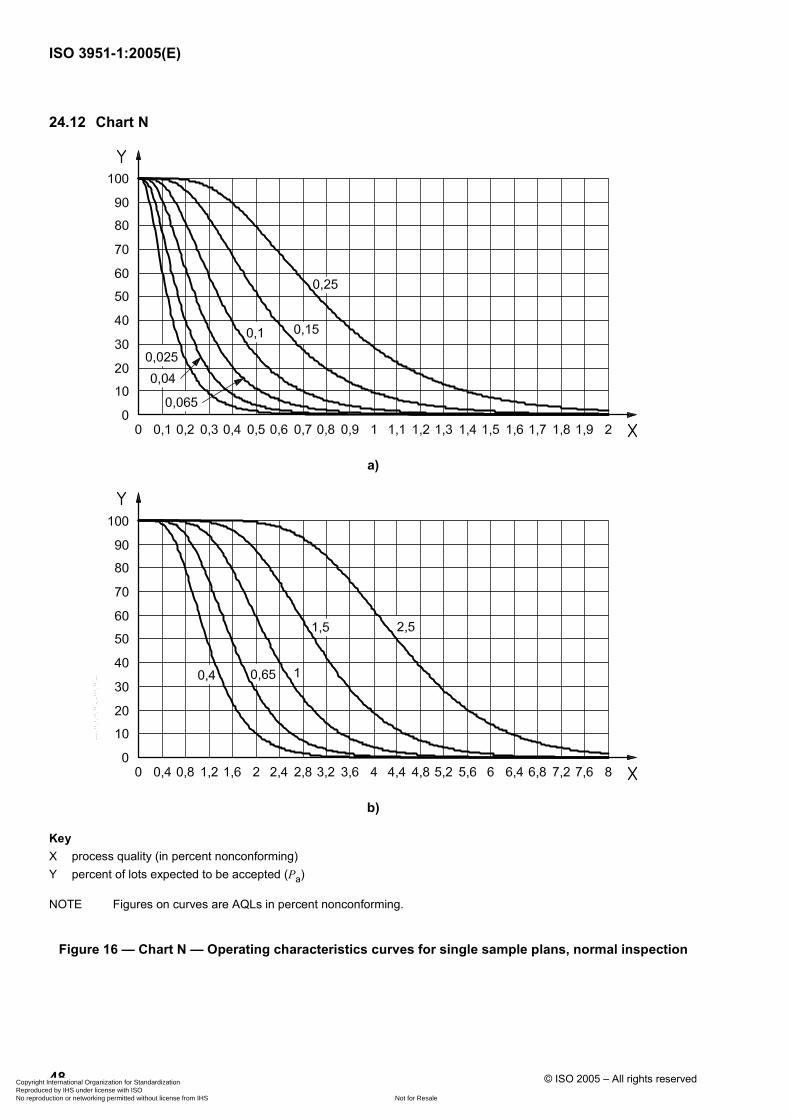
ISO 3951-1:2005(E)
48 © ISO 2005 – All rights reserved
24.12 Chart N
a)
b)
Key X process quality (in percent nonconforming) Y percent of lots expected to be accepted (Pa)
NOTE Figures on curves are AQLs in percent nonconforming.
Figure 16 — Chart N — Operating characteristics curves for single sample plans, normal inspection
Copyright International Organization for Standardization Reproduced by IHS under license with ISO
Not for ResaleNo reproduction or networking permitted without license from IHS
--`,,`,,,-`-`,,`,,`,`,,`---
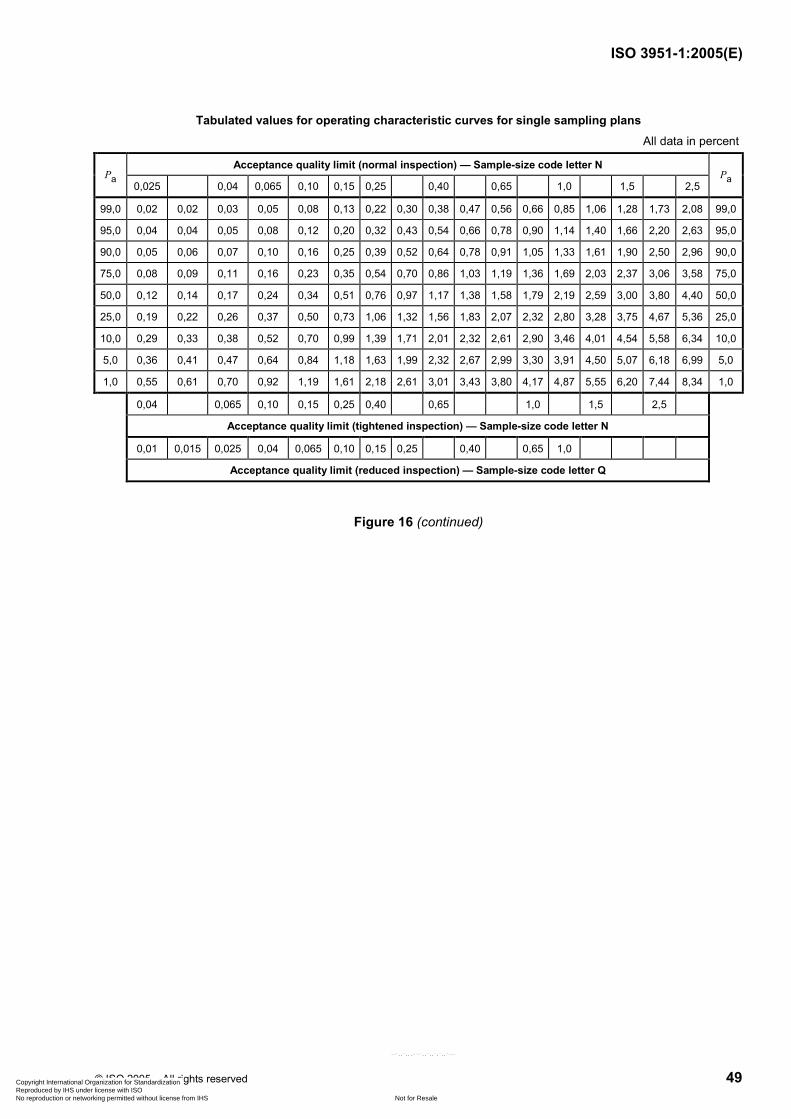
ISO 3951-1:2005(E)
© ISO 2005 – All rights reserved 49
Tabulated values for operating characteristic curves for single sampling plans All data in percent
Acceptance quality limit (normal inspection) — Sample-size code letter N Pa
0,025 0,04 0,065 0,10 0,15 0,25 0,40 0,65 1,0 1,5 2,5 Pa
99,0 0,02 0,02 0,03 0,05 0,08 0,13 0,22 0,30 0,38 0,47 0,56 0,66 0,85 1,06 1,28 1,73 2,08 99,0
95,0 0,04 0,04 0,05 0,08 0,12 0,20 0,32 0,43 0,54 0,66 0,78 0,90 1,14 1,40 1,66 2,20 2,63 95,0
90,0 0,05 0,06 0,07 0,10 0,16 0,25 0,39 0,52 0,64 0,78 0,91 1,05 1,33 1,61 1,90 2,50 2,96 90,0
75,0 0,08 0,09 0,11 0,16 0,23 0,35 0,54 0,70 0,86 1,03 1,19 1,36 1,69 2,03 2,37 3,06 3,58 75,0
50,0 0,12 0,14 0,17 0,24 0,34 0,51 0,76 0,97 1,17 1,38 1,58 1,79 2,19 2,59 3,00 3,80 4,40 50,0
25,0 0,19 0,22 0,26 0,37 0,50 0,73 1,06 1,32 1,56 1,83 2,07 2,32 2,80 3,28 3,75 4,67 5,36 25,0
10,0 0,29 0,33 0,38 0,52 0,70 0,99 1,39 1,71 2,01 2,32 2,61 2,90 3,46 4,01 4,54 5,58 6,34 10,0
5,0 0,36 0,41 0,47 0,64 0,84 1,18 1,63 1,99 2,32 2,67 2,99 3,30 3,91 4,50 5,07 6,18 6,99 5,0
1,0 0,55 0,61 0,70 0,92 1,19 1,61 2,18 2,61 3,01 3,43 3,80 4,17 4,87 5,55 6,20 7,44 8,34 1,0
0,04 0,065 0,10 0,15 0,25 0,40 0,65 1,0 1,5 2,5
Acceptance quality limit (tightened inspection) — Sample-size code letter N
0,01 0,015 0,025 0,04 0,065 0,10 0,15 0,25 0,40 0,65 1,0
Acceptance quality limit (reduced inspection) — Sample-size code letter Q
Figure 16 (continued)
Copyright International Organization for Standardization Reproduced by IHS under license with ISO
Not for ResaleNo reproduction or networking permitted without license from IHS
--`,,`,,,-`-`,,`,,`,`,,`---
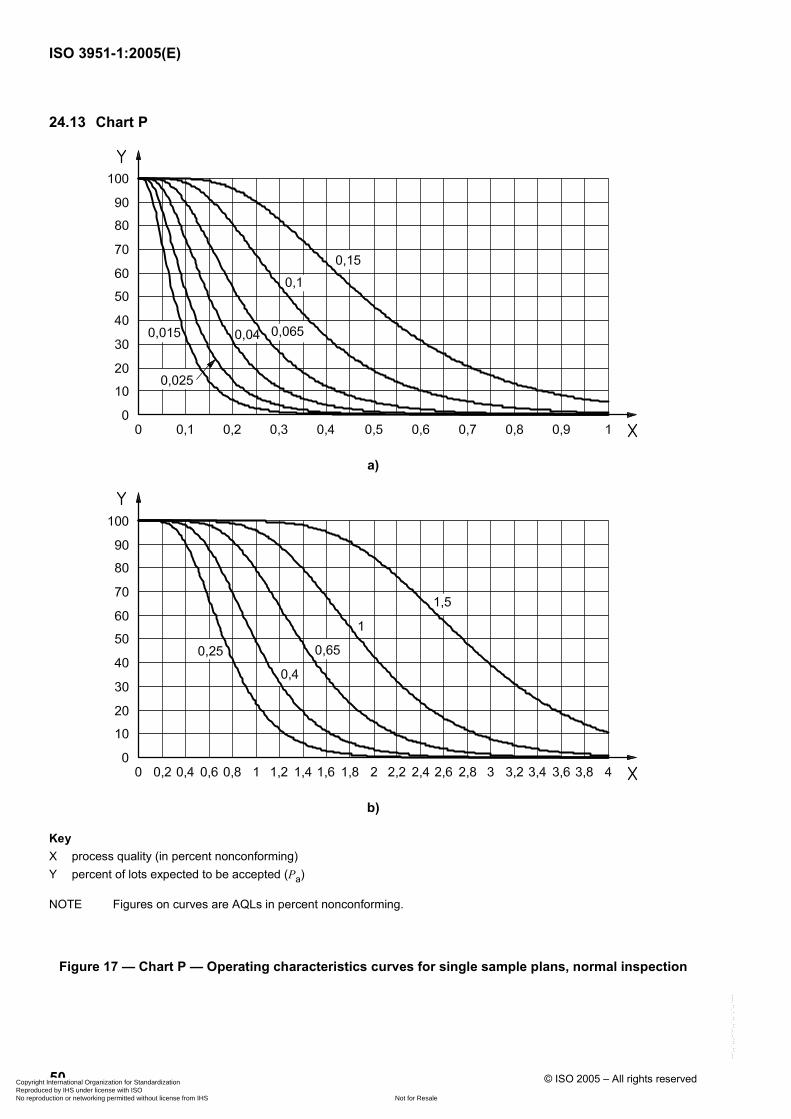
ISO 3951-1:2005(E)
50 © ISO 2005 – All rights reserved
24.13 Chart P
a)
b)
Key X process quality (in percent nonconforming) Y percent of lots expected to be accepted (Pa)
NOTE Figures on curves are AQLs in percent nonconforming.
Figure 17 — Chart P — Operating characteristics curves for single sample plans, normal inspection
Copyright International Organization for Standardization Reproduced by IHS under license with ISO
Not for ResaleNo reproduction or networking permitted without license from IHS
--`,,`,,,-`-`,,`,,`,`,,`---
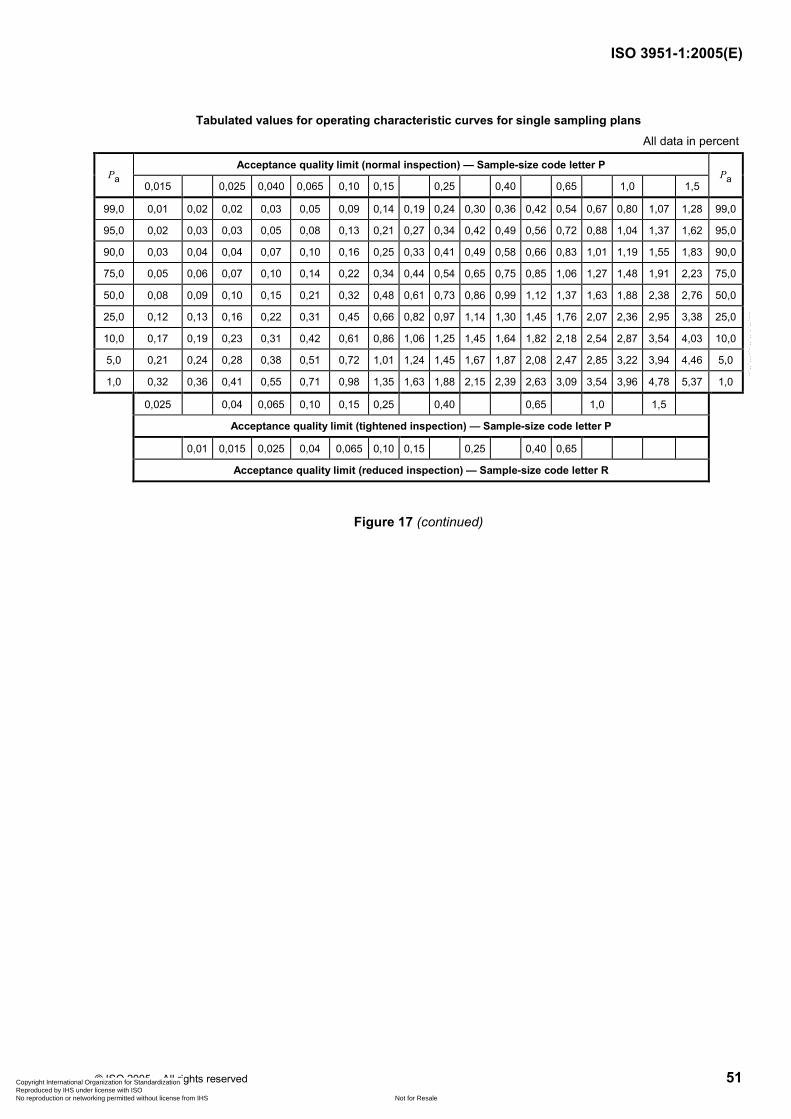
ISO 3951-1:2005(E)
© ISO 2005 – All rights reserved 51
Tabulated values for operating characteristic curves for single sampling plans All data in percent
Acceptance quality limit (normal inspection) — Sample-size code letter P Pa
0,015 0,025 0,040 0,065 0,10 0,15 0,25 0,40 0,65 1,0 1,5 Pa
99,0 0,01 0,02 0,02 0,03 0,05 0,09 0,14 0,19 0,24 0,30 0,36 0,42 0,54 0,67 0,80 1,07 1,28 99,0
95,0 0,02 0,03 0,03 0,05 0,08 0,13 0,21 0,27 0,34 0,42 0,49 0,56 0,72 0,88 1,04 1,37 1,62 95,0
90,0 0,03 0,04 0,04 0,07 0,10 0,16 0,25 0,33 0,41 0,49 0,58 0,66 0,83 1,01 1,19 1,55 1,83 90,0
75,0 0,05 0,06 0,07 0,10 0,14 0,22 0,34 0,44 0,54 0,65 0,75 0,85 1,06 1,27 1,48 1,91 2,23 75,0
50,0 0,08 0,09 0,10 0,15 0,21 0,32 0,48 0,61 0,73 0,86 0,99 1,12 1,37 1,63 1,88 2,38 2,76 50,0
25,0 0,12 0,13 0,16 0,22 0,31 0,45 0,66 0,82 0,97 1,14 1,30 1,45 1,76 2,07 2,36 2,95 3,38 25,0
10,0 0,17 0,19 0,23 0,31 0,42 0,61 0,86 1,06 1,25 1,45 1,64 1,82 2,18 2,54 2,87 3,54 4,03 10,0
5,0 0,21 0,24 0,28 0,38 0,51 0,72 1,01 1,24 1,45 1,67 1,87 2,08 2,47 2,85 3,22 3,94 4,46 5,0
1,0 0,32 0,36 0,41 0,55 0,71 0,98 1,35 1,63 1,88 2,15 2,39 2,63 3,09 3,54 3,96 4,78 5,37 1,0
0,025 0,04 0,065 0,10 0,15 0,25 0,40 0,65 1,0 1,5
Acceptance quality limit (tightened inspection) — Sample-size code letter P
0,01 0,015 0,025 0,04 0,065 0,10 0,15 0,25 0,40 0,65
Acceptance quality limit (reduced inspection) — Sample-size code letter R
Figure 17 (continued)
Copyright International Organization for Standardization Reproduced by IHS under license with ISO
Not for ResaleNo reproduction or networking permitted without license from IHS
--`,,`,,,-`-`,,`,,`,`,,`---

ISO 3951-1:2005(E)
52 © ISO 2005 – All rights reserved
24.14 Chart Q
a)
b)
Key X process quality (in percent nonconforming) Y percent of lots expected to be accepted (Pa)
NOTE Figures on curves are AQLs in percent nonconforming.
Figure 18 — Chart Q — Operating characteristics curves for single sample plans, normal inspection
Copyright International Organization for Standardization Reproduced by IHS under license with ISO
Not for ResaleNo reproduction or networking permitted without license from IHS
--`,,`,,,-`-`,,`,,`,`,,`---
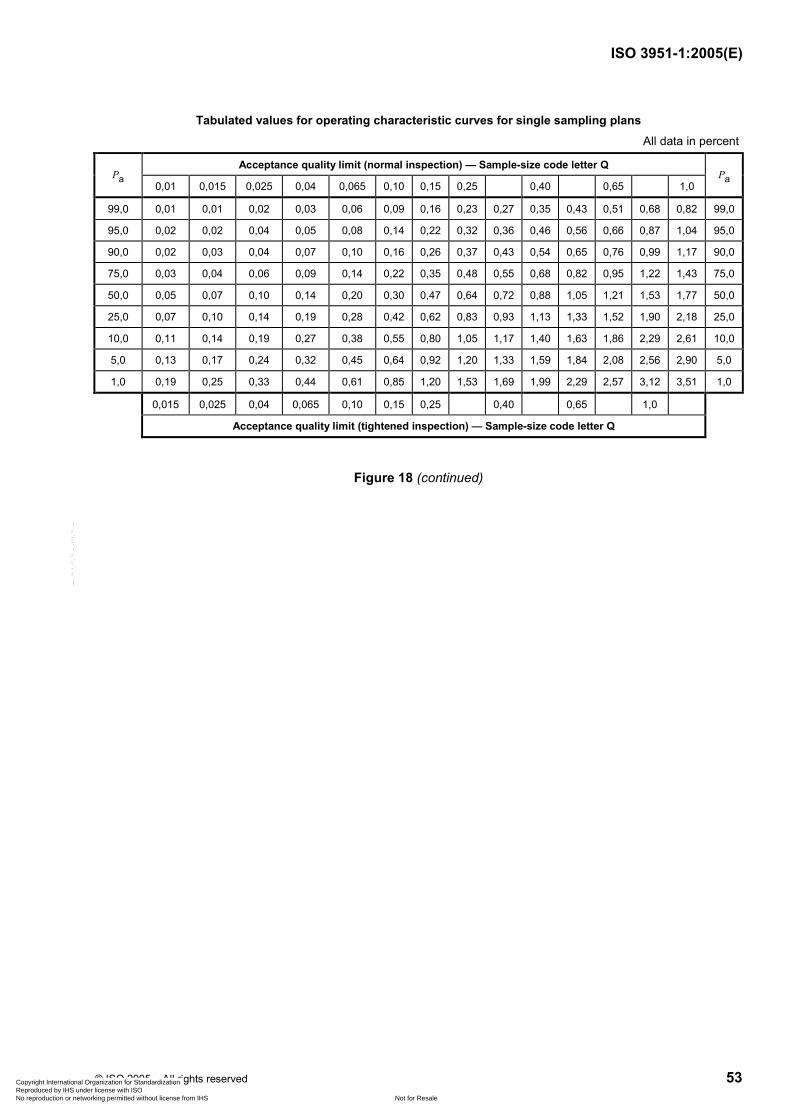
ISO 3951-1:2005(E)
© ISO 2005 – All rights reserved 53
Tabulated values for operating characteristic curves for single sampling plans All data in percent
Acceptance quality limit (normal inspection) — Sample-size code letter Q Pa
0,01 0,015 0,025 0,04 0,065 0,10 0,15 0,25 0,40 0,65 1,0 Pa
99,0 0,01 0,01 0,02 0,03 0,06 0,09 0,16 0,23 0,27 0,35 0,43 0,51 0,68 0,82 99,0
95,0 0,02 0,02 0,04 0,05 0,08 0,14 0,22 0,32 0,36 0,46 0,56 0,66 0,87 1,04 95,0
90,0 0,02 0,03 0,04 0,07 0,10 0,16 0,26 0,37 0,43 0,54 0,65 0,76 0,99 1,17 90,0
75,0 0,03 0,04 0,06 0,09 0,14 0,22 0,35 0,48 0,55 0,68 0,82 0,95 1,22 1,43 75,0
50,0 0,05 0,07 0,10 0,14 0,20 0,30 0,47 0,64 0,72 0,88 1,05 1,21 1,53 1,77 50,0
25,0 0,07 0,10 0,14 0,19 0,28 0,42 0,62 0,83 0,93 1,13 1,33 1,52 1,90 2,18 25,0
10,0 0,11 0,14 0,19 0,27 0,38 0,55 0,80 1,05 1,17 1,40 1,63 1,86 2,29 2,61 10,0
5,0 0,13 0,17 0,24 0,32 0,45 0,64 0,92 1,20 1,33 1,59 1,84 2,08 2,56 2,90 5,0
1,0 0,19 0,25 0,33 0,44 0,61 0,85 1,20 1,53 1,69 1,99 2,29 2,57 3,12 3,51 1,0
0,015 0,025 0,04 0,065 0,10 0,15 0,25 0,40 0,65 1,0
Acceptance quality limit (tightened inspection) — Sample-size code letter Q
Figure 18 (continued)
Copyright International Organization for Standardization Reproduced by IHS under license with ISO
Not for ResaleNo reproduction or networking permitted without license from IHS
--`,,`,,,-`-`,,`,,`,`,,`---
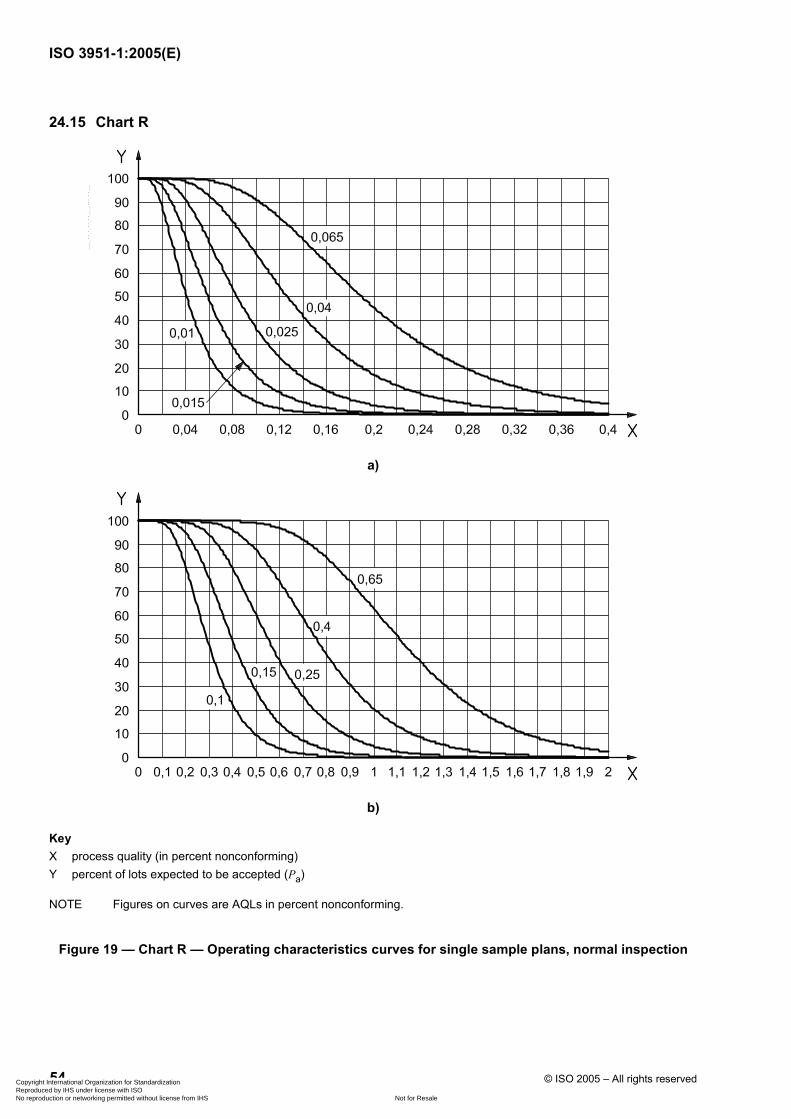
ISO 3951-1:2005(E)
54 © ISO 2005 – All rights reserved
24.15 Chart R
a)
b)
Key X process quality (in percent nonconforming) Y percent of lots expected to be accepted (Pa)
NOTE Figures on curves are AQLs in percent nonconforming.
Figure 19 — Chart R — Operating characteristics curves for single sample plans, normal inspection
Copyright International Organization for Standardization Reproduced by IHS under license with ISO
Not for ResaleNo reproduction or networking permitted without license from IHS
--`,,`,,,-`-`,,`,,`,`,,`---

ISO 3951-1:2005(E)
© ISO 2005 – All rights reserved 55
Tabulated values for operating characteristic curves for single sampling plans All data in percent
Acceptance quality limit (normal inspection) — Sample-size code letter R Pa
0,010 0,015 0,025 0,04 0,065 0,10 0,15 0,25 0,40 0,65 Pa
99,0 0,01 0,01 0,01 0,02 0,04 0,06 0,10 0,15 0,17 0,22 0,27 0,32 0,43 0,51 99,0
95,0 0,01 0,01 0,02 0,03 0,05 0,09 0,14 0,20 0,23 0,29 0,35 0,42 0,55 0,65 95,0
90,0 0,01 0,02 0,03 0,04 0,07 0,10 0,17 0,23 0,27 0,34 0,41 0,48 0,62 0,73 90,0
75,0 0,02 0,03 0,04 0,06 0,09 0,14 0,22 0,30 0,34 0,43 0,51 0,60 0,77 0,90 75,0
50,0 0,03 0,04 0,06 0,08 0,13 0,19 0,29 0,40 0,45 0,55 0,65 0,76 0,96 1,11 50,0
25,0 0,04 0,06 0,09 0,12 0,18 0,26 0,39 0,52 0,58 0,71 0,83 0,95 1,19 1,37 25,0
10,0 0,06 0,08 0,12 0,16 0,23 0,34 0,49 0,65 0,73 0,88 1,02 1,16 1,44 1,65 10,0
5,0 0,08 0,10 0,14 0,19 0,28 0,39 0,57 0,75 0,83 0,99 1,15 1,31 1,61 1,83 5,0
1,0 0,11 0,15 0,20 0,27 0,37 0,52 0,74 0,95 1,05 1,25 1,44 1,62 1,97 2,23 1,0
0,010 0,015 0,025 0,04 0,065 0,10 0,15 0,25 0,40 0,65
Acceptance quality limit (tightened inspection) — Sample-size code letter R
Figure 19 (continued)
Copyright International Organization for Standardization Reproduced by IHS under license with ISO
Not for ResaleNo reproduction or networking permitted without license from IHS
--`,,`,,,-`-`,,`,,`,`,,`---
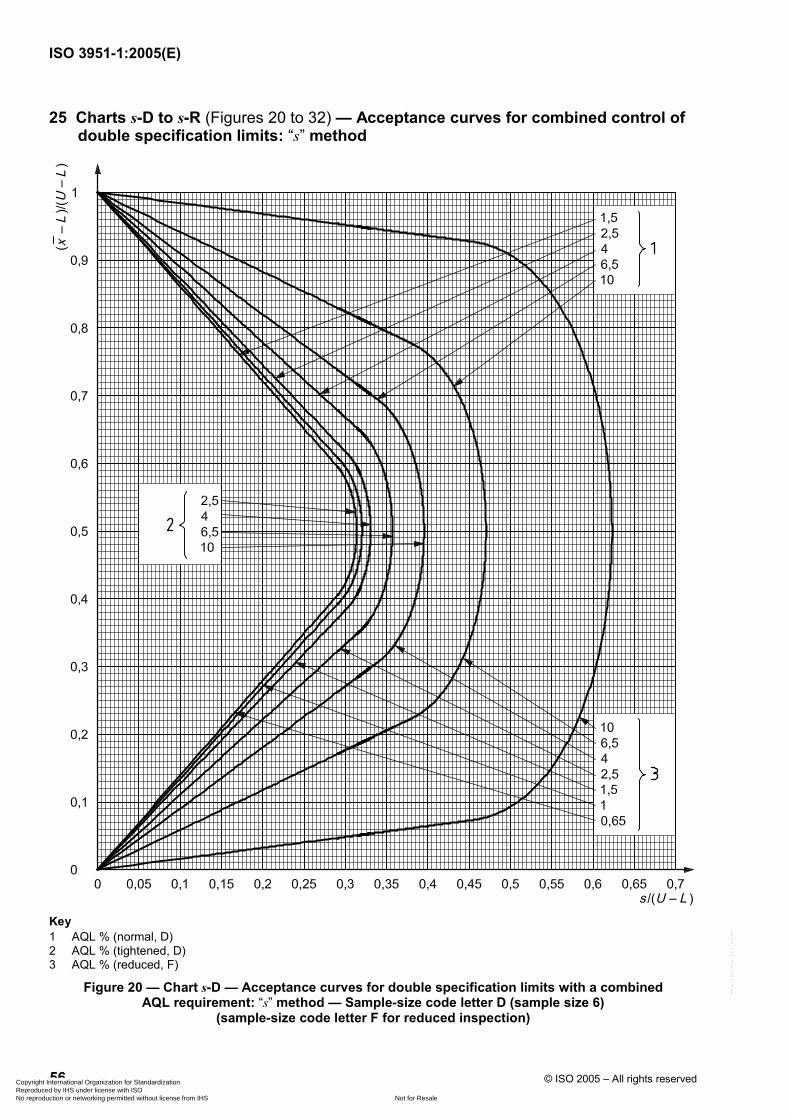
ISO 3951-1:2005(E)
56 © ISO 2005 – All rights reserved
25 Charts s-D to s-R (Figures 20 to 32) — Acceptance curves for combined control of double specification limits: “s” method
Key 1 AQL % (normal, D) 2 AQL % (tightened, D) 3 AQL % (reduced, F)
Figure 20 — Chart s-D — Acceptance curves for double specification limits with a combined AQL requirement: “s” method — Sample-size code letter D (sample size 6)
(sample-size code letter F for reduced inspection)
Copyright International Organization for Standardization Reproduced by IHS under license with ISO
Not for ResaleNo reproduction or networking permitted without license from IHS
--`,,`,,,-`-`,,`,,`,`,,`---
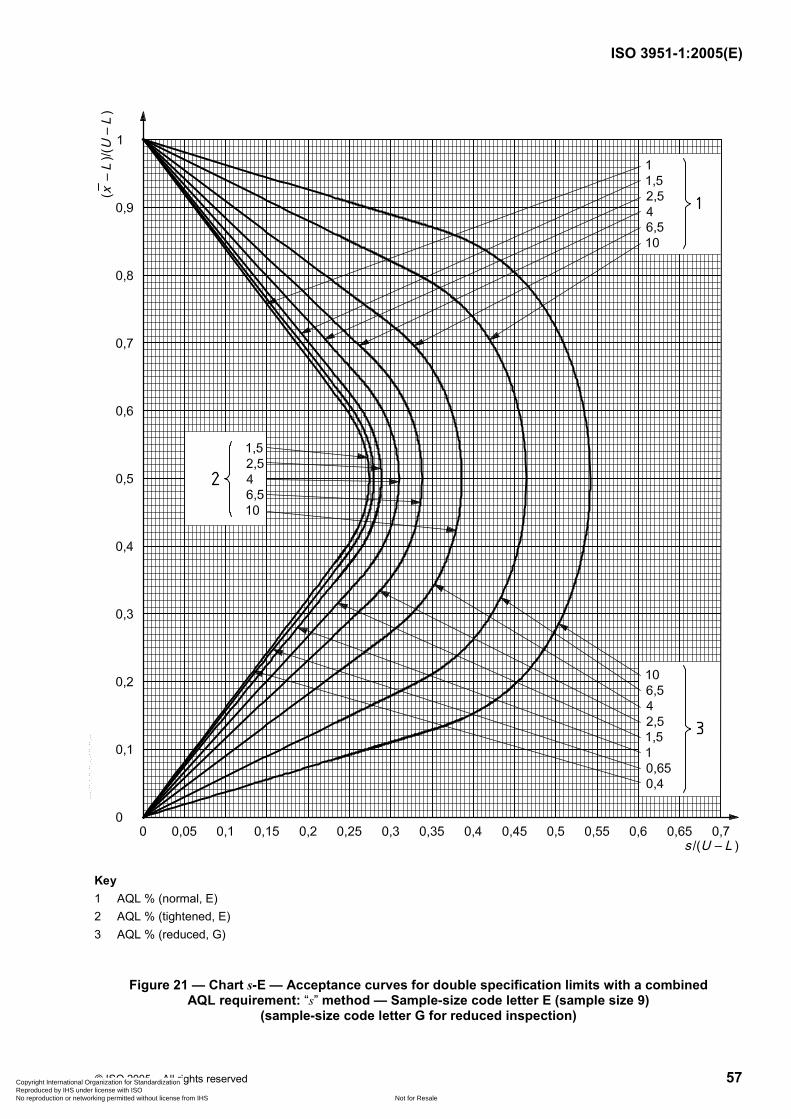
ISO 3951-1:2005(E)
© ISO 2005 – All rights reserved 57
Key 1 AQL % (normal, E) 2 AQL % (tightened, E) 3 AQL % (reduced, G)
Figure 21 — Chart s-E — Acceptance curves for double specification limits with a combined AQL requirement: “s” method — Sample-size code letter E (sample size 9)
(sample-size code letter G for reduced inspection)
Copyright International Organization for Standardization Reproduced by IHS under license with ISO
Not for ResaleNo reproduction or networking permitted without license from IHS
--`,,`,,,-`-`,,`,,`,`,,`---
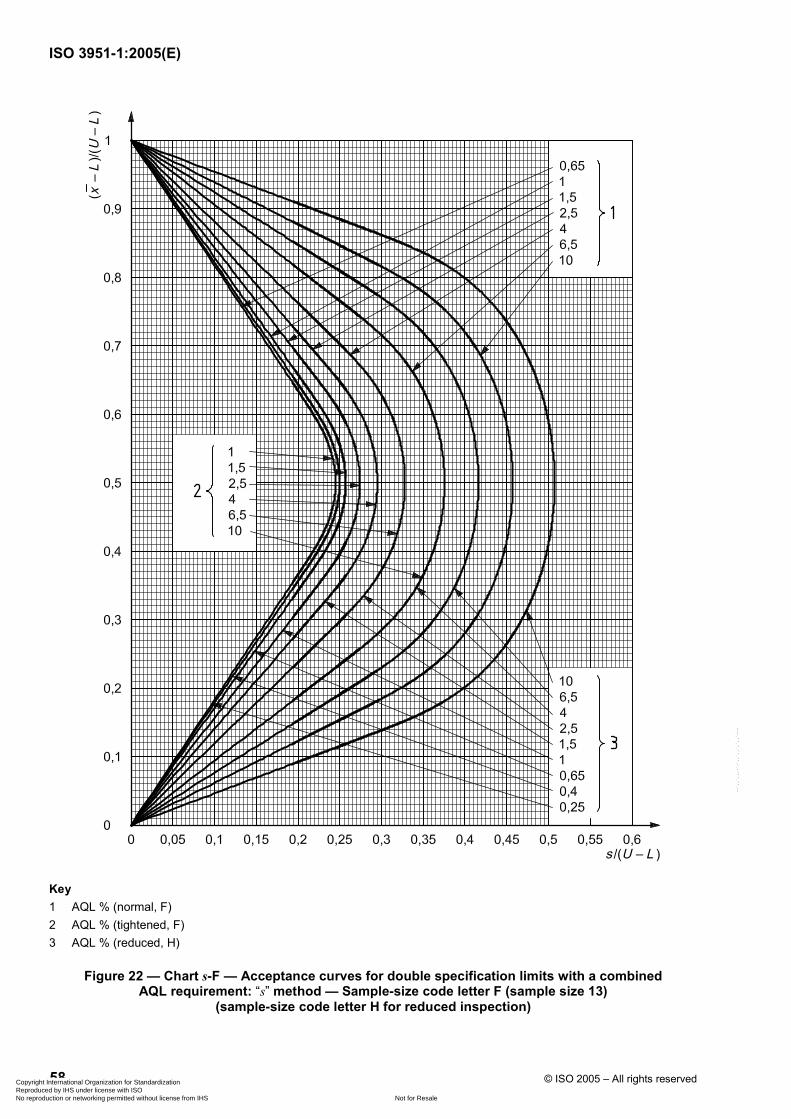
ISO 3951-1:2005(E)
58 © ISO 2005 – All rights reserved
Key 1 AQL % (normal, F) 2 AQL % (tightened, F) 3 AQL % (reduced, H)
Figure 22 — Chart s-F — Acceptance curves for double specification limits with a combined AQL requirement: “s” method — Sample-size code letter F (sample size 13)
(sample-size code letter H for reduced inspection)
Copyright International Organization for Standardization Reproduced by IHS under license with ISO
Not for ResaleNo reproduction or networking permitted without license from IHS
--`,,`,,,-`-`,,`,,`,`,,`---
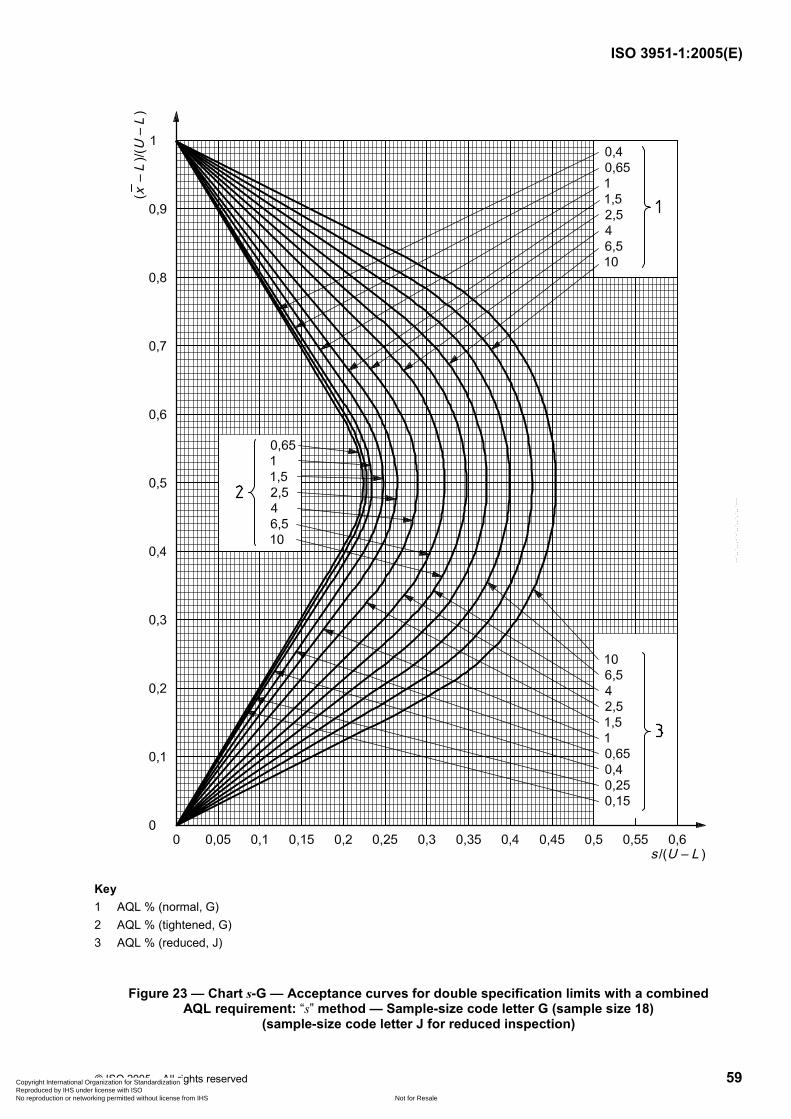
ISO 3951-1:2005(E)
© ISO 2005 – All rights reserved 59
Key 1 AQL % (normal, G) 2 AQL % (tightened, G) 3 AQL % (reduced, J)
Figure 23 — Chart s-G — Acceptance curves for double specification limits with a combined AQL requirement: “s” method — Sample-size code letter G (sample size 18)
(sample-size code letter J for reduced inspection)
Copyright International Organization for Standardization Reproduced by IHS under license with ISO
Not for ResaleNo reproduction or networking permitted without license from IHS
--`,,`,,,-`-`,,`,,`,`,,`---
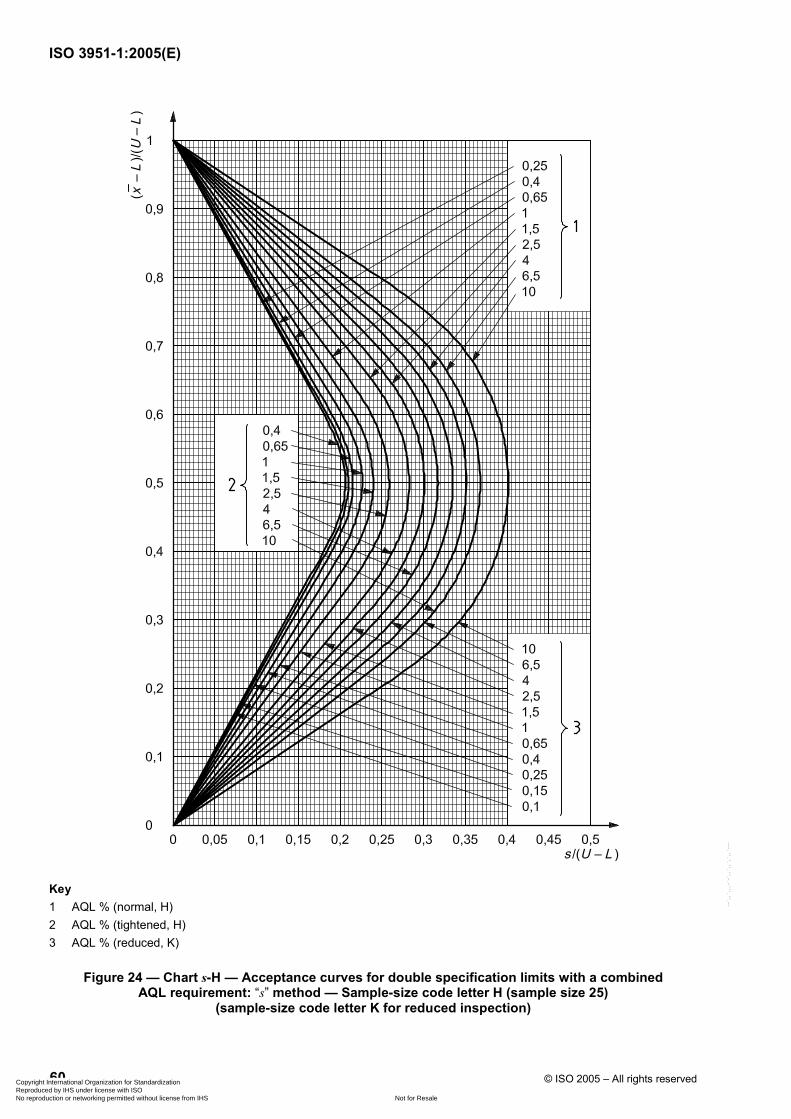
ISO 3951-1:2005(E)
60 © ISO 2005 – All rights reserved
Key 1 AQL % (normal, H) 2 AQL % (tightened, H) 3 AQL % (reduced, K)
Figure 24 — Chart s-H — Acceptance curves for double specification limits with a combined AQL requirement: “s” method — Sample-size code letter H (sample size 25)
(sample-size code letter K for reduced inspection)
Copyright International Organization for Standardization Reproduced by IHS under license with ISO
Not for ResaleNo reproduction or networking permitted without license from IHS
--`,,`,,,-`-`,,`,,`,`,,`---
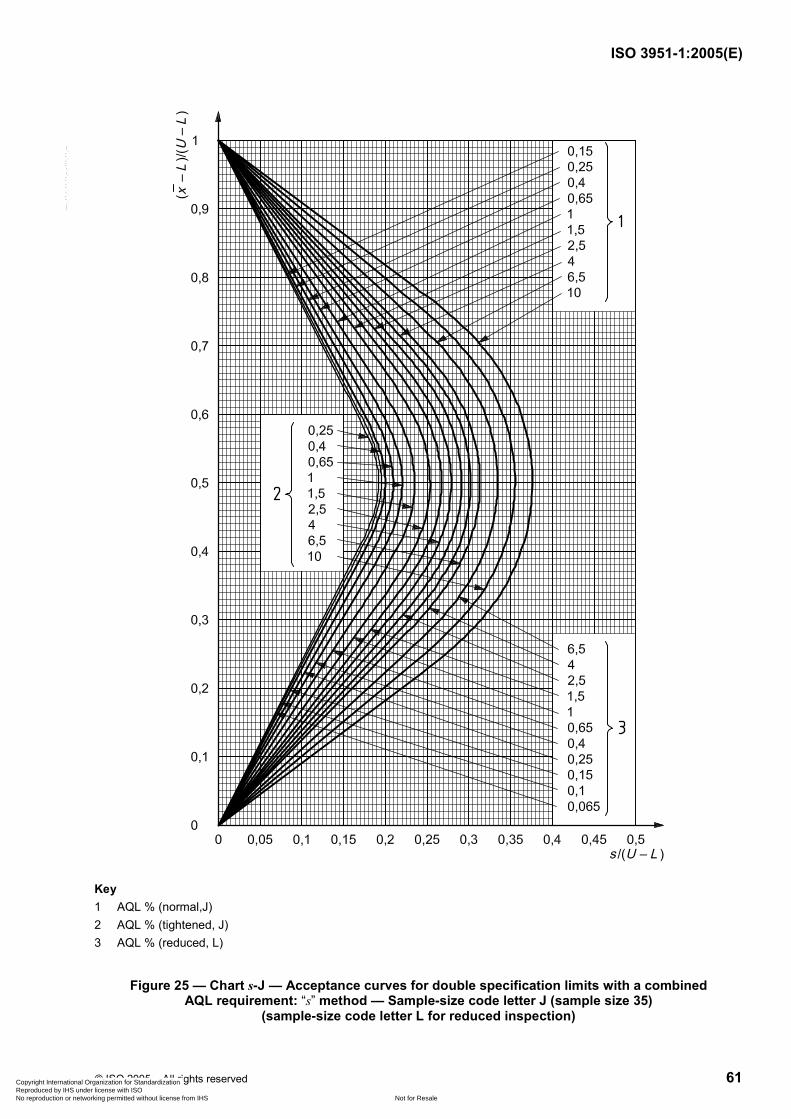
ISO 3951-1:2005(E)
© ISO 2005 – All rights reserved 61
Key 1 AQL % (normal,J) 2 AQL % (tightened, J) 3 AQL % (reduced, L)
Figure 25 — Chart s-J — Acceptance curves for double specification limits with a combined AQL requirement: “s” method — Sample-size code letter J (sample size 35)
(sample-size code letter L for reduced inspection)
Copyright International Organization for Standardization Reproduced by IHS under license with ISO
Not for ResaleNo reproduction or networking permitted without license from IHS
--`,,`,,,-`-`,,`,,`,`,,`---
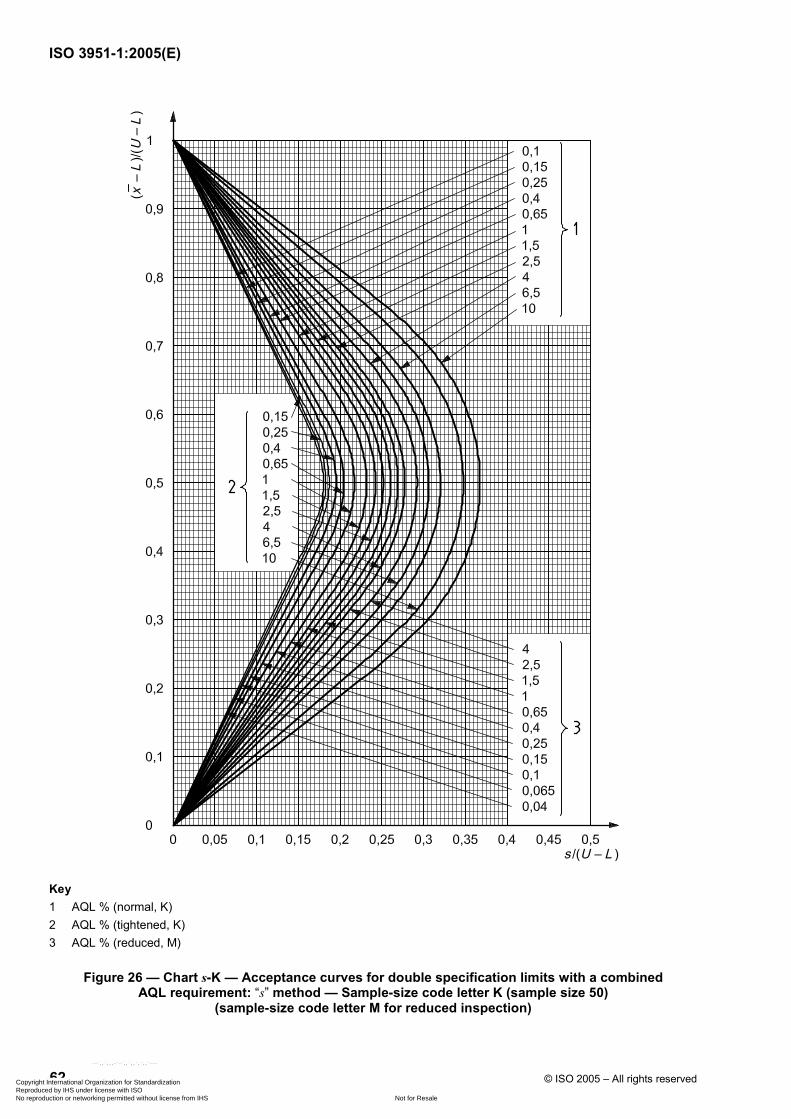
ISO 3951-1:2005(E)
62 © ISO 2005 – All rights reserved
Key 1 AQL % (normal, K) 2 AQL % (tightened, K) 3 AQL % (reduced, M)
Figure 26 — Chart s-K — Acceptance curves for double specification limits with a combined AQL requirement: “s” method — Sample-size code letter K (sample size 50)
(sample-size code letter M for reduced inspection)
Copyright International Organization for Standardization Reproduced by IHS under license with ISO
Not for ResaleNo reproduction or networking permitted without license from IHS
--`,,`,,,-`-`,,`,,`,`,,`---
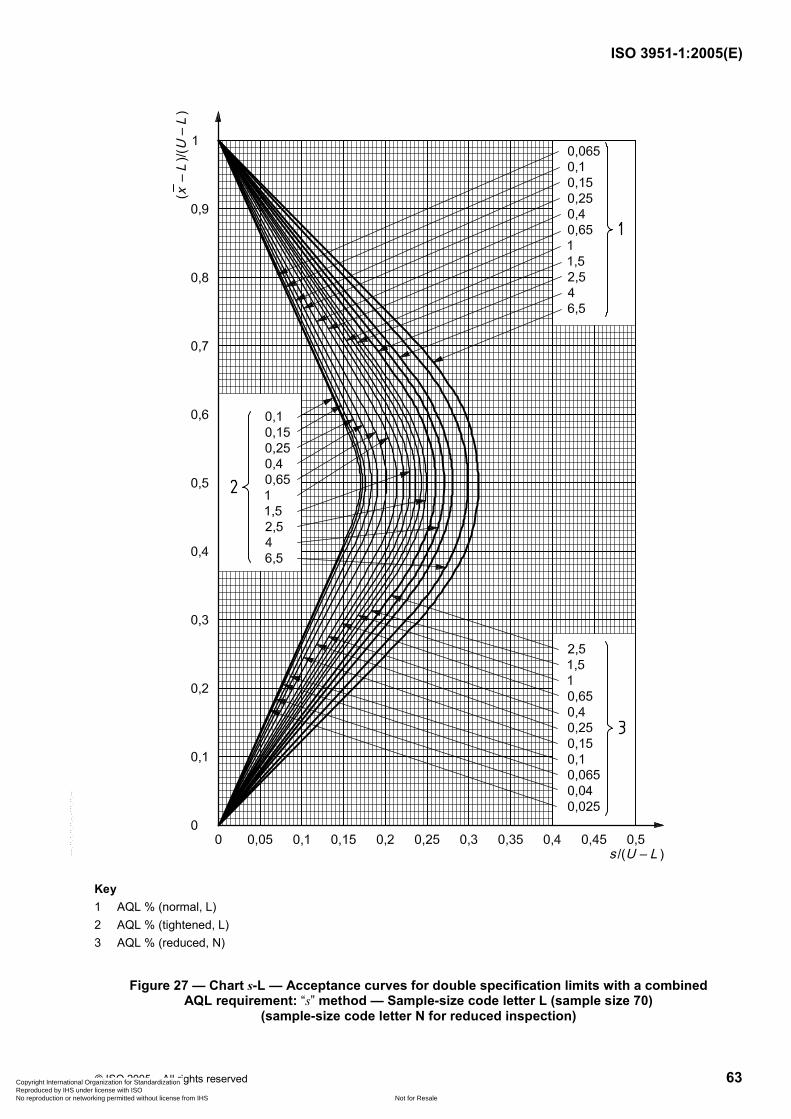
ISO 3951-1:2005(E)
© ISO 2005 – All rights reserved 63
Key 1 AQL % (normal, L) 2 AQL % (tightened, L) 3 AQL % (reduced, N)
Figure 27 — Chart s-L — Acceptance curves for double specification limits with a combined AQL requirement: “s” method — Sample-size code letter L (sample size 70)
(sample-size code letter N for reduced inspection)
Copyright International Organization for Standardization Reproduced by IHS under license with ISO
Not for ResaleNo reproduction or networking permitted without license from IHS
--`,,`,,,-`-`,,`,,`,`,,`---
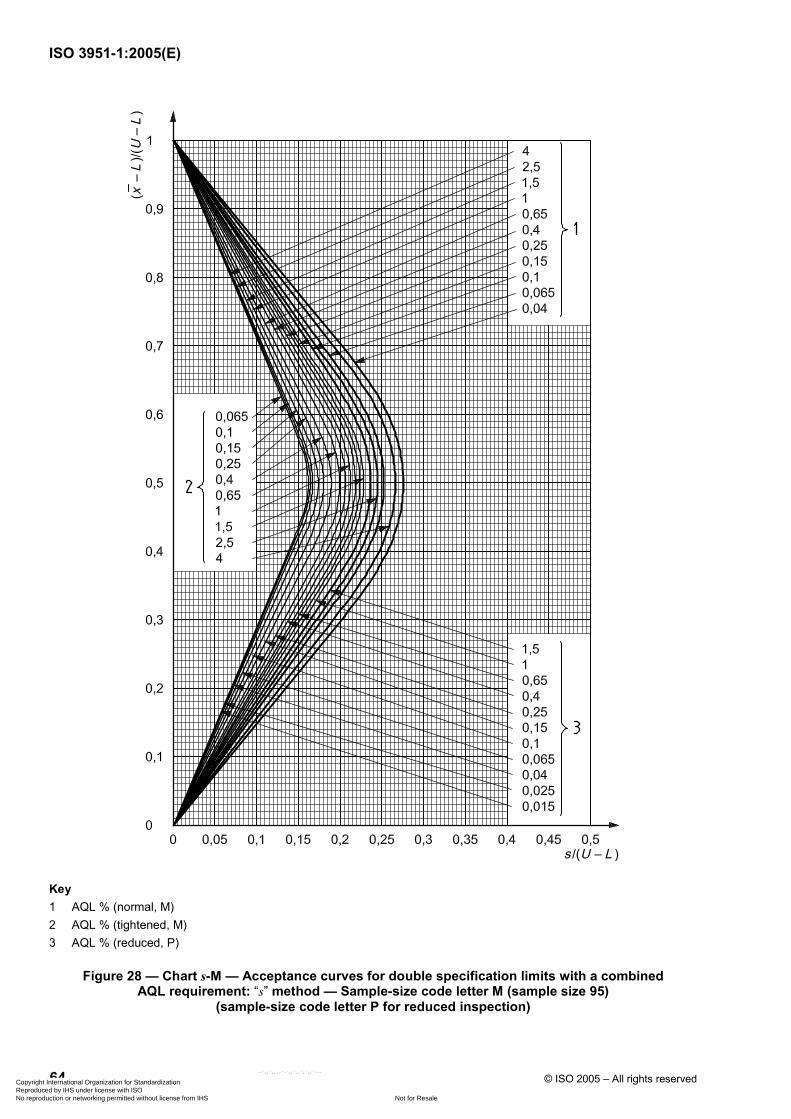
ISO 3951-1:2005(E)
64 © ISO 2005 – All rights reserved
Key 1 AQL % (normal, M) 2 AQL % (tightened, M) 3 AQL % (reduced, P)
Figure 28 — Chart s-M — Acceptance curves for double specification limits with a combined AQL requirement: “s” method — Sample-size code letter M (sample size 95)
(sample-size code letter P for reduced inspection)
Copyright International Organization for Standardization Reproduced by IHS under license with ISO
Not for ResaleNo reproduction or networking permitted without license from IHS
--`,,`,,,-`-`,,`,,`,`,,`---
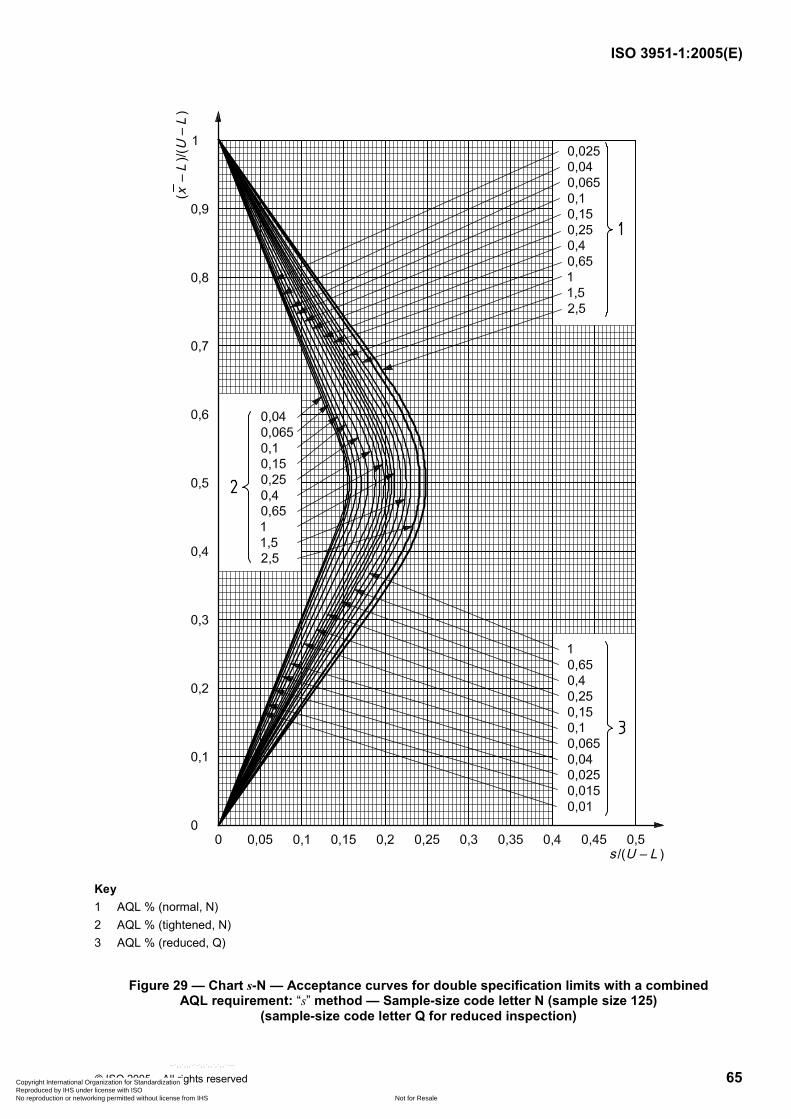
ISO 3951-1:2005(E)
© ISO 2005 – All rights reserved 65
Key 1 AQL % (normal, N) 2 AQL % (tightened, N) 3 AQL % (reduced, Q)
Figure 29 — Chart s-N — Acceptance curves for double specification limits with a combined AQL requirement: “s” method — Sample-size code letter N (sample size 125)
(sample-size code letter Q for reduced inspection)
Copyright International Organization for Standardization Reproduced by IHS under license with ISO
Not for ResaleNo reproduction or networking permitted without license from IHS
--`,,`,,,-`-`,,`,,`,`,,`---
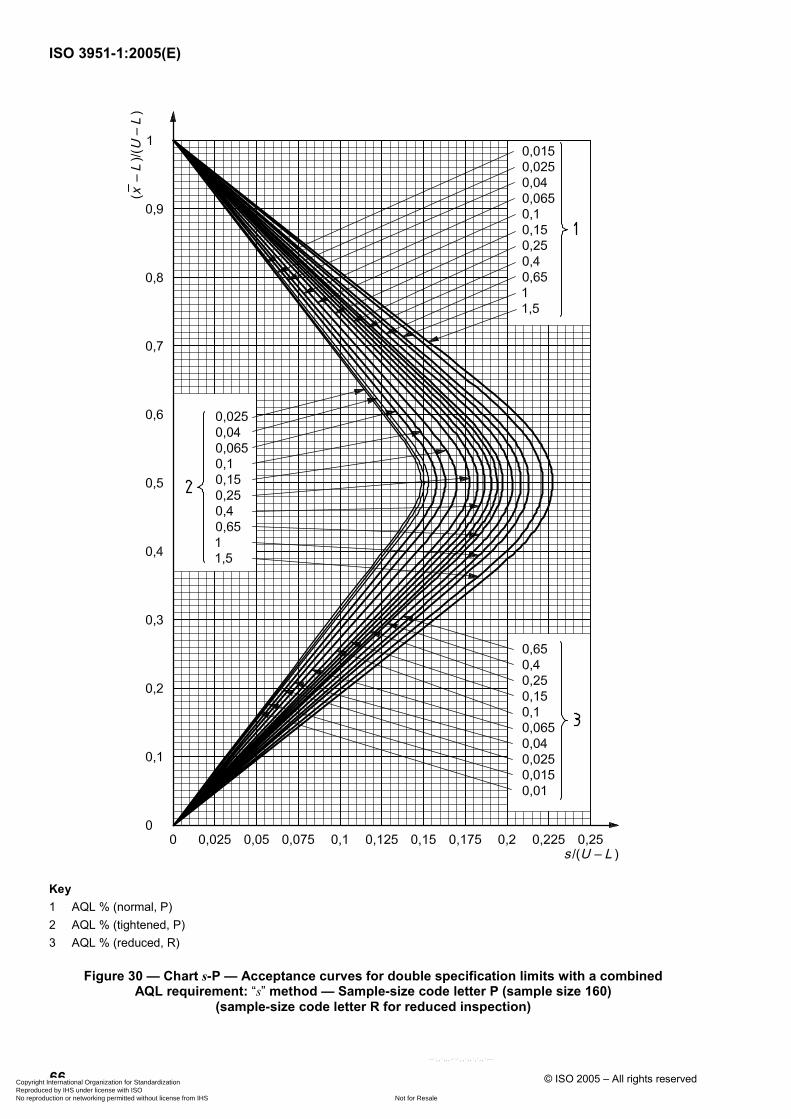
ISO 3951-1:2005(E)
66 © ISO 2005 – All rights reserved
Key 1 AQL % (normal, P) 2 AQL % (tightened, P) 3 AQL % (reduced, R)
Figure 30 — Chart s-P — Acceptance curves for double specification limits with a combined AQL requirement: “s” method — Sample-size code letter P (sample size 160)
(sample-size code letter R for reduced inspection)
Copyright International Organization for Standardization Reproduced by IHS under license with ISO
Not for ResaleNo reproduction or networking permitted without license from IHS
--`,,`,,,-`-`,,`,,`,`,,`---
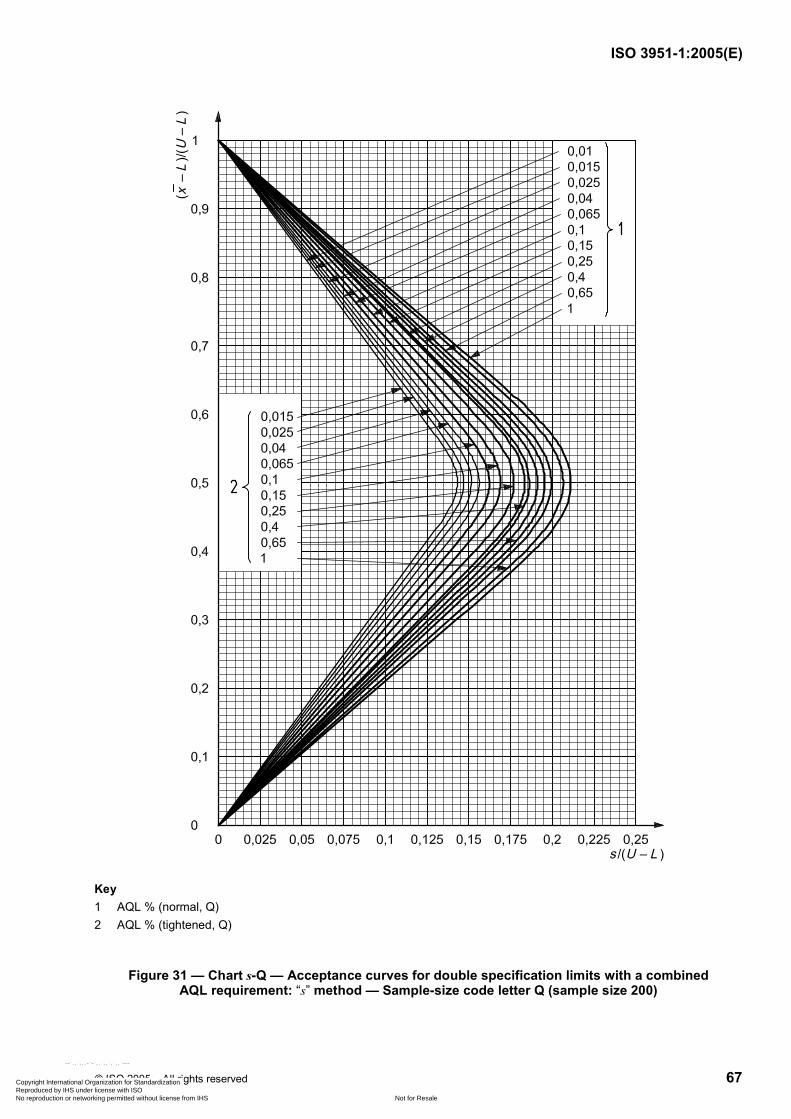
ISO 3951-1:2005(E)
© ISO 2005 – All rights reserved 67
Key 1 AQL % (normal, Q) 2 AQL % (tightened, Q)
Figure 31 — Chart s-Q — Acceptance curves for double specification limits with a combined AQL requirement: “s” method — Sample-size code letter Q (sample size 200)
Copyright International Organization for Standardization Reproduced by IHS under license with ISO
Not for ResaleNo reproduction or networking permitted without license from IHS
--`,,`,,,-`-`,,`,,`,`,,`---
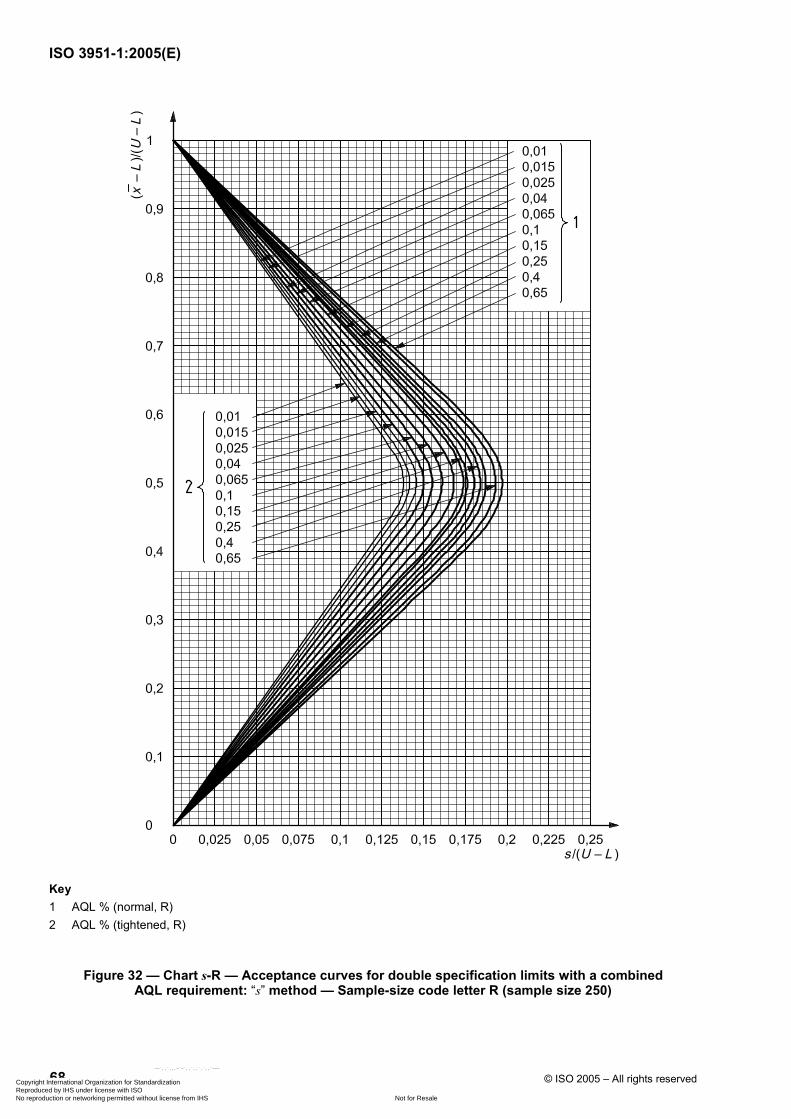
ISO 3951-1:2005(E)
68 © ISO 2005 – All rights reserved
Key 1 AQL % (normal, R) 2 AQL % (tightened, R)
Figure 32 — Chart s-R — Acceptance curves for double specification limits with a combined AQL requirement: “s” method — Sample-size code letter R (sample size 250)
Copyright International Organization for Standardization Reproduced by IHS under license with ISO
Not for ResaleNo reproduction or networking permitted without license from IHS
--`,,`,,,-`-`,,`,,`,`,,`---
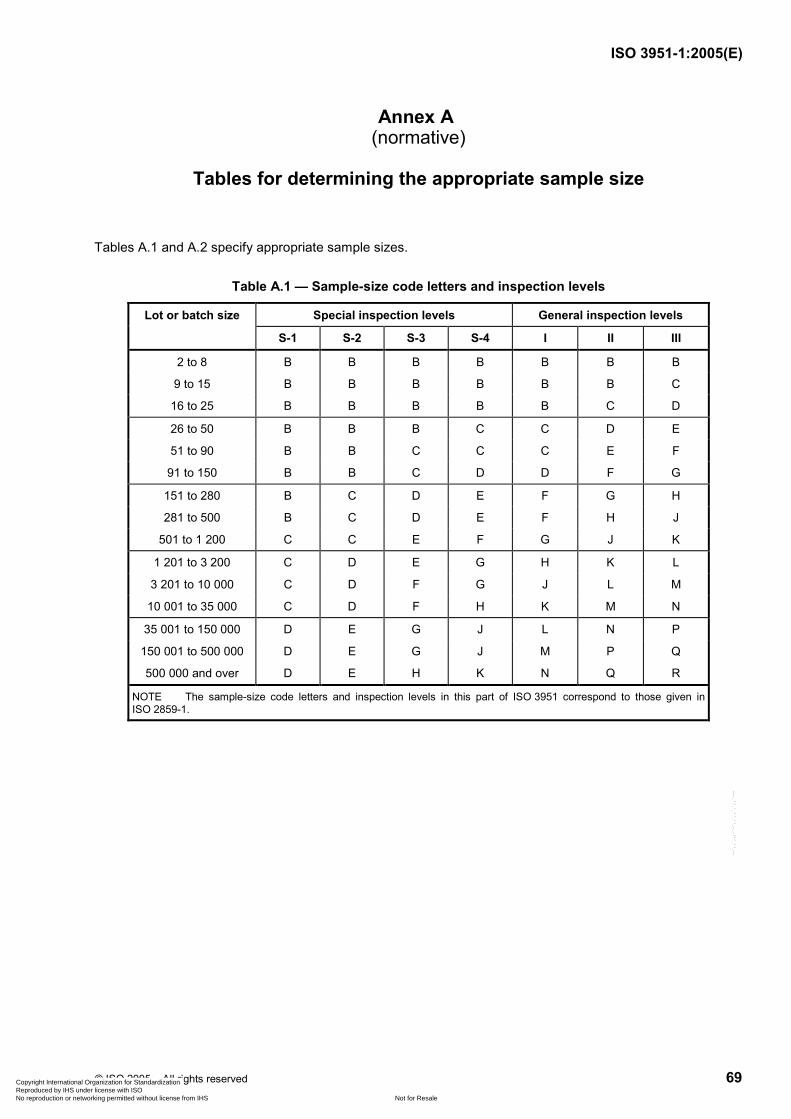
ISO 3951-1:2005(E)
© ISO 2005 – All rights reserved 69
Annex A (normative)
Tables for determining the appropriate sample size
Tables A.1 and A.2 specify appropriate sample sizes.
Table A.1 — Sample-size code letters and inspection levels
Special inspection levels General inspection levels Lot or batch size
S-1 S-2 S-3 S-4 I II III
2 to 8 B B B B B B B
9 to 15 B B B B B B C
16 to 25 B B B B B C D
26 to 50 B B B C C D E
51 to 90 B B C C C E F
91 to 150 B B C D D F G
151 to 280 B C D E F G H
281 to 500 B C D E F H J
501 to 1 200 C C E F G J K
1 201 to 3 200 C D E G H K L
3 201 to 10 000 C D F G J L M
10 001 to 35 000 C D F H K M N
35 001 to 150 000 D E G J L N P
150 001 to 500 000 D E G J M P Q
500 000 and over D E H K N Q R
NOTE The sample-size code letters and inspection levels in this part of ISO 3951 correspond to those given in ISO 2859-1.
Copyright International Organization for Standardization Reproduced by IHS under license with ISO
Not for ResaleNo reproduction or networking permitted without license from IHS
--`,,`,,,-`-`,,`,,`,`,,`---
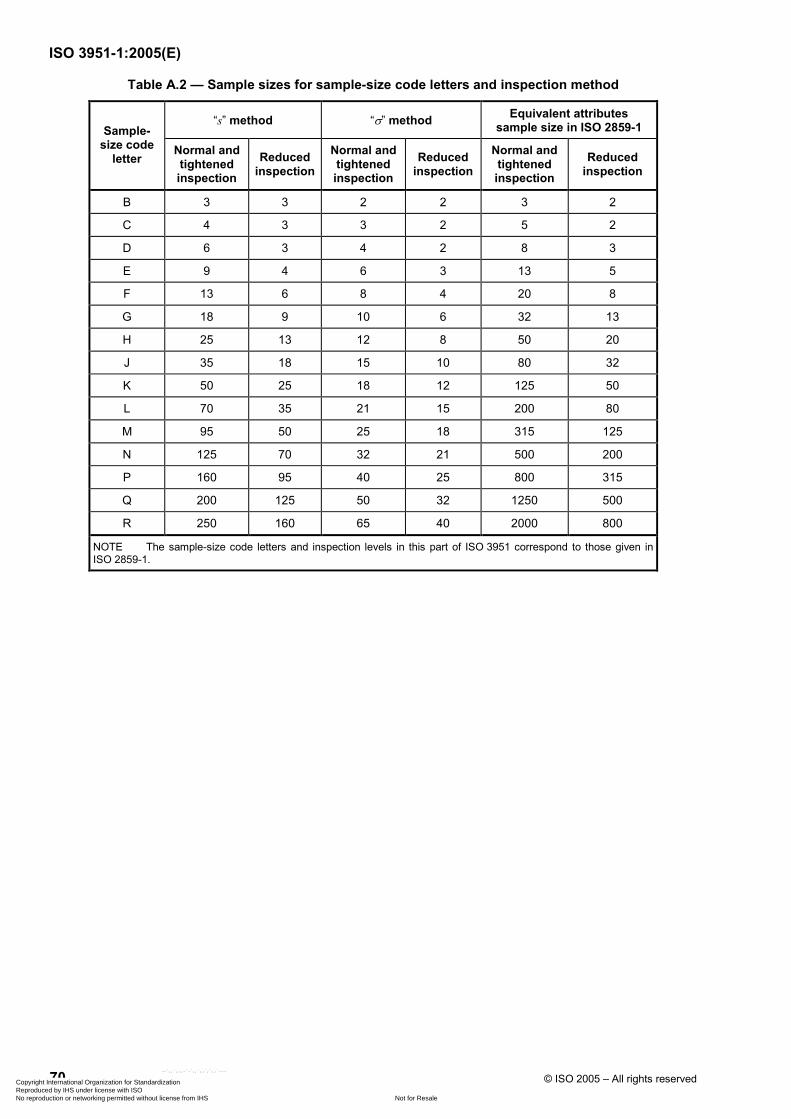
ISO 3951-1:2005(E)
70 © ISO 2005 – All rights reserved
Table A.2 — Sample sizes for sample-size code letters and inspection method
“s” method “σ” method Equivalent attributes sample size in ISO 2859-1 Sample-
size code letter
Normal and tightened inspection
Reduced inspection
Normal and tightened inspection
Reduced inspection
Normal and tightened inspection
Reduced inspection
B 3 3 2 2 3 2
C 4 3 3 2 5 2
D 6 3 4 2 8 3
E 9 4 6 3 13 5
F 13 6 8 4 20 8
G 18 9 10 6 32 13
H 25 13 12 8 50 20
J 35 18 15 10 80 32
K 50 25 18 12 125 50
L 70 35 21 15 200 80
M 95 50 25 18 315 125
N 125 70 32 21 500 200
P 160 95 40 25 800 315
Q 200 125 50 32 1250 500
R 250 160 65 40 2000 800
NOTE The sample-size code letters and inspection levels in this part of ISO 3951 correspond to those given in ISO 2859-1.
Copyright International Organization for Standardization Reproduced by IHS under license with ISO
Not for ResaleNo reproduction or networking permitted without license from IHS
--`,,`,,,-`-`,,`,,`,`,,`---
ISO 3951-1:2005(E)
© ISO 2005 – All rights reserved 71
Annex B (normative)
Form k single sampling plans for the “s” method
Tables B.1 to B.3 provide single sampling plans for the “s” method.
Copyright International Organization for Standardization Reproduced by IHS under license with ISO
Not for ResaleNo reproduction or networking permitted without license from IHS
--`,,`,,,-`-`,,`,,`,`,,`---
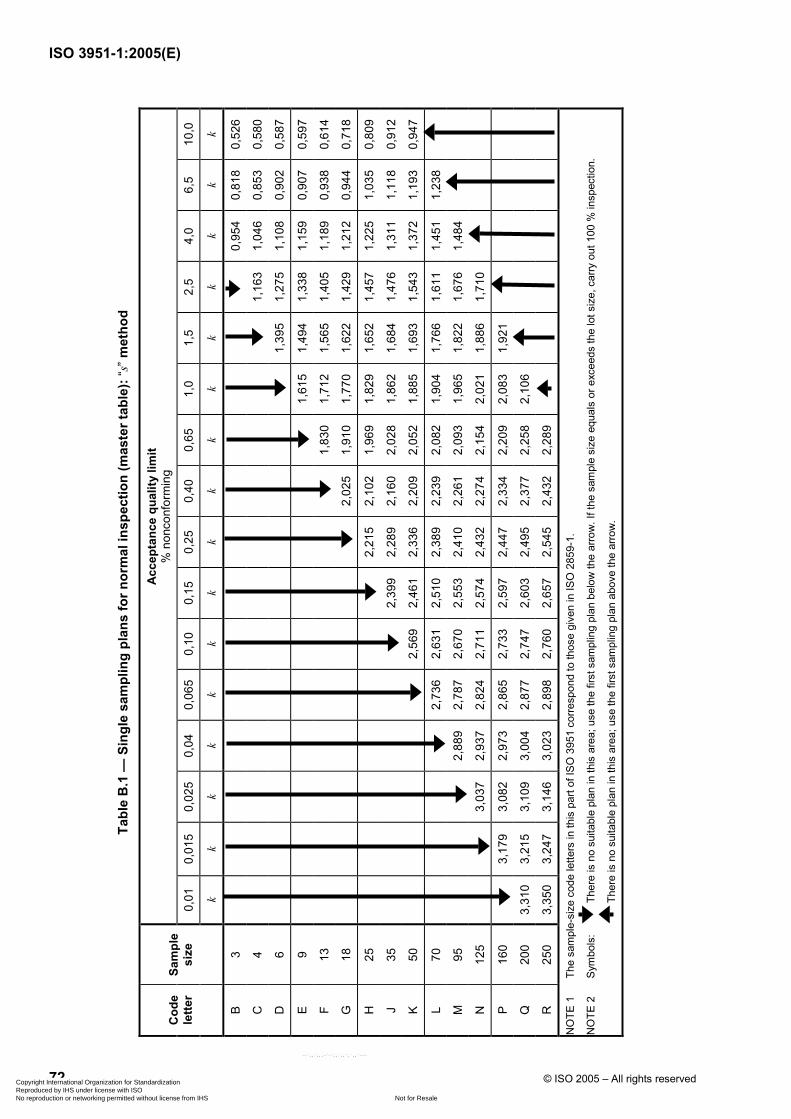
ISO 3951-1:2005(E)
72 © ISO 2005 – All rights reserved
Tabl
e B
.1 —
Sin
gle
sam
plin
g pl
ans
for n
orm
al in
spec
tion
(mas
ter t
able
): “s
” met
hod
Acce
ptan
ce q
ualit
y lim
it
% n
onco
nfor
min
g
0,01
0,
015
0,02
5 0,
04
0,06
5 0,
10
0,15
0,
25
0,40
0,
65
1,0
1,5
2,5
4,0
6,5
10,0
C
ode
lette
r Sa
mpl
e si
ze
k k
k k
k k
k k
k k
k k
k k
k k
B 3
0,
954
0,81
8 0,
526
C
4
1,
163
1,04
6 0,
853
0,58
0
D
6
1,39
5 1,
275
1,10
8 0,
902
0,58
7
E 9
1,61
5 1,
494
1,33
8 1,
159
0,90
7 0,
597
F 13
1,83
0 1,
712
1,56
5 1,
405
1,18
9 0,
938
0,61
4
G
18
2,02
5 1,
910
1,77
0 1,
622
1,42
9 1,
212
0,94
4 0,
718
H
25
2,
215
2,10
2 1,
969
1,82
9 1,
652
1,45
7 1,
225
1,03
5 0,
809
J 35
2,
399
2,28
9 2,
160
2,02
8 1,
862
1,68
4 1,
476
1,31
1 1,
118
0,91
2
K 50
2,56
9 2,
461
2,33
6 2,
209
2,05
2 1,
885
1,69
3 1,
543
1,37
2 1,
193
0,94
7
L 70
2,
736
2,63
1 2,
510
2,38
9 2,
239
2,08
2 1,
904
1,76
6 1,
611
1,45
1 1,
238
M
95
2,
889
2,78
7 2,
670
2,55
3 2,
410
2,26
1 2,
093
1,96
5 1,
822
1,67
6 1,
484
N
125
3,03
7 2,
937
2,82
4 2,
711
2,57
4 2,
432
2,27
4 2,
154
2,02
1 1,
886
1,71
0
P 16
0
3,17
9 3,
082
2,97
3 2,
865
2,73
3 2,
597
2,44
7 2,
334
2,20
9 2,
083
1,92
1
Q
200
3,31
0 3,
215
3,10
9 3,
004
2,87
7 2,
747
2,60
3 2,
495
2,37
7 2,
258
2,10
6
R
250
3,35
0 3,
247
3,14
6 3,
023
2,89
8 2,
760
2,65
7 2,
545
2,43
2 2,
289
NO
TE 1
Th
e sa
mpl
e-si
ze c
ode
lette
rs in
this
par
t of I
SO 3
951
corre
spon
d to
thos
e gi
ven
in IS
O 2
859-
1.
NO
TE 2
Sy
mbo
ls:
Ther
e is
no
suita
ble
plan
in th
is a
rea;
use
the
first
sam
plin
g pl
an b
elow
the
arro
w. I
f the
sam
ple
size
equ
als
or e
xcee
ds th
e lo
t siz
e, c
arry
out
100
% in
spec
tion.
Ther
e is
no
suita
ble
plan
in th
is a
rea;
use
the
first
sam
plin
g pl
an a
bove
the
arro
w.
Copyright International Organization for Standardization Reproduced by IHS under license with ISO
Not for ResaleNo reproduction or networking permitted without license from IHS
--`,,`,,,-`-`,,`,,`,`,,`---
© ISO 2005 – All rights reserved 73
Tabl
e B
.2 —
Sin
gle
sam
plin
g pl
ans
for t
ight
ened
insp
ectio
n (m
aste
r tab
le):
“s” m
etho
d
Acce
ptan
ce q
ualit
y lim
it
% n
onco
nfor
min
g
0,01
0,
015
0,02
5 0,
04
0,06
5 0,
10
0,15
0,
25
0,40
0,
65
1,0
1,5
2,5
4,0
6,5
10,0
C
ode
lette
r Sa
mpl
e si
ze
k k
k k
k k
k k
k k
k k
k k
k k
B 3
0,95
4 0,
818
C
4
1,16
3 1,
046
0,85
3
D
6
1,
395
1,27
5 1,
108
0,90
2
E 9
1,
615
1,49
4 1,
338
1,15
9 0,
907
F 13
1,
830
1,71
2 1,
565
1,40
5 1,
189
0,93
8
G
18
2,
025
1,91
0 1,
770
1,62
2 1,
429
1,21
2 0,
944
H
25
2,21
5 2,
102
1,96
9 1,
829
1,65
2 1,
457
1,22
5 0,
995
J 35
2,39
9 2,
289
2,16
0 2,
028
1,86
2 1,
684
1,47
6 1,
242
1,01
0
K 50
2,
569
2,46
1 2,
336
2,20
9 2,
052
1,88
5 1,
693
1,48
1 1,
277
1,04
4
L 70
2,73
6 2,
631
2,51
0 2,
389
2,23
9 2,
082
1,90
4 1,
710
1,52
6 1,
322
M
95
2,88
9 2,
787
2,67
0 2,
553
2,41
0 2,
261
2,09
3 1,
913
1,74
5 1,
559
N
125
3,
037
2,93
7 2,
824
2,71
1 2,
574
2,43
2 2,
274
2,10
5 1,
949
1,77
9
P 16
0
3,
179
3,08
2 2,
973
2,86
5 2,
733
2,59
7 2,
447
2,28
8 2,
141
1,98
4
Q
200
3,
310
3,21
5 3,
109
3,00
4 2,
877
2,74
7 2,
603
2,45
2 2,
313
2,16
5
R
250
3,44
2 3,
350
3,24
7 3,
146
3,02
3 2,
898
2,76
0 2,
616
2,48
5 2,
345
NO
TE 1
Th
e sa
mpl
e-si
ze c
ode
lette
rs in
this
Inte
rnat
iona
l Sta
ndar
d co
rresp
ond
to th
ose
give
n in
ISO
285
9-1.
NO
TE 2
Sy
mbo
ls:
Ther
e is
no
suita
ble
plan
in th
is a
rea;
use
the
first
sam
plin
g pl
an b
elow
the
arro
w. I
f the
sam
ple
size
equ
als
or e
xcee
ds th
e lo
t siz
e, c
arry
out
100
% in
spec
tion.
Ther
e is
no
suita
ble
plan
in th
is a
rea;
use
the
first
sam
plin
g pl
an a
bove
the
arro
w.
ISO 3951-1:2005(E)
Copyright International Organization for Standardization Reproduced by IHS under license with ISO
Not for ResaleNo reproduction or networking permitted without license from IHS
--`,,`,,,-`-`,,`,,`,`,,`---
74 © ISO 2005 – All rights reserved
Tabl
e B
.3 —
Sin
gle
sam
plin
g pl
ans
for r
educ
ed in
spec
tion
(mas
ter t
able
): “s
” met
hod
Acce
ptan
ce q
ualit
y lim
it
% n
onco
nfor
min
g
0,01
0,
015
0,02
5 0,
04
0,06
5 0,
10
0,15
0,
25
0,40
0,
65
1,0
1,5
2,5
4,0
6,5
10,0
C
ode
lette
r Sa
mpl
e si
ze
k k
k k
k k
k k
k k
k k
k k
k k
B - D
3
0,
954
0,90
7 0,
818
0,52
6 0,
023
E 4
1,16
3 1,
119
1,04
6 0,
853
0,58
0 0,
099
F 6
1,
395
1,34
8 1,
275
1,10
8 0,
902
0,58
7 0,
161
G
9
1,
615
1,56
6 1,
494
1,33
8 1,
159
0,90
7 0,
597
0,36
8
H
13
1,
830
1,78
2 1,
712
1,56
5 1,
405
1,18
9 0,
938
0,76
3 0,
461
J 18
2,
025
1,97
8 1,
910
1,77
0 1,
622
1,42
9 1,
212
1,06
5 0,
823
0,61
9
K 25
2,21
5 2,
168
2,10
2 1,
969
1,82
9 1,
652
1,45
7 1,
329
1,12
3 0,
955
0,80
9
L 35
2,
399
2,35
3 2,
289
2,16
0 2,
028
1,86
2 1,
684
1,56
9 1,
387
1,24
2 1,
118
M
50
2,
569
2,52
4 2,
461
2,33
6 2,
209
2,05
2 1,
885
1,77
8 1,
612
1,48
1 1,
372
N
70
2,73
6 2,
692
2,63
1 2,
510
2,38
9 2,
239
2,08
2 1,
982
1,82
9 1,
710
1,61
1
P 95
2,88
9 2,
846
2,78
7 2,
670
2,55
3 2,
410
2,26
1 2,
167
2,02
3 1,
913
1,82
2
Q
125
3,03
7 2,
995
2,93
7 2,
824
2,71
1 2,
574
2,43
2 2,
344
2,20
8 2,
105
2,02
1
R
160
3,13
9 3,
082
2,97
3 2,
865
2,73
3 2,
597
2,51
3 2,
385
2,28
8 2,
209
NO
TE 1
Th
e sa
mpl
e-si
ze c
ode
lette
rs in
this
par
t of I
SO 3
951
corre
spon
d to
thos
e gi
ven
in IS
O 2
859-
1.
NO
TE 2
Sy
mbo
ls:
Ther
e is
no
suita
ble
plan
in th
is a
rea;
use
the
first
sam
plin
g pl
an b
elow
the
arro
w. I
f the
sam
ple
size
equ
als
or e
xcee
ds th
e lo
t siz
e, c
arry
out
100
% in
spec
tion.
Ther
e is
no
suita
ble
plan
in th
is a
rea;
use
the
first
sam
plin
g pl
an a
bove
the
arro
w.
ISO 3951-1:2005(E)
Copyright International Organization for Standardization Reproduced by IHS under license with ISO
Not for ResaleNo reproduction or networking permitted without license from IHS
--`,,`,,,-`-`,,`,,`,`,,`---
ISO 3951-1:2005(E)
© ISO 2005 – All rights reserved 75
Annex C (normative)
Form k single sampling plans for the “σ” method
Tables C.1 to C.3 provide single sampling plans for the “σ” method.
Copyright International Organization for Standardization Reproduced by IHS under license with ISO
Not for ResaleNo reproduction or networking permitted without license from IHS
--`,,`,,,-`-`,,`,,`,`,,`---
76 © ISO 2005 – All rights reserved
Tabl
e C
.1 —
Sin
gle
sam
plin
g pl
ans
for n
orm
al in
spec
tion
(mas
ter t
able
): “σ
” met
hod
Acce
ptan
ce q
ualit
y lim
it
% n
onco
nfor
min
g
0,01
0,
015
0,02
5 0,
04
0,06
5 0,
10
0,15
0,
25
0,40
0,
65
1,0
1,5
2,5
4,0
6,5
10,0
C
ode
lette
r Sa
mpl
e si
ze
k k
k k
k k
k k
k k
k k
k k
k k
B 2
0,
620
0,47
8 0,
273
C
3
0,
991
0,84
1 0,
643
0,41
2
D
4
1,29
6 1,
148
0,96
4 0,
760
0,47
8
E 6
1,57
8 1,
432
1,25
6 1,
068
0,81
8 0,
528
F 8
1,
821
1,68
2 1,
517
1,34
4 1,
121
0,87
2 0,
564
G
10
2,03
0 1,
897
1,74
2 1,
581
1,37
8 1,
157
0,89
3 0,
675
H
12
2,
223
2,09
6 1,
949
1,80
0 1,
613
1,41
2 1,
179
0,99
1 0,
771
J 15
2,
410
2,28
9 2,
150
2,00
9 1,
835
1,65
0 1,
439
1,27
3 1,
082
0,87
9
K 18
2,57
6 2,
459
2,32
7 2,
193
2,02
9 1,
857
1,66
2 1,
511
1,34
0 1,
162
0,91
9
L 21
2,
738
2,62
7 2,
500
2,37
4 2,
218
2,05
7 1,
876
1,73
7 1,
582
1,42
2 1,
210
M
25
2,
890
2,78
3 2,
661
2,54
0 2,
393
2,24
0 2,
070
1,94
1 1,
797
1,65
0 1,
459
N
32
3,04
1 2,
937
2,82
0 2,
704
2,56
3 2,
419
2,25
8 2,
136
2,00
1 1,
866
1,69
0
P 40
3,18
6 3,
086
2,97
4 2,
862
2,72
7 2,
589
2,43
6 2,
321
2,19
4 2,
068
1,90
5
Q
50
3,31
9 3,
222
3,11
3 3,
005
2,87
5 2,
742
2,59
6 2,
487
2,36
7 2,
247
2,09
4
R
65
3,35
9 3,
254
3,15
0 3,
025
2,89
7 2,
758
2,65
3 2,
539
2,42
6 2,
281
NO
TE 1
Th
e sa
mpl
e-si
ze c
ode
lette
rs in
this
par
t of I
SO 3
951
corre
spon
d to
thos
e gi
ven
in IS
O 2
859-
1.
NO
TE 2
Sy
mbo
ls:
Ther
e is
no
suita
ble
plan
in th
is a
rea;
use
the
first
sam
plin
g pl
an b
elow
the
arro
w. I
f the
sam
ple
size
equ
als
or e
xcee
ds th
e lo
t siz
e, c
arry
out
100
% in
spec
tion.
Ther
e is
no
suita
ble
plan
in th
is a
rea;
use
the
first
sam
plin
g pl
an a
bove
the
arro
w.
ISO 3951-1:2005(E)
Copyright International Organization for Standardization Reproduced by IHS under license with ISO
Not for ResaleNo reproduction or networking permitted without license from IHS
--`,,`,,,-`-`,,`,,`,`,,`---
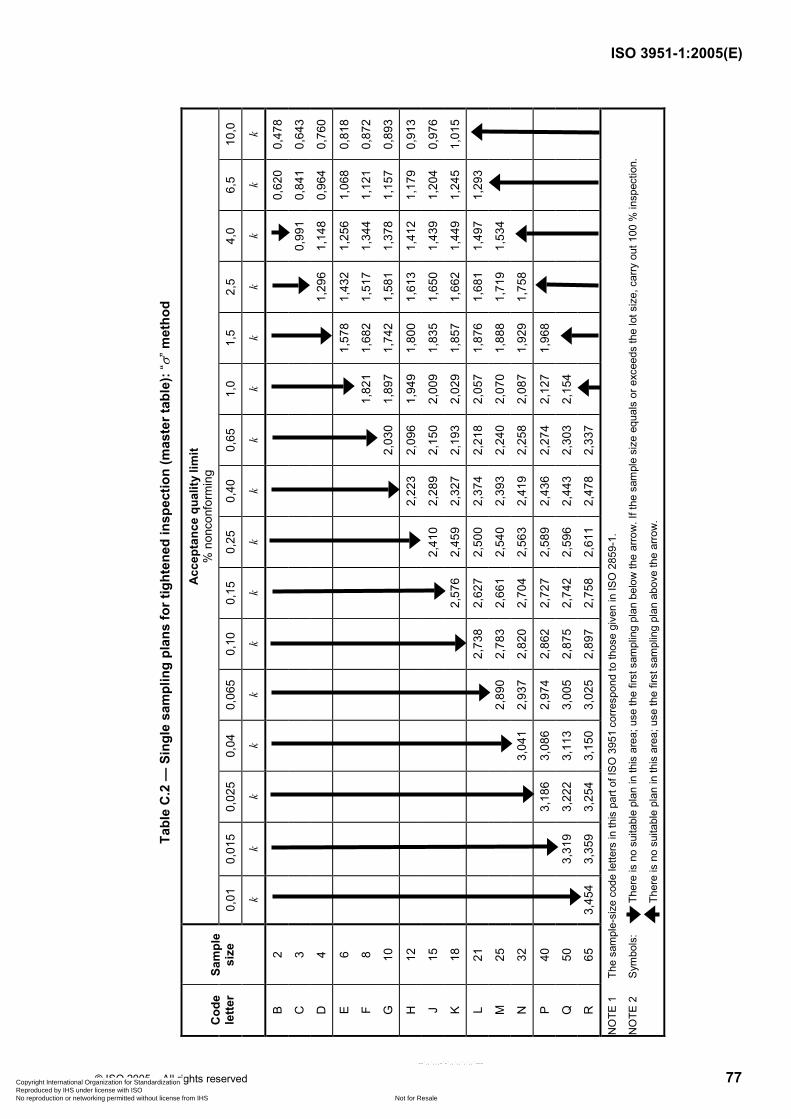
© ISO 2005 – All rights reserved 77
Tabl
e C
.2 —
Sin
gle
sam
plin
g pl
ans
for t
ight
ened
insp
ectio
n (m
aste
r tab
le):
“σ” m
etho
d
Acce
ptan
ce q
ualit
y lim
it
% n
onco
nfor
min
g
0,01
0,
015
0,02
5 0,
04
0,06
5 0,
10
0,15
0,
25
0,40
0,
65
1,0
1,5
2,5
4,0
6,5
10,0
C
ode
lette
r Sa
mpl
e si
ze
k k
k k
k k
k k
k k
k k
k k
k k
B 2
0,62
0 0,
478
C
3
0,99
1 0,
841
0,64
3
D
4
1,
296
1,14
8 0,
964
0,76
0
E 6
1,
578
1,43
2 1,
256
1,06
8 0,
818
F 8
1,82
1 1,
682
1,51
7 1,
344
1,12
1 0,
872
G
10
2,
030
1,89
7 1,
742
1,58
1 1,
378
1,15
7 0,
893
H
12
2,22
3 2,
096
1,94
9 1,
800
1,61
3 1,
412
1,17
9 0,
913
J 15
2,41
0 2,
289
2,15
0 2,
009
1,83
5 1,
650
1,43
9 1,
204
0,97
6
K 18
2,
576
2,45
9 2,
327
2,19
3 2,
029
1,85
7 1,
662
1,44
9 1,
245
1,01
5
L 21
2,73
8 2,
627
2,50
0 2,
374
2,21
8 2,
057
1,87
6 1,
681
1,49
7 1,
293
M
25
2,89
0 2,
783
2,66
1 2,
540
2,39
3 2,
240
2,07
0 1,
888
1,71
9 1,
534
N
32
3,
041
2,93
7 2,
820
2,70
4 2,
563
2,41
9 2,
258
2,08
7 1,
929
1,75
8
P 40
3,
186
3,08
6 2,
974
2,86
2 2,
727
2,58
9 2,
436
2,27
4 2,
127
1,96
8
Q
50
3,
319
3,22
2 3,
113
3,00
5 2,
875
2,74
2 2,
596
2,44
3 2,
303
2,15
4
R
65
3,45
4 3,
359
3,25
4 3,
150
3,02
5 2,
897
2,75
8 2,
611
2,47
8 2,
337
NO
TE 1
Th
e sa
mpl
e-si
ze c
ode
lette
rs in
this
par
t of I
SO 3
951
corre
spon
d to
thos
e gi
ven
in IS
O 2
859-
1.
NO
TE 2
Sy
mbo
ls:
Ther
e is
no
suita
ble
plan
in th
is a
rea;
use
the
first
sam
plin
g pl
an b
elow
the
arro
w. I
f the
sam
ple
size
equ
als
or e
xcee
ds th
e lo
t siz
e, c
arry
out
100
% in
spec
tion.
Ther
e is
no
suita
ble
plan
in th
is a
rea;
use
the
first
sam
plin
g pl
an a
bove
the
arro
w.
ISO 3951-1:2005(E)
Copyright International Organization for Standardization Reproduced by IHS under license with ISO
Not for ResaleNo reproduction or networking permitted without license from IHS
--`,,`,,,-`-`,,`,,`,`,,`---
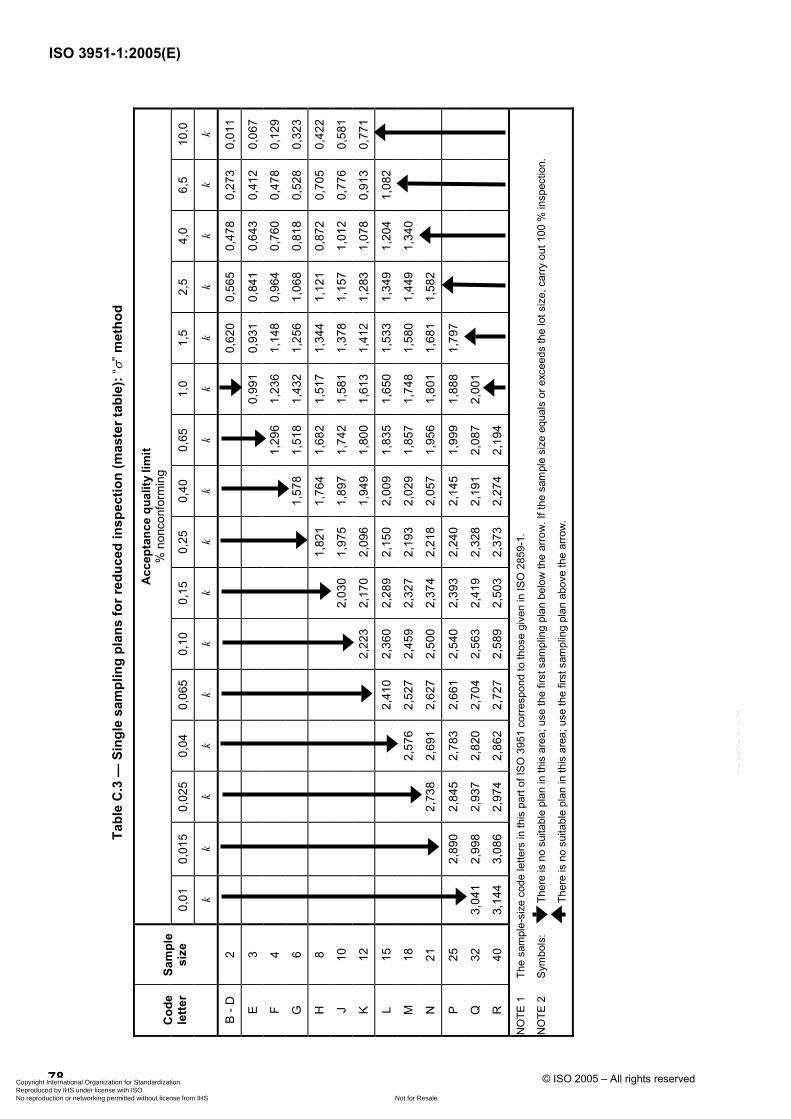
78 © ISO 2005 – All rights reserved
Tabl
e C
.3 —
Sin
gle
sam
plin
g pl
ans
for r
educ
ed in
spec
tion
(mas
ter t
able
): “σ
” met
hod
Acce
ptan
ce q
ualit
y lim
it
% n
onco
nfor
min
g
0,01
0,
015
0,02
5 0,
04
0,06
5 0,
10
0,15
0,
25
0,40
0,
65
1,0
1,5
2,5
4,0
6,5
10,0
C
ode
lette
r Sa
mpl
e si
ze
k k
k k
k k
k k
k k
k k
k k
k k
B - D
2
0,
620
0,56
5 0,
478
0,27
3 0,
011
E 3
0,99
1 0,
931
0,84
1 0,
643
0,41
2 0,
067
F 4
1,
296
1,23
6 1,
148
0,96
4 0,
760
0,47
8 0,
129
G
6
1,
578
1,51
8 1,
432
1,25
6 1,
068
0,81
8 0,
528
0,32
3
H
8
1,82
1 1,
764
1,68
2 1,
517
1,34
4 1,
121
0,87
2 0,
705
0,42
2
J 10
2,
030
1,97
5 1,
897
1,74
2 1,
581
1,37
8 1,
157
1,01
2 0,
776
0,58
1
K 12
2,22
3 2,
170
2,09
6 1,
949
1,80
0 1,
613
1,41
2 1,
283
1,07
8 0,
913
0,77
1
L 15
2,
410
2,36
0 2,
289
2,15
0 2,
009
1,83
5 1,
650
1,53
3 1,
349
1,20
4 1,
082
M
18
2,
576
2,52
7 2,
459
2,32
7 2,
193
2,02
9 1,
857
1,74
8 1,
580
1,44
9 1,
340
N
21
2,73
8 2,
691
2,62
7 2,
500
2,37
4 2,
218
2,05
7 1,
956
1,80
1 1,
681
1,58
2
P 25
2,89
0 2,
845
2,78
3 2,
661
2,54
0 2,
393
2,24
0 2,
145
1,99
9 1,
888
1,79
7
Q
32
3,04
1 2,
998
2,93
7 2,
820
2,70
4 2,
563
2,41
9 2,
328
2,19
1 2,
087
2,00
1
R
40
3,14
4 3,
086
2,97
4 2,
862
2,72
7 2,
589
2,50
3 2,
373
2,27
4 2,
194
NO
TE 1
Th
e sa
mpl
e-si
ze c
ode
lette
rs in
this
par
t of I
SO 3
951
corre
spon
d to
thos
e gi
ven
in IS
O 2
859-
1.
NO
TE 2
Sy
mbo
ls:
Ther
e is
no
suita
ble
plan
in th
is a
rea;
use
the
first
sam
plin
g pl
an b
elow
the
arro
w. I
f the
sam
ple
size
equ
als
or e
xcee
ds th
e lo
t siz
e, c
arry
out
100
% in
spec
tion.
Ther
e is
no
suita
ble
plan
in th
is a
rea;
use
the
first
sam
plin
g pl
an a
bove
the
arro
w.
ISO 3951-1:2005(E)
Copyright International Organization for Standardization Reproduced by IHS under license with ISO
Not for ResaleNo reproduction or networking permitted without license from IHS
--`,,`,,,-`-`,,`,,`,`,,`---
ISO 3951-1:2005(E)
© ISO 2005 – All rights reserved
79
Annex D (normative)
Values of fs for maximum sample standard deviation (MSSD)
Tables D.1 to D.3 provide values of fs for maximum sample standard deviation.
Copyright International Organization for Standardization Reproduced by IHS under license with ISO
Not for ResaleNo reproduction or networking permitted without license from IHS
--`,,`,,,-`-`,,`,,`,`,,`---
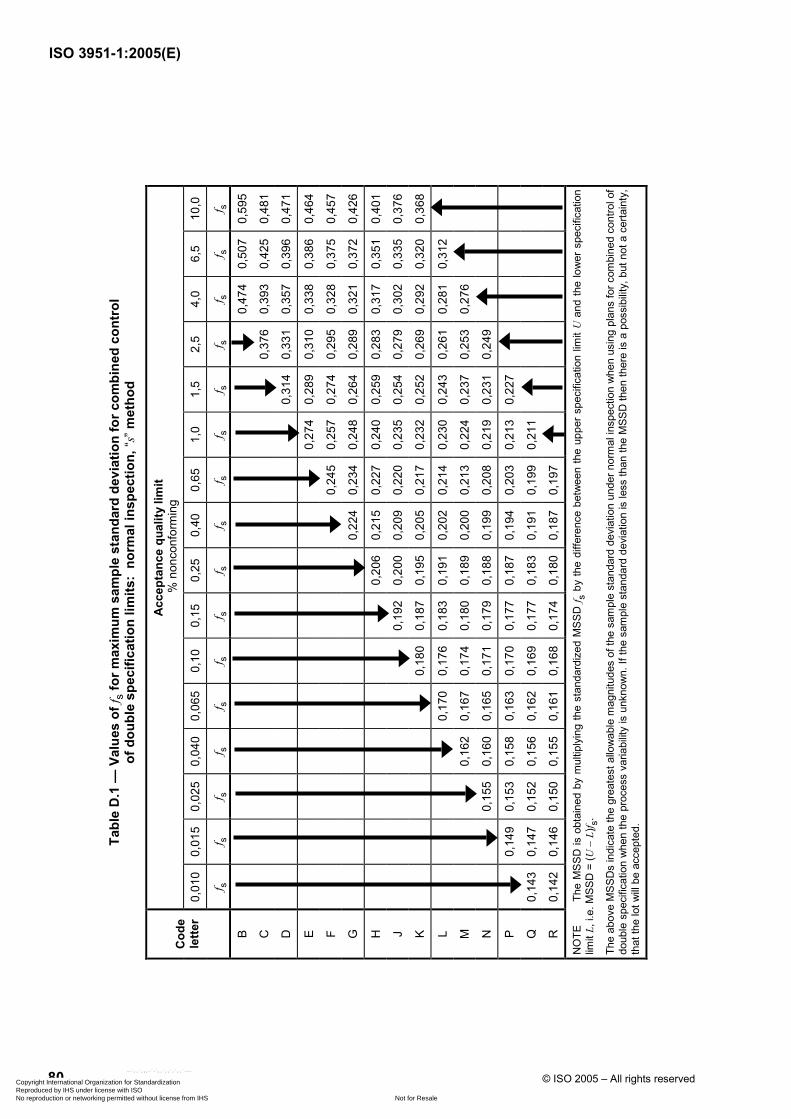
80 © ISO 2005 – All rights reserved
Tabl
e D
.1 —
Val
ues
of f s
for m
axim
um s
ampl
e st
anda
rd d
evia
tion
for c
ombi
ned
cont
rol
of d
oubl
e sp
ecifi
catio
n lim
its:
norm
al in
spec
tion,
“s” m
etho
d
Acce
ptan
ce q
ualit
y lim
it %
non
conf
orm
ing
0,01
0 0,
015
0,02
5 0,
040
0,06
5 0,
10
0,15
0,
25
0,40
0,
65
1,0
1,5
2,5
4,0
6,5
10,0
C
ode
lette
r
f s f s
f s f s
f s f s
f s f s
f s f s
f s f s
f s f s
f s f s
B
0,47
4 0,
507
0,59
5
C
0,37
6 0,
393
0,42
5 0,
481
D
0,
314
0,33
1 0,
357
0,39
6 0,
471
E
0,
274
0,28
9 0,
310
0,33
8 0,
386
0,46
4
F
0,24
5 0,
257
0,27
4 0,
295
0,32
8 0,
375
0,45
7
G
0,22
4 0,
234
0,24
8 0,
264
0,28
9 0,
321
0,37
2 0,
426
H
0,
206
0,21
5 0,
227
0,24
0 0,
259
0,28
3 0,
317
0,35
1 0,
401
J
0,
192
0,20
0 0,
209
0,22
0 0,
235
0,25
4 0,
279
0,30
2 0,
335
0,37
6
K
0,18
0 0,
187
0,19
5 0,
205
0,21
7 0,
232
0,25
2 0,
269
0,29
2 0,
320
0,36
8
L
0,
170
0,17
6 0,
183
0,19
1 0,
202
0,21
4 0,
230
0,24
3 0,
261
0,28
1 0,
312
M
0,
162
0,16
7 0,
174
0,18
0 0,
189
0,20
0 0,
213
0,22
4 0,
237
0,25
3 0,
276
N
0,15
5 0,
160
0,16
5 0,
171
0,17
9 0,
188
0,19
9 0,
208
0,21
9 0,
231
0,24
9
P
0,14
9 0,
153
0,15
8 0,
163
0,17
0 0,
177
0,18
7 0,
194
0,20
3 0,
213
0,22
7
Q
0,14
3 0,
147
0,15
2 0,
156
0,16
2 0,
169
0,17
7 0,
183
0,19
1 0,
199
0,21
1
R
0,14
2 0,
146
0,15
0 0,
155
0,16
1 0,
168
0,17
4 0,
180
0,18
7 0,
197
NO
TE
The
MSS
D is
obt
aine
d by
mul
tiply
ing
the
stan
dard
ized
MSS
D f s
by th
e di
ffere
nce
betw
een
the
uppe
r spe
cific
atio
n lim
it U
and
the
low
er s
peci
ficat
ion
limit
L, i.
e. M
SSD
= (U
− L
)f s.
The
abov
e M
SSD
s in
dica
te th
e gr
eate
st a
llow
able
mag
nitu
des
of th
e sa
mpl
e st
anda
rd d
evia
tion
unde
r nor
mal
insp
ectio
n w
hen
usin
g pl
ans
for c
ombi
ned
cont
rol o
f do
uble
spe
cific
atio
n w
hen
the
proc
ess
varia
bilit
y is
unk
now
n. If
the
sam
ple
stan
dard
dev
iatio
n is
less
than
the
MSS
D th
en th
ere
is a
pos
sibi
lity,
but
not
a c
erta
inty
, th
at th
e lo
t will
be a
ccep
ted.
ISO 3951-1:2005(E)
Copyright International Organization for Standardization Reproduced by IHS under license with ISO
Not for ResaleNo reproduction or networking permitted without license from IHS
--`,,`,,,-`-`,,`,,`,`,,`---
© ISO 2005 – All rights reserved 81
Tabl
e D
.2 —
Val
ues
of f s
for m
axim
um s
ampl
e st
anda
rd d
evia
tion
fo
r com
bine
d co
ntro
l of d
oubl
e sp
ecifi
catio
n lim
its: t
ight
ened
insp
ectio
n, “s
” met
hod
Acce
ptan
ce q
ualit
y lim
it
% n
onco
nfor
min
g
0,01
0 0,
015
0,02
5 0,
040
0,06
5 0,
10
0,15
0,
25
0,40
0,
65
1,0
1,5
2,5
4,0
6,5
10,0
C
ode
lette
r
f s f s
f s f s
f s f s
f s f s
f s f s
f s f s
f s f s
f s f s
B
0,
474
0,50
7
C
0,
376
0,39
3 0,
425
D
0,31
4 0,
331
0,35
7 0,
396
E
0,27
4 0,
289
0,31
0 0,
338
0,38
6
F
0,
245
0,25
7 0,
274
0,29
5 0,
328
0,37
5
G
0,
224
0,23
4 0,
248
0,26
4 0,
289
0,32
1 0,
372
H
0,20
6 0,
215
0,22
7 0,
240
0,25
9 0,
283
0,31
7 0,
368
J
0,19
2 0,
200
0,20
9 0,
220
0,23
5 0,
254
0,27
9 0,
313
0,35
5
K
0,
180
0,18
7 0,
195
0,20
5 0,
217
0,23
2 0,
252
0,27
7 0,
307
0,34
8
L
0,17
0 0,
176
0,18
3 0,
191
0,20
2 0,
214
0,23
0 0,
249
0,27
1 0,
299
M
0,16
2 0,
167
0,17
4 0,
180
0,18
9 0,
200
0,21
3 0,
228
0,24
5 0,
266
N
0,
155
0,16
0 0,
165
0,17
1 0,
179
0,18
8 0,
199
0,21
2 0,
225
0,24
1
P
0,
149
0,15
3 0,
158
0,16
3 0,
170
0,17
7 0,
187
0,19
7 0,
208
0,22
2
Q
0,
143
0,14
7 0,
152
0,15
6 0,
162
0,16
9 0,
177
0,18
6 0,
196
0,20
6
R
0,13
8 0,
142
0,14
6 0,
150
0,15
5 0,
161
0,16
8 0,
176
0,18
4 0,
193
NO
TE
The
MSS
D is
obt
aine
d by
mul
tiply
ing
the
stan
dard
ized
MSS
D f s
by th
e di
ffere
nce
betw
een
the
uppe
r spe
cific
atio
n lim
it U
and
the
low
er s
peci
ficat
ion
limit
L, i.
e. M
SSD
= (U
− L
)f s.
The
abov
e M
SSD
s in
dica
te th
e gr
eate
st a
llow
able
mag
nitu
des
of th
e sa
mpl
e st
anda
rd d
evia
tion
unde
r tig
hten
ed in
spec
tion
whe
n us
ing
plan
s fo
r com
bine
d co
ntro
l of
dou
ble
spec
ifica
tion
whe
n th
e pr
oces
s va
riabi
lity
is u
nkno
wn.
If
the
sam
ple
stan
dard
dev
iatio
n is
less
tha
n th
e M
SSD
the
n th
ere
is a
pos
sibi
lity,
but
not
a
certa
inty
, tha
t the
lot w
ill be
acc
epte
d.
ISO 3951-1:2005(E)
Copyright International Organization for Standardization Reproduced by IHS under license with ISO
Not for ResaleNo reproduction or networking permitted without license from IHS
--`,,`,,,-`-`,,`,,`,`,,`---
82 © ISO 2005 – All rights reserved
Tabl
e D
.3 —
Val
ues
of f s
for m
axim
um s
ampl
e st
anda
rd d
evia
tion
for c
ombi
ned
cont
rol o
f dou
ble
spec
ifica
tion
limits
: re
duce
d in
spec
tion,
“s” m
etho
d
Acce
ptan
ce q
ualit
y lim
it
% n
onco
nfor
min
g
0,01
0 0,
015
0,02
5 0,
040
0,06
5 0,
10
0,15
0,
25
0,40
0,
65
1,0
1,5
2,5
4,0
6,5
10,0
C
ode
lette
r
f s f s
f s f s
f s f s
f s f s
f s f s
f s f s
f s f s
f s f s
B-D
0,47
4 0,
485
0,50
7 0,
595
0,84
9
E
0,
376
0,38
2 0,
393
0,42
5 0,
481
0,62
5
F
0,31
4 0,
320
0,33
1 0,
357
0,39
6 0,
471
0,62
3
G
0,27
4 0,
280
0,28
9 0,
310
0,33
8 0,
386
0,46
4 0,
542
H
0,
245
0,25
0 0,
257
0,27
4 0,
295
0,32
8 0,
375
0,41
6 0,
507
J
0,
224
0,22
8 0,
234
0,24
8 0,
264
0,28
9 0,
321
0,34
7 0,
399
0,45
5
K
0,20
6 0,
210
0,21
5 0,
227
0,24
0 0,
259
0,28
3 0,
301
0,33
5 0,
368
0,40
1
L
0,
192
0,19
5 0,
200
0,20
9 0,
220
0,23
5 0,
254
0,26
7 0,
291
0,31
3 0,
335
M
0,
180
0,18
3 0,
187
0,19
5 0,
205
0,21
7 0,
232
0,24
3 0,
261
0,27
7 0,
292
N
0,17
0 0,
173
0,17
6 0,
183
0,19
1 0,
202
0,21
4 0,
223
0,23
7 0,
249
0,26
1
P
0,16
2 0,
164
0,16
7 0,
174
0,18
0 0,
189
0,20
0 0,
207
0,21
9 0,
228
0,23
7
Q
0,15
5 0,
157
0,16
0 0,
165
0,17
1 0,
179
0,18
8 0,
194
0,20
3 0,
212
0,21
9
R
0,15
0 0,
153
0,15
8 0,
163
0,17
0 0,
177
0,18
3 0,
191
0,19
7 0,
203
NO
TE
The
MSS
D is
obt
aine
d by
mul
tiply
ing
the
stan
dard
ized
MSS
D f s
by th
e di
ffere
nce
betw
een
the
uppe
r spe
cific
atio
n lim
it U
and
the
low
er s
peci
ficat
ion
limit
L, i.
e. M
SSD
= (U
− L
)f s.
The
abov
e M
SSD
s in
dica
te th
e gr
eate
st a
llow
able
mag
nitu
des
of th
e sa
mpl
e st
anda
rd d
evia
tion
unde
r red
uced
insp
ectio
n w
hen
usin
g pl
ans
for c
ombi
ned
cont
rol
of d
oubl
e sp
ecifi
catio
n w
hen
the
proc
ess
varia
bilit
y is
unk
now
n. I
f th
e sa
mpl
e st
anda
rd d
evia
tion
is le
ss t
han
the
MSS
D t
hen
ther
e is
a p
ossi
bilit
y, b
ut n
ot a
ce
rtain
ty, t
hat t
he lo
t will
be a
ccep
ted.
ISO 3951-1:2005(E)
Copyright International Organization for Standardization Reproduced by IHS under license with ISO
Not for ResaleNo reproduction or networking permitted without license from IHS
--`,,`,,,-`-`,,`,,`,`,,`---
ISO 3951-1:2005(E)
© ISO 2005 – All rights reserved 83
Annex E (normative)
Values of fσ for maximum process standard deviation (MPSD)
Table E.1 provides values for maximum process standard deviation. The MPSD indicates the greatest allowable magnitude of the process standard deviation when using plans for combined control of double specification limits when the process variability is known. If the process standard deviation is less than the MPSD, then there is a possibility, but not a certainty, that the lot will be accepted.
The MPSD is obtained by multiplying the standardized MPSD fσ by the difference between the upper specification limit U and the lower specification limit L, i.e. MPSD = (U − L)fσ .
Table E.1 — Values of fσ for maximum process standard deviation for combined control of double specification limits: “σ” method
Acceptance quality limit % nonconforming
fσ
0,010 0,125
0,015 0,129
0,025 0,132
0,040 0,137
0,065 0,141
0,10 0,147
0,15 0,152
0,25 0,157
0,40 0,165
0,65 0,174
1,0 0,184
1,5 0,194
2,5 0,206
4,0 0,223
6,5 0,243
10,0 0,271
Copyright International Organization for Standardization Reproduced by IHS under license with ISO
Not for ResaleNo reproduction or networking permitted without license from IHS
--`,,`,,,-`-`,,`,,`,`,,`---
ISO 3951-1:2005(E)
84 © ISO 2005 – All rights reserved
Annex F (normative)
Estimating the process fraction nonconforming for sample size 3:
“s” method
Table F.1 provides values for the estimated process fraction nonconforming.
Table F.1 — Estimated process fraction nonconforming, ˆ,p as a function of the quality statistic Q
Third decimal place of 3 / 2Q
0,000 0,001 0,002 0,003 0,004 0,005 0,006 0,007 0,008 0,009
First two decimal
places of 3 / 2Q
p p p p p p p p p p
0,00 0,5000 0,4997 0,4994 0,4990 0,4987 0,4984 0,4981 0,4978 0,4975 0,4971
0,01 0,4968 0,4965 0,4962 0,4959 0,4955 0,4952 0,4949 0,4946 0,4943 0,4940
0,02 0,4936 0,4933 0,4930 0,4927 0,4924 0,4920 0,4917 0,4914 0,4911 0,4908
0,03 0,4904 0,4901 0,4898 0,4895 0,4892 0,4889 0,4885 0,4882 0,4879 0,4876
0,04 0,4873 0,4869 0,4866 0,4863 0,4860 0,4857 0,4854 0,4850 0,4847 0,4844
0,05 0,4841 0,4838 0,4834 0,4831 0,4828 0,4825 0,4822 0,4818 0,4815 0,4812
0,06 0,4809 0,4806 0,4803 0,4799 0,4796 0,4793 0,4790 0,4787 0,4783 0,4780
0,07 0,4777 0,4774 0,4771 0,4767 0,4764 0,4761 0,4758 0,4755 0,4751 0,4748
0,08 0,4745 0,4742 0,4739 0,4735 0,4732 0,4729 0,4726 0,4723 0,4720 0,4716
0,09 0,4713 0,4710 0,4707 0,4704 0,4700 0,4697 0,4694 0,4691 0,4688 0,4684
0,10 0,4681 0,4678 0,4675 0,4672 0,4668 0,4665 0,4662 0,4659 0,4656 0,4652
0,11 0,4649 0,4646 0,4643 0,4640 0,4636 0,4633 0,4630 0,4627 0,4624 0,4620
0,12 0,4617 0,4614 0,4611 0,4607 0,4604 0,4601 0,4598 0,4595 0,4591 0,4588
0,13 0,4585 0,4582 0,4579 0,4575 0,4572 0,4569 0,4566 0,4563 0,4559 0,4556
0,14 0,4553 0,4550 0,4546 0,4543 0,4540 0,4537 0,4534 0,4530 0,4527 0,4524
0,15 0,4521 0,4518 0,4514 0,4511 0,4508 0,4505 0,4501 0,4498 0,4495 0,4492
0,16 0,4489 0,4485 0,4482 0,4479 0,4476 0,4472 0,4469 0,4466 0,4463 0,4459
0,17 0,4456 0,4453 0,4450 0,4447 0,4443 0,4440 0,4437 0,4434 0,4430 0,4427
0,18 0,4424 0,4421 0,4417 0,4414 0,4411 0,4408 0,4404 0,4401 0,4398 0,4395
0,19 0,4392 0,4388 0,4385 0,4382 0,4379 0,4375 0,4372 0,4369 0,4366 0,4362
0,20 0,4359 0,4356 0,4353 0,4349 0,4346 0,4343 0,4340 0,4336 0,4333 0,4330
0,21 0,4327 0,4323 0,4320 0,4317 0,4314 0,4310 0,4307 0,4304 0,4300 0,4297
0,22 0,4294 0,4291 0,4287 0,4284 0,4281 0,4278 0,4274 0,4271 0,4268 0,4265
0,23 0,4261 0,4258 0,4255 0,4251 0,4248 0,4245 0,4242 0,4238 0,4235 0,4232
0,24 0,4229 0,4225 0,4222 0,4219 0,4215 0,4212 0,4209 0,4206 0,4202 0,4199
0,25 0,4196 0,4192 0,4189 0,4186 0,4183 0,4179 0,4176 0,4173 0,4169 0,4166
0,26 0,4163 0,4159 0,4156 0,4153 0,4150 0,4146 0,4143 0,4140 0,4136 0,4133
0,27 0,4130 0,4126 0,4123 0,4120 0,4117 0,4113 0,4110 0,4107 0,4103 0,4100
0,28 0,4097 0,4093 0,4090 0,4087 0,4083 0,4080 0,4077 0,4073 0,4070 0,4067
0,29 0,4063 0,4060 0,4057 0,4053 0,4050 0,4047 0,4043 0,4040 0,4037 0,4033
0,30 0,4030 0,4027 0,4023 0,4020 0,4017 0,4013 0,4010 0,4007 0,4003 0,4000
Copyright International Organization for Standardization Reproduced by IHS under license with ISO
Not for ResaleNo reproduction or networking permitted without license from IHS
--`,,`,,,-`-`,,`,,`,`,,`---
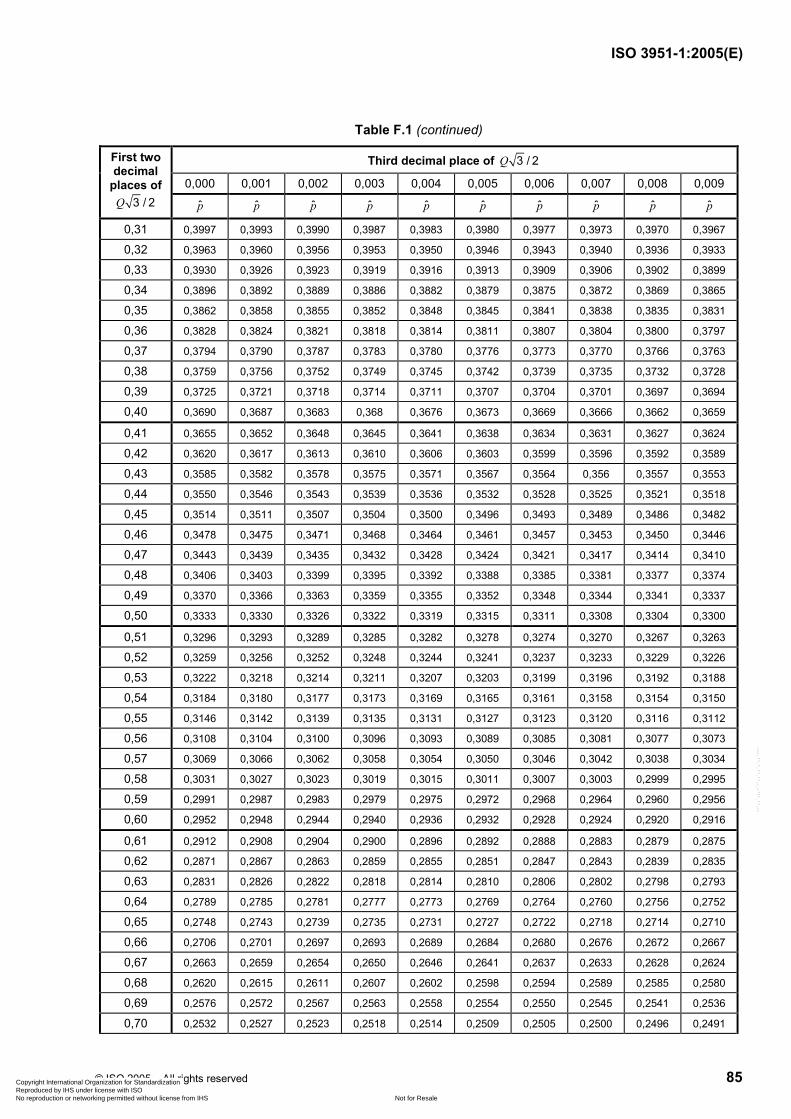
ISO 3951-1:2005(E)
© ISO 2005 – All rights reserved 85
Table F.1 (continued)
Third decimal place of 3 / 2Q
0,000 0,001 0,002 0,003 0,004 0,005 0,006 0,007 0,008 0,009
First two decimal
places of 3 / 2Q p p p p p p p p p p
0,31 0,3997 0,3993 0,3990 0,3987 0,3983 0,3980 0,3977 0,3973 0,3970 0,3967
0,32 0,3963 0,3960 0,3956 0,3953 0,3950 0,3946 0,3943 0,3940 0,3936 0,3933
0,33 0,3930 0,3926 0,3923 0,3919 0,3916 0,3913 0,3909 0,3906 0,3902 0,3899
0,34 0,3896 0,3892 0,3889 0,3886 0,3882 0,3879 0,3875 0,3872 0,3869 0,3865
0,35 0,3862 0,3858 0,3855 0,3852 0,3848 0,3845 0,3841 0,3838 0,3835 0,3831
0,36 0,3828 0,3824 0,3821 0,3818 0,3814 0,3811 0,3807 0,3804 0,3800 0,3797
0,37 0,3794 0,3790 0,3787 0,3783 0,3780 0,3776 0,3773 0,3770 0,3766 0,3763
0,38 0,3759 0,3756 0,3752 0,3749 0,3745 0,3742 0,3739 0,3735 0,3732 0,3728
0,39 0,3725 0,3721 0,3718 0,3714 0,3711 0,3707 0,3704 0,3701 0,3697 0,3694
0,40 0,3690 0,3687 0,3683 0,368 0,3676 0,3673 0,3669 0,3666 0,3662 0,3659
0,41 0,3655 0,3652 0,3648 0,3645 0,3641 0,3638 0,3634 0,3631 0,3627 0,3624
0,42 0,3620 0,3617 0,3613 0,3610 0,3606 0,3603 0,3599 0,3596 0,3592 0,3589
0,43 0,3585 0,3582 0,3578 0,3575 0,3571 0,3567 0,3564 0,356 0,3557 0,3553
0,44 0,3550 0,3546 0,3543 0,3539 0,3536 0,3532 0,3528 0,3525 0,3521 0,3518
0,45 0,3514 0,3511 0,3507 0,3504 0,3500 0,3496 0,3493 0,3489 0,3486 0,3482
0,46 0,3478 0,3475 0,3471 0,3468 0,3464 0,3461 0,3457 0,3453 0,3450 0,3446
0,47 0,3443 0,3439 0,3435 0,3432 0,3428 0,3424 0,3421 0,3417 0,3414 0,3410
0,48 0,3406 0,3403 0,3399 0,3395 0,3392 0,3388 0,3385 0,3381 0,3377 0,3374
0,49 0,3370 0,3366 0,3363 0,3359 0,3355 0,3352 0,3348 0,3344 0,3341 0,3337
0,50 0,3333 0,3330 0,3326 0,3322 0,3319 0,3315 0,3311 0,3308 0,3304 0,3300
0,51 0,3296 0,3293 0,3289 0,3285 0,3282 0,3278 0,3274 0,3270 0,3267 0,3263
0,52 0,3259 0,3256 0,3252 0,3248 0,3244 0,3241 0,3237 0,3233 0,3229 0,3226
0,53 0,3222 0,3218 0,3214 0,3211 0,3207 0,3203 0,3199 0,3196 0,3192 0,3188
0,54 0,3184 0,3180 0,3177 0,3173 0,3169 0,3165 0,3161 0,3158 0,3154 0,3150
0,55 0,3146 0,3142 0,3139 0,3135 0,3131 0,3127 0,3123 0,3120 0,3116 0,3112
0,56 0,3108 0,3104 0,3100 0,3096 0,3093 0,3089 0,3085 0,3081 0,3077 0,3073
0,57 0,3069 0,3066 0,3062 0,3058 0,3054 0,3050 0,3046 0,3042 0,3038 0,3034
0,58 0,3031 0,3027 0,3023 0,3019 0,3015 0,3011 0,3007 0,3003 0,2999 0,2995
0,59 0,2991 0,2987 0,2983 0,2979 0,2975 0,2972 0,2968 0,2964 0,2960 0,2956
0,60 0,2952 0,2948 0,2944 0,2940 0,2936 0,2932 0,2928 0,2924 0,2920 0,2916
0,61 0,2912 0,2908 0,2904 0,2900 0,2896 0,2892 0,2888 0,2883 0,2879 0,2875
0,62 0,2871 0,2867 0,2863 0,2859 0,2855 0,2851 0,2847 0,2843 0,2839 0,2835
0,63 0,2831 0,2826 0,2822 0,2818 0,2814 0,2810 0,2806 0,2802 0,2798 0,2793
0,64 0,2789 0,2785 0,2781 0,2777 0,2773 0,2769 0,2764 0,2760 0,2756 0,2752
0,65 0,2748 0,2743 0,2739 0,2735 0,2731 0,2727 0,2722 0,2718 0,2714 0,2710
0,66 0,2706 0,2701 0,2697 0,2693 0,2689 0,2684 0,2680 0,2676 0,2672 0,2667
0,67 0,2663 0,2659 0,2654 0,2650 0,2646 0,2641 0,2637 0,2633 0,2628 0,2624
0,68 0,2620 0,2615 0,2611 0,2607 0,2602 0,2598 0,2594 0,2589 0,2585 0,2580
0,69 0,2576 0,2572 0,2567 0,2563 0,2558 0,2554 0,2550 0,2545 0,2541 0,2536
0,70 0,2532 0,2527 0,2523 0,2518 0,2514 0,2509 0,2505 0,2500 0,2496 0,2491
Copyright International Organization for Standardization Reproduced by IHS under license with ISO
Not for ResaleNo reproduction or networking permitted without license from IHS
--`,,`,,,-`-`,,`,,`,`,,`---
ISO 3951-1:2005(E)
86 © ISO 2005 – All rights reserved
Table F.1 (continued)
Third decimal place of 3 / 2Q
0,000 0,001 0,002 0,003 0,004 0,005 0,006 0,007 0,008 0,009
First two decimal
places of 3 / 2Q
p p p p p p p p p p
0,71 0,2487 0,2482 0,2478 0,2473 0,2469 0,2464 0,2460 0,2455 0,2451 0,2446
0,72 0,2441 0,2437 0,2432 0,2428 0,2423 0,2418 0,2414 0,2409 0,2405 0,2400
0,73 0,2395 0,2391 0,2386 0,2381 0,2377 0,2372 0,2367 0,2362 0,2358 0,2353
0,74 0,2348 0,2344 0,2339 0,2334 0,2329 0,2324 0,2320 0,2315 0,2310 0,2305
0,75 0,2301 0,2296 0,2291 0,2286 0,2281 0,2276 0,2272 0,2267 0,2262 0,2257
0,76 0,2252 0,2247 0,2242 0,2237 0,2232 0,2227 0,2222 0,2217 0,2213 0,2208
0,77 0,2203 0,2198 0,2193 0,2188 0,2183 0,2177 0,2172 0,2167 0,2162 0,2157
0,78 0,2152 0,2147 0,2142 0,2137 0,2132 0,2127 0,2121 0,2116 0,2111 0,2106
0,79 0,2101 0,2096 0,2090 0,2085 0,2080 0,2075 0,2069 0,2064 0,2059 0,2054
0,80 0,2048 0,2043 0,2038 0,2032 0,2027 0,2022 0,2016 0,2011 0,2006 0,2000
0,81 0,1995 0,1989 0,1984 0,1978 0,1973 0,1967 0,1962 0,1956 0,1951 0,1945
0,82 0,1940 0,1934 0,1929 0,1923 0,1917 0,1912 0,1906 0,1900 0,1895 0,1889
0,83 0,1883 0,1878 0,1872 0,1866 0,1860 0,1855 0,1849 0,1843 0,1837 0,1831
0,84 0,1826 0,1820 0,1814 0,1808 0,1802 0,1796 0,1790 0,1784 0,1778 0,1772
0,85 0,1766 0,1760 0,1754 0,1748 0,1742 0,1736 0,1729 0,1723 0,1717 0,1711
0,86 0,1705 0,1698 0,1692 0,1686 0,1680 0,1673 0,1667 0,1660 0,1654 0,1648
0,87 0,1641 0,1635 0,1628 0,1622 0,1615 0,1609 0,1602 0,1595 0,1589 0,1582
0,88 0,1575 0,1569 0,1562 0,1555 0,1548 0,1542 0,1535 0,1528 0,1521 0,1514
0,89 0,1507 0,1500 0,1493 0,1486 0,1479 0,1472 0,1465 0,1457 0,1450 0,1443
0,90 0,1436 0,1428 0,1421 0,1414 0,1406 0,1399 0,1391 0,1384 0,1376 0,1368
0,91 0,1361 0,1353 0,1345 0,1338 0,1330 0,1322 0,1314 0,1306 0,1298 0,1290
0,92 0,1282 0,1274 0,1266 0,1257 0,1249 0,1241 0,1232 0,1224 0,1215 0,1207
0,93 0,1198 0,1189 0,1181 0,1172 0,1163 0,1154 0,1145 0,1136 0,1127 0,1118
0,94 0,1108 0,1099 0,1089 0,1080 0,1070 0,1061 0,1051 0,1041 0,1031 0,1021
0,95 0,1011 0,1001 0,0990 0,0980 0,0969 0,0959 0,0948 0,0937 0,0926 0,0915
0,96 0,0903 0,0892 0,0880 0,0869 0,0857 0,0845 0,0832 0,0820 0,0807 0,0795
0,97 0,0782 0,0768 0,0755 0,0741 0,0727 0,0713 0,0699 0,0684 0,0669 0,0653
0,98 0,0638 0,0621 0,0605 0,0588 0,0570 0,0552 0,0533 0,0514 0,0494 0,0473
0,99 0,0451 0,0427 0,0403 0,0377 0,0349 0,0318 0,0285 0,0247 0,0201 0,0142
1,00 0,0000 0,0000 0,0000 0,0000 0,0000 0,0000 0,0000 0,0000 0,0000 0,0000
NOTE For negative values of Q, enter the table with the absolute value of 3 / 2Q and subtract the result from 1,0.
Copyright International Organization for Standardization Reproduced by IHS under license with ISO
Not for ResaleNo reproduction or networking permitted without license from IHS
--`,,`,,,-`-`,,`,,`,`,,`---
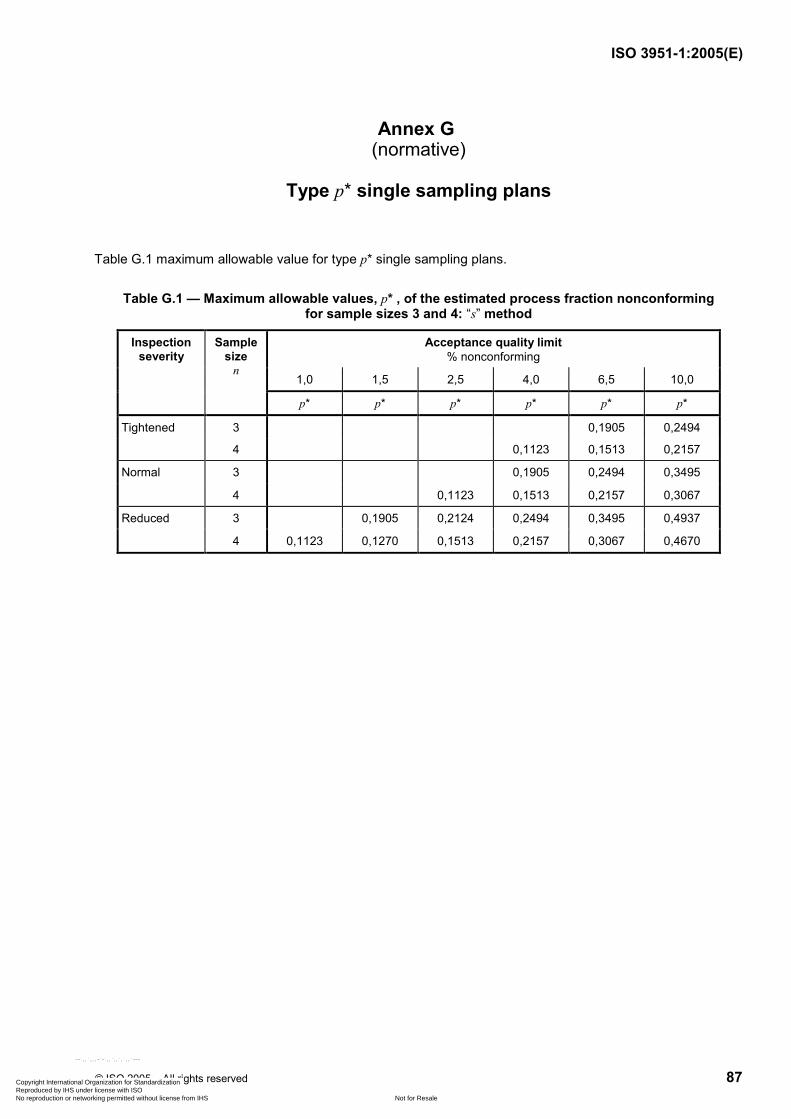
ISO 3951-1:2005(E)
© ISO 2005 – All rights reserved 87
Annex G (normative)
Type p* single sampling plans
Table G.1 maximum allowable value for type p* single sampling plans.
Table G.1 — Maximum allowable values, p* , of the estimated process fraction nonconforming for sample sizes 3 and 4: “s” method
Acceptance quality limit % nonconforming
1,0 1,5 2,5 4,0 6,5 10,0
Inspection severity
Sample size
n
p* p* p* p* p* p*
3 0,1905 0,2494 Tightened
4 0,1123 0,1513 0,2157
3 0,1905 0,2494 0,3495 Normal
4 0,1123 0,1513 0,2157 0,3067
3 0,1905 0,2124 0,2494 0,3495 0,4937 Reduced
4 0,1123 0,1270 0,1513 0,2157 0,3067 0,4670
Copyright International Organization for Standardization Reproduced by IHS under license with ISO
Not for ResaleNo reproduction or networking permitted without license from IHS
--`,,`,,,-`-`,,`,,`,`,,`---
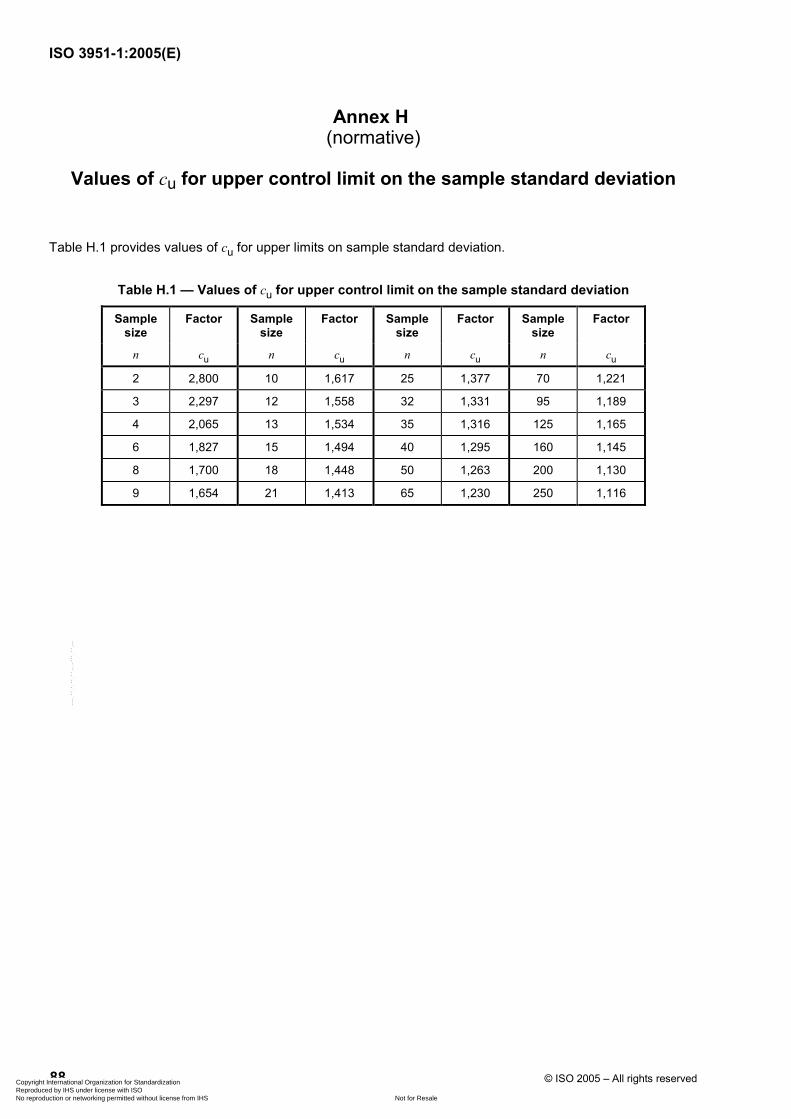
ISO 3951-1:2005(E)
88 © ISO 2005 – All rights reserved
Annex H (normative)
Values of cu for upper control limit on the sample standard deviation
Table H.1 provides values of cu for upper limits on sample standard deviation.
Table H.1 — Values of cu for upper control limit on the sample standard deviation
Sample size
Factor Sample size
Factor Sample size
Factor Sample size
Factor
n cu n cu n cu n cu
2 2,800 10 1,617 25 1,377 70 1,221
3 2,297 12 1,558 32 1,331 95 1,189
4 2,065 13 1,534 35 1,316 125 1,165
6 1,827 15 1,494 40 1,295 160 1,145
8 1,700 18 1,448 50 1,263 200 1,130
9 1,654 21 1,413 65 1,230 250 1,116
Copyright International Organization for Standardization Reproduced by IHS under license with ISO
Not for ResaleNo reproduction or networking permitted without license from IHS
--`,,`,,,-`-`,,`,,`,`,,`---
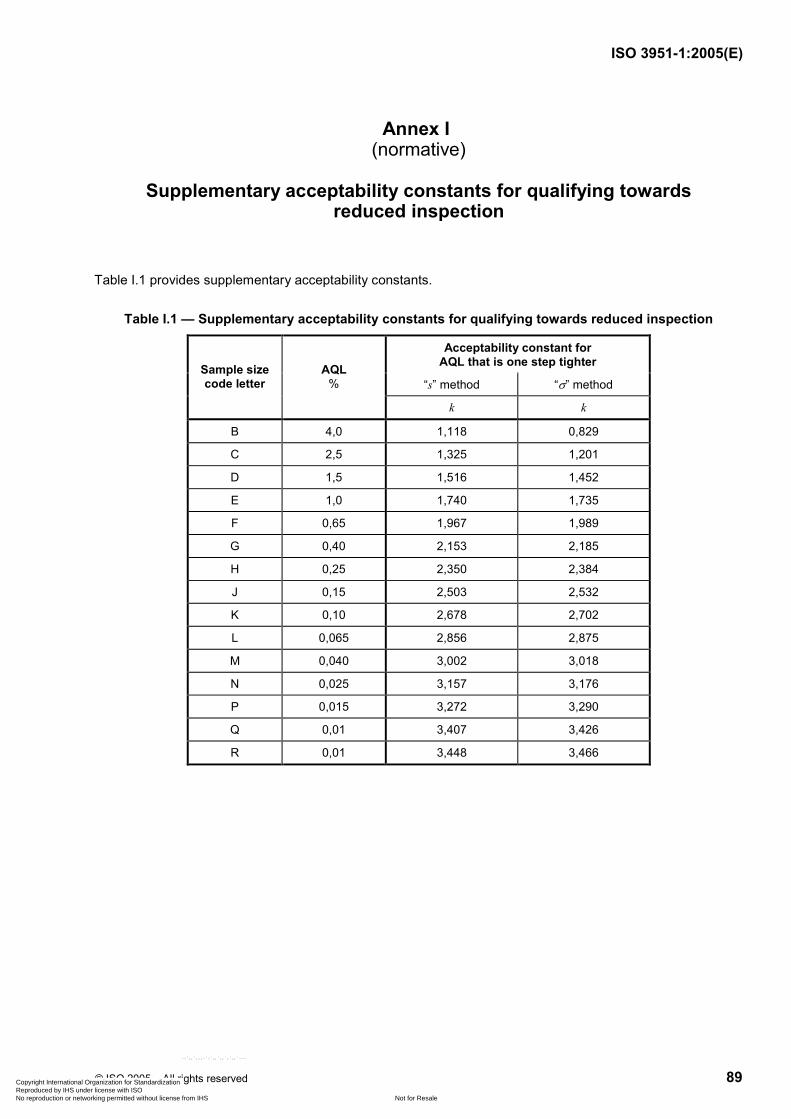
ISO 3951-1:2005(E)
© ISO 2005 – All rights reserved 89
Annex I (normative)
Supplementary acceptability constants for qualifying towards
reduced inspection
Table I.1 provides supplementary acceptability constants.
Table I.1 — Supplementary acceptability constants for qualifying towards reduced inspection
Acceptability constant for AQL that is one step tighter
“s” method “σ” method Sample size code letter
AQL %
k k
B 4,0 1,118 0,829
C 2,5 1,325 1,201
D 1,5 1,516 1,452
E 1,0 1,740 1,735
F 0,65 1,967 1,989
G 0,40 2,153 2,185
H 0,25 2,350 2,384
J 0,15 2,503 2,532
K 0,10 2,678 2,702
L 0,065 2,856 2,875
M 0,040 3,002 3,018
N 0,025 3,157 3,176
P 0,015 3,272 3,290
Q 0,01 3,407 3,426
R 0,01 3,448 3,466
Copyright International Organization for Standardization Reproduced by IHS under license with ISO
Not for ResaleNo reproduction or networking permitted without license from IHS
--`,,`,,,-`-`,,`,,`,`,,`---
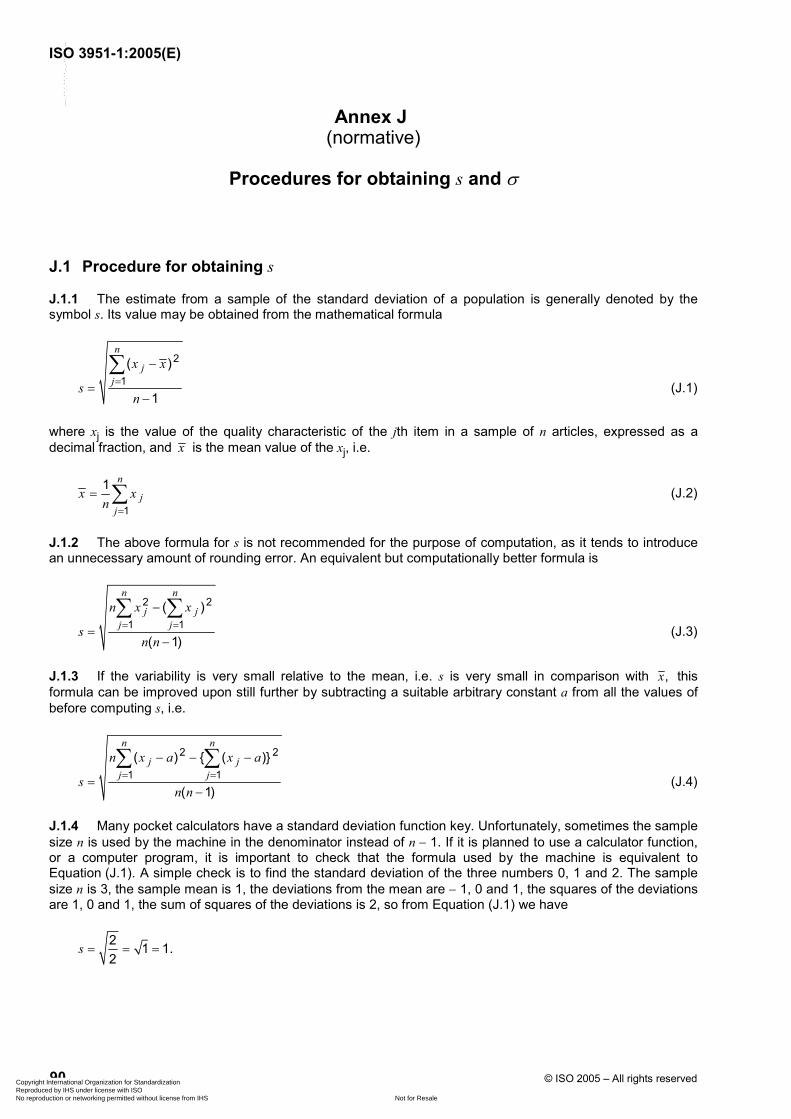
ISO 3951-1:2005(E)
90 © ISO 2005 – All rights reserved
Annex J (normative)
Procedures for obtaining s and σ
J.1 Procedure for obtaining s
J.1.1 The estimate from a sample of the standard deviation of a population is generally denoted by the symbol s. Its value may be obtained from the mathematical formula
2
1( )
1
n
jj
x x
sn
=
−
=−
∑ (J.1)
where xj is the value of the quality characteristic of the jth item in a sample of n articles, expressed as a decimal fraction, and x is the mean value of the xj, i.e.
1
1 n
jj
x xn =
= ∑ (J.2)
J.1.2 The above formula for s is not recommended for the purpose of computation, as it tends to introduce an unnecessary amount of rounding error. An equivalent but computationally better formula is
2 2
1 1( )
( 1)
n n
j jj j
n x x
sn n
= =
−
=−
∑ ∑ (J.3)
J.1.3 If the variability is very small relative to the mean, i.e. s is very small in comparison with ,x this formula can be improved upon still further by subtracting a suitable arbitrary constant a from all the values of before computing s, i.e.
2 2
1 1( ) ( )
( 1)
n n
j jj j
n x a x a
sn n
= =
− − −
=−
∑ ∑ (J.4)
J.1.4 Many pocket calculators have a standard deviation function key. Unfortunately, sometimes the sample size n is used by the machine in the denominator instead of n − 1. If it is planned to use a calculator function, or a computer program, it is important to check that the formula used by the machine is equivalent to Equation (J.1). A simple check is to find the standard deviation of the three numbers 0, 1 and 2. The sample size n is 3, the sample mean is 1, the deviations from the mean are − 1, 0 and 1, the squares of the deviations are 1, 0 and 1, the sum of squares of the deviations is 2, so from Equation (J.1) we have
2 1 1.2
s = = =
Copyright International Organization for Standardization Reproduced by IHS under license with ISO
Not for ResaleNo reproduction or networking permitted without license from IHS
--`,,`,,,-`-`,,`,,`,`,,`---
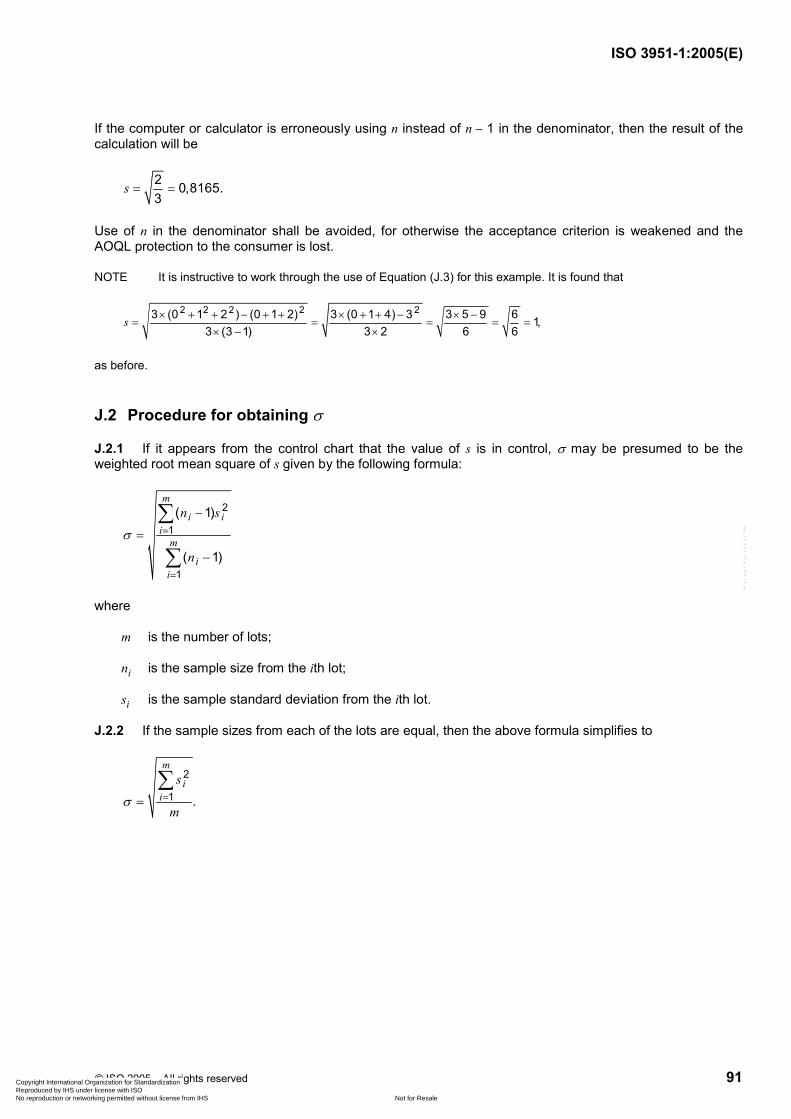
ISO 3951-1:2005(E)
© ISO 2005 – All rights reserved 91
If the computer or calculator is erroneously using n instead of n − 1 in the denominator, then the result of the calculation will be
2 0,8165.3
s = =
Use of n in the denominator shall be avoided, for otherwise the acceptance criterion is weakened and the AOQL protection to the consumer is lost.
NOTE It is instructive to work through the use of Equation (J.3) for this example. It is found that
2 2 2 2 23 (0 1 2 ) (0 1 2) 3 (0 1 4) 3 3 5 9 6 1,3 (3 1) 3 2 6 6
s × + + − + + × + + − × −= = = = =
× − ×
as before.
J.2 Procedure for obtaining σ
J.2.1 If it appears from the control chart that the value of s is in control, σ may be presumed to be the weighted root mean square of s given by the following formula:
2
1
1
( 1)
( 1)
m
i ii
m
ii
n s
n
σ =
=
−
=
−
∑
∑
where
m is the number of lots;
ni is the sample size from the ith lot;
si is the sample standard deviation from the ith lot.
J.2.2 If the sample sizes from each of the lots are equal, then the above formula simplifies to
2
1 .
m
ii
s
mσ ==
∑
Copyright International Organization for Standardization Reproduced by IHS under license with ISO
Not for ResaleNo reproduction or networking permitted without license from IHS
--`,,`,,,-`-`,,`,,`,`,,`---
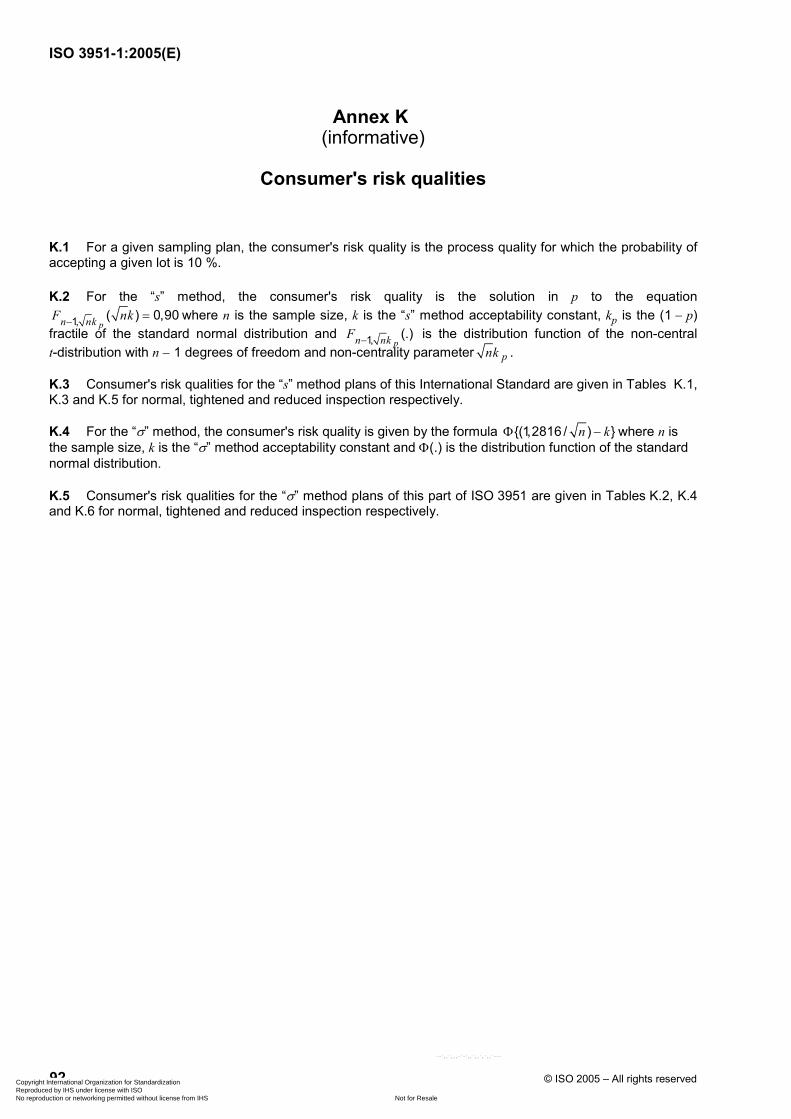
ISO 3951-1:2005(E)
92 © ISO 2005 – All rights reserved
Annex K (informative)
Consumer's risk qualities
K.1 For a given sampling plan, the consumer's risk quality is the process quality for which the probability of accepting a given lot is 10 %.
K.2 For the “s” method, the consumer's risk quality is the solution in p to the equation
1, ( ) 0,90pn nkF nk− = where n is the sample size, k is the “s” method acceptability constant, kp is the (1 − p)
fractile of the standard normal distribution and 1, (.)pn nkF − is the distribution function of the non-central
t-distribution with n − 1 degrees of freedom and non-centrality parameter pnk .
K.3 Consumer's risk qualities for the “s” method plans of this International Standard are given in Tables K.1, K.3 and K.5 for normal, tightened and reduced inspection respectively.
K.4 For the “σ” method, the consumer's risk quality is given by the formula (1,2816 / ) n kΦ − where n is the sample size, k is the “σ” method acceptability constant and Φ(.) is the distribution function of the standard normal distribution.
K.5 Consumer's risk qualities for the “σ” method plans of this part of ISO 3951 are given in Tables K.2, K.4 and K.6 for normal, tightened and reduced inspection respectively.
Copyright International Organization for Standardization Reproduced by IHS under license with ISO
Not for ResaleNo reproduction or networking permitted without license from IHS
--`,,`,,,-`-`,,`,,`,`,,`---
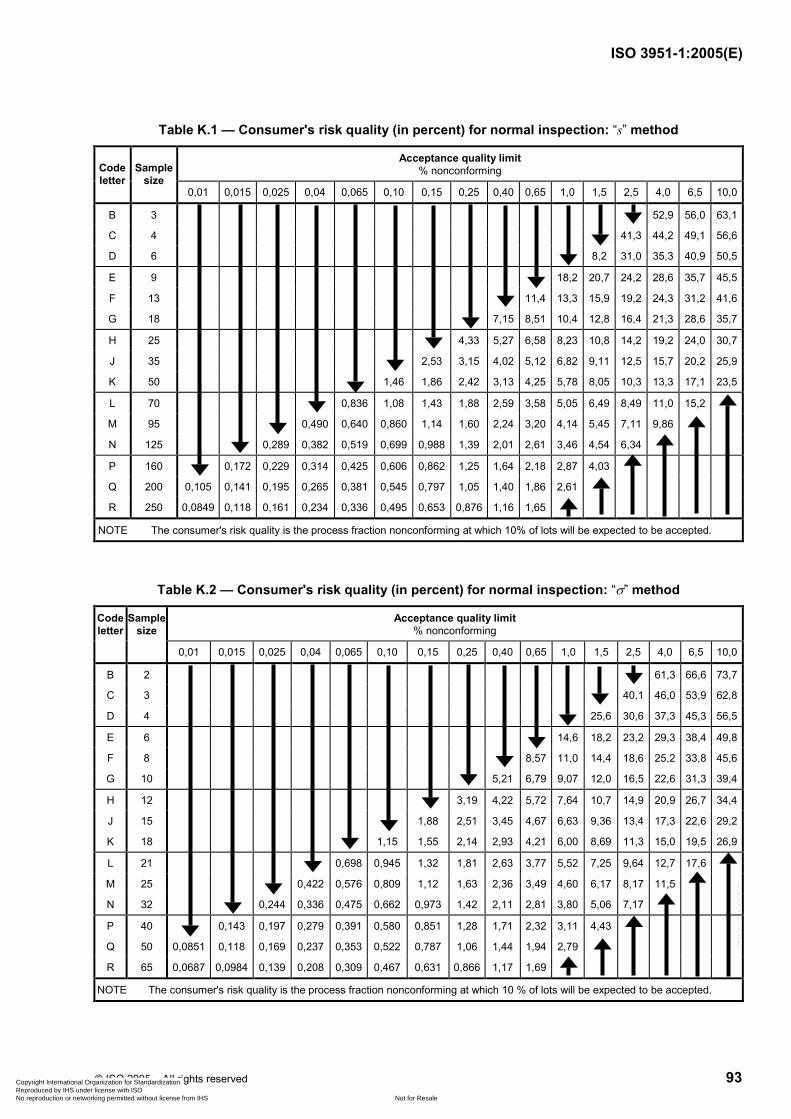
ISO 3951-1:2005(E)
© ISO 2005 – All rights reserved 93
Table K.1 — Consumer's risk quality (in percent) for normal inspection: “s” method
Acceptance quality limit % nonconforming Code
letter Sample
size 0,01 0,015 0,025 0,04 0,065 0,10 0,15 0,25 0,40 0,65 1,0 1,5 2,5 4,0 6,5 10,0
B 3 52,9 56,0 63,1
C 4 41,3 44,2 49,1 56,6
D 6 8,2 31,0 35,3 40,9 50,5
E 9 18,2 20,7 24,2 28,6 35,7 45,5
F 13 11,4 13,3 15,9 19,2 24,3 31,2 41,6
G 18 7,15 8,51 10,4 12,8 16,4 21,3 28,6 35,7
H 25 4,33 5,27 6,58 8,23 10,8 14,2 19,2 24,0 30,7
J 35 2,53 3,15 4,02 5,12 6,82 9,11 12,5 15,7 20,2 25,9
K 50 1,46 1,86 2,42 3,13 4,25 5,78 8,05 10,3 13,3 17,1 23,5
L 70 0,836 1,08 1,43 1,88 2,59 3,58 5,05 6,49 8,49 11,0 15,2
M 95 0,490 0,640 0,860 1,14 1,60 2,24 3,20 4,14 5,45 7,11 9,86
N 125 0,289 0,382 0,519 0,699 0,988 1,39 2,01 2,61 3,46 4,54 6,34
P 160 0,172 0,229 0,314 0,425 0,606 0,862 1,25 1,64 2,18 2,87 4,03
Q 200 0,105 0,141 0,195 0,265 0,381 0,545 0,797 1,05 1,40 1,86 2,61
R 250 0,0849 0,118 0,161 0,234 0,336 0,495 0,653 0,876 1,16 1,65
NOTE The consumer's risk quality is the process fraction nonconforming at which 10% of lots will be expected to be accepted.
Table K.2 — Consumer's risk quality (in percent) for normal inspection: “σ” method
Acceptance quality limit % nonconforming
Code letter
Sample size
0,01 0,015 0,025 0,04 0,065 0,10 0,15 0,25 0,40 0,65 1,0 1,5 2,5 4,0 6,5 10,0
B 2 61,3 66,6 73,7
C 3 40,1 46,0 53,9 62,8
D 4 25,6 30,6 37,3 45,3 56,5
E 6 14,6 18,2 23,2 29,3 38,4 49,8
F 8 8,57 11,0 14,4 18,6 25,2 33,8 45,6
G 10 5,21 6,79 9,07 12,0 16,5 22,6 31,3 39,4
H 12 3,19 4,22 5,72 7,64 10,7 14,9 20,9 26,7 34,4
J 15 1,88 2,51 3,45 4,67 6,63 9,36 13,4 17,3 22,6 29,2
K 18 1,15 1,55 2,14 2,93 4,21 6,00 8,69 11,3 15,0 19,5 26,9
L 21 0,698 0,945 1,32 1,81 2,63 3,77 5,52 7,25 9,64 12,7 17,6
M 25 0,422 0,576 0,809 1,12 1,63 2,36 3,49 4,60 6,17 8,17 11,5
N 32 0,244 0,336 0,475 0,662 0,973 1,42 2,11 2,81 3,80 5,06 7,17
P 40 0,143 0,197 0,279 0,391 0,580 0,851 1,28 1,71 2,32 3,11 4,43
Q 50 0,0851 0,118 0,169 0,237 0,353 0,522 0,787 1,06 1,44 1,94 2,79
R 65 0,0687 0,0984 0,139 0,208 0,309 0,467 0,631 0,866 1,17 1,69
NOTE The consumer's risk quality is the process fraction nonconforming at which 10 % of lots will be expected to be accepted.
Copyright International Organization for Standardization Reproduced by IHS under license with ISO
Not for ResaleNo reproduction or networking permitted without license from IHS
--`,,`,,,-`-`,,`,,`,`,,`---
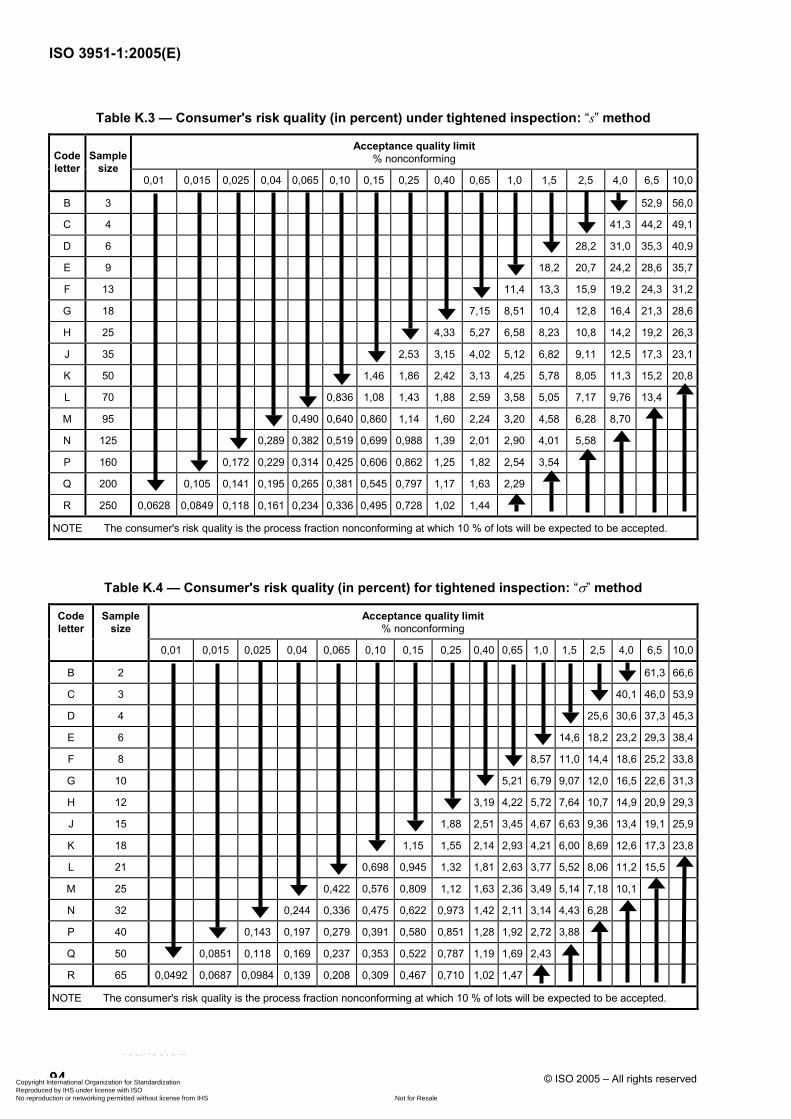
ISO 3951-1:2005(E)
94 © ISO 2005 – All rights reserved
Table K.3 — Consumer's risk quality (in percent) under tightened inspection: “s” method
Acceptance quality limit % nonconforming Code
letter Sample
size 0,01 0,015 0,025 0,04 0,065 0,10 0,15 0,25 0,40 0,65 1,0 1,5 2,5 4,0 6,5 10,0
B 3 52,9 56,0
C 4 41,3 44,2 49,1
D 6 28,2 31,0 35,3 40,9
E 9 18,2 20,7 24,2 28,6 35,7
F 13 11,4 13,3 15,9 19,2 24,3 31,2
G 18 7,15 8,51 10,4 12,8 16,4 21,3 28,6
H 25 4,33 5,27 6,58 8,23 10,8 14,2 19,2 26,3
J 35 2,53 3,15 4,02 5,12 6,82 9,11 12,5 17,3 23,1
K 50 1,46 1,86 2,42 3,13 4,25 5,78 8,05 11,3 15,2 20,8
L 70 0,836 1,08 1,43 1,88 2,59 3,58 5,05 7,17 9,76 13,4
M 95 0,490 0,640 0,860 1,14 1,60 2,24 3,20 4,58 6,28 8,70
N 125 0,289 0,382 0,519 0,699 0,988 1,39 2,01 2,90 4,01 5,58
P 160 0,172 0,229 0,314 0,425 0,606 0,862 1,25 1,82 2,54 3,54
Q 200 0,105 0,141 0,195 0,265 0,381 0,545 0,797 1,17 1,63 2,29
R 250 0,0628 0,0849 0,118 0,161 0,234 0,336 0,495 0,728 1,02 1,44
NOTE The consumer's risk quality is the process fraction nonconforming at which 10 % of lots will be expected to be accepted.
Table K.4 — Consumer's risk quality (in percent) for tightened inspection: “σ” method
Acceptance quality limit % nonconforming
Code letter
Sample size
0,01 0,015 0,025 0,04 0,065 0,10 0,15 0,25 0,40 0,65 1,0 1,5 2,5 4,0 6,5 10,0
B 2 61,3 66,6
C 3 40,1 46,0 53,9
D 4 25,6 30,6 37,3 45,3
E 6 14,6 18,2 23,2 29,3 38,4
F 8 8,57 11,0 14,4 18,6 25,2 33,8
G 10 5,21 6,79 9,07 12,0 16,5 22,6 31,3
H 12 3,19 4,22 5,72 7,64 10,7 14,9 20,9 29,3
J 15 1,88 2,51 3,45 4,67 6,63 9,36 13,4 19,1 25,9
K 18 1,15 1,55 2,14 2,93 4,21 6,00 8,69 12,6 17,3 23,8
L 21 0,698 0,945 1,32 1,81 2,63 3,77 5,52 8,06 11,2 15,5
M 25 0,422 0,576 0,809 1,12 1,63 2,36 3,49 5,14 7,18 10,1
N 32 0,244 0,336 0,475 0,622 0,973 1,42 2,11 3,14 4,43 6,28
P 40 0,143 0,197 0,279 0,391 0,580 0,851 1,28 1,92 2,72 3,88
Q 50 0,0851 0,118 0,169 0,237 0,353 0,522 0,787 1,19 1,69 2,43
R 65 0,0492 0,0687 0,0984 0,139 0,208 0,309 0,467 0,710 1,02 1,47
NOTE The consumer's risk quality is the process fraction nonconforming at which 10 % of lots will be expected to be accepted.
Copyright International Organization for Standardization Reproduced by IHS under license with ISO
Not for ResaleNo reproduction or networking permitted without license from IHS
--`,,`,,,-`-`,,`,,`,`,,`---
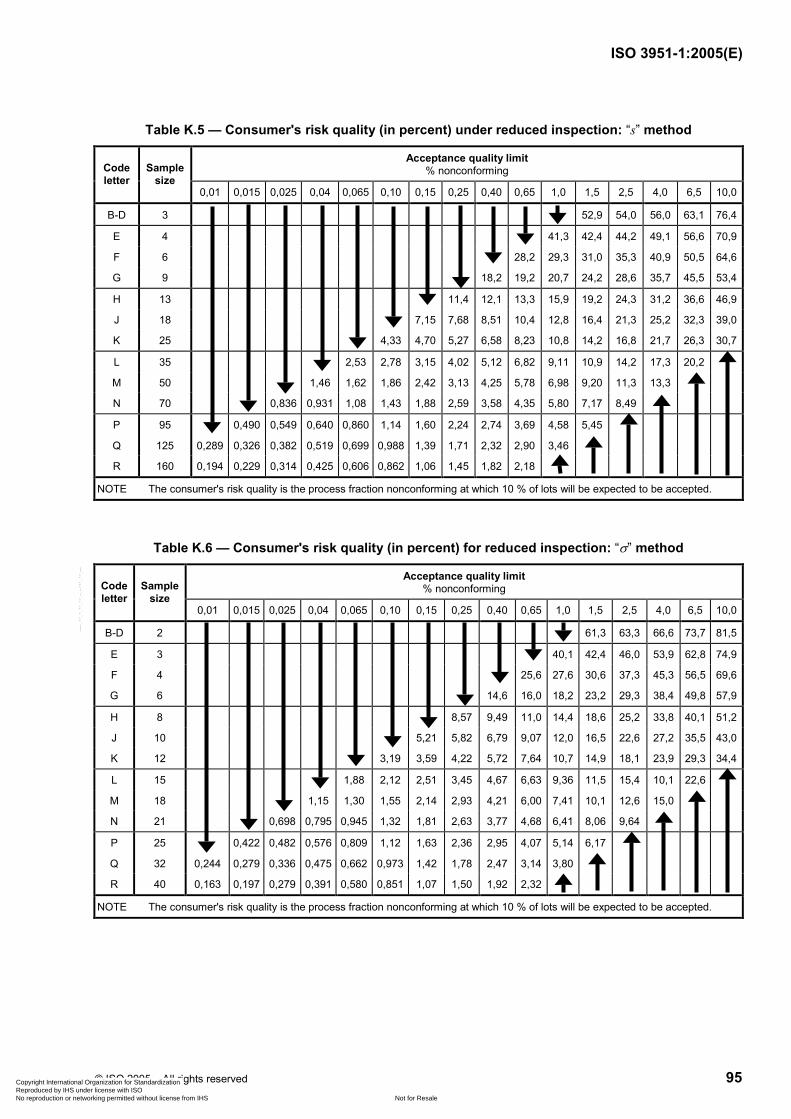
ISO 3951-1:2005(E)
© ISO 2005 – All rights reserved 95
Table K.5 — Consumer's risk quality (in percent) under reduced inspection: “s” method
Acceptance quality limit % nonconforming Code
letter Sample
size 0,01 0,015 0,025 0,04 0,065 0,10 0,15 0,25 0,40 0,65 1,0 1,5 2,5 4,0 6,5 10,0
B-D 3 52,9 54,0 56,0 63,1 76,4
E 4 41,3 42,4 44,2 49,1 56,6 70,9
F 6 28,2 29,3 31,0 35,3 40,9 50,5 64,6
G 9 18,2 19,2 20,7 24,2 28,6 35,7 45,5 53,4
H 13 11,4 12,1 13,3 15,9 19,2 24,3 31,2 36,6 46,9
J 18 7,15 7,68 8,51 10,4 12,8 16,4 21,3 25,2 32,3 39,0
K 25 4,33 4,70 5,27 6,58 8,23 10,8 14,2 16,8 21,7 26,3 30,7
L 35 2,53 2,78 3,15 4,02 5,12 6,82 9,11 10,9 14,2 17,3 20,2
M 50 1,46 1,62 1,86 2,42 3,13 4,25 5,78 6,98 9,20 11,3 13,3
N 70 0,836 0,931 1,08 1,43 1,88 2,59 3,58 4,35 5,80 7,17 8,49
P 95 0,490 0,549 0,640 0,860 1,14 1,60 2,24 2,74 3,69 4,58 5,45
Q 125 0,289 0,326 0,382 0,519 0,699 0,988 1,39 1,71 2,32 2,90 3,46
R 160 0,194 0,229 0,314 0,425 0,606 0,862 1,06 1,45 1,82 2,18
NOTE The consumer's risk quality is the process fraction nonconforming at which 10 % of lots will be expected to be accepted.
Table K.6 — Consumer's risk quality (in percent) for reduced inspection: “σ” method
Acceptance quality limit % nonconforming Code
letter Sample
size 0,01 0,015 0,025 0,04 0,065 0,10 0,15 0,25 0,40 0,65 1,0 1,5 2,5 4,0 6,5 10,0
B-D 2 61,3 63,3 66,6 73,7 81,5
E 3 40,1 42,4 46,0 53,9 62,8 74,9
F 4 25,6 27,6 30,6 37,3 45,3 56,5 69,6
G 6 14,6 16,0 18,2 23,2 29,3 38,4 49,8 57,9
H 8 8,57 9,49 11,0 14,4 18,6 25,2 33,8 40,1 51,2
J 10 5,21 5,82 6,79 9,07 12,0 16,5 22,6 27,2 35,5 43,0
K 12 3,19 3,59 4,22 5,72 7,64 10,7 14,9 18,1 23,9 29,3 34,4
L 15 1,88 2,12 2,51 3,45 4,67 6,63 9,36 11,5 15,4 10,1 22,6
M 18 1,15 1,30 1,55 2,14 2,93 4,21 6,00 7,41 10,1 12,6 15,0
N 21 0,698 0,795 0,945 1,32 1,81 2,63 3,77 4,68 6,41 8,06 9,64
P 25 0,422 0,482 0,576 0,809 1,12 1,63 2,36 2,95 4,07 5,14 6,17
Q 32 0,244 0,279 0,336 0,475 0,662 0,973 1,42 1,78 2,47 3,14 3,80
R 40 0,163 0,197 0,279 0,391 0,580 0,851 1,07 1,50 1,92 2,32
NOTE The consumer's risk quality is the process fraction nonconforming at which 10 % of lots will be expected to be accepted.
Copyright International Organization for Standardization Reproduced by IHS under license with ISO
Not for ResaleNo reproduction or networking permitted without license from IHS
--`,,`,,,-`-`,,`,,`,`,,`---
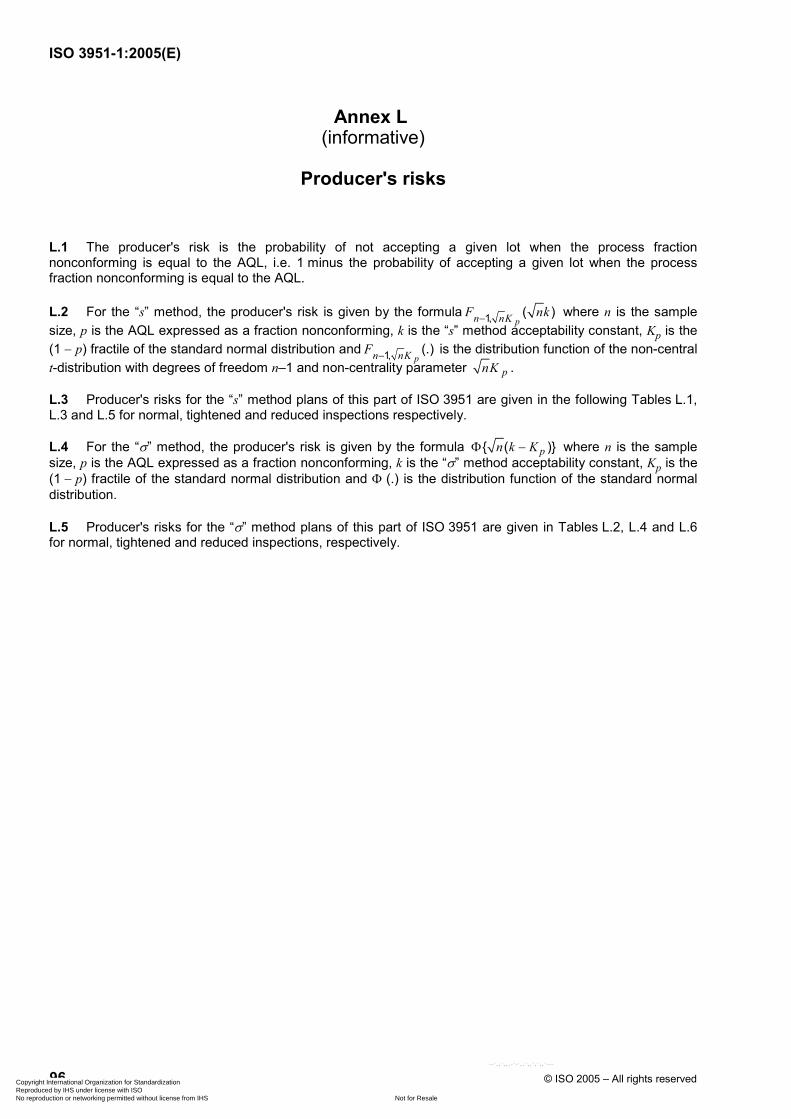
ISO 3951-1:2005(E)
96 © ISO 2005 – All rights reserved
Annex L (informative)
Producer's risks
L.1 The producer's risk is the probability of not accepting a given lot when the process fraction nonconforming is equal to the AQL, i.e. 1 minus the probability of accepting a given lot when the process fraction nonconforming is equal to the AQL.
L.2 For the “s” method, the producer's risk is given by the formula 1, ( )pn nKF nk− where n is the sample
size, p is the AQL expressed as a fraction nonconforming, k is the “s” method acceptability constant, Kp is the (1 − p) fractile of the standard normal distribution and 1, (.)
pn nKF − is the distribution function of the non-central t-distribution with degrees of freedom n–1 and non-centrality parameter pnK .
L.3 Producer's risks for the “s” method plans of this part of ISO 3951 are given in the following Tables L.1, L.3 and L.5 for normal, tightened and reduced inspections respectively.
L.4 For the “σ” method, the producer's risk is given by the formula ( )pn k KΦ − where n is the sample size, p is the AQL expressed as a fraction nonconforming, k is the “σ” method acceptability constant, Kp is the (1 − p) fractile of the standard normal distribution and Φ (.) is the distribution function of the standard normal distribution.
L.5 Producer's risks for the “σ” method plans of this part of ISO 3951 are given in Tables L.2, L.4 and L.6 for normal, tightened and reduced inspections, respectively.
Copyright International Organization for Standardization Reproduced by IHS under license with ISO
Not for ResaleNo reproduction or networking permitted without license from IHS
--`,,`,,,-`-`,,`,,`,`,,`---
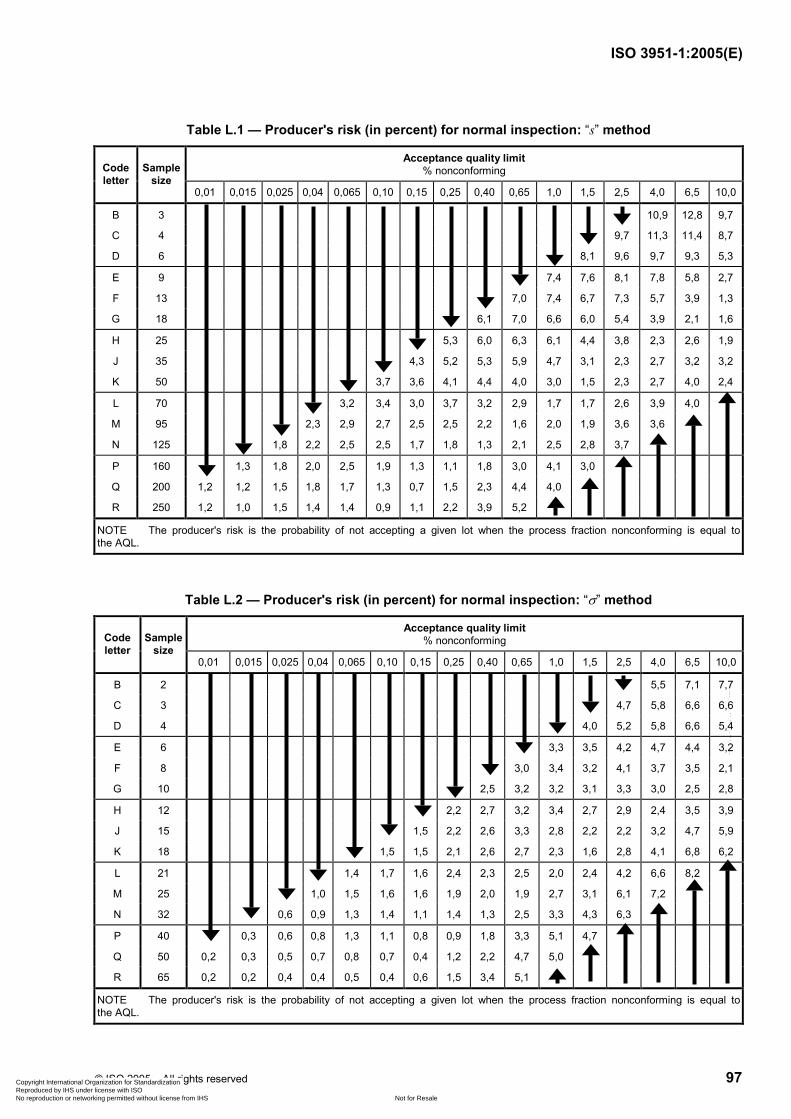
ISO 3951-1:2005(E)
© ISO 2005 – All rights reserved 97
Table L.1 — Producer's risk (in percent) for normal inspection: “s” method
Acceptance quality limit % nonconforming Code
letter Sample
size 0,01 0,015 0,025 0,04 0,065 0,10 0,15 0,25 0,40 0,65 1,0 1,5 2,5 4,0 6,5 10,0
B 3 10,9 12,8 9,7
C 4 9,7 11,3 11,4 8,7
D 6 8,1 9,6 9,7 9,3 5,3
E 9 7,4 7,6 8,1 7,8 5,8 2,7
F 13 7,0 7,4 6,7 7,3 5,7 3,9 1,3
G 18 6,1 7,0 6,6 6,0 5,4 3,9 2,1 1,6
H 25 5,3 6,0 6,3 6,1 4,4 3,8 2,3 2,6 1,9
J 35 4,3 5,2 5,3 5,9 4,7 3,1 2,3 2,7 3,2 3,2
K 50 3,7 3,6 4,1 4,4 4,0 3,0 1,5 2,3 2,7 4,0 2,4
L 70 3,2 3,4 3,0 3,7 3,2 2,9 1,7 1,7 2,6 3,9 4,0
M 95 2,3 2,9 2,7 2,5 2,5 2,2 1,6 2,0 1,9 3,6 3,6
N 125 1,8 2,2 2,5 2,5 1,7 1,8 1,3 2,1 2,5 2,8 3,7
P 160 1,3 1,8 2,0 2,5 1,9 1,3 1,1 1,8 3,0 4,1 3,0
Q 200 1,2 1,2 1,5 1,8 1,7 1,3 0,7 1,5 2,3 4,4 4,0
R 250 1,2 1,0 1,5 1,4 1,4 0,9 1,1 2,2 3,9 5,2
NOTE The producer's risk is the probability of not accepting a given lot when the process fraction nonconforming is equal to the AQL.
Table L.2 — Producer's risk (in percent) for normal inspection: “σ” method
Acceptance quality limit % nonconforming Code
letter Sample
size 0,01 0,015 0,025 0,04 0,065 0,10 0,15 0,25 0,40 0,65 1,0 1,5 2,5 4,0 6,5 10,0
B 2 5,5 7,1 7,7
C 3 4,7 5,8 6,6 6,6
D 4 4,0 5,2 5,8 6,6 5,4
E 6 3,3 3,5 4,2 4,7 4,4 3,2
F 8 3,0 3,4 3,2 4,1 3,7 3,5 2,1
G 10 2,5 3,2 3,2 3,1 3,3 3,0 2,5 2,8
H 12 2,2 2,7 3,2 3,4 2,7 2,9 2,4 3,5 3,9
J 15 1,5 2,2 2,6 3,3 2,8 2,2 2,2 3,2 4,7 5,9
K 18 1,5 1,5 2,1 2,6 2,7 2,3 1,6 2,8 4,1 6,8 6,2
L 21 1,4 1,7 1,6 2,4 2,3 2,5 2,0 2,4 4,2 6,6 8,2
M 25 1,0 1,5 1,6 1,6 1,9 2,0 1,9 2,7 3,1 6,1 7,2
N 32 0,6 0,9 1,3 1,4 1,1 1,4 1,3 2,5 3,3 4,3 6,3
P 40 0,3 0,6 0,8 1,3 1,1 0,8 0,9 1,8 3,3 5,1 4,7
Q 50 0,2 0,3 0,5 0,7 0,8 0,7 0,4 1,2 2,2 4,7 5,0
R 65 0,2 0,2 0,4 0,4 0,5 0,4 0,6 1,5 3,4 5,1
NOTE The producer's risk is the probability of not accepting a given lot when the process fraction nonconforming is equal to the AQL.
Copyright International Organization for Standardization Reproduced by IHS under license with ISO
Not for ResaleNo reproduction or networking permitted without license from IHS
--`,,`,,,-`-`,,`,,`,`,,`---
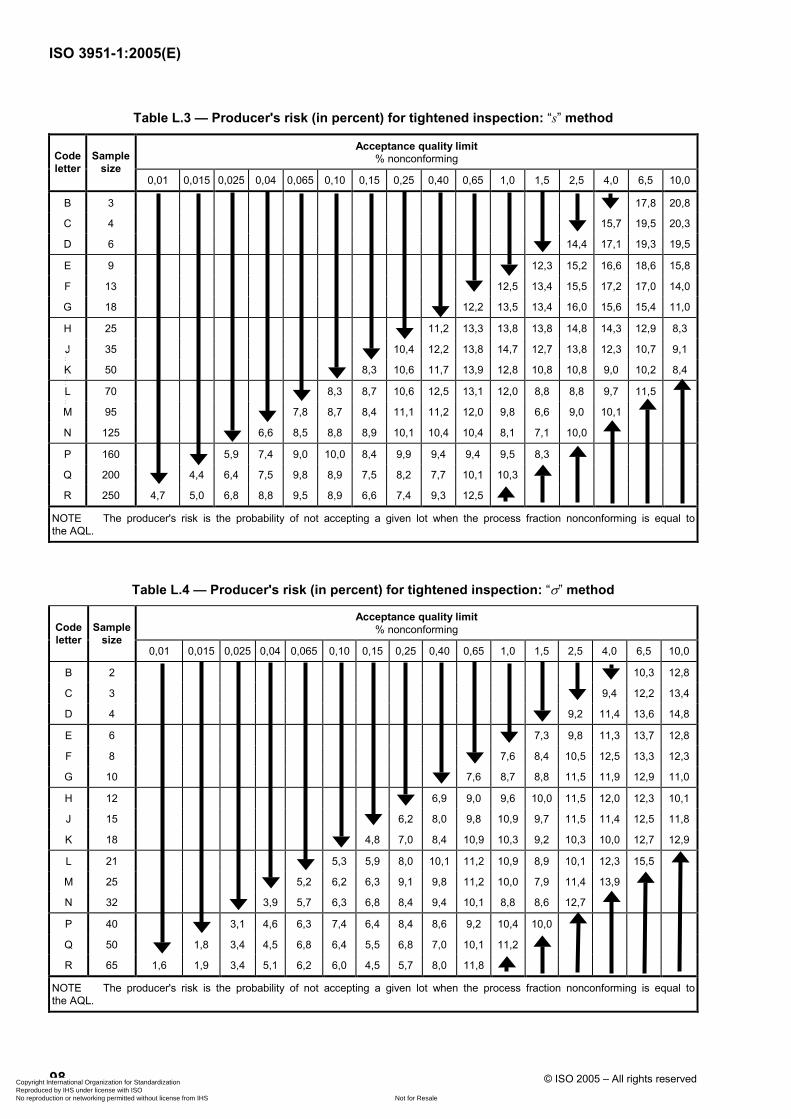
ISO 3951-1:2005(E)
98 © ISO 2005 – All rights reserved
Table L.3 — Producer's risk (in percent) for tightened inspection: “s” method
Acceptance quality limit % nonconforming Code
letter Sample
size 0,01 0,015 0,025 0,04 0,065 0,10 0,15 0,25 0,40 0,65 1,0 1,5 2,5 4,0 6,5 10,0
B 3 17,8 20,8
C 4 15,7 19,5 20,3
D 6 14,4 17,1 19,3 19,5
E 9 12,3 15,2 16,6 18,6 15,8
F 13 12,5 13,4 15,5 17,2 17,0 14,0
G 18 12,2 13,5 13,4 16,0 15,6 15,4 11,0
H 25 11,2 13,3 13,8 13,8 14,8 14,3 12,9 8,3
J 35 10,4 12,2 13,8 14,7 12,7 13,8 12,3 10,7 9,1
K 50 8,3 10,6 11,7 13,9 12,8 10,8 10,8 9,0 10,2 8,4
L 70 8,3 8,7 10,6 12,5 13,1 12,0 8,8 8,8 9,7 11,5
M 95 7,8 8,7 8,4 11,1 11,2 12,0 9,8 6,6 9,0 10,1
N 125 6,6 8,5 8,8 8,9 10,1 10,4 10,4 8,1 7,1 10,0
P 160 5,9 7,4 9,0 10,0 8,4 9,9 9,4 9,4 9,5 8,3
Q 200 4,4 6,4 7,5 9,8 8,9 7,5 8,2 7,7 10,1 10,3
R 250 4,7 5,0 6,8 8,8 9,5 8,9 6,6 7,4 9,3 12,5
NOTE The producer's risk is the probability of not accepting a given lot when the process fraction nonconforming is equal to the AQL.
Table L.4 — Producer's risk (in percent) for tightened inspection: “σ” method
Acceptance quality limit % nonconforming Code
letter Sample
size 0,01 0,015 0,025 0,04 0,065 0,10 0,15 0,25 0,40 0,65 1,0 1,5 2,5 4,0 6,5 10,0
B 2 10,3 12,8
C 3 9,4 12,2 13,4
D 4 9,2 11,4 13,6 14,8
E 6 7,3 9,8 11,3 13,7 12,8
F 8 7,6 8,4 10,5 12,5 13,3 12,3
G 10 7,6 8,7 8,8 11,5 11,9 12,9 11,0
H 12 6,9 9,0 9,6 10,0 11,5 12,0 12,3 10,1
J 15 6,2 8,0 9,8 10,9 9,7 11,5 11,4 12,5 11,8
K 18 4,8 7,0 8,4 10,9 10,3 9,2 10,3 10,0 12,7 12,9
L 21 5,3 5,9 8,0 10,1 11,2 10,9 8,9 10,1 12,3 15,5
M 25 5,2 6,2 6,3 9,1 9,8 11,2 10,0 7,9 11,4 13,9
N 32 3,9 5,7 6,3 6,8 8,4 9,4 10,1 8,8 8,6 12,7
P 40 3,1 4,6 6,3 7,4 6,4 8,4 8,6 9,2 10,4 10,0
Q 50 1,8 3,4 4,5 6,8 6,4 5,5 6,8 7,0 10,1 11,2
R 65 1,6 1,9 3,4 5,1 6,2 6,0 4,5 5,7 8,0 11,8
NOTE The producer's risk is the probability of not accepting a given lot when the process fraction nonconforming is equal to the AQL.
Copyright International Organization for Standardization Reproduced by IHS under license with ISO
Not for ResaleNo reproduction or networking permitted without license from IHS
--`,,`,,,-`-`,,`,,`,`,,`---
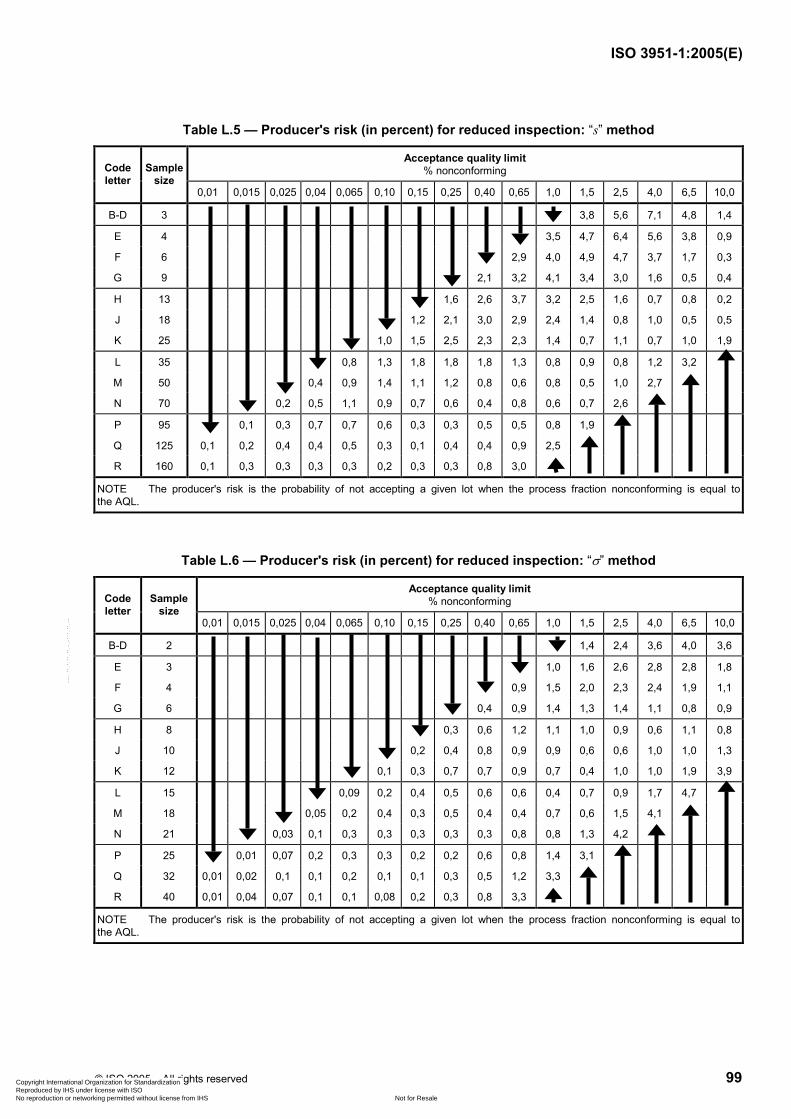
ISO 3951-1:2005(E)
© ISO 2005 – All rights reserved 99
Table L.5 — Producer's risk (in percent) for reduced inspection: “s” method
Acceptance quality limit % nonconforming Code
letter Sample
size 0,01 0,015 0,025 0,04 0,065 0,10 0,15 0,25 0,40 0,65 1,0 1,5 2,5 4,0 6,5 10,0
B-D 3 3,8 5,6 7,1 4,8 1,4
E 4 3,5 4,7 6,4 5,6 3,8 0,9
F 6 2,9 4,0 4,9 4,7 3,7 1,7 0,3
G 9 2,1 3,2 4,1 3,4 3,0 1,6 0,5 0,4
H 13 1,6 2,6 3,7 3,2 2,5 1,6 0,7 0,8 0,2
J 18 1,2 2,1 3,0 2,9 2,4 1,4 0,8 1,0 0,5 0,5
K 25 1,0 1,5 2,5 2,3 2,3 1,4 0,7 1,1 0,7 1,0 1,9
L 35 0,8 1,3 1,8 1,8 1,8 1,3 0,8 0,9 0,8 1,2 3,2
M 50 0,4 0,9 1,4 1,1 1,2 0,8 0,6 0,8 0,5 1,0 2,7
N 70 0,2 0,5 1,1 0,9 0,7 0,6 0,4 0,8 0,6 0,7 2,6
P 95 0,1 0,3 0,7 0,7 0,6 0,3 0,3 0,5 0,5 0,8 1,9
Q 125 0,1 0,2 0,4 0,4 0,5 0,3 0,1 0,4 0,4 0,9 2,5
R 160 0,1 0,3 0,3 0,3 0,3 0,2 0,3 0,3 0,8 3,0
NOTE The producer's risk is the probability of not accepting a given lot when the process fraction nonconforming is equal to the AQL.
Table L.6 — Producer's risk (in percent) for reduced inspection: “σ” method
Acceptance quality limit % nonconforming Code
letter Sample
size 0,01 0,015 0,025 0,04 0,065 0,10 0,15 0,25 0,40 0,65 1,0 1,5 2,5 4,0 6,5 10,0
B-D 2 1,4 2,4 3,6 4,0 3,6
E 3 1,0 1,6 2,6 2,8 2,8 1,8
F 4 0,9 1,5 2,0 2,3 2,4 1,9 1,1
G 6 0,4 0,9 1,4 1,3 1,4 1,1 0,8 0,9
H 8 0,3 0,6 1,2 1,1 1,0 0,9 0,6 1,1 0,8
J 10 0,2 0,4 0,8 0,9 0,9 0,6 0,6 1,0 1,0 1,3
K 12 0,1 0,3 0,7 0,7 0,9 0,7 0,4 1,0 1,0 1,9 3,9
L 15 0,09 0,2 0,4 0,5 0,6 0,6 0,4 0,7 0,9 1,7 4,7
M 18 0,05 0,2 0,4 0,3 0,5 0,4 0,4 0,7 0,6 1,5 4,1
N 21 0,03 0,1 0,3 0,3 0,3 0,3 0,3 0,8 0,8 1,3 4,2
P 25 0,01 0,07 0,2 0,3 0,3 0,2 0,2 0,6 0,8 1,4 3,1
Q 32 0,01 0,02 0,1 0,1 0,2 0,1 0,1 0,3 0,5 1,2 3,3
R 40 0,01 0,04 0,07 0,1 0,1 0,08 0,2 0,3 0,8 3,3
NOTE The producer's risk is the probability of not accepting a given lot when the process fraction nonconforming is equal to the AQL.
Copyright International Organization for Standardization Reproduced by IHS under license with ISO
Not for ResaleNo reproduction or networking permitted without license from IHS
--`,,`,,,-`-`,,`,,`,`,,`---
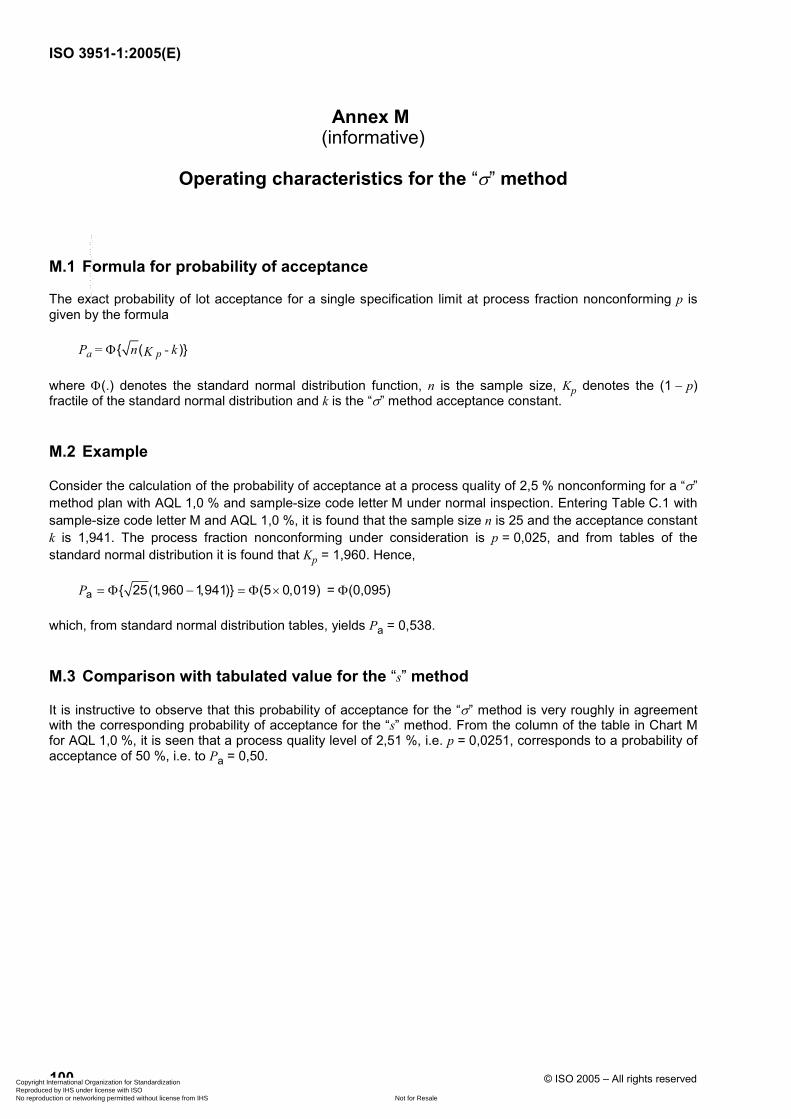
ISO 3951-1:2005(E)
100 © ISO 2005 – All rights reserved
Annex M (informative)
Operating characteristics for the “σ” method
M.1 Formula for probability of acceptance
The exact probability of lot acceptance for a single specification limit at process fraction nonconforming p is given by the formula
( )paP = n - kKΦ
where Φ(.) denotes the standard normal distribution function, n is the sample size, Kp denotes the (1 − p) fractile of the standard normal distribution and k is the “σ” method acceptance constant.
M.2 Example
Consider the calculation of the probability of acceptance at a process quality of 2,5 % nonconforming for a “σ” method plan with AQL 1,0 % and sample-size code letter M under normal inspection. Entering Table C.1 with sample-size code letter M and AQL 1,0 %, it is found that the sample size n is 25 and the acceptance constant k is 1,941. The process fraction nonconforming under consideration is p = 0,025, and from tables of the standard normal distribution it is found that Kp = 1,960. Hence,
a 25(1,960 1,941) (5 0,019)P = Φ − = Φ × = Φ(0,095)
which, from standard normal distribution tables, yields Pa = 0,538.
M.3 Comparison with tabulated value for the “s” method
It is instructive to observe that this probability of acceptance for the “σ” method is very roughly in agreement with the corresponding probability of acceptance for the “s” method. From the column of the table in Chart M for AQL 1,0 %, it is seen that a process quality level of 2,51 %, i.e. p = 0,0251, corresponds to a probability of acceptance of 50 %, i.e. to Pa = 0,50.
Copyright International Organization for Standardization Reproduced by IHS under license with ISO
Not for ResaleNo reproduction or networking permitted without license from IHS
--`,,`,,,-`-`,,`,,`,`,,`---
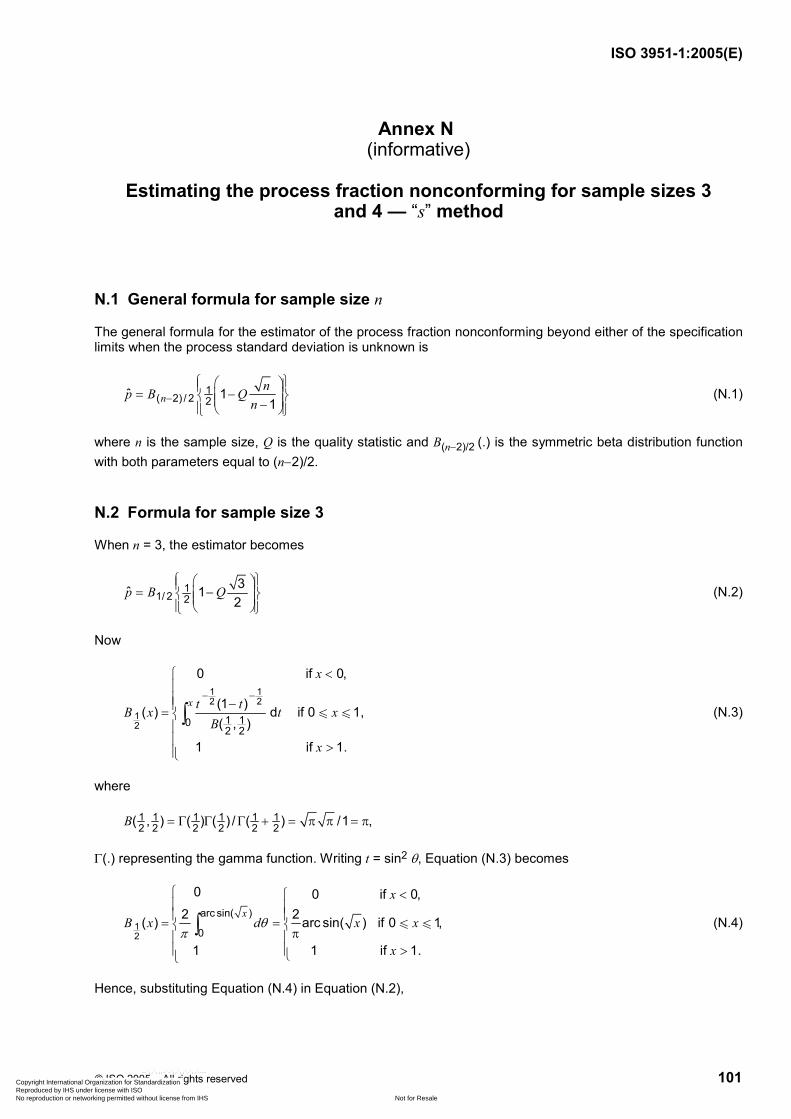
ISO 3951-1:2005(E)
© ISO 2005 – All rights reserved 101
Annex N (informative)
Estimating the process fraction nonconforming for sample sizes 3
and 4 — “s” method
N.1 General formula for sample size n
The general formula for the estimator of the process fraction nonconforming beyond either of the specification limits when the process standard deviation is unknown is
1( 2) / 2 2ˆ 1
1nnp B Q
n− = − −
(N.1)
where n is the sample size, Q is the quality statistic and B(n−2)/2 (.) is the symmetric beta distribution function with both parameters equal to (n−2)/2.
N.2 Formula for sample size 3
When n = 3, the estimator becomes
11/ 2 2
3ˆ 12
p B Q = −
(N.2)
Now
1 12 2
12 1 10
2 2
0 if 0,
(1 )( ) d if 0 1,( , )
1 if 1.
x
x
t tB x t xB
x
− −
< −= >
∫ u u (N.3)
where
1 1 1 1 1 12 2 2 2 2 2( , ) ( ) ( ) / ( ) /1 ,B = Γ Γ Γ + = π π = π
Γ(.) representing the gamma function. Writing t = sin2 θ, Equation (N.3) becomes
12
arc sin( )
0
0 0 if 0,2 2( ) arc sin( ) if 0 1,
1 1 if 1.
x
x
B x d x x
x
θπ
< = =
π >
∫ u u (N.4)
Hence, substituting Equation (N.4) in Equation (N.2),
Copyright International Organization for Standardization Reproduced by IHS under license with ISO
Not for ResaleNo reproduction or networking permitted without license from IHS
--`,,`,,,-`-`,,`,,`,`,,`---
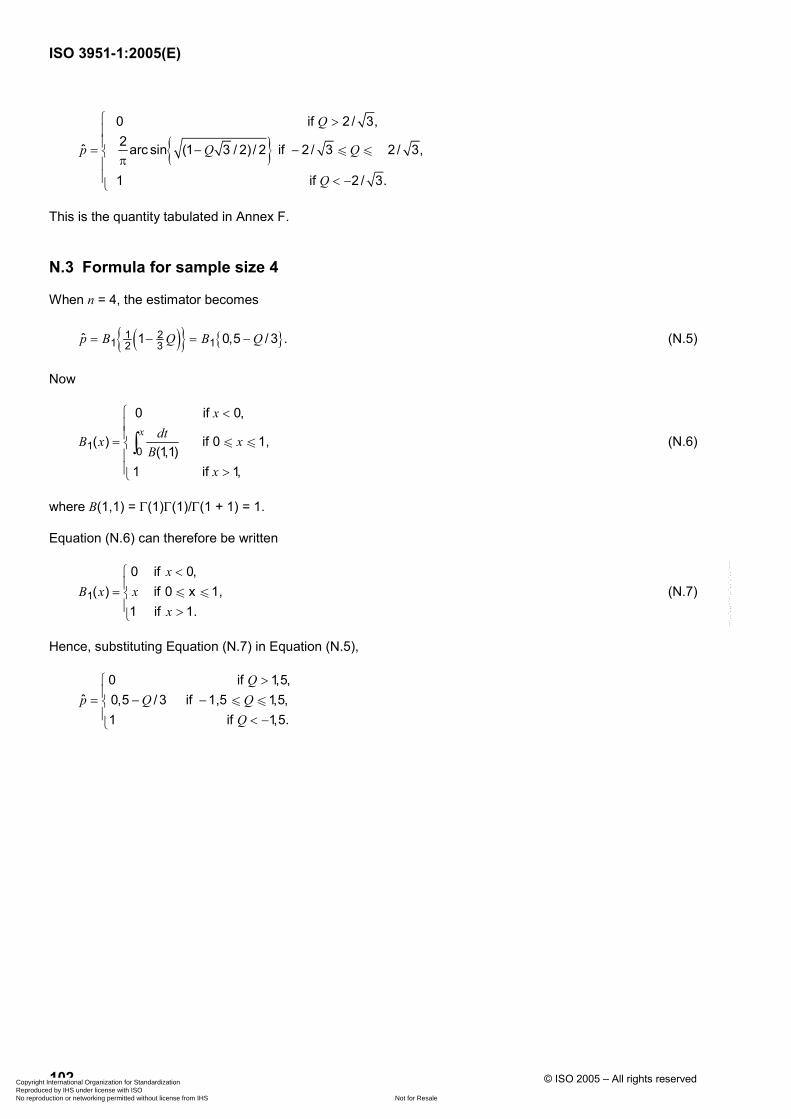
ISO 3951-1:2005(E)
102 © ISO 2005 – All rights reserved
0 if 2 / 3,
2ˆ arc sin (1 3 / 2) / 2 if 2 / 3 2 / 3,
1 if 2 / 3.
Q
p Q Q
Q
>= − −
π < −
u u
This is the quantity tabulated in Annex F.
N.3 Formula for sample size 4
When n = 4, the estimator becomes
( ) 1 21 12 3ˆ 1 0,5 / 3 .p B Q B Q= − = − (N.5)
Now
1 0
0 if 0,
( ) if 0 1,(1,1)
1 if 1,
x
xdtB x x
Bx
<= >
∫ u u (N.6)
where B(1,1) = Γ(1)Γ(1)/Γ(1 + 1) = 1.
Equation (N.6) can therefore be written
1
0 if 0,( ) if 0 x 1,
1 if 1.
xB x x
x
<= >
u u (N.7)
Hence, substituting Equation (N.7) in Equation (N.5),
0 if 1,5,ˆ 0,5 / 3 if 1,5 1,5,
1 if 1,5.
Qp Q Q
Q
>= − − < −
u uu
Copyright International Organization for Standardization Reproduced by IHS under license with ISO
Not for ResaleNo reproduction or networking permitted without license from IHS
--`,,`,,,-`-`,,`,,`,`,,`---
ISO 3951-1:2005(E)
© ISO 2005 – All rights reserved 103
Bibliography
[1] BOWKER, A.H. and GOODE, H. P. Sampling Inspection by Variables, McGraw-Hill, 1952
[2] BOWKER, A.H. and LIEBERMAN, G. J. Engineering Statistics. Prentice-Hall, 1972
[3] BURR, I.W. Engineering Statistics and Quality Control. McGraw-Hill, 1953
[4] DUNCAN, A. J. Quality Control and Industrial Statistics. Richard D. Irwin, Inc., 1965
[5] GÖB, R. (2001). Methodological Foundations of Statistical Lot Inspection, pp. 3-24. In: LENZ, H.J. and WILRICH, P.-Th. [Editors]. Frontiers in Statistical Quality Control 6, Physica-Verlag, Heidelberg; New York
[6] GRANT, E.L. and LEAVENWORTH, R.S. Statistical Quality Control, McGraw-Hill, 1972
[7] HAHN, G. H. and SHAPIRO, S. S. Statistical Models in Engineering. John Wiley, 1967
[8] ISO 31-11, Quantities and units — Part 11: Mathematical signs and symbols for use in the physical sciences and technology
[9] ISO 2854:1976, Statistical interpretation of data — Techniques of estimation and tests relating to means and variances
[10] ISO 2859-0, Sampling procedures for inspection by attributes — Part 0: Introduction to the ISO 2859 attribute sampling system
[11] ISO 2859-2, Sampling procedures for inspection by attributes — Part 2: Sampling plans indexed by limiting quality (LQ) for isolated lot inspection
[12] ISO 5479, Statistical interpretation of data — Tests for departure from the normal distribution
[13] ISO 5725-2, Accuracy (trueness and precision) of measurement methods and results — Part 2: Basic method for the determination of repeatability and reproducibility of a standard measurement method
[14] ISO 7870, Control charts — General guide and introduction
[15] ISO 8258, Shewhart control charts
[16] KENDALL, M. G., and BUCKLAND, W. R. A Dictionary of Statistical Terms. Oliver and Boyd, 1971
[17] Mathematical and Statistical Principles Underlying Military Standard 414. Office of the Assistant Secretary of Defense, Washington D. C.
[18] MELGAARD, H. and THYREGOD, P. (2001). Acceptance sampling by variables under measurement uncertainty, pp. 47-60. In: LENZ, H.J. and WILRICH, P.-Th. (eds.) Frontiers in Statistical Quality Control 6, Physica-Verlag, Heidelberg; New York
[19] PEARSON, E. S., and HARTLEY, H. O. Biometrika Tables for Statisticians, Volumes 1 and 2. Cambridge University Press, 1966
[20] RESNIKOFF, G. J., and LIEBERMAN, G. J. Tables of the Non-Central t-Distribution. Stanford University Press, 1966
[21] Techniques of Statistical Analysis. Statistical Research Group, Columbia University, McGraw-Hill, 1947
Copyright International Organization for Standardization Reproduced by IHS under license with ISO
Not for ResaleNo reproduction or networking permitted without license from IHS
--`,,`,,,-`-`,,`,,`,`,,`---
ISO 3951-1:2005(E)
ICS 03.120.30 Price based on 103 pages
© ISO 2005 – All rights reserved
Copyright International Organization for Standardization Reproduced by IHS under license with ISO
Not for ResaleNo reproduction or networking permitted without license from IHS
--`,,`,,,-`-`,,`,,`,`,,`---