sampling procedures and tables for inspection ansi asq z1 4 2008
DESCRIPTION
Sampling Procedures and Tables for Inspection PHARMA PRODUCTSTRANSCRIPT

ANSI/ASQ Z1.4-2008
AMERICAN SOCIETY FOR QUALITY600 NORTH PLANKINTON AVENUEMILWAUKEE, WISCONSIN 53203
AMERICAN NATIONAL STANDARD
SAMPLING PROCEDURES AND TABLES FOR INSPECTIONBY ATTRIBUTES
Copyright American Society for Quality Provided by IHS under license with ASQ
Not for ResaleNo reproduction or networking permitted without license from IHS
--`,,```,,,,````-`-`,,`,,`,`,,`---
AMERICAN NATIONAL STANDARD
Sampling Procedures and Tables for Inspectionby Attributes
Prepared byThe Statistics Subcommittee of the Accredited
Standards Committee Z1 on Quality, Environment,Dependability and Statistics
SecretariatAmerican Society for Quality
ANSI/ASQ Z1.4-2008
Copyright American Society for Quality Provided by IHS under license with ASQ
Not for ResaleNo reproduction or networking permitted without license from IHS
--`,,```,,,,````-`-`,,`,,`,`,,`---
AbstractSampling Procedures and Tables for Inspection by Attributes is an acceptance sampling system to be used with switchingrules on a continuing stream of lots for AQL specified. It provides tightened, normal, and reduced plans to be applied forattributes inspection for percent nonconforming or nonconformities per 100 units.
AMERICAN NATIONAL STANDARD: An American national Standard implies a consensus of those substantially con-cerned with its scope and provisions. An American National Standard is intended as a guide to aid the manufacturer, theconsumer, and the general public. The existence of an American National Standard does not in any respect preclude any-one, whether he has approved the standard or not, from manufacturing, marketing, purchasing, or using products, processes,or procedures not conforming to the standard. American National Standards are subject to periodic review and users arecautioned to obtain the latest editions.
CAUTION NOTICE: This American National Standard may be revised or withdrawn at any time. The procedures of theAmerican National Standards Institute require that action be taken to reaffirm, revise, or withdraw this standard no laterthan five years from the date of publication. Purchasers of American National Standards may receive current informationon all standards by calling or writing the American National Standards Institute.
Published byAMERICAN SOCIETY FOR QUALITY600 NORTH PLANKINTONMILWAUKEE, WISCONSIN 53203
© 2008 by the AMERICAN SOCIETY FOR QUALITY
No part of this publication may be reproduced in any form, in an electronic retrieval system or otherwise, without theprior written permission of the publisher.
Printed in the United States of America
Copyright American Society for Quality Provided by IHS under license with ASQ
Not for ResaleNo reproduction or networking permitted without license from IHS
--`,,```,,,,````-`-`,,`,,`,`,,`---
Foreword
iii
(This foreword is not a part of the American National Standard—Sampling Procedures and Tables for Inspection byAttributes, Z1.4-2008)
This standard is a reaffirmation of ANSI/ASQCZ1.4-2003, “Sampling Procedures and Tables for Inspection by Attributes.”
Suggestions for improvement of this standard are welcomed. Send your comments to the sponsor, ASQ Standards,600 North Plankinton Avenue, Milwaukee, WI 53203.
Copyright American Society for Quality Provided by IHS under license with ASQ
Not for ResaleNo reproduction or networking permitted without license from IHS
--`,,```,,,,````-`-`,,`,,`,`,,`---

(This page intentionally left blank)
Copyright American Society for Quality Provided by IHS under license with ASQ
Not for ResaleNo reproduction or networking permitted without license from IHS
--`,,```,,,,````-`-`,,`,,`,`,,`---
Table of ContentsParagraph Page
1. SCOPE. . . . . . . . . . . . . . . . . . . . . . . . . . . . . . . . . . . . . . . . . . . . . . . . . . . . . . . . . . . . . . . . . . . . . . . . . . . . 12. DEFINITIONS AND TERMINOLOGY . . . . . . . . . . . . . . . . . . . . . . . . . . . . . . . . . . . . . . . . . . . . . . . . . 13. PERCENT NONCONFORMING AND NONCONFORMITIES PER
HUNDRED UNITS. . . . . . . . . . . . . . . . . . . . . . . . . . . . . . . . . . . . . . . . . . . . . . . . . . . . . . . . . . . . . . . . . . 24. ACCEPTANCE QUALITY LIMIT (AQL). . . . . . . . . . . . . . . . . . . . . . . . . . . . . . . . . . . . . . . . . . . . . . . . 25. SUBMISSION OF PRODUCT . . . . . . . . . . . . . . . . . . . . . . . . . . . . . . . . . . . . . . . . . . . . . . . . . . . . . . . . . 36. ACCEPTANCE AND NON-ACCEPTANCE. . . . . . . . . . . . . . . . . . . . . . . . . . . . . . . . . . . . . . . . . . . . . . 37. DRAWING OF SAMPLES. . . . . . . . . . . . . . . . . . . . . . . . . . . . . . . . . . . . . . . . . . . . . . . . . . . . . . . . . . . . 48. NORMAL, TIGHTENED, AND REDUCED INSPECTION . . . . . . . . . . . . . . . . . . . . . . . . . . . . . . . . . 49. SAMPLING PLANS. . . . . . . . . . . . . . . . . . . . . . . . . . . . . . . . . . . . . . . . . . . . . . . . . . . . . . . . . . . . . . . . . 510. DETERMINATION OF ACCEPTABILITY . . . . . . . . . . . . . . . . . . . . . . . . . . . . . . . . . . . . . . . . . . . . . . 611. SUPPLEMENTARY INFORMATION . . . . . . . . . . . . . . . . . . . . . . . . . . . . . . . . . . . . . . . . . . . . . . . . . . 6
TablesTable I Sample Size Code Letters . . . . . . . . . . . . . . . . . . . . . . . . . . . . . . . . . . . . . . . . . . . . . . . . . . . . . . . . . . . . 10Table II-A Single Sampling Plans for Normal Inspection (Master Table) . . . . . . . . . . . . . . . . . . . . . . . . . . . . . . . . 11Table II-B Single Sampling Plans for Tightened Inspection (Master Table) . . . . . . . . . . . . . . . . . . . . . . . . . . . . . . 12Table II-C Single Sampling Plans for Reduced Inspection (Master Table) . . . . . . . . . . . . . . . . . . . . . . . . . . . . . . . 13Table III-A Doubling Sampling Plans for Normal Inspection (Master Table) . . . . . . . . . . . . . . . . . . . . . . . . . . . . . . 14Table III-B Doubling Sampling Plans for Tightened Inspection (Master Table) . . . . . . . . . . . . . . . . . . . . . . . . . . . . 15Table III-C Doubling Sampling Plans for Reduced Inspection (Master Table) . . . . . . . . . . . . . . . . . . . . . . . . . . . . . 16Table IV-A Multiple Sampling Plans for Normal Inspection (Master Table). . . . . . . . . . . . . . . . . . . . . . . . . . . . . . . 17Table IV-B Multiple Sampling Plans for Tightened Inspection (Master Table) . . . . . . . . . . . . . . . . . . . . . . . . . . . . 19Table IV-C Multiple Sampling Plans for Reduced Inspection (Master Table). . . . . . . . . . . . . . . . . . . . . . . . . . . . . . 21Table V-A Factors for Determining Approximate Values for Average Outgoing Quality Limits for Normal
Inspection (Single Sampling) . . . . . . . . . . . . . . . . . . . . . . . . . . . . . . . . . . . . . . . . . . . . . . . . . . . . . . . . . . 23Table V-B Factors for Determining Approximate Values for Average Outgoing Quality Limits for Tightened
Inspection (Single Sampling) . . . . . . . . . . . . . . . . . . . . . . . . . . . . . . . . . . . . . . . . . . . . . . . . . . . . . . . . . . 24Table VI-A Limiting Quality (in percent nonconforming) for Which Pa = 10 Percent
(for Normal Inspection, Single Sampling) . . . . . . . . . . . . . . . . . . . . . . . . . . . . . . . . . . . . . . . . . . . . . . . . 25Table VI-B Limiting Quality (in nonconformities per hundred units) for Which Pa = 10 Percent
(for Normal Inspection, Single Sampling) . . . . . . . . . . . . . . . . . . . . . . . . . . . . . . . . . . . . . . . . . . . . . . . . 26Table VII-A Limiting Quality (in percent nonconforming) for Which Pa = 5 Percent
(for Normal Inspection, Single Sampling) . . . . . . . . . . . . . . . . . . . . . . . . . . . . . . . . . . . . . . . . . . . . . . . . 27Table VII-B Limiting Quality (in nonconformities per hundred units) for Which Pa = 5 Percent
(for Normal Inspection, Single Sampling) . . . . . . . . . . . . . . . . . . . . . . . . . . . . . . . . . . . . . . . . . . . . . . . . 28Table VIII Limit Numbers for Reduced Inspection. . . . . . . . . . . . . . . . . . . . . . . . . . . . . . . . . . . . . . . . . . . . . . . . . . 29Table IX Average Sample Size Curves for Double and Multiple Sampling Plans
(normal and tightened inspection) . . . . . . . . . . . . . . . . . . . . . . . . . . . . . . . . . . . . . . . . . . . . . . . . . . . . . . 30Table X-A Sample Size Code Letter A—Individual Plans . . . . . . . . . . . . . . . . . . . . . . . . . . . . . . . . . . . . . . . . . . . . 31Table X-B Sample Size Code Letter B—Individual Plans . . . . . . . . . . . . . . . . . . . . . . . . . . . . . . . . . . . . . . . . . . . . 33Table X-C Sample Size Code Letter C—Individual Plans . . . . . . . . . . . . . . . . . . . . . . . . . . . . . . . . . . . . . . . . . . . . 35
ANSI/ASQ Z1.4-2008
v
Copyright American Society for Quality Provided by IHS under license with ASQ
Not for ResaleNo reproduction or networking permitted without license from IHS
--`,,```,,,,````-`-`,,`,,`,`,,`---
vi
Table X-D Sample Size Code Letter D—Individual Plans . . . . . . . . . . . . . . . . . . . . . . . . . . . . . . . . . . . . . . . . . . . . 37Table X-E Sample Size Code Letter E—Individual Plans . . . . . . . . . . . . . . . . . . . . . . . . . . . . . . . . . . . . . . . . . . . . 39Table X-F Sample Size Code Letter F—Individual Plans . . . . . . . . . . . . . . . . . . . . . . . . . . . . . . . . . . . . . . . . . . . . 41Table X-G Sample Size Code Letter G—Individual Plans . . . . . . . . . . . . . . . . . . . . . . . . . . . . . . . . . . . . . . . . . . . . 43Table X-H Sample Size Code Letter H—Individual Plans . . . . . . . . . . . . . . . . . . . . . . . . . . . . . . . . . . . . . . . . . . . . 45Table X-J Sample Size Code Letter J—Individual Plans . . . . . . . . . . . . . . . . . . . . . . . . . . . . . . . . . . . . . . . . . . . . . 47Table X-K Sample Size Code Letter K—Individual Plans . . . . . . . . . . . . . . . . . . . . . . . . . . . . . . . . . . . . . . . . . . . . 49Table X-L Sample Size Code Letter L—Individual Plans . . . . . . . . . . . . . . . . . . . . . . . . . . . . . . . . . . . . . . . . . . . . 51Table X-M Sample Size Code Letter M—Individual Plans . . . . . . . . . . . . . . . . . . . . . . . . . . . . . . . . . . . . . . . . . . . . 53Table X-N Sample Size Code Letter N—Individual Plans . . . . . . . . . . . . . . . . . . . . . . . . . . . . . . . . . . . . . . . . . . . . 55Table X-P Sample Size Code Letter P—Individual Plans . . . . . . . . . . . . . . . . . . . . . . . . . . . . . . . . . . . . . . . . . . . . 57Table X-Q Sample Size Code Letter Q—Individual Plans . . . . . . . . . . . . . . . . . . . . . . . . . . . . . . . . . . . . . . . . . . . . 59Table X-R Sample Size Code Letter R—Individual Plans . . . . . . . . . . . . . . . . . . . . . . . . . . . . . . . . . . . . . . . . . . . . 61Table X-S Sample Size Code Letter S—Individual Plans . . . . . . . . . . . . . . . . . . . . . . . . . . . . . . . . . . . . . . . . . . . . 63Table XI Average Outgoing Quality Limit Factors for ANSI-Z1.4 Scheme Performance
(Single Sampling). . . . . . . . . . . . . . . . . . . . . . . . . . . . . . . . . . . . . . . . . . . . . . . . . . . . . . . . . . . . . . . . . . . 64Table XII Limiting Quality for ANSI-Z1.4 Scheme Performance for Which
Pa = 10 Percent (Single Sampling) . . . . . . . . . . . . . . . . . . . . . . . . . . . . . . . . . . . . . . . . . . . . . . . . . . . . . . 65Table XIII Limiting Quality for ANSI-Z1.4 Scheme Performance for Which
Pa = 5 Percent (Single Sampling) . . . . . . . . . . . . . . . . . . . . . . . . . . . . . . . . . . . . . . . . . . . . . . . . . . . . . . . 66Table XIV Average Sample Size Tables for ANSI-Z1.4 Scheme Performance (Single Sampling) . . . . . . . . . . . . . 67Table XV-A Sample Size Code Letter A—Scheme Performance . . . . . . . . . . . . . . . . . . . . . . . . . . . . . . . . . . . . . . . . 71Table XV-B Sample Size Code Letter B—Scheme Performance . . . . . . . . . . . . . . . . . . . . . . . . . . . . . . . . . . . . . . . . 72Table XV-C Sample Size Code Letter C—Scheme Performance . . . . . . . . . . . . . . . . . . . . . . . . . . . . . . . . . . . . . . . . 73Table XV-D Sample Size Code Letter D—Scheme Performance . . . . . . . . . . . . . . . . . . . . . . . . . . . . . . . . . . . . . . . . 74Table XV-E Sample Size Code Letter E—Scheme Performance . . . . . . . . . . . . . . . . . . . . . . . . . . . . . . . . . . . . . . . . 75Table XV-F Sample Size Code Letter F—Scheme Performance. . . . . . . . . . . . . . . . . . . . . . . . . . . . . . . . . . . . . . . . . 76Table XV-G Sample Size Code Letter G—Scheme Performance . . . . . . . . . . . . . . . . . . . . . . . . . . . . . . . . . . . . . . . . 77Table XV-H Sample Size Code Letter H—Scheme Performance . . . . . . . . . . . . . . . . . . . . . . . . . . . . . . . . . . . . . . . . 78Table XV-J Sample Size Code Letter J—Scheme Performance . . . . . . . . . . . . . . . . . . . . . . . . . . . . . . . . . . . . . . . . . 79Table XV-K Sample Size Code Letter K—Scheme Performance . . . . . . . . . . . . . . . . . . . . . . . . . . . . . . . . . . . . . . . . 80Table XV-L Sample Size Code Letter L—Scheme Performance . . . . . . . . . . . . . . . . . . . . . . . . . . . . . . . . . . . . . . . . 81Table XV-M Sample Size Code Letter M—Scheme Performance . . . . . . . . . . . . . . . . . . . . . . . . . . . . . . . . . . . . . . . . 82Table XV-N Sample Size Code Letter N—Scheme Performance . . . . . . . . . . . . . . . . . . . . . . . . . . . . . . . . . . . . . . . . 83Table XV-P Sample Size Code Letter P—Scheme Performance. . . . . . . . . . . . . . . . . . . . . . . . . . . . . . . . . . . . . . . . . 84Table XV-Q Sample Size Code Letter Q—Scheme Performance . . . . . . . . . . . . . . . . . . . . . . . . . . . . . . . . . . . . . . . . 85Table XV-R Sample Size Code Letter R—Scheme Performance . . . . . . . . . . . . . . . . . . . . . . . . . . . . . . . . . . . . . . . . 86INDEX OF TERMSWITH SPECIAL MEANINGS. . . . . . . . . . . . . . . . . . . . . . . . . . . . . . . . . . . . . . . . . . . . . . . . . . . . . 87
ANSI/ASQ Z1.4-2008
Copyright American Society for Quality Provided by IHS under license with ASQ
Not for ResaleNo reproduction or networking permitted without license from IHS
--`,,```,,,,````-`-`,,`,,`,`,,`---
1. SCOPE
1.1 PURPOSE. This publication establishes samplingplans and procedures for inspection by attributes. Whenspecified by the responsible authority, this publication shallbe referenced in the specification, contract, inspectioninstructions, or other documents and the provisions set forthherein shall govern. The “responsible authority” shall bedesignated in one of the above documents, as agreed to bythe purchaser and seller or producer and user.
1.2 APPLICATION. Sampling plans designated in thispublication are applicable, but not limited, to inspection ofthe following:
a. End items.
b. Components and raw materials.
c. Operations.
d. Materials in process.
e. Supplies in storage.
f. Maintenance operations.
g. Data or records.
h. Administrative procedures.
These plans are intended primarily to be used for a continu-ing series of lots or batches. The plans may also be used forthe inspection of isolated lots or batches, but, in this lattercase, the user is cautioned to consult the operating charac-teristic curves to find a plan which will yield the desired pro-tection (see 11.6).
1.3 INSPECTION. Inspection is the process of measur-ing, examining, testing, or otherwise comparing the unit ofproduct (see 1.5) with the requirements.
1.4 INSPECTION BY ATTRIBUTES. Inspection byattributes is inspection whereby either the unit of productis classified simply as conforming or nonconforming, or
the number of nonconformities in the unit of products iscounted, with respect to a given requirement or set ofrequirements.
1.5 UNIT OF PRODUCT. The unit of product is the unitinspected in order to determine its classification as con-forming or nonconforming or to count the number of non-conformities. It may be a single article, a pair, a set, a length,an area, an operation, a volume, a component of an endproduct, or the end product itself. The unit of product mayor may not be the same as the unit of purchase, supply, pro-duction, or shipment.
2. DEFINITIONSAND TERMINOLOGY
The definitions and terminology employed in this standardare in accord with ANSI/ASQ A3534-2-2006 (Terms,Symbols, and Definitions for Acceptance Sampling). Thefollowing two definitions are particularly important inapplying the standard.
DEFECT: A departure of a quality characteristic fromits intended level or state that occurs with a sever-ity sufficient to cause an associated product orservice not to satisfy intended normal, or foresee-able, usage requirements.
NONCONFORMITY: A departure of a quality charac-teristic from its intended level or state that occurswith severity sufficient to cause an associatedproduct or service not to meet a specificationrequirement.
These acceptance sampling plans for attributes are given interms of the percent or proportion of product in a lot or batchthat depart from some requirement. The general terminol-ogy used within the document will be given in terms of per-cent of nonconforming units or number of nonconformities,since these terms are likely to constitute the most widelyused criteria for acceptance sampling.
In the use of this standard it is helpful to distinguishbetween:
a. an individual sampling plan—a specific plan thatstates the sample size or sizes to be used, and theassociated acceptance criteria.
1
SAMPLING PROCEDURESAND TABLESFOR INSPECTION BYATTRIBUTES
Copyright American Society for Quality Provided by IHS under license with ASQ
Not for ResaleNo reproduction or networking permitted without license from IHS
--`,,```,,,,````-`-`,,`,,`,`,,`---
b. a sampling scheme—a combination of samplingplans with switching rules and possibly a provisionfor discontinuance of inspection. In this standardthe terms “sampling scheme” and “scheme per-formance” will be used in the restricted sensedescribed in Sec. 11.1.
c. a sampling system—a collection of samplingschemes. This standard is a sampling system indexedby lot-size ranges, inspection levels, and AQLs.
3. PERCENT NONCONFORMINGANDNONCONFORMITIES PER HUNDRED UNITS
3.1 EXPRESSION OF NONCONFORMANCE. Theextent of nonconformance of product shall be expressedeither in terms of percent nonconforming or in terms of non-conformities per hundred units.
3.2 PERCENT NONCONFORMING. The percent non-conforming of any given quantity of units of product is onehundred times the number of nonconforming units dividedby the total number of units of product, i.e.:
3.3 NONCONFORMITIES PER HUNDRED UNITS.The number of nonconformities per hundred units of anygiven quantity of units of product is one hundred times thenumber of nonconformities contained therein (one or morenonconformities being possible in any unit of product)divided by the total number of units of product, i.e.:
It is assumed that nonconformities occur randomly and withstatistical independence within and between units.
4. ACCEPTANCE QUALITY LIMIT (AQL)
4.1 USE. The AQL together with the Sample Size CodeLetter, is used for indexing the sampling plans provided herein.
4.2 DEFINITION. The AQL is the quality level that is theworst tolerable process average when a continuing series oflots is submitted for acceptance sampling.
Note: The use of the abbreviation AQL to mean AcceptableQuality Level is no longer recommended.
4.3 NOTE ON THE MEANING OF AQL. The conceptof AQL only applies when an acceptance sampling schemewith rules for switching between normal, tightened andreduced inspection and discontinuance of sampling inspec-tion is used. These rules are designed to encourage suppliersto have process averages consistently better than the AQL. Ifsuppliers fail to do so, there is a high probability of beingswitched from normal inspection to tightened inspectionwhere lot acceptance becomes more difficult. Once on tight-ened inspection, unless corrective action is taken to improveproduct quality, it is very likely that the rule requiring dis-continuance of sampling inspection will be invoked.
Although individual lots with quality as bad as the AQL canbe accepted with fairly high probability, the designation of anAQL does not suggest that this is necessarily a desirablequality level. The AQL is a parameter of the samplingscheme and should not be confused with a process averagewhich describes the operating level of a manufacturingprocess. It is expected that the product quality level will beless than the AQL to avoid excessive non-accepted lots.
The sampling plans in this standard are so arranged that theprobability of lot acceptance at the designated AQL dependsupon sample size, being generally higher for large samplesthan for small samples for a given AQL. To determine thespecific protection to the consumer at a given AQL, it is nec-essary to refer to the operating characteristic curves (whichare provided in this standard) of the corresponding schemeand its constituent plans.
The AQL alone does not describe the protection to the con-sumer for individual lots or batches, but more directly relatesto what is expected from a series of lots or batches providedthe provisions of this standard are satisfied.
4.4 LIMITATION. The designation of an AQL shall notimply that the supplier has the right to knowingly supplyany nonconforming unit of product.
4.5 SPECIFYINGAQLs. TheAQL to be used will be des-ignated in the contract or by the responsible authority.Different AQLs may be designated for groups of nonconfor-mities considered collectively, or for individual nonconfor-mities. For example, Group A may include nonconformitiesof a type felt to be of the highest concern for the product orservice and therefore be assigned a small AQL value; GroupB may include nonconformities of the next higher degree ofconcern and therefore be assigned a larger AQL value thanfor Group A and smaller than that of Group C, etc. The clas-sification into groups should be appropriate to the quality
Nonconformities per=Number of nonconformities × 100
hundred units Number of units inspected
Number nonconformingPercent nonconforming =
Number of units inspected× 100
ANSI/ASQ Z1.4-2008
2
Copyright American Society for Quality Provided by IHS under license with ASQ
Not for ResaleNo reproduction or networking permitted without license from IHS
--`,,```,,,,````-`-`,,`,,`,`,,`---
requirements of the specific situation. An AQL for a groupof nonconformities may be designated in addition to AQLsfor individual nonconformities, or subgroups, within thatgroup. AQL values of 10.0 or less may be expressed eitherin percent nonconforming or in nonconformities per hun-dred units; those over 10.0 shall be expressed in nonconfor-mities per hundred units only.
4.6 PREFERRED AQLs. The values of AQLs given inthese tables are known as preferred AQLs. If, for any prod-uct, an AQL be designated other than a preferred AQL, thesetables are not applicable.
5. SUBMISSION OF PRODUCT
5.1 LOT OR BATCH. The term lot or batch shall mean“inspection lot” or “inspection batch,” i.e., a collection of unitsof product from which a sample is to be drawn and inspectedto determine conformance with the acceptability criteria, andmay differ from a collection of units designated as a lot orbatch for other purposes (e.g., production, shipment, etc.).
5.2 FORMATION OF LOTS OR BATCHES. The prod-uct shall be assembled into identifiable lots, sublots, batches,or in such other manner as may be prescribed (see 5.4). Eachlot or batch shall, as far as is practicable, consist of units ofproduct of a single type, grade, class, size, and composition,manufactured under essentially the same conditions, and atessentially the same time.
5.3 LOT OR BATCH SIZE. The lot or batch size is thenumber of units of product in a lot or batch.
5.4 PRESENTATION OF LOTS OR BATCHES. Theformation of the lots or batches, lot or batch size, and themanner in which each lot or batch is to be presented andidentified by the supplier shall be designated or approved bythe responsible authority. As necessary, the supplier shallprovide adequate and suitable storage space for each lot orbatch, equipment needed for proper identification and pres-entation, and personnel for all handling of product requiredfor drawing of samples.
6. ACCEPTANCEAND NON-ACCEPTANCE
6.1 ACCEPTABILITY OF LOTS OR BATCHES.Acceptability of a lot or batch will be determined by the useof a sampling plan or plans associated with the designatedAQL or AQLs.
In the use of this standard a statement that a lot is acceptablemeans simply that sample results satisfy the standard’s
acceptance criteria. The acceptance of a lot is not intended toprovide information about lot quality. If a stream of lots froma given process is inspected under an acceptance samplingscheme such as provided in this standard, some lots will beaccepted and others will not. If all incoming lots are assumedto be at the same process average and if the nonconformingitems that are discovered and replaced by conforming itemsduring sample inspection are ignored, it will be found thatboth the set of accepted lots and the set of non-accepted lotswill have the same long run average quality as the originalset of lots submitted for inspection. Inspection of incominglots whose quality levels vary around a fixed long run aver-age quality level will divide the lots into a set of accepted lotsand a set of non-accepted lots, but it will be found that thelong run average quality of the accepted lots is only slightlybetter than the long run average quality of the non-acceptedlots. Replacement of the nonconforming items that are dis-covered during sample inspection does not alter this findingbecause the samples are a small fraction of the lots.
The purpose of this standard is, through the economic andpsychological pressure of lot non-acceptance, to induce asupplier to maintain a process average at least as good as thespecified AQL while at the same time providing an upperlimit on the consideration of the consumer’s risk of accept-ing occasional poor lots. The standard is not intended as aprocedure for estimating lot quality or for segregating lots.
In acceptance sampling, when sample data do not meet theacceptance criteria, it is often stated that the lot is to be“rejected.” In this connection, the words “to reject” generallyare used. Rejection in an acceptance sampling sense means todecide that a batch, lot or quantity of product, material, orservice has not been shown to satisfy the acceptance criteriabased on the information obtained from the sample(s).
In acceptance sampling, the words “to reject” generally areused to mean “to not accept” without direct implication ofproduct usability. Lots which are “rejected” may bescrapped, sorted (with or without nonconforming unitsbeing replaced), reworked, re-evaluated against more spe-cific usability criteria, held for additional information, etc.Since the common language usage of “reject” often resultsin an inference of unsafe or unusable product, it is recom-mended that “not accept” be understood rather than “reject”in the use of this standard.
The word “non-acceptance” is used here for “rejection”when it refers to the result of following the procedure.Forms of the word “reject” are retained when they refer toactions the customer may take, as in “rejection number.”
ANSI/ASQ Z1.4-2008
3
Copyright American Society for Quality Provided by IHS under license with ASQ
Not for ResaleNo reproduction or networking permitted without license from IHS
--`,,```,,,,````-`-`,,`,,`,`,,`---
6.2 NONCONFORMING UNITS. The right is reservedto reject any unit of product found nonconforming duringinspection whether that unit of product forms a part of asample or not, and whether the lot or batch as a whole isaccepted or rejected. Rejected units may be repaired or cor-rected and resubmitted for inspection with the approval of,and in the manner specified by, the responsible authority.
6.3 SPECIAL RESERVATION FOR DESIGNATEDNONCONFORMITIES. Since most acceptance samplinginvolves evaluation of more than one quality characteristic,and since these may differ in importance in terms of qualityand/or economic effects, it is often desirable to classify thetypes of nonconformity according to agreed upon groupings.Specific assignment of types of nonconformities to eachclass is a function of agreement on specific sampling appli-cations. In general, the function of such classification is topermit the use of a set of sampling plans having a commonsample size, but different acceptance numbers for each classhaving a different AQL, such as in Tables II, III, and IV.
The supplier may be required at the discretion of the respon-sible authority to inspect every unit of the lot or batch fordesignated classes of nonconformities. The right is reservedto inspect every unit submitted by the supplier for specifiednonconformities, and to reject the lot or batch immediately,when a nonconformity of this class is found. The right isreserved also to sample, for specified classes of nonconfor-mities, lots or batches submitted by the supplier and to rejectany lot or batch if a sample drawn therefrom is found to con-tain one or more of these nonconformities.
6.4 RESUBMITTED LOTS OR BATCHES. Lots orbatches found unacceptable shall be resubmitted for rein-spection only after all units are re-examined or re-tested andall nonconforming units are removed or nonconformitiescorrected. The responsible authority shall determinewhether normal or tightened inspection shall be used onreinspection and whether reinspection shall include all typesor classes of nonconformities or only the particular types orclasses of nonconformities which caused initial rejection.
7. DRAWING OF SAMPLES
7.1 SAMPLE. A sample consists of one or more units ofproduct drawn from a lot or batch, the units of the samplebeing selected at random without regard to their quality. Thenumber of units of product in the sample is the sample size.
7.2 SAMPLING. When appropriate, the number of unitsin the sample shall be selected in proportion to the size ofsublots or subbatches, or parts of the lot or batch, identifiedby some rational criterion. In so doing, the units from eachpart of the lot or batch shall be selected at random, asdefined in ANSI/ASQ A3534-2-2006.
7.3 TIMEOFSAMPLING.Samples may be drawn after allthe units comprising the lot or batch have been produced, orsamples may be drawn during production of the lot or batch.
7.4 DOUBLEORMULTIPLE SAMPLING.Where dou-ble or multiple sampling is to be used, each sample shall beselected over the entire lot or batch.
8. NORMAL, TIGHTENEDAND REDUCEDINSPECTION
8.1 INITIATION OF INSPECTION. Normal inspectionwill be used at the start of inspection unless otherwisedirected by the responsible authority.
8.2 CONTINUATION OF INSPECTION. Normal, tight-ened or reduced inspection shall continue unchanged onsuccessive lots or batches except where the switching pro-cedures given below require change.
8.3 SWITCHING PROCEDURES.
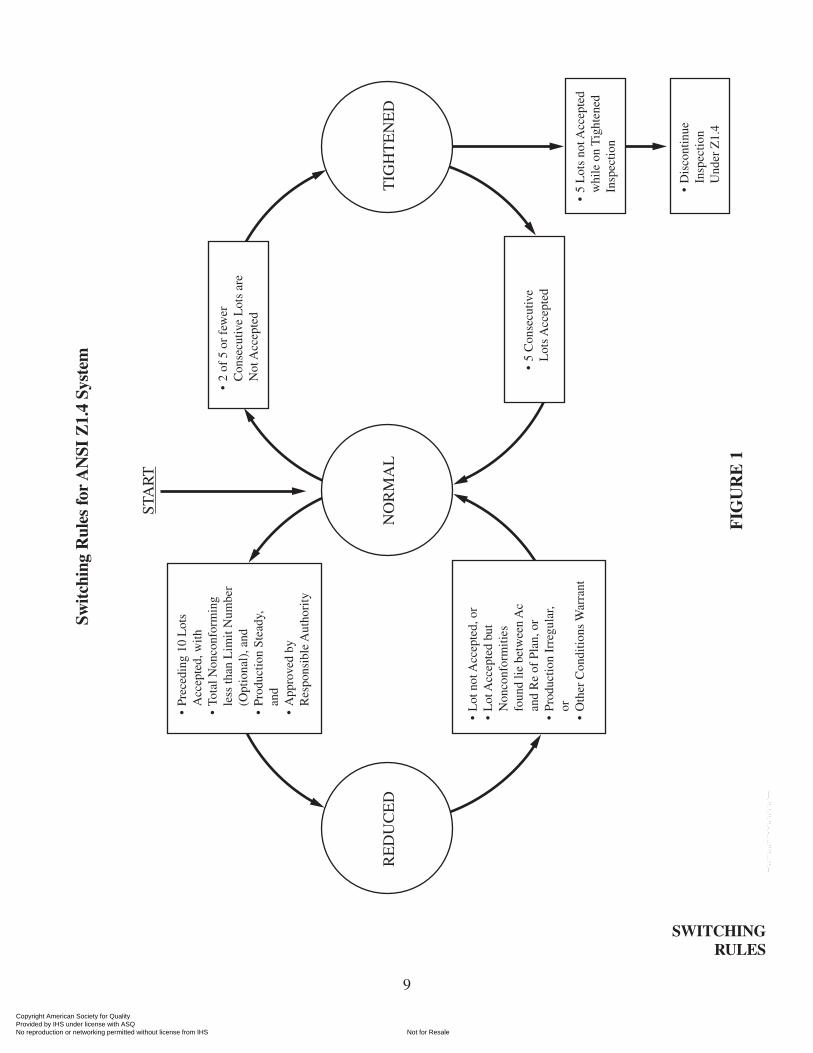
8.3.1 NORMAL TO TIGHTENED. When normalinspection is in effect, tightened inspection shall be insti-tuted when 2 out of 5 or fewer consecutive lots or batcheshave been non-acceptable on original inspection (i.e., ignor-ing resubmitted lots or batches for this procedure).
8.3.2 TIGHTENED TO NORMAL. When tightenedinspection is in effect, normal inspection shall be institutedwhen 5 consecutive lots or batches have been consideredacceptable on original inspection.
8.3.3 NORMALTOREDUCED.When normal inspectionis in effect, reduced inspection shall be instituted providingthat all of the following conditions are satisfied.
a. The preceding 10 lots or batches (or more, as indi-cated by the note to Table VIII) have been on nor-mal inspection and all have been accepted onoriginal inspection; and
ANSI/ASQ Z1.4-2008
4
Copyright American Society for Quality Provided by IHS under license with ASQ
Not for ResaleNo reproduction or networking permitted without license from IHS
--`,,```,,,,````-`-`,,`,,`,`,,`---
b. The total number of nonconforming units (or non-conformities) in the samples from the preceding 10lots or batches (or such other number as was usedfor condition “a” above) is equal to or less than theapplicable limit number given in Table VIII (see8.5). If double or multiple sampling is in use, allsamples inspected should be included, not “first”samples only; and
c. Production is at a steady rate; and
d. Reduced inspection is considered desirable by theresponsible authority.
8.3.4 REDUCED TO NORMAL. When reduced inspec-tion is in effect, normal inspection shall be instituted if anyof the following occur on original inspection:
a. A lot or batch is rejected; or
b. A lot or batch is considered acceptable under theprocedures for reduced inspection given in10.1.4; or
c. Production becomes irregular or delayed; or
d. Other conditions warrant that normal inspectionshall be instituted.
8.4 DISCONTINUATION OF INSPECTION. If thecumulative number of lots not accepted in a sequence of con-secutive lots on tightened inspection reaches 5, the accept-ance procedures of this standard shall be discontinued.Inspection under the provisions of this standard shall not beresumed until corrective action has been taken. Tightenedinspection shall then be used as if 8.3.1 had been invoked.
8.5 LIMIT NUMBERS FOR REDUCED INSPECTION.When agreed upon by responsible authority for both partiesto the inspection, that is, the supplier and the end item cus-tomer, the requirements of 8.3.3b may be dropped. Thisaction will have little effect on the operating properties ofthe scheme.
8.6 SWITCHING SEQUENCE. A schematic diagramdescribing the sequence of application of the switching rulesis shown in Figure 1.
9. SAMPLING PLANS
9.1 SAMPLING PLAN. A sampling plan indicates thenumber of units of product from each lot or batch which are
to be inspected (sample size or series of sample sizes) andthe criteria for determining the acceptability of the lot orbatch (acceptance and rejection numbers).
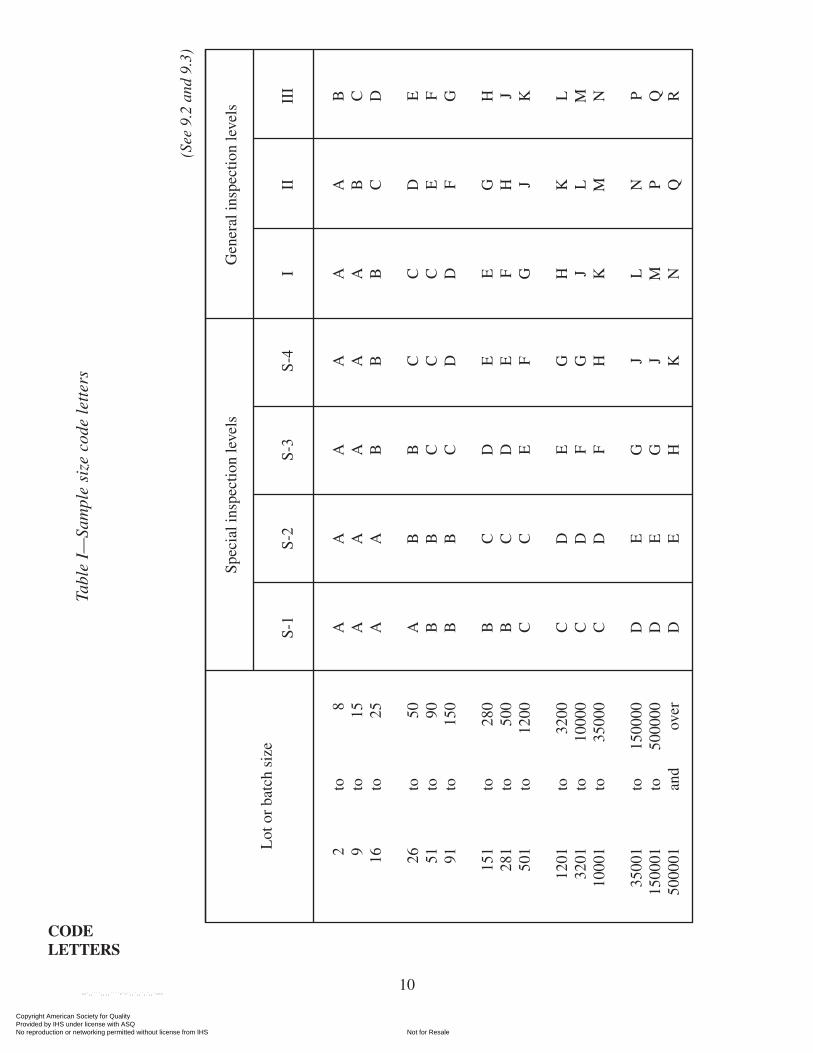
9.2 INSPECTION LEVEL. The inspection level deter-mines the relationship between the lot or batch size and thesample size. The inspection level to be used for any partic-ular requirement will be prescribed by the responsibleauthority. Three inspection levels: I, II and III are given inTable I for general use. Unless otherwise specified,Inspection Level II will be used. However, Inspection LevelI may be specified when less discrimination is needed, orLevel III may be specified for greater discrimination. Fouradditional special levels: S-1, S-2, S-3, and S-4, are givenin the same table and may be used where relatively smallsample sizes are necessary and large sampling risks can ormust be tolerated.
NOTE: In the designation of inspection levels S-1 to S-4,care must be exercised to avoid AQLs inconsistent withthese inspection levels.
9.3 CODE LETTERS. Sample sizes are designated bycode letters. Table I shall be used to find the applicable codeletter for the particular lot or batch size and the prescribedinspection level.
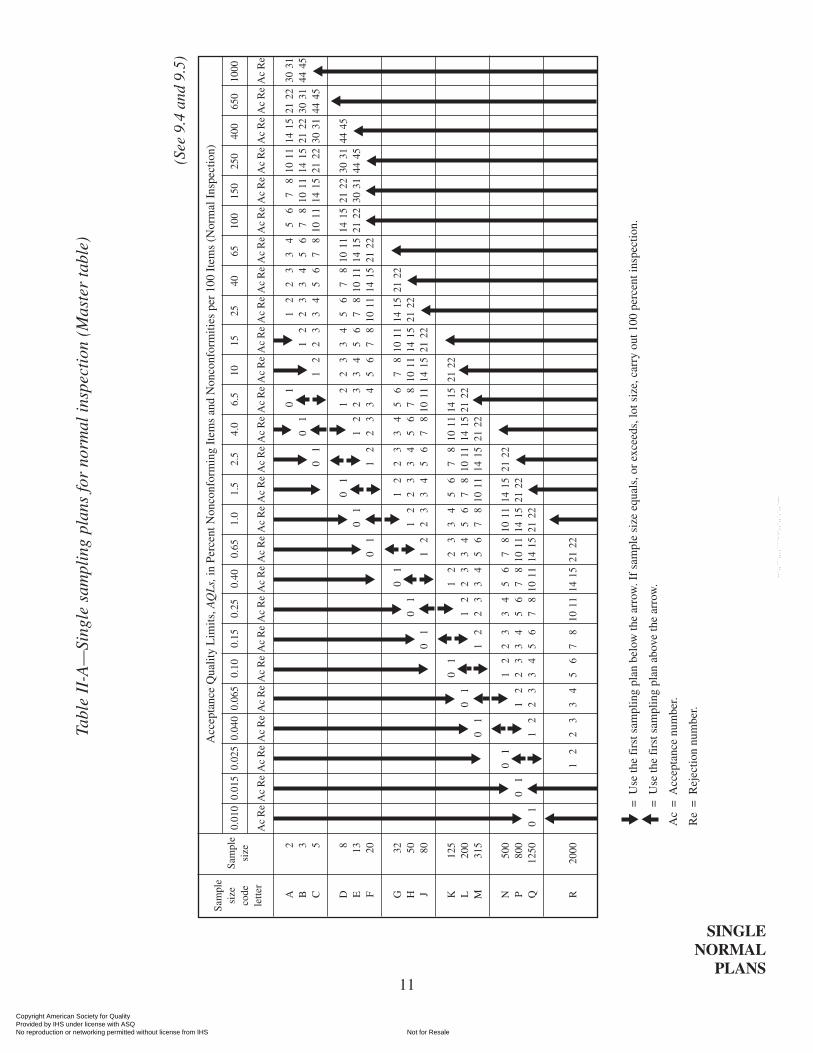
9.4 OBTAINING SAMPLING PLAN. The AQL and thecode letter shall be used to obtain the sampling plan fromTables II, III, or IV.When no sampling plan is available for agiven combination of AQL and code letter, the tables directthe user to a different letter. The sample size to be used isgiven by the new code letter, not by the original letter. If thisprocedure leads to different sample sizes for different classesof nonconformities, the code letter corresponding to thelargest sample size derived may be used for all classes ofnonconformities when designated or approved by the respon-sible authority. As an alternative to a single sampling planwith an acceptance number of 0, the plan with an acceptancenumber of 1 with its correspondingly larger sample size fora designated AQL (where available), may be used when des-ignated or approved by the responsible authority.
9.5 TYPESOF SAMPLINGPLANS. Three types of sam-pling plans: Single, Double and Multiple, are given in TablesII, III, and IV, respectively. When several types of plans areavailable for a given AQL and code letter, any one may beused. A decision as to type of plan, either single, double, ormultiple, when available for a given AQL and code letter,will usually be based upon the comparison between the
ANSI/ASQ Z1.4-2008
5
Copyright American Society for Quality Provided by IHS under license with ASQ
Not for ResaleNo reproduction or networking permitted without license from IHS
--`,,```,,,,````-`-`,,`,,`,`,,`---
administrative difficulty and the average sample sizes of theavailable plans. The average sample size of multiple plans isless than for double (except in the case corresponding to sin-gle acceptance number 1) and both of these are always lessthan a single sample size (see Table IX). Usually the admin-istrative difficulty for single sampling and the cost per unit ofthe sample are less than for double or multiple.
10. DETERMINATION OFACCEPTABILITY
10.1 PERCENT NONCONFORMING INSPECTION.To determine acceptability of a lot or batch under percent non-conforming inspection, the applicable sampling plan shall beused in accordance with 10.1.1, 10.1.2, 10.1.3 and 10.1.4.
10.1.1 SINGLE SAMPLING PLAN. The number of sam-ple units inspected shall be equal to the sample size given bythe plan. If the number of nonconforming units found in thesample is equal to or less than the acceptance number, the lotor batch shall be considered acceptable. If the number ofnonconforming units is equal to or greater than the rejectionnumber, the lot or batch shall be considered not acceptable.
10.1.2 DOUBLE SAMPLE PLAN. The number of sampleunits first inspected shall be equal to the first sample sizegiven by the plan. If the number of nonconforming unitsfound in the first sample is equal to or less than the firstacceptable number, the lot or batch shall be consideredacceptable. If the number of nonconforming units found inthe first sample is equal to or greater than the first rejectionnumber, the lot or batch shall be considered not acceptable.If the number of nonconforming units found in the first sam-ple is between the first acceptance and rejection numbers, asecond sample of the size given by the plan shall beinspected. The number of nonconforming units found in thefirst and second samples shall be accumulated. If the cumu-lative number of nonconforming units is equal to or less thanthe second acceptance number, the lot or batch shall be con-sidered acceptable. If the cumulative number of noncon-forming units is equal to or greater than the second rejectionnumber, the lot or batch shall be considered not acceptable.
10.1.3 MULTIPLE SAMPLE PLAN. Under multiplesampling, the procedure shall be similar to that specified in10.1.2, except that the number of successive samplesrequired to reach a decision might be more than two.
10.1.4 SPECIAL PROCEDURE FOR REDUCEDINSPECTION. Under reduced inspection, the samplingprocedure may terminate without making a decision. In
these circumstances, the lot or batch will be consideredacceptable, but normal inspection will be reinstated startingwith the next lot or batch (see 8.3.4(b)).
10.2 NONCONFORMITIES PER HUNDRED UNITSINSPECTION. To determine the acceptability of a lot orbatch under Nonconformities per Hundred Units inspection,the procedure specified for Percent Nonconforming inspec-tion above shall be used, except that the word “nonconfor-mities” shall be substituted for “nonconforming units.”
11. SUPPLEMENTARY INFORMATION
11.1 OPERATING CHARACTERISTIC CURVES.Operating characteristic curves and other measures of per-formance presented in this standard are of two types. Thosefor the individual plans that represent the elements of theschemes are presented in Tables V, VI, VII, IX, and X.Analogous curves and other measures of overall scheme per-formance when the switching rules are used are given inTables XI, XII, XIII, XIV, and XV. Scheme performance isdefined as the composite proportion of lots accepted at astated percent nonconforming when the switching rules areapplied. The term scheme performance is used here in a veryrestrictive sense. It refers to how the ANSI Z1.4 scheme ofswitching rules would operate at a given process level underthe assumption that the process stays at that level even afterswitching to tightened inspection or discontinuation ofinspection. This gives a conservative “worst case” descriptionof the performance of the scheme for use as a baseline in thesense that if the psychological and economic pressures asso-ciated with the switching rules are considered, the protectionof the scheme may be somewhat better than that shown.
Operating characteristic curves are given in Table X forindividual sampling plans for normal and tightened inspec-tion. The operating characteristic curve for unqualifiedacceptance under reduced inspection can be found by usingthe AQL index of the normal plan with the sample size(s)and acceptance number(s) of the reduced plan. The curvesshown are for single sampling; curves for double and multi-ple sampling are matched as closely as practicable. The O.C.curves shown for AQLs greater than 10.0 are based on thePoisson distribution and apply for nonconformities per hun-dred units inspection; those for AQLs of 10.0 or less andsample sizes of 80 or less are based on the binomial distri-bution and apply for percent nonconforming inspection;those for AQLs of 10.0 or less and sample sizes larger than80 are based on the Poisson distribution and apply either fornonconformities per hundred units inspection, or for percent
ANSI/ASQ Z1.4-2008
6
Copyright American Society for Quality Provided by IHS under license with ASQ
Not for ResaleNo reproduction or networking permitted without license from IHS
--`,,```,,,,````-`-`,,`,,`,`,,`---
nonconforming inspection (the Poisson distribution being anadequate approximation to the binomial distribution underthese conditions). Tabulated values corresponding toselected values of probabilities of acceptance (Pa in percent)are given for each of the curves shown, and, in addition, areindexed for tightened inspection, and also show values fornonconformities per hundred units for AQLs of 10.0 or lessand sample sizes of 80 or less.
The operating characteristic curves for scheme performanceshown in Table XV indicate the percentage of lots or batcheswhich may be expected to be accepted under use of theswitching rules with the various sampling plans for a givenprocess quality subject to the restrictions stated above. Theoperating characteristic curves of scheme performance arebased on the use of limit numbers in switching to reducedinspection and are approximately correct when the limitnumbers for reduced inspection are not used under Option8.5. The curves also assume a return to tightened inspectionwhen inspection is resumed after discontinuation has beenimposed. This is also true of average outgoing quality limitand average sample size for ANSI Z1.4 scheme performance.
Note that the operating characteristic curve for scheme per-formance is approximately that of the normal plan for lowlevels of percent nonconforming and that the tightened planfor high levels of percent nonconforming. Use of thereduced plan increases scheme probability of acceptanceonly for extremely low levels of percent nonconforming.
11.2 PROCESS AVERAGE. The process average is theaverage percent nonconforming or average number of non-conformities per hundred units (whichever is applicable) ofproduct submitted by the supplier for original inspection.Original inspection is the first inspection of a particularquantity of product as distinguished from the inspection ofproduct which has been resubmitted after prior rejection.When double or multiple sampling is used, only first sampleresults shall be included in the process average calculation.
11.3 AVERAGE OUTGOING QUALITY (AOQ). TheAOQ is the average quality of outgoing product includingall accepted lots or batches, plus all lots or batches which arenot accepted after such lots or batches have been effectively100 percent inspected and all nonconforming units replacedby conforming units.
11.4 AVERAGE OUTGOING QUALITY LIMIT(AOQL). The AOQL is the maximum of the AOQs for allpossible incoming qualities for a given acceptance sampling
plan. AOQL values are given in Table V-A for each of thesingle sampling plans for normal inspection and in TableV-Bfor each of the single sampling plans for tightened inspec-tions. AOQL values for ANSI Z1.4 scheme performance aregiven in Table XI subject to the restrictions of 11.1. Theyshow the average outgoing quality limits for scheme per-formance when using single sampling. AOQL will beslightly higher when the limit numbers for reduced inspec-tion are not used under Option 8.5.
11.5 AVERAGE SAMPLE SIZE CURVES. Averagesample size curves for double and multiple sampling ascompared to the single sampling plan for each acceptancenumber are in Table IX. These show the average samplesizes which may be expected to occur under the varioussampling plans for a given process quality level. The curvesassume no curtailment of inspection and are approximate tothe extent that they are based upon the Poisson distribution,and that the sample sizes at each stage for double and mul-tiple sampling are assumed to be 0.631n and 0.25n respec-tively, where n is the equivalent single sample size. Averagesample size tables for ANSI Z1.4 scheme performance aregiven in Table XIV. They show the average sample size forscheme performance when using single sampling.
11.6 LIMITING QUALITY PROTECTION.
11.6.1 USE OF INDIVIDUAL PLANS. This standard isintended to be used as a system employing tightened, nor-mal, and reduced inspection on a continuing series of lots toachieve consumer protection while assuring the producerthat acceptance will occur most of the time if quality is bet-ter than the AQL.
11.6.2 IMPORTANCE OF SWITCHING RULES.Occasionally specific individual plans are selected from thestandard and used without the switching rules. This is notthe intended application of the ANSI Z1.4 system and its usein this way should not be referred to as inspection underANSI Z1.4.When employed in this way, this document sim-ply represents a repository for a collection of individualplans indexed by AQL. The operating characteristics andother measures of a plan so chosen must be assessed indi-vidually for that plan from the tables provided.
11.6.3 LIMITING QUALITY TABLES. If the lot orbatch is of an isolated nature, it is desirable to limit theselection of sampling plans to those, associated with a des-ignated AQL value, that provide not less than a specifiedlimiting quality protection. Sampling plans for this purpose
ANSI/ASQ Z1.4-2008
7
Copyright American Society for Quality Provided by IHS under license with ASQ
Not for ResaleNo reproduction or networking permitted without license from IHS
--`,,```,,,,````-`-`,,`,,`,`,,`---
can be selected by choosing a Limiting Quality (LQ) and aconsumer’s risk to be associated with it. Limiting Quality isthe percentage of nonconforming units (or nonconformities)in a batch or lot for which for purposes of acceptance sam-pling, the consumer wishes the probability of acceptance tobe restricted to a specified low value.
Tables VI and VII give process levels for which the proba-bilities of lot acceptance under various sampling plans are10 percent and 5 percent respectively. If a different value ofconsumer’s risk is required, the O.C. curves and their tabu-lated values may be used. For individual lots with percentsnonconforming or nonconformities per 100 units equal to thespecified Limiting Quality (LQ) values, the probabilities oflot acceptance are less than 10 percent in the case of planslisted in Table VI and less than 5 percent in the case ofplans listed in Table VII. When there is reason for avoidingmore than a limiting percentage of nonconforming units (ornonconformities) in a lot or batch, TablesVI andVII may beuseful for fixing minimum sample sizes to be associated
with the AQL and Inspection Level specified for the inspec-tion of a series of lots or batches. For example, if an LQ of5 percent is desired for individual lots with an associated Paof 10 percent or less, then if an AQL of 1.5 percent is desig-nated for inspection of a series of lots or batches. Table VIindicates that the minimum sample size must be that givenby Code Letter M.
Where there is interest in a limiting process level, Tables XIIand XIII, which give LQ values and ANSI Z1.4 scheme per-formance may be used in a similar way to fix minimumsample sizes.
In the case of an isolated lot, it is preferable for the customerto adapt a sampling plan with a small consumer’s risk. Theideal method of calculating the sample size and risk is by useof the hypergeometric probability function. ASQC Q3-1988contains sampling plans that have been calculated on thisbasis and therefore provide a more accurate set of tables forthese situations.
ANSI/ASQ Z1.4-2008
8
Copyright American Society for Quality Provided by IHS under license with ASQ
Not for ResaleNo reproduction or networking permitted without license from IHS
--`,,```,,,,````-`-`,,`,,`,`,,`---
9
SwitchingRulesforANSIZ1.4System
RE
DU
CE
DN
OR
MA
L
STA
RT
TIG
HT
EN
ED
•Pr
eced
ing
10L
ots
Acc
epte
d,w
ith•
Tota
lNon
conf
orm
ing
less
than
Lim
itN
umbe
r(O
ptio
nal)
,and
•Pr
oduc
tion
Stea
dy,
and
•A
ppro
ved
byR
espo
nsib
leA
utho
rity
•2
of5
orfe
wer
Con
secu
tive
Lot
sar
eN
otA
ccep
ted
•5
Con
secu
tive
Lot
sA
ccep
ted
•L
otno
tAcc
epte
d,or
•L
otA
ccep
ted
but
Non
conf
orm
ities
foun
dlie
betw
een
Ac
and
Re
ofPl
an,o
r•
Prod
uctio
nIr
regu
lar,
or•
Oth
erC
ondi
tions
War
rant
•5
Lot
sno
tAcc
epte
dw
hile
onT
ight
ened
Insp
ectio
n
•D
isco
ntin
ueIn
spec
tion
Und
erZ
1.4
SWITCHINGRULES
FIGURE1
Copyright American Society for Quality Provided by IHS under license with ASQ
Not for ResaleNo reproduction or networking permitted without license from IHS
--`,,```,,,,````-`-`,,`,,`,`,,`---
10
TableI—
Samplesize
code
letters
Lot
orba
tch
size
2 9 16 26 51 91 151
281
501
1201
3201
1000
1
3500
115
0001
5000
01
to to to to to to to to to to to to to to and
8 15 25 50 90 150
280
500
1200
3200
1000
035
000
1500
0050
0000
over
A A A A B B B B C C C C D D DS-1
A A A B B B C C C D D D E E ES-2
A A B B C C D D E E F F G G HS-3
A A B C C D E E F G G H J J KS-4
A A B C C D E F G H J K L M NI
A B C D E F G H J K L M N P QII
Spec
iali
nspe
ctio
nle
vels
Gen
eral
insp
ectio
nle
vels
(See
9.2
and
9.3)
B C D E F G H J K L M N P Q RIII
CODELETTERS
Copyright American Society for Quality Provided by IHS under license with ASQ
Not for ResaleNo reproduction or networking permitted without license from IHS
--`,,```,,,,````-`-`,,`,,`,`,,`---
11
TableII-A—Singlesamplingplansfornorm
alinspection
(Mastertable)
Sam
ple
size
code
lette
r
Sam
ple
size
Acc
epta
nce
Qua
lity
Lim
its,A
QL
s,in
Perc
entN
onco
nfor
min
gIt
ems
and
Non
conf
orm
ities
per
100
Item
s(N
orm
alIn
spec
tion)
A B C D E F G H J K L M N P Q R
2 3 5 8 13 20 32 50 80 125
200
315
500
800
1250
2000
11
1 2
1 2 3
1 2 3 4
1 2 3 4 6
1 2 3 4 6 8
1 2 3 4 6 8 11
1 2 3 4 6 8 11 15
1 2 3 4 6 8 11 15 22
1 2 3 4 6 8 11 15 22
1 2 3 4 6 8 11 15 22
1 2 3 4 6 8 11 15 22
1 2 3 4 6 8 11 15 22
1 2 3 4 6 8 11 15 22
2 3 4 6 8 11 15 22
2 3 4 6 8 11 15 22
2 3 4 6 8 11 15 22
3 4 6 8 11 15 22
4 6 8 11 15 22
6 8 11 15 22
8 11 15 22 31
11 15 22 31 45
15 22 31 45
22 31 45
31 45
00
Re
Ac
Re
Ac
Re
Ac
Re
Ac
Re
Ac
Re
Ac
Re
Ac
Re
Ac
Re
Ac
Re
Ac
Re
Ac
Re
Ac
Re
Ac
Re
Ac
Re
Ac
Re
Ac
Re
Ac
Re
Ac
Re
Ac
Re
Ac
Re
Ac
Re
Ac
Re
Ac
Re
Ac
Re
Ac
Re
Ac
0.01
50.
025
0.04
00.
065
0.10
0.15
0.25
0.40
0.65
1.0
1.5
2.5
4.0
6.5
1015
2540
6510
015
025
040
065
010
000.
010
0 1
0 1 2
0 1 2 3
0 1 2 3 5
0 1 2 3 5 7
0 1 2 3 5 7 10
0 1 2 3 5 7 10 14
0 1 2 3 5 7 10 14 21
0 1 2 3 5 7 10 14 21
0 1 2 3 5 7 10 14 21
0 1 2 3 5 7 10 14 21
0 1 2 3 5 7 10 14 21
0 1 2 3 5 7 10 14 21
1 2 3 5 7 10 14 21
1 2 3 5 7 10 14 21
1 2 3 5 7 10 14 21
2 3 5 7 10 14 21
3 5 7 10 14 21
5 7 10 14 21
7 10 14 21 30
10 14 21 30 44
14 21 30 44
21 30 44
30 44
=U
seth
efi
rsts
ampl
ing
plan
belo
wth
ear
row
.If
sam
ple
size
equa
ls,o
rex
ceed
s,lo
tsiz
e,ca
rry
out1
00pe
rcen
tins
pect
ion.
=U
seth
efi
rsts
ampl
ing
plan
abov
eth
ear
row
.
=A
ccep
tanc
enu
mbe
r.
=R
ejec
tion
num
ber.
Ac
Re
(See
9.4
and
9.5)
SINGLENORMALPLANS
Copyright American Society for Quality Provided by IHS under license with ASQ
Not for ResaleNo reproduction or networking permitted without license from IHS
--`,,```,,,,````-`-`,,`,,`,`,,`---
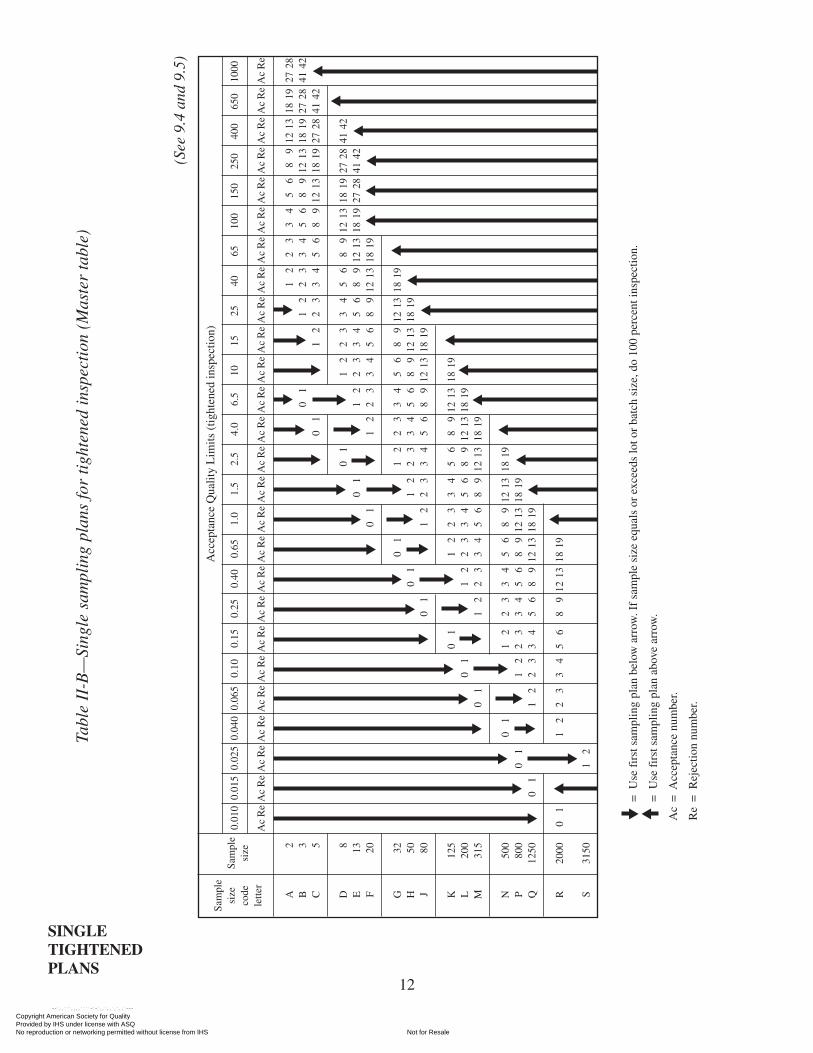
12
TableII-B—Singlesamplingplansfortightenedinspection
(Mastertable)
Sam
ple
size
code
lette
r
Sam
ple
size
Acc
epta
nce
Qua
lity
Lim
its(t
ight
ened
insp
ectio
n)
A B C D E F G H J K L M N P Q R S
2 3 5 8 13 20 32 50 80 125
200
315
500
800
1250
2000
3150
11 2
1 2
1 2 3
1 2 3 4
1 2 3 4 6
1 2 3 4 6 9
1 2 3 4 6 9 13
1 2 3 4 6 9 13
1 2 3 4 6 9 13 19
1 2 3 4 6 9 13 19
1 2 3 4 6 9 13
1 2 3 4 6 9 13 19
1 2 3 4 6 9 13 19
2 3 4 6 9 13 19
2 3 4 6 9 13 19
2 3 4 6 9 13 19
2 3 4 6 9 13 19
3 4 6 9 13 19
4 6 9 13 19
6 9 13 19 28
9 13 19 28 42
13 19 28 42
19 28 42
28 42
10
0
Re
Ac
Re
Ac
Re
Ac
Re
Ac
Re
Ac
Re
Ac
Re
Ac
Re
Ac
Re
Ac
Re
Ac
Re
Ac
Re
Ac
Re
Ac
Re
Ac
Re
Ac
Re
Ac
Re
Ac
Re
Ac
Re
Ac
Re
Ac
Re
Ac
Re
Ac
Re
Ac
Re
Ac
Re
Ac
Re
Ac
0.01
50.
025
0.04
00.
065
0.10
0.15
0.25
0.40
0.65
1.0
1.5
2.5
4.0
6.5
1015
2540
6510
015
025
040
065
010
000.
010
0 1
0 1
0 1 2
0 1 2 3
0 1 2 3 5
0 1 2 3 5 8
0 1 2 3 5 8 12
0 1 2 3 5 8 12
1918
0 1 2 3 5 8 12 18
0 1 2 3 5 8 12 18
0 1 2 3 5 8 12
1918
0 1 2 3 5 8 12 18
0 1 2 3 5 8 12 18
1 2 3 5 8 12 18
1 2 3 5 8 12 18
1 2 3 5 8 12 18
1 2 3 5 8 12 18
2 3 5 8 12 18
3 5 8 12 18
5 8 12 18 27
8 12 18 27 41
12 18 27 41
18 27 41
27 41
=U
sefi
rsts
ampl
ing
plan
belo
war
row
.If
sam
ple
size
equa
lsor
exce
eds
loto
rba
tch
size
,do
100
perc
enti
nspe
ctio
n.
=U
sefi
rsts
ampl
ing
plan
abov
ear
row
.
=A
ccep
tanc
enu
mbe
r.
=R
ejec
tion
num
ber.
Ac
Re
(See
9.4
and
9.5)
SINGLETIGHTENEDPLANS
Copyright American Society for Quality Provided by IHS under license with ASQ
Not for ResaleNo reproduction or networking permitted without license from IHS
--`,,```,,,,````-`-`,,`,,`,`,,`---
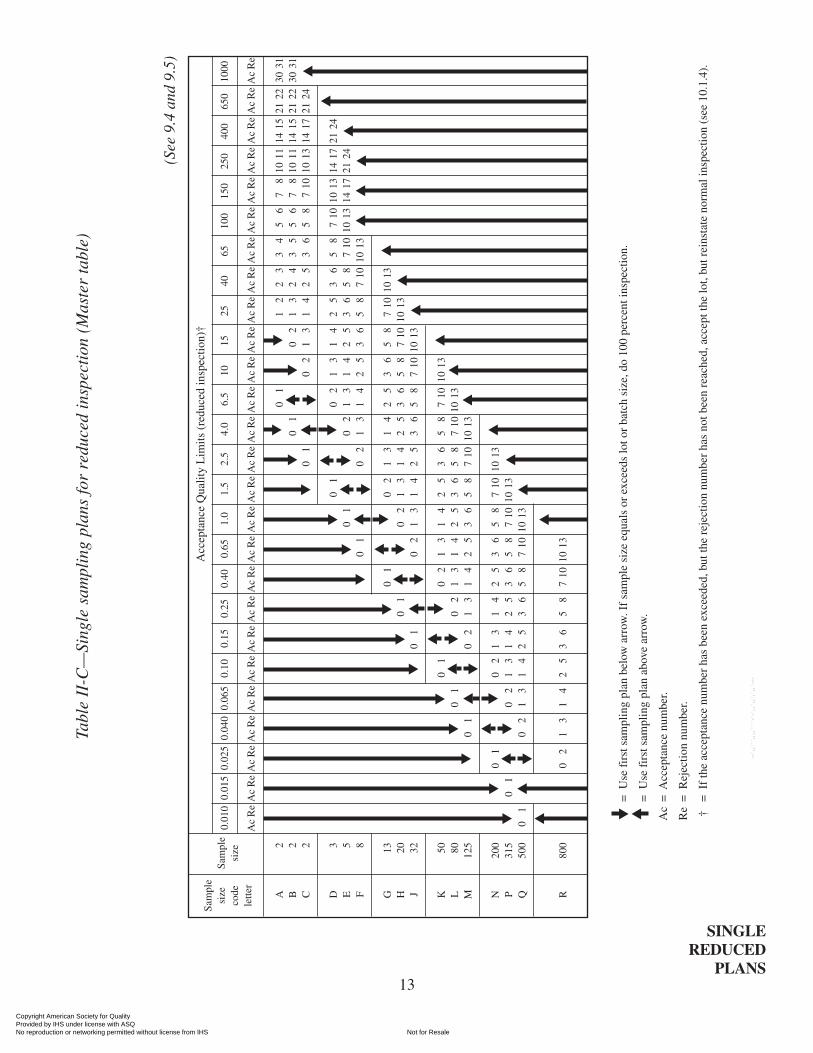
13
TableII-C—Singlesamplingplansforreducedinspection
(Mastertable)
Sam
ple
size
code
lette
r
Sam
ple
size
Acc
epta
nce
Qua
lity
Lim
its(r
educ
edin
spec
tion)
†
A B C D E F G H J K L M N P Q R
2 2 2 3 5 8 13 20 32 50 80 125
200
315
500
800
11
1 2
1 2 3
1 2 3 4
1 2 3 4 5
1 2 3 4 5 6
1 2 3 4 5 6 8
1 2 3 4 5 6 8 10
1 2 3 4 5 6 8 10 13
1 2 3 4 5 6 8 10 13
1 2 3 4 5 6 8 10 13
1 2 3 4 5 6 8 10 13
1 2 3 4 5 6 8 10 13
1 2 3 4 5 6 8 10 13
2 3 4 5 6 8 10 13
2 3 4 5 6 8 10 13
2 3 4 5 6 8 10 13
3 4 5 6 8 10 13
4 5 6 8 10 13
6 6 8 10 13
8 8 10 13 17
11 11 13 17 24
15 15 17 24
22 22 24
31 31
00
Re
Ac
Re
Ac
Re
Ac
Re
Ac
Re
Ac
Re
Ac
Re
Ac
Re
Ac
Re
Ac
Re
Ac
Re
Ac
Re
Ac
Re
Ac
Re
Ac
Re
Ac
Re
Ac
Re
Ac
Re
Ac
Re
Ac
Re
Ac
Re
Ac
Re
Ac
Re
Ac
Re
Ac
Re
Ac
Re
Ac
0.01
50.
025
0.04
00.
065
0.10
0.15
0.25
0.40
0.65
1.0
1.5
2.5
4.0
6.5
1015
2540
6510
015
025
040
065
010
000.
010
0 0
0 0 1
0 0 1 1
0 0 1 1 2
0 0 1 1 2 3
0 0 1 1 2 3 5
0 0 1 1 2 3 5 7
0 0 1 1 2 3 5 7 10
0 0 1 1 2 3 5 7 10
0 0 1 1 2 3 5 7 10
0 0 1 1 2 3 5 7 10
0 0 1 1 2 3 5 7 10
0 0 1 1 2 3 5 7 10
0 1 1 2 3 5 7 10
0 1 1 2 3 5 7 10
1 1 1 2 3 5 7 10
2 2 2 3 5 7 10
3 3 3 5 7 10
5 5 5 7 10
7 7 7 10 14
10 10 10 14 21
14 14 14 21
21 21 21
30 30
=U
sefi
rsts
ampl
ing
plan
belo
war
row
.If
sam
ple
size
equa
lsor
exce
eds
loto
rba
tch
size
,do
100
perc
enti
nspe
ctio
n.
=U
sefi
rsts
ampl
ing
plan
abov
ear
row
.
=A
ccep
tanc
enu
mbe
r.
=R
ejec
tion
num
ber.
=If
the
acce
ptan
cenu
mbe
rha
sbe
enex
ceed
ed,b
utth
ere
ject
ion
num
ber
has
notb
een
reac
hed,
acce
ptth
elo
t,bu
trei
nsta
teno
rmal
insp
ectio
n(s
ee10
.1.4
).
Ac
Re †
(See
9.4
and
9.5)
SINGLEREDUCED
PLANS
Copyright American Society for Quality Provided by IHS under license with ASQ
Not for ResaleNo reproduction or networking permitted without license from IHS
--`,,```,,,,````-`-`,,`,,`,`,,`---
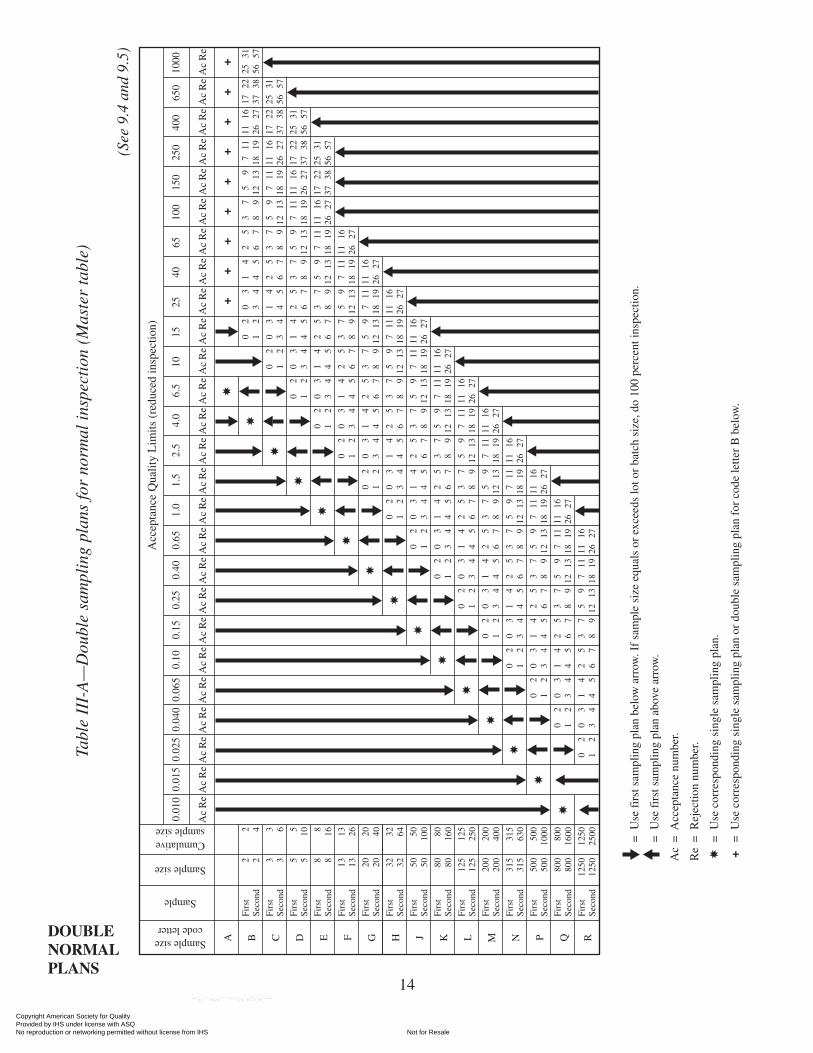
14
TableIII-A—Doublesamplingplansfornorm
alinspection
(Mastertable)
Samplesizecodeletter
Sample
Samplesize
Cumulative samplesize
Acc
epta
nce
Qua
lity
Lim
its(r
educ
edin
spec
tion)
A B C D E F G H J K L M N P Q R
Firs
tSe
cond
Firs
tSe
cond
Firs
tSe
cond
Firs
tSe
cond
Firs
tSe
cond
Firs
tSe
cond
Firs
tSe
cond
Firs
tSe
cond
Firs
tSe
cond
Firs
tSe
cond
Firs
tSe
cond
Firs
tSe
cond
Firs
tSe
cond
Firs
tSe
cond
Firs
tSe
cond
2 2 3 3 5 5 8 8 13 13 20 20 32 32 50 50 80 80 125
125
200
200
315
315
500
500
800
800
1250
1250
2 4 3 6 5 10 8 16 13 26 20 40 32 64 50 100 80 160
125
250
200
400
315
630
500
1000 800
1600
1250
2500
0 12 2
0 1 0 3
2 2 3 4
0 1 0 3 1 4
2 2 3 4 4 5
0 1 0 3 1 4 2 6
2 2 3 4 4 5 5 7
0 1 0 3 1 4 2 6 3 8
2 2 3 4 4 5 5 7 7 9
0 1 0 3 1 4 2 6 3 8 5 12
2 2 3 4 4 5 5 7 7 9 9 13
0 1 0 3 1 4 2 6 3 8 5 12 7 18
2 2 3 4 4 5 5 7 7 9 9 13 11 19
0 1 0 3 1 4 2 6 3 8 5 12 7 18 11 26
2 2 3 4 4 5 5 7 7 9 9 13 11 19 16 27
0 1 0 3 1 4 2 6 3 8 5 12 7 18 11 26
2 2 3 4 4 5 5 7 7 9 9 13 11 19 16 27
0 1 0 3 1 4 2 6 3 8 5 12 7 18 11 26
2 2 3 4 4 5 5 7 7 9 9 13 11 19 16 27
0 1 0 3 1 4 2 6 3 8 5 12 7 18 11 26
2 2 3 4 4 5 5 7 7 9 9 13 11 19 16 27
0 1 0 3 1 4 2 6 3 8 5 12 7 18 11 26
2 2 3 4 4 5 5 7 7 9 9 13 11 19 16 27
0 1 0 3 1 4 2 6 3 8 5 12 7 18 11 26
2 2 3 4 4 5 5 7 7 9 9 13 11 19 16 27
0 1 0 3 1 4 2 6 3 8 5 12 7 18 11 26
2 2 3 4 4 5 5 7 7 9 9 13 11 19 16 27
0 1 0 3 1 4 2 6 3 8 5 12 7 18 11 26
2 2 3 4 4 5 5 7 7 9 9 13 11 19 16 27
0 3 1 4 2 6 3 8 5 12 7 18 11 26
3 4 4 5 5 7 7 9 9 13 11 19 16 27
1 4 2 6 3 8 5 12 7 18 11 26
4 5 5 7 7 9 9 13 11 19 16 27
2 6 3 8 5 12 7 18 11 26
5 7 7 9 9 13 11 19 16 27
3 8 5 12 7 18 11 26
7 9 9 13 11 19 16 27
5 12 7 18 11 26 17 37
9 13 11 19 16 27 22 38
7 18 11 26 17 37 25 56
11 19 16 27 22 38 31 57
11 26 17 37 25 56
16 27 22 38 31 57
17 37 25 56
22 38 31 57
25 5631 57
Re
Ac
Re
Ac
Re
Ac
Re
Ac
Re
Ac
Re
Ac
Re
Ac
Re
Ac
Re
Ac
Re
Ac
Re
Ac
Re
Ac
Re
Ac
Re
Ac
Re
Ac
Re
Ac
Re
Ac
Re
Ac
Re
Ac
Re
Ac
Re
Ac
Re
Ac
Re
Ac
Re
Ac
Re
Ac
Re
Ac
0.01
50.
025
0.04
00.
065
0.10
0.15
0.25
0.40
0.65
1.0
1.5
2.5
4.0
6.5
1015
2540
6510
015
025
040
065
010
000.
010
=U
sefi
rsts
ampl
ing
plan
belo
war
row
.If
sam
ple
size
equa
lsor
exce
eds
loto
rba
tch
size
,do
100
perc
enti
nspe
ctio
n.
=U
sefi
rsts
ampl
ing
plan
abov
ear
row
.
=A
ccep
tanc
enu
mbe
r.
=R
ejec
tion
num
ber.
=U
seco
rres
pond
ing
sing
lesa
mpl
ing
plan
.
Ac
Re
X
=U
seco
rres
pond
ing
sing
lesa
mpl
ing
plan
ordo
uble
sam
plin
gpl
anfo
rco
dele
tter
Bbe
low
.+
(See
9.4
and
9.5)
X
X
X
X
X
X
X
X
X
X
X
X
X
X
X+
++
++
++
++
DOUBLENORMALPLANS
Copyright American Society for Quality Provided by IHS under license with ASQ
Not for ResaleNo reproduction or networking permitted without license from IHS
--`,,```,,,,````-`-`,,`,,`,`,,`---
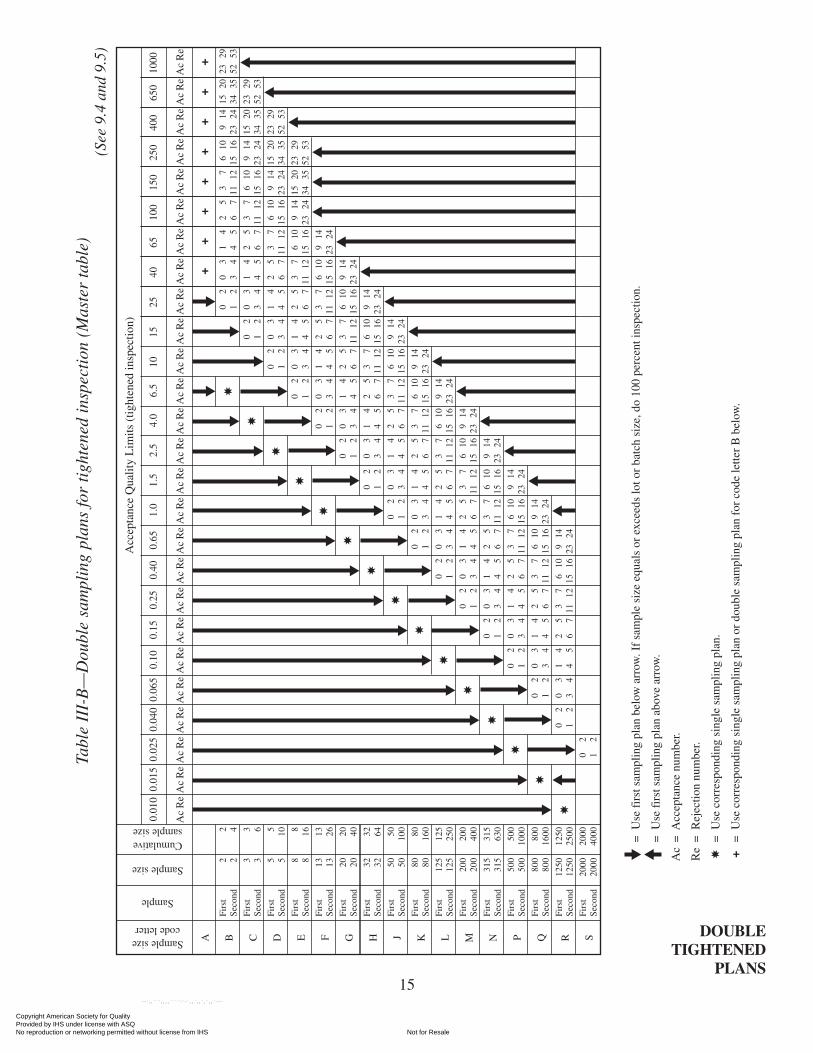
15
Samplesizecodeletter
Sample
Samplesize
Cumulative samplesize
Acc
epta
nce
Qua
lity
Lim
its(t
ight
ened
insp
ectio
n)
A B C D E F G H J K L M N P Q R
Firs
tSe
cond
Firs
tSe
cond
Firs
tSe
cond
Firs
tSe
cond
Firs
tSe
cond
Firs
tSe
cond
Firs
tSe
cond
Firs
tSe
cond
Firs
tSe
cond
Firs
tSe
cond
Firs
tSe
cond
Firs
tSe
cond
Firs
tSe
cond
Firs
tSe
cond
Firs
tSe
cond
2 2 3 3 5 5 8 8 13 13 20 20 32 32 50 50 80 80 125
125
200
200
315
315
500
500
800
800
1250
1250
2 4 3 6 5 10 8 16 13 26 20 40 32 64 50 100 80 160
125
250
200
400
315
630
500
1000 800
1600
1250
2500
0 12 2
0 1 0 3
2 2 3 4
0 1 0 3 1 4
2 2 3 4 4 5
0 1 0 3 1 4 2 6
2 2 3 4 4 5 5 7
0 1 0 3 1 4 2 6 3 11
2 2 3 4 4 5 5 7 7 12
0 1 0 3 1 4 2 6 3 11 6 15
2 2 3 4 4 5 5 7 7 12 10 16
0 1 0 3 1 4 2 6 3 11 6 15 9 23
2 2 3 4 4 5 5 7 7 12 10 16 14 24
0 1 0 3 1 4 2 6 3 11 6 15 9 23
2 2 3 4 4 5 5 7 7 12 10 16 14 24
0 1 0 3 1 4 2 6 3 11 6 15 9 23
2 2 3 4 4 5 5 7 7 12 10 16 14 24
0 1 0 3 1 4 2 6 3 11 6 15 9 23
2 2 3 4 4 5 5 7 7 12 10 16 14 24
0 1 0 3 1 4 2 6 3 11 6 15 9 23
2 2 3 4 4 5 5 7 7 12 10 16 14 24
0 1 0 3 1 4 2 6 3 11 6 15 9 23
2 2 3 4 4 5 5 7 7 12 10 16 14 24
0 1 0 3 1 4 2 6 3 11 6 15 9 23
2 2 3 4 4 5 5 7 7 12 10 16 14 24
0 1 0 3 1 4 2 6 3 11 6 15 9 23
2 2 3 4 4 5 5 7 7 12 10 16 14 24
0 1 0 3 1 4 2 6 3 11 6 15 9 23
2 2 3 4 4 5 5 7 7 12 10 16 14 24
0 3 1 4 2 6 3 11 6 15 9 23
3 4 4 5 5 7 7 12 10 16 14 24
1 4 2 6 3 11 6 15 9 23
4 5 5 7 7 12 10 16 14 24
2 6 3 11 6 15 9 23
5 7 7 12 10 16 14 24
3 11 6 15 9 23 15 34
7 12 10 16 14 24 20 35
6 15 9 23 15 34 23 52
10 16 14 24 20 35 29 53
9 23 15 34 23 52
14 24 20 35 29 53
15 34 23 52
20 35 29 53
23 5229 53
Re
Ac
Re
Ac
Re
Ac
Re
Ac
Re
Ac
Re
Ac
Re
Ac
Re
Ac
Re
Ac
Re
Ac
Re
Ac
Re
Ac
Re
Ac
Re
Ac
Re
Ac
Re
Ac
Re
Ac
Re
Ac
Re
Ac
Re
Ac
Re
Ac
Re
Ac
Re
Ac
Re
Ac
Re
Ac
Re
Ac
0.01
50.
025
0.04
00.
065
0.10
0.15
0.25
0.40
0.65
1.0
1.5
2.5
4.0
6.5
1015
2540
6510
015
025
040
065
010
000.
010
(See
9.4
and
9.5)
SFi
rst
Seco
nd20
0020
0020
0040
000 1
2 2
=U
sefi
rsts
ampl
ing
plan
belo
war
row
.If
sam
ple
size
equa
lsor
exce
eds
loto
rba
tch
size
,do
100
perc
enti
nspe
ctio
n.
=U
sefi
rsts
ampl
ing
plan
abov
ear
row
.
=A
ccep
tanc
enu
mbe
r.
=R
ejec
tion
num
ber.
=U
seco
rres
pond
ing
sing
lesa
mpl
ing
plan
.
Ac
Re
X
=U
seco
rres
pond
ing
sing
lesa
mpl
ing
plan
ordo
uble
sam
plin
gpl
anfo
rco
dele
tter
Bbe
low
.+
X
X
X
X
X
X
X
X
X
X
X
X
X
X
X
++
++
++
++
DOUBLETIGHTENED
PLANS
TableIII-B—Doublesamplingplansfortightenedinspection
(Mastertable)
Copyright American Society for Quality Provided by IHS under license with ASQ
Not for ResaleNo reproduction or networking permitted without license from IHS
--`,,```,,,,````-`-`,,`,,`,`,,`---
16
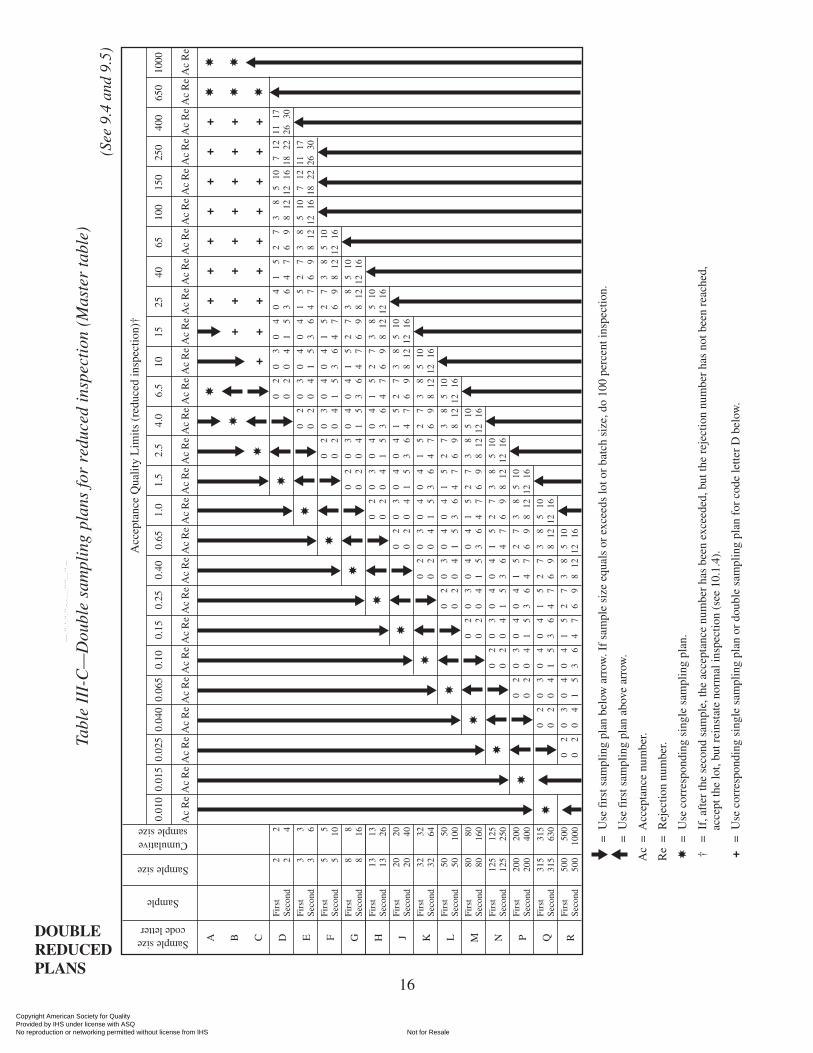
TableIII-C—Doublesamplingplansforreducedinspection
(Mastertable)
Samplesizecodeletter
Sample
Samplesize
Cumulative samplesize
Acc
epta
nce
Qua
lity
Lim
its(r
educ
edin
spec
tion)
†
A B C D E F G H J K L M N P Q R
Firs
tSe
cond
Firs
tSe
cond
Firs
tSe
cond
Firs
tSe
cond
Firs
tSe
cond
Firs
tSe
cond
Firs
tSe
cond
Firs
tSe
cond
Firs
tSe
cond
Firs
tSe
cond
Firs
tSe
cond
Firs
tSe
cond
Firs
tSe
cond
2 2 3 3 5 5 8 8 13 13 20 20 32 32 50 50 80 80 125
125
200
200
315
315
500
500
2 4 3 6 5 10 8 16 13 26 20 40 32 64 50 100 80 160
125
250
200
400
315
630
500
1000
0 02 2
0 0 0 0
2 2 3 4
0 0 0 0 0 1
2 2 3 4 4 5
0 0 0 0 0 1 0 3
2 2 3 4 4 5 4 6
0 0 0 0 0 1 0 3 1 4
2 2 3 4 4 5 4 6 5 7
0 0 0 0 0 1 0 3 1 4 2 6
2 2 3 4 4 5 4 6 5 7 7 9
0 0 0 0 0 1 0 3 1 4 2 6 3 8
2 2 3 4 4 5 4 6 5 7 7 9 8 12
0 0 0 0 0 1 0 3 1 4 2 6 3 8 5 12
2 2 3 4 4 5 4 6 5 7 7 9 8 12 10 16
0 0 0 0 0 1 0 3 1 4 2 6 3 8 5 12
2 2 3 4 4 5 4 6 5 7 7 9 8 12 10 16
0 0 0 0 0 1 0 3 1 4 2 6 3 8 5 12
2 2 3 4 4 5 4 6 5 7 7 9 8 12 10 16
0 0 0 0 0 1 0 3 1 4 2 6 3 8 5 12
2 2 3 4 4 5 4 6 5 7 7 9 8 12 10 16
0 0 0 0 0 1 0 3 1 4 2 6 3 8 5 12
2 2 3 4 4 5 4 6 5 7 7 9 8 12 10 16
0 0 0 0 0 1 0 3 1 4 2 6 3 8 5 12
2 2 3 4 4 5 4 6 5 7 7 9 8 12 10 16
0 0 0 1 0 3 1 4 2 6 3 8 5 12
3 4 4 5 4 6 5 7 7 9 8 12 10 16
0 1 0 3 1 4 2 6 3 8 5 12
4 5 4 6 5 7 7 9 8 12 10 16
0 3 1 4 2 6 3 8 5 12
4 6 5 7 7 9 8 12 10 16
1 4 2 6 3 8 5 12
5 7 7 9 8 12 10 16
2 6 3 8 5 12
7 9 8 12 10 16
3 8 5 12
8 12 10 16
5 12 7 18
10 16 12 22
7 18 11 26
12 22 17 30
11 2617 30
Re
Ac
Re
Ac
Re
Ac
Re
Ac
Re
Ac
Re
Ac
Re
Ac
Re
Ac
Re
Ac
Re
Ac
Re
Ac
Re
Ac
Re
Ac
Re
Ac
Re
Ac
Re
Ac
Re
Ac
Re
Ac
Re
Ac
Re
Ac
Re
Ac
Re
Ac
Re
Ac
Re
Ac
Re
Ac
Re
Ac
0.01
50.
025
0.04
00.
065
0.10
0.15
0.25
0.40
0.65
1.0
1.5
2.5
4.0
6.5
1015
2540
6510
015
025
040
065
010
000.
010
=U
sefi
rsts
ampl
ing
plan
belo
war
row
.If
sam
ple
size
equa
lsor
exce
eds
loto
rba
tch
size
,do
100
perc
enti
nspe
ctio
n.
=U
sefi
rsts
ampl
ing
plan
abov
ear
row
.
=A
ccep
tanc
enu
mbe
r.
=R
ejec
tion
num
ber.
=U
seco
rres
pond
ing
sing
lesa
mpl
ing
plan
.
=If
,aft
erth
ese
cond
sam
ple,
the
acce
ptan
cenu
mbe
rha
sbe
enex
ceed
ed,b
utth
ere
ject
ion
num
ber
has
notb
een
reac
hed,
acce
ptth
elo
t,bu
trei
nsta
teno
rmal
insp
ectio
n(s
ee10
.1.4
).
Ac
Re
X †
=U
seco
rres
pond
ing
sing
lesa
mpl
ing
plan
ordo
uble
sam
plin
gpl
anfo
rco
dele
tter
Dbe
low
.+
(See
9.4
and
9.5)
X
X
X
X
X
X
X
X
X
X
X
X
X
X
X+
++
++
++
XX
++
++
++
+X
X
+
+ ++
++
++
++
X
DOUBLEREDUCEDPLANS
Copyright American Society for Quality Provided by IHS under license with ASQ
Not for ResaleNo reproduction or networking permitted without license from IHS
--`,,```,,,,````-`-`,,`,,`,`,,`---
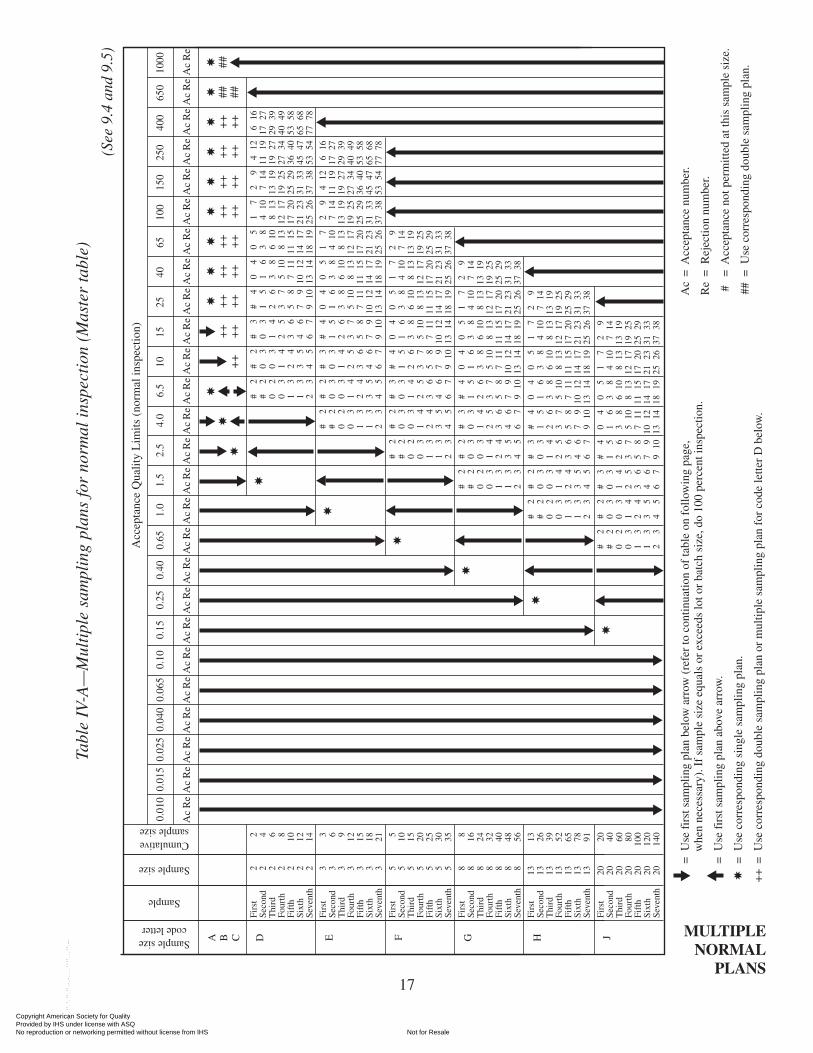
17
TableIV-A—Multiplesamplingplansfornorm
alinspection
(Mastertable)
Samplesizecodeletter
Sample
Samplesize
Cumulative samplesize
Acc
epta
nce
Qua
lity
Lim
its(n
orm
alin
spec
tion)
A CB D E F G H
Firs
tSe
cond
Thi
rdFo
urth
Fift
hSi
xth
Seve
nth
Firs
tSe
cond
Thi
rdFo
urth
Fift
hSi
xth
Seve
nth
Firs
tSe
cond
Thi
rdFo
urth
Fift
hSi
xth
Seve
nth
Firs
tSe
cond
Thi
rdFo
urth
Fift
hSi
xth
Seve
nth
Firs
tSe
cond
Thi
rdFo
urth
Fift
hSi
xth
Seve
nth
2 2 2 2 2 2 2 3 3 3 3 3 3 3 5 5 5 5 5 5 5 8 8 8 8 8 8 8 13 13 13 13 13 13 13
2 4 6 8 10 12 14
2 2 2 3 3 3 3
# # 0 0 1 1 2
2 3 3 4 4 5 5
# 0 0 1 2 3 4
3 3 4 5 6 6 7
# 0 1 2 3 4 6
4 5 6 7 8 9 10
# 1 2 3 5 7 9
4 6 8 10 11 12 14
0 1 3 5 7 10 13
5 8 10 13 15 17 19
0 3 6 8 11 14 18
7 10 13 17 20 23 26
1 4 8 12 17 21 25
9 14 19 25 29 33 38
2 7 13 19 25 31 37
12 19 27 34 40 47 54
4 11 19 27 36 45 53
16 27 39 49 58 68 78
6 17 29 40 53 65 77
2 2 2 3 3 3 3
# # 0 0 1 1 2
2 3 3 4 4 5 5
# 0 0 1 2 3 4
3 3 4 5 6 6 7
# 0 1 2 3 4 6
4 5 6 7 8 9 10
# 1 2 3 5 7 9
4 6 8 10 11 12 14
0 1 3 5 7 10 13
5 8 10 13 15 17 19
0 3 6 8 11 14 18
7 10 13 17 20 23 26
1 4 8 12 17 21 25
9 14 19 25 29 33 38
2 7 13 19 25 31 37
2 2 2 3 3 3 3
# # 0 0 1 1 2
2 3 3 4 4 5 5
# 0 0 1 2 3 4
3 3 4 5 6 6 7
# 0 1 2 3 4 6
4 5 6 7 8 9 10
# 1 2 3 5 7 9
4 6 8 10 11 12 14
0 1 3 5 7 10 13
5 8 10 13 15 17 19
0 3 6 8 11 14 18
7 10 13 17 20 23 26
1 4 8 12 17 21 25
9 14 19 25 29 33 38
2 7 13 19 25 31 37
2 2 2 3 3 3 3
# # 0 0 1 1 2
2 3 3 4 4 5 5
# 0 0 1 2 3 4
3 3 4 5 6 6 7
# 0 1 2 3 4 6
4 5 6 7 8 9 10
# 1 2 3 5 7 9
4 6 8 10 11 12 14
0 1 3 5 7 10 13
5 8 10 13 15 17 19
0 3 6 8 11 14 18
7 10 13 17 20 23 26
1 4 8 12 17 21 25
9 14 19 25 29 33 38
2 7 13 19 25 31 37
2 2 2 3 3 3 3
# # 0 0 1 1 2
2 3 3 4 4 5 5
# 0 0 1 2 3 4
3 3 4 5 6 6 7
# 0 1 2 3 4 6
4 5 6 7 8 9 10
# 1 2 3 5 7 9
4 6 8 10 11 12 14
0 1 3 5 7 10 13
5 8 10 13 15 17 19
0 3 6 8 11 14 18
7 10 13 17 20 23 26
1 4 8 12 17 21 25
9 14 19 25 29 33 38
2 7 13 19 25 31 37
3 6 9 12 15 18 21 5 10 15 20 25 30 35 8 16 24 32 40 48 56 13 26 39 52 65 78 91
Re
Ac
Re
Ac
Re
Ac
Re
Ac
Re
Ac
Re
Ac
Re
Ac
Re
Ac
Re
Ac
Re
Ac
Re
Ac
Re
Ac
Re
Ac
Re
Ac
Re
Ac
Re
Ac
Re
Ac
Re
Ac
Re
Ac
Re
Ac
Re
Ac
Re
Ac
Re
Ac
Re
Ac
Re
Ac
Re
Ac
0.01
50.
025
0.04
00.
065
0.10
0.15
0.25
0.40
0.65
1.0
1.5
2.5
4.0
6.5
1015
2540
6510
015
025
040
065
010
000.
010
=U
sefi
rsts
ampl
ing
plan
belo
war
row
(ref
erto
cont
inua
tion
ofta
ble
onfo
llow
ing
page
,w
hen
nece
ssar
y).I
fsa
mpl
esi
zeeq
uals
orex
ceed
slo
tor
batc
hsi
ze,d
o10
0pe
rcen
tins
pect
ion.
=U
sefi
rsts
ampl
ing
plan
abov
ear
row
.
=U
seco
rres
pond
ing
sing
lesa
mpl
ing
plan
.
=U
seco
rres
pond
ing
doub
lesa
mpl
ing
plan
orm
ultip
lesa
mpl
ing
plan
for
code
lette
rD
belo
w.
X ++
=A
ccep
tanc
enu
mbe
r.
=R
ejec
tion
num
ber.
=A
ccep
tanc
eno
tper
mitt
edat
this
sam
ple
size
.
=U
seco
rres
pond
ing
doub
lesa
mpl
ing
plan
.
Ac
Re # ##
(See
9.4
and
9.5)
JFi
rst
Seco
ndT
hird
Four
thFi
fth
Sixt
hSe
vent
h
20 20 20 20 20 20 20
20 40 60 80 100
120
140
X
X
X
X
X
X
X
XX
++
++
++
++
++
++
++
++
++
++
++
++
++
++
++
++
++
######
XX
XX
XX
XX
X
MULTIPLENORMALPLANS
Copyright American Society for Quality Provided by IHS under license with ASQ
Not for ResaleNo reproduction or networking permitted without license from IHS
--`,,```,,,,````-`-`,,`,,`,`,,`---
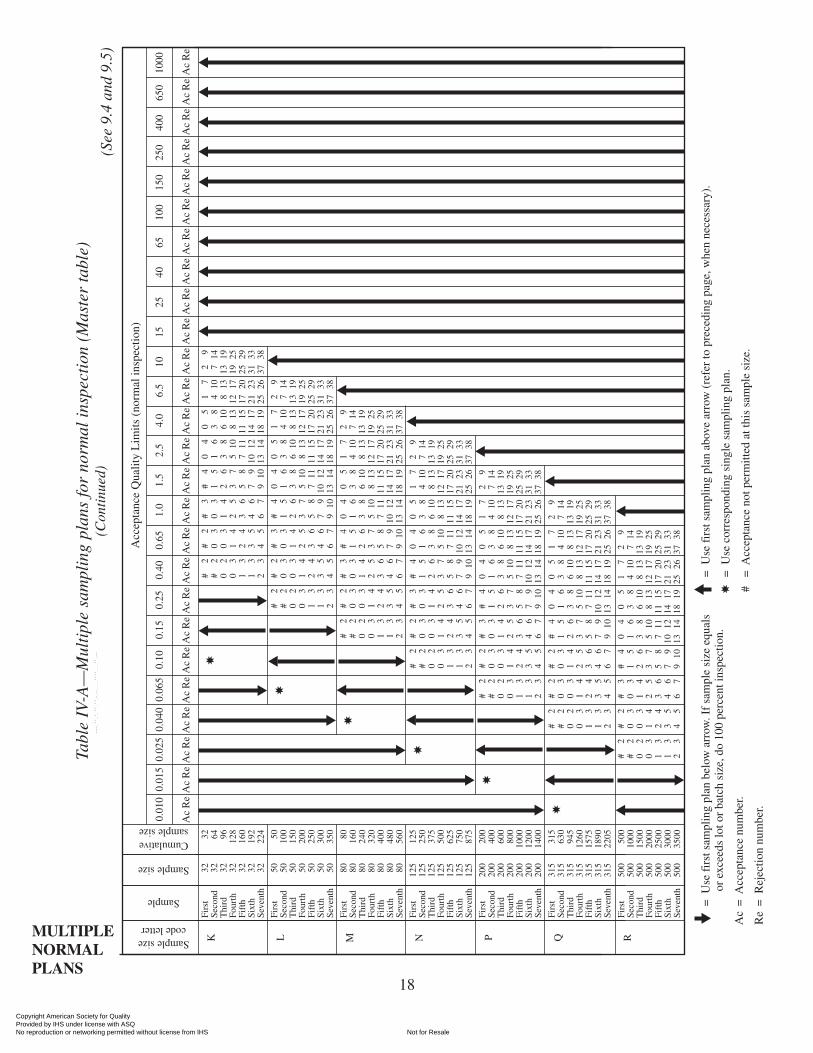
18
Samplesizecodeletter
Sample
Samplesize
Cumulative samplesize
Acc
epta
nce
Qua
lity
Lim
its(n
orm
alin
spec
tion)
K L M N P Q
Firs
tSe
cond
Thi
rdFo
urth
Fift
hSi
xth
Seve
nth
Firs
tSe
cond
Thi
rdFo
urth
Fift
hSi
xth
Seve
nth
Firs
tSe
cond
Thi
rdFo
urth
Fift
hSi
xth
Seve
nth
Firs
tSe
cond
Thi
rdFo
urth
Fift
hSi
xth
Seve
nth
Firs
tSe
cond
Thi
rdFo
urth
Fift
hSi
xth
Seve
nth
50 50 50 50 50 50 50 80 80 80 80 80 80 80 125
125
125
125
125
125
125
200
200
200
200
200
200
200
315
315
315
315
315
315
315
50 100
150
200
250
300
350
Firs
tSe
cond
Thi
rdFo
urth
Fift
hSi
xth
Seve
nth
32 32 32 32 32 32 32
32 64 96 128
160
192
224
2 2 2 3 3 3 3
# # 0 0 1 1 2
2 3 3 4 4 5 5
# 0 0 1 2 3 4
3 3 4 5 6 6 7
# 0 1 2 3 4 6
4 5 6 7 8 9 10
# 1 2 3 5 7 9
4 6 8 10 11 12 14
0 1 3 5 7 10 13
5 8 10 13 15 17 19
0 3 6 8 11 14 18
7 10 13 17 20 23 26
1 4 8 12 17 21 25
9 14 19 25 29 33 38
2 7 13 19 25 31 37
2 2 2 3 3 3 3
# # 0 0 1 1 2
2 3 3 4 4 5 5
# 0 0 1 2 3 4
3 3 4 5 6 6 7
# 0 1 2 3 4 6
4 5 6 7 8 9 10
# 1 2 3 5 7 9
4 6 8 10 11 12 14
0 1 3 5 7 10 13
5 8 10 13 15 17 19
0 3 6 8 11 14 18
7 10 13 17 20 23 26
1 4 8 12 17 21 25
9 14 19 25 29 33 38
2 7 13 19 25 31 37
2 2 2 3 3 3 3
# # 0 0 1 1 2
2 3 3 4 4 5 5
# 0 0 1 2 3 4
3 3 4 5 6 6 7
# 0 1 2 3 4 6
4 5 6 7 8 9 10
# 1 2 3 5 7 9
4 6 8 10 11 12 14
0 1 3 5 7 10 13
5 8 10 13 15 17 19
0 3 6 8 11 14 18
7 10 13 17 20 23 26
1 4 8 12 17 21 25
9 14 19 25 29 33 38
2 7 13 19 25 31 37
2 2 2 3 3 3 3
# # 0 0 1 1 2
2 3 3 4 4 5 5
# 0 0 1 2 3 4
3 3 4 5 6 6 7
# 0 1 2 3 4 6
4 5 6 7 8 9 10
# 1 2 3 5 7 9
4 6 8 10 11 12 14
0 1 3 5 7 10 13
5 8 10 13 15 17 19
0 3 6 8 11 14 18
7 10 13 17 20 23 26
1 4 8 12 17 21 25
9 14 19 25 29 33 38
2 7 13 19 25 31 37
2 2 2 3 3 3 3
# # 0 0 1 1 2
2 3 3 4 4 5 5
# 0 0 1 2 3 4
3 3 4 5 6 6 7
# 0 1 2 3 4 6
4 5 6 7 8 9 10
# 1 2 3 5 7 9
4 6 8 10 11 12 14
0 1 3 5 7 10 13
5 8 10 13 15 17 19
0 3 6 8 11 14 18
7 10 13 17 20 23 26
1 4 8 12 17 21 25
9 14 19 25 29 33 38
2 7 13 19 25 31 37
2 2 2 3 3 3 3
# # 0 0 1 1 2
2 3 3 4 4 5 5
# 0 0 1 2 3 4
2 3 4 5 6 6 7
# 0 1 2 3 4 6
4 5 6 7 8 9 10
# 1 2 3 5 7 9
4 6 8 10 11 12 14
0 1 3 5 7 10 13
5 8 10 13 15 17 19
0 3 6 8 11 14 18
7 10 13 17 20 23 26
1 4 8 12 17 21 25
9 14 19 25 29 33 38
2 7 13 19 25 31 37
2 2 2 3 3 3 3
# # 0 0 1 1 2
2 3 3 4 4 5 5
# 0 0 1 2 3 4
3 3 4 5 6 6 7
# 0 1 2 3 4 6
4 5 6 7 8 9 10
# 1 2 3 5 7 9
4 6 8 10 11 12 14
0 1 3 5 7 10 13
5 8 10 13 15 17 19
0 3 6 8 11 14 18
7 10 13 17 20 23 26
1 4 8 12 17 21 25
9 14 19 25 29 33 38
2 7 13 19 25 31 37
80 160
240
320
400
480
560
125
250
375
500
625
750
875
200
400
600
800
1000
1200
1400 315
630
945
1260
1575
1890
2205
Re
Ac
Re
Ac
Re
Ac
Re
Ac
Re
Ac
Re
Ac
Re
Ac
Re
Ac
Re
Ac
Re
Ac
Re
Ac
Re
Ac
Re
Ac
Re
Ac
Re
Ac
Re
Ac
Re
Ac
Re
Ac
Re
Ac
Re
Ac
Re
Ac
Re
Ac
Re
Ac
Re
Ac
Re
Ac
Re
Ac
0.01
50.
025
0.04
00.
065
0.10
0.15
0.25
0.40
0.65
1.0
1.5
2.5
4.0
6.5
1015
2540
6510
015
025
040
065
010
000.
010
=U
sefi
rsts
ampl
ing
plan
belo
war
row
.If
sam
ple
size
equa
lsor
exce
eds
loto
rba
tch
size
,do
100
perc
enti
nspe
ctio
n.
=A
ccep
tanc
enu
mbe
r.
=R
ejec
tion
num
ber.
Ac
Re
=U
sefi
rsts
ampl
ing
plan
abov
ear
row
(ref
erto
prec
edin
gpa
ge,w
hen
nece
ssar
y).
=U
seco
rres
pond
ing
sing
lesa
mpl
ing
plan
.
=A
ccep
tanc
eno
tper
mitt
edat
this
sam
ple
size
.
X #
(See
9.4
and
9.5)
RFi
rst
Seco
ndT
hird
Four
thFi
fth
Sixt
hSe
vent
h
500
500
500
500
500
500
500
500
1000
1500
2000
2500
3000
3500
X
X
X
X
X
X
MULTIPLENORMALPLANS
TableIV-A—Multiplesamplingplansfornorm
alinspection
(Mastertable)
(Continued)
Copyright American Society for Quality Provided by IHS under license with ASQ
Not for ResaleNo reproduction or networking permitted without license from IHS
--`,,```,,,,````-`-`,,`,,`,`,,`---
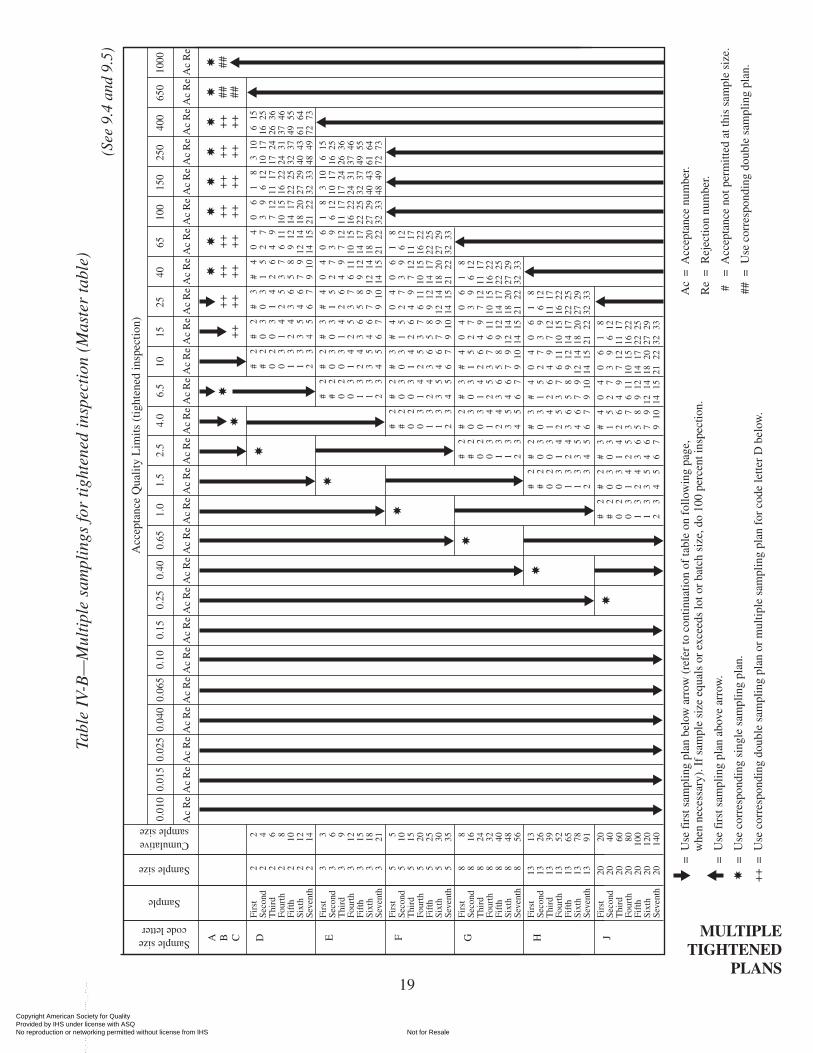
19
TableIV-B—Multiplesamplings
fortightenedinspection
(Mastertable)
Samplesizecodeletter
Sample
Samplesize
Cumulative samplesize
Acc
epta
nce
Qua
lity
Lim
its(t
ight
ened
insp
ectio
n)
A CB D E F G H
Firs
tSe
cond
Thi
rdFo
urth
Fift
hSi
xth
Seve
nth
Firs
tSe
cond
Thi
rdFo
urth
Fift
hSi
xth
Seve
nth
Firs
tSe
cond
Thi
rdFo
urth
Fift
hSi
xth
Seve
nth
Firs
tSe
cond
Thi
rdFo
urth
Fift
hSi
xth
Seve
nth
Firs
tSe
cond
Thi
rdFo
urth
Fift
hSi
xth
Seve
nth
2 2 2 2 2 2 2 3 3 3 3 3 3 3 5 5 5 5 5 5 5 8 8 8 8 8 8 8 13 13 13 13 13 13 13
2 4 6 8 10 12 14
2 2 2 3 3 3 3
# # 0 0 1 1 2
2 3 3 4 4 5 5
# 0 0 1 2 3 4
3 3 4 5 6 6 7
# 0 1 2 3 4 6
4 5 6 7 8 9 10
# 1 2 3 5 7 9
4 7 9 11 12 14 15
0 2 4 6 9 12 14
6 9 12 15 17 20 22
0 3 7 10 14 18 21
8 12 17 22 25 29 33
1 6 11 16 22 27 32
10 17 24 31 37 43 49
3 10 17 24 32 40 48
15 25 36 46 55 64 73
6 16 26 37 49 61 72
2 2 2 3 3 3 3
# # 0 0 1 1 2
2 3 3 4 4 5 5
# 0 0 1 2 3 4
3 3 4 5 6 6 7
# 0 1 2 3 4 6
4 5 6 7 8 9 10
# 1 2 3 5 7 9
4 7 9 11 12 14 15
0 2 4 6 9 12 14
6 9 12 15 17 20 22
0 3 7 10 14 18 21
8 12 17 22 25 29 33
1 6 11 16 22 27 32
2 2 2 3 3 3 3
# # 0 0 1 1 2
2 3 3 4 4 5 5
# 0 0 1 2 3 4
3 3 4 5 6 6 7
# 0 1 2 3 4 6
4 5 6 7 8 9 10
# 1 2 3 5 7 9
4 7 9 11 12 14 15
0 2 4 6 9 12 14
6 9 12 15 17 20 22
0 3 7 10 14 18 21
8 12 17 22 25 29 33
1 6 11 16 22 27 32
2 2 2 3 3 3 3
# # 0 0 1 1 2
2 3 3 4 4 5 5
# 0 0 1 2 3 4
3 3 4 5 6 6 7
# 0 1 2 3 4 6
4 5 6 7 8 9 10
# 1 2 3 5 7 9
4 7 9 11 12 14 15
0 2 4 6 9 12 14
6 9 12 15 17 20 22
0 3 7 10 14 18 21
8 12 17 22 25 29 33
1 6 11 16 22 27 32
2 2 2 3 3 3 3
# # 0 0 1 1 2
2 3 3 4 4 5 5
# 0 0 1 2 3 4
3 3 4 5 6 6 7
# 0 1 2 3 4 6
4 5 6 7 8 9 10
# 1 2 3 5 7 9
4 7 9 11 12 14 15
0 2 4 6 9 12 14
6 9 12 15 17 20 22
0 3 7 10 14 18 21
8 12 17 22 25 29 33
1 6 11 16 22 27 32
3 6 9 12 15 18 21 5 10 15 20 25 30 35 8 16 24 32 40 48 56 13 26 39 52 65 78 91
Re
Ac
Re
Ac
Re
Ac
Re
Ac
Re
Ac
Re
Ac
Re
Ac
Re
Ac
Re
Ac
Re
Ac
Re
Ac
Re
Ac
Re
Ac
Re
Ac
Re
Ac
Re
Ac
Re
Ac
Re
Ac
Re
Ac
Re
Ac
Re
Ac
Re
Ac
Re
Ac
Re
Ac
Re
Ac
Re
Ac
0.01
50.
025
0.04
00.
065
0.10
0.15
0.25
0.40
0.65
1.0
1.5
2.5
4.0
6.5
1015
2540
6510
015
025
040
065
010
000.
010
(See
9.4
and
9.5)
JFi
rst
Seco
ndT
hird
Four
thFi
fth
Sixt
hSe
vent
h
20 20 20 20 20 20 20
20 40 60 80 100
120
140
X
X
X
X
X
X
XX
++
++
++
++
++
++
++
++
++
++
++
++
++
++
++
######
XX
XX
XX
XX
=U
sefi
rsts
ampl
ing
plan
belo
war
row
(ref
erto
cont
inua
tion
ofta
ble
onfo
llow
ing
page
,w
hen
nece
ssar
y).I
fsa
mpl
esi
zeeq
uals
orex
ceed
slo
tor
batc
hsi
ze,d
o10
0pe
rcen
tins
pect
ion.
=U
sefi
rsts
ampl
ing
plan
abov
ear
row
.
=U
seco
rres
pond
ing
sing
lesa
mpl
ing
plan
.
=U
seco
rres
pond
ing
doub
lesa
mpl
ing
plan
orm
ultip
lesa
mpl
ing
plan
for
code
lette
rD
belo
w.
X ++
=A
ccep
tanc
enu
mbe
r.
=R
ejec
tion
num
ber.
=A
ccep
tanc
eno
tper
mitt
edat
this
sam
ple
size
.
=U
seco
rres
pond
ing
doub
lesa
mpl
ing
plan
.
Ac
Re # ##
MULTIPLETIGHTENED
PLANS
Copyright American Society for Quality Provided by IHS under license with ASQ
Not for ResaleNo reproduction or networking permitted without license from IHS
--`,,```,,,,````-`-`,,`,,`,`,,`---
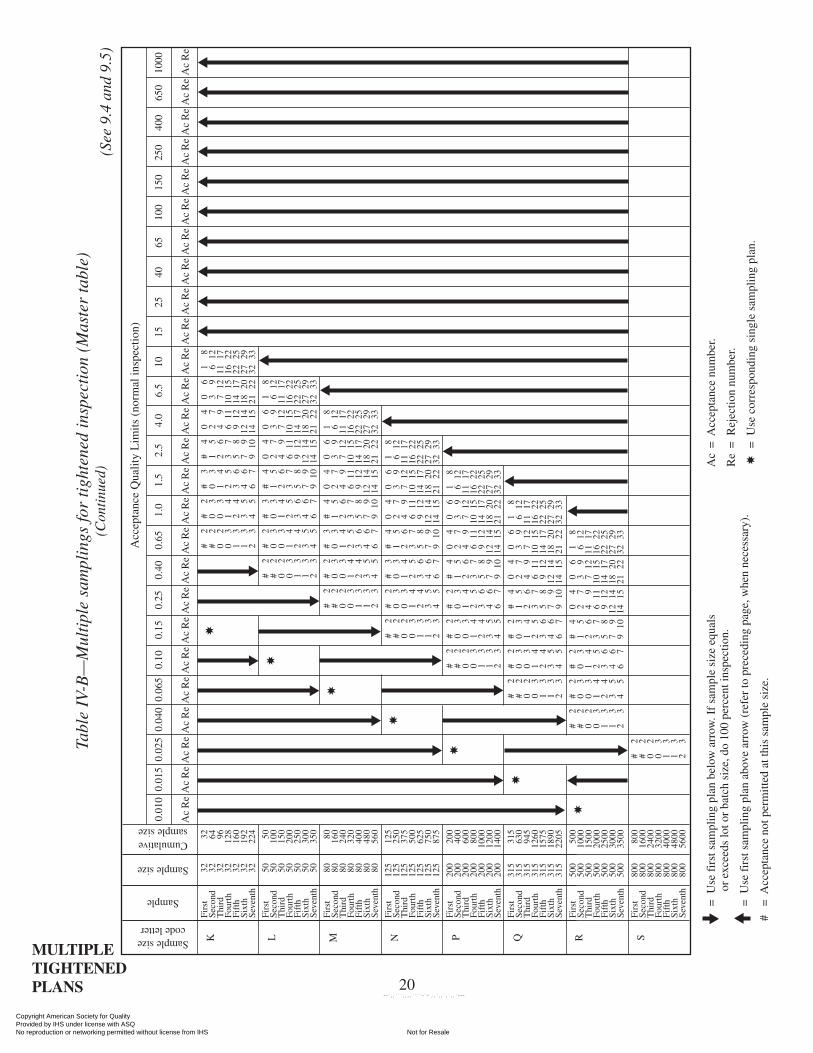
20
Samplesizecodeletter
Sample
Samplesize
Cumulative samplesize
Acc
epta
nce
Qua
lity
Lim
its(n
orm
alin
spec
tion)
K L M N P Q
Firs
tSe
cond
Thi
rdFo
urth
Fift
hSi
xth
Seve
nth
Firs
tSe
cond
Thi
rdFo
urth
Fift
hSi
xth
Seve
nth
Firs
tSe
cond
Thi
rdFo
urth
Fift
hSi
xth
Seve
nth
Firs
tSe
cond
Thi
rdFo
urth
Fift
hSi
xth
Seve
nth
Firs
tSe
cond
Thi
rdFo
urth
Fift
hSi
xth
Seve
nth
50 50 50 50 50 50 50 80 80 80 80 80 80 80 125
125
125
125
125
125
125
200
200
200
200
200
200
200
315
315
315
315
315
315
315
50 100
150
200
250
300
350
Firs
tSe
cond
Thi
rdFo
urth
Fift
hSi
xth
Seve
nth
32 32 32 32 32 32 32
32 64 96 128
160
192
224
2 2 2 3 3 3 3
# # 0 0 1 1 2
2 3 3 4 4 5 5
# 0 0 1 2 3 4
3 3 4 5 6 6 7
# 0 1 2 3 4 6
4 5 6 7 8 9 10
# 1 2 3 5 7 9
4 7 9 11 12 14 15
0 2 4 6 9 12 14
6 9 12 15 17 20 22
0 3 7 10 14 18 21
8 12 17 22 25 29 33
1 6 11 16 22 27 32
2 2 2 3 3 3 3
# # 0 0 1 1 2
2 3 3 4 4 5 5
# 0 0 1 2 3 4
3 3 4 5 6 6 7
# 0 1 2 3 4 6
4 5 6 7 8 9 10
# 1 2 3 5 7 9
4 7 9 11 12 14 15
0 2 4 6 9 12 14
6 9 12 15 17 20 22
0 3 7 10 14 18 21
8 12 17 22 25 29 33
1 6 11 16 22 27 32
2 2 2 3 3 3 3
# # 0 0 1 1 2
2 3 3 4 4 5 5
# 0 0 1 2 3 4
3 3 4 5 6 6 7
# 0 1 2 3 4 6
4 5 6 7 8 9 10
# 1 2 3 5 7 9
4 7 9 11 12 14 15
0 2 4 6 9 12 14
6 9 12 15 17 20 22
0 3 7 10 14 18 21
8 12 17 22 25 29 33
1 6 11 16 22 27 32
2 2 2 3 3 3 3
# # 0 0 1 1 2
2 3 3 4 4 5 5
# 0 0 1 2 3 4
3 3 4 5 6 6 7
# 0 1 2 3 4 6
4 5 6 7 8 9 10
# 1 2 3 5 7 9
4 7 9 11 12 14 15
0 2 4 6 9 12 14
6 9 12 15 17 20 22
0 3 7 10 14 18 21
8 12 17 22 25 29 33
1 6 11 16 22 27 32
2 2 2 3 3 3 3
# # 0 0 1 1 2
2 3 3 4 4 5 5
# 0 0 1 2 3 4
2 3 4 5 6 6 7
# 0 1 2 3 4 6
4 5 6 7 8 9 10
# 1 2 3 5 7 9
4 7 9 11 12 14 15
0 2 4 6 9 12 14
6 9 12 15 17 20 22
0 3 7 10 14 18 21
8 12 17 22 25 29 33
1 6 11 16 22 27 32
2 2 2 3 3 3 3
# # 0 0 1 1 2
2 3 3 4 4 5 5
# 0 0 1 2 3 4
2 3 4 5 6 6 7
# 0 1 2 3 4 6
4 5 6 7 8 9 10
# 1 2 3 5 7 9
4 7 9 11 12 14 15
0 2 4 6 9 12 14
6 9 12 15 17 20 22
0 3 7 10 14 18 21
8 12 17 22 25 29 33
1 6 11 16 22 27 32
2 2 2 3 3 3 3
# # 0 0 1 1 2
2 3 3 4 4 5 5
# 0 0 1 2 3 4
2 3 4 5 6 6 7
# 0 1 2 3 4 6
4 5 6 7 8 9 10
# 1 2 3 5 7 9
4 7 9 11 12 14 15
0 2 4 6 9 12 14
6 9 12 15 17 20 22
0 3 7 10 14 18 21
8 12 17 22 25 29 33
1 6 11 16 22 27 32
80 160
240
320
400
480
560
125
250
375
500
625
750
875
200
400
600
800
1000
1200
1400 315
630
945
1260
1575
1890
2205
Re
Ac
Re
Ac
Re
Ac
Re
Ac
Re
Ac
Re
Ac
Re
Ac
Re
Ac
Re
Ac
Re
Ac
Re
Ac
Re
Ac
Re
Ac
Re
Ac
Re
Ac
Re
Ac
Re
Ac
Re
Ac
Re
Ac
Re
Ac
Re
Ac
Re
Ac
Re
Ac
Re
Ac
Re
Ac
Re
Ac
0.01
50.
025
0.04
00.
065
0.10
0.15
0.25
0.40
0.65
1.0
1.5
2.5
4.0
6.5
1015
2540
6510
015
025
040
065
010
000.
010
=U
sefi
rsts
ampl
ing
plan
belo
war
row
.If
sam
ple
size
equa
lsor
exce
eds
loto
rba
tch
size
,do
100
perc
enti
nspe
ctio
n.
=U
sefi
rsts
ampl
ing
plan
abov
ear
row
(ref
erto
prec
edin
gpa
ge,w
hen
nece
ssar
y).
=A
ccep
tanc
eno
tper
mitt
edat
this
sam
ple
size
.#
=A
ccep
tanc
enu
mbe
r.
=R
ejec
tion
num
ber.
=U
seco
rres
pond
ing
sing
lesa
mpl
ing
plan
.
Ac
Re
X
(See
9.4
and
9.5)
RFi
rst
Seco
ndT
hird
Four
thFi
fth
Sixt
hSe
vent
h
500
500
500
500
500
500
500
500
1000
1500
2000
2500
3000
3500
2 2 2 3 3 3 3
# # 0 0 1 1 2
SFi
rst
Seco
ndT
hird
Four
thFi
fth
Sixt
hSe
vent
h
800
800
800
800
800
800
800
800
1600
2400
3200
4000
4800
5600
X
X
X
X
X
X
X
MULTIPLETIGHTENEDPLANS
TableIV-B—Multiplesamplings
fortightenedinspection
(Mastertable)
(Continued)
Copyright American Society for Quality Provided by IHS under license with ASQ
Not for ResaleNo reproduction or networking permitted without license from IHS
--`,,```,,,,````-`-`,,`,,`,`,,`---
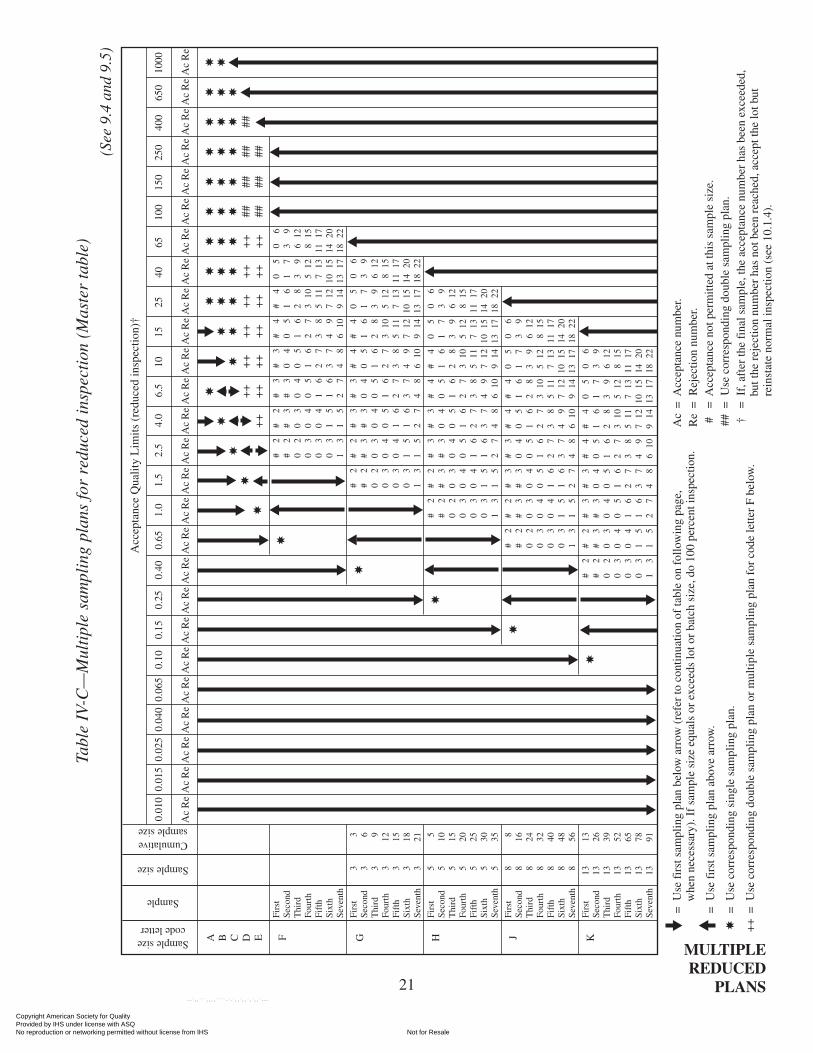
21
Samplesizecodeletter
Sample
Samplesize
Cumulative samplesize
Acc
epta
nce
Qua
lity
Lim
its(r
educ
edin
spec
tion)
†
A CB ED G H J KFFi
rst
Seco
ndT
hird
Four
thFi
fth
Sixt
hSe
vent
h
Firs
tSe
cond
Thi
rdFo
urth
Fift
hSi
xth
Seve
nth
Firs
tSe
cond
Thi
rdFo
urth
Fift
hSi
xth
Seve
nth
Firs
tSe
cond
Thi
rdFo
urth
Fift
hSi
xth
Seve
nth
Firs
tSe
cond
Thi
rdFo
urth
Fift
hSi
xth
Seve
nth
3 3 3 3 3 3 3 5 5 5 5 5 5 5 8 8 8 8 8 8 8 13 13 13 13 13 13 13
2 3 3 4 4 5 5
# # 0 0 0 1 1
3 3 4 5 6 6 7
# # 0 0 1 1 2
3 4 5 6 7 7 8
# 0 0 1 2 3 4
4 5 6 7 8 9 10
# 0 1 2 3 4 6
4 6 8 10 11 12 14
# 1 2 3 5 7 9
5 7 9 12 13 15 17
0 1 3 5 7 10 13
2 3 3 4 4 5 5
# # 0 0 0 1 1
3 3 4 5 6 6 7
# # 0 0 1 1 2
3 4 5 6 7 7 8
# 0 0 1 2 3 4
4 5 6 7 8 9 10
# 0 1 2 3 4 6
4 6 8 10 11 12 14
# 1 2 3 5 7 9
5 7 9 12 13 15 17
0 1 3 5 7 10 13
2 3 3 4 4 5 5
# # 0 0 0 1 1
3 3 4 5 6 6 7
# # 0 0 1 1 2
3 4 5 6 7 7 8
# 0 0 1 2 3 4
4 5 6 7 8 9 10
# 0 1 2 3 4 6
4 6 8 10 11 12 14
# 1 2 3 5 7 9
5 7 9 12 13 15 17
0 1 3 5 7 10 13
2 3 3 4 4 5 5
# # 0 0 0 1 1
3 3 4 5 6 6 7
# # 0 0 1 1 2
3 4 5 6 7 7 8
# 0 0 1 2 3 4
4 5 6 7 8 9 10
# 0 1 2 3 4 6
4 6 8 10 11 12 14
# 1 2 3 5 7 9
5 7 9 12 13 15 17
0 1 3 5 7 10 13
2 3 3 4 4 5 5
# # 0 0 0 1 1
2 2 2 3 3 3 3
# # 0 0 0 0 1
2 2 2 3 3 3 3
# # 0 0 0 0 1
2 2 2 3 3 3 3
# # 0 0 0 0 1
2 2 2 3 3 3 3
# # 0 0 0 0 1
2 2 2 3 3 3 3
# # 0 0 0 0 1
3 3 4 5 6 6 7
# # 0 0 1 1 2
3 4 5 6 7 7 8
# 0 0 1 2 3 4
4 5 6 7 8 9 10
# 0 1 2 3 4 6
4 6 8 10 11 12 14
# 1 2 3 5 7 9
5 7 9 12 13 15 17
0 1 3 5 7 10 13
6 9 12 15 17 20 22
0 3 6 8 11 14 18
6 9 12 15 17 20 22
0 3 6 8 11 14 18
6 9 12 15 17 20 22
0 3 6 8 11 14 18
6 9 12 15 17 20 22
0 3 6 8 11 14 18
6 9 12 15 17 20 22
0 3 6 8 11 14 18
3 6 9 12 15 18 21 5 10 15 20 25 30 35 8 16 24 32 40 48 56 13 26 39 52 65 78 91
Re
Ac
Re
Ac
Re
Ac
Re
Ac
Re
Ac
Re
Ac
Re
Ac
Re
Ac
Re
Ac
Re
Ac
Re
Ac
Re
Ac
Re
Ac
Re
Ac
Re
Ac
Re
Ac
Re
Ac
Re
Ac
Re
Ac
Re
Ac
Re
Ac
Re
Ac
Re
Ac
Re
Ac
Re
Ac
Re
Ac
0.01
50.
025
0.04
00.
065
0.10
0.15
0.25
0.40
0.65
1.0
1.5
2.5
4.0
6.5
1015
2540
6510
015
025
040
065
010
000.
010
(See
9.4
and
9.5)
X
X
X
X
X
XX
XX
XX
XX
XX
XX
XX
X
++
++
X+
+X+
+X+
+X##X
##X##X
##XX
++
++
++
++
++
X
++
++
++
####
##
XX
XX
XX
XX
X
=U
sefi
rsts
ampl
ing
plan
belo
war
row
(ref
erto
cont
inua
tion
ofta
ble
onfo
llow
ing
page
,w
hen
nece
ssar
y).I
fsa
mpl
esi
zeeq
uals
orex
ceed
slo
tor
batc
hsi
ze,d
o10
0pe
rcen
tins
pect
ion.
=U
sefi
rsts
ampl
ing
plan
abov
ear
row
.
=U
seco
rres
pond
ing
sing
lesa
mpl
ing
plan
.
=U
seco
rres
pond
ing
doub
lesa
mpl
ing
plan
orm
ultip
lesa
mpl
ing
plan
for
code
lette
rF
belo
w.
X ++
=A
ccep
tanc
enu
mbe
r.=
Rej
ectio
nnu
mbe
r.=
Acc
epta
nce
notp
erm
itted
atth
issa
mpl
esi
ze.
=U
seco
rres
pond
ing
doub
lesa
mpl
ing
plan
.=
If,a
fter
the
fina
lsam
ple,
the
acce
ptan
cenu
mbe
rha
sbe
enex
ceed
ed,
butt
here
ject
ion
num
ber
has
notb
een
reac
hed,
acce
ptth
elo
tbut
rein
stat
eno
rmal
insp
ectio
n(s
ee10
.1.4
).
Ac
Re # ## †
MULTIPLEREDUCED
PLANS
TableIV-C—Multiplesamplingplansforreducedinspection
(Mastertable)
Copyright American Society for Quality Provided by IHS under license with ASQ
Not for ResaleNo reproduction or networking permitted without license from IHS
--`,,```,,,,````-`-`,,`,,`,`,,`---
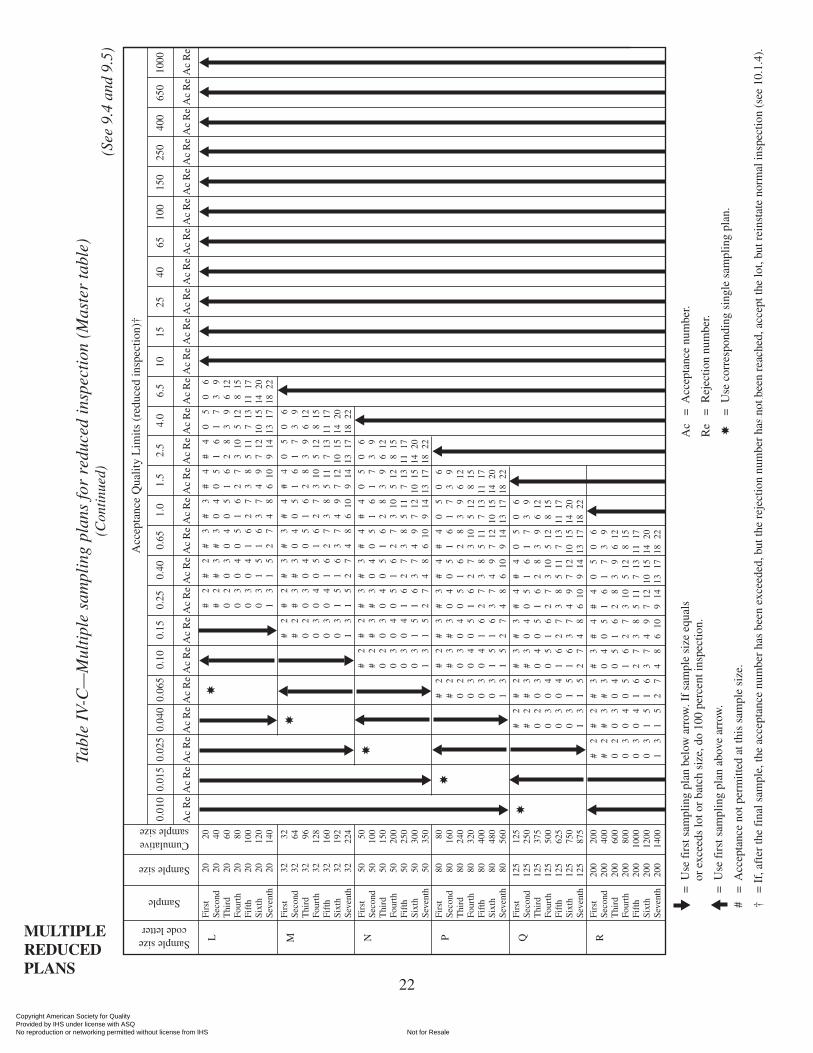
22
Samplesizecodeletter
Sample
Samplesize
Cumulative samplesize
Acc
epta
nce
Qua
lity
Lim
its(r
educ
edin
spec
tion)
†
L M N P Q R
Firs
tSe
cond
Thi
rdFo
urth
Fift
hSi
xth
Seve
nth
Firs
tSe
cond
Thi
rdFo
urth
Fift
hSi
xth
Seve
nth
Firs
tSe
cond
Thi
rdFo
urth
Fift
hSi
xth
Seve
nth
Firs
tSe
cond
Thi
rdFo
urth
Fift
hSi
xth
Seve
nth
Firs
tSe
cond
Thi
rdFo
urth
Fift
hSi
xth
Seve
nth
32 32 32 32 32 32 32 50 50 50 50 50 50 50 80 80 80 80 80 80 80 125
125
125
125
125
125
125
200
200
200
200
200
200
200
32 64 96 128
160
192
224
Firs
tSe
cond
Thi
rdFo
urth
Fift
hSi
xth
Seve
nth
20 20 20 20 20 20 20
20 40 60 80 100
120
140
2 2 2 3 3 3 3
# # 0 0 0 0 1
2 3 3 4 4 5 5
# # 0 0 0 1 1
3 3 4 5 6 6 7
# # 0 0 1 1 2
3 4 5 6 7 7 8
# 0 0 1 2 3 4
4 5 6 7 8 9 10
# 0 1 2 3 4 6
4 6 8 10 11 12 14
# 1 2 3 5 7 9
5 7 9 12 13 15 17
0 1 3 5 7 10 13
6 9 12 15 17 20 22
0 3 6 8 11 14 18
2 2 2 3 3 3 3
# # 0 0 0 0 1
2 3 3 4 4 5 5
# # 0 0 0 1 1
3 3 4 5 6 6 7
# # 0 0 1 1 2
3 4 5 6 7 7 8
# 0 0 1 2 3 4
4 5 6 7 8 9 10
# 0 1 2 3 4 6
4 6 8 10 11 12 14
# 1 2 3 5 7 9
5 7 9 12 13 15 17
0 1 3 5 7 10 13
6 9 12 15 17 20 22
0 3 6 8 11 14 18
2 2 2 3 3 3 3
# # 0 0 0 0 1
2 3 3 4 4 5 5
# # 0 0 0 1 1
3 3 4 5 6 6 7
# # 0 0 1 1 2
3 4 5 6 7 7 8
# 0 0 1 2 3 4
4 5 6 7 8 9 10
# 0 1 2 3 4 6
4 6 8 10 11 12 14
# 1 2 3 5 7 9
5 7 9 12 13 15 17
0 1 3 5 7 10 13
6 9 12 15 17 20 22
0 3 6 8 11 14 18
2 2 2 3 3 3 3
# # 0 0 0 0 1
2 3 3 4 4 5 5
# # 0 0 0 1 1
3 3 4 5 6 6 7
# # 0 0 1 1 2
3 4 5 6 7 7 8
# 0 0 1 2 3 4
4 5 6 7 8 9 10
# 0 1 2 3 4 6
4 6 8 10 11 12 14
# 1 2 3 5 7 9
5 7 9 12 13 15 17
0 1 3 5 7 10 13
6 9 12 15 17 20 22
0 3 6 8 11 14 18
2 2 2 3 3 3 3
# # 0 0 0 0 1
2 3 3 4 4 5 5
# # 0 0 0 1 1
3 3 4 5 6 6 7
# # 0 0 1 1 2
3 4 5 6 7 7 8
# 0 0 1 2 3 4
4 5 6 7 8 9 10
# 0 1 2 3 4 6
4 6 8 10 11 12 14
# 1 2 3 5 7 9
5 7 9 12 13 15 17
0 1 3 5 7 10 13
6 9 12 15 17 20 22
0 3 6 8 11 14 18
2 2 2 3 3 3 3
# # 0 0 0 0 1
2 3 3 4 4 5 5
# # 0 0 0 1 1
3 3 4 5 6 6 7
# # 0 0 1 1 2
3 4 5 6 7 7 8
# 0 0 1 2 3 4
4 5 6 7 8 9 10
# 0 1 2 3 4 6
4 6 8 10 11 12 14
# 1 2 3 5 7 9
5 7 9 12 13 15 17
0 1 3 5 7 10 13
6 9 12 15 17 20 22
0 3 6 8 11 14 18
50 100
150
200
250
300
350 80 160
240
320
400
480
560
125
250
375
500
625
750
875
200
400
600
800
1000
1200
1400
Re
Ac
Re
Ac
Re
Ac
Re
Ac
Re
Ac
Re
Ac
Re
Ac
Re
Ac
Re
Ac
Re
Ac
Re
Ac
Re
Ac
Re
Ac
Re
Ac
Re
Ac
Re
Ac
Re
Ac
Re
Ac
Re
Ac
Re
Ac
Re
Ac
Re
Ac
Re
Ac
Re
Ac
Re
Ac
Re
Ac
0.01
50.
025
0.04
00.
065
0.10
0.15
0.25
0.40
0.65
1.0
1.5
2.5
4.0
6.5
1015
2540
6510
015
025
040
065
010
000.
010
=U
sefi
rsts
ampl
ing
plan
belo
war
row
.If
sam
ple
size
equa
lsor
exce
eds
loto
rba
tch
size
,do
100
perc
enti
nspe
ctio
n.
=U
sefi
rsts
ampl
ing
plan
abov
ear
row
.
=A
ccep
tanc
eno
tper
mitt
edat
this
sam
ple
size
.
=If
,aft
erth
efi
nals
ampl
e,th
eac
cept
ance
num
ber
has
been
exce
eded
,but
the
reje
ctio
nnu
mbe
rha
sno
tbee
nre
ache
d,ac
cept
the
lot,
butr
eins
tate
norm
alin
spec
tion
(see
10.1
.4).
# †
(See
9.4
and
9.5)
X
X
X
X
X
=A
ccep
tanc
enu
mbe
r.
=R
ejec
tion
num
ber.
=U
seco
rres
pond
ing
sing
lesa
mpl
ing
plan
.
Ac
Re
X
TableIV-C—Multiplesamplingplansforreducedinspection
(Mastertable)
(Continued)
MULTIPLEREDUCEDPLANS
Copyright American Society for Quality Provided by IHS under license with ASQ
Not for ResaleNo reproduction or networking permitted without license from IHS
--`,,```,,,,````-`-`,,`,,`,`,,`---
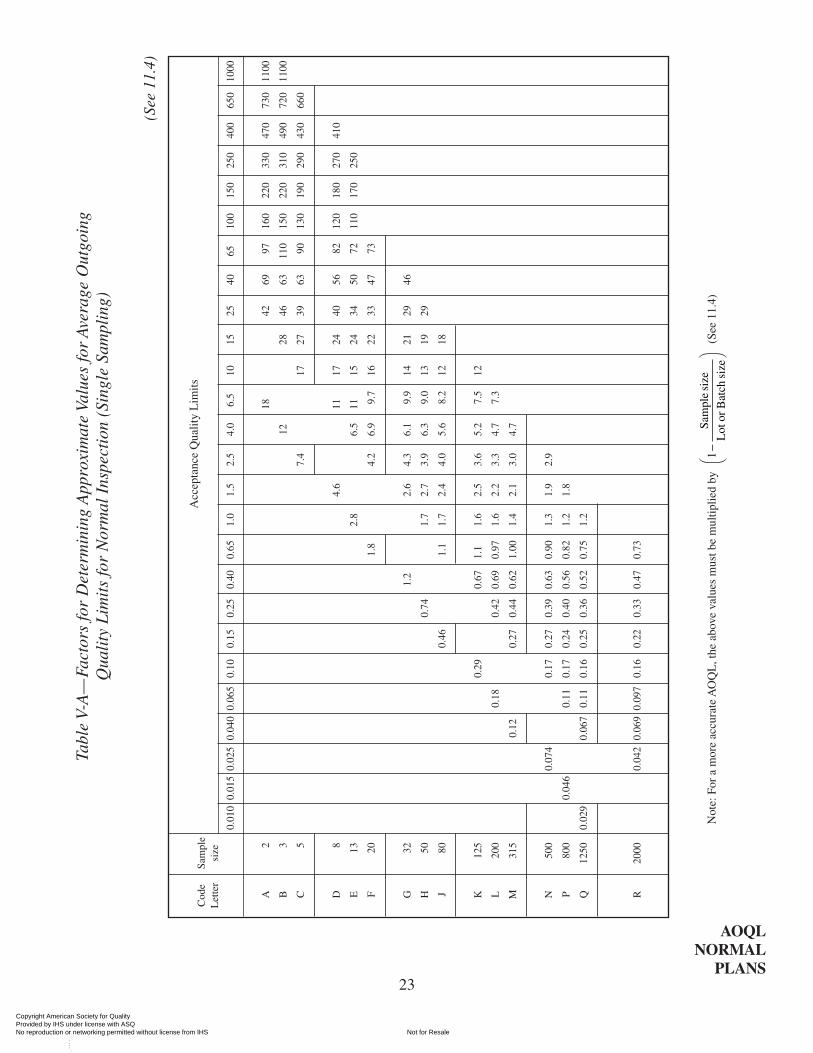
23
TableV-A—Fa
ctorsforDeterminingApproximateVa
lues
forAverageOutgoing
QualityLimitsforNormal
Inspection
(SingleSampling)
Cod
eL
ette
rSa
mpl
esi
ze
Acc
epta
nce
Qua
lity
Lim
its
A B C D E F G H J K L M N P Q R
2 3 5 8 13 20 32 50 80 125
200
315
500
800
1250
2000
0.02
9
0.04
6
0.07
4
0.04
2
0.12
0.06
7
0.06
9
0.18
0.11
0.11
0.09
7
0.29
0.17
0.17
0.16
0.16
0.46
0.27
0.27
0.24
0.25
0.22
0.74
0.42
0.44
0.39
0.40
0.36
0.33
1.2
0.67
0.69
0.62
0.63
0.56
0.52
0.47
1.8
1.1
1.1
0.97
1.00
0.90
0.82
0.75
0.73
2.8
1.7
1.7
1.6
1.6
1.4
1.3
1.2
1.2
4.6
2.6
2.7
2.4
2.5
2.2
2.1
1.9
1.8
7.4
4.2
4.3
3.9
4.0
3.6
3.3
3.0
2.9
12 6.5
6.9
6.1
6.3
5.6
5.2
4.7
4.7
18 11 11 9.7
9.9
9.0
8.2
7.5
7.3
17 17 15 16 14 13 12 12
28 27 24 24 22 21 19 18
42 46 39 40 34 33 29 29
69 63 63 56 50 47 46
97 110 90 82 72 73
160
150
130
120
110
220
220
190
180
170
330
310
290
270
250
470
490
430
410
730
720
660
1100
1100
0.01
50.
025
0.04
00.
065
0.10
0.15
0.25
0.40
0.65
1.0
1.5
2.5
4.0
6.5
1015
2540
6510
015
025
040
065
010
000.
010
(See
11.4
)
Not
e:Fo
ra
mor
eac
cura
teA
OQ
L,t
heab
ove
valu
esm
ustb
em
ultip
lied
by(S
ee11
.4)
1−
Sam
ple
size
Lot
orB
atch
size
AOQLNORMALPLANS
Copyright American Society for Quality Provided by IHS under license with ASQ
Not for ResaleNo reproduction or networking permitted without license from IHS
--`,,```,,,,````-`-`,,`,,`,`,,`---
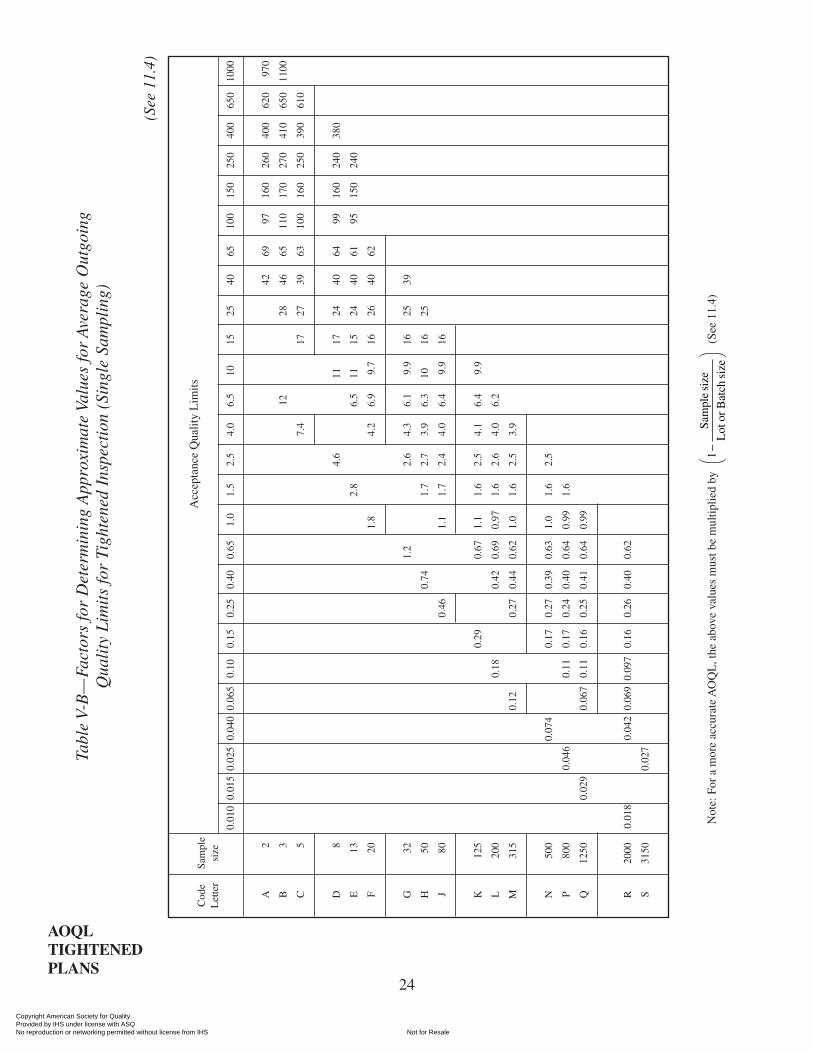
24
TableV-B—Fa
ctorsforDeterminingApproximateVa
lues
forAverageOutgoing
QualityLimitsforTightenedInspection
(SingleSampling)
Cod
eL
ette
rSa
mpl
esi
ze
Acc
epta
nce
Qua
lity
Lim
its
A B C D E F G H J K L M N P Q R S
2 3 5 8 13 20 32 50 80 125
200
315
500
800
1250
2000
3150
0.01
8
0.02
9
0.04
6
0.07
4
0.02
7
0.04
2
0.12
0.06
7
0.06
9
0.18
0.11
0.11
0.09
7
0.29
0.17
0.17
0.16
0.16
0.46
0.27
0.27
0.24
0.25
0.26
0.74
0.42
0.44
0.39
0.40
0.41
0.40
1.2
0.67
0.69
0.62
0.63
0.64
0.64
0.62
1.8
1.1
1.1
0.97
1.0
1.0
0.99
0.99
2.8
1.7
1.7
1.6
1.6
1.6
1.6
1.6
4.6
2.6
2.7
2.4
2.5
2.6
2.5
2.5
7.4
4.2
4.3
3.9
4.0
4.1
4.0
3.9
12 6.5
6.9
6.1
6.3
6.4
6.4
6.2
11 11 9.7
9.9
10 9.9
9.9
17 17 15 16 16 16 16
28 27 24 24 26 25 25
42 46 39 40 40 40 39
69 65 63 64 61 62
97 110
100 99 95
160
170
160
160
150
260
270
250
240
240
400
410
390
380
620
650
610
970
1100
0.01
50.
025
0.04
00.
065
0.10
0.15
0.25
0.40
0.65
1.0
1.5
2.5
4.0
6.5
1015
2540
6510
015
025
040
065
010
000.
010
(See
11.4
)
Not
e:Fo
ra
mor
eac
cura
teA
OQ
L,t
heab
ove
valu
esm
ustb
em
ultip
lied
by(S
ee11
.4)
1−
Sam
ple
size
Lot
orB
atch
size
AOQLTIGHTENEDPLANS
Copyright American Society for Quality Provided by IHS under license with ASQ
Not for ResaleNo reproduction or networking permitted without license from IHS
--`,,```,,,,````-`-`,,`,,`,`,,`---
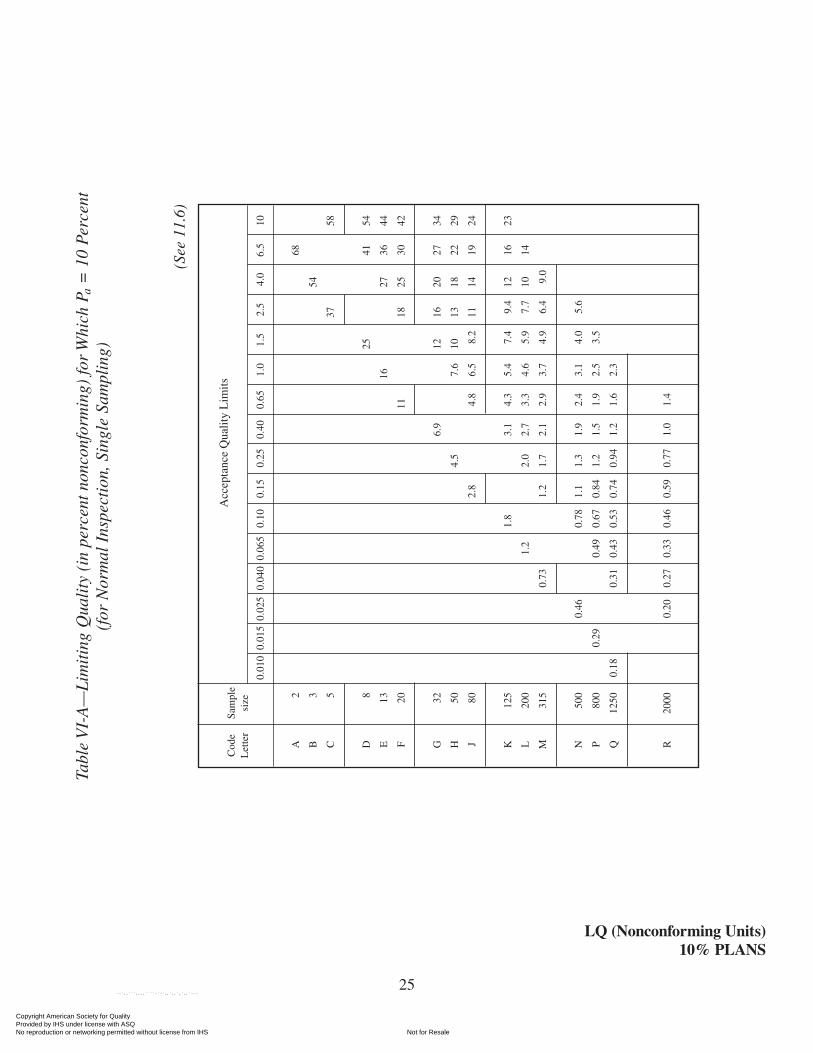
25
TableVI-A—LimitingQuality(inpercentnonconform
ing)
forWhich
P a=10
Percent
(for
Normal
Inspection,S
ingleSampling)
Cod
eL
ette
rSa
mpl
esi
ze
Acc
epta
nce
Qua
lity
Lim
its
A B C D E F G H J K L M N P Q R
2 3 5 8 13 20 32 50 80 125
200
315
500
800
1250
2000
0.18
0.29
0.46
0.20
0.73
0.31
0.27
1.2
0.49
0.43
0.33
1.8
0.78
0.67
0.53
0.46
2.8
1.2
1.1
0.84
0.74
0.59
4.5
2.0
1.7
1.3
1.2
0.94
0.77
6.9
3.1
2.7
2.1
1.9
1.5
1.2
1.0
11 4.8
4.3
3.3
2.9
2.4
1.9
1.6
1.4
16 7.6
6.5
5.4
4.6
3.7
3.1
2.5
2.3
25 12 10 8.2
7.4
5.9
4.9
4.0
3.5
37 18 16 13 11 9.4
7.7
6.4
5.6
54 27 25 20 18 14 12 10 9.0
68 41 36 30 27 22 19 16 14
58 54 44 42 34 29 24 23
0.01
50.
025
0.04
00.
065
0.10
0.15
0.25
0.40
0.65
1.0
1.5
2.5
4.0
6.5
100.
010
(See
11.6
)
LQ (Nonconforming Units)10% PLANS
Copyright American Society for Quality Provided by IHS under license with ASQ
Not for ResaleNo reproduction or networking permitted without license from IHS
--`,,```,,,,````-`-`,,`,,`,`,,`---
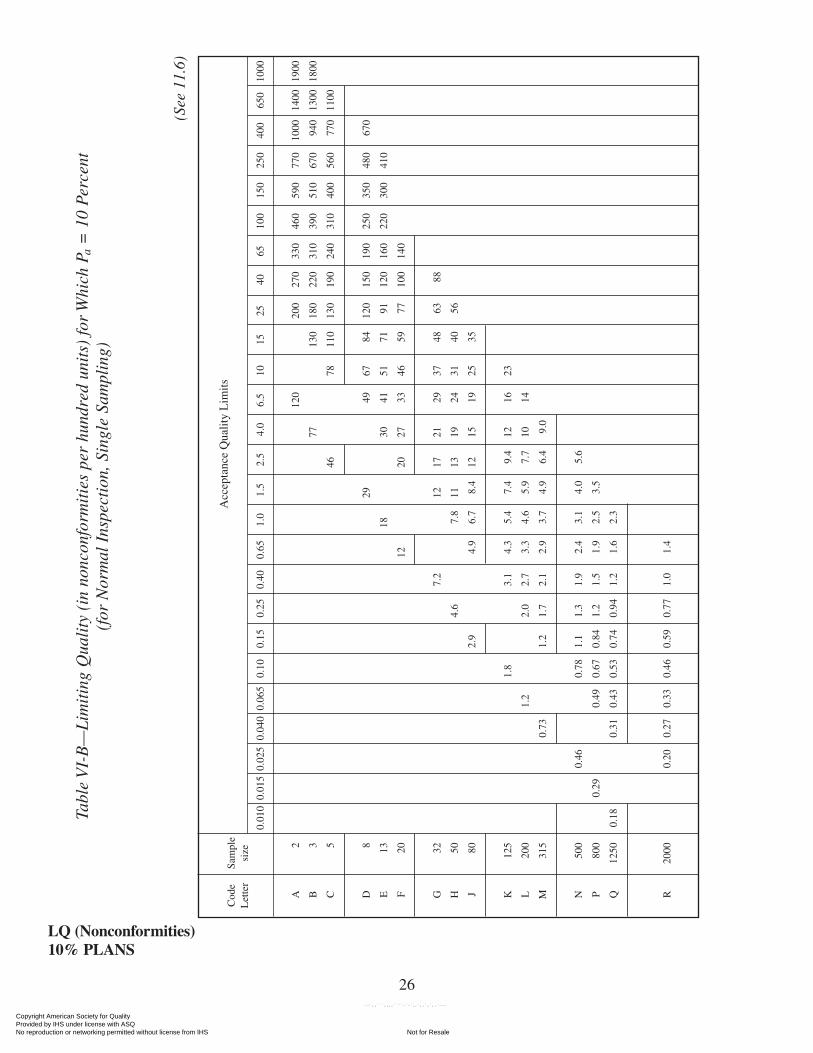
26
TableVI-B—LimitingQuality(innonconform
itiesperhundredun
its)forWhich
P a=10
Percent
(for
Normal
Inspection,S
ingleSampling)
Cod
eL
ette
rSa
mpl
esi
ze
Acc
epta
nce
Qua
lity
Lim
its
A B C D E F G H J K L M N P Q R
2 3 5 8 13 20 32 50 80 125
200
315
500
800
1250
2000
0.18
0.29
0.46
0.20
0.73
0.31
0.27
1.2
0.49
0.43
0.33
1.8
0.78
0.67
0.53
0.46
2.9
1.2
1.1
0.84
0.74
0.59
4.6
2.0
1.7
1.3
1.2
0.94
0.77
7.2
3.1
2.7
2.1
1.9
1.5
1.2
1.0
12 4.9
4.3
3.3
2.9
2.4
1.9
1.6
1.4
18 7.8
6.7
5.4
4.6
3.7
3.1
2.5
2.3
29 12 11 8.4
7.4
5.9
4.9
4.0
3.5
46 20 17 13 12 9.4
7.7
6.4
5.6
77 30 27 21 19 15 12 10 9.0
120 49 41 33 29 24 19 16 14
78 67 51 46 37 31 25 23
130
110 84 71 59 48 40 35
200
180
130
120 91 77 63 56
270
220
190
150
120
100 88
330
310
240
190
160
140
460
390
310
250
220
590
510
400
350
300
770
670
560
480
410
1000 940
770
670
1400
1300
1100
1900
1800
0.01
50.
025
0.04
00.
065
0.10
0.15
0.25
0.40
0.65
1.0
1.5
2.5
4.0
6.5
1015
2540
6510
015
025
040
065
010
000.
010
(See
11.6
)
LQ (Nonconformities)10% PLANS
Copyright American Society for Quality Provided by IHS under license with ASQ
Not for ResaleNo reproduction or networking permitted without license from IHS
--`,,```,,,,````-`-`,,`,,`,`,,`---
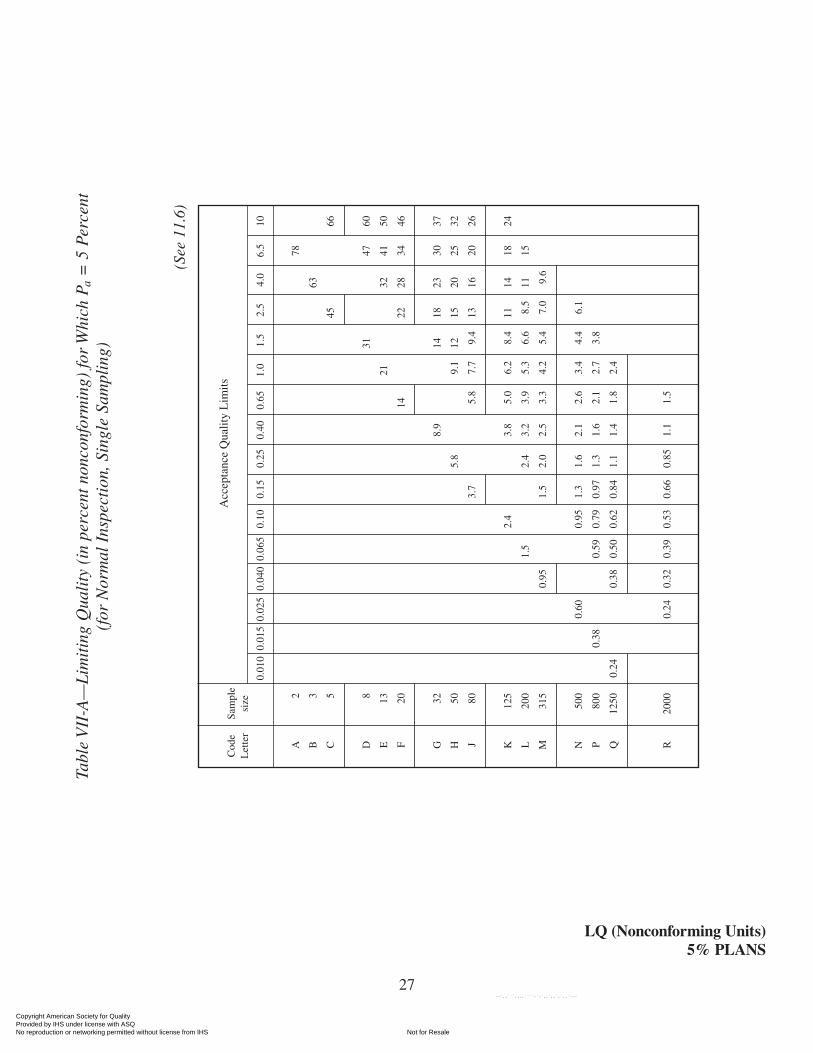
27
TableVII-A—LimitingQuality(inpercentnonconform
ing)
forWhich
P a=5Percent
(for
Normal
Inspection,S
ingleSampling)
Cod
eL
ette
rSa
mpl
esi
ze
Acc
epta
nce
Qua
lity
Lim
its
A B C D E F G H J K L M N P Q R
2 3 5 8 13 20 32 50 80 125
200
315
500
800
1250
2000
0.24
0.38
0.60
0.24
0.95
0.38
0.32
1.5
0.59
0.50
0.39
2.4
0.95
0.79
0.62
0.53
3.7
1.5
1.3
0.97
0.84
0.66
5.8
2.4
2.0
1.6
1.3
1.1
0.85
8.9
3.8
3.2
2.5
2.1
1.6
1.4
1.1
14 5.8
5.0
3.9
3.3
2.6
2.1
1.8
1.5
21 9.1
7.7
6.2
5.3
4.2
3.4
2.7
2.4
31 14 12 9.4
8.4
6.6
5.4
4.4
3.8
45 22 18 15 13 11 8.5
7.0
6.1
63 32 28 23 20 16 14 11 9.6
78 47 41 34 30 25 20 18 15
66 60 50 46 37 32 26 24
0.01
50.
025
0.04
00.
065
0.10
0.15
0.25
0.40
0.65
1.0
1.5
2.5
4.0
6.5
100.
010
(See
11.6
)
LQ (Nonconforming Units)5% PLANS
Copyright American Society for Quality Provided by IHS under license with ASQ
Not for ResaleNo reproduction or networking permitted without license from IHS
--`,,```,,,,````-`-`,,`,,`,`,,`---
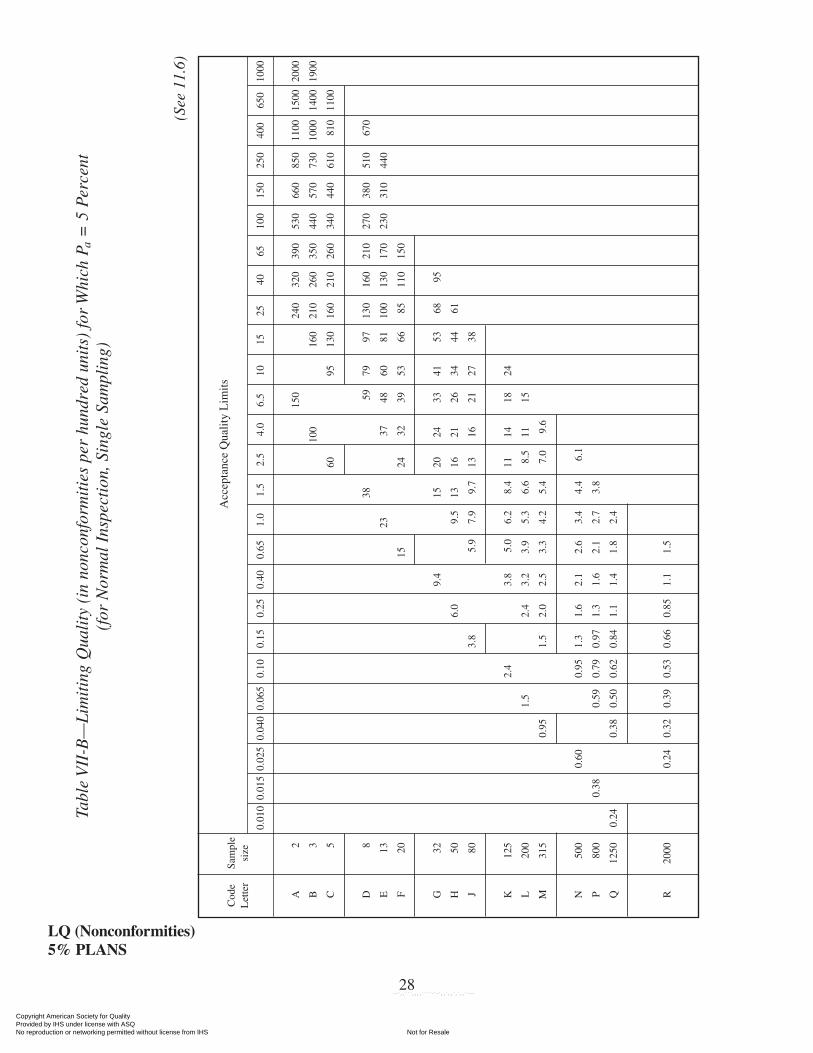
28
TableVII-B—LimitingQuality(innonconform
itiesperhundredunits)forWhich
P a=5Percent
(for
Normal
Inspection,S
ingleSampling)
Cod
eL
ette
rSa
mpl
esi
ze
Acc
epta
nce
Qua
lity
Lim
its
A B C D E F G H J K L M N P Q R
2 3 5 8 13 20 32 50 80 125
200
315
500
800
1250
2000
0.24
0.38
0.60
0.24
0.95
0.38
0.32
1.5
0.59
0.50
0.39
2.4
0.95
0.79
0.62
0.53
3.8
1.5
1.3
0.97
0.84
0.66
6.0
2.4
2.0
1.6
1.3
1.1
0.85
9.4
3.8
3.2
2.5
2.1
1.6
1.4
1.1
15 5.9
5.0
3.9
3.3
2.6
2.1
1.8
1.5
23 9.5
7.9
6.2
5.3
4.2
3.4
2.7
2.4
38 15 13 9.7
8.4
6.6
5.4
4.4
3.8
60 24 20 16 13 11 8.5
7.0 6.1
100 37 32 24 21 16 14 11 9.
6
150 59 48 39 33 26 21 18 15
95 79 60 53 41 34 27 24
160
130 97 81 66 53 44 38
240
210
160
130
100 85 68 61
320
260
210
160
130
110 95
390
350
260
210
170
150
530
440
340
270
230
660
570
440
380
310
850
730
610
510
440
1100
1000 810
670
1500
1400
1100
2000
1900
0.01
50.
025
0.04
00.
065
0.10
0.15
0.25
0.40
0.65
1.0
1.5
2.5
4.0
6.5
1015
2540
6510
015
025
040
065
010
000.
010
(See
11.6
)
LQ (Nonconformities)5% PLANS
Copyright American Society for Quality Provided by IHS under license with ASQ
Not for ResaleNo reproduction or networking permitted without license from IHS
--`,,```,,,,````-`-`,,`,,`,`,,`---
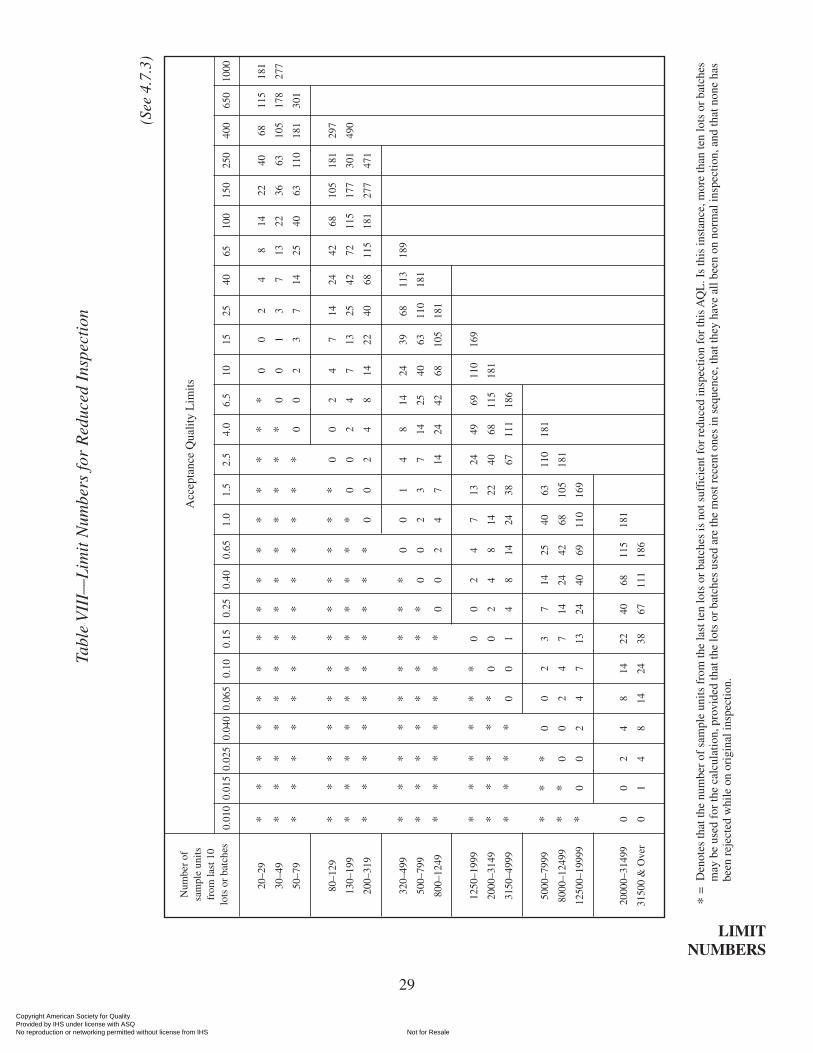
29
TableVIII—
LimitNum
bers
forReduced
Inspection
Num
ber
ofsa
mpl
eun
itsfr
omla
st10
lots
orba
tche
s
Acc
epta
nce
Qua
lity
Lim
its
20–2
9
30–4
9
50–7
9
80–1
29
130–
199
200–
319
320–
499
500–
799
800–
1249
1250
–199
9
2000
–314
9
3150
–499
9
5000
–799
9
8000
–124
99
1250
0–19
999
2000
0–31
499
3150
0&
Ove
r
* * * * * * * * * * * *
* * * * * * * * * * * *
* * * * * * * * * * * *
* * * * * * * * * * * *
* * * * * * * * * * * 0
* * * * * * * * * * 0 0
* * * * * *
* * *
* * *
* * *
* * * 0 0
0 1* * 0
* 0 0 2 4
0 0 2 4 8
0 2 4 8 14
2 4 7 14 24
0 0 1 3 7 13 22 38
* * 0 0 2 4 7 14 24 40 67
* 0 0 2 4 8 14 24 40 68 111
* * * 0 0 2 4 8 14 25 42 69 115
186
181* * 0 0 2 4 7 14 24 40 68 110
* 0 0 1 3 7 13 22 38 63 105
169
* * *
* * *
* * *
* * *
* * *
* * *
0 0 2 4 7 14 24 40 67 110
181
* * 0 0 2 4 8 14 24 49 68 111
* 0 0 2 4 8 14 25 42 69 115
186
0 0 2 4 7 14 24 40 68 110
181
0 1 3 7 13 22 39 63 105
2 3 7 14 25 40 68 110
181
4 7 14 24 42 68 113
181
181
169
1898 13 25 42 72 115
14 22 40 68 115
181
22 36 63 105
177
277
40 63 110
181
301
471
68 105
181
297
490
115
178
301
181
277
0.01
50.
025
0.04
00.
065
0.10
0.15
0.25
0.40
0.65
1.0
1.5
2.5
4.0
6.5
1015
2540
6510
015
025
040
065
010
000.
010
(See
4.7.
3)
=D
enot
esth
atth
enu
mbe
rof
sam
ple
units
from
the
last
ten
lots
orba
tche
sis
nots
uffi
cien
tfor
redu
ced
insp
ectio
nfo
rth
isA
QL
.Is
this
inst
ance
,mor
eth
ante
nlo
tsor
batc
hes
may
beus
edfo
rth
eca
lcul
atio
n,pr
ovid
edth
atth
elo
tsor
batc
hes
used
are
the
mos
trec
ento
nes
inse
quen
ce,t
hatt
hey
have
allb
een
onno
rmal
insp
ectio
n,an
dth
atno
neha
sbe
enre
ject
edw
hile
onor
igin
alin
spec
tion.
*
LIMITNUMBERS
Copyright American Society for Quality Provided by IHS under license with ASQ
Not for ResaleNo reproduction or networking permitted without license from IHS
--`,,```,,,,````-`-`,,`,,`,`,,`---
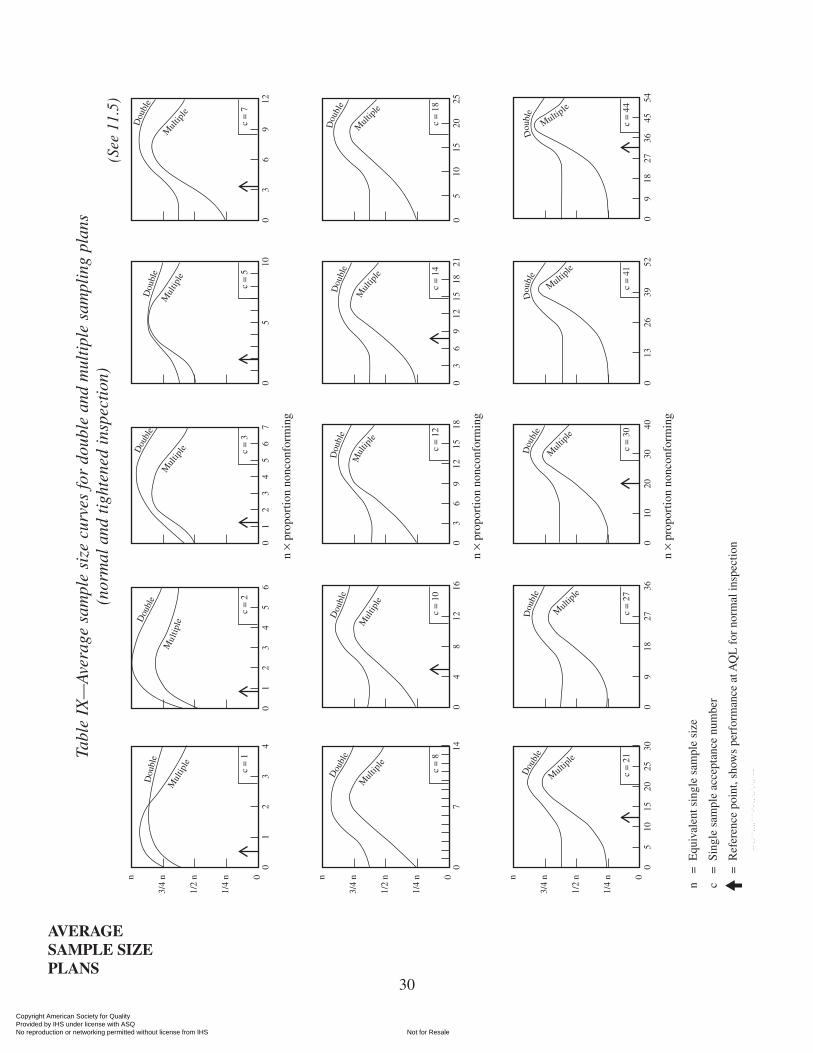
30
=E
quiv
alen
tsin
gle
sam
ple
size
=Si
ngle
sam
ple
acce
ptan
cenu
mbe
r
=R
efer
ence
poin
t,sh
ows
perf
orm
ance
atA
QL
for
norm
alin
spec
tion
n c
(See
11.5
)D
oubl
e
Mul
tiple
c=
7
03
69
12
c=
5
05
10
Dou
ble
Mul
tiple
n×
prop
ortio
nno
ncon
form
ing
n×
prop
ortio
nno
ncon
form
ing
c=
3
01
23
45
67
Dou
ble
Mul
tiple
c=
2
01
23
45
6
Dou
ble
Mul
tiple
c=
1
01
23
4
n
3/4
n
1/2
n
1/4
n 0
Dou
ble
Mul
tiple
c=
18
010
515
2025
Dou
ble
M
ultipl
e
c=
14
03
69
1215
1821
Dou
ble
Mul
tiple
c=
12
03
69
1215
18
Dou
ble
Mul
tiple
c=
10
04
812
16
Dou
ble
Mul
tiple
c=
8
07
14
n
3/4
n
1/2
n
1/4
n 0
Dou
ble
Mul
tiple
n×
prop
ortio
nno
ncon
form
ing
c=
44
027
1836
4554
9
Dou
ble
Multiple
c=
41
013
2639
52
Dou
ble
Multi
ple
c=
30
010
2030
40
Dou
ble
Mul
tiple
c=
27
09
1827
36
Dou
ble
M
ultipl
e
c=
21
015
2025
510
30
n
3/4
n
1/2
n
1/4
n 0
Dou
ble
Multi
ple
AVERAGESAMPLE SIZEPLANS
TableIX—Averagesamplesize
curves
fordoubleandmultiplesamplingplans
(normal
andtightenedinspection)
Copyright American Society for Quality Provided by IHS under license with ASQ
Not for ResaleNo reproduction or networking permitted without license from IHS
--`,,```,,,,````-`-`,,`,,`,`,,`---
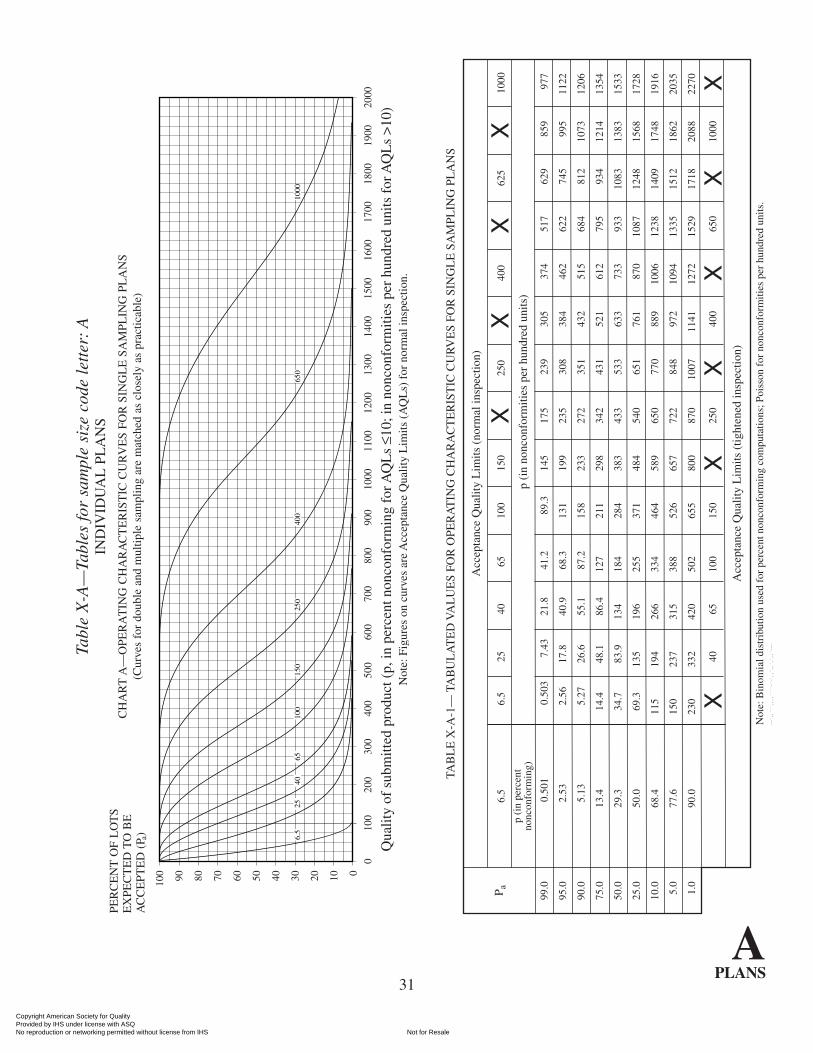
31
APLANS
TableX-A—Tables
forsamplesize
code
letter:A
INDIVIDUALPLANS
CHARTA—OPERATINGCHARACTERISTICCURVESFORSINGLESAMPLINGPLANS
(Curvesfordoubleandmultiplesamplingarematchedascloselyaspracticable)
P a
Acc
epta
nce
Qua
lity
Lim
its(n
orm
alin
spec
tion)
TAB
LE
X-A
-1—
TAB
UL
AT
ED
VA
LU
ES
FOR
OPE
RA
TIN
GC
HA
RA
CT
ER
IST
ICC
UR
VE
SFO
RSI
NG
LE
SAM
PLIN
GPL
AN
S
p(i
nno
ncon
form
ities
per
hund
red
units
)
Acc
epta
nce
Qua
lity
Lim
its(t
ight
ened
insp
ectio
n)
Not
e:B
inom
iald
istr
ibut
ion
used
for
perc
entn
onco
nfor
min
gco
mpu
tatio
ns;P
oiss
onfo
rno
ncon
form
ities
per
hund
red
units
.
6.5
p(i
npe
rcen
tno
ncon
form
ing)
6.5
2540
6510
015
0X
250
X40
0X
625
X10
00
99.0
89.3
145
175
239
305
95.0
131
199
235
308
384
90.0
158
233
272
351
432
75.0
211
298
342
431
521
50.0
284
383
433
533
633
25.0
371
484
540
651
761
10.0
464
589
650
770
889
5.0
526
657
722
848
972
X
0.50
1
2.53
5.13
13.4
29.3
50.0
68.4
77.6
90.0
0.50
3
2.56
5.27
14.4
34.7
69.3
115
150
230
407.43
17.8
26.6
48.1
83.9
135
194
237
332
6521.8
40.9
55.1
86.4
134
196
266
315
420
100
41.2
68.3
87.2
127
184
255
334
388
502
1.0
655
800
870
1007
1141
374
462
515
612
733
870
1006
1094
1272
517
622
684
795
933
1087
1238
1335
1529
629
745
812
934
1083
1248
1409
1512
1718
859
995
1073
1214
1383
1568
1748
1862
2088
977
1122
1206
1354
1533
1728
1916
2035
2270
150
X25
0X
400
X65
0X
1000
X
00
100
200
300
400
500
600
Qua
lity
ofsu
bmitt
edpr
oduc
t(p,
inpe
rcen
tnon
conf
orm
ing
forA
QL
s≤1
0;in
nonc
onfo
rmiti
espe
rhu
ndre
dun
itsfo
rAQ
Ls
>10
)N
ote:
Figu
res
oncu
rves
are
Acc
epta
nce
Qua
lity
Lim
its(A
QL
s)fo
rno
rmal
insp
ectio
n.
700
800
900
1000
1100
1200
1300
1400
1500
1600
1700
1800
1900
2000
102030405060708090100
6.5
2540
6510
015
025
040
065
010
00
PERCENTOFLOTS
EXPECTEDTOBE
ACCEPTED(Pa)
Copyright American Society for Quality Provided by IHS under license with ASQ
Not for ResaleNo reproduction or networking permitted without license from IHS
--`,,```,,,,````-`-`,,`,,`,`,,`---
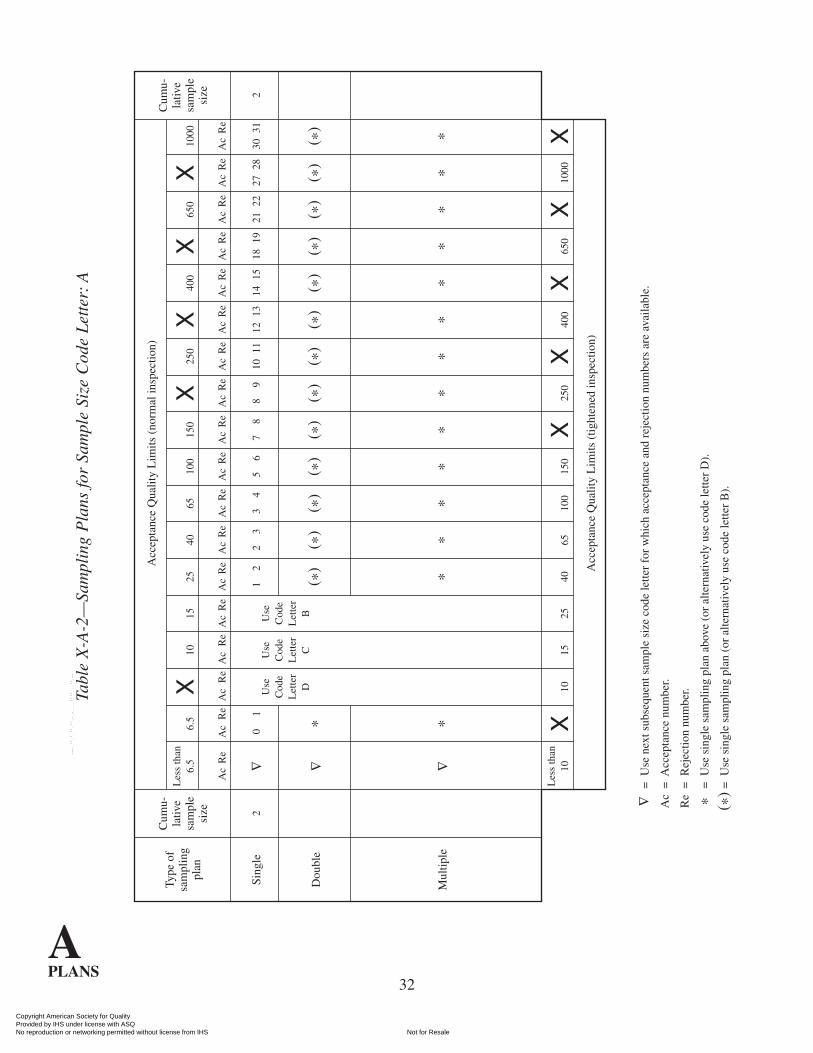
32
TableX-A-2—SamplingPlans
forSampleSize
CodeLetter:A
Acc
epta
nce
Qua
lity
Lim
its(n
orm
alin
spec
tion)
Acc
epta
nce
Qua
lity
Lim
its(t
ight
ened
insp
ectio
n)
Type
ofsa
mpl
ing
plan
Sing
le
Les
sth
an6.
5 ∇
6.5
X10
1525
4065
100
150
X25
0X
400
X65
0X
1000
*( *
)( *
)( *
)( *
)( *
)( *
)( *
)( *
)( *
)( *
)( *
)( *
)( *
)
**
**
**
**
**
**
**
Les
sth
an10
X10
1525
4065
100
150
X25
0X
400
X65
0X
1000
X
Ac
Ac
Ac
Ac
Ac
Ac
Ac
Ac
Ac
Ac
Ac
Ac
Ac
Ac
Ac
Ac
Ac
Ac
Re
Re
Re
Re
Re
Re
Re
Re
Re
Re
Re
Re
Re
Re
Re
Re
Re
Re
Use
Cod
eL
ette
rD
02
Use
Cod
eL
ette
rC
Use
Cod
eL
ette
rB
12
35
78
1012
1418
2127
301
23
46
89
1113
1519
2228
31
Dou
ble
∇
Mul
tiple
∇
∇ Ac
Re * ( *)
Cum
u-la
tive
sam
ple
size
2
Cum
u-la
tive
sam
ple
size
=U
sene
xtsu
bseq
uent
sam
ple
size
code
lette
rfo
rw
hich
acce
ptan
cean
dre
ject
ion
num
bers
are
avai
labl
e.
=A
ccep
tanc
enu
mbe
r.
=R
ejec
tion
num
ber.
=U
sesi
ngle
sam
plin
gpl
anab
ove
(or
alte
rnat
ivel
yus
eco
dele
tter
D).
=U
sesi
ngle
sam
plin
gpl
an(o
ral
tern
ativ
ely
use
code
lette
rB
).
APLANS
Copyright American Society for Quality Provided by IHS under license with ASQ
Not for ResaleNo reproduction or networking permitted without license from IHS
--`,,```,,,,````-`-`,,`,,`,`,,`---
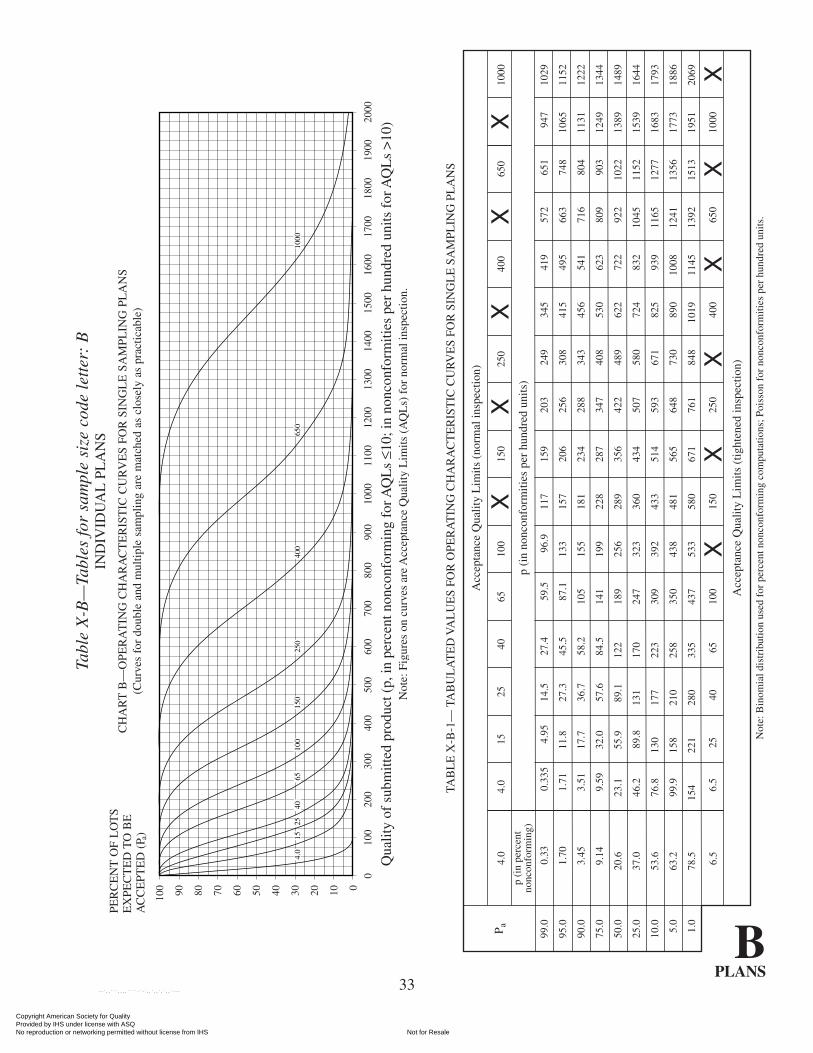
33
TableX-B—Tables
forsamplesize
code
letter:B
INDIVIDUALPLANS
CHARTB—OPERATINGCHARACTERISTICCURVESFORSINGLESAMPLINGPLANS
(Curvesfordoubleandmultiplesamplingarematchedascloselyaspracticable)
P a
Acc
epta
nce
Qua
lity
Lim
its(n
orm
alin
spec
tion)
TAB
LE
X-B
-1—
TAB
UL
AT
ED
VA
LU
ES
FOR
OPE
RA
TIN
GC
HA
RA
CT
ER
IST
ICC
UR
VE
SFO
RSI
NG
LE
SAM
PLIN
GPL
AN
S
p(i
nno
ncon
form
ities
per
hund
red
units
)
Acc
epta
nce
Qua
lity
Lim
its(t
ight
ened
insp
ectio
n)
Not
e:B
inom
iald
istr
ibut
ion
used
for
perc
entn
onco
nfor
min
gco
mpu
tatio
ns;P
oiss
onfo
rno
ncon
form
ities
per
hund
red
units
.
4.0
p(i
npe
rcen
tno
ncon
form
ing)
4.0
1525
4065
100
X15
0X
250
X40
0X
X65
010
00
99.0
59.5
96.9
117
159
203
95.0
87.1
133
157
206
256
90.0
105
155
181
234
288
75.0
141
199
228
287
347
50.0
189
256
289
356
422
25.0
247
323
360
434
507
10.0
309
392
433
514
593
5.0
350
438
481
565
648
0.33
1.70
3.45
9.14
20.6
37.0
53.6
63.2
78.5 6.5
0.33
5
1.71
3.51
9.59
23.1
46.2
76.8
99.9
154
256.
5
4.95
11.8
17.7
32.0
55.9
89.8
130
158
221
4014.5
27.3
36.7
57.6
89.1
131
177
210
280
6527.4
45.5
58.2
84.5
122
170
223
258
335
1.0
437
533
580
671
761
249
308
343
408
489
580
671
730
848
345
415
456
530
622
724
825
890
1019
419
495
541
623
722
832
939
1008
1145
572
663
716
809
922
1045
1165
1241
1392
651
748
804
903
1022
1152
1277
1356
1513
947
1065
1131
1249
1389
1539
1683
1773
1951
100
X15
0X
250
X40
0X
650
1000
1029
1152
1222
1344
1489
1644
1793
1886
2069
XX
00
100
200
300
400
500
600
Qua
lity
ofsu
bmitt
edpr
oduc
t(p,
inpe
rcen
tnon
conf
orm
ing
forA
QL
s≤1
0;in
nonc
onfo
rmiti
espe
rhu
ndre
dun
itsfo
rAQ
Ls
>10
)N
ote:
Figu
res
oncu
rves
are
Acc
epta
nce
Qua
lity
Lim
its(A
QL
s)fo
rno
rmal
insp
ectio
n.
700
800
900
1000
1100
1200
1300
1400
1500
1600
1700
1800
1900
2000
102030405060708090100
4.0
1525
4065
100
150
250
400
650
1000
PERCENTOFLOTS
EXPECTEDTOBE
ACCEPTED(Pa)
BPLANS
Copyright American Society for Quality Provided by IHS under license with ASQ
Not for ResaleNo reproduction or networking permitted without license from IHS
--`,,```,,,,````-`-`,,`,,`,`,,`---
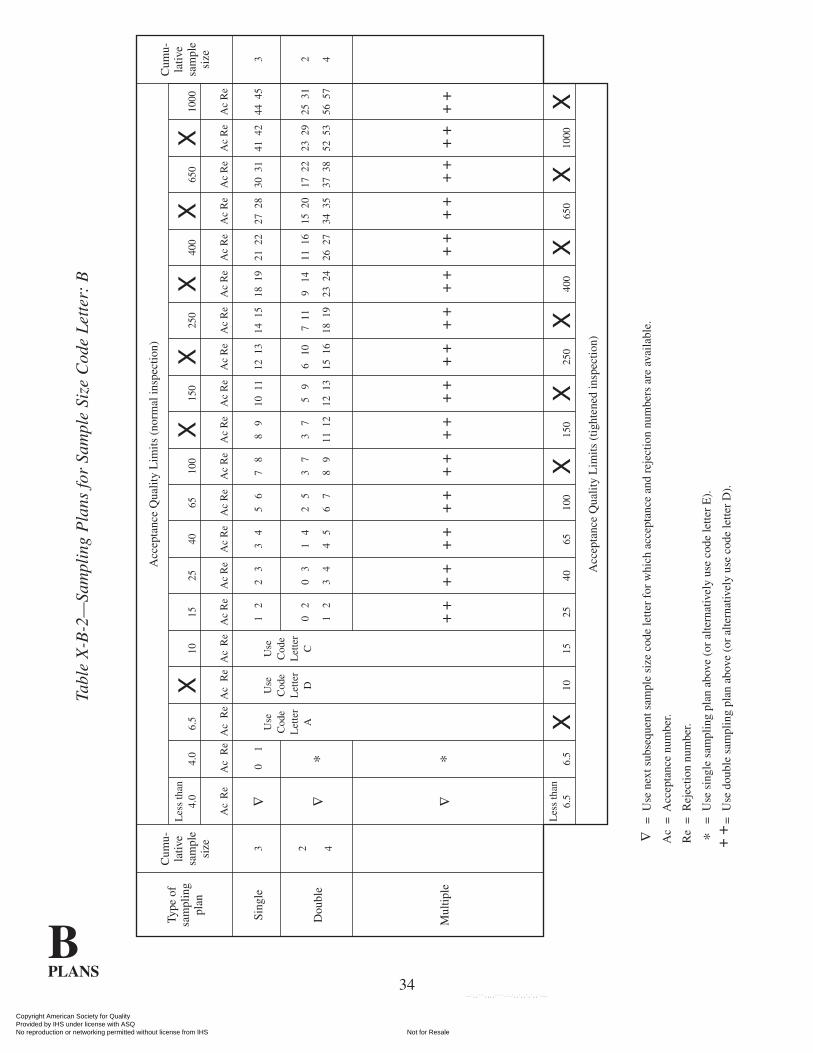
34
TableX-B-2—SamplingPlans
forSampleSize
CodeLetter:B
Acc
epta
nce
Qua
lity
Lim
its(n
orm
alin
spec
tion)
Acc
epta
nce
Qua
lity
Lim
its(t
ight
ened
insp
ectio
n)
Type
ofsa
mpl
ing
plan
Sing
le
Les
sth
an4.
0 ∇
4.0
X6.
510
1525
4065
100
X15
0X
250
X40
0X
X65
010
00
*0
2
12
03
34
14
45
25
67
37
89
37
1112
59
1213
610
1516
711
1819
914
2324
1116
2627
1520
3435
1722
3738
2329
5253
2531
5657
2 4
*+
++
++
++
++
++
++
++
++
++
++
++
++
++
++
+
Les
sth
an6.
5X
6.5
1015
2540
6510
0X
150
X25
0X
400
650
1000
XX
X
Ac
Ac
Ac
Ac
Ac
Ac
Re
Ac
Re
Ac
Re
Ac
Re
Ac
Re
Ac
Re
Ac
Re
Ac
Re
Ac
Re
Ac
Re
Ac
Re
Ac
Re
Ac
Re
Ac
Re
Ac
Re
Re
Re
Re
Re
Re
Use
Cod
eL
ette
rA
03
Use
Cod
eL
ette
rD
Use
Cod
eL
ette
rC
12
23
34
56
78
89
1011
1213
1415
1819
2122
2728
3031
4142
4445
1
Dou
ble
∇
Mul
tiple
∇
∇ Ac
Re * ++
Cum
u-la
tive
sam
ple
size
3
Cum
u-la
tive
sam
ple
size
=U
sene
xtsu
bseq
uent
sam
ple
size
code
lette
rfo
rw
hich
acce
ptan
cean
dre
ject
ion
num
bers
are
avai
labl
e.
=A
ccep
tanc
enu
mbe
r.
=R
ejec
tion
num
ber.
=U
sesi
ngle
sam
plin
gpl
anab
ove
(or
alte
rnat
ivel
yus
eco
dele
tter
E).
=U
sedo
uble
sam
plin
gpl
anab
ove
(or
alte
rnat
ivel
yus
eco
dele
tter
D).
2 4
BPLANS
Copyright American Society for Quality Provided by IHS under license with ASQ
Not for ResaleNo reproduction or networking permitted without license from IHS
--`,,```,,,,````-`-`,,`,,`,`,,`---
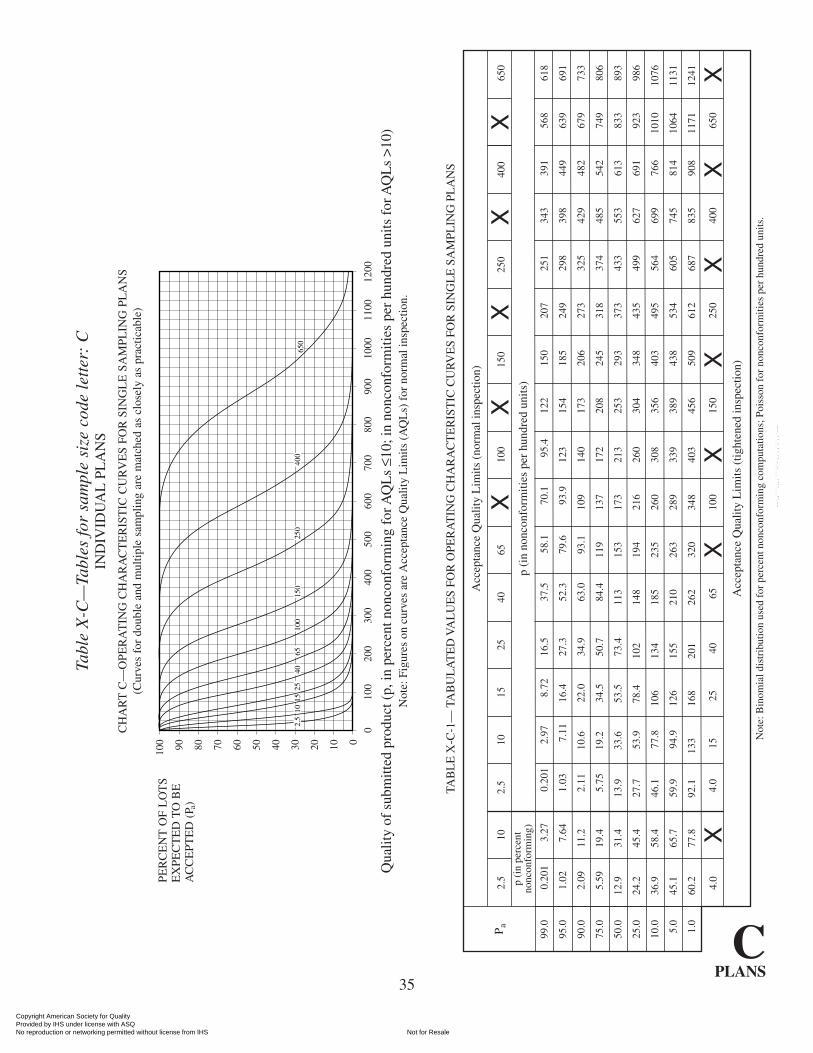
35
TableX-C—Tables
forsamplesize
code
letter:C
INDIVIDUALPLANS
CHARTC—OPERATINGCHARACTERISTICCURVESFORSINGLESAMPLINGPLANS
(Curvesfordoubleandmultiplesamplingarematchedascloselyaspracticable)
P a
Acc
epta
nce
Qua
lity
Lim
its(n
orm
alin
spec
tion)
TAB
LE
X-C
-1—
TAB
UL
AT
ED
VA
LU
ES
FOR
OPE
RA
TIN
GC
HA
RA
CT
ER
IST
ICC
UR
VE
SFO
RSI
NG
LE
SAM
PLIN
GPL
AN
S
p(i
nno
ncon
form
ities
per
hund
red
units
)
Acc
epta
nce
Qua
lity
Lim
its(t
ight
ened
insp
ectio
n)
Not
e:B
inom
iald
istr
ibut
ion
used
for
perc
entn
onco
nfor
min
gco
mpu
tatio
ns;P
oiss
onfo
rno
ncon
form
ities
per
hund
red
units
.
2.5 p(i
npe
rcen
tno
ncon
form
ing)
2.5
1010
1525
4065
X10
0X
150
X25
0X
X40
065
0
99.0
37.5
58.1
70.1
95.4
122
95.0
52.3
79.6
93.9
123
154
90.0
63.0
93.1
109
140
173
75.0
84.4
119
137
172
208
50.0
113
153
173
213
253
25.0
148
194
216
260
304
10.0
185
235
260
308
356
5.0
210
263
289
339
389
0.20
1
1.02
2.09
5.59
12.9
24.2
36.9
45.1
60.2 4.0
3.27
7.64
11.2
19.4
31.4
45.4
58.4
65.7
77.8
0.20
1
1.03
2.11
5.75
13.9
27.7
46.1
59.9
92.1
154.
0
2.97 7.11
10.6
19.2
33.6
53.9
77.8
94.9
133
258.72
16.4
22.0
34.5
53.5
78.4
106
126
168
4016.5
27.3
34.9
50.7
73.4
102
134
155
201
1.0
262
320
348
403
456
150
185
206
245
293
348
403
438
509
207
249
273
318
373
435
495
534
612
251
298
325
374
433
499
564
605
687
343
398
429
485
553
627
699
745
835
391
449
482
542
613
691
766
814
908
568
639
679
749
833
923
1010
1064
1171
65X
X10
0X
150
X25
0X
400
650
618
691
733
806
893
986
1076
1131
1241
XX
00
100
200
300
400
500
600
Qua
lity
ofsu
bmitt
edpr
oduc
t(p,
inpe
rcen
tnon
conf
orm
ing
forA
QL
s≤1
0;in
nonc
onfo
rmiti
espe
rhu
ndre
dun
itsfo
rAQ
Ls
>10
)N
ote:
Figu
res
oncu
rves
are
Acc
epta
nce
Qua
lity
Lim
its(A
QL
s)fo
rno
rmal
insp
ectio
n.
700
800
900
1000
1100
1200
102030405060708090100
1510
2540
6510
015
025
040
065
02.
5
PERCENTOFLOTS
EXPECTEDTOBE
ACCEPTED(Pa)
CPLANS
Copyright American Society for Quality Provided by IHS under license with ASQ
Not for ResaleNo reproduction or networking permitted without license from IHS
--`,,```,,,,````-`-`,,`,,`,`,,`---
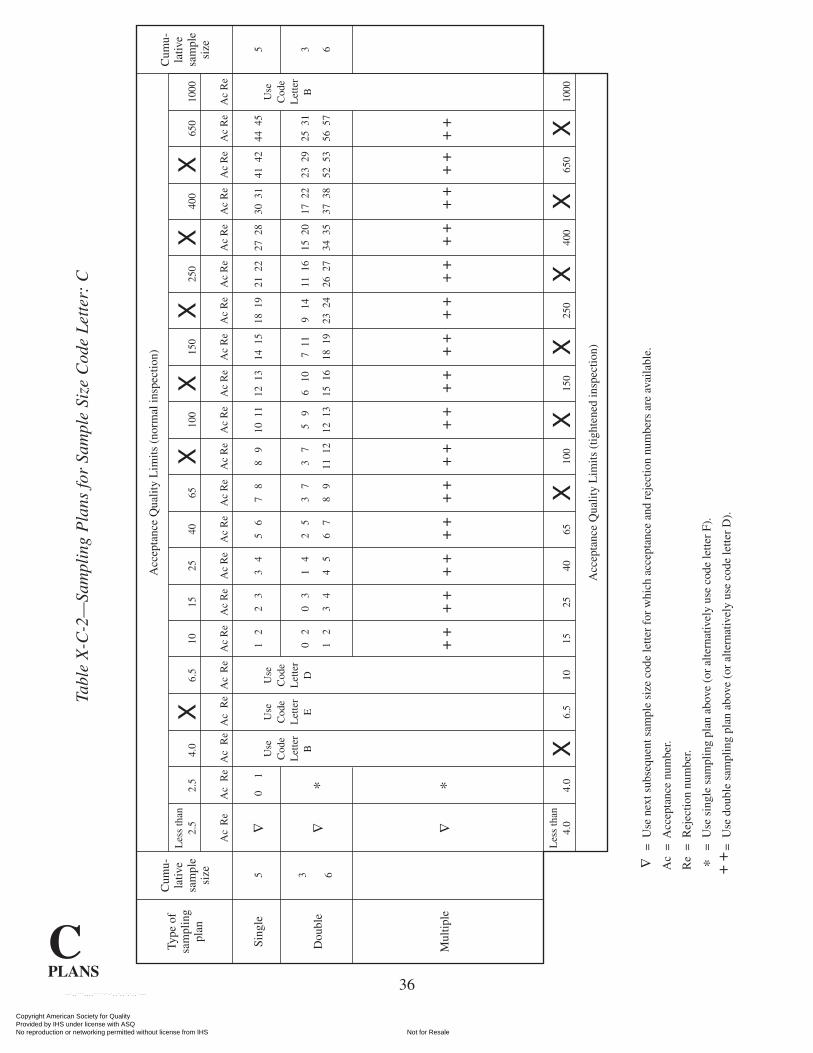
36
TableX-C-2—SamplingPlans
forSampleSize
CodeLetter:C
Acc
epta
nce
Qua
lity
Lim
its(n
orm
alin
spec
tion)
Acc
epta
nce
Qua
lity
Lim
its(t
ight
ened
insp
ectio
n)
Type
ofsa
mpl
ing
plan
Sing
le
Les
sth
an2.
5 ∇
2.5
X4.
06.
510
1525
4065
X10
0X
150
X25
0X
X40
065
0
*0
2
12
03
34
14
45
25
67
37
89
37
1112
59
1213
610
1516
711
1819
914
2324
1116
2627
1520
3435
1722
3738
2329
5253
2531
5657
3 6
*+
++
++
++
++
++
++
++
++
++
++
++
++
++
++
+
Les
sth
an4.
0X
4.0
6.5
1015
2540
65X
100
X15
0X
250
400
650
1000
XX
X
Ac
Ac
Ac
Ac
Ac
Ac
Re
Ac
Re
Ac
Re
Ac
Re
Ac
Re
Ac
Re
Ac
Re
Ac
Re
Ac
Re
Ac
Re
Ac
Re
Ac
Re
Ac
Re
Ac
Re
Ac
Re
Re
Re
Re
Re
Re
Use
Cod
eL
ette
rB
05
Use
Cod
eL
ette
rE
Use
Cod
eL
ette
rD
Use
Cod
eL
ette
rB
12
23
34
56
78
89
1011
1213
1415
1819
2122
2728
3031
4142
4445
1000
Ac
Re
1
Dou
ble
∇
Mul
tiple
∇
∇ Ac
Re * ++
Cum
u-la
tive
sam
ple
size
5
Cum
u-la
tive
sam
ple
size
=U
sene
xtsu
bseq
uent
sam
ple
size
code
lette
rfo
rw
hich
acce
ptan
cean
dre
ject
ion
num
bers
are
avai
labl
e.
=A
ccep
tanc
enu
mbe
r.
=R
ejec
tion
num
ber.
=U
sesi
ngle
sam
plin
gpl
anab
ove
(or
alte
rnat
ivel
yus
eco
dele
tter
F).
=U
sedo
uble
sam
plin
gpl
anab
ove
(or
alte
rnat
ivel
yus
eco
dele
tter
D).
3 6
CPLANS
Copyright American Society for Quality Provided by IHS under license with ASQ
Not for ResaleNo reproduction or networking permitted without license from IHS
--`,,```,,,,````-`-`,,`,,`,`,,`---
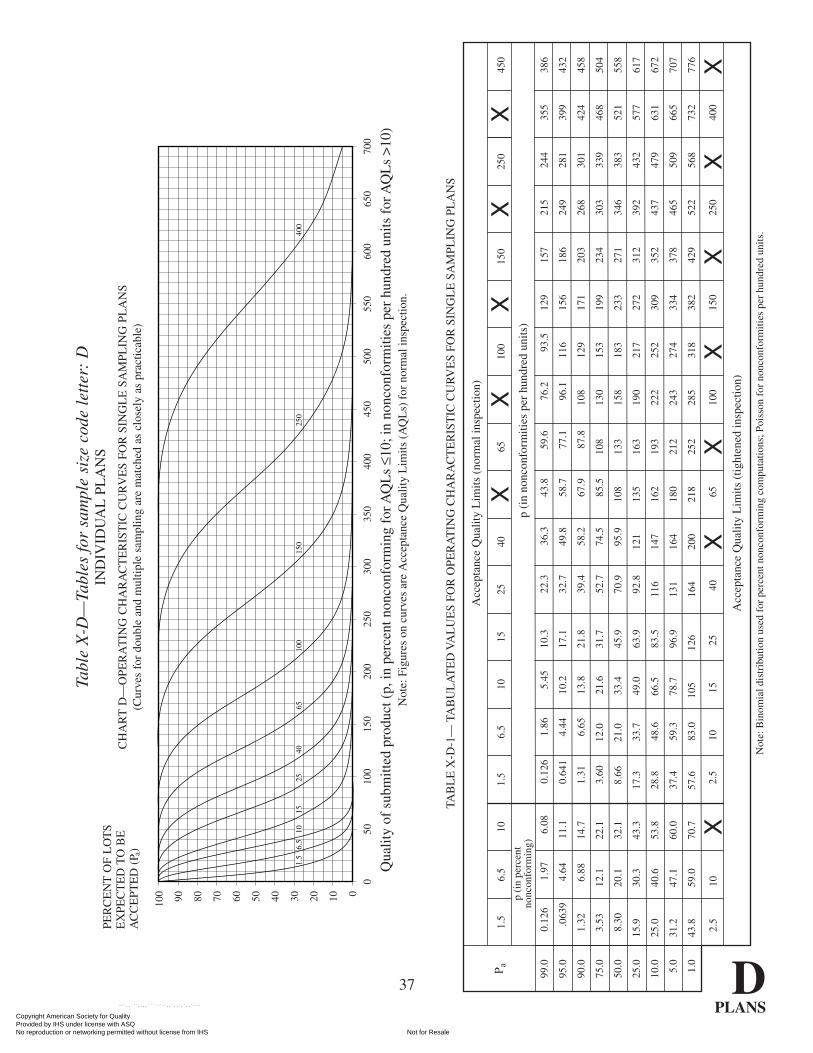
TableX-D
—Tables
forsamplesize
code
letter:D
INDIVIDUALPLANS
CHARTD—OPERATINGCHARACTERISTICCURVESFORSINGLESAMPLINGPLANS
(Curvesfordoubleandmultiplesamplingarematchedascloselyaspracticable)
P a
Acc
epta
nce
Qua
lity
Lim
its(n
orm
alin
spec
tion)
TAB
LE
X-D
-1—
TAB
UL
AT
ED
VA
LU
ES
FOR
OPE
RA
TIN
GC
HA
RA
CT
ER
IST
ICC
UR
VE
SFO
RSI
NG
LE
SAM
PLIN
GPL
AN
S
p(i
nno
ncon
form
ities
per
hund
red
units
)
Acc
epta
nce
Qua
lity
Lim
its(t
ight
ened
insp
ectio
n)
Not
e:B
inom
iald
istr
ibut
ion
used
for
perc
entn
onco
nfor
min
gco
mpu
tatio
ns;P
oiss
onfo
rno
ncon
form
ities
per
hund
red
units
.
6.5
p(i
npe
rcen
tno
ncon
form
ing)
1.5
106.
510
1525
40X
65X
100
X15
0X
X25
045
0
99.0
22.3
36.3
43.8
59.6
76.2
95.0
32.7
49.8
58.7
77.1
96.1
90.0
39.4
58.2
67.9
87.8
108
75.0
52.7
74.5
85.5
108
130
50.0
70.9
95.9
108
133
158
25.0
92.8
121
135
163
190
10.0
116
147
162
193
222
5.0
131
164
180
212
243
1.97
4.64
6.88
12.1
20.1
30.3
40.6
47.1
59.0
10
1.5
0.12
6
.063
9
1.32
3.53
8.30
15.9
25.0
31.2
43.8 2.5
6.08
11.1
14.7
22.1
32.1
43.3
53.8
60.0
70.7
0.12
6
0.64
1
1.31
3.60
8.66
17.3
28.8
37.4
57.6
102.
5
1.86
4.44
6.65
12.0
21.0
33.7
48.6
59.3
83.0
155.45
10.2
13.8
21.6
33.4
49.0
66.5
78.7
105
2510.3
17.1
21.8
31.7
45.9
63.9
83.5
96.9
126
1.0
164
200
218
252
285
93.5
116
129
153
183
217
252
274
318
129
156
171
199
233
272
309
334
382
157
186
203
234
271
312
352
378
429
215
249
268
303
346
392
437
465
522
244
281
301
339
383
432
479
509
568
355
399
424
468
521
577
631
665
732
40X
X65
X10
0X
150
X25
040
0
386
432
458
504
558
617
672
707
776
XX
00
5010
015
020
025
030
035
040
045
050
055
060
065
070
0
Qua
lity
ofsu
bmitt
edpr
oduc
t(p,
inpe
rcen
tnon
conf
orm
ing
forA
QL
s≤1
0;in
nonc
onfo
rmiti
espe
rhu
ndre
dun
itsfo
rAQ
Ls
>10
)N
ote:
Figu
res
oncu
rves
are
Acc
epta
nce
Qua
lity
Lim
its(A
QL
s)fo
rno
rmal
insp
ectio
n.
102030405060708090100
1.5
6.5
1015
2540
6510
015
025
040
0
PERCENTOFLOTS
EXPECTEDTOBE
ACCEPTED(Pa)
37 DPLANS
Copyright American Society for Quality Provided by IHS under license with ASQ
Not for ResaleNo reproduction or networking permitted without license from IHS
--`,,```,,,,````-`-`,,`,,`,`,,`---
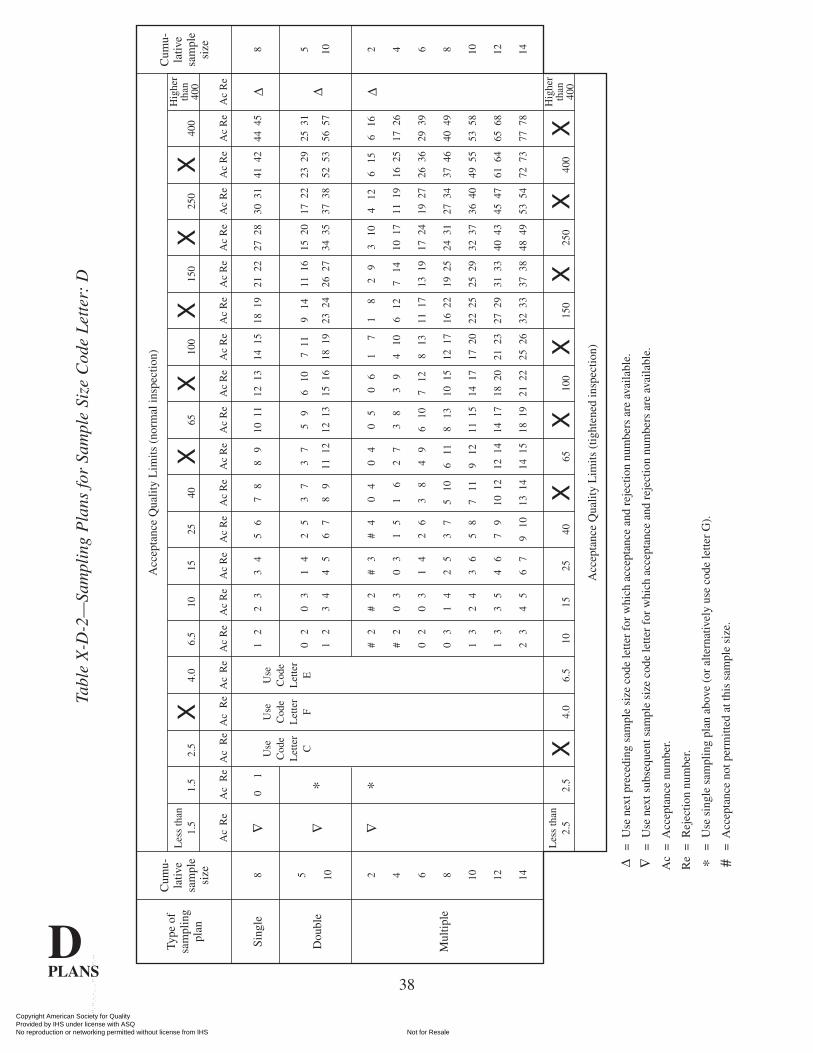
38
TableX-D
-2—SamplingPlans
forSampleSize
CodeLetter:D
Acc
epta
nce
Qua
lity
Lim
its(n
orm
alin
spec
tion)
Acc
epta
nce
Qua
lity
Lim
its(t
ight
ened
insp
ectio
n)
Type
ofsa
mpl
ing
plan
Sing
le
Les
sth
an1.
5 ∇
1.5
X2.
54.
06.
510
1525
40X
65X
100
X15
0X
X25
040
0
*0
2
12
2 4 6 8 10 12 14
2 4 6 8 10 12 14
#2
#2
02
03
13
13
23
#2
03
03
14
24
35
45
#3
03
14
25
36
46
67
#4
15
26
37
58
79
910
04
16
38
510
711
1012
1314
04
27
49
611
912
1214
1415
05
38
610
813
1115
1417
1819
06
39
712
1015
1417
1820
2122
17
410
813
1217
1720
2123
2526
18
612
1117
1622
2225
2729
3233
29
714
1319
1925
2529
3133
3738
310
1017
1724
2431
3237
4043
4849
412
1119
1927
2734
3640
4547
5354
615
1625
2636
3746
4955
6164
7273
616
1726
2939
4049
5358
6568
7778
03
34
14
45
25
67
37
89
37
1112
59
1213
610
1516
711
1819
914
2324
1116
2627
1520
3435
1722
3738
2329
5253
2531
5657
5 10
*
Les
sth
an2.
5X
2.5
4.0
6.5
1015
2540
X65
X10
0X
150
250
400
XX
X
Ac
Ac
Ac
Ac
Ac
Ac
Re
Ac
Re
Ac
Re
Ac
Re
Ac
Re
Ac
Re
Ac
Re
Ac
Re
Ac
Re
Ac
Re
Ac
Re
Ac
Re
Ac
Re
Ac
Re
Ac
Re
Re
Re
Re
Re
Re
Use
Cod
eL
ette
rC
08
Use
Cod
eL
ette
rF
Use
Cod
eL
ette
rE
12
23
34
56
78
89
1011
1213
1415
1819
2122
2728
3031
4142
4445
Hig
her
than
400
Hig
her
than
400
Ac
Re
1
Dou
ble
∇
Mul
tiple
∇
∆ ∆ ∆
∆ ∇ Ac
Re * #
Cum
u-la
tive
sam
ple
size
8
Cum
u-la
tive
sam
ple
size
=U
sene
xtpr
eced
ing
sam
ple
size
code
lette
rfo
rw
hich
acce
ptan
cean
dre
ject
ion
num
bers
are
avai
labl
e.
=U
sene
xtsu
bseq
uent
sam
ple
size
code
lette
rfo
rw
hich
acce
ptan
cean
dre
ject
ion
num
bers
are
avai
labl
e.
=A
ccep
tanc
enu
mbe
r.
=R
ejec
tion
num
ber.
=U
sesi
ngle
sam
plin
gpl
anab
ove
(or
alte
rnat
ivel
yus
eco
dele
tter
G).
=A
ccep
tanc
eno
tper
mitt
edat
this
sam
ple
size
.
5 10
DPLANS
Copyright American Society for Quality Provided by IHS under license with ASQ
Not for ResaleNo reproduction or networking permitted without license from IHS
--`,,```,,,,````-`-`,,`,,`,`,,`---
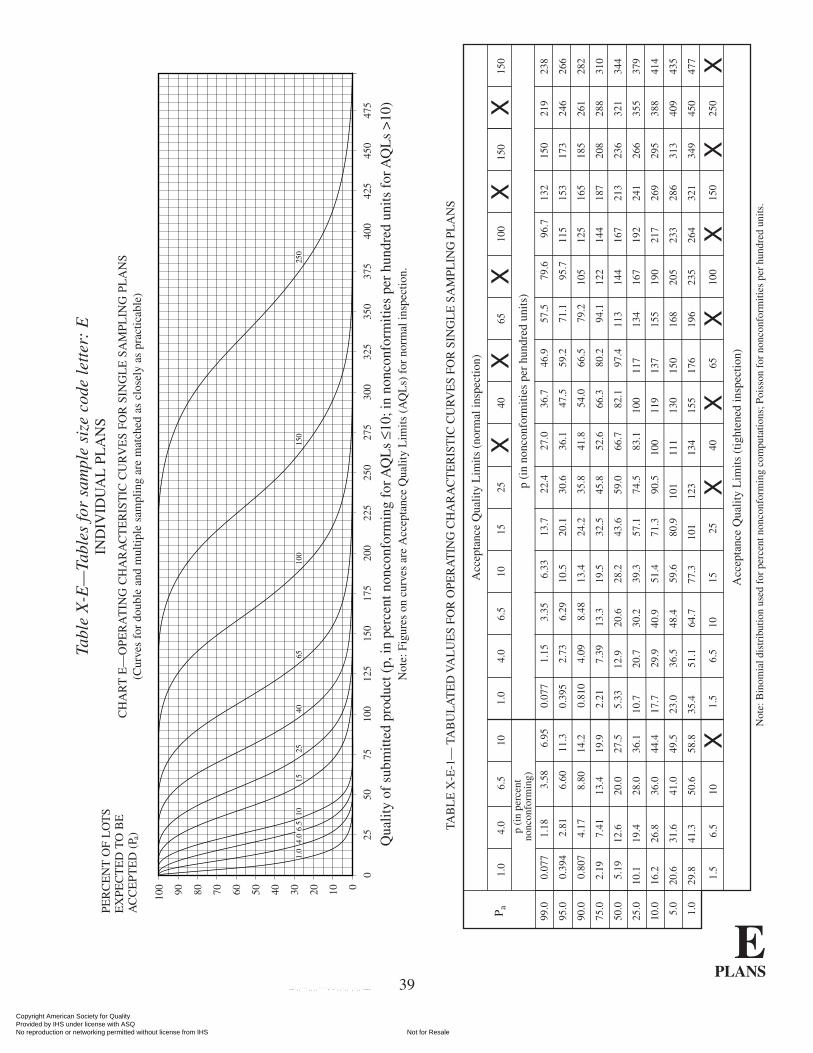
39
TableX-E—Tables
forsamplesize
code
letter:E
INDIVIDUALPLANS
CHARTE—OPERATINGCHARACTERISTICCURVESFORSINGLESAMPLINGPLANS
(Curvesfordoubleandmultiplesamplingarematchedascloselyaspracticable)
P a
Acc
epta
nce
Qua
lity
Lim
its(n
orm
alin
spec
tion)
TAB
LE
X-E
-1—
TAB
UL
AT
ED
VA
LU
ES
FOR
OPE
RA
TIN
GC
HA
RA
CT
ER
IST
ICC
UR
VE
SFO
RSI
NG
LE
SAM
PLIN
GPL
AN
S
p(i
nno
ncon
form
ities
per
hund
red
units
)
Acc
epta
nce
Qua
lity
Lim
its(t
ight
ened
insp
ectio
n)
Not
e:B
inom
iald
istr
ibut
ion
used
for
perc
entn
onco
nfor
min
gco
mpu
tatio
ns;P
oiss
onfo
rno
ncon
form
ities
per
hund
red
units
.
6.5
p(i
npe
rcen
tno
ncon
form
ing)
1.0
104.
06.
510
1525
X40
X65
X10
0X
X15
015
0
99.0
13.7
22.4
27.0
36.7
46.9
95.0
20.1
30.6
36.1
47.5
59.2
90.0
24.2
35.8
41.8
54.0
66.5
75.0
32.5
45.8
52.6
66.3
80.2
50.0
43.6
59.0
66.7
82.1
97.4
25.0
57.1
74.5
83.1
100
117
10.0
71.3
90.5
100
119
137
5.0
80.9
101
111
130
150
3.58
6.60
8.80
13.4
20.0
28.0
36.0
41.0
50.6
10
4.0
1.18
2.81
4.17
7.41
12.6
19.4
26.8
31.6
41.3 6.5
1.0
0.07
7
0.39
4
0.80
7
2.19
5.19
10.1
16.2
20.6
29.8 1.5
6.95
11.3
14.2
19.9
27.5
36.1
44.4
49.5
58.8
0.07
7
0.39
5
0.81
0
2.21
5.33
10.7
17.7
23.0
35.4
6.5
1.5
1.15
2.73
4.09
7.39
12.9
20.7
29.9
36.5
51.1
10
3.35
6.29
8.48
13.3
20.6
30.2
40.9
48.4
64.7
156.33
10.5
13.4
19.5
28.2
39.3
51.4
59.6
77.3
1.0
101
123
134
155
176
57.5
71.1
79.2
94.1
113
134
155
168
196
79.6
95.7
105
122
144
167
190
205
235
96.7
115
125
144
167
192
217
233
264
132
153
165
187
213
241
269
286
321
150
173
185
208
236
266
295
313
349
219
246
261
288
321
355
388
409
450
25X
X40
X65
X10
0X
150
250
238
266
282
310
344
379
414
435
477
XX
00
2550
7510
012
515
017
520
022
525
027
530
032
535
037
540
042
545
047
5
Qua
lity
ofsu
bmitt
edpr
oduc
t(p,
inpe
rcen
tnon
conf
orm
ing
forA
QL
s≤1
0;in
nonc
onfo
rmiti
espe
rhu
ndre
dun
itsfo
rAQ
Ls
>10
)N
ote:
Figu
res
oncu
rves
are
Acc
epta
nce
Qua
lity
Lim
its(A
QL
s)fo
rno
rmal
insp
ectio
n.
102030405060708090100
1.0
4.0
1015
2540
6510
015
025
06.
5
PERCENTOFLOTS
EXPECTEDTOBE
ACCEPTED(Pa)
EPLANS
Copyright American Society for Quality Provided by IHS under license with ASQ
Not for ResaleNo reproduction or networking permitted without license from IHS
--`,,```,,,,````-`-`,,`,,`,`,,`---

40
TableX-E-2—SamplingPlans
forSampleSize
CodeLetter:E
Acc
epta
nce
Qua
lity
Lim
its(n
orm
alin
spec
tion)
Acc
epta
nce
Qua
lity
Lim
its(t
ight
ened
insp
ectio
n)
Type
ofsa
mpl
ing
plan
Sing
le
Les
sth
an1.
0 ∇
1.0
X1.
52.
54.
06.
510
1525
X40
X65
X10
0X
X15
025
0
*0
2
12
3 6 9 12 15 18 21
3 6 9 12 15 18 21
#2
#2
02
03
13
13
23
#2
03
03
14
24
35
45
#3
03
14
25
36
46
67
#4
15
26
37
58
79
910
04
16
38
510
711
1012
1314
04
27
49
611
912
1214
1415
05
38
610
813
1115
1417
1819
06
39
712
1015
1417
1820
2122
17
410
813
1217
1720
2123
2526
18
612
1117
1622
2225
2729
3233
29
714
1319
1925
2529
3133
3738
310
1017
1724
2431
3237
4043
4849
412
1119
1927
2734
3640
4547
5354
615
1625
2636
3746
4955
6164
7273
616
1727
2939
4049
5358
6568
7778
03
34
14
45
25
67
37
89
37
1112
59
1213
610
1516
711
1819
914
2324
1116
2627
1520
3435
1722
3738
2329
5253
2531
5657
8 13
*
Les
sth
an1.
5X
1.5
2.5
4.0
6.5
1015
25X
40X
65X
100
150
250
XX
X
Ac
Ac
Ac
Ac
Ac
Ac
Re
Ac
Re
Ac
Re
Ac
Re
Ac
Re
Ac
Re
Ac
Re
Ac
Re
Ac
Re
Ac
Re
Ac
Re
Ac
Re
Ac
Re
Ac
Re
Ac
Re
Re
Re
Re
Re
Re
Use
Cod
eL
ette
rD
013
Use
Cod
eL
ette
rG
Use
Cod
eL
ette
rF
12
23
34
56
78
89
1011
1213
1415
1819
2122
2728
3031
4142
4445
Hig
her
than
250
Hig
her
than
250
Ac
Re
1
Dou
ble
∇
Mul
tiple
∇
∆ ∆ ∆
∆ ∇ Ac
Re * #
Cum
u-la
tive
sam
ple
size
13
Cum
u-la
tive
sam
ple
size
=U
sene
xtpr
eced
ing
sam
ple
size
code
lette
rfo
rw
hich
acce
ptan
cean
dre
ject
ion
num
bers
are
avai
labl
e.
=U
sene
xtsu
bseq
uent
sam
ple
size
code
lette
rfo
rw
hich
acce
ptan
cean
dre
ject
ion
num
bers
are
avai
labl
e.
=A
ccep
tanc
enu
mbe
r.
=R
ejec
tion
num
ber.
=U
sesi
ngle
sam
plin
gpl
anab
ove
(or
alte
rnat
ivel
yus
eco
dele
tter
H).
=A
ccep
tanc
eno
tper
mitt
edat
this
sam
ple
size
.
8 13
EPLANS
Copyright American Society for Quality Provided by IHS under license with ASQ
Not for ResaleNo reproduction or networking permitted without license from IHS
--`,,```,,,,````-`-`,,`,,`,`,,`---
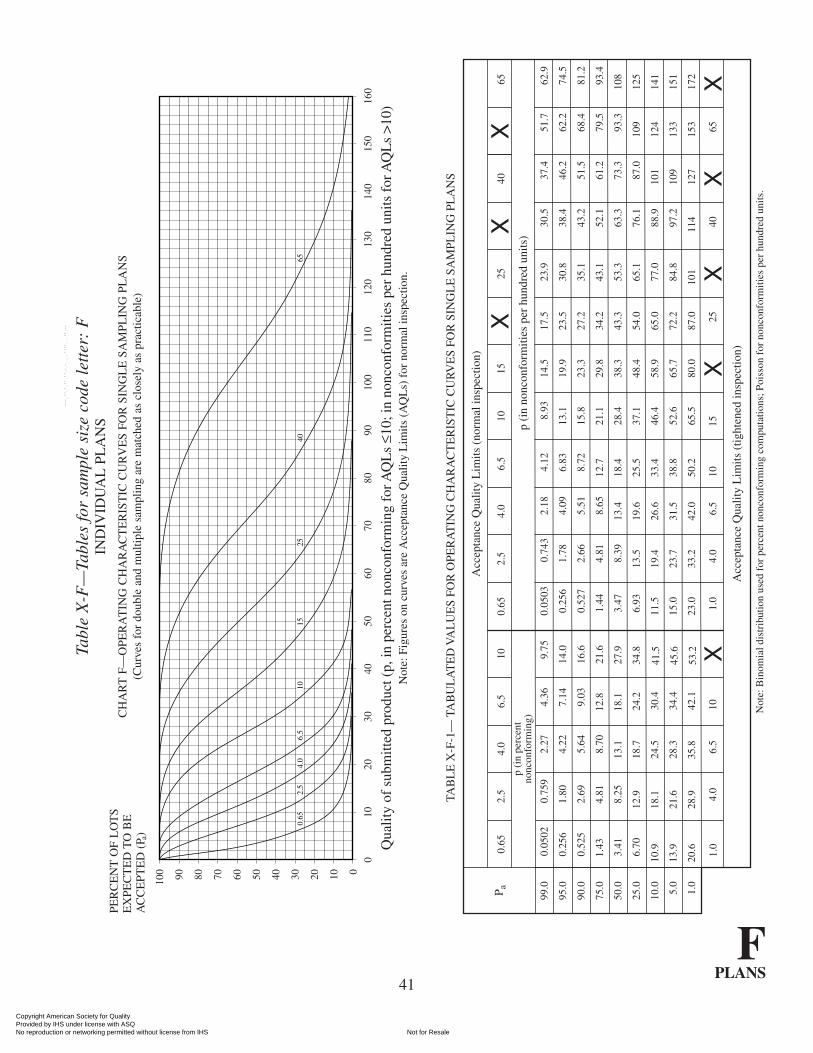
41
FPLANS
TableX-F—Tables
forsamplesize
code
letter:F
INDIVIDUALPLANS
CHARTF—
OPERATINGCHARACTERISTICCURVESFORSINGLESAMPLINGPLANS
(Curvesfordoubleandmultiplesamplingarematchedascloselyaspracticable)
P a
Acc
epta
nce
Qua
lity
Lim
its(n
orm
alin
spec
tion)
TAB
LE
X-F
-1—
TAB
UL
AT
ED
VA
LU
ES
FOR
OPE
RA
TIN
GC
HA
RA
CT
ER
IST
ICC
UR
VE
SFO
RSI
NG
LE
SAM
PLIN
GPL
AN
S
p(i
nno
ncon
form
ities
per
hund
red
units
)
Acc
epta
nce
Qua
lity
Lim
its(t
ight
ened
insp
ectio
n)
Not
e:B
inom
iald
istr
ibut
ion
used
for
perc
entn
onco
nfor
min
gco
mpu
tatio
ns;P
oiss
onfo
rno
ncon
form
ities
per
hund
red
units
.
0.65
p(i
npe
rcen
tno
ncon
form
ing)
4.0
2.5
6.5
100.
652.
54.
06.
510
15X
25X
X40
65
99.0
0.05
030.
743
2.18
4.12
8.93
95.0
0.25
61.
784.
096.
8313
.1
90.0
0.52
72.
665.
518.
7215
.8
75.0
1.44
4.81
8.65
12.7
21.1
50.0
3.47
8.39
13.4
18.4
28.4
25.0
6.93
13.5
19.6
25.5
37.1
10.0
11.5
19.4
26.6
33.4
46.4
5.0
15.0
23.7
31.5
38.8
52.6
0.05
02
0.25
6
0.52
5
1.43
3.41
6.70
10.9
13.9
20.6 1.0
0.75
9
1.80
2.69
4.81
8.25
12.9
18.1
21.6
28.9
2.27
4.22
5.64
8.70
13.1
18.7
24.5
28.3
35.8
106.
54.
0
4.36
7.14
9.03
12.8
18.1
24.2
30.4
34.4
42.1
9.75
14.0
16.6
21.6
27.9
34.8
41.5
45.6
53.2
1.0
23.0
33.2
42.0
50.2
65.5
14.5
19.9
23.3
29.8
38.3
48.4
58.9
65.7
80.0
17.5
23.5
27.2
34.2
43.3
54.0
65.0
72.2
87.0
23.9
30.8
35.1
43.1
53.3
65.1
77.0
84.8
101
30.5
38.4
43.2
52.1
63.3
76.1
88.9
97.2
114
37.4
46.2
51.5
61.2
73.3
87.0
101
109
127
51.7
62.2
68.4
79.5
93.3
109
124
133
153
1.0
4.0
X6.
510
15X
25X
4065
62.9
74.5
81.2
93.4
108
125
141
151
172
XX
00
1020
3040
5060
7080
9010
011
012
013
014
015
016
0
Qua
lity
ofsu
bmitt
edpr
oduc
t(p,
inpe
rcen
tnon
conf
orm
ing
forA
QL
s≤1
0;in
nonc
onfo
rmiti
espe
rhu
ndre
dun
itsfo
rAQ
Ls
>10
)N
ote:
Figu
res
oncu
rves
are
Acc
epta
nce
Qua
lity
Lim
its(A
QL
s)fo
rno
rmal
insp
ectio
n.
102030405060708090100
0.65
2.5
4.0
6.5
1015
2540
65
PERCENTOFLOTS
EXPECTEDTOBE
ACCEPTED(Pa)
Copyright American Society for Quality Provided by IHS under license with ASQ
Not for ResaleNo reproduction or networking permitted without license from IHS
--`,,```,,,,````-`-`,,`,,`,`,,`---

42
TableX-F-2—SamplingPlans
forSampleSize
CodeLetter:F
Acc
epta
nce
Qua
lity
Lim
its(n
orm
alin
spec
tion)
Acc
epta
nce
Qua
lity
Lim
its(t
ight
ened
insp
ectio
n)
Type
ofsa
mpl
ing
plan
Sing
le
Les
sth
an0.
65 ∇
0.65
X1.
01.
52.
54.
06.
510
15X
25X
40X
65
*0
2
12
5 10 15 20 25 30 35
5 10 15 20 25 30 35
#2
#2
02
03
13
13
23
#2
03
03
14
24
35
45
#3
03
14
25
36
46
67
#4
15
26
37
58
79
910
04
16
38
510
711
1012
1314
04
27
49
611
912
1214
1415
05
38
610
813
1115
1417
1819
06
39
712
1015
1417
1820
2122
17
410
813
1217
1720
2123
2526
18
612
1117
1622
2225
2729
3233
29
714
1319
1925
2529
3133
3738
03
34
14
45
25
67
37
89
37
1112
59
1213
610
1516
711
1819
914
2324
1116
2627
13 26
*
Les
sth
an1.
0X
1.0
1.5
2.5
4.0
6.5
1015
X25
X40
X65
X
Ac
Ac
Ac
Ac
Ac
Ac
Re
Ac
Re
Ac
Re
Ac
Re
Ac
Re
Ac
Re
Ac
Re
Ac
Re
Ac
Re
Ac
Re
Ac
Re
Re
Re
Re
Re
Re
Use
Cod
eL
ette
rE
020
Use
Cod
eL
ette
rH
Use
Cod
eL
ette
rG
12
23
34
56
78
89
1011
1213
1415
1819
2122
Hig
her
than 65
Hig
her
than 65
Ac
Re
1
Dou
ble
∇
Mul
tiple
∇
∆ ∆ ∆
∆ ∇ Ac
Re * #
Cum
u-la
tive
sam
ple
size
20
Cum
u-la
tive
sam
ple
size
=U
sene
xtpr
eced
ing
sam
ple
size
code
lette
rfo
rw
hich
acce
ptan
cean
dre
ject
ion
num
bers
are
avai
labl
e.
=U
sene
xtsu
bseq
uent
sam
ple
size
code
lette
rfo
rw
hich
acce
ptan
cean
dre
ject
ion
num
bers
are
avai
labl
e.
=A
ccep
tanc
enu
mbe
r.
=R
ejec
tion
num
ber.
=U
sesi
ngle
sam
plin
gpl
anab
ove
(or
alte
rnat
ivel
yus
eco
dele
tter
H).
=A
ccep
tanc
eno
tper
mitt
edat
this
sam
ple
size
.
13 26
FPLANS
Copyright American Society for Quality Provided by IHS under license with ASQ
Not for ResaleNo reproduction or networking permitted without license from IHS
--`,,```,,,,````-`-`,,`,,`,`,,`---
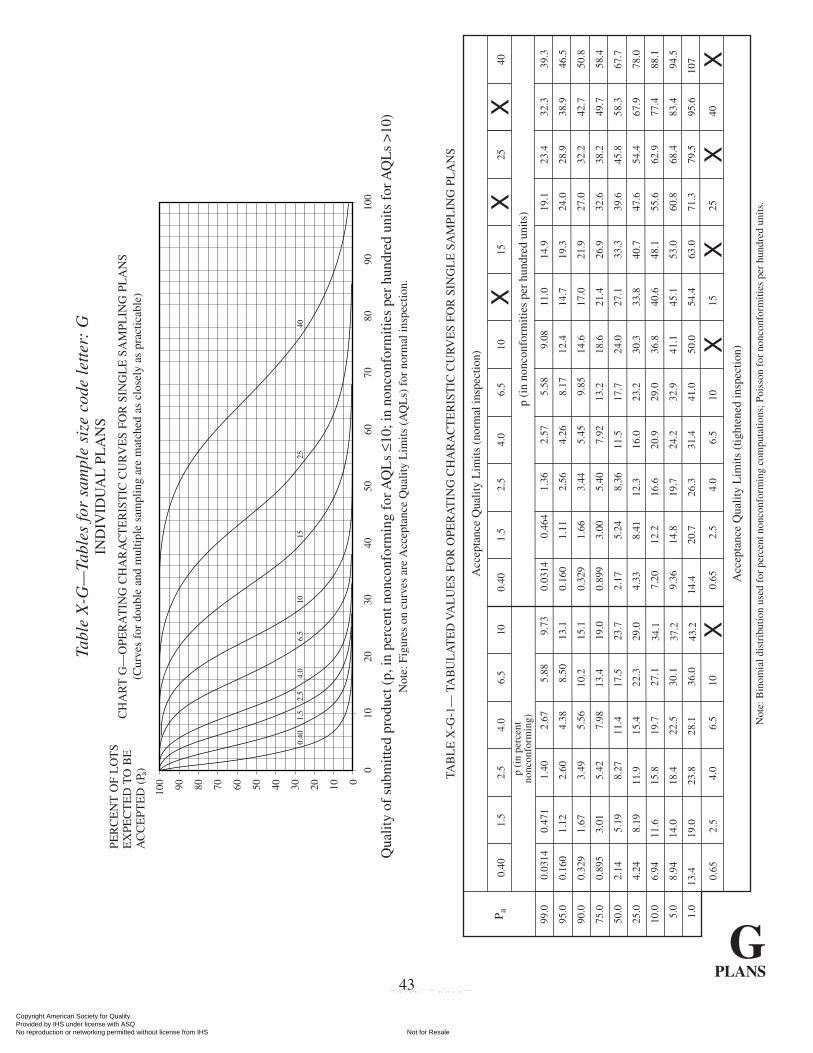
43
TableX-G
—Tables
forsamplesize
code
letter:G
INDIVIDUALPLANS
CHARTG—OPERATINGCHARACTERISTICCURVESFORSINGLESAMPLINGPLANS
(Curvesfordoubleandmultiplesamplingarematchedascloselyaspracticable)
P a
Acc
epta
nce
Qua
lity
Lim
its(n
orm
alin
spec
tion)
TAB
LE
X-G
-1—
TAB
UL
AT
ED
VA
LU
ES
FOR
OPE
RA
TIN
GC
HA
RA
CT
ER
IST
ICC
UR
VE
SFO
RSI
NG
LE
SAM
PLIN
GPL
AN
S
p(i
nno
ncon
form
ities
per
hund
red
units
)
Acc
epta
nce
Qua
lity
Lim
its(t
ight
ened
insp
ectio
n)
Not
e:B
inom
iald
istr
ibut
ion
used
for
perc
entn
onco
nfor
min
gco
mpu
tatio
ns;P
oiss
onfo
rno
ncon
form
ities
per
hund
red
units
.
1.5
p(i
npe
rcen
tno
ncon
form
ing)
4.0
2.5
6.5
100.
401.
52.
54.
06.
510
X15
XX
2540
99.0
0.03
140.
464
1.36
2.57
5.58
95.0
0.16
01.
112.
564.
268.
17
90.0
0.32
91.
663.
445.
459.
85
75.0
0.89
93.
005.
407.
9213
.2
50.0
2.17
5.24
8.36
11.5
17.7
25.0
4.33
8.41
12.3
16.0
23.2
10.0
7.20
12.2
16.6
20.9
29.0
5.0
9.36
14.8
19.7
24.2
32.9
0.47
1
1.12
1.67
3.01
5.19
8.19
11.6
14.0
19.0 2.5
0.40
0.03
14
0.16
0
0.32
9
0.89
5
2.14
4.24
6.94
8.94
13.4 0.65
1.40
2.60
3.49
5.42
8.27
11.9
15.8
18.4
23.8
2.67
4.38
5.56
7.98
11.4
15.4
19.7
22.5
28.1
106.
54.
0
5.88
8.50
10.2
13.4
17.5
22.3
27.1
30.1
36.0
9.73
13.1
15.1
19.0
23.7
29.0
34.1
37.2
43.2
1.0
14.4
20.7
26.3
31.4
41.0
9.08
12.4
14.6
18.6
24.0
30.3
36.8
41.1
50.0
11.0
14.7
17.0
21.4
27.1
33.8
40.6
45.1
54.4
14.9
19.3
21.9
26.9
33.3
40.7
48.1
53.0
63.0
19.1
24.0
27.0
32.6
39.6
47.6
55.6
60.8
71.3
23.4
28.9
32.2
38.2
45.8
54.4
62.9
68.4
79.5
32.3
38.9
42.7
49.7
58.3
67.9
77.4
83.4
95.6
0.65
2.5
X4.
06.
510
X15
X25
40
39.3
46.5
50.8
58.4
67.7
78.0
88.1
94.5
107
XX
00
1020
3040
5060
7080
9010
0
Qua
lity
ofsu
bmitt
edpr
oduc
t(p,
inpe
rcen
tnon
conf
orm
ing
forA
QL
s≤1
0;in
nonc
onfo
rmiti
espe
rhu
ndre
dun
itsfo
rAQ
Ls
>10
)N
ote:
Figu
res
oncu
rves
are
Acc
epta
nce
Qua
lity
Lim
its(A
QL
s)fo
rno
rmal
insp
ectio
n.
102030405060708090100
0.40
2.5
1.5
4.0
6.5
1015
2540
PERCENTOFLOTS
EXPECTEDTOBE
ACCEPTED(Pa)
GPLANS
Copyright American Society for Quality Provided by IHS under license with ASQ
Not for ResaleNo reproduction or networking permitted without license from IHS
--`,,```,,,,````-`-`,,`,,`,`,,`---

44
TableX-G
-2—SamplingPlans
forSampleSize
CodeLetter:G
Acc
epta
nce
Qua
lity
Lim
its(n
orm
alin
spec
tion)
Acc
epta
nce
Qua
lity
Lim
its(t
ight
ened
insp
ectio
n)
Type
ofsa
mpl
ing
plan
Sing
le
Les
sth
an0.
40 ∇
0.40
X0.
651.
01.
52.
54.
06.
510
X15
X25
X40
*0
2
12
8 16 24 32 40 48 56
8 16 24 32 40 48 56
#2
#2
02
03
13
13
23
#2
03
03
14
24
35
45
#3
03
14
25
36
46
67
#4
15
26
37
58
79
910
04
16
38
510
711
1012
1314
04
27
49
611
912
1214
1415
05
38
610
813
1115
1417
1819
06
39
712
1015
1417
1820
2122
17
410
813
1217
1720
2123
2526
18
612
1117
1622
2225
2729
3233
29
714
1319
1925
2529
3133
3738
03
34
14
45
25
67
37
89
37
1112
59
1213
610
1516
711
1819
914
2324
1116
2627
20 40
*
Les
sth
an0.
65X
0.65
1.0
1.5
2.5
4.0
6.5
10X
15X
25X
40X
Ac
Ac
Ac
Ac
Ac
Ac
Re
Ac
Re
Ac
Re
Ac
Re
Ac
Re
Ac
Re
Ac
Re
Ac
Re
Ac
Re
Ac
Re
Ac
Re
Re
Re
Re
Re
Re
Use
Cod
eL
ette
rF
032
Use
Cod
eL
ette
rJ
Use
Cod
eL
ette
rH
12
23
34
56
78
89
1011
1213
1415
1819
2122
Hig
her
than 40
Hig
her
than 40
Ac
Re
1
Dou
ble
∇
Mul
tiple
∇
∆ ∆ ∆
∆ ∇ Ac
Re * #
Cum
u-la
tive
sam
ple
size
32
Cum
u-la
tive
sam
ple
size
=U
sene
xtpr
eced
ing
sam
ple
size
code
lette
rfo
rw
hich
acce
ptan
cean
dre
ject
ion
num
bers
are
avai
labl
e.
=U
sene
xtsu
bseq
uent
sam
ple
size
code
lette
rfo
rw
hich
acce
ptan
cean
dre
ject
ion
num
bers
are
avai
labl
e.
=A
ccep
tanc
enu
mbe
r.
=R
ejec
tion
num
ber.
=U
sesi
ngle
sam
plin
gpl
anab
ove
(or
alte
rnat
ivel
yus
eco
dele
tter
K).
=A
ccep
tanc
eno
tper
mitt
edat
this
sam
ple
size
.
20 40
GPLANS
Copyright American Society for Quality Provided by IHS under license with ASQ
Not for ResaleNo reproduction or networking permitted without license from IHS
--`,,```,,,,````-`-`,,`,,`,`,,`---
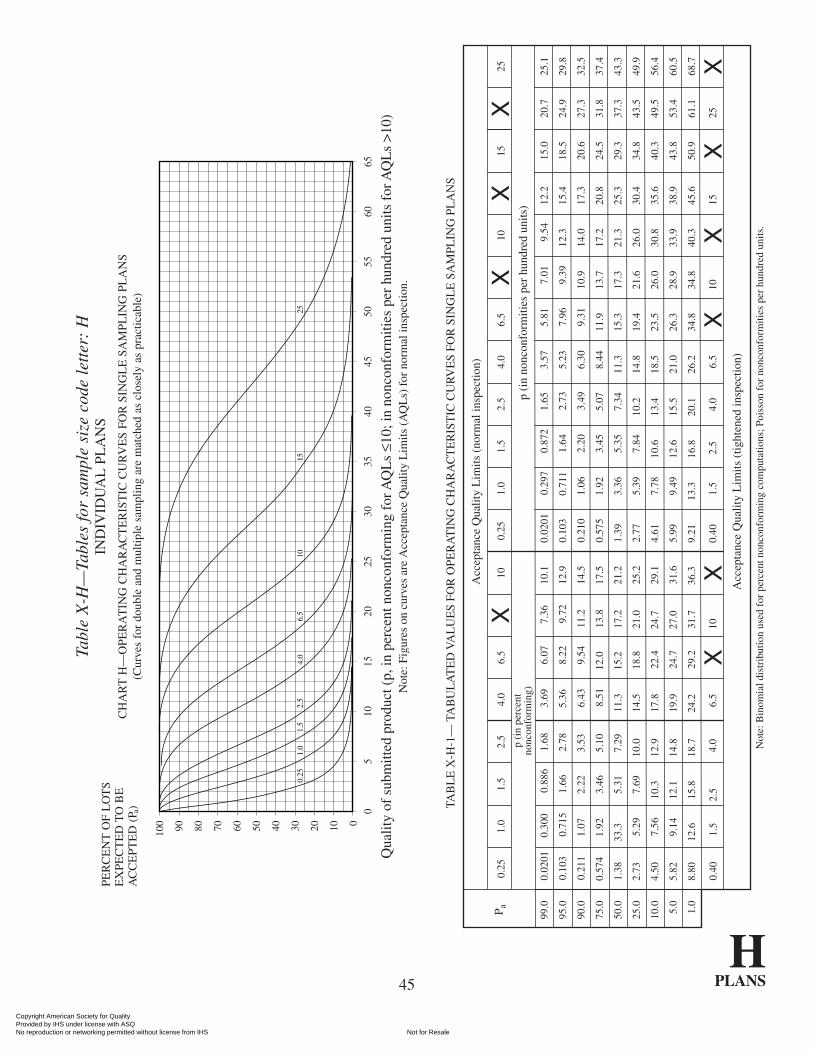
45
HPLANS
TableX-H
—Tables
forsamplesize
code
letter:H
INDIVIDUALPLANS
CHARTH—OPERATINGCHARACTERISTICCURVESFORSINGLESAMPLINGPLANS
(Curvesfordoubleandmultiplesamplingarematchedascloselyaspracticable)
P a
Acc
epta
nce
Qua
lity
Lim
its(n
orm
alin
spec
tion)
TAB
LE
X-H
-1—
TAB
UL
AT
ED
VA
LU
ES
FOR
OPE
RA
TIN
GC
HA
RA
CT
ER
IST
ICC
UR
VE
SFO
RSI
NG
LE
SAM
PLIN
GPL
AN
S
p(i
nno
ncon
form
ities
per
hund
red
units
)
Acc
epta
nce
Qua
lity
Lim
its(t
ight
ened
insp
ectio
n)
Not
e:B
inom
iald
istr
ibut
ion
used
for
perc
entn
onco
nfor
min
gco
mpu
tatio
ns;P
oiss
onfo
rno
ncon
form
ities
per
hund
red
units
.
1.5
p(i
npe
rcen
tno
ncon
form
ing)
4.0
2.5
6.5
100.
251.
01.
52.
54.
06.
5X
10X
X15
25
99.0
0.02
010.
297
0.87
21.
653.
57
95.0
0.10
30.
711
1.64
2.73
5.23
90.0
0.21
01.
062.
203.
496.
30
75.0
0.57
51.
923.
455.
078.
44
50.0
1.39
3.36
5.35
7.34
11.3
25.0
2.77
5.39
7.84
10.2
14.8
10.0
4.61
7.78
10.6
13.4
18.5
5.0
5.99
9.49
12.6
15.5
21.0
0.88
6
1.66
2.22
3.46
5.31
7.69
10.3
12.1
15.8
2.5
1.0
0.30
0
0.71
5
1.07
1.92
33.3 5.29
7.56
9.14
12.6 1.5
0.25
0.02
01
0.10
3
0.21
1
0.57
4
1.38
2.73
4.50
5.82
8.80
0.40
1.68
2.78
3.53
5.10
7.29
10.0
12.9
14.8
18.7
3.69
5.36
6.43
8.51
11.3
14.5
17.8
19.9
24.2 6.5
4.0
6.07
8.22
9.54
12.0
15.2
18.8
22.4
24.7
29.2
107.36
9.72
11.2
13.8
17.2
21.0
24.7
27.0
31.7
10.1
12.9
14.5
17.5
21.2
25.2
29.1
31.6
36.3
1.0
9.21
13.3
16.8
20.1
26.2
5.81
7.96
9.31
11.9
15.3
19.4
23.5
26.3
34.8
7.01
9.39
10.9
13.7
17.3
21.6
26.0
28.9
34.8
9.54
12.3
14.0
17.2
21.3
26.0
30.8
33.9
40.3
12.2
15.4
17.3
20.8
25.3
30.4
35.6
38.9
45.6
15.0
18.5
20.6
24.5
29.3
34.8
40.3
43.8
50.9
20.7
24.9
27.3
31.8
37.3
43.5
49.5
53.4
61.1
0.40
1.5
X
X
X2.
54.
06.
5X
10X
1525
25.1
29.8
32.5
37.4
43.3
49.9
56.4
60.5
68.7
XX
00
510
1520
2530
3540
4550
5560
65
Qua
lity
ofsu
bmitt
edpr
oduc
t(p,
inpe
rcen
tnon
conf
orm
ing
forA
QL
s≤1
0;in
nonc
onfo
rmiti
espe
rhu
ndre
dun
itsfo
rAQ
Ls
>10
)N
ote:
Figu
res
oncu
rves
are
Acc
epta
nce
Qua
lity
Lim
its(A
QL
s)fo
rno
rmal
insp
ectio
n.
102030405060708090100
0.25
2.5
1.5
1.0
4.0
6.5
1015
25
PERCENTOFLOTS
EXPECTEDTOBE
ACCEPTED(Pa)
Copyright American Society for Quality Provided by IHS under license with ASQ
Not for ResaleNo reproduction or networking permitted without license from IHS
--`,,```,,,,````-`-`,,`,,`,`,,`---

46
TableX-H
-2—SamplingPlans
forSampleSize
CodeLetter:H
Acc
epta
nce
Qua
lity
Lim
its(n
orm
alin
spec
tion)
Acc
epta
nce
Qua
lity
Lim
its(t
ight
ened
insp
ectio
n)
Type
ofsa
mpl
ing
plan
Sing
le
Les
sth
an0.
25 ∇
0.25
X0.
400.
651.
01.
52.
54.
06.
5X
10X
15X
25
*0
2
12
13 26 39 52 65 78 91
13 26 39 52 65 78 91
#2
#2
02
03
13
13
23
#2
03
03
14
24
35
45
#3
03
14
25
36
46
67
#4
15
26
37
58
79
910
04
16
38
510
711
1012
1314
04
27
49
611
912
1214
1415
05
38
610
813
1115
1417
1819
06
39
712
1015
1417
1820
2122
17
410
813
1217
1720
2123
2526
18
612
1117
1622
2225
2729
3233
29
714
1319
1925
2529
3133
3738
03
34
14
45
25
67
37
89
37
1112
59
1213
610
1516
711
1819
914
2324
1116
2627
32 64
*
Les
sth
an0.
40X
0.40
0.65
1.0
1.5
2.5
4.0
6.5
X10
X15
X25
X
Ac
Ac
Ac
Ac
Ac
Ac
Re
Ac
Re
Ac
Re
Ac
Re
Ac
Re
Ac
Re
Ac
Re
Ac
Re
Ac
Re
Ac
Re
Ac
Re
Re
Re
Re
Re
Re
Use
Cod
eL
ette
rG
050
Use
Cod
eL
ette
rK
Use
Cod
eL
ette
rJ
12
23
34
56
78
89
1011
1213
1415
1819
2122
Hig
her
than 25
Hig
her
than 25
Ac
Re
1
Dou
ble
∇
Mul
tiple
∇
∆ ∆ ∆
∆ ∇ Ac
Re * #
Cum
u-la
tive
sam
ple
size
50
Cum
u-la
tive
sam
ple
size
=U
sene
xtpr
eced
ing
sam
ple
size
code
lette
rfo
rw
hich
acce
ptan
cean
dre
ject
ion
num
bers
are
avai
labl
e.
=U
sene
xtsu
bseq
uent
sam
ple
size
code
lette
rfo
rw
hich
acce
ptan
cean
dre
ject
ion
num
bers
are
avai
labl
e.
=A
ccep
tanc
enu
mbe
r.
=R
ejec
tion
num
ber.
=U
sesi
ngle
sam
plin
gpl
anab
ove
(or
alte
rnat
ivel
yus
eco
dele
tter
L).
=A
ccep
tanc
eno
tper
mitt
edat
this
sam
ple
size
.
32 64
HPLANS
Copyright American Society for Quality Provided by IHS under license with ASQ
Not for ResaleNo reproduction or networking permitted without license from IHS
--`,,```,,,,````-`-`,,`,,`,`,,`---
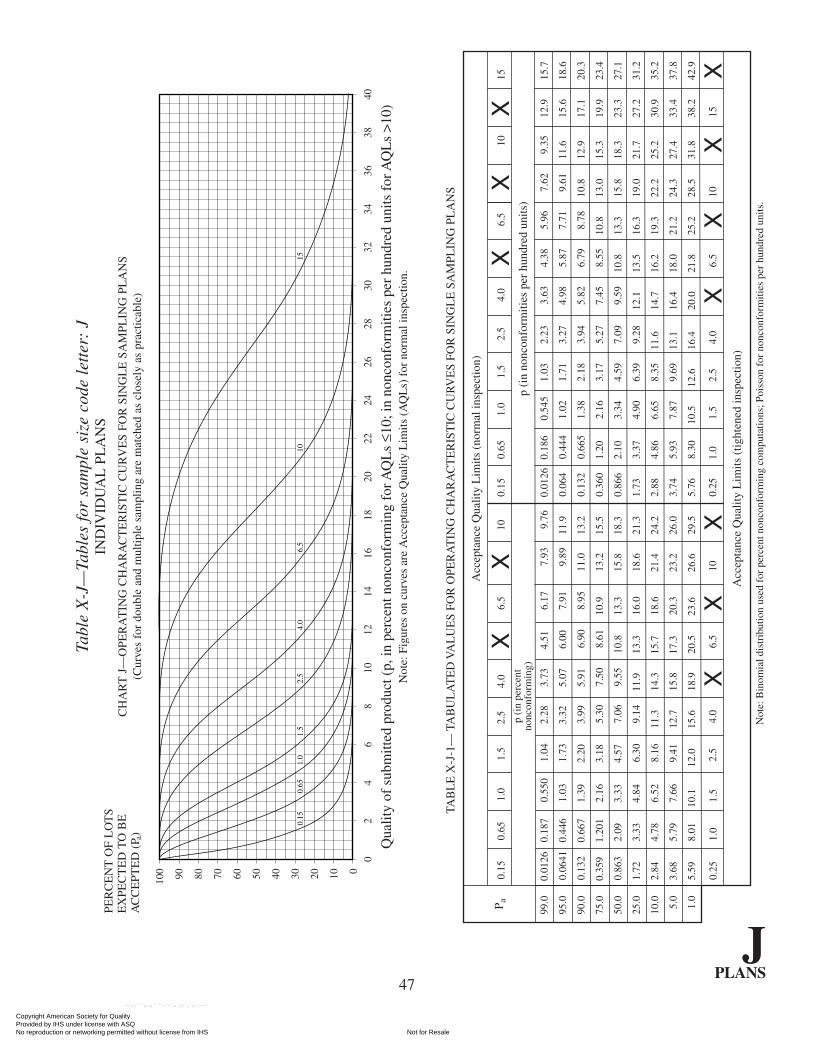
47
JPLANS
TableX-J—Tables
forsamplesize
code
letter:J
INDIVIDUALPLANS
CHARTJ—OPERATINGCHARACTERISTICCURVESFORSINGLESAMPLINGPLANS
(Curvesfordoubleandmultiplesamplingarematchedascloselyaspracticable)
P a
Acc
epta
nce
Qua
lity
Lim
its(n
orm
alin
spec
tion)
TAB
LE
X-J
-1—
TAB
UL
AT
ED
VA
LU
ES
FOR
OPE
RA
TIN
GC
HA
RA
CT
ER
IST
ICC
UR
VE
SFO
RSI
NG
LE
SAM
PLIN
GPL
AN
S
p(i
nno
ncon
form
ities
per
hund
red
units
)
Acc
epta
nce
Qua
lity
Lim
its(t
ight
ened
insp
ectio
n)
Not
e:B
inom
iald
istr
ibut
ion
used
for
perc
entn
onco
nfor
min
gco
mpu
tatio
ns;P
oiss
onfo
rno
ncon
form
ities
per
hund
red
units
.
1.0
p(i
npe
rcen
tno
ncon
form
ing)
2.5
1.5
4.0
6.5
100.
150.
651.
01.
52.
54.
0X
XX
6.5
10
99.0
7.93
9.76
0.01
260.
186
0.54
5
95.0
9.89
11.9
0.06
40.
444
1.02
90.0
11.0
13.2
0.13
20.
665
1.38
75.0
13.2
15.5
0.36
01.
202.
16
50.0
15.8
18.3
0.86
62.
103.
34
25.0
18.6
21.3
1.73
3.37
4.90
10.0
21.4
24.2
2.88
4.86
6.65
5.0
23.2
26.0
3.74
5.93
7.87
0.55
0
1.03
1.39
2.16
3.33
4.84
6.52
7.66
10.1 1.5
0.65
0.18
7
0.44
6
0.66
7
1.20
1
2.09
3.33
4.78
5.79
8.01
1.0
0.15
0.01
26
0.06
41
0.13
2
0.35
9
0.86
3
1.72
2.84
3.68
5.59
0.25
1.04
1.73
2.20
3.18
4.57
6.30
8.16
9.41
12.0
2.28
3.32
3.99
5.30
7.06
9.14
11.3
12.7
15.6 4.0
2.5
3.73
5.07
5.91
7.50
9.55
11.9
14.3
15.8
18.9
6.5
4.51
6.00
6.90
8.61
10.8
13.3
15.7
17.3
20.5
6.17
7.91
8.95
10.9
13.3
16.0
18.6
20.3
23.6
1.0
26.6
29.5
5.76
8.30
10.5
1.03
1.71
2.18
3.17
4.59
6.39
8.35
9.69
12.6
2.23
3.27
3.94
5.27
7.09
9.28
11.6
13.1
16.4
3.63
4.98
5.82
7.45
9.59
12.1
14.7
16.4
20.0
4.38
5.87
6.79
8.55
10.8
13.5
16.2
18.0
21.8
5.96
7.71
8.78
10.8
13.3
16.3
19.3
21.2
25.2
7.62
9.61
10.8
13.0
15.8
19.0
22.2
24.3
28.5
10X
XX
XX
0.25
1.0
1.5
2.5
4.0
X6.
510
15
9.35
11.6
12.9
15.3
18.3
21.7
25.2
27.4
31.8
XX
12.9
15.6
17.1
19.9
23.3
27.2
30.9
33.4
38.2
15 15.7
18.6
20.3
23.4
27.1
31.2
35.2
37.8
42.9 X
00
24
68
1012
1416
1820
2224
2628
3034
3832
3640
Qua
lity
ofsu
bmitt
edpr
oduc
t(p,
inpe
rcen
tnon
conf
orm
ing
forA
QL
s≤1
0;in
nonc
onfo
rmiti
espe
rhu
ndre
dun
itsfo
rAQ
Ls
>10
)N
ote:
Figu
res
oncu
rves
are
Acc
epta
nce
Qua
lity
Lim
its(A
QL
s)fo
rno
rmal
insp
ectio
n.
102030405060708090100
0.15
2.5
1.5
1.0
4.0
6.5
1015
0.65
PERCENTOFLOTS
EXPECTEDTOBE
ACCEPTED(Pa)
Copyright American Society for Quality Provided by IHS under license with ASQ
Not for ResaleNo reproduction or networking permitted without license from IHS
--`,,```,,,,````-`-`,,`,,`,`,,`---

48
TableX-J-2—SamplingPlans
forSampleSize
CodeLetter:J
Acc
epta
nce
Qua
lity
Lim
its(n
orm
alin
spec
tion)
Acc
epta
nce
Qua
lity
Lim
its(t
ight
ened
insp
ectio
n)
Type
ofsa
mpl
ing
plan
Sing
le
Les
sth
an0.
15 ∇
0.15
X0.
250.
400.
651.
01.
52.
54.
0X
6.5
X10
X15
*0
2
12
20 40 60 80 100
120
140
20 40 60 80 100
120
140
#2
#2
02
03
13
13
23
#2
03
03
14
24
35
45
#3
03
14
25
36
46
67
#4
15
26
37
58
79
910
04
16
38
510
711
1012
1314
04
27
49
611
912
1214
1415
05
38
610
813
1115
1417
1819
06
39
712
1015
1417
1820
2122
17
410
813
1217
1720
2123
2526
18
612
1117
1622
2225
2729
3233
29
714
1319
1925
2529
3133
3738
03
34
14
45
25
67
37
89
37
1112
59
1213
610
1516
711
1819
914
2324
1116
2627
50 100
*
Les
sth
an0.
25X
0.25
0.40
0.65
1.0
1.5
2.5
4.0
X6.
5X
10X
15X
Ac
Ac
Ac
Ac
Ac
Ac
Re
Ac
Re
Ac
Re
Ac
Re
Ac
Re
Ac
Re
Ac
Re
Ac
Re
Ac
Re
Ac
Re
Ac
Re
Re
Re
Re
Re
Re
Use
Cod
eL
ette
rH
080
Use
Cod
eL
ette
rL
Use
Cod
eL
ette
rK
12
23
34
56
78
89
1011
1213
1415
1819
2122
Hig
her
than 15
Hig
her
than 15
Ac
Re
1
Dou
ble
∇
Mul
tiple
∇
∆ ∆ ∆
∆ ∇ Ac
Re * #
Cum
u-la
tive
sam
ple
size
80
Cum
u-la
tive
sam
ple
size
=U
sene
xtpr
eced
ing
sam
ple
size
code
lette
rfo
rw
hich
acce
ptan
cean
dre
ject
ion
num
bers
are
avai
labl
e.
=U
sene
xtsu
bseq
uent
sam
ple
size
code
lette
rfo
rw
hich
acce
ptan
cean
dre
ject
ion
num
bers
are
avai
labl
e.
=A
ccep
tanc
enu
mbe
r.
=R
ejec
tion
num
ber.
=U
sesi
ngle
sam
plin
gpl
anab
ove
(or
alte
rnat
ivel
yus
eco
dele
tter
M).
=A
ccep
tanc
eno
tper
mitt
edat
this
sam
ple
size
.
50 100
JPLANS
Copyright American Society for Quality Provided by IHS under license with ASQ
Not for ResaleNo reproduction or networking permitted without license from IHS
--`,,```,,,,````-`-`,,`,,`,`,,`---
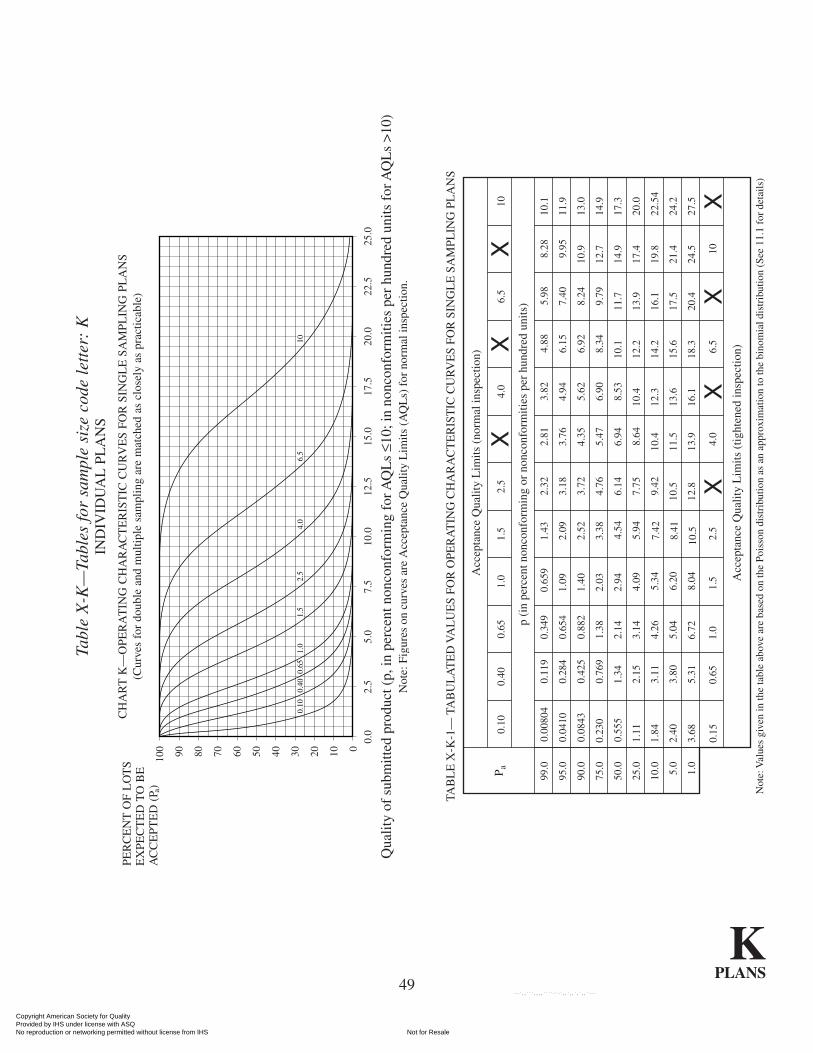
49
KPLANS
TableX-K—Tables
forsamplesize
code
letter:K
INDIVIDUALPLANS
CHARTK—OPERATINGCHARACTERISTICCURVESFORSINGLESAMPLINGPLANS
(Curvesfordoubleandmultiplesamplingarematchedascloselyaspracticable)
P a
Acc
epta
nce
Qua
lity
Lim
its(n
orm
alin
spec
tion)
TAB
LE
X-K
-1—
TAB
UL
AT
ED
VA
LU
ES
FOR
OPE
RA
TIN
GC
HA
RA
CT
ER
IST
ICC
UR
VE
SFO
RSI
NG
LE
SAM
PLIN
GPL
AN
S
Acc
epta
nce
Qua
lity
Lim
its(t
ight
ened
insp
ectio
n)
Not
e:V
alue
sgi
ven
inth
eta
ble
abov
ear
eba
sed
onth
ePo
isso
ndi
stri
butio
nas
anap
prox
imat
ion
toth
ebi
nom
iald
istr
ibut
ion
(See
11.1
for
deta
ils)
0.10
p(i
npe
rcen
tnon
conf
orm
ing
orno
ncon
form
ities
per
hund
red
units
)
0.65
0.40
1.0
1.5
2.5
4.0
6.5
10X
XX
99.0
2.32
2.81
3.82
4.88
95.0
3.18
3.76
4.94
6.15
90.0
3.72
4.35
5.62
6.92
75.0
4.76
5.47
6.90
8.34
50.0
6.14
6.94
8.53
10.1
25.0
7.75
8.64
10.4
12.2
10.0
9.42
10.4
12.3
14.2
5.0
10.5
11.5
13.6
15.6
0.00
804
0.04
10
0.08
43
0.23
0
0.55
5
1.11
1.84
2.40
3.68
0.15
0.11
9
0.28
4
0.42
5
0.76
9
1.34
2.15
3.11
3.80
5.31
0.34
9
0.65
4
0.88
2
1.38
2.14
3.14
4.26
5.04
6.72
1.5
1.0
2.5
0.65
0.65
9
1.09
1.40
2.03
2.94
4.09
5.34
6.20
8.04
1.43
2.09
2.52
3.38
4.54
5.94
7.42
8.41
10.5
1.0
12.8
13.9
16.1
18.3
5.98
7.40
8.24
9.79
11.7
13.9
16.1
17.5
20.4
8.28
9.95
10.9
12.7
14.9
17.4
19.8
21.4
24.5
10.1
11.9
13.0
14.9
17.3
20.0
22.5
4
24.2
27.5
4.0
X6.
510
XX
X
00.
02.
55.
07.
510
.012
.515
.017
.520
.022
.525
.0
Qua
lity
ofsu
bmitt
edpr
oduc
t(p,
inpe
rcen
tnon
conf
orm
ing
forA
QL
s≤1
0;in
nonc
onfo
rmiti
espe
rhu
ndre
dun
itsfo
rAQ
Ls
>10
)N
ote:
Figu
res
oncu
rves
are
Acc
epta
nce
Qua
lity
Lim
its(A
QL
s)fo
rno
rmal
insp
ectio
n.
102030405060708090100
0.65
0.10
0.40
2.5
1.5
1.0
4.0
6.5
10
PERCENTOFLOTS
EXPECTEDTOBE
ACCEPTED(Pa)
Copyright American Society for Quality Provided by IHS under license with ASQ
Not for ResaleNo reproduction or networking permitted without license from IHS
--`,,```,,,,````-`-`,,`,,`,`,,`---

50
TableX-K-2—SamplingPlans
forSampleSize
CodeLetter:K
Acc
epta
nce
Qua
lity
Lim
its(n
orm
alin
spec
tion)
Acc
epta
nce
Qua
lity
Lim
its(t
ight
ened
insp
ectio
n)
Type
ofsa
mpl
ing
plan
Sing
le
Les
sth
an0.
10 ∇
0.10
X0.
150.
250.
400.
651.
01.
52.
5X
4.0
X6.
5X
10
*0
2
12
32 64 96 128
160
192
224
32 64 96 128
160
192
224
#2
#2
02
03
13
13
23
#2
03
03
14
24
35
45
#3
03
14
25
36
46
67
#4
15
26
37
58
79
910
04
16
38
510
711
1012
1314
04
27
49
611
912
1214
1415
05
38
610
813
1115
1417
1819
06
39
712
1015
1417
1820
2122
17
410
813
1217
1720
2123
2526
18
612
1117
1622
2225
2729
3233
29
714
1319
1925
2529
3133
3738
03
34
14
45
25
67
37
89
37
1112
59
1213
610
1516
711
1819
914
2324
1116
2627
80 160
*
Les
sth
an0.
15X
0.15
0.25
0.40
0.65
1.0
1.5
2.5
X4.
0X
6.5
X10
X
Ac
Ac
Ac
Ac
Ac
Ac
Re
Ac
Re
Ac
Re
Ac
Re
Ac
Re
Ac
Re
Ac
Re
Ac
Re
Ac
Re
Ac
Re
Ac
Re
Re
Re
Re
Re
Re
Use
Cod
eL
ette
rJ
012
5U
seC
ode
Let
ter
M
Use
Cod
eL
ette
rL
12
23
34
56
78
89
1011
1213
1415
1819
2122
Hig
her
than 10
Hig
her
than 10
Ac
Re
1
Dou
ble
∇
Mul
tiple
∇
∆ ∆ ∆
∆ ∇ Ac
Re * #
Cum
u-la
tive
sam
ple
size
125
Cum
u-la
tive
sam
ple
size
=U
sene
xtpr
eced
ing
sam
ple
size
code
lette
rfo
rw
hich
acce
ptan
cean
dre
ject
ion
num
bers
are
avai
labl
e.
=U
sene
xtsu
bseq
uent
sam
ple
size
code
lette
rfo
rw
hich
acce
ptan
cean
dre
ject
ion
num
bers
are
avai
labl
e.
=A
ccep
tanc
enu
mbe
r.
=R
ejec
tion
num
ber.
=U
sesi
ngle
sam
plin
gpl
anab
ove
(or
alte
rnat
ivel
yus
eco
dele
tter
N).
=A
ccep
tanc
eno
tper
mitt
edat
this
sam
ple
size
.
80 160
KPLANS
Copyright American Society for Quality Provided by IHS under license with ASQ
Not for ResaleNo reproduction or networking permitted without license from IHS
--`,,```,,,,````-`-`,,`,,`,`,,`---
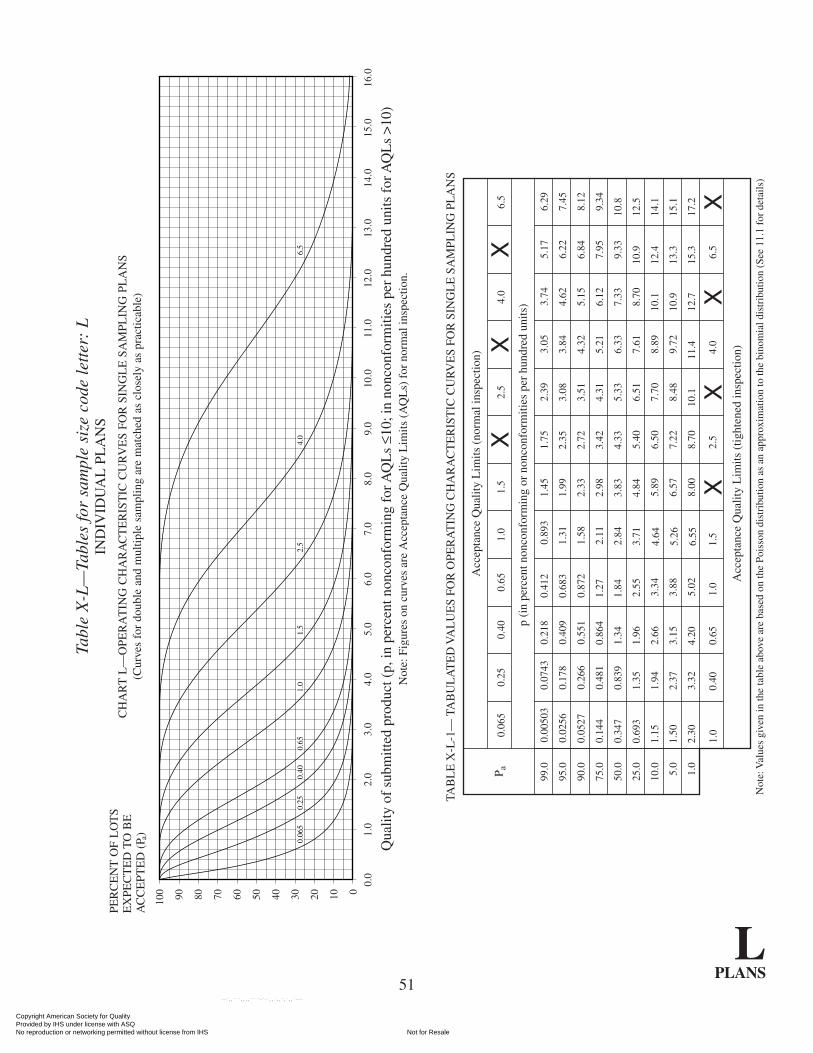
51
LPLANS
TableX-L—Tables
forsamplesize
code
letter:L
INDIVIDUALPLANS
CHARTL—OPERATINGCHARACTERISTICCURVESFORSINGLESAMPLINGPLANS
(Curvesfordoubleandmultiplesamplingarematchedascloselyaspracticable)
P a
Acc
epta
nce
Qua
lity
Lim
its(n
orm
alin
spec
tion)
TAB
LE
X-L
-1—
TAB
UL
AT
ED
VA
LU
ES
FOR
OPE
RA
TIN
GC
HA
RA
CT
ER
IST
ICC
UR
VE
SFO
RSI
NG
LE
SAM
PLIN
GPL
AN
S
Acc
epta
nce
Qua
lity
Lim
its(t
ight
ened
insp
ectio
n)
Not
e:V
alue
sgi
ven
inth
eta
ble
abov
ear
eba
sed
onth
ePo
isso
ndi
stri
butio
nas
anap
prox
imat
ion
toth
ebi
nom
iald
istr
ibut
ion
(See
11.1
for
deta
ils)
0.06
5
p(i
npe
rcen
tnon
conf
orm
ing
orno
ncon
form
ities
per
hund
red
units
)
0.40
0.25
0.65
1.0
1.5
2.5
4.0
6.5
XX
X
99.0
1.45
1.75
2.39
3.05
95.0
1.99
2.35
3.08
3.84
90.0
2.33
2.72
3.51
4.32
75.0
2.98
3.42
4.31
5.21
50.0
3.83
4.33
5.33
6.33
25.0
4.84
5.40
6.51
7.61
10.0
5.89
6.50
7.70
8.89
5.0
6.57
7.22
8.48
9.72
0.00
503
0.02
56
0.05
27
0.14
4
0.34
7
0.69
3
1.15
1.50
2.30
1.0
0.07
43
0.17
8
0.26
6
0.48
1
0.83
9
1.35
1.94
2.37
3.32
0.21
8
0.40
9
0.55
1
0.86
4
1.34
1.96
2.66
3.15
4.20
1.0
0.65
1.5
0.40
0.41
2
0.68
3
0.87
2
1.27
1.84
2.55
3.34
3.88
5.02
0.89
3
1.31
1.58
2.11
2.84
3.71
4.64
5.26
6.55
1.0
8.00
8.70
10.1
11.4
3.74
4.62
5.15
6.12
7.33
8.70
10.1
10.9
12.7
5.17
6.22
6.84
7.95
9.33
10.9
12.4
13.3
15.3
6.29
7.45
8.12
9.34
10.8
12.5
14.1
15.1
17.2
2.5
X4.
06.
5X
XX
00.
01.
02.
03.
04.
05.
06.
07.
08.
09.
010
.011
.012
.013
.014
.015
.016
.0
Qua
lity
ofsu
bmitt
edpr
oduc
t(p,
inpe
rcen
tnon
conf
orm
ing
forA
QL
s≤1
0;in
nonc
onfo
rmiti
espe
rhu
ndre
dun
itsfo
rAQ
Ls
>10
)N
ote:
Figu
res
oncu
rves
are
Acc
epta
nce
Qua
lity
Lim
its(A
QL
s)fo
rno
rmal
insp
ectio
n.
102030405060708090100
0.65
0.25
0.06
50.
402.
51.
51.
04.
06.
5
PERCENTOFLOTS
EXPECTEDTOBE
ACCEPTED(Pa)
Copyright American Society for Quality Provided by IHS under license with ASQ
Not for ResaleNo reproduction or networking permitted without license from IHS
--`,,```,,,,````-`-`,,`,,`,`,,`---

52
TableX-L-2—SamplingPlans
forSampleSize
CodeLetter:L
Acc
epta
nce
Qua
lity
Lim
its(n
orm
alin
spec
tion)
Acc
epta
nce
Qua
lity
Lim
its(t
ight
ened
insp
ectio
n)
Type
ofsa
mpl
ing
plan
Sing
le
Les
sth
an0.
065
∇
0.06
5X
0.10
0.15
0.25
0.40
0.65
1.0
1.5
X2.
5X
4.0
X6.
5
*0
2
12
50 100
150
200
250
300
350
50 100
150
200
250
300
350
#2
#2
02
03
13
13
23
#2
03
03
14
24
35
45
#3
03
14
25
36
46
67
#4
15
26
37
58
79
910
04
16
38
510
711
1012
1314
04
27
49
611
912
1214
1415
05
38
610
813
1115
1417
1819
06
39
712
1015
1417
1820
2122
17
410
813
1217
1720
2123
2526
18
612
1117
1622
2225
2729
3233
29
714
1319
1925
2529
3133
3738
03
34
14
45
25
67
37
89
37
1112
59
1213
610
1516
711
1819
914
2324
1116
2627
125
250
*
Les
sth
an0.
10X
0.10
0.15
0.25
0.40
0.65
1.0
1.5
X2.
5X
4.0
X6.
5X
Ac
Ac
Ac
Ac
Ac
Ac
Re
Ac
Re
Ac
Re
Ac
Re
Ac
Re
Ac
Re
Ac
Re
Ac
Re
Ac
Re
Ac
Re
Ac
Re
Re
Re
Re
Re
Re
Use
Cod
eL
ette
rK
020
0U
seC
ode
Let
ter
N
Use
Cod
eL
ette
rM
12
23
34
56
78
89
1011
1213
1415
1819
2122
Hig
her
than 6.5
Hig
her
than 6.5
Ac
Re
1
Dou
ble
∇
Mul
tiple
∇
∆ ∆ ∆
∆ ∇ Ac
Re * #
Cum
u-la
tive
sam
ple
size
200
Cum
u-la
tive
sam
ple
size
=U
sene
xtpr
eced
ing
sam
ple
size
code
lette
rfo
rw
hich
acce
ptan
cean
dre
ject
ion
num
bers
are
avai
labl
e.
=U
sene
xtsu
bseq
uent
sam
ple
size
code
lette
rfo
rw
hich
acce
ptan
cean
dre
ject
ion
num
bers
are
avai
labl
e.
=A
ccep
tanc
enu
mbe
r.
=R
ejec
tion
num
ber.
=U
sesi
ngle
sam
plin
gpl
anab
ove
(or
alte
rnat
ivel
yus
eco
dele
tter
P).
=A
ccep
tanc
eno
tper
mitt
edat
this
sam
ple
size
.
125
250
LPLANS
Copyright American Society for Quality Provided by IHS under license with ASQ
Not for ResaleNo reproduction or networking permitted without license from IHS
--`,,```,,,,````-`-`,,`,,`,`,,`---
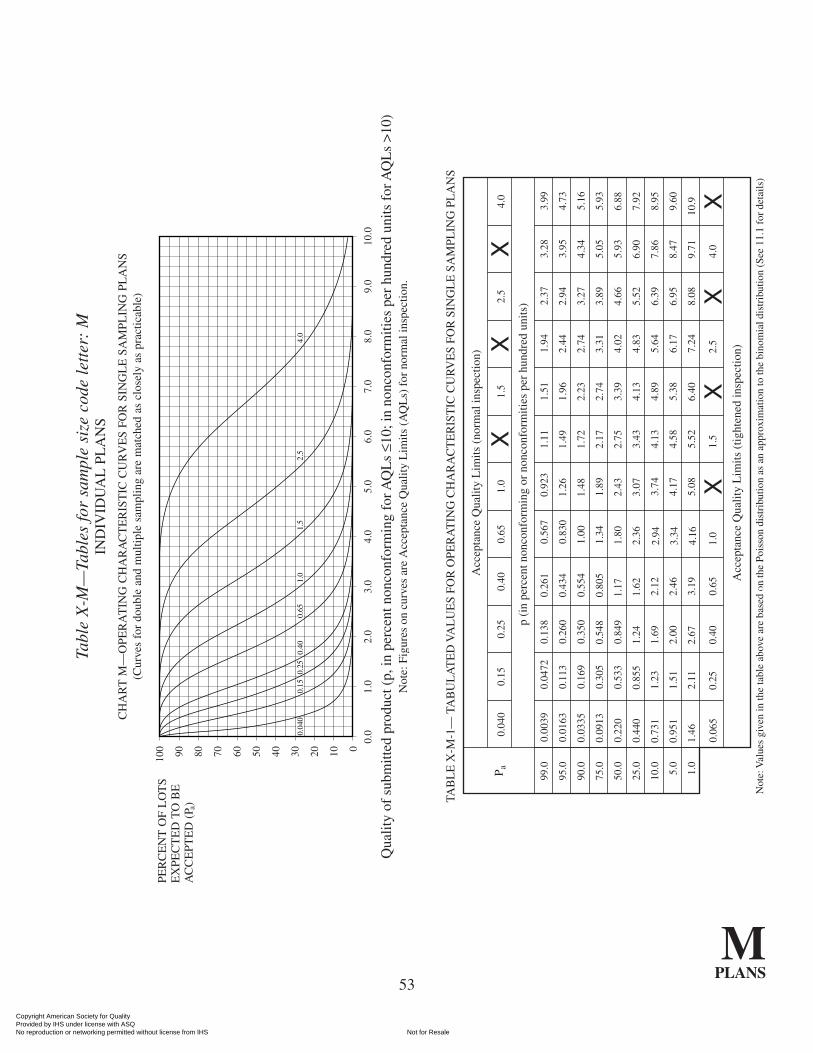
53
MPLANS
TableX-M
—Tables
forsamplesize
code
letter:M
INDIVIDUALPLANS
CHARTM—OPERATINGCHARACTERISTICCURVESFORSINGLESAMPLINGPLANS
(Curvesfordoubleandmultiplesamplingarematchedascloselyaspracticable)
P a
Acc
epta
nce
Qua
lity
Lim
its(n
orm
alin
spec
tion)
TAB
LE
X-M
-1—
TAB
UL
AT
ED
VA
LU
ES
FOR
OPE
RA
TIN
GC
HA
RA
CT
ER
IST
ICC
UR
VE
SFO
RSI
NG
LE
SAM
PLIN
GPL
AN
S
Acc
epta
nce
Qua
lity
Lim
its(t
ight
ened
insp
ectio
n)
Not
e:V
alue
sgi
ven
inth
eta
ble
abov
ear
eba
sed
onth
ePo
isso
ndi
stri
butio
nas
anap
prox
imat
ion
toth
ebi
nom
iald
istr
ibut
ion
(See
11.1
for
deta
ils)
0.04
0
p(i
npe
rcen
tnon
conf
orm
ing
orno
ncon
form
ities
per
hund
red
units
)
0.25
0.15
0.40
0.65
1.0
1.5
2.5
4.0
XX
X
99.0
0.92
31.
111.
511.
94
95.0
1.26
1.49
1.96
2.44
90.0
1.48
1.72
2.23
2.74
75.0
1.89
2.17
2.74
3.31
50.0
2.43
2.75
3.39
4.02
25.0
3.07
3.43
4.13
4.83
10.0
3.74
4.13
4.89
5.64
5.0
4.17
4.58
5.38
6.17
0.00
39
0.01
63
0.03
35
0.09
13
0.22
0
0.44
0
0.73
1
0.95
1
1.46
0.06
5
0.04
72
0.11
3
0.16
9
0.30
5
0.53
3
0.85
5
1.23
1.51
2.11
0.13
8
0.26
0
0.35
0
0.54
8
0.84
9
1.24
1.69
2.00
2.67
0.65
0.40
1.0
0.25
0.26
1
0.43
4
0.55
4
0.80
5
1.17
1.62
2.12
2.46
3.19
0.56
7
0.83
0
1.00
1.34
1.80
2.36
2.94
3.34
4.16
1.0
5.08
5.52
6.40
7.24
2.37
2.94
3.27
3.89
4.66
5.52
6.39
6.95
8.08
3.28
3.95
4.34
5.05
5.93
6.90
7.86
8.47
9.71
3.99
4.73
5.16
5.93
6.88
7.92
8.95
9.60
10.9
1.5
X2.
54.
0X
XX
00.
01.
02.
03.
04.
05.
06.
07.
08.
09.
010
.0
Qua
lity
ofsu
bmitt
edpr
oduc
t(p,
inpe
rcen
tnon
conf
orm
ing
forA
QL
s≤1
0;in
nonc
onfo
rmiti
espe
rhu
ndre
dun
itsfo
rAQ
Ls
>10
)N
ote:
Figu
res
oncu
rves
are
Acc
epta
nce
Qua
lity
Lim
its(A
QL
s)fo
rno
rmal
insp
ectio
n.
102030405060708090100
2.5
1.5
1.0
4.0
0.65
0.15
0.25
0.04
00.
40
PERCENTOFLOTS
EXPECTEDTOBE
ACCEPTED(Pa)
Copyright American Society for Quality Provided by IHS under license with ASQ
Not for ResaleNo reproduction or networking permitted without license from IHS
--`,,```,,,,````-`-`,,`,,`,`,,`---
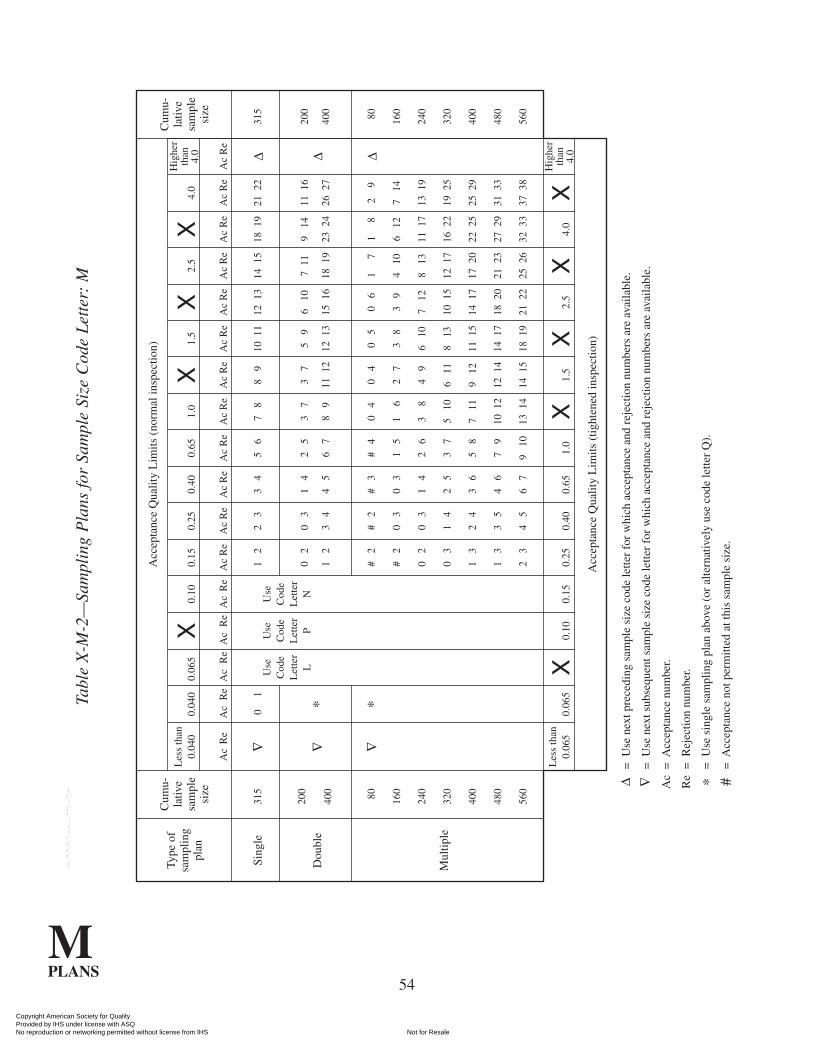
54
TableX-M
-2—SamplingPlans
forSampleSize
CodeLetter:M
Acc
epta
nce
Qua
lity
Lim
its(n
orm
alin
spec
tion)
Acc
epta
nce
Qua
lity
Lim
its(t
ight
ened
insp
ectio
n)
Type
ofsa
mpl
ing
plan
Sing
le
Les
sth
an0.
040
∇
0.04
0X
0.06
50.
100.
150.
250.
400.
651.
0X
1.5
X2.
5X
4.0
*0
2
12
80 160
240
320
400
480
560
80 160
240
320
400
480
560
#2
#2
02
03
13
13
23
#2
03
03
14
24
35
45
#3
03
14
25
36
46
67
#4
15
26
37
58
79
910
04
16
38
510
711
1012
1314
04
27
49
611
912
1214
1415
05
38
610
813
1115
1417
1819
06
39
712
1015
1417
1820
2122
17
410
813
1217
1720
2123
2526
18
612
1117
1622
2225
2729
3233
29
714
1319
1925
2529
3133
3738
03
34
14
45
25
67
37
89
37
1112
59
1213
610
1516
711
1819
914
2324
1116
2627
200
400
*
Les
sth
an0.
065
X0.
065
0.10
0.15
0.25
0.40
0.65
1.0
X1.
5X
2.5
X4.
0X
Ac
Ac
Ac
Ac
Ac
Ac
Re
Ac
Re
Ac
Re
Ac
Re
Ac
Re
Ac
Re
Ac
Re
Ac
Re
Ac
Re
Ac
Re
Ac
Re
Re
Re
Re
Re
Re
Use
Cod
eL
ette
rL
031
5U
seC
ode
Let
ter
P
Use
Cod
eL
ette
rN
12
23
34
56
78
89
1011
1213
1415
1819
2122
Hig
her
than 4.0
Hig
her
than 4.0
Ac
Re
1
Dou
ble
∇
Mul
tiple
∇
∆ ∆ ∆
∆ ∇ Ac
Re * #
Cum
u-la
tive
sam
ple
size
315
Cum
u-la
tive
sam
ple
size
=U
sene
xtpr
eced
ing
sam
ple
size
code
lette
rfo
rw
hich
acce
ptan
cean
dre
ject
ion
num
bers
are
avai
labl
e.
=U
sene
xtsu
bseq
uent
sam
ple
size
code
lette
rfo
rw
hich
acce
ptan
cean
dre
ject
ion
num
bers
are
avai
labl
e.
=A
ccep
tanc
enu
mbe
r.
=R
ejec
tion
num
ber.
=U
sesi
ngle
sam
plin
gpl
anab
ove
(or
alte
rnat
ivel
yus
eco
dele
tter
Q).
=A
ccep
tanc
eno
tper
mitt
edat
this
sam
ple
size
.
200
400
MPLANS
Copyright American Society for Quality Provided by IHS under license with ASQ
Not for ResaleNo reproduction or networking permitted without license from IHS
--`,,```,,,,````-`-`,,`,,`,`,,`---
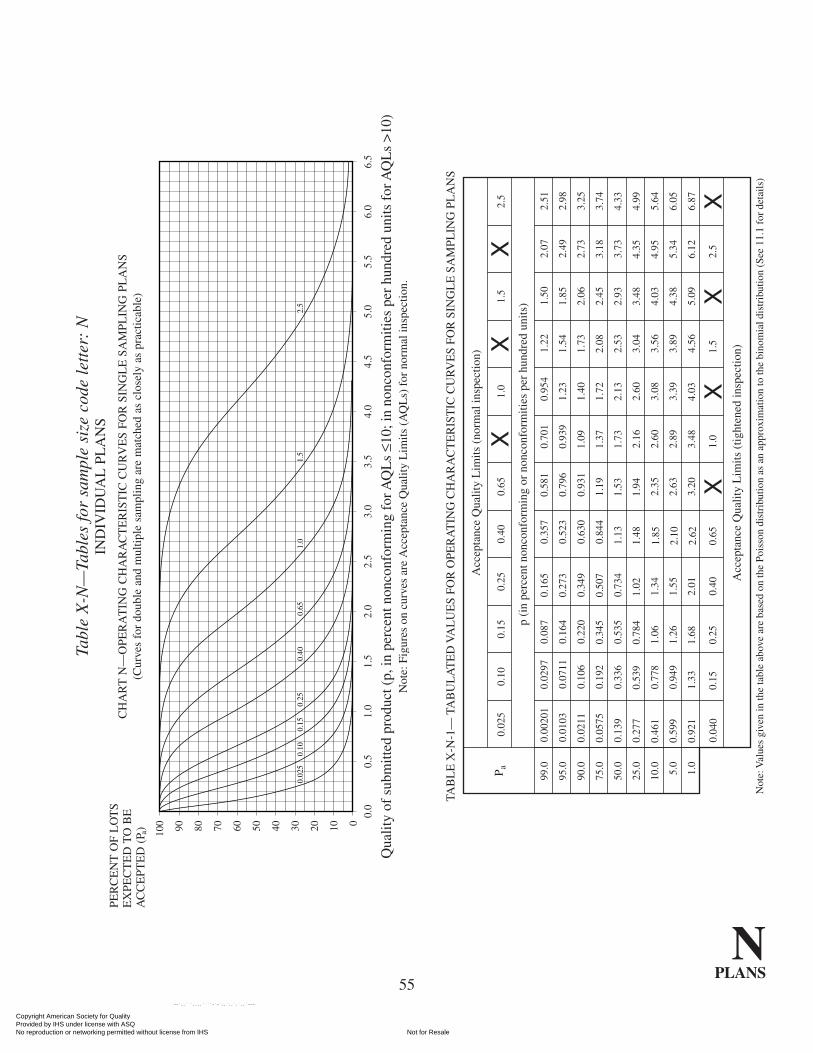
55
NPLANS
TableX-N—Tables
forsamplesize
code
letter:N
INDIVIDUALPLANS
CHARTN—OPERATINGCHARACTERISTICCURVESFORSINGLESAMPLINGPLANS
(Curvesfordoubleandmultiplesamplingarematchedascloselyaspracticable)
P a
Acc
epta
nce
Qua
lity
Lim
its(n
orm
alin
spec
tion)
TAB
LE
X-N
-1—
TAB
UL
AT
ED
VA
LU
ES
FOR
OPE
RA
TIN
GC
HA
RA
CT
ER
IST
ICC
UR
VE
SFO
RSI
NG
LE
SAM
PLIN
GPL
AN
S
Acc
epta
nce
Qua
lity
Lim
its(t
ight
ened
insp
ectio
n)
Not
e:V
alue
sgi
ven
inth
eta
ble
abov
ear
eba
sed
onth
ePo
isso
ndi
stri
butio
nas
anap
prox
imat
ion
toth
ebi
nom
iald
istr
ibut
ion
(See
11.1
for
deta
ils)
0.02
5
p(i
npe
rcen
tnon
conf
orm
ing
orno
ncon
form
ities
per
hund
red
units
)
0.15
0.10
0.25
0.40
0.65
1.0
1.5
2.5
XX
X
99.0
0.58
10.
701
0.95
41.
22
95.0
0.79
60.
939
1.23
1.54
90.0
0.93
11.
091.
401.
73
75.0
1.19
1.37
1.72
2.08
50.0
1.53
1.73
2.13
2.53
25.0
1.94
2.16
2.60
3.04
10.0
2.35
2.60
3.08
3.56
5.0
2.63
2.89
3.39
3.89
0.00
201
0.01
03
0.02
11
0.05
75
0.13
9
0.27
7
0.46
1
0.59
9
0.92
1
0.04
0
0.02
97
0.07
11
0.10
6
0.19
2
0.33
6
0.53
9
0.77
8
0.94
9
1.33
0.08
7
0.16
4
0.22
0
0.34
5
0.53
5
0.78
4
1.06
1.26
1.68
0.40
0.25
0.65
0.15
0.16
5
0.27
3
0.34
9
0.50
7
0.73
4
1.02
1.34
1.55
2.01
0.35
7
0.52
3
0.63
0
0.84
4
1.13
1.48
1.85
2.10
2.62
1.0
3.20
3.48
4.03
4.56
1.50
1.85
2.06
2.45
2.93
3.48
4.03
4.38
5.09
2.07
2.49
2.73
3.18
3.73
4.35
4.95
5.34
6.12
2.51
2.98
3.25
3.74
4.33
4.99
5.64
6.05
6.87
1.0
X1.
52.
5X
XX
00.
00.
51.
01.
52.
02.
53.
03.
54.
04.
55.
05.
56.
06.
5
Qua
lity
ofsu
bmitt
edpr
oduc
t(p,
inpe
rcen
tnon
conf
orm
ing
forA
QL
s≤1
0;in
nonc
onfo
rmiti
espe
rhu
ndre
dun
itsfo
rAQ
Ls
>10
)N
ote:
Figu
res
oncu
rves
are
Acc
epta
nce
Qua
lity
Lim
its(A
QL
s)fo
rno
rmal
insp
ectio
n.
102030405060708090100
1.0
1.5
2.5
0.02
50.
650.
400.
250.
150.
10
PERCENTOFLOTS
EXPECTEDTOBE
ACCEPTED(Pa)
Copyright American Society for Quality Provided by IHS under license with ASQ
Not for ResaleNo reproduction or networking permitted without license from IHS
--`,,```,,,,````-`-`,,`,,`,`,,`---
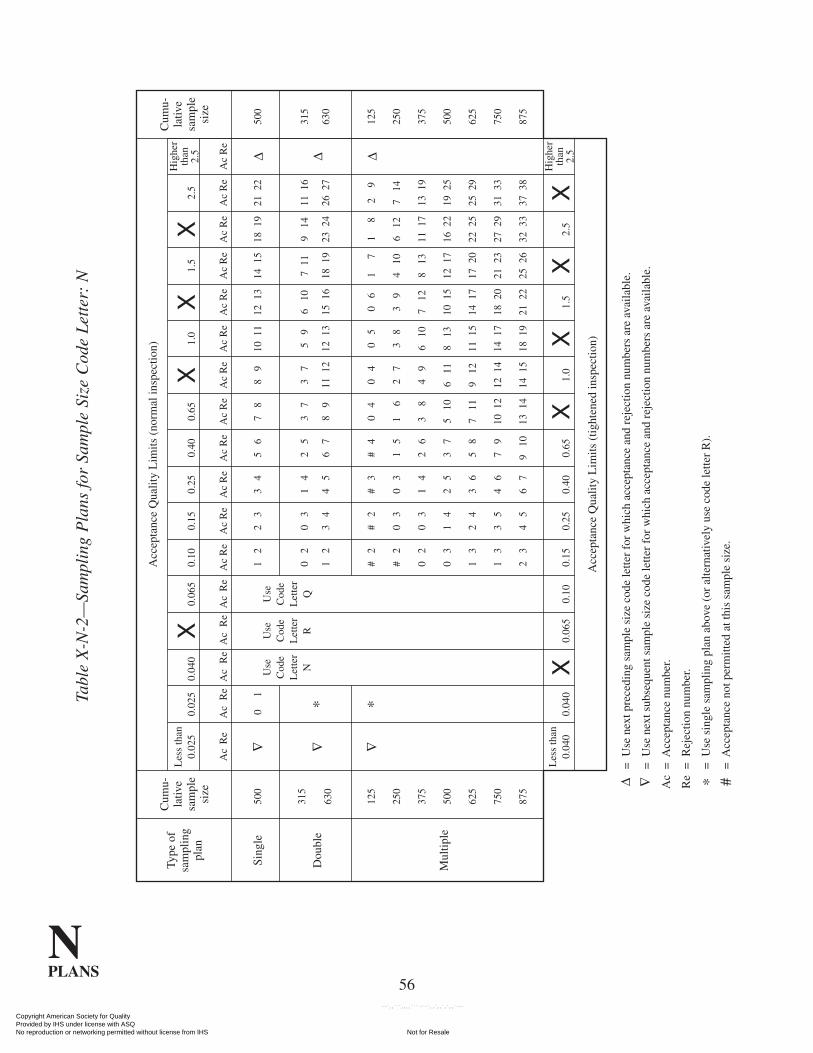
56
TableX-N-2—SamplingPlans
forSampleSize
CodeLetter:N
Acc
epta
nce
Qua
lity
Lim
its(n
orm
alin
spec
tion)
Acc
epta
nce
Qua
lity
Lim
its(t
ight
ened
insp
ectio
n)
Type
ofsa
mpl
ing
plan
Sing
le
Les
sth
an0.
025
∇
0.02
5X
0.04
00.
065
0.10
0.15
0.25
0.40
0.65
X1.
0X
1.5
X2.
5
*0
2
12
125
250
375
500
625
750
875
125
250
375
500
625
750
875
#2
#2
02
03
13
13
23
#2
03
03
14
24
35
45
#3
03
14
25
36
46
67
#4
15
26
37
58
79
910
04
16
38
510
711
1012
1314
04
27
49
611
912
1214
1415
05
38
610
813
1115
1417
1819
06
39
712
1015
1417
1820
2122
17
410
813
1217
1720
2123
2526
18
612
1117
1622
2225
2729
3233
29
714
1319
1925
2529
3133
3738
03
34
14
45
25
67
37
89
37
1112
59
1213
610
1516
711
1819
914
2324
1116
2627
315
630
*
Les
sth
an0.
040
X0.
040
0.06
50.
100.
150.
250.
400.
65X
1.0
X1.
5X
2.5
X
Ac
Ac
Ac
Ac
Ac
Ac
Re
Ac
Re
Ac
Re
Ac
Re
Ac
Re
Ac
Re
Ac
Re
Ac
Re
Ac
Re
Ac
Re
Ac
Re
Re
Re
Re
Re
Re
Use
Cod
eL
ette
rN
050
0U
seC
ode
Let
ter
R
Use
Cod
eL
ette
rQ
12
23
34
56
78
89
1011
1213
1415
1819
2122
Hig
her
than 2.5
Hig
her
than 2.5
Ac
Re
1
Dou
ble
∇
Mul
tiple
∇
∆ ∆ ∆
∆ ∇ Ac
Re * #
Cum
u-la
tive
sam
ple
size
500
Cum
u-la
tive
sam
ple
size
=U
sene
xtpr
eced
ing
sam
ple
size
code
lette
rfo
rw
hich
acce
ptan
cean
dre
ject
ion
num
bers
are
avai
labl
e.
=U
sene
xtsu
bseq
uent
sam
ple
size
code
lette
rfo
rw
hich
acce
ptan
cean
dre
ject
ion
num
bers
are
avai
labl
e.
=A
ccep
tanc
enu
mbe
r.
=R
ejec
tion
num
ber.
=U
sesi
ngle
sam
plin
gpl
anab
ove
(or
alte
rnat
ivel
yus
eco
dele
tter
R).
=A
ccep
tanc
eno
tper
mitt
edat
this
sam
ple
size
.
315
630
NPLANS
Copyright American Society for Quality Provided by IHS under license with ASQ
Not for ResaleNo reproduction or networking permitted without license from IHS
--`,,```,,,,````-`-`,,`,,`,`,,`---

57
PPLANS
TableX-P—Tables
forsamplesize
code
letter:P
INDIVIDUALPLANS
CHARTP—
OPERATINGCHARACTERISTICCURVESFORSINGLESAMPLINGPLANS
(Curvesfordoubleandmultiplesamplingarematchedascloselyaspracticable)
P a
Acc
epta
nce
Qua
lity
Lim
its(n
orm
alin
spec
tion)
TAB
LE
X-P
-1—
TAB
UL
AT
ED
VA
LU
ES
FOR
OPE
RA
TIN
GC
HA
RA
CT
ER
IST
ICC
UR
VE
SFO
RSI
NG
LE
SAM
PLIN
GPL
AN
S
Acc
epta
nce
Qua
lity
Lim
its(t
ight
ened
insp
ectio
n)
Not
e:V
alue
sgi
ven
inth
eta
ble
abov
ear
eba
sed
onth
ePo
isso
ndi
stri
butio
nas
anap
prox
imat
ion
toth
ebi
nom
iald
istr
ibut
ion
(See
11.1
for
deta
ils)
0.01
5
p(i
npe
rcen
tnon
conf
orm
ing
orno
ncon
form
ities
per
hund
red
units
)
0.10
0.06
50.
150.
250.
400.
651.
01.
5X
XX
99.0
0.36
30.
438
0.59
60.
762
95.0
0.49
80.
587
0.77
10.
961
90.0
0.58
20.
679
0.87
81.
08
75.0
0.74
50.
855
1.08
1.30
50.0
0.95
91.
081.
331.
58
25.0
1.21
1.35
1.63
1.90
10.0
1.47
1.62
1.93
2.22
5.0
1.64
1.80
2.12
2.43
0.00
126
0.00
641
0.01
32
0.03
60
0.08
66
0.17
3
0.28
8
0.37
4
0.57
6
0.02
5
0.01
86
0.04
44
0.06
65
0.12
0
0.21
0
0.33
7
0.48
6
0.59
3
0.83
0
0.05
45
0.10
2
0.13
8
0.21
6
0.33
4
0.49
0
0.66
5
0.78
7
1.05
0.25
0.15
0.40
0.10
0.10
3
0.17
1
0.21
8
0.31
7
0.45
9
0.63
0
0.83
5
0.96
9
1.26
0.22
3
0.32
7
0.39
4
0.52
7
0.70
9
0.92
8
1.16
1.31
1.64
1.0
2.00
2.18
2.52
2.85
0.93
5
1.16
1.29
1.53
1.83
2.17
2.52
2.74
3.18
1.29
1.56
1.71
1.99
2.33
2.72
3.09
3.34
3.82
1.57
1.86
2.03
2.34
2.71
3.12
3.52
3.78
4.29
0.65
X1.
01.
5X
XX
00.
00.
51.
01.
52.
02.
53.
03.
54.
0
Qua
lity
ofsu
bmitt
edpr
oduc
t(p,
inpe
rcen
tnon
conf
orm
ing
forA
QL
s≤1
0;in
nonc
onfo
rmiti
espe
rhu
ndre
dun
itsfo
rAQ
Ls
>10
)N
ote:
Figu
res
oncu
rves
are
Acc
epta
nce
Qua
lity
Lim
its(A
QL
s)fo
rno
rmal
insp
ectio
n.
102030405060708090100
1.0
1.5
0.01
50.
065
0.65
0.40
0.25
0.15
0.10
PERCENTOFLOTS
EXPECTEDTOBE
ACCEPTED(Pa)
Copyright American Society for Quality Provided by IHS under license with ASQ
Not for ResaleNo reproduction or networking permitted without license from IHS
--`,,```,,,,````-`-`,,`,,`,`,,`---

58
TableX-P-2—SamplingPlans
forSampleSize
CodeLetter:P
Acc
epta
nce
Qua
lity
Lim
its(n
orm
alin
spec
tion)
Acc
epta
nce
Qua
lity
Lim
its(t
ight
ened
insp
ectio
n)
Type
ofsa
mpl
ing
plan
Sing
le
Les
sth
an0.
010
∇
0.01
5X
0.02
50.
040
0.06
50.
100.
150.
250.
40X
0.65
X1.
0X
1.5
*0
2
12
200
400
600
800
1000
1200
1400
200
400
600
800
1000
1200
1400
#2
#2
02
03
13
13
23
#2
03
03
14
24
35
45
#3
03
14
25
36
46
67
#4
15
26
37
58
79
910
04
16
38
510
711
1012
1314
04
27
49
611
912
1214
1415
05
38
610
813
1115
1417
1819
06
39
712
1015
1417
1820
2122
17
410
813
1217
1720
2123
2526
18
612
1117
1622
2225
2729
3233
29
714
1319
1925
2529
3133
3738
03
34
14
45
25
67
37
89
37
1112
59
1213
610
1516
711
1819
914
2324
1116
2627
500
1000
*
Les
sth
an0.
025
X0.
025
0.04
00.
065
0.10
0.15
0.25
0.40
X0.
65X
1.0
X1.
5X
Ac
Ac
Ac
Ac
Ac
Ac
Re
Ac
Re
Ac
Re
Ac
Re
Ac
Re
Ac
Re
Ac
Re
Ac
Re
Ac
Re
Ac
Re
Ac
Re
Re
Re
Re
Re
Re
Use
Cod
eL
ette
rN
080
0U
seC
ode
Let
ter
R
Use
Cod
eL
ette
rQ
12
23
34
56
78
89
1011
1213
1415
1819
2122
Hig
her
than 1.5
Hig
her
than 1.5
Ac
Re
1
Dou
ble
∇
Mul
tiple
∇
∆ ∆ ∆
∆ ∇ Ac
Re * #
Cum
u-la
tive
sam
ple
size
800
Cum
u-la
tive
sam
ple
size
=U
sene
xtpr
eced
ing
sam
ple
size
code
lette
rfo
rw
hich
acce
ptan
cean
dre
ject
ion
num
bers
are
avai
labl
e.
=U
sene
xtsu
bseq
uent
sam
ple
size
code
lette
rfo
rw
hich
acce
ptan
cean
dre
ject
ion
num
bers
are
avai
labl
e.
=A
ccep
tanc
enu
mbe
r.
=R
ejec
tion
num
ber.
=U
sesi
ngle
sam
plin
gpl
anab
ove.
=A
ccep
tanc
eno
tper
mitt
edat
this
sam
ple
size
.
500
1000
PPLANS
Copyright American Society for Quality Provided by IHS under license with ASQ
Not for ResaleNo reproduction or networking permitted without license from IHS
--`,,```,,,,````-`-`,,`,,`,`,,`---
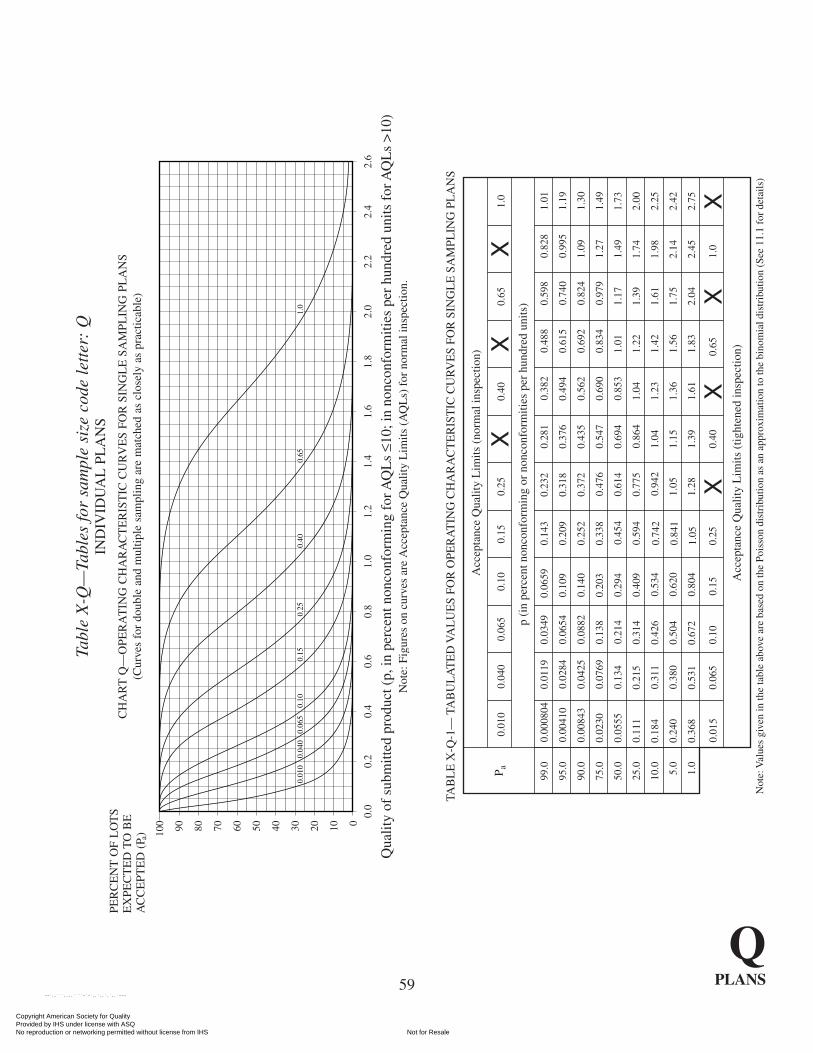
59
QPLANS
TableX-Q
—Tables
forsamplesize
code
letter:Q
INDIVIDUALPLANS
CHARTQ—OPERATINGCHARACTERISTICCURVESFORSINGLESAMPLINGPLANS
(Curvesfordoubleandmultiplesamplingarematchedascloselyaspracticable)
P a
Acc
epta
nce
Qua
lity
Lim
its(n
orm
alin
spec
tion)
TAB
LE
X-Q
-1—
TAB
UL
AT
ED
VA
LU
ES
FOR
OPE
RA
TIN
GC
HA
RA
CT
ER
IST
ICC
UR
VE
SFO
RSI
NG
LE
SAM
PLIN
GPL
AN
S
Acc
epta
nce
Qua
lity
Lim
its(t
ight
ened
insp
ectio
n)
Not
e:V
alue
sgi
ven
inth
eta
ble
abov
ear
eba
sed
onth
ePo
isso
ndi
stri
butio
nas
anap
prox
imat
ion
toth
ebi
nom
iald
istr
ibut
ion
(See
11.1
for
deta
ils)
0.01
0
p(i
npe
rcen
tnon
conf
orm
ing
orno
ncon
form
ities
per
hund
red
units
)
0.06
50.
040
0.10
0.15
0.25
0.40
0.65
1.0
XX
X
99.0
0.23
20.
281
0.38
2
95.0
0.31
80.
376
0.49
4
90.0
0.37
20.
435
0.56
2
75.0
0.47
60.
547
0.69
0
50.0
0.61
40.
694
0.85
3
25.0
0.77
50.
864
1.04
10.0
0.94
21.
041.
23
5.0
1.05
1.15
1.36
0.00
0804
0.00
410
0.00
843
0.02
30
0.05
55
0.11
1
0.18
4
0.24
0
0.36
8
0.01
5
0.01
19
0.02
84
0.04
25
0.07
69
0.13
4
0.21
5
0.31
1
0.38
0
0.53
1
0.03
49
0.06
54
0.08
82
0.13
8
0.21
4
0.31
4
0.42
6
0.50
4
0.67
2
0.15
0.10
0.25
0.06
5
0.06
59
0.10
9
0.14
0
0.20
3
0.29
4
0.40
9
0.53
4
0.62
0
0.80
4
0.14
3
0.20
9
0.25
2
0.33
8
0.45
4
0.59
4
0.74
2
0.84
1
1.05
1.0
1.28
1.39
1.61
0.59
8
0.74
0
0.82
4
0.97
9
1.17
1.39
1.61
1.75
2.04
0.48
8
0.61
5
0.69
2
0.83
4
1.01
1.22
1.42
1.56
1.83
0.82
8
0.99
5
1.09
1.27
1.49
1.74
1.98
2.14
2.45
1.01
1.19
1.30
1.49
1.73
2.00
2.25
2.42
2.75
0.40
X0.
651.
0X
XX
00.
00.
20.
40.
60.
81.
01.
21.
41.
61.
82.
02.
22.
42.
6
Qua
lity
ofsu
bmitt
edpr
oduc
t(p,
inpe
rcen
tnon
conf
orm
ing
forA
QL
s≤1
0;in
nonc
onfo
rmiti
espe
rhu
ndre
dun
itsfo
rAQ
Ls
>10
)N
ote:
Figu
res
oncu
rves
are
Acc
epta
nce
Qua
lity
Lim
its(A
QL
s)fo
rno
rmal
insp
ectio
n.
102030405060708090100
1.0
0.01
00.
040
0.06
50.
650.
400.
250.
150.
10
PERCENTOFLOTS
EXPECTEDTOBE
ACCEPTED(Pa)
Copyright American Society for Quality Provided by IHS under license with ASQ
Not for ResaleNo reproduction or networking permitted without license from IHS
--`,,```,,,,````-`-`,,`,,`,`,,`---
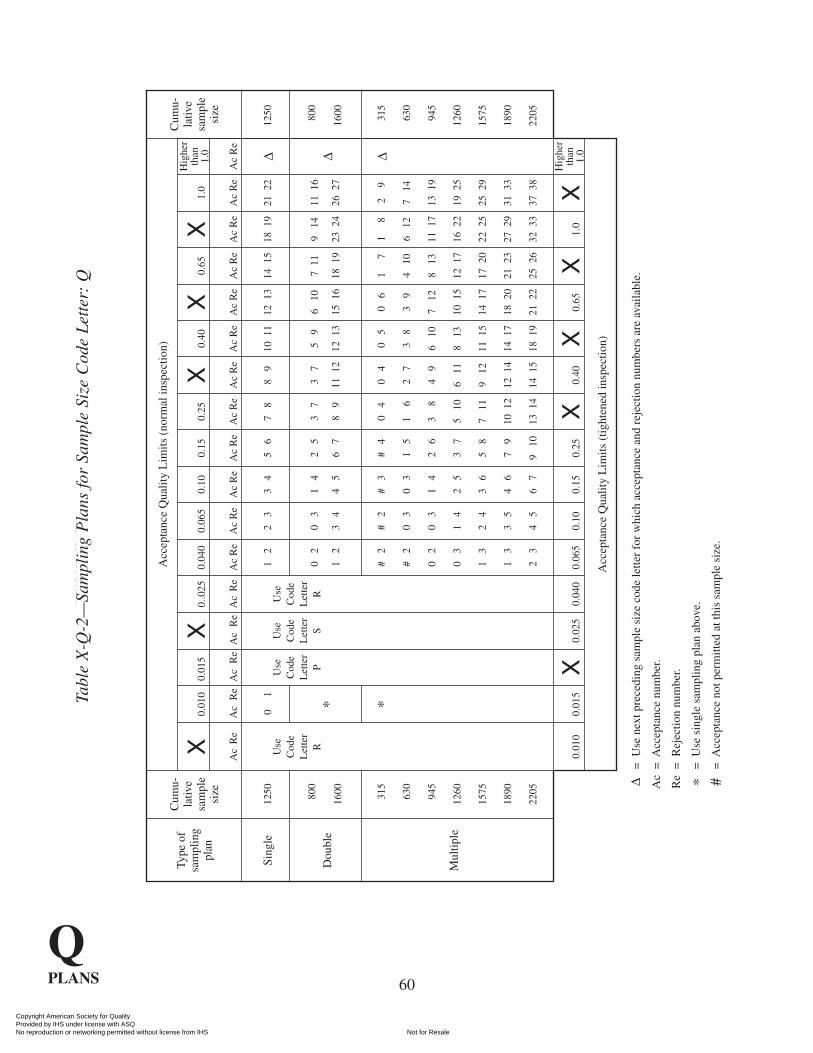
60
TableX-Q
-2—SamplingPlans
forSampleSize
CodeLetter:Q
Acc
epta
nce
Qua
lity
Lim
its(n
orm
alin
spec
tion)
Acc
epta
nce
Qua
lity
Lim
its(t
ight
ened
insp
ectio
n)
Type
ofsa
mpl
ing
plan
Sing
le
0.01
0X
X0.
015
0..0
250.
040
0.06
50.
100.
150.
25X
0.40
X0.
65X
1.0
*0
2
12
315
630
945
1260
1575
1890
2205
#2
#2
02
03
13
13
23
#2
03
03
14
24
35
45
#3
03
14
25
36
46
67
#4
15
26
37
58
79
910
04
16
38
510
711
1012
1314
04
27
49
611
912
1214
1415
05
38
610
813
1115
1417
1819
06
39
712
1015
1417
1820
2122
17
410
813
1217
1720
2123
2526
18
612
1117
1622
2225
2729
3233
29
714
1319
1925
2529
3133
3738
03
34
14
45
25
67
37
89
37
1112
59
1213
610
1516
711
1819
914
2324
1116
2627
*
0.01
0X
0.01
50.
025
0.04
00.
065
0.10
0.15
0.25
X0.
40X
0.65
X1.
0X
Ac
Ac
Ac
Ac
Ac
Ac
Re
Ac
Re
Ac
Re
Ac
Re
Ac
Re
Ac
Re
Ac
Re
Ac
Re
Ac
Re
Ac
Re
Ac
Re
Re
Re
Re
Re
Re
Use
Cod
eL
ette
rP
Use
Cod
eL
ette
rR
012
50U
seC
ode
Let
ter
S
Use
Cod
eL
ette
rR
12
23
34
56
78
89
1011
1213
1415
1819
2122
Hig
her
than 1.0
Hig
her
than 1.0
Ac
Re
1
Dou
ble
Mul
tiple
∆ ∆ ∆
∆ Ac
Re * #
Cum
u-la
tive
sam
ple
size
Cum
u-la
tive
sam
ple
size
=U
sene
xtpr
eced
ing
sam
ple
size
code
lette
rfo
rw
hich
acce
ptan
cean
dre
ject
ion
num
bers
are
avai
labl
e.
=A
ccep
tanc
enu
mbe
r.
=R
ejec
tion
num
ber.
=U
sesi
ngle
sam
plin
gpl
anab
ove.
=A
ccep
tanc
eno
tper
mitt
edat
this
sam
ple
size
.
800
1600
315
630
945
1260
1575
1890
2205
1250 800
1600
QPLANS
Copyright American Society for Quality Provided by IHS under license with ASQ
Not for ResaleNo reproduction or networking permitted without license from IHS
--`,,```,,,,````-`-`,,`,,`,`,,`---
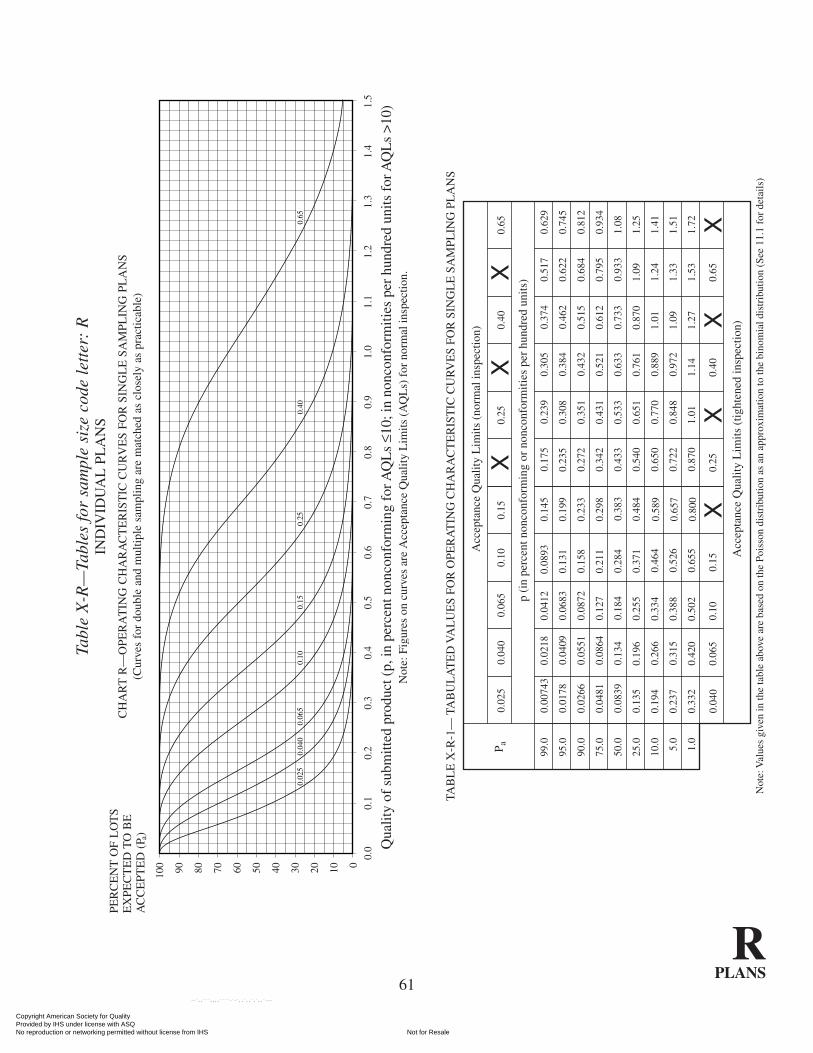
61
RPLANS
TableX-R—Tables
forsamplesize
code
letter:R
INDIVIDUALPLANS
CHARTR—OPERATINGCHARACTERISTICCURVESFORSINGLESAMPLINGPLANS
(Curvesfordoubleandmultiplesamplingarematchedascloselyaspracticable)
P a
Acc
epta
nce
Qua
lity
Lim
its(n
orm
alin
spec
tion)
TAB
LE
X-R
-1—
TAB
UL
AT
ED
VA
LU
ES
FOR
OPE
RA
TIN
GC
HA
RA
CT
ER
IST
ICC
UR
VE
SFO
RSI
NG
LE
SAM
PLIN
GPL
AN
S
Acc
epta
nce
Qua
lity
Lim
its(t
ight
ened
insp
ectio
n)
Not
e:V
alue
sgi
ven
inth
eta
ble
abov
ear
eba
sed
onth
ePo
isso
ndi
stri
butio
nas
anap
prox
imat
ion
toth
ebi
nom
iald
istr
ibut
ion
(See
11.1
for
deta
ils)
0.02
5
p(i
npe
rcen
tnon
conf
orm
ing
orno
ncon
form
ities
per
hund
red
units
)
0.06
50.
040
0.10
0.15
0.25
0.40
0.65
XX
X
99.0
0.17
5
95.0
0.23
5
90.0
0.27
2
75.0
0.34
2
50.0
0.43
3
25.0
0.54
0
10.0
0.65
0
5.0
0.72
2
0.00
743
0.01
78
0.02
66
0.04
81
0.08
39
0.13
5
0.19
4
0.23
7
0.33
2
0.04
0
0.02
18
0.04
09
0.05
51
0.08
64
0.13
4
0.19
6
0.26
6
0.31
5
0.42
0
0.04
12
0.06
83
0.08
72
0.12
7
0.18
4
0.25
5
0.33
4
0.38
8
0.50
2
0.15
0.10
0.06
5
0.08
93
0.13
1
0.15
8
0.21
1
0.28
4
0.37
1
0.46
4
0.52
6
0.65
5
0.14
5
0.19
9
0.23
3
0.29
8
0.38
3
0.48
4
0.58
9
0.65
7
0.80
01.
00.
870
0.30
5
0.38
4
0.43
2
0.52
1
0.63
3
0.76
1
0.88
9
0.97
2
1.14
0.23
9
0.30
8
0.35
1
0.43
1
0.53
3
0.65
1
0.77
0
0.84
8
1.01
0.37
4
0.46
2
0.51
5
0.61
2
0.73
3
0.87
0
1.01
1.09
1.27
0.62
9
0.74
5
0.81
2
0.93
4
1.08
1.25
1.41
1.51
1.72
0.51
7
0.62
2
0.68
4
0.79
5
0.93
3
1.09
1.24
1.33
1.53
0.25
X0.
400.
65X
XX
00.
00.
10.
20.
30.
40.
50.
60.
70.
80.
91.
01.
11.
21.
31.
41.
5
Qua
lity
ofsu
bmitt
edpr
oduc
t(p,
inpe
rcen
tnon
conf
orm
ing
forA
QL
s≤1
0;in
nonc
onfo
rmiti
espe
rhu
ndre
dun
itsfo
rAQ
Ls
>10
)N
ote:
Figu
res
oncu
rves
are
Acc
epta
nce
Qua
lity
Lim
its(A
QL
s)fo
rno
rmal
insp
ectio
n.
102030405060708090100
0.10
0.15
0.25
0.40
0.65
0.04
00.
025
0.06
5
PERCENTOFLOTS
EXPECTEDTOBE
ACCEPTED(Pa)
Copyright American Society for Quality Provided by IHS under license with ASQ
Not for ResaleNo reproduction or networking permitted without license from IHS
--`,,```,,,,````-`-`,,`,,`,`,,`---
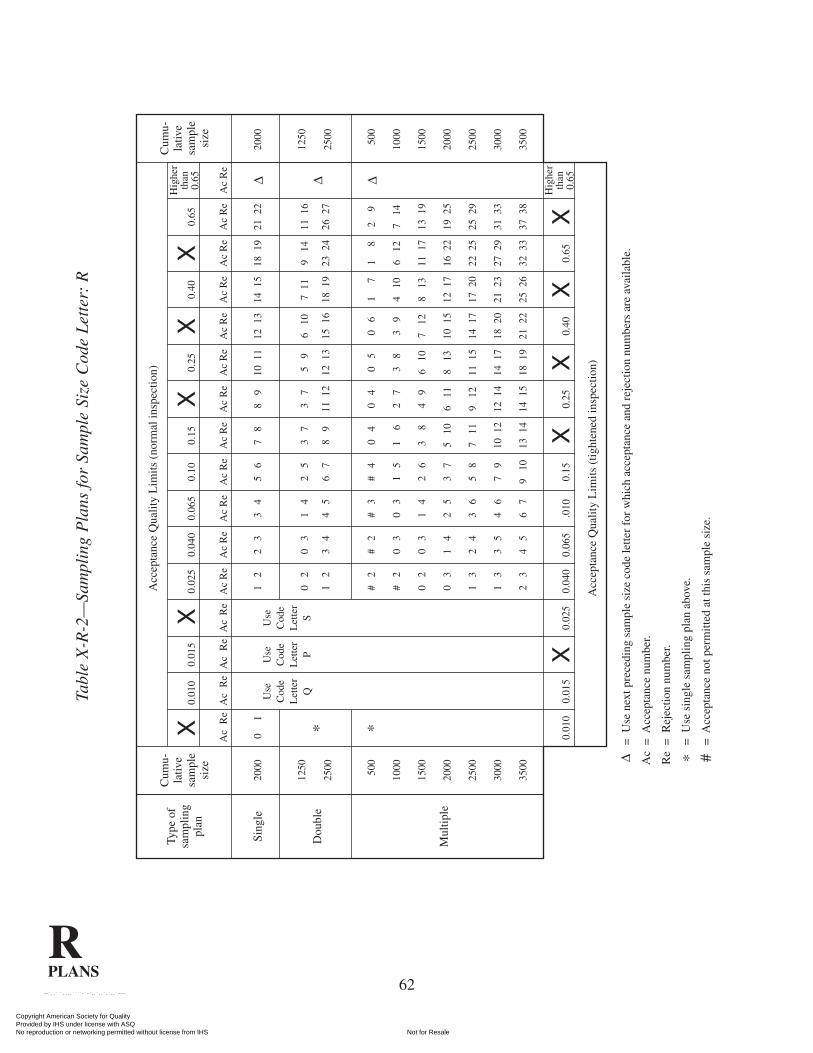
62
TableX-R-2—SamplingPlans
forSampleSize
CodeLetter:R
Acc
epta
nce
Qua
lity
Lim
its(n
orm
alin
spec
tion)
Acc
epta
nce
Qua
lity
Lim
its(t
ight
ened
insp
ectio
n)
Type
ofsa
mpl
ing
plan
Sing
le
XX
0.01
00.
015
0.02
50.
040
0.06
50.
100.
15X
0.25
X0.
40X
0.65
*0
2
12
500
1000
1500
2000
2500
3000
3500
#2
#2
02
03
13
13
23
#2
03
03
14
24
35
45
#3
03
14
25
36
46
67
#4
15
26
37
58
79
910
04
16
38
510
711
1012
1314
04
27
49
611
912
1214
1415
05
38
610
813
1115
1417
1819
06
39
712
1015
1417
1820
2122
17
410
813
1217
1720
2123
2526
18
612
1117
1622
2225
2729
3233
29
714
1319
1925
2529
3133
3738
03
34
14
45
25
67
37
89
37
1112
59
1213
610
1516
711
1819
914
2324
1116
2627
*
X0.
015
0.01
00.
025
0.04
00.
065
.010
0.15
0.25
XX
0.40
X0.
65X
Ac
Ac
Ac
Ac
Ac
Re
Ac
Re
Ac
Re
Ac
Re
Ac
Re
Ac
Re
Ac
Re
Ac
Re
Ac
Re
Ac
Re
Ac
Re
Re
Re
Re
Re
Use
Cod
eL
ette
rQ
020
00U
seC
ode
Let
ter
P
Use
Cod
eL
ette
rS
12
23
34
56
78
89
1011
1213
1415
1819
2122
Hig
her
than
0.65
Hig
her
than
0.65
Ac
Re
1
Dou
ble
Mul
tiple
∆ ∆ ∆
∆ Ac
Re * #
Cum
u-la
tive
sam
ple
size
Cum
u-la
tive
sam
ple
size
=U
sene
xtpr
eced
ing
sam
ple
size
code
lette
rfo
rw
hich
acce
ptan
cean
dre
ject
ion
num
bers
are
avai
labl
e.
=A
ccep
tanc
enu
mbe
r.
=R
ejec
tion
num
ber.
=U
sesi
ngle
sam
plin
gpl
anab
ove.
=A
ccep
tanc
eno
tper
mitt
edat
this
sam
ple
size
.
1250
2500
500
1000
1500
2000
2500
3000
3500
2000
1250
2500
RPLANS
Copyright American Society for Quality Provided by IHS under license with ASQ
Not for ResaleNo reproduction or networking permitted without license from IHS
--`,,```,,,,````-`-`,,`,,`,`,,`---
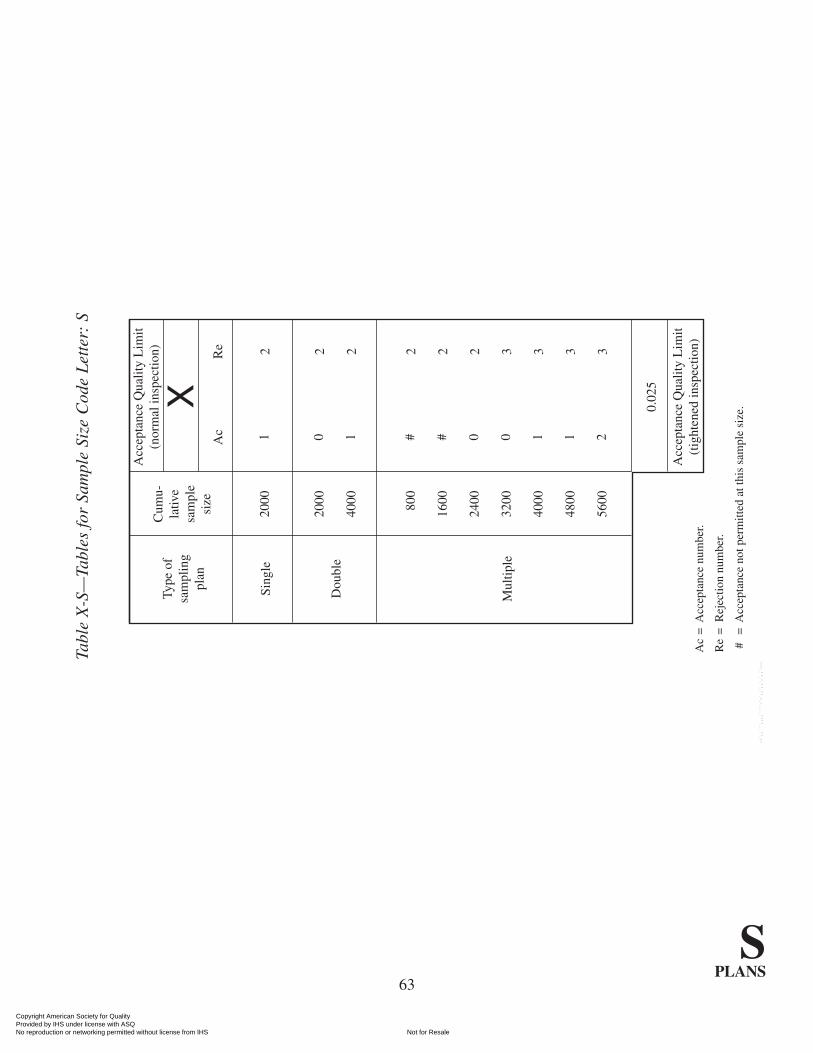
63
TableX-S—Tables
forSampleSize
CodeLetter:S
Type
ofsa
mpl
ing
plan
Cum
u-la
tive
sam
ple
size
Acc
epta
nce
Qua
lity
Lim
it(n
orm
alin
spec
tion)
Acc
epta
nce
Qua
lity
Lim
it(t
ight
ened
insp
ectio
n)
0.02
5
Ac
Re
Sing
le20
001
2
Mul
tiple
3200
03
4000
13
4800
13
5600
23
2400
02
1600
#2
800
#2
Dou
ble
2000
02
4000
12
X
Ac
=A
ccep
tanc
enu
mbe
r.
Re
=R
ejec
tion
num
ber.
#=
Acc
epta
nce
notp
erm
itted
atth
issa
mpl
esi
ze.
SPLANS
Copyright American Society for Quality Provided by IHS under license with ASQ
Not for ResaleNo reproduction or networking permitted without license from IHS
--`,,```,,,,````-`-`,,`,,`,`,,`---
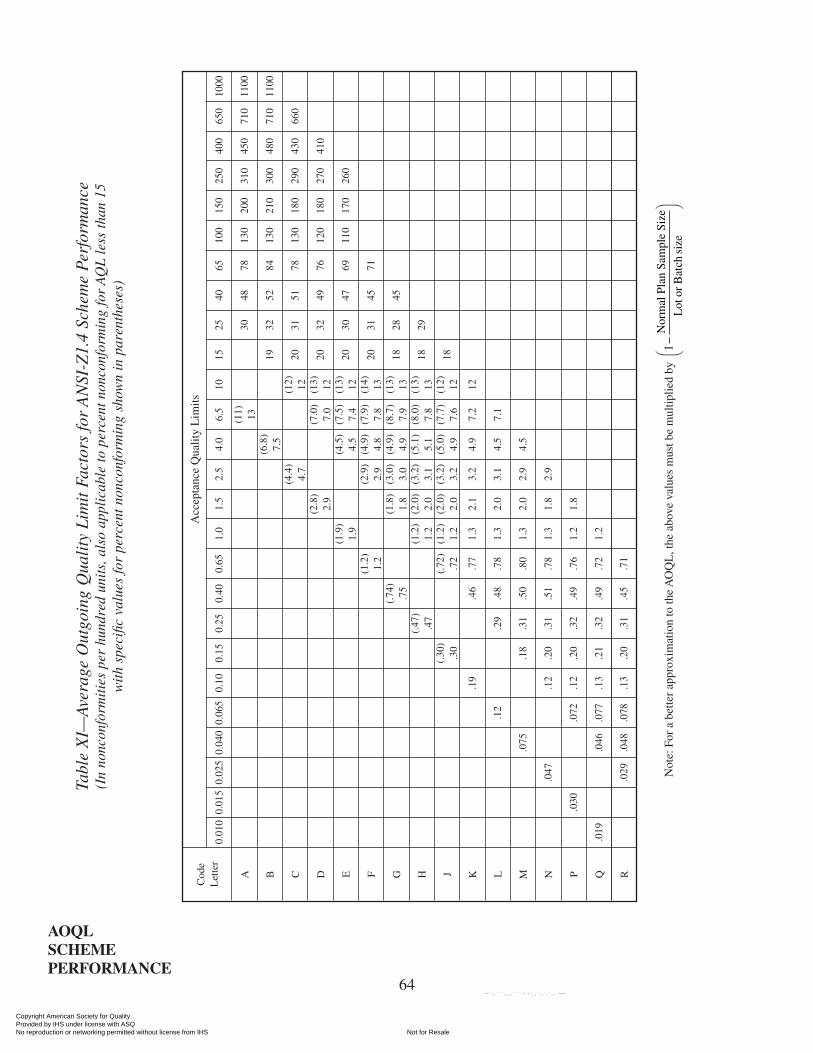
64
TableXI—
AverageOutgoingQualityLimitFa
ctorsforANSI-Z1.4SchemePerform
ance
(Innonconform
itiesperhundredunits,also
applicableto
percentnonconform
ingforAQLless
than
15withspecificvalues
forpercentnonconform
ingshow
nin
parentheses)
Cod
eL
ette
r
A B C D E F G H J K L M N P Q
Acc
epta
nce
Qua
lity
Lim
its
0.01
00.
015
0.02
50.
040
0.06
50.
100.
150.
250.
400.
651.
01.
52.
54.
06.
510
1525
4065
100
150
250
400
650
1000
(11) 13
3048
7813
020
031
045
071
011
00
(6.8
)7.
519
3252
8413
021
030
048
071
011
00
(4.4
)4.
7(1
2) 1220
3151
7813
018
029
043
066
0
(2.8
)2.
9(7
.0)
7.0
(13) 12
2032
4976
120
180
270
410
(1.9
)1.
9(4
.5)
4.5
(7.5
)7.
4(1
3) 1220
3047
6911
017
026
0
(1.2
)1.
2(2
.9)
2.9
(4.9
)4.
8(7
.9)
7.8
(14) 13
2031
4571
(.74
).7
5(1
.8)
1.8
(3.0
)3.
0(4
.9)
4.9
(8.7
)7.
9(1
3) 1318
2845
(.47
).4
7(1
.2)
1.2
(2.0
)2.
0(3
.2)
3.1
(5.1
)5.
1(8
.0)
7.8
(13) 13
1829
(.30
).3
0(.
72)
.72
(1.2
)1.
2(2
.0)
2.0
(3.2
)3.
2(5
.0)
4.9
(7.7
)7.
6(1
2) 1218
.19
.46
.77
1.3
2.1
3.2
4.9
7.2
12
.12
.29
.48
.78
1.3
2.0
3.1
4.5
7.1
.075
.18
.31
.50
.80
1.3
2.0
2.9
4.5
.047
.12
.20
.31
.51
.78
1.3
1.8
2.9
.030
.072
.12
.20
.32
.49
.76
1.2
1.8
.019
.046
.077
.13
.21
.32
.49
.72
1.2
R.0
29.0
48.0
78.1
3.2
0.3
1.4
5.7
1
Not
e:Fo
ra
bette
rap
prox
imat
ion
toth
eA
OQ
L,t
heab
ove
valu
esm
ustb
em
ultip
lied
by1
−N
orm
alPl
anSa
mpl
eSi
ze
Lot
orB
atch
size
AOQLSCHEMEPERFORMANCE
Copyright American Society for Quality Provided by IHS under license with ASQ
Not for ResaleNo reproduction or networking permitted without license from IHS
--`,,```,,,,````-`-`,,`,,`,`,,`---
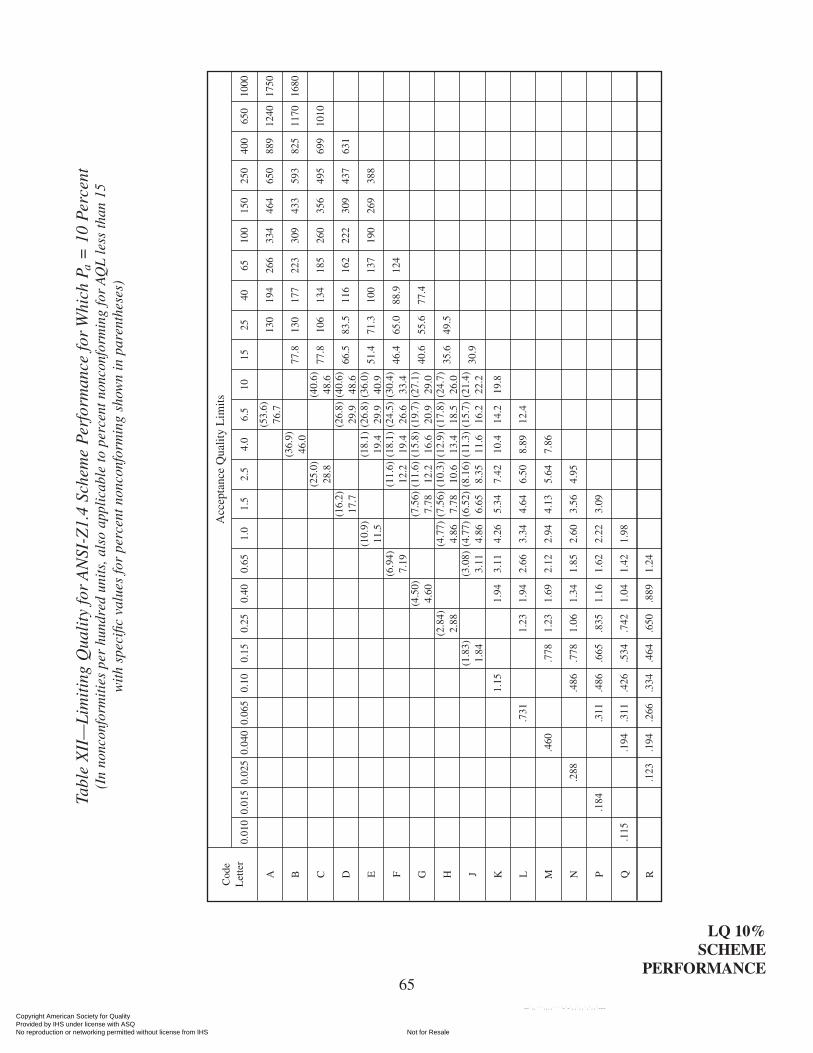
65
TableXII—LimitingQualityforANSI-Z1.4SchemePerform
ance
forWhich
P a=10
Percent
(Innonconform
itiesperhundredunits,also
applicableto
percentnonconform
ingforAQLless
than
15withspecificvalues
forpercentnonconform
ingshow
nin
parentheses)
Cod
eL
ette
r
A B C D E F G H J K L M N P Q
Acc
epta
nce
Qua
lity
Lim
its
0.01
00.
015
0.02
50.
040
0.06
50.
100.
150.
250.
400.
651.
01.
52.
54.
06.
510
1525
4065
100
150
250
400
650
1000
(53.
6)76
.713
019
426
633
446
465
088
912
4017
50
(36.
9)46
.077
.813
017
722
330
943
359
382
511
7016
80
(25.
0)28
.8(4
0.6)
48.6
77.8
106
134
185
260
356
495
699
1010
(16.
2)17
.7(2
6.8)
29.9
(40.
6)48
.666
.583
.511
616
222
230
943
763
1
(10.
9)11
.5(1
8.1)
19.4
(26.
8)29
.9(3
6.0)
40.9
51.4
71.3
100
137
190
269
388
(6.9
4)7.
19(1
1.6)
12.2
(18.
1)19
.4(2
4.5)
26.6
(30.
4)33
.446
.465
.088
.912
4
(4.5
0)4.
60(7
.56)
7.78
(11.
6)12
.2(1
5.8)
16.6
(19.
7)20
.9(2
7.1)
29.0
40.6
55.6
77.4
(2.8
4)2.
88(4
.77)
4.86
(7.5
6)7.
78(1
0.3)
10.6
(12.
9)13
.4(1
7.8)
18.5
(24.
7)26
.035
.649
.5
(1.8
3)1.
84(3
.08)
3.11
(4.7
7)4.
86(6
.52)
6.65
(8.1
6)8.
35(1
1.3)
11.6
(15.
7)16
.2(2
1.4)
22.2
30.9
1.15
1.94
3.11
4.26
5.34
7.42
10.4
14.2
19.8
.731
1.23
1.94
2.66
3.34
4.64
6.50
8.89
12.4
.460
.778
1.23
1.69
2.12
2.94
4.13
5.64
7.86
.288
.486
.778
1.06
1.34
1.85
2.60
3.56
4.95
.184
.311
.486
.665
.835
1.16
1.62
2.22
3.09
.115
.194
.311
.426
.534
.742
1.04
1.42
1.98
R.1
23.1
94.2
66.3
34.4
64.6
50.8
891.
24
LQ 10%SCHEME
PERFORMANCE
Copyright American Society for Quality Provided by IHS under license with ASQ
Not for ResaleNo reproduction or networking permitted without license from IHS
--`,,```,,,,````-`-`,,`,,`,`,,`---
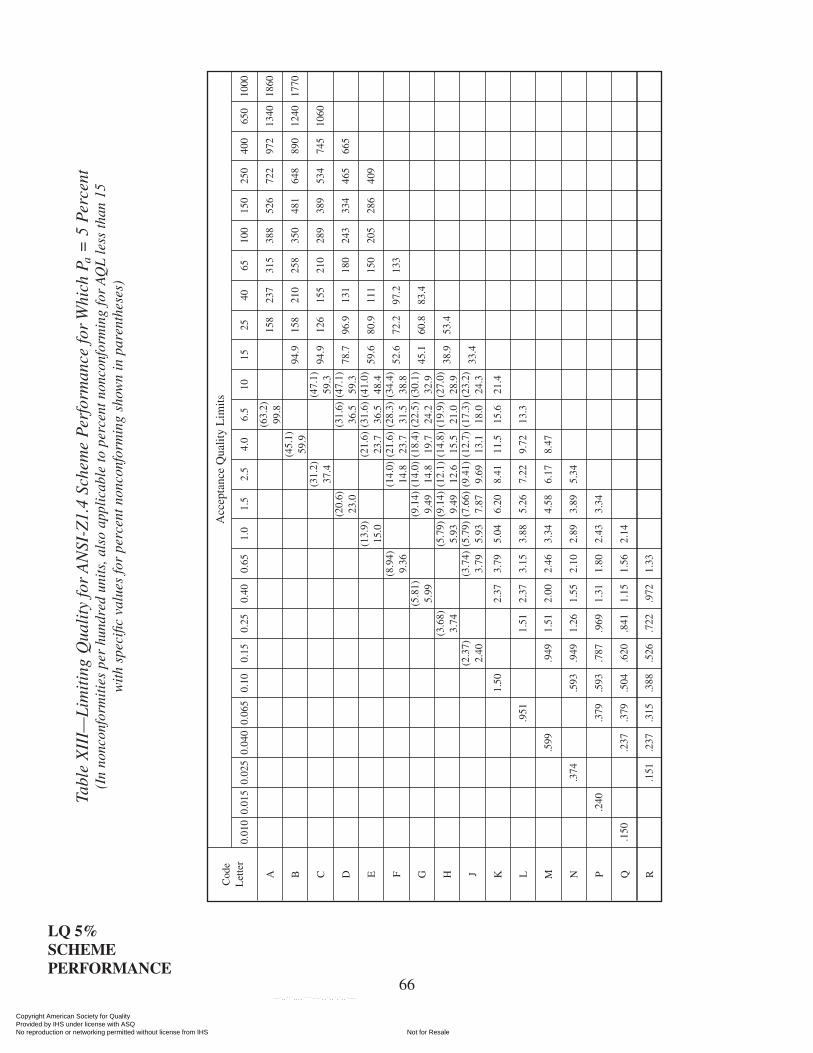
66
TableXIII—
LimitingQualityforANSI-Z1.4SchemePerform
ance
forWhich
P a=5Percent
(Innonconform
itiesperhundredunits,also
applicableto
percentnonconform
ingforAQLless
than
15withspecificvalues
forpercentnonconform
ingshow
nin
parentheses)
Cod
eL
ette
r
A B C D E F G H J K L M N P Q
Acc
epta
nce
Qua
lity
Lim
its
0.01
00.
015
0.02
50.
040
0.06
50.
100.
150.
250.
400.
651.
01.
52.
54.
06.
510
1525
4065
100
150
250
400
650
1000
(63.
2)99
.815
823
731
538
852
672
297
213
4018
60
(45.
1)59
.994
.915
821
025
835
048
164
889
012
4017
70
(31.
2)37
.4(4
7.1)
59.3
94.9
126
155
210
289
389
534
745
1060
(20.
6)23
.0(3
1.6)
36.5
(47.
1)59
.378
.796
.913
118
024
333
446
566
5
(13.
9)15
.0(2
1.6)
23.7
(31.
6)36
.5(4
1.0)
48.4
59.6
80.9
111
150
205
286
409
(8.9
4)9.
36(1
4.0)
14.8
(21.
6)23
.7(2
8.3)
31.5
(34.
4)38
.852
.672
.297
.213
3
(5.8
1)5.
99(9
.14)
9.49
(14.
0)14
.8(1
8.4)
19.7
(22.
5)24
.2(3
0.1)
32.9
45.1
60.8
83.4
(3.6
8)3.
74(5
.79)
5.93
(9.1
4)9.
49(1
2.1)
12.6
(14.
8)15
.5(1
9.9)
21.0
(27.
0)28
.938
.953
.4
(2.3
7)2.
40(3
.74)
3.79
(5.7
9)5.
93(7
.66)
7.87
(9.4
1)9.
69(1
2.7)
13.1
(17.
3)18
.0(2
3.2)
24.3
33.4
1.50
2.37
3.79
5.04
6.20
8.41
11.5
15.6
21.4
.951
1.51
2.37
3.15
3.88
5.26
7.22
9.72
13.3
.599
.949
1.51
2.00
2.46
3.34
4.58
6.17
8.47
.374
.593
.949
1.26
1.55
2.10
2.89
3.89
5.34
.240
.379
.593
.787
.969
1.31
1.80
2.43
3.34
.150
.237
.379
.504
.620
.841
1.15
1.56
2.14
R.1
51.2
37.3
15.3
88.5
26.7
22.9
721.
33
LQ 5%SCHEMEPERFORMANCE
Copyright American Society for Quality Provided by IHS under license with ASQ
Not for ResaleNo reproduction or networking permitted without license from IHS
--`,,```,,,,````-`-`,,`,,`,`,,`---
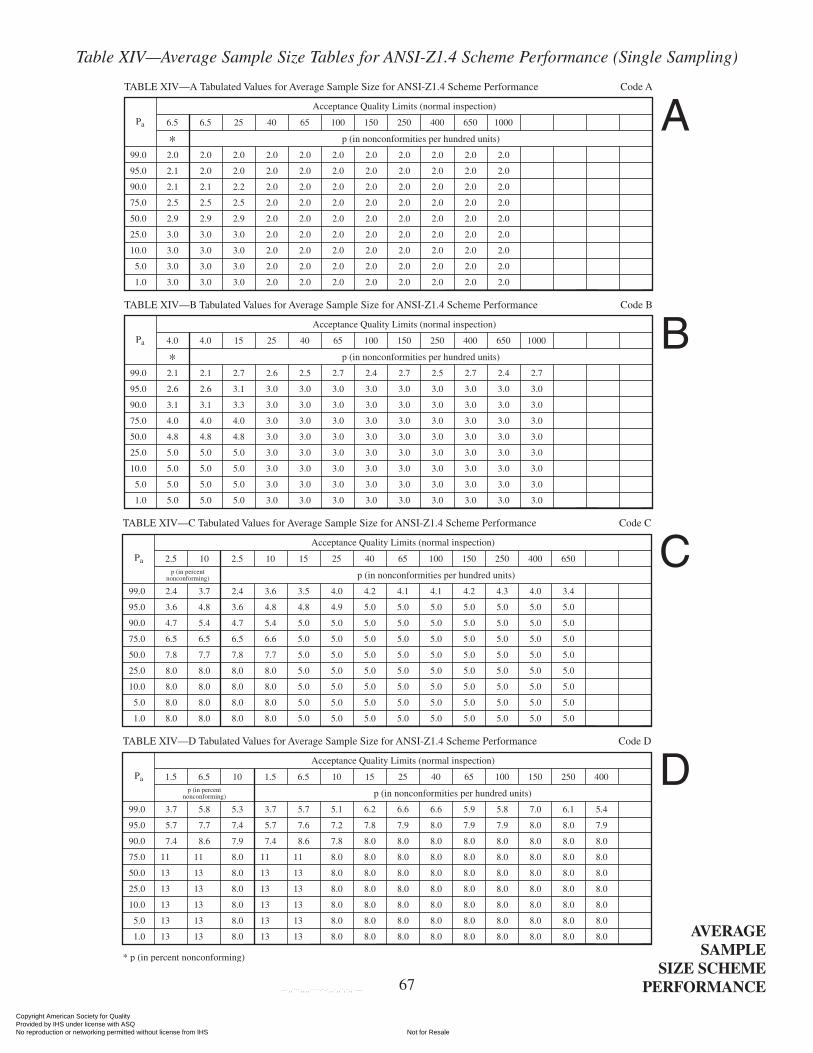
Table XIV—Average Sample Size Tables for ANSI-Z1.4 Scheme Performance (Single Sampling)
Pa
Acceptance Quality Limits (normal inspection)
TABLE XIV—A Tabulated Values for Average Sample Size for ANSI-Z1.4 Scheme Performance Code A
Ap (in nonconformities per hundred units)
6.5
*99.0
95.0
90.0
75.0
50.0
25.0
10.0
5.0
2.0
2.1
2.1
2.5
2.9
3.0
3.0
3.0
3.0
6.5
2.0
2.0
2.1
2.5
2.9
3.0
3.0
3.0
3.0
25
2.0
2.0
2.2
2.5
2.9
3.0
3.0
3.0
3.0
40
2.0
2.0
2.0
2.0
2.0
2.0
2.0
2.0
2.0
65
2.0
2.0
2.0
2.0
2.0
2.0
2.0
2.0
2.0
100
2.0
2.0
2.0
2.0
2.0
2.0
2.0
2.0
2.0
150
2.0
2.0
2.0
2.0
2.0
2.0
2.0
2.0
2.0
250
2.0
2.0
2.0
2.0
2.0
2.0
2.0
2.0
2.0
400
2.0
2.0
2.0
2.0
2.0
2.0
2.0
2.0
2.0
650
2.0
2.0
2.0
2.0
2.0
2.0
2.0
2.0
2.0
1000
2.0
2.0
2.0
2.0
2.0
2.0
2.0
2.0
2.01.0
Pa
Acceptance Quality Limits (normal inspection)
TABLE XIV—B Tabulated Values for Average Sample Size for ANSI-Z1.4 Scheme Performance Code B
Bp (in nonconformities per hundred units)
4.0
*99.0
95.0
90.0
75.0
50.0
25.0
10.0
5.0
2.1
2.6
3.1
4.0
4.8
5.0
5.0
5.0
5.0
4.0
2.1
2.6
3.1
4.0
4.8
5.0
5.0
5.0
5.0
15
2.7
3.1
3.3
4.0
4.8
5.0
5.0
5.0
5.0
25
2.6
3.0
3.0
3.0
3.0
3.0
3.0
3.0
3.0
40
2.5
3.0
3.0
3.0
3.0
3.0
3.0
3.0
3.0
65
2.7
3.0
3.0
3.0
3.0
3.0
3.0
3.0
3.0
100
2.4
3.0
3.0
3.0
3.0
3.0
3.0
3.0
3.0
150
2.7
3.0
3.0
3.0
3.0
3.0
3.0
3.0
3.0
250
2.5
3.0
3.0
3.0
3.0
3.0
3.0
3.0
3.0
400
2.7
3.0
3.0
3.0
3.0
3.0
3.0
3.0
3.0
650
2.4
3.0
3.0
3.0
3.0
3.0
3.0
3.0
3.0
1000
2.7
3.0
3.0
3.0
3.0
3.0
3.0
3.0
3.01.0
Pa
Acceptance Quality Limits (normal inspection)
TABLE XIV—C Tabulated Values for Average Sample Size for ANSI-Z1.4 Scheme Performance Code C
Cp (in nonconformities per hundred units)p (in percent
nonconforming)
2.5
99.0
95.0
90.0
75.0
50.0
25.0
10.0
5.0
2.4
3.6
4.7
6.5
7.8
8.0
8.0
8.0
8.0
10
3.7
4.8
5.4
6.5
7.7
8.0
8.0
8.0
8.0
2.5
2.4
3.6
4.7
6.5
7.8
8.0
8.0
8.0
8.0
10
3.6
4.8
5.4
6.6
7.7
8.0
8.0
8.0
8.0
15
3.5
4.8
5.0
5.0
5.0
5.0
5.0
5.0
5.0
25
4.0
4.9
5.0
5.0
5.0
5.0
5.0
5.0
5.0
40
4.2
5.0
5.0
5.0
5.0
5.0
5.0
5.0
5.0
65
4.1
5.0
5.0
5.0
5.0
5.0
5.0
5.0
5.0
100
4.1
5.0
5.0
5.0
5.0
5.0
5.0
5.0
5.0
150
4.2
5.0
5.0
5.0
5.0
5.0
5.0
5.0
5.0
250
4.3
5.0
5.0
5.0
5.0
5.0
5.0
5.0
5.0
400
4.0
5.0
5.0
5.0
5.0
5.0
5.0
5.0
5.0
650
3.4
5.0
5.0
5.0
5.0
5.0
5.0
5.0
5.01.0
Pa
Acceptance Quality Limits (normal inspection)
TABLE XIV—D Tabulated Values for Average Sample Size for ANSI-Z1.4 Scheme Performance Code D
Dp (in nonconformities per hundred units)
* p (in percent nonconforming)
p (in percentnonconforming)
1.5
99.0
95.0
90.0
75.0
50.0
25.0
10.0
5.0
3.7
5.7
7.4
11
13
13
13
13
13
6.5
5.8
7.7
8.6
11
13
13
13
13
13
10
5.3
7.4
7.9
8.0
8.0
8.0
8.0
8.0
8.0
1.5
3.7
5.7
7.4
11
13
13
13
13
13
6.5
5.7
7.6
8.6
11
13
13
13
13
13
10
5.1
7.2
7.8
8.0
8.0
8.0
8.0
8.0
8.0
15
6.2
7.8
8.0
8.0
8.0
8.0
8.0
8.0
8.0
25
6.6
7.9
8.0
8.0
8.0
8.0
8.0
8.0
8.0
40
6.6
8.0
8.0
8.0
8.0
8.0
8.0
8.0
8.0
65
5.9
7.9
8.0
8.0
8.0
8.0
8.0
8.0
8.0
100
5.8
7.9
8.0
8.0
8.0
8.0
8.0
8.0
8.0
150
7.0
8.0
8.0
8.0
8.0
8.0
8.0
8.0
8.0
250
6.1
8.0
8.0
8.0
8.0
8.0
8.0
8.0
8.0
400
5.4
7.9
8.0
8.0
8.0
8.0
8.0
8.0
8.01.0 AVERAGESAMPLE
SIZE SCHEMEPERFORMANCE67
Copyright American Society for Quality Provided by IHS under license with ASQ
Not for ResaleNo reproduction or networking permitted without license from IHS
--`,,```,,,,````-`-`,,`,,`,`,,`---
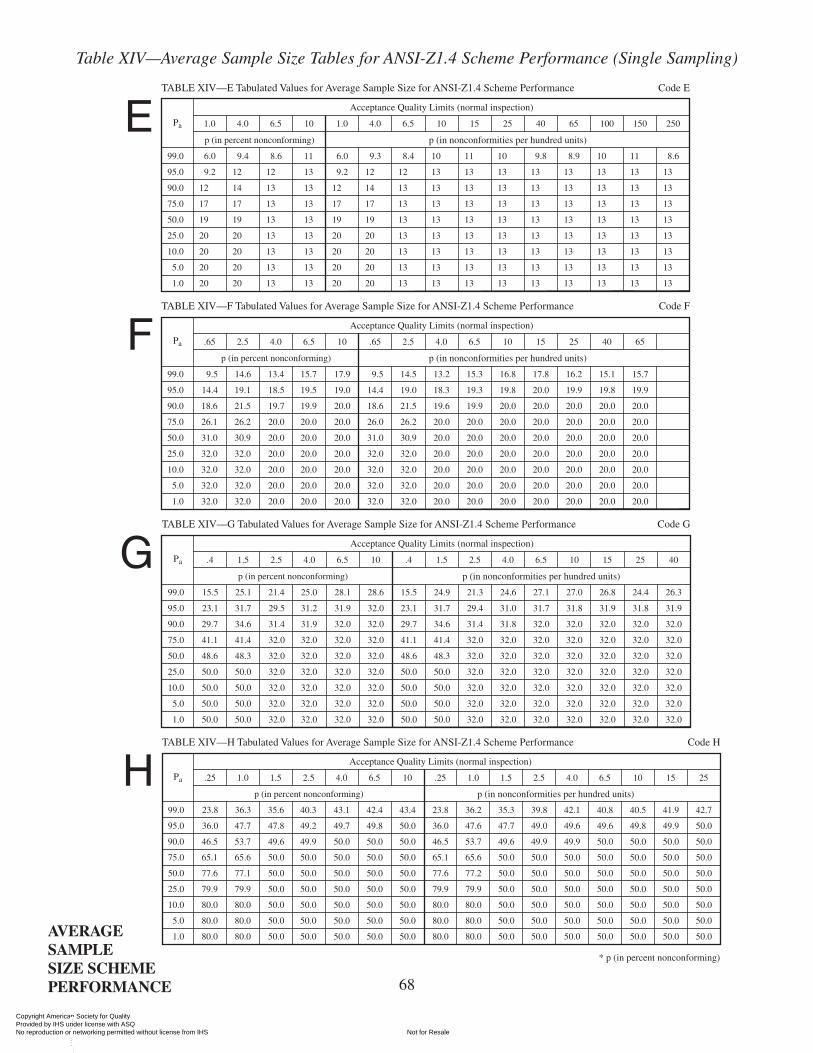
Table XIV—Average Sample Size Tables for ANSI-Z1.4 Scheme Performance (Single Sampling)
Pa
Acceptance Quality Limits (normal inspection)
TABLE XIV—E Tabulated Values for Average Sample Size for ANSI-Z1.4 Scheme Performance Code E
Ep (in nonconformities per hundred units)p (in percent nonconforming)
1.0
99.0
95.0
90.0
75.0
50.0
25.0
10.0
5.0
6.0
9.2
12
17
19
20
20
20
20
4.0
9.4
12
14
17
19
20
20
20
20
6.5
8.6
12
13
13
13
13
13
13
13
10
11
13
13
13
13
13
13
13
13
1.0
6.0
9.2
12
17
19
20
20
20
20
4.0
9.3
12
14
17
19
20
20
20
20
6.5
8.4
12
13
13
13
13
13
13
13
10
10
13
13
13
13
13
13
13
13
15
11
13
13
13
13
13
13
13
13
25
10
13
13
13
13
13
13
13
13
40
9.8
13
13
13
13
13
13
13
13
65
8.9
13
13
13
13
13
13
13
13
100
10
13
13
13
13
13
13
13
13
150
11
13
13
13
13
13
13
13
13
250
8.6
13
13
13
13
13
13
13
131.0
Pa
Acceptance Quality Limits (normal inspection)
TABLE XIV—F Tabulated Values for Average Sample Size for ANSI-Z1.4 Scheme Performance Code F
Fp (in nonconformities per hundred units)p (in percent nonconforming)
.65
99.0
95.0
90.0
75.0
50.0
25.0
10.0
5.0
9.5
14.4
18.6
26.1
31.0
32.0
32.0
32.0
32.0
2.5
14.6
19.1
21.5
26.2
30.9
32.0
32.0
32.0
32.0
4.0
13.4
18.5
19.7
20.0
20.0
20.0
20.0
20.0
20.0
6.5
15.7
19.5
19.9
20.0
20.0
20.0
20.0
20.0
20.0
10
17.9
19.0
20.0
20.0
20.0
20.0
20.0
20.0
20.0
.65
9.5
14.4
18.6
26.0
31.0
32.0
32.0
32.0
32.0
2.5
14.5
19.0
21.5
26.2
30.9
32.0
32.0
32.0
32.0
4.0
13.2
18.3
19.6
20.0
20.0
20.0
20.0
20.0
20.0
6.5
15.3
19.3
19.9
20.0
20.0
20.0
20.0
20.0
20.0
10
16.8
19.8
20.0
20.0
20.0
20.0
20.0
20.0
20.0
15
17.8
20.0
20.0
20.0
20.0
20.0
20.0
20.0
20.0
25
16.2
19.9
20.0
20.0
20.0
20.0
20.0
20.0
20.0
40
15.1
19.8
20.0
20.0
20.0
20.0
20.0
20.0
20.0
65
15.7
19.9
20.0
20.0
20.0
20.0
20.0
20.0
20.01.0
Pa
Acceptance Quality Limits (normal inspection)
TABLE XIV—G Tabulated Values for Average Sample Size for ANSI-Z1.4 Scheme Performance Code G
Gp (in nonconformities per hundred units)p (in percent nonconforming)
.4
99.0
95.0
90.0
75.0
50.0
25.0
10.0
5.0
15.5
23.1
29.7
41.1
48.6
50.0
50.0
50.0
50.0
1.5
25.1
31.7
34.6
41.4
48.3
50.0
50.0
50.0
50.0
2.5
21.4
29.5
31.4
32.0
32.0
32.0
32.0
32.0
32.0
4.0
25.0
31.2
31.9
32.0
32.0
32.0
32.0
32.0
32.0
6.5
28.1
31.9
32.0
32.0
32.0
32.0
32.0
32.0
32.0
10
28.6
32.0
32.0
32.0
32.0
32.0
32.0
32.0
32.0
.4
15.5
23.1
29.7
41.1
48.6
50.0
50.0
50.0
50.0
1.5
24.9
31.7
34.6
41.4
48.3
50.0
50.0
50.0
50.0
2.5
21.3
29.4
31.4
32.0
32.0
32.0
32.0
32.0
32.0
4.0
24.6
31.0
31.8
32.0
32.0
32.0
32.0
32.0
32.0
6.5
27.1
31.7
32.0
32.0
32.0
32.0
32.0
32.0
32.0
10
27.0
31.8
32.0
32.0
32.0
32.0
32.0
32.0
32.0
15
26.8
31.9
32.0
32.0
32.0
32.0
32.0
32.0
32.0
25
24.4
31.8
32.0
32.0
32.0
32.0
32.0
32.0
32.0
40
26.3
31.9
32.0
32.0
32.0
32.0
32.0
32.0
32.01.0
Pa
Acceptance Quality Limits (normal inspection)
TABLE XIV—H Tabulated Values for Average Sample Size for ANSI-Z1.4 Scheme Performance Code H
Hp (in nonconformities per hundred units)p (in percent nonconforming)
.25
99.0
95.0
90.0
75.0
50.0
25.0
10.0
5.0
23.8
36.0
46.5
65.1
77.6
79.9
80.0
80.0
80.0
1.0
36.3
47.7
53.7
65.6
77.1
79.9
80.0
80.0
80.0
1.5
35.6
47.8
49.6
50.0
50.0
50.0
50.0
50.0
50.0
2.5
40.3
49.2
49.9
50.0
50.0
50.0
50.0
50.0
50.0
4.0
43.1
49.7
50.0
50.0
50.0
50.0
50.0
50.0
50.0
6.5
42.4
49.8
50.0
50.0
50.0
50.0
50.0
50.0
50.0
10
43.4
50.0
50.0
50.0
50.0
50.0
50.0
50.0
50.0
.25
23.8
36.0
46.5
65.1
77.6
79.9
80.0
80.0
80.0
1.0
36.2
47.6
53.7
65.6
77.2
79.9
80.0
80.0
80.0
1.5
35.3
47.7
49.6
50.0
50.0
50.0
50.0
50.0
50.0
2.5
39.8
49.0
49.9
50.0
50.0
50.0
50.0
50.0
50.0
4.0
42.1
49.6
49.9
50.0
50.0
50.0
50.0
50.0
50.0
6.5
40.8
49.6
50.0
50.0
50.0
50.0
50.0
50.0
50.0
10
40.5
49.8
50.0
50.0
50.0
50.0
50.0
50.0
50.0
15
41.9
49.9
50.0
50.0
50.0
50.0
50.0
50.0
50.0
25
42.7
50.0
50.0
50.0
50.0
50.0
50.0
50.0
50.01.0
* p (in percent nonconforming)
68
AVERAGESAMPLESIZE SCHEMEPERFORMANCE
Copyright American Society for Quality Provided by IHS under license with ASQ
Not for ResaleNo reproduction or networking permitted without license from IHS
--`,,```,,,,````-`-`,,`,,`,`,,`---
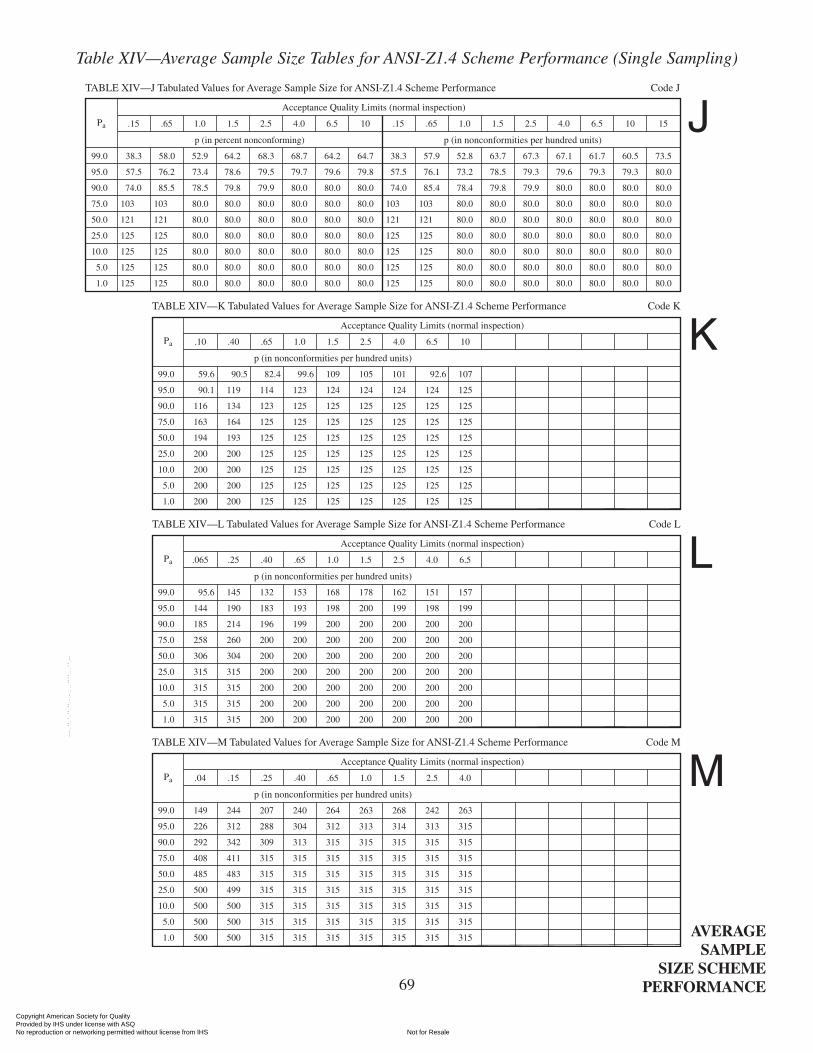
Table XIV—Average Sample Size Tables for ANSI-Z1.4 Scheme Performance (Single Sampling)
Pa
Acceptance Quality Limits (normal inspection)
TABLE XIV—J Tabulated Values for Average Sample Size for ANSI-Z1.4 Scheme Performance Code J
Jp (in nonconformities per hundred units)p (in percent nonconforming)
.15
99.0
95.0
90.0
75.0
50.0
25.0
10.0
5.0
38.3
57.5
74.0
103
121
125
125
125
125
.65
58.0
76.2
85.5
103
121
125
125
125
125
1.0
52.9
73.4
78.5
80.0
80.0
80.0
80.0
80.0
80.0
1.5
64.2
78.6
79.8
80.0
80.0
80.0
80.0
80.0
80.0
2.5
68.3
79.5
79.9
80.0
80.0
80.0
80.0
80.0
80.0
4.0
68.7
79.7
80.0
80.0
80.0
80.0
80.0
80.0
80.0
6.5
64.2
79.6
80.0
80.0
80.0
80.0
80.0
80.0
80.0
10
64.7
79.8
80.0
80.0
80.0
80.0
80.0
80.0
80.0
.15
38.3
57.5
74.0
103
121
125
125
125
125
.65
57.9
76.1
85.4
103
121
125
125
125
125
1.0
52.8
73.2
78.4
80.0
80.0
80.0
80.0
80.0
80.0
1.5
63.7
78.5
79.8
80.0
80.0
80.0
80.0
80.0
80.0
2.5
67.3
79.3
79.9
80.0
80.0
80.0
80.0
80.0
80.0
4.0
67.1
79.6
80.0
80.0
80.0
80.0
80.0
80.0
80.0
6.5
61.7
79.3
80.0
80.0
80.0
80.0
80.0
80.0
80.0
10
60.5
79.3
80.0
80.0
80.0
80.0
80.0
80.0
80.0
15
73.5
80.0
80.0
80.0
80.0
80.0
80.0
80.0
80.01.0
Pa
Acceptance Quality Limits (normal inspection)
TABLE XIV—K Tabulated Values for Average Sample Size for ANSI-Z1.4 Scheme Performance Code K
Kp (in nonconformities per hundred units)
.10
99.0
95.0
90.0
75.0
50.0
25.0
10.0
5.0
59.6
90.1
116
163
194
200
200
200
200
.40
90.5
119
134
164
193
200
200
200
200
.65
82.4
114
123
125
125
125
125
125
125
1.0
99.6
123
125
125
125
125
125
125
125
1.5
109
124
125
125
125
125
125
125
125
2.5
105
124
125
125
125
125
125
125
125
4.0
101
124
125
125
125
125
125
125
125
6.5
92.6
124
125
125
125
125
125
125
125
10
107
125
125
125
125
125
125
125
1251.0
Pa
Acceptance Quality Limits (normal inspection)
TABLE XIV—L Tabulated Values for Average Sample Size for ANSI-Z1.4 Scheme Performance Code L
Lp (in nonconformities per hundred units)
.065
99.0
95.0
90.0
75.0
50.0
25.0
10.0
5.0
95.6
144
185
258
306
315
315
315
315
.25
145
190
214
260
304
315
315
315
315
.40
132
183
196
200
200
200
200
200
200
.65
153
193
199
200
200
200
200
200
200
1.0
168
198
200
200
200
200
200
200
200
1.5
178
200
200
200
200
200
200
200
200
2.5
162
199
200
200
200
200
200
200
200
4.0
151
198
200
200
200
200
200
200
200
6.5
157
199
200
200
200
200
200
200
2001.0
Pa
Acceptance Quality Limits (normal inspection)
TABLE XIV—M Tabulated Values for Average Sample Size for ANSI-Z1.4 Scheme Performance Code M
Mp (in nonconformities per hundred units)
.04
99.0
95.0
90.0
75.0
50.0
25.0
10.0
5.0
149
226
292
408
485
500
500
500
500
.15
244
312
342
411
483
499
500
500
500
.25
207
288
309
315
315
315
315
315
315
.40
240
304
313
315
315
315
315
315
315
.65
264
312
315
315
315
315
315
315
315
1.0
263
313
315
315
315
315
315
315
315
1.5
268
314
315
315
315
315
315
315
315
2.5
242
313
315
315
315
315
315
315
315
4.0
263
315
315
315
315
315
315
315
3151.0
69
AVERAGESAMPLE
SIZE SCHEMEPERFORMANCE
Copyright American Society for Quality Provided by IHS under license with ASQ
Not for ResaleNo reproduction or networking permitted without license from IHS
--`,,```,,,,````-`-`,,`,,`,`,,`---
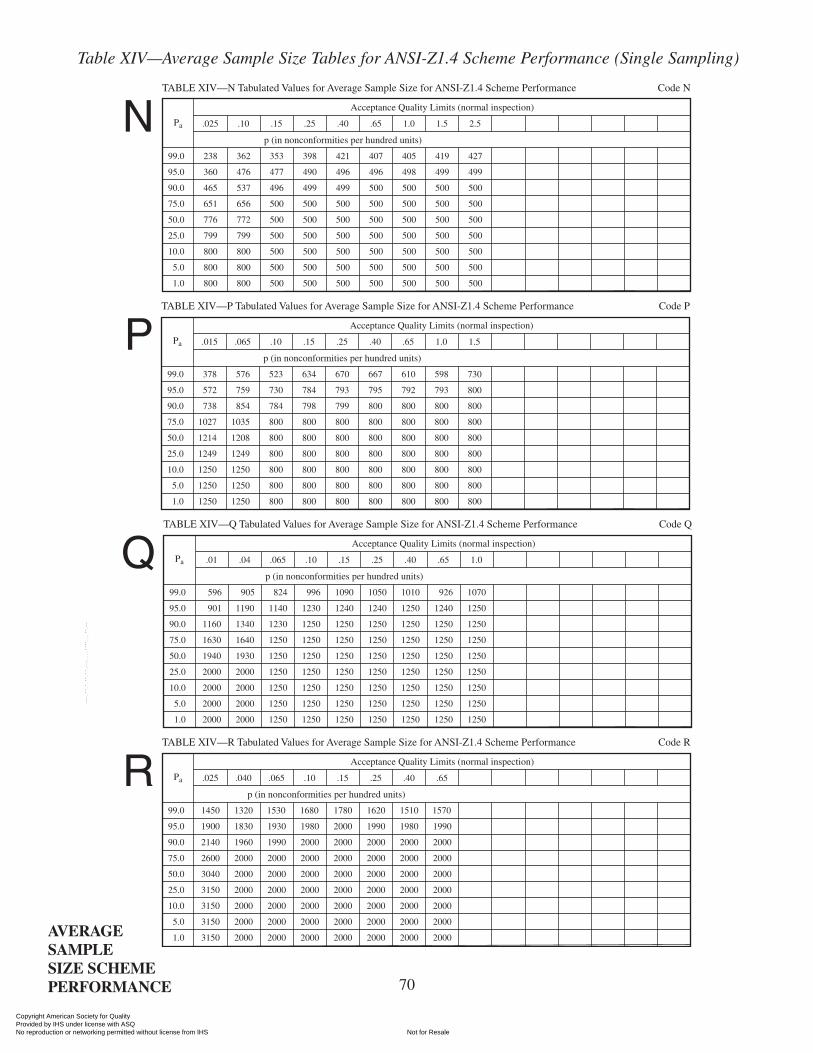
Table XIV—Average Sample Size Tables for ANSI-Z1.4 Scheme Performance (Single Sampling)
Pa
Acceptance Quality Limits (normal inspection)
TABLE XIV—N Tabulated Values for Average Sample Size for ANSI-Z1.4 Scheme Performance Code N
Np (in nonconformities per hundred units)
.025
99.0
95.0
90.0
75.0
50.0
25.0
10.0
5.0
238
360
465
651
776
799
800
800
800
.10
362
476
537
656
772
799
800
800
800
.15
353
477
496
500
500
500
500
500
500
.25
398
490
499
500
500
500
500
500
500
.40
421
496
499
500
500
500
500
500
500
.65
407
496
500
500
500
500
500
500
500
1.0
405
498
500
500
500
500
500
500
500
1.5
419
499
500
500
500
500
500
500
500
2.5
427
499
500
500
500
500
500
500
5001.0
Pa
Acceptance Quality Limits (normal inspection)
TABLE XIV—P Tabulated Values for Average Sample Size for ANSI-Z1.4 Scheme Performance Code P
Pp (in nonconformities per hundred units)
.015
99.0
95.0
90.0
75.0
50.0
25.0
10.0
5.0
378
572
738
1027
1214
1249
1250
1250
1250
.065
576
759
854
1035
1208
1249
1250
1250
1250
.10
523
730
784
800
800
800
800
800
800
.15
634
784
798
800
800
800
800
800
800
.25
670
793
799
800
800
800
800
800
800
.40
667
795
800
800
800
800
800
800
800
.65
610
792
800
800
800
800
800
800
800
1.0
598
793
800
800
800
800
800
800
800
1.5
730
800
800
800
800
800
800
800
8001.0
Pa
Acceptance Quality Limits (normal inspection)
TABLE XIV—Q Tabulated Values for Average Sample Size for ANSI-Z1.4 Scheme Performance Code Q
Qp (in nonconformities per hundred units)
.01
99.0
95.0
90.0
75.0
50.0
25.0
10.0
5.0
596
901
1160
1630
1940
2000
2000
2000
2000
.04
905
1190
1340
1640
1930
2000
2000
2000
2000
.065
824
1140
1230
1250
1250
1250
1250
1250
1250
.10
996
1230
1250
1250
1250
1250
1250
1250
1250
.15
1090
1240
1250
1250
1250
1250
1250
1250
1250
.25
1050
1240
1250
1250
1250
1250
1250
1250
1250
.40
1010
1250
1250
1250
1250
1250
1250
1250
1250
.65
926
1240
1250
1250
1250
1250
1250
1250
1250
1.0
1070
1250
1250
1250
1250
1250
1250
1250
12501.0
Pa
Acceptance Quality Limits (normal inspection)
TABLE XIV—R Tabulated Values for Average Sample Size for ANSI-Z1.4 Scheme Performance Code R
Rp (in nonconformities per hundred units)
.025
99.0
95.0
90.0
75.0
50.0
25.0
10.0
5.0
1450
1900
2140
2600
3040
3150
3150
3150
3150
.040
1320
1830
1960
2000
2000
2000
2000
2000
2000
.065
1530
1930
1990
2000
2000
2000
2000
2000
2000
.10
1680
1980
2000
2000
2000
2000
2000
2000
2000
.15
1780
2000
2000
2000
2000
2000
2000
2000
2000
.25
1620
1990
2000
2000
2000
2000
2000
2000
2000
.40
1510
1980
2000
2000
2000
2000
2000
2000
2000
.65
1570
1990
2000
2000
2000
2000
2000
2000
20001.0
70
AVERAGESAMPLESIZE SCHEMEPERFORMANCE
Copyright American Society for Quality Provided by IHS under license with ASQ
Not for ResaleNo reproduction or networking permitted without license from IHS
--`,,```,,,,````-`-`,,`,,`,`,,`---
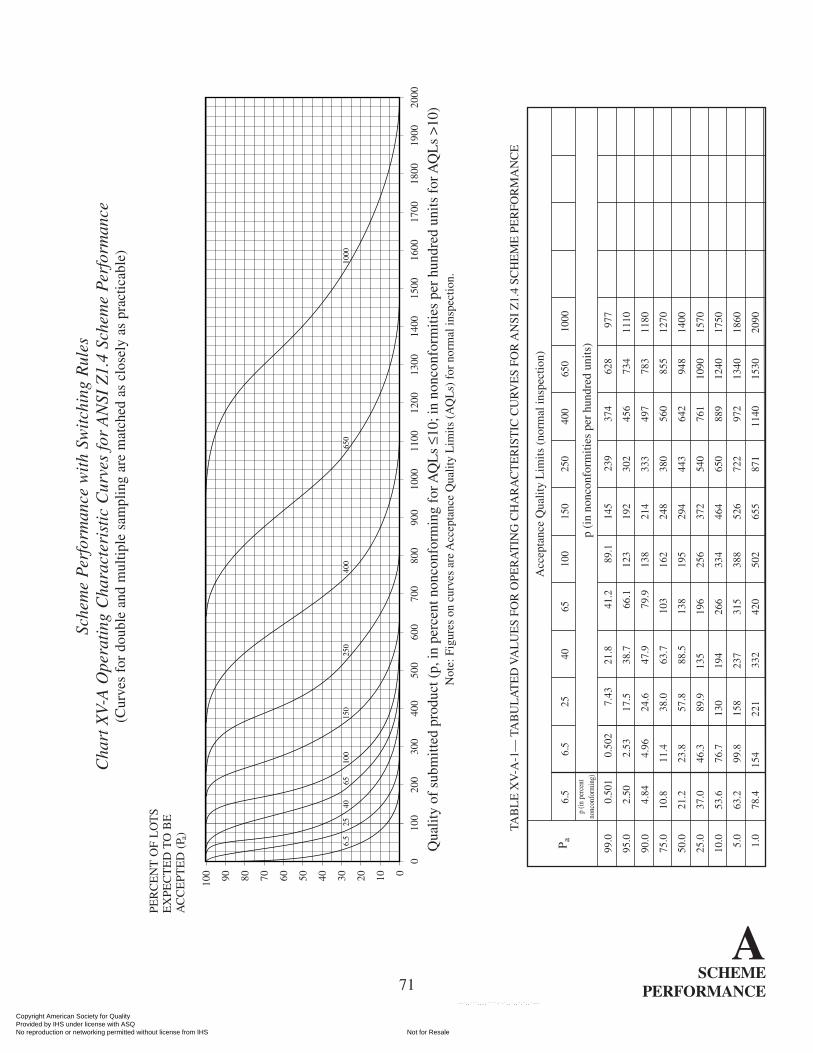
71
ASCHEME
PERFORMANCE
SchemePerform
ance
withSw
itchingRules
ChartXV-AOperating
CharacteristicCurvesforANSI
Z1.4SchemePerform
ance
(Curvesfordoubleandmultiplesamplingarematchedascloselyaspracticable)
P a
Acc
epta
nce
Qua
lity
Lim
its(n
orm
alin
spec
tion)
TAB
LE
XV
-A-1
—TA
BU
LA
TE
DV
AL
UE
SFO
RO
PER
AT
ING
CH
AR
AC
TE
RIS
TIC
CU
RV
ES
FOR
AN
SIZ
1.4
SCH
EM
EPE
RFO
RM
AN
CE
p(i
nno
ncon
form
ities
per
hund
red
units
)
6.5
p(in
perc
ent
nonc
onfo
rmin
g)
256.
540
6510
015
025
040
065
010
00
99.0
145
239
374
628
977
95.0
192
302
456
734
1110
90.0
214
333
497
783
1180
75.0
248
380
560
855
1270
50.0
294
443
642
948
1400
25.0
372
540
761
1090
1570
10.0
464
650
889
1240
1750
5.0
526
722
972
1340
1860
0.50
1
2.50
4.84
10.8
21.2
37.0
53.6
63.2
78.4
0.50
2
2.53
4.96
11.4
23.8
46.3
76.7
99.8
154
7.43
17.5
24.6
38.0
57.8
89.9
130
158
221
21.8
38.7
47.9
63.7
88.5
135
194
237
332
41.2
66.1
79.9
103
138
196
266
315
420
89.1
123
138
162
195
256
334
388
502
1.0
655
871
1140
1530
2090
00
100
200
300
400
500
600
Qua
lity
ofsu
bmitt
edpr
oduc
t(p,
inpe
rcen
tnon
conf
orm
ing
forA
QL
s≤1
0;in
nonc
onfo
rmiti
espe
rhu
ndre
dun
itsfo
rAQ
Ls
>10
)N
ote:
Figu
res
oncu
rves
are
Acc
epta
nce
Qua
lity
Lim
its(A
QL
s)fo
rno
rmal
insp
ectio
n.
700
800
900
1000
1100
1200
1300
1400
1500
1600
1700
1800
1900
2000
102030405060708090100
6.5
2540
6510
015
025
040
065
010
00
PERCENTOFLOTS
EXPECTEDTOBE
ACCEPTED(Pa)
Copyright American Society for Quality Provided by IHS under license with ASQ
Not for ResaleNo reproduction or networking permitted without license from IHS
--`,,```,,,,````-`-`,,`,,`,`,,`---
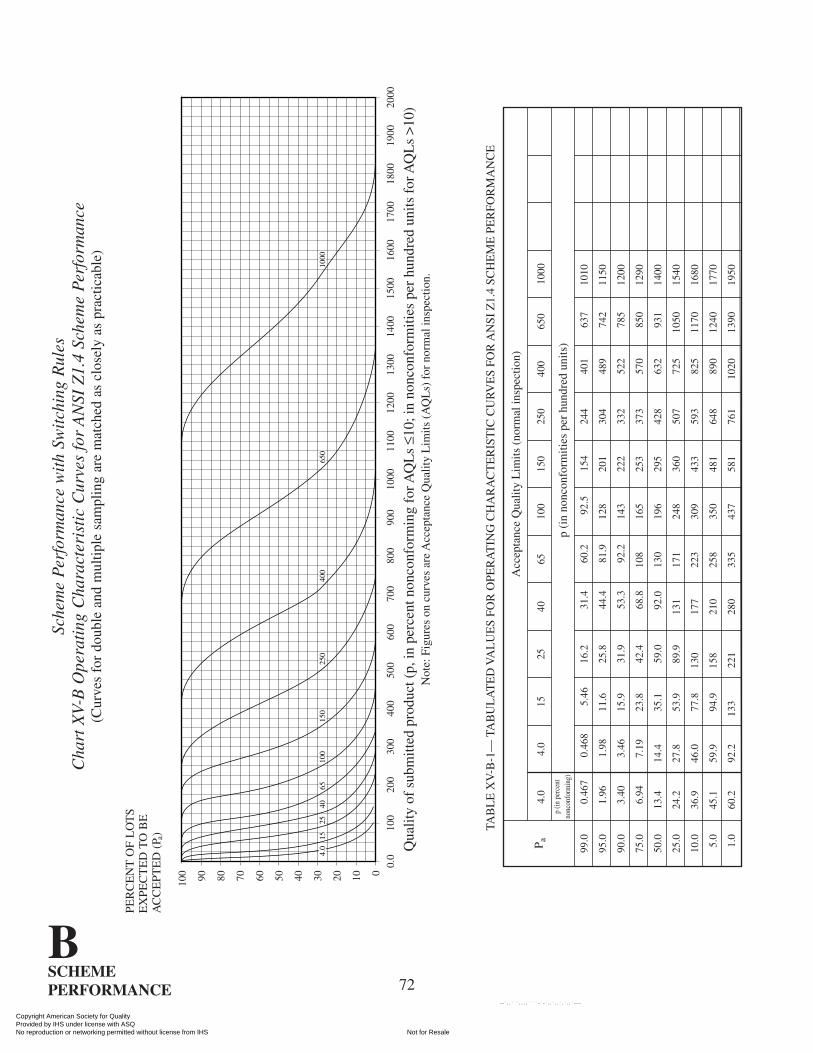
72
SchemePerform
ance
withSw
itchingRules
ChartXV-BOperating
CharacteristicCurvesforANSI
Z1.4SchemePerform
ance
(Curvesfordoubleandmultiplesamplingarematchedascloselyaspracticable)
P a
Acc
epta
nce
Qua
lity
Lim
its(n
orm
alin
spec
tion)
TAB
LE
XV
-B-1
—TA
BU
LA
TE
DV
AL
UE
SFO
RO
PER
AT
ING
CH
AR
AC
TE
RIS
TIC
CU
RV
ES
FOR
AN
SIZ
1.4
SCH
EM
EPE
RFO
RM
AN
CE
p(i
nno
ncon
form
ities
per
hund
red
units
)
4.0
p(in
perc
ent
nonc
onfo
rmin
g)
154.
025
4065
100
150
250
400
650
99.0
92.5
154
244
401
637
95.0
128
201
304
489
742
90.0
143
222
332
522
785
75.0
165
253
373
570
850
50.0
196
295
428
632
931
25.0
248
360
507
725
1050
10.0
309
433
593
825
1170
5.0
350
481
648
890
1240
0.46
7
1.96
3.40
6.94
13.4
24.2
36.9
45.1
60.2
0.46
8
1.98
3.46
7.19
14.4
27.8
46.0
59.9
92.2
5.46
11.6
15.9
23.8
35.1
53.9
77.8
94.9
133
16.2
25.8
31.9
42.4
59.0
89.9
130
158
221
31.4
44.4
53.3
68.8
92.0
131
177
210
280
60.2
81.9
92.2
108
130
171
223
258
335
1.0
437
581
761
1020
1390
1000
1010
1150
1200
1290
1400
1540
1680
1770
1950
00.
010
020
030
040
050
060
0
Qua
lity
ofsu
bmitt
edpr
oduc
t(p,
inpe
rcen
tnon
conf
orm
ing
forA
QL
s≤1
0;in
nonc
onfo
rmiti
espe
rhu
ndre
dun
itsfo
rAQ
Ls
>10
)N
ote:
Figu
res
oncu
rves
are
Acc
epta
nce
Qua
lity
Lim
its(A
QL
s)fo
rno
rmal
insp
ectio
n.
700
800
900
1000
1100
1200
1300
1400
1500
1600
1700
1800
1900
2000
102030405060708090100
1525
4065
100
150
250
400
650
1000
4.0
PERCENTOFLOTS
EXPECTEDTOBE
ACCEPTED(Pa)
BSCHEMEPERFORMANCE
Copyright American Society for Quality Provided by IHS under license with ASQ
Not for ResaleNo reproduction or networking permitted without license from IHS
--`,,```,,,,````-`-`,,`,,`,`,,`---
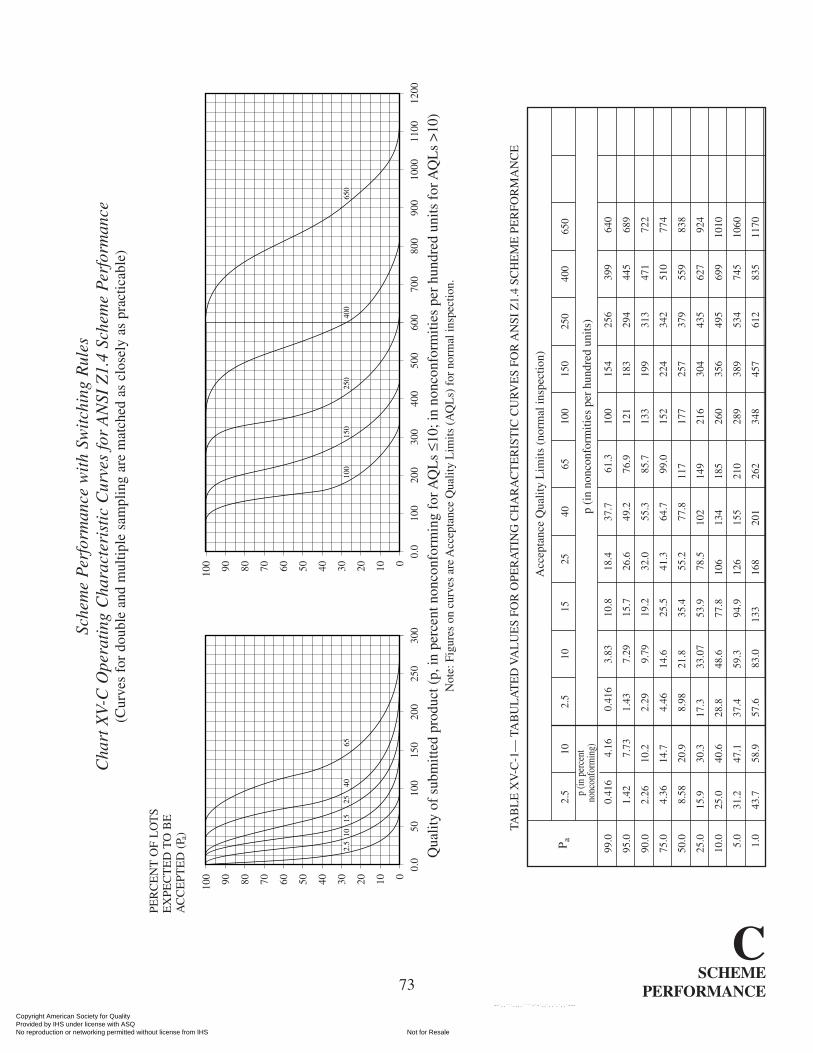
73
CSCHEME
PERFORMANCE
SchemePerform
ance
withSw
itchingRules
ChartXV-COperating
CharacteristicCurvesforANSI
Z1.4SchemePerform
ance
(Curvesfordoubleandmultiplesamplingarematchedascloselyaspracticable)
P a
Acc
epta
nce
Qua
lity
Lim
its(n
orm
alin
spec
tion)
TAB
LE
XV
-C-1
—TA
BU
LA
TE
DV
AL
UE
SFO
RO
PER
AT
ING
CH
AR
AC
TE
RIS
TIC
CU
RV
ES
FOR
AN
SIZ
1.4
SCH
EM
EPE
RFO
RM
AN
CE
p(i
nno
ncon
form
ities
per
hund
red
units
)
2.5 p
(inpe
rcen
tno
ncon
form
ing)
2.5
1010
1525
4065
100
150
250
99.0
37.7
61.3
100
154
256
95.0
49.2
76.9
121
183
294
90.0
55.3
85.7
133
199
313
75.0
64.7
99.0
152
224
342
50.0
77.8
117
177
257
379
25.0
102
149
216
304
435
10.0
134
185
260
356
495
5.0
155
210
289
389
534
0.41
6
1.42
2.26
4.36
8.58
15.9
25.0
31.2
43.7
4.16
7.73
10.2
14.7
20.9
30.3
40.6
47.1
58.9
0.41
6
1.43
2.29
4.46
8.98
17.3
28.8
37.4
57.6
3.83
7.29
9.79
14.6
21.8
33.0
7
48.6
59.3
83.0
10.8
15.7
19.2
25.5
35.4
53.9
77.8
94.9
133
18.4
26.6
32.0
41.3
55.2
78.5
106
126
168
1.0
201
262
348
457
612
400
399
445
471
510
559
627
699
745
835
650
640
689
722
774
838
924
1010
1060
1170
00.
050
100
150
200
250
300
Qua
lity
ofsu
bmitt
edpr
oduc
t(p,
inpe
rcen
tnon
conf
orm
ing
forA
QL
s≤1
0;in
nonc
onfo
rmiti
espe
rhu
ndre
dun
itsfo
rAQ
Ls
>10
)N
ote:
Figu
res
oncu
rves
are
Acc
epta
nce
Qua
lity
Lim
its(A
QL
s)fo
rno
rmal
insp
ectio
n.
102030405060708090100
00.
010
020
030
040
050
060
070
080
090
010
0011
0012
00
102030405060708090100
1510
2540
6510
015
025
040
065
02.
5
PERCENTOFLOTS
EXPECTEDTOBE
ACCEPTED(Pa)
Copyright American Society for Quality Provided by IHS under license with ASQ
Not for ResaleNo reproduction or networking permitted without license from IHS
--`,,```,,,,````-`-`,,`,,`,`,,`---
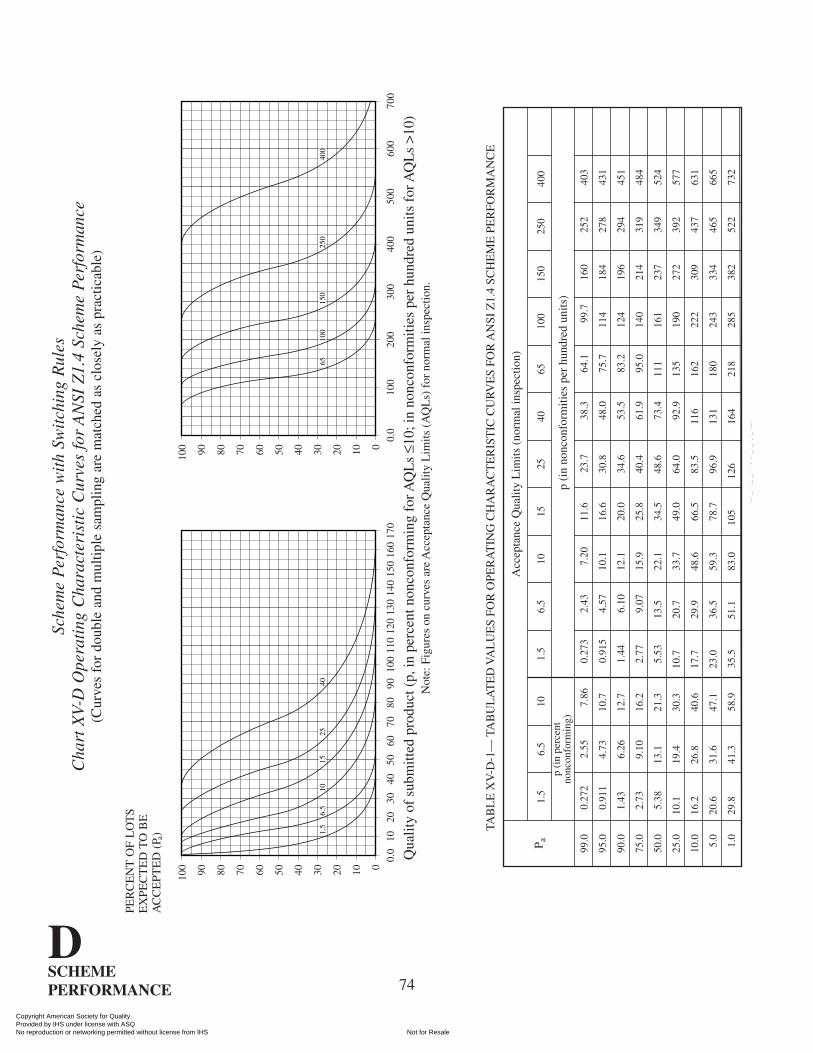
74
SchemePerform
ance
withSw
itchingRules
ChartXV-DOperating
CharacteristicCurvesforANSI
Z1.4SchemePerform
ance
(Curvesfordoubleandmultiplesamplingarematchedascloselyaspracticable)
P a
Acc
epta
nce
Qua
lity
Lim
its(n
orm
alin
spec
tion)
TAB
LE
XV
-D-1
—TA
BU
LA
TE
DV
AL
UE
SFO
RO
PER
AT
ING
CH
AR
AC
TE
RIS
TIC
CU
RV
ES
FOR
AN
SIZ
1.4
SCH
EM
EPE
RFO
RM
AN
CE
p(i
nno
ncon
form
ities
per
hund
red
units
)
1.5
p(i
npe
rcen
tno
ncon
form
ing)
106.
51.
56.
510
1525
4065
100
99.0
11.6
23.7
38.3
64.1
99.7
95.0
16.6
30.8
48.0
75.7
114
90.0
20.0
34.6
53.5
83.2
124
75.0
25.8
40.4
61.9
95.0
140
50.0
34.5
48.6
73.4
111
161
25.0
49.0
64.0
92.9
135
190
10.0
66.5
83.5
116
162
222
5.0
78.7
96.9
131
180
243
0.27
2
0.91
1
1.43
2.73
5.38
10.1
16.2
20.6
29.8
2.55
4.73
6.26
9.10
13.1
19.4
26.8
31.6
41.3
7.86
10.7
12.7
16.2
21.3
30.3
40.6
47.1
58.9
0.27
3
0.91
5
1.44
2.77
5.53
10.7
17.7
23.0
35.5
2.43
4.57
6.10
9.07
13.5
20.7
29.9
36.5
51.1
7.20
10.1
12.1
15.9
22.1
33.7
48.6
59.3
83.0
1.0
105
126
164
218
285
150
160
184
196
214
237
272
309
334
382
250
252
278
294
319
349
392
437
465
522
400
403
431
451
484
524
577
631
665
732
00.
020
1040
3060
5080
7010
090
120
110
140
130
160
170
150
Qua
lity
ofsu
bmitt
edpr
oduc
t(p,
inpe
rcen
tnon
conf
orm
ing
forA
QL
s≤1
0;in
nonc
onfo
rmiti
espe
rhu
ndre
dun
itsfo
rAQ
Ls
>10
)N
ote:
Figu
res
oncu
rves
are
Acc
epta
nce
Qua
lity
Lim
its(A
QL
s)fo
rno
rmal
insp
ectio
n.
102030405060708090100
00.
020
010
040
030
060
050
070
0
102030405060708090100
1015
6.5
2540
1.5
6510
015
025
040
0
PERCENTOFLOTS
EXPECTEDTOBE
ACCEPTED(Pa)
DSCHEMEPERFORMANCE
Copyright American Society for Quality Provided by IHS under license with ASQ
Not for ResaleNo reproduction or networking permitted without license from IHS
--`,,```,,,,````-`-`,,`,,`,`,,`---
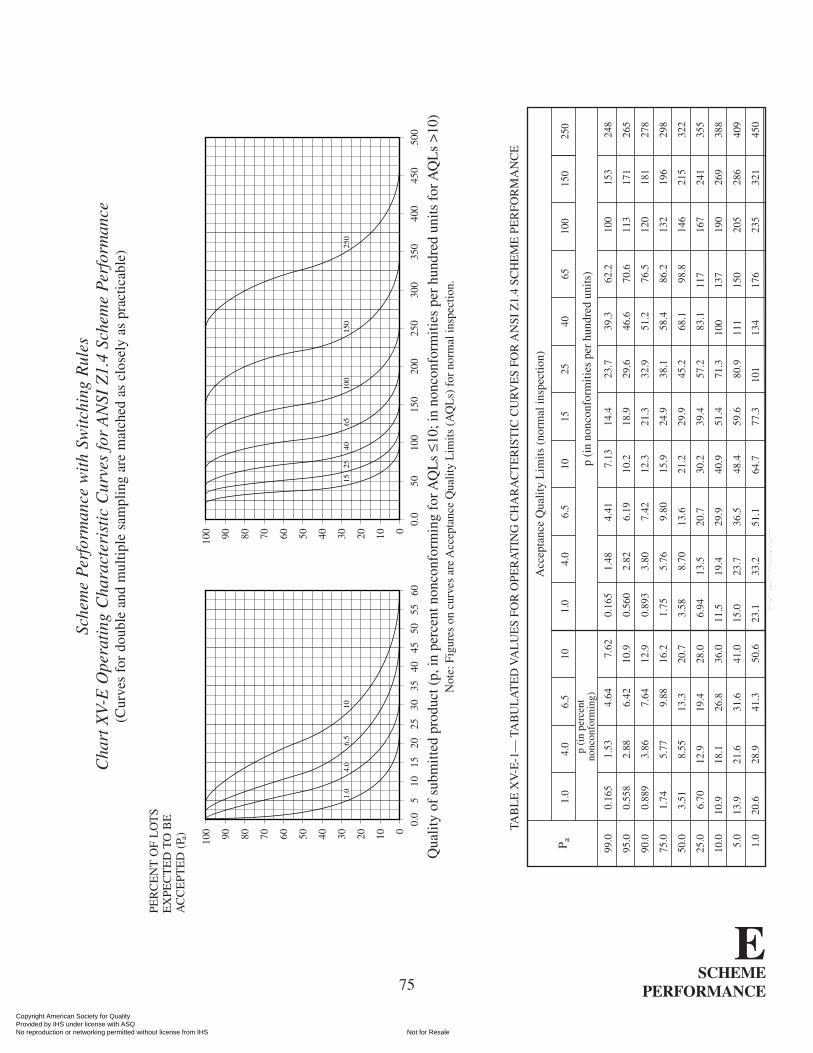
75
ESCHEME
PERFORMANCE
SchemePerform
ance
withSw
itchingRules
ChartXV-EOperating
CharacteristicCurvesforANSI
Z1.4SchemePerform
ance
(Curvesfordoubleandmultiplesamplingarematchedascloselyaspracticable)
P a
Acc
epta
nce
Qua
lity
Lim
its(n
orm
alin
spec
tion)
TAB
LE
XV
-E-1
—TA
BU
LA
TE
DV
AL
UE
SFO
RO
PER
AT
ING
CH
AR
AC
TE
RIS
TIC
CU
RV
ES
FOR
AN
SIZ
1.4
SCH
EM
EPE
RFO
RM
AN
CE
p(i
nno
ncon
form
ities
per
hund
red
units
)
1.0
p(i
npe
rcen
tno
ncon
form
ing)
6.5
4.0
101.
04.
06.
510
1525
40
99.0
4.41
7.13
14.4
23.7
39.3
95.0
6.19
10.2
18.9
29.6
46.6
90.0
7.42
12.3
21.3
32.9
51.2
75.0
9.80
15.9
24.9
38.1
58.4
50.0
13.6
21.2
29.9
45.2
68.1
25.0
20.7
30.2
39.4
57.2
83.1
10.0
29.9
40.9
51.4
71.3
100
5.0
36.5
48.4
59.6
80.9
111
0.16
5
0.55
8
0.88
9
1.74
3.51
6.70
10.9
13.9
20.6
1.53
2.88
3.86
5.77
8.55
12.9
18.1
21.6
28.9
4.64
6.42
7.64
9.88
13.3
19.4
26.8
31.6
41.3
7.62
10.9
12.9
16.2
20.7
28.0
36.0
41.0
50.6
0.16
5
0.56
0
0.89
3
1.75
3.58
6.94
11.5
15.0
23.1
1.48
2.82
3.80
5.76
8.70
13.5
19.4
23.7
33.2
1.0
51.1
64.7
77.3
101
134
65 62.2
70.6
76.5
86.2
98.8
117
137
150
176
100
100
113
120
132
146
167
190
205
235
150
153
171
181
196
215
241
269
286
321
250
248
265
278
298
322
355
388
409
450
00.
010
520
1530
2540
3550
4555
60
Qua
lity
ofsu
bmitt
edpr
oduc
t(p,
inpe
rcen
tnon
conf
orm
ing
forA
QL
s≤1
0;in
nonc
onfo
rmiti
espe
rhu
ndre
dun
itsfo
rAQ
Ls
>10
)N
ote:
Figu
res
oncu
rves
are
Acc
epta
nce
Qua
lity
Lim
its(A
QL
s)fo
rno
rmal
insp
ectio
n.
102030405060708090100
00.
010
050
200
150
350
300
250
450
400
500
102030405060708090100
106.
51.
04.
065
4025
1510
015
025
0
PERCENTOFLOTS
EXPECTEDTOBE
ACCEPTED(Pa)
Copyright American Society for Quality Provided by IHS under license with ASQ
Not for ResaleNo reproduction or networking permitted without license from IHS
--`,,```,,,,````-`-`,,`,,`,`,,`---
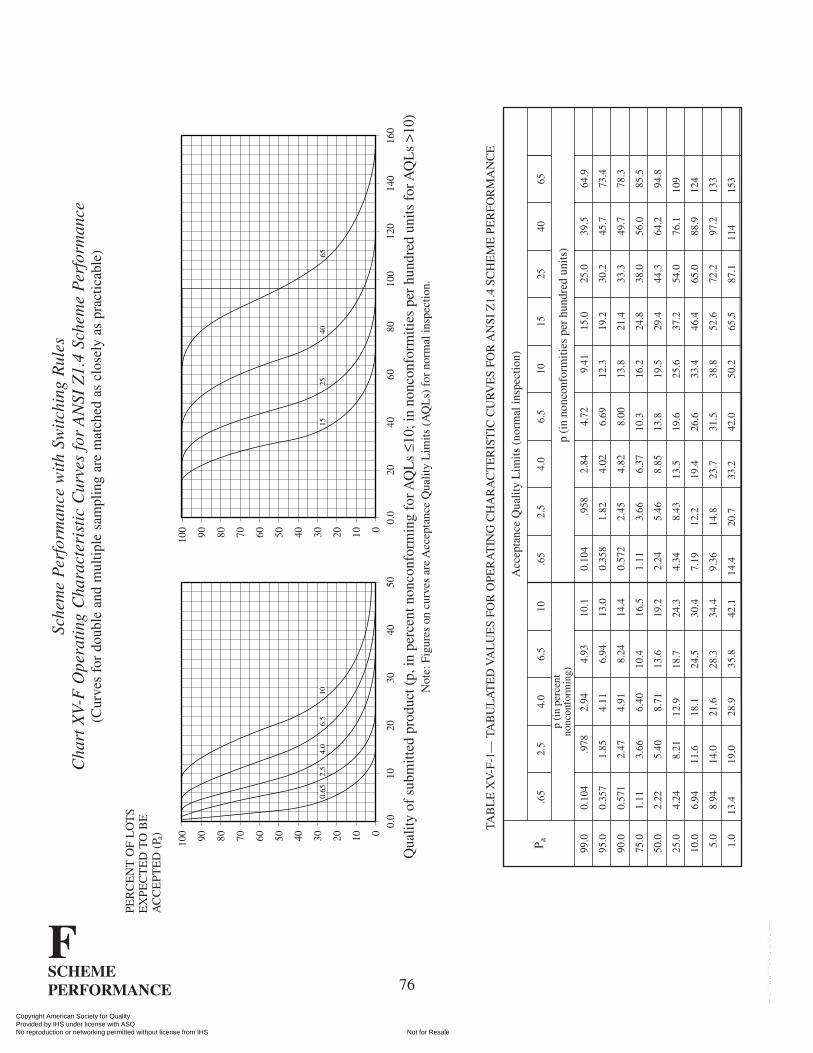
76
SchemePerform
ance
withSw
itchingRules
ChartXV-FOperating
CharacteristicCurvesforANSI
Z1.4SchemePerform
ance
(Curvesfordoubleandmultiplesamplingarematchedascloselyaspracticable)
P a
Acc
epta
nce
Qua
lity
Lim
its(n
orm
alin
spec
tion)
TAB
LE
XV
-F-1
—TA
BU
LA
TE
DV
AL
UE
SFO
RO
PER
AT
ING
CH
AR
AC
TE
RIS
TIC
CU
RV
ES
FOR
AN
SIZ
1.4
SCH
EM
EPE
RFO
RM
AN
CE
p(i
nno
ncon
form
ities
per
hund
red
units
)
.65
p(i
npe
rcen
tno
ncon
form
ing)
4.0
2.5
6.5
10.6
52.
54.
06.
510
15
99.0
.958
2.84
4.72
9.41
15.0
95.0
1.82
4.02
6.69
12.3
19.2
90.0
2.45
4.82
8.00
13.8
21.4
75.0
3.66
6.37
10.3
16.2
24.8
50.0
5.46
8.85
13.8
19.5
29.4
25.0
8.43
13.5
19.6
25.6
37.2
10.0
12.2
19.4
26.6
33.4
46.4
5.0
14.8
23.7
31.5
38.8
52.6
0.10
4
0.35
7
0.57
1
1.11
2.22
4.24
6.94
8.94
13.4
.978
1.85
2.47
3.66
5.40
8.21
11.6
14.0
19.0
2.94
4.11
4.91
6.40
8.71
12.9
18.1
21.6
28.9
4.93
6.94
8.24
10.4
13.6
18.7
24.5
28.3
35.8
10.1
13.0
14.4
16.5
19.2
24.3
30.4
34.4
42.1
0.10
4
0.35
8
0.57
2
1.11
2.24
4.34
7.19
9.36
14.4
1.0
20.7
33.2
42.0
50.2
65.5
25 25.0
30.2
33.3
38.0
44.3
54.0
65.0
72.2
87.1
40 39.5
45.7
49.7
56.0
64.2
76.1
88.9
97.2
114
65 64.9
73.4
78.3
85.5
94.8
109
124
133
153
00.
010
2030
4050
Qua
lity
ofsu
bmitt
edpr
oduc
t(p,
inpe
rcen
tnon
conf
orm
ing
forA
QL
s≤1
0;in
nonc
onfo
rmiti
espe
rhu
ndre
dun
itsfo
rAQ
Ls
>10
)N
ote:
Figu
res
oncu
rves
are
Acc
epta
nce
Qua
lity
Lim
its(A
QL
s)fo
rno
rmal
insp
ectio
n.
102030405060708090100
00.
020
4060
8010
012
014
016
0
102030405060708090100
2.5
4.0
6.5
1015
2540
650.
65
PERCENTOFLOTS
EXPECTEDTOBE
ACCEPTED(Pa)
FSCHEMEPERFORMANCE
Copyright American Society for Quality Provided by IHS under license with ASQ
Not for ResaleNo reproduction or networking permitted without license from IHS
--`,,```,,,,````-`-`,,`,,`,`,,`---
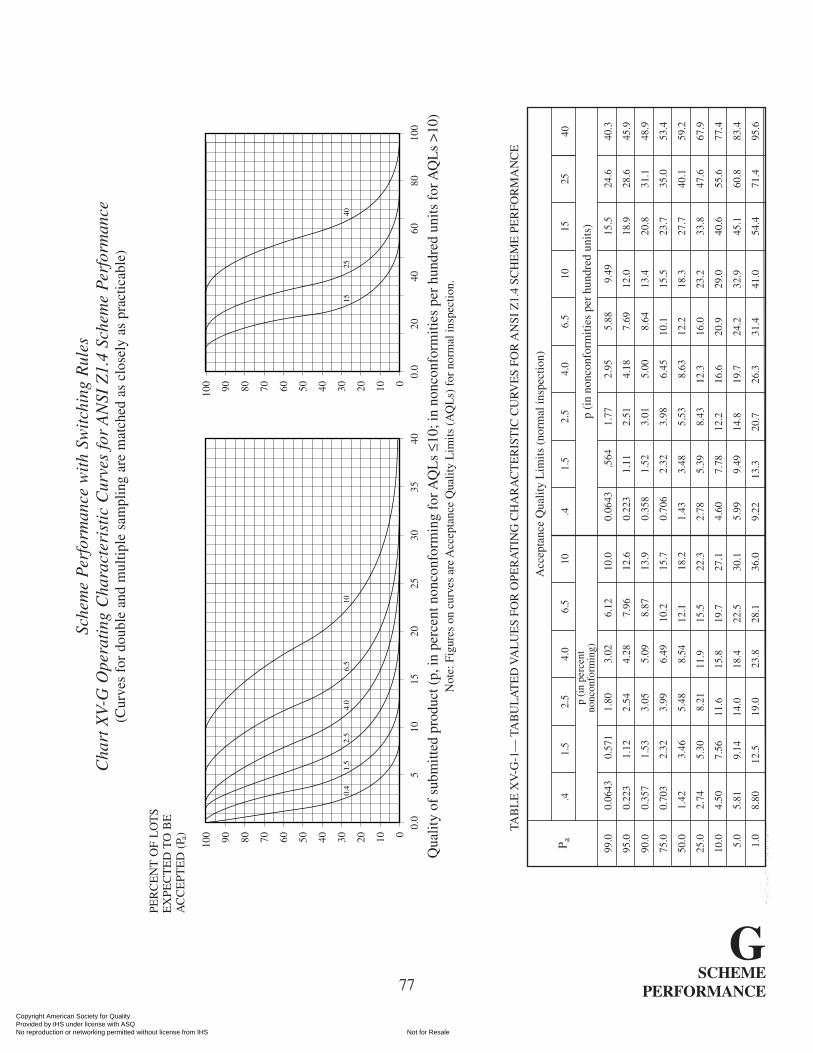
77
GSCHEME
PERFORMANCE
SchemePerform
ance
withSw
itchingRules
ChartXV-GOperating
CharacteristicCurvesforANSI
Z1.4SchemePerform
ance
(Curvesfordoubleandmultiplesamplingarematchedascloselyaspracticable)
P a
Acc
epta
nce
Qua
lity
Lim
its(n
orm
alin
spec
tion)
TAB
LE
XV
-G-1
—TA
BU
LA
TE
DV
AL
UE
SFO
RO
PER
AT
ING
CH
AR
AC
TE
RIS
TIC
CU
RV
ES
FOR
AN
SIZ
1.4
SCH
EM
EPE
RFO
RM
AN
CE
p(i
nno
ncon
form
ities
per
hund
red
units
)
.4
p(i
npe
rcen
tno
ncon
form
ing)
2.5
1.5
4.0
6.5
10.4
1.5
2.5
4.0
6.5
99.0
0.06
43.5
641.
772.
955.
88
95.0
0.22
31.
112.
514.
187.
69
90.0
0.35
81.
523.
015.
008.
64
75.0
0.70
62.
323.
986.
4510
.1
50.0
1.43
3.48
5.53
8.63
12.2
25.0
2.78
5.39
8.43
12.3
16.0
10.0
4.60
7.78
12.2
16.6
20.9
5.0
5.99
9.49
14.8
19.7
24.2
0.06
43
0.22
3
0.35
7
0.70
3
1.42
2.74
4.50
5.81
8.80
0.57
1
1.12
1.53
2.32
3.46
5.30
7.56
9.14
12.5
1.80
2.54
3.05
3.99
5.48
8.21
11.6
14.0
19.0
3.02
4.28
5.09
6.49
8.54
11.9
15.8
18.4
23.8
6.12
7.96
8.87
10.2
12.1
15.5
19.7
22.5
28.1
10.0
12.6
13.9
15.7
18.2
22.3
27.1
30.1
36.0
1.0
9.22
13.3
20.7
26.3
31.4
10 9.49
12.0
13.4
15.5
18.3
23.2
29.0
32.9
41.0
15 15.5
18.9
20.8
23.7
27.7
33.8
40.6
45.1
54.4
25 24.6
28.6
31.1
35.0
40.1
47.6
55.6
60.8
71.4
40 40.3
45.9
48.9
53.4
59.2
67.9
77.4
83.4
95.6
00.
05
1015
2025
3035
40
Qua
lity
ofsu
bmitt
edpr
oduc
t(p,
inpe
rcen
tnon
conf
orm
ing
forA
QL
s≤1
0;in
nonc
onfo
rmiti
espe
rhu
ndre
dun
itsfo
rAQ
Ls
>10
)N
ote:
Figu
res
oncu
rves
are
Acc
epta
nce
Qua
lity
Lim
its(A
QL
s)fo
rno
rmal
insp
ectio
n.
102030405060708090100
00.
020
4060
8010
0
102030405060708090100
2.5
1.5
0.4
4.0
6.5
1015
2540
PERCENTOFLOTS
EXPECTEDTOBE
ACCEPTED(Pa)
Copyright American Society for Quality Provided by IHS under license with ASQ
Not for ResaleNo reproduction or networking permitted without license from IHS
--`,,```,,,,````-`-`,,`,,`,`,,`---
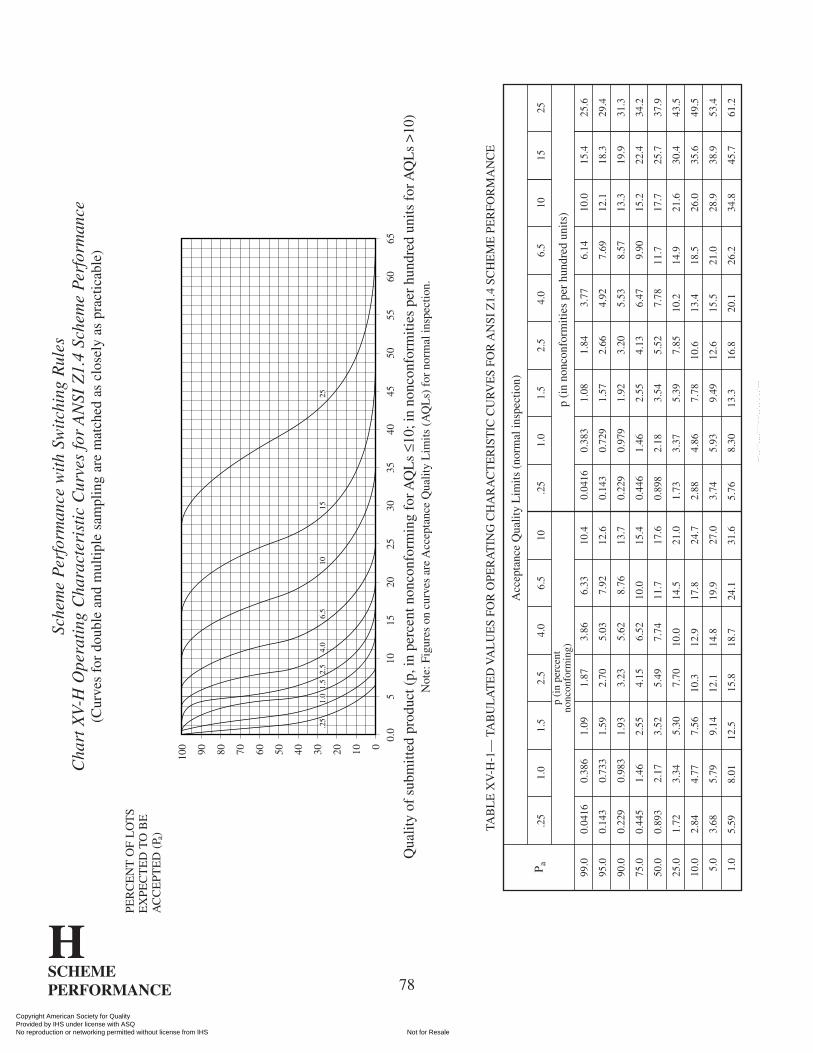
78
SchemePerform
ance
withSw
itchingRules
ChartXV-HOperating
CharacteristicCurvesforANSI
Z1.4SchemePerform
ance
(Curvesfordoubleandmultiplesamplingarematchedascloselyaspracticable)
P a
Acc
epta
nce
Qua
lity
Lim
its(n
orm
alin
spec
tion)
TAB
LE
XV
-H-1
—TA
BU
LA
TE
DV
AL
UE
SFO
RO
PER
AT
ING
CH
AR
AC
TE
RIS
TIC
CU
RV
ES
FOR
AN
SIZ
1.4
SCH
EM
EPE
RFO
RM
AN
CE
p(i
nno
ncon
form
ities
per
hund
red
units
)
.25
p(i
npe
rcen
tno
ncon
form
ing)
1.5
1.0
2.5
4.0
6.5
10.2
51.
01.
52.
5
99.0
10.4
0.04
160.
383
1.08
1.84
95.0
12.6
0.14
30.
729
1.57
2.66
90.0
13.7
0.22
90.
979
1.92
3.20
75.0
15.4
0.44
61.
462.
554.
13
50.0
17.6
0.89
82.
183.
545.
52
25.0
21.0
1.73
3.37
5.39
7.85
10.0
24.7
2.88
4.86
7.78
10.6
5.0
27.0
3.74
5.93
9.49
12.6
0.04
16
0.14
3
0.22
9
0.44
5
0.89
3
1.72
2.84
3.68
5.59
0.38
6
0.73
3
0.98
3
1.46
2.17
3.34
4.77
5.79
8.01
1.09
1.59
1.93
2.55
3.52
5.30
7.56
9.14
12.5
1.87
2.70
3.23
4.15
5.49
7.70
10.3
12.1
15.8
3.86
5.03
5.62
6.52
7.74
10.0
12.9
14.8
18.7
6.33
7.92
8.76
10.0
11.7
14.5
17.8
19.9
24.1
1.0
31.6
5.76
8.30
13.3
16.8
4.0
3.77
4.92
5.53
6.47
7.78
10.2
13.4
15.5
20.1
6.5
6.14
7.69
8.57
9.90
11.7
14.9
18.5
21.0
26.2
10 10.0
12.1
13.3
15.2
17.7
21.6
26.0
28.9
34.8
15 15.4
18.3
19.9
22.4
25.7
30.4
35.6
38.9
45.7
25 25.6
29.4
31.3
34.2
37.9
43.5
49.5
53.4
61.2
00.
05
1015
2025
3035
4045
5055
6065
Qua
lity
ofsu
bmitt
edpr
oduc
t(p,
inpe
rcen
tnon
conf
orm
ing
forA
QL
s≤1
0;in
nonc
onfo
rmiti
espe
rhu
ndre
dun
itsfo
rAQ
Ls
>10
)N
ote:
Figu
res
oncu
rves
are
Acc
epta
nce
Qua
lity
Lim
its(A
QL
s)fo
rno
rmal
insp
ectio
n.
102030405060708090100
2.5
1.0
1.5
.25
4.0
6.5
1510
25
PERCENTOFLOTS
EXPECTEDTOBE
ACCEPTED(Pa)
HSCHEMEPERFORMANCE
Copyright American Society for Quality Provided by IHS under license with ASQ
Not for ResaleNo reproduction or networking permitted without license from IHS
--`,,```,,,,````-`-`,,`,,`,`,,`---
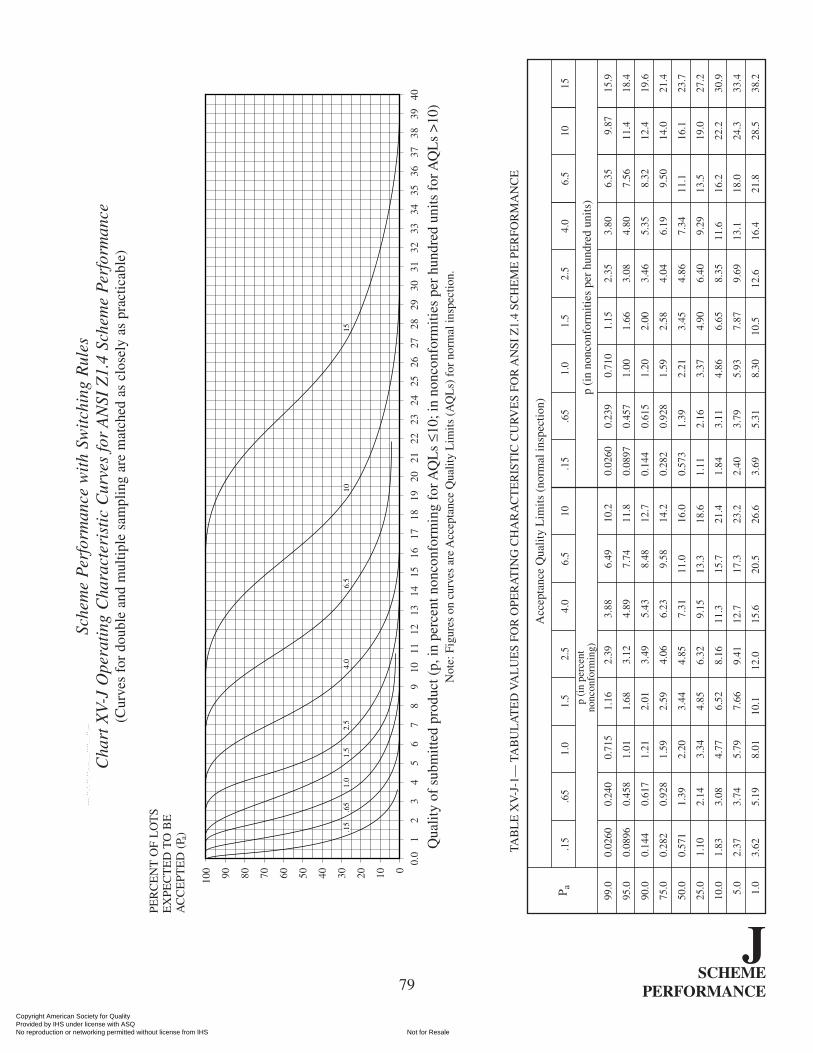
79
JSCHEME
PERFORMANCE
SchemePerform
ance
withSw
itchingRules
ChartXV-JOperating
CharacteristicCurvesforANSI
Z1.4SchemePerform
ance
(Curvesfordoubleandmultiplesamplingarematchedascloselyaspracticable)
P a
Acc
epta
nce
Qua
lity
Lim
its(n
orm
alin
spec
tion)
TAB
LE
XV
-J-1
—TA
BU
LA
TE
DV
AL
UE
SFO
RO
PER
AT
ING
CH
AR
AC
TE
RIS
TIC
CU
RV
ES
FOR
AN
SIZ
1.4
SCH
EM
EPE
RFO
RM
AN
CE
p(i
nno
ncon
form
ities
per
hund
red
units
)
.15
p(i
npe
rcen
tno
ncon
form
ing)
1.0
.65
1.5
2.5
4.0
6.5
10.1
5.6
51.
0
99.0
6.49
10.2
0.02
600.
239
0.71
0
95.0
7.74
11.8
0.08
970.
457
1.00
90.0
8.48
12.7
0.14
40.
615
1.20
75.0
9.58
14.2
0.28
20.
928
1.59
50.0
11.0
16.0
0.57
31.
392.
21
25.0
13.3
18.6
1.11
2.16
3.37
10.0
15.7
21.4
1.84
3.11
4.86
5.0
17.3
23.2
2.40
3.79
5.93
0.02
60
0.08
96
0.14
4
0.28
2
0.57
1
1.10
1.83
2.37
3.62
0.24
0
0.45
8
0.61
7
0.92
8
1.39
2.14
3.08
3.74
5.19
0.71
5
1.01
1.21
1.59
2.20
3.34
4.77
5.79
8.01
1.16
1.68
2.01
2.59
3.44
4.85
6.52
7.66
10.1
2.39
3.12
3.49
4.06
4.85
6.32
8.16
9.41
12.0
3.88
4.89
5.43
6.23
7.31
9.15
11.3
12.7
15.6
1.0
20.5
26.6
3.69
5.31
8.30
1.5
1.15
1.66
2.00
2.58
3.45
4.90
6.65
7.87
10.5
2.5
2.35
3.08
3.46
4.04
4.86
6.40
8.35
9.69
12.6
4.0
3.80
4.80
5.35
6.19
7.34
9.29
11.6
13.1
16.4
6.5
6.35
7.56
8.32
9.50
11.1
13.5
16.2
18.0
21.8
10 9.87
11.4
12.4
14.0
16.1
19.0
22.2
24.3
28.5
15 15.9
18.4
19.6
21.4
23.7
27.2
30.9
33.4
38.2
00.
01
23
45
67
89
1011
1213
1415
1617
1819
2021
2223
2425
2627
2829
3031
3233
3435
3637
3839
Qua
lity
ofsu
bmitt
edpr
oduc
t(p,
inpe
rcen
tnon
conf
orm
ing
forA
QL
s≤1
0;in
nonc
onfo
rmiti
espe
rhu
ndre
dun
itsfo
rAQ
Ls
>10
)N
ote:
Figu
res
oncu
rves
are
Acc
epta
nce
Qua
lity
Lim
its(A
QL
s)fo
rno
rmal
insp
ectio
n.
40
102030405060708090100
1510
.15
6.5
4.0
2.5
1.5
1.0
.65
PERCENTOFLOTS
EXPECTEDTOBE
ACCEPTED(Pa)
Copyright American Society for Quality Provided by IHS under license with ASQ
Not for ResaleNo reproduction or networking permitted without license from IHS
--`,,```,,,,````-`-`,,`,,`,`,,`---
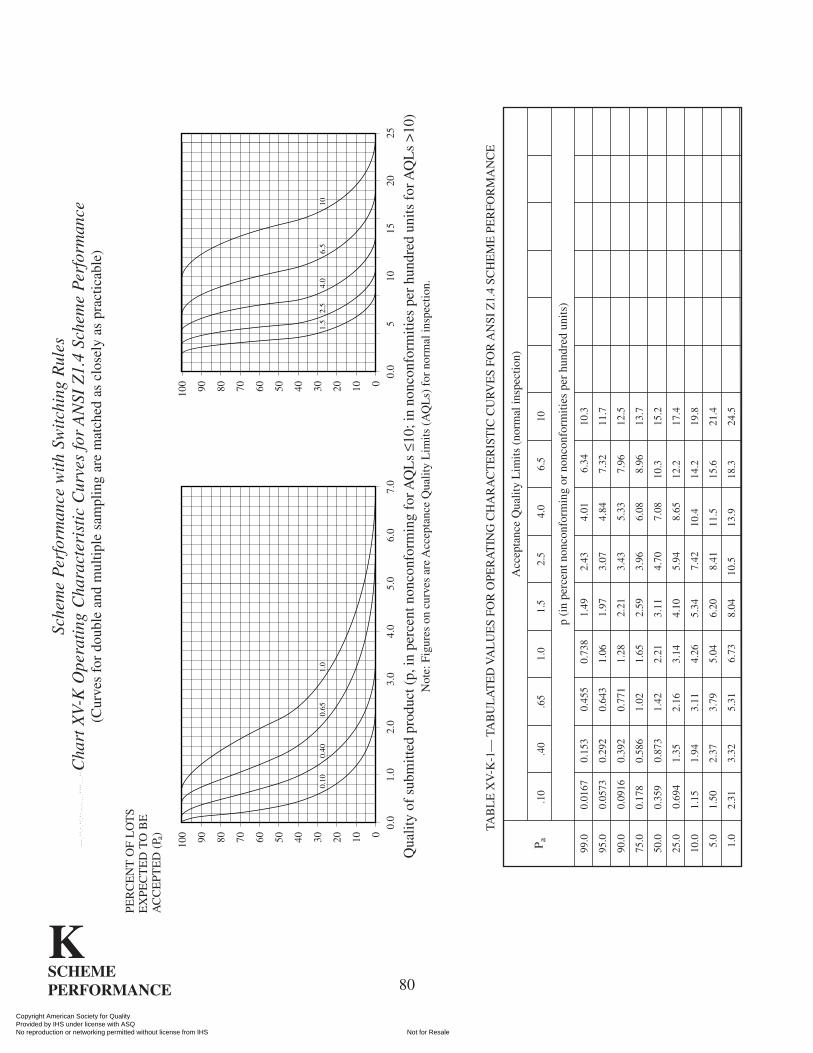
80
SchemePerform
ance
withSw
itchingRules
ChartXV-KOperating
CharacteristicCurvesforANSI
Z1.4SchemePerform
ance
(Curvesfordoubleandmultiplesamplingarematchedascloselyaspracticable)
P a
Acc
epta
nce
Qua
lity
Lim
its(n
orm
alin
spec
tion)
TAB
LE
XV
-K-1
—TA
BU
LA
TE
DV
AL
UE
SFO
RO
PER
AT
ING
CH
AR
AC
TE
RIS
TIC
CU
RV
ES
FOR
AN
SIZ
1.4
SCH
EM
EPE
RFO
RM
AN
CE
p(i
npe
rcen
tnon
conf
orm
ing
orno
ncon
form
ities
per
hund
red
units
)
.10
.65
.40
1.0
1.5
2.5
4.0
6.5
10
99.0
4.01
6.34
10.3
95.0
4.84
7.32
11.7
90.0
5.33
7.96
12.5
75.0
6.08
8.96
13.7
50.0
7.08
10.3
15.2
25.0
8.65
12.2
17.4
10.0
10.4
14.2
19.8
5.0
11.5
15.6
21.4
0.01
67
0.05
73
0.09
16
0.17
8
0.35
9
0.69
4
1.15
1.50
2.31
0.15
3
0.29
2
0.39
2
0.58
6
0.87
3
1.35
1.94
2.37
3.32
0.45
5
0.64
3
0.77
1
1.02
1.42
2.16
3.11
3.79
5.31
0.73
8
1.06
1.28
1.65
2.21
3.14
4.26
5.04
6.73
1.49
1.97
2.21
2.59
3.11
4.10
5.34
6.20
8.04
2.43
3.07
3.43
3.96
4.70
5.94
7.42
8.41
10.5
1.0
13.9
18.3
24.5
00.
01.
02.
03.
04.
05.
06.
07.
0
Qua
lity
ofsu
bmitt
edpr
oduc
t(p,
inpe
rcen
tnon
conf
orm
ing
forA
QL
s≤1
0;in
nonc
onfo
rmiti
espe
rhu
ndre
dun
itsfo
rAQ
Ls
>10
)N
ote:
Figu
res
oncu
rves
are
Acc
epta
nce
Qua
lity
Lim
its(A
QL
s)fo
rno
rmal
insp
ectio
n.
102030405060708090100
00.
05
1015
2025
102030405060708090100
2.5
1.5
0.10
0.40
0.65
4.0
6.5
1.0
10
PERCENTOFLOTS
EXPECTEDTOBE
ACCEPTED(Pa)
KSCHEMEPERFORMANCE
Copyright American Society for Quality Provided by IHS under license with ASQ
Not for ResaleNo reproduction or networking permitted without license from IHS
--`,,```,,,,````-`-`,,`,,`,`,,`---
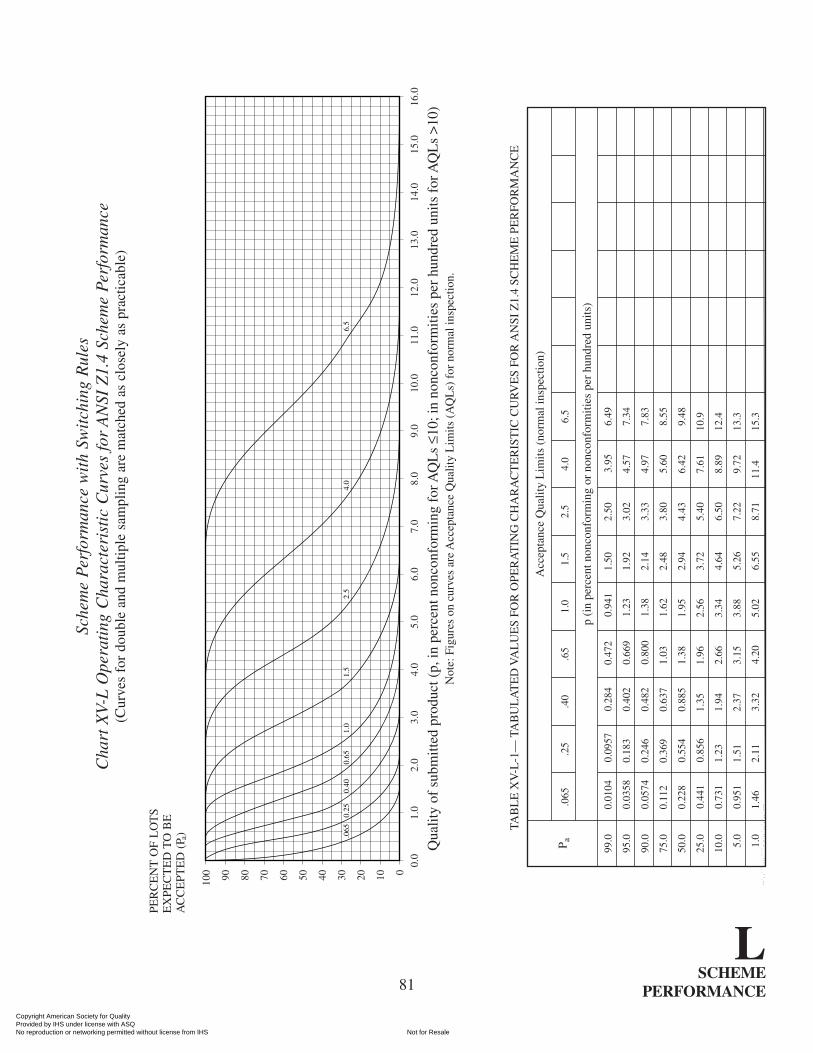
81
LSCHEME
PERFORMANCE
SchemePerform
ance
withSw
itchingRules
ChartXV-LOperating
CharacteristicCurvesforANSI
Z1.4SchemePerform
ance
(Curvesfordoubleandmultiplesamplingarematchedascloselyaspracticable)
P a
Acc
epta
nce
Qua
lity
Lim
its(n
orm
alin
spec
tion)
TAB
LE
XV
-L-1
—TA
BU
LA
TE
DV
AL
UE
SFO
RO
PER
AT
ING
CH
AR
AC
TE
RIS
TIC
CU
RV
ES
FOR
AN
SIZ
1.4
SCH
EM
EPE
RFO
RM
AN
CE
p(i
npe
rcen
tnon
conf
orm
ing
orno
ncon
form
ities
per
hund
red
units
)
.065
.40
.25
.65
1.0
1.5
2.5
4.0
6.5
99.0
2.50
3.95
6.49
95.0
3.02
4.57
7.34
90.0
3.33
4.97
7.83
75.0
3.80
5.60
8.55
50.0
4.43
6.42
9.48
25.0
5.40
7.61
10.9
10.0
6.50
8.89
12.4
5.0
7.22
9.72
13.3
0.01
04
0.03
58
0.05
74
0.11
2
0.22
8
0.44
1
0.73
1
0.95
1
1.46
0.09
57
0.18
3
0.24
6
0.36
9
0.55
4
0.85
6
1.23
1.51
2.11
0.28
4
0.40
2
0.48
2
0.63
7
0.88
5
1.35
1.94
2.37
3.32
0.47
2
0.66
9
0.80
0
1.03
1.38
1.96
2.66
3.15
4.20
0.94
1
1.23
1.38
1.62
1.95
2.56
3.34
3.88
5.02
1.50
1.92
2.14
2.48
2.94
3.72
4.64
5.26
6.55
1.0
8.71
11.4
15.3
00.
01.
02.
03.
04.
05.
06.
07.
08.
09.
010
.011
.012
.013
.014
.015
.0
Qua
lity
ofsu
bmitt
edpr
oduc
t(p,
inpe
rcen
tnon
conf
orm
ing
forA
QL
s≤1
0;in
nonc
onfo
rmiti
espe
rhu
ndre
dun
itsfo
rAQ
Ls
>10
)N
ote:
Figu
res
oncu
rves
are
Acc
epta
nce
Qua
lity
Lim
its(A
QL
s)fo
rno
rmal
insp
ectio
n.
16.0
102030405060708090100
6.5
4.0
2.5
1.5
1.0
0.65
0.40
0.25
.065
PERCENTOFLOTS
EXPECTEDTOBE
ACCEPTED(Pa)
Copyright American Society for Quality Provided by IHS under license with ASQ
Not for ResaleNo reproduction or networking permitted without license from IHS
--`,,```,,,,````-`-`,,`,,`,`,,`---
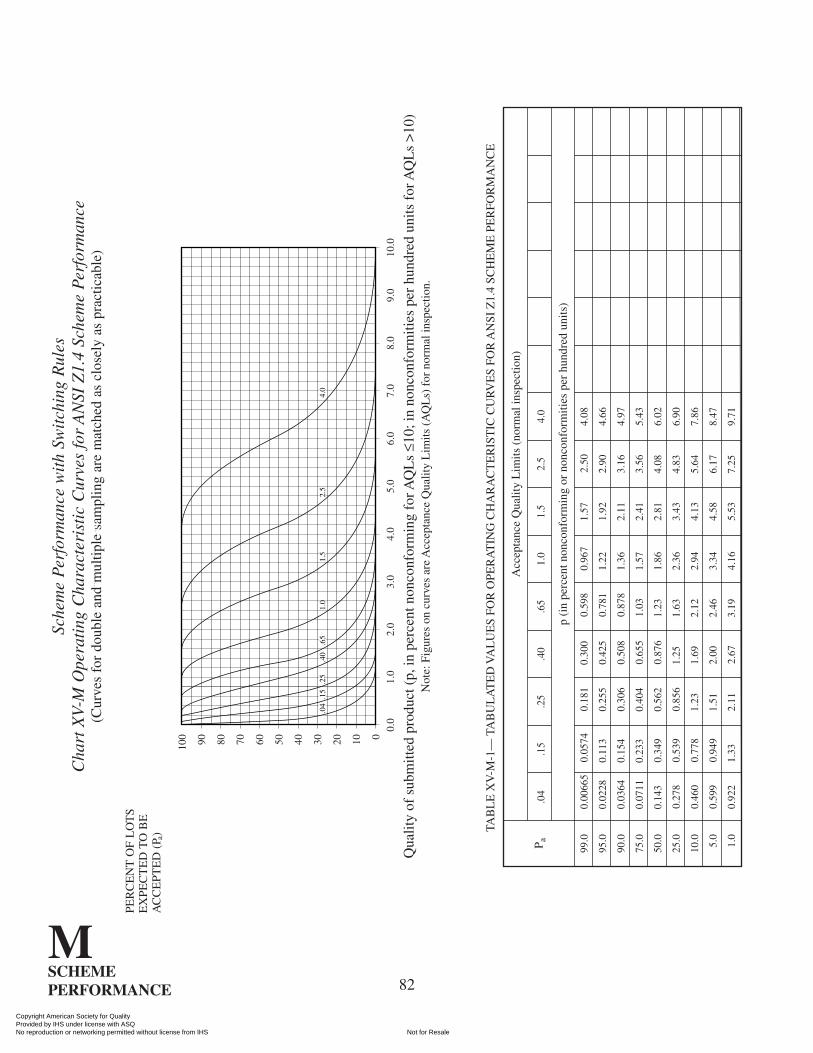
82
SchemePerform
ance
withSw
itchingRules
ChartXV-M
Operating
CharacteristicCurvesforANSI
Z1.4SchemePerform
ance
(Curvesfordoubleandmultiplesamplingarematchedascloselyaspracticable)
P a
Acc
epta
nce
Qua
lity
Lim
its(n
orm
alin
spec
tion)
TAB
LE
XV
-M-1
—TA
BU
LA
TE
DV
AL
UE
SFO
RO
PER
AT
ING
CH
AR
AC
TE
RIS
TIC
CU
RV
ES
FOR
AN
SIZ
1.4
SCH
EM
EPE
RFO
RM
AN
CE
p(i
npe
rcen
tnon
conf
orm
ing
orno
ncon
form
ities
per
hund
red
units
)
.04
.25
.15
.40
.65
1.0
1.5
2.5
4.0
99.0
1.57
2.50
4.08
95.0
1.92
2.90
4.66
90.0
2.11
3.16
4.97
75.0
2.41
3.56
5.43
50.0
2.81
4.08
6.02
25.0
3.43
4.83
6.90
10.0
4.13
5.64
7.86
5.0
4.58
6.17
8.47
0.00
665
0.02
28
0.03
64
0.07
11
0.14
3
0.27
8
0.46
0
0.59
9
0.92
2
0.05
74
0.11
3
0.15
4
0.23
3
0.34
9
0.53
9
0.77
8
0.94
9
1.33
0.18
1
0.25
5
0.30
6
0.40
4
0.56
2
0.85
6
1.23
1.51
2.11
0.30
0
0.42
5
0.50
8
0.65
5
0.87
6
1.25
1.69
2.00
2.67
0.59
8
0.78
1
0.87
8
1.03
1.23
1.63
2.12
2.46
3.19
0.96
7
1.22
1.36
1.57
1.86
2.36
2.94
3.34
4.16
1.0
5.53
7.25
9.71
00.
01.
03.
02.
04.
05.
06.
07.
08.
09.
010
.0
Qua
lity
ofsu
bmitt
edpr
oduc
t(p,
inpe
rcen
tnon
conf
orm
ing
forA
QL
s≤1
0;in
nonc
onfo
rmiti
espe
rhu
ndre
dun
itsfo
rAQ
Ls
>10
)N
ote:
Figu
res
oncu
rves
are
Acc
epta
nce
Qua
lity
Lim
its(A
QL
s)fo
rno
rmal
insp
ectio
n.
102030405060708090100
2.5
1.0
1.5
.65
.40
.25
.15
.04
4.0
PERCENTOFLOTS
EXPECTEDTOBE
ACCEPTED(Pa)
MSCHEMEPERFORMANCE
Copyright American Society for Quality Provided by IHS under license with ASQ
Not for ResaleNo reproduction or networking permitted without license from IHS
--`,,```,,,,````-`-`,,`,,`,`,,`---
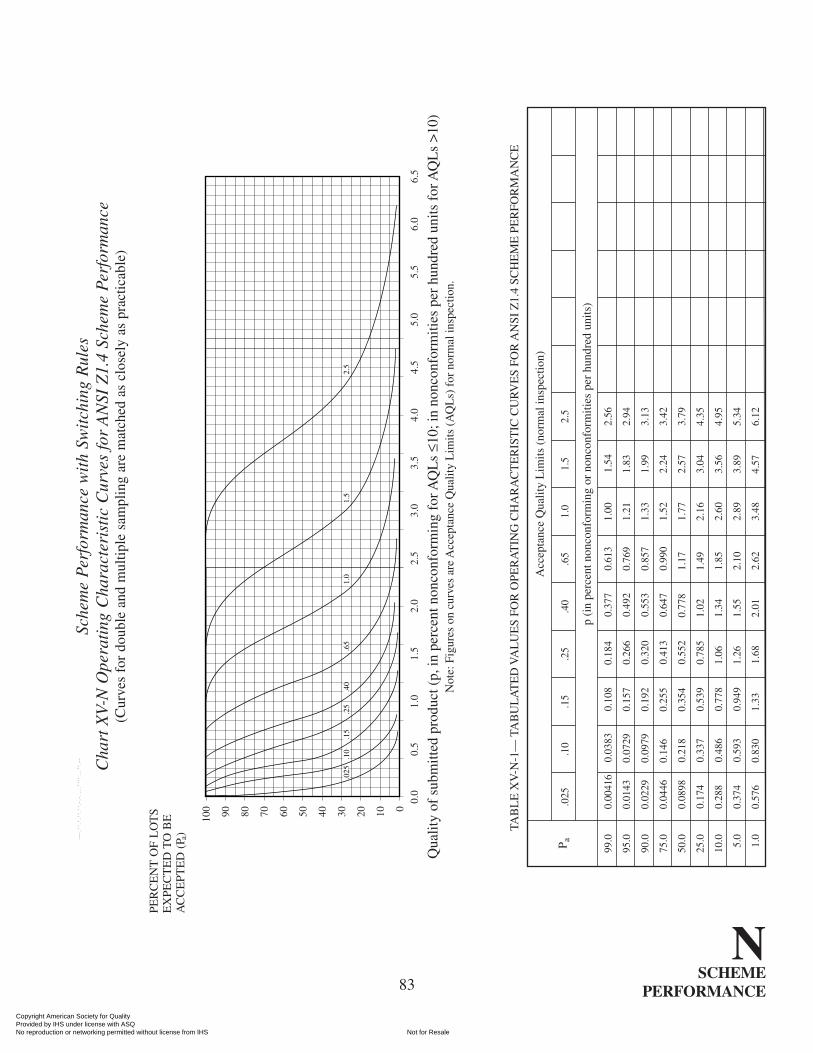
83
NSCHEME
PERFORMANCE
SchemePerform
ance
withSw
itchingRules
ChartXV-NOperating
CharacteristicCurvesforANSI
Z1.4SchemePerform
ance
(Curvesfordoubleandmultiplesamplingarematchedascloselyaspracticable)
P a
Acc
epta
nce
Qua
lity
Lim
its(n
orm
alin
spec
tion)
TAB
LE
XV
-N-1
—TA
BU
LA
TE
DV
AL
UE
SFO
RO
PER
AT
ING
CH
AR
AC
TE
RIS
TIC
CU
RV
ES
FOR
AN
SIZ
1.4
SCH
EM
EPE
RFO
RM
AN
CE
p(i
npe
rcen
tnon
conf
orm
ing
orno
ncon
form
ities
per
hund
red
units
)
.025
.15
.10
.25
.40
.65
1.0
1.5
2.5
99.0
1.00
1.54
2.56
95.0
1.21
1.83
2.94
90.0
1.33
1.99
3.13
75.0
1.52
2.24
3.42
50.0
1.77
2.57
3.79
25.0
2.16
3.04
4.35
10.0
2.60
3.56
4.95
5.0
2.89
3.89
5.34
0.00
416
0.01
43
0.02
29
0.04
46
0.08
98
0.17
4
0.28
8
0.37
4
0.57
6
0.03
83
0.07
29
0.09
79
0.14
6
0.21
8
0.33
7
0.48
6
0.59
3
0.83
0
0.10
8
0.15
7
0.19
2
0.25
5
0.35
4
0.53
9
0.77
8
0.94
9
1.33
0.18
4
0.26
6
0.32
0
0.41
3
0.55
2
0.78
5
1.06
1.26
1.68
0.37
7
0.49
2
0.55
3
0.64
7
0.77
8
1.02
1.34
1.55
2.01
0.61
3
0.76
9
0.85
7
0.99
0
1.17
1.49
1.85
2.10
2.62
1.0
3.48
4.57
6.12
Qua
lity
ofsu
bmitt
edpr
oduc
t(p,
inpe
rcen
tnon
conf
orm
ing
forA
QL
s≤1
0;in
nonc
onfo
rmiti
espe
rhu
ndre
dun
itsfo
rAQ
Ls
>10
)N
ote:
Figu
res
oncu
rves
are
Acc
epta
nce
Qua
lity
Lim
its(A
QL
s)fo
rno
rmal
insp
ectio
n.
00.
00.
51.
01.
52.
02.
53.
03.
54.
04.
55.
05.
56.
06.
5
102030405060708090100
.25
.15
.10
.025
.40
.65
2.5
1.5
1.0
PERCENTOFLOTS
EXPECTEDTOBE
ACCEPTED(Pa)
Copyright American Society for Quality Provided by IHS under license with ASQ
Not for ResaleNo reproduction or networking permitted without license from IHS
--`,,```,,,,````-`-`,,`,,`,`,,`---
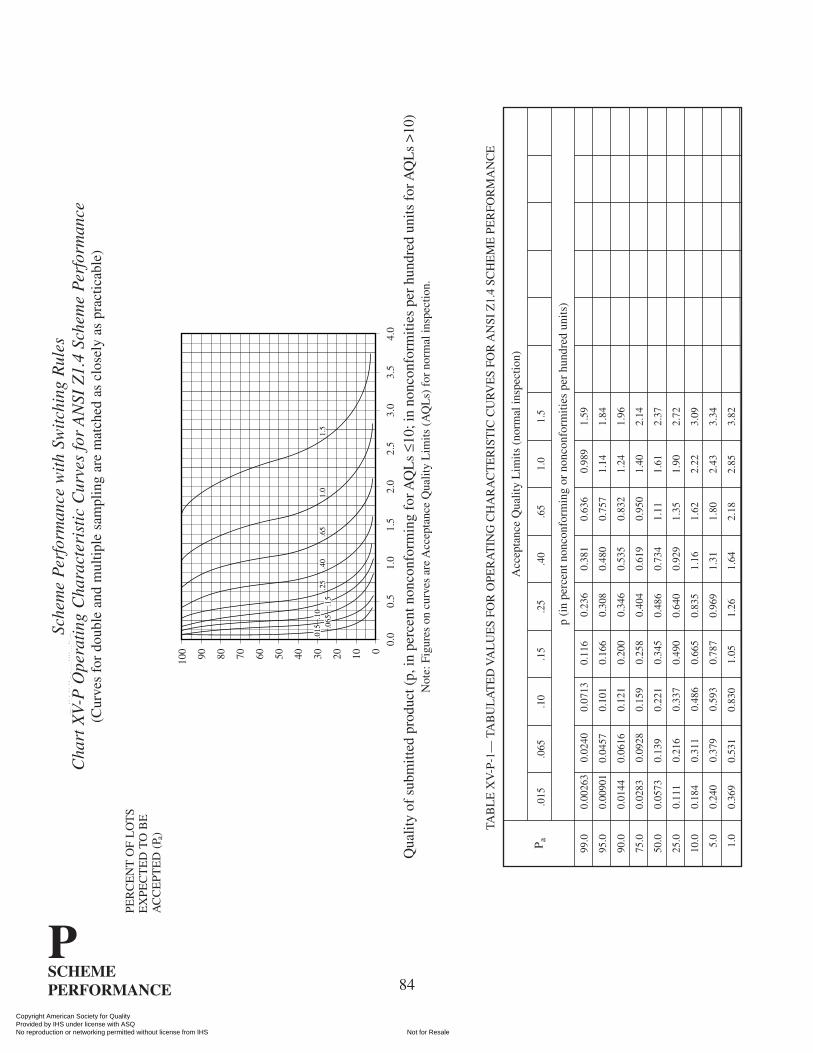
84
SchemePerform
ance
withSw
itchingRules
ChartXV-POperating
CharacteristicCurvesforANSI
Z1.4SchemePerform
ance
(Curvesfordoubleandmultiplesamplingarematchedascloselyaspracticable)
P a
Acc
epta
nce
Qua
lity
Lim
its(n
orm
alin
spec
tion)
TAB
LE
XV
-P-1
—TA
BU
LA
TE
DV
AL
UE
SFO
RO
PER
AT
ING
CH
AR
AC
TE
RIS
TIC
CU
RV
ES
FOR
AN
SIZ
1.4
SCH
EM
EPE
RFO
RM
AN
CE
p(i
npe
rcen
tnon
conf
orm
ing
orno
ncon
form
ities
per
hund
red
units
)
.015
.10
.065
.15
.25
.40
.65
1.0
1.5
99.0
0.63
60.
989
1.59
95.0
0.75
71.
141.
84
90.0
0.83
21.
241.
96
75.0
0.95
01.
402.
14
50.0
1.11
1.61
2.37
25.0
1.35
1.90
2.72
10.0
1.62
2.22
3.09
5.0
1.80
2.43
3.34
0.00
263
0.00
901
0.01
44
0.02
83
0.05
73
0.11
1
0.18
4
0.24
0
0.36
9
0.02
40
0.04
57
0.06
16
0.09
28
0.13
9
0.21
6
0.31
1
0.37
9
0.53
1
0.07
13
0.10
1
0.12
1
0.15
9
0.22
1
0.33
7
0.48
6
0.59
3
0.83
0
0.11
6
0.16
6
0.20
0
0.25
8
0.34
5
0.49
0
0.66
5
0.78
7
1.05
0.23
6
0.30
8
0.34
6
0.40
4
0.48
6
0.64
0
0.83
5
0.96
9
1.26
0.38
1
0.48
0
0.53
5
0.61
9
0.73
4
0.92
9
1.16
1.31
1.64
1.0
2.18
2.85
3.82
00.
00.
51.
01.
52.
02.
53.
03.
54.
0
Qua
lity
ofsu
bmitt
edpr
oduc
t(p,
inpe
rcen
tnon
conf
orm
ing
forA
QL
s≤1
0;in
nonc
onfo
rmiti
espe
rhu
ndre
dun
itsfo
rAQ
Ls
>10
)N
ote:
Figu
res
oncu
rves
are
Acc
epta
nce
Qua
lity
Lim
its(A
QL
s)fo
rno
rmal
insp
ectio
n.
102030405060708090100
.25
1.5
1.0
.65
.40
.15
.10
.065
.015
PERCENTOFLOTS
EXPECTEDTOBE
ACCEPTED(Pa)
PSCHEMEPERFORMANCE
Copyright American Society for Quality Provided by IHS under license with ASQ
Not for ResaleNo reproduction or networking permitted without license from IHS
--`,,```,,,,````-`-`,,`,,`,`,,`---
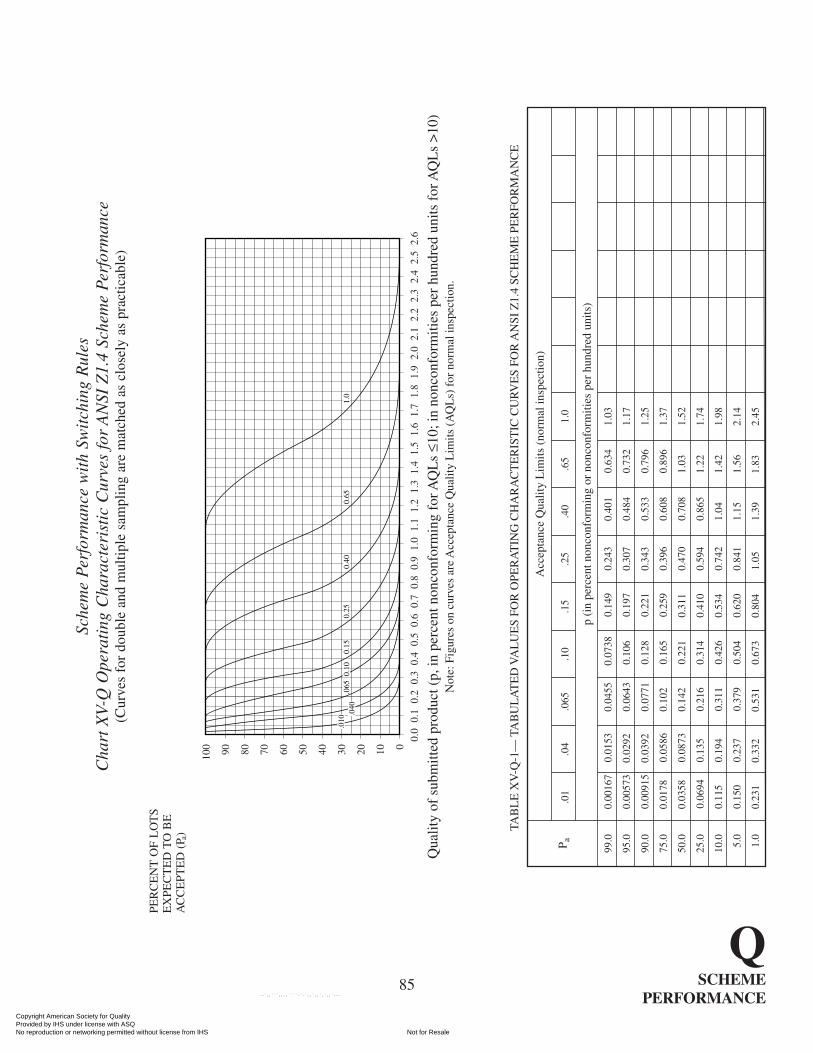
85
QSCHEME
PERFORMANCE
SchemePerform
ance
withSw
itchingRules
ChartXV-QOperating
CharacteristicCurvesforANSI
Z1.4SchemePerform
ance
(Curvesfordoubleandmultiplesamplingarematchedascloselyaspracticable)
P a
Acc
epta
nce
Qua
lity
Lim
its(n
orm
alin
spec
tion)
TAB
LE
XV
-Q-1
—TA
BU
LA
TE
DV
AL
UE
SFO
RO
PER
AT
ING
CH
AR
AC
TE
RIS
TIC
CU
RV
ES
FOR
AN
SIZ
1.4
SCH
EM
EPE
RFO
RM
AN
CE
p(i
npe
rcen
tnon
conf
orm
ing
orno
ncon
form
ities
per
hund
red
units
)
.01
.065
.04
.10
.15
.25
.40
.65
1.0
99.0
0.40
10.
634
1.03
95.0
0.48
40.
732
1.17
90.0
0.53
30.
796
1.25
75.0
0.60
80.
896
1.37
50.0
0.70
81.
031.
52
25.0
0.86
51.
221.
74
10.0
1.04
1.42
1.98
5.0
1.15
1.56
2.14
0.00
167
0.00
573
0.00
915
0.01
78
0.03
58
0.06
94
0.11
5
0.15
0
0.23
1
0.01
53
0.02
92
0.03
92
0.05
86
0.08
73
0.13
5
0.19
4
0.23
7
0.33
2
0.04
55
0.06
43
0.07
71
0.10
2
0.14
2
0.21
6
0.31
1
0.37
9
0.53
1
0.07
38
0.10
6
0.12
8
0.16
5
0.22
1
0.31
4
0.42
6
0.50
4
0.67
3
0.14
9
0.19
7
0.22
1
0.25
9
0.31
1
0.41
0
0.53
4
0.62
0
0.80
4
0.24
3
0.30
7
0.34
3
0.39
6
0.47
0
0.59
4
0.74
2
0.84
1
1.05
1.0
1.39
1.83
2.45
00.
00.
10.
20.
30.
40.
50.
60.
70.
80.
91.
01.
11.
21.
31.
41.
51.
61.
71.
81.
92.
02.
12.
22.
32.
42.
52.
6
Qua
lity
ofsu
bmitt
edpr
oduc
t(p,
inpe
rcen
tnon
conf
orm
ing
forA
QL
s≤1
0;in
nonc
onfo
rmiti
espe
rhu
ndre
dun
itsfo
rAQ
Ls
>10
)N
ote:
Figu
res
oncu
rves
are
Acc
epta
nce
Qua
lity
Lim
its(A
QL
s)fo
rno
rmal
insp
ectio
n.
102030405060708090100
0.65
0.40
0.25
0.15
.065
1.0
.010
.040
0.10
PERCENTOFLOTS
EXPECTEDTOBE
ACCEPTED(Pa)
Copyright American Society for Quality Provided by IHS under license with ASQ
Not for ResaleNo reproduction or networking permitted without license from IHS
--`,,```,,,,````-`-`,,`,,`,`,,`---
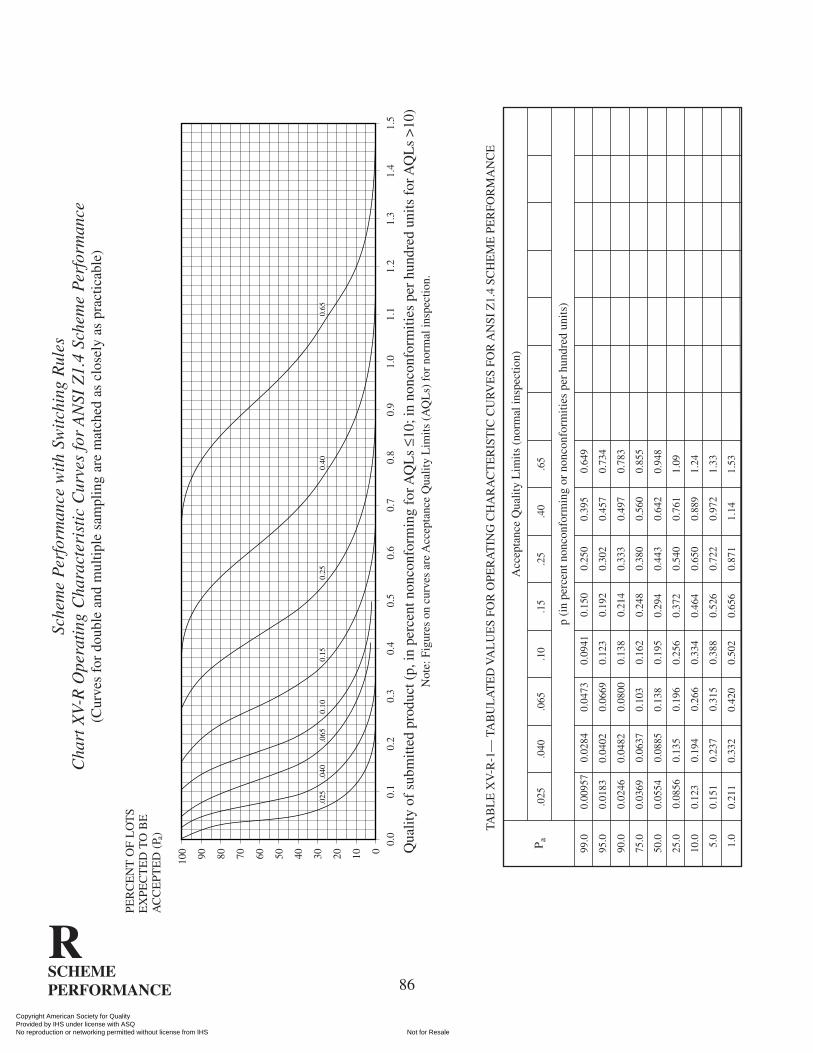
86
SchemePerform
ance
withSw
itchingRules
ChartXV-ROperating
CharacteristicCurvesforANSI
Z1.4SchemePerform
ance
(Curvesfordoubleandmultiplesamplingarematchedascloselyaspracticable)
P a
Acc
epta
nce
Qua
lity
Lim
its(n
orm
alin
spec
tion)
TAB
LE
XV
-R-1
—TA
BU
LA
TE
DV
AL
UE
SFO
RO
PER
AT
ING
CH
AR
AC
TE
RIS
TIC
CU
RV
ES
FOR
AN
SIZ
1.4
SCH
EM
EPE
RFO
RM
AN
CE
p(i
npe
rcen
tnon
conf
orm
ing
orno
ncon
form
ities
per
hund
red
units
)
.025
.065
.040
.10
.15
.25
.40
.65
99.0
0.39
50.
649
95.0
0.45
70.
734
90.0
0.49
70.
783
75.0
0.56
00.
855
50.0
0.64
20.
948
25.0
0.76
11.
09
10.0
0.88
91.
24
5.0
0.97
21.
33
0.00
957
0.01
83
0.02
46
0.03
69
0.05
54
0.08
56
0.12
3
0.15
1
0.21
1
0.02
84
0.04
02
0.04
82
0.06
37
0.08
85
0.13
5
0.19
4
0.23
7
0.33
2
0.04
73
0.06
69
0.08
00
0.10
3
0.13
8
0.19
6
0.26
6
0.31
5
0.42
0
0.09
41
0.12
3
0.13
8
0.16
2
0.19
5
0.25
6
0.33
4
0.38
8
0.50
2
0.15
0
0.19
2
0.21
4
0.24
8
0.29
4
0.37
2
0.46
4
0.52
6
0.65
6
0.25
0
0.30
2
0.33
3
0.38
0
0.44
3
0.54
0
0.65
0
0.72
2
0.87
11.
01.
141.
53
00.
00.
10.
20.
30.
40.
50.
60.
70.
80.
91.
01.
11.
21.
31.
41.
5
Qua
lity
ofsu
bmitt
edpr
oduc
t(p,
inpe
rcen
tnon
conf
orm
ing
forA
QL
s≤1
0;in
nonc
onfo
rmiti
espe
rhu
ndre
dun
itsfo
rAQ
Ls
>10
)N
ote:
Figu
res
oncu
rves
are
Acc
epta
nce
Qua
lity
Lim
its(A
QL
s)fo
rno
rmal
insp
ectio
n.
102030405060708090100
0.65
0.40
0.25
0.15
0.10
.065
.040
.025
PERCENTOFLOTS
EXPECTEDTOBE
ACCEPTED(Pa)
RSCHEMEPERFORMANCE
Copyright American Society for Quality Provided by IHS under license with ASQ
Not for ResaleNo reproduction or networking permitted without license from IHS
--`,,```,,,,````-`-`,,`,,`,`,,`---
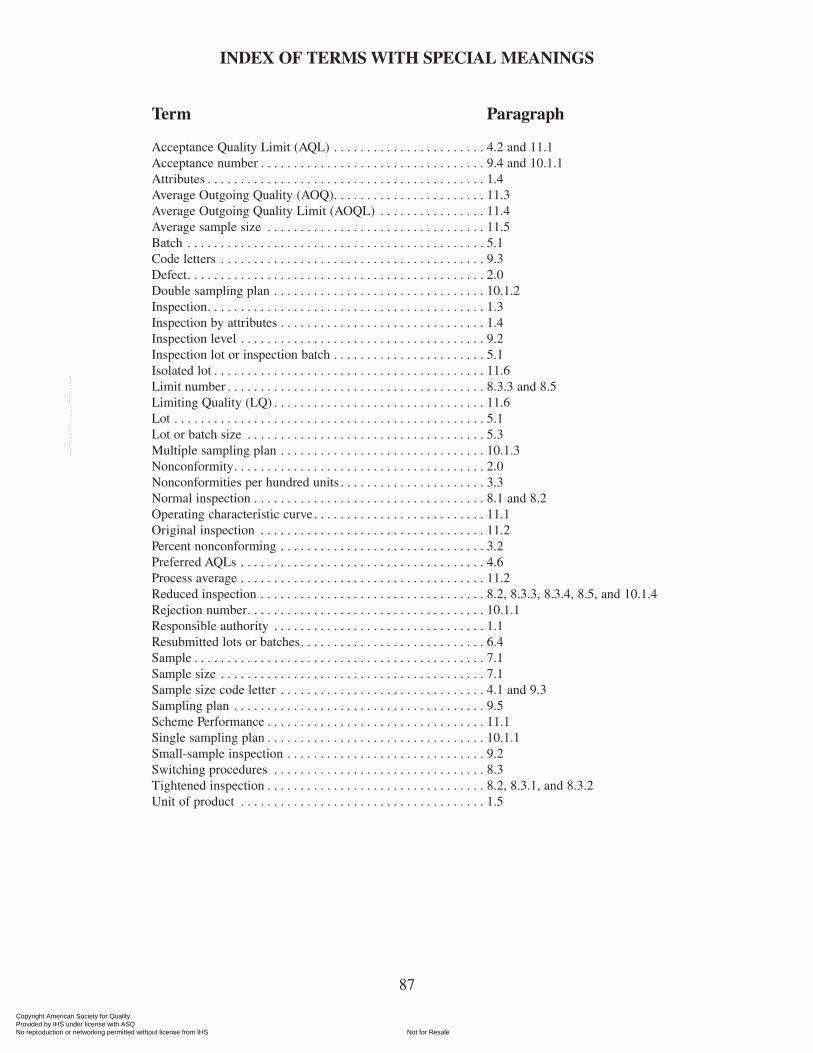
87
INDEX OF TERMSWITH SPECIAL MEANINGS
Term Paragraph
Acceptance Quality Limit (AQL) . . . . . . . . . . . . . . . . . . . . . . . 4.2 and 11.1Acceptance number . . . . . . . . . . . . . . . . . . . . . . . . . . . . . . . . . . 9.4 and 10.1.1Attributes . . . . . . . . . . . . . . . . . . . . . . . . . . . . . . . . . . . . . . . . . . 1.4Average Outgoing Quality (AOQ). . . . . . . . . . . . . . . . . . . . . . . 11.3Average Outgoing Quality Limit (AOQL) . . . . . . . . . . . . . . . . 11.4Average sample size . . . . . . . . . . . . . . . . . . . . . . . . . . . . . . . . . 11.5Batch . . . . . . . . . . . . . . . . . . . . . . . . . . . . . . . . . . . . . . . . . . . . . 5.1Code letters . . . . . . . . . . . . . . . . . . . . . . . . . . . . . . . . . . . . . . . . 9.3Defect. . . . . . . . . . . . . . . . . . . . . . . . . . . . . . . . . . . . . . . . . . . . . 2.0Double sampling plan . . . . . . . . . . . . . . . . . . . . . . . . . . . . . . . . 10.1.2Inspection. . . . . . . . . . . . . . . . . . . . . . . . . . . . . . . . . . . . . . . . . . 1.3Inspection by attributes . . . . . . . . . . . . . . . . . . . . . . . . . . . . . . . 1.4Inspection level . . . . . . . . . . . . . . . . . . . . . . . . . . . . . . . . . . . . . 9.2Inspection lot or inspection batch . . . . . . . . . . . . . . . . . . . . . . . 5.1Isolated lot . . . . . . . . . . . . . . . . . . . . . . . . . . . . . . . . . . . . . . . . . 11.6Limit number . . . . . . . . . . . . . . . . . . . . . . . . . . . . . . . . . . . . . . . 8.3.3 and 8.5Limiting Quality (LQ) . . . . . . . . . . . . . . . . . . . . . . . . . . . . . . . . 11.6Lot . . . . . . . . . . . . . . . . . . . . . . . . . . . . . . . . . . . . . . . . . . . . . . . 5.1Lot or batch size . . . . . . . . . . . . . . . . . . . . . . . . . . . . . . . . . . . . 5.3Multiple sampling plan . . . . . . . . . . . . . . . . . . . . . . . . . . . . . . . 10.1.3Nonconformity. . . . . . . . . . . . . . . . . . . . . . . . . . . . . . . . . . . . . . 2.0Nonconformities per hundred units . . . . . . . . . . . . . . . . . . . . . . 3.3Normal inspection . . . . . . . . . . . . . . . . . . . . . . . . . . . . . . . . . . . 8.1 and 8.2Operating characteristic curve. . . . . . . . . . . . . . . . . . . . . . . . . . 11.1Original inspection . . . . . . . . . . . . . . . . . . . . . . . . . . . . . . . . . . 11.2Percent nonconforming . . . . . . . . . . . . . . . . . . . . . . . . . . . . . . . 3.2Preferred AQLs . . . . . . . . . . . . . . . . . . . . . . . . . . . . . . . . . . . . . 4.6Process average . . . . . . . . . . . . . . . . . . . . . . . . . . . . . . . . . . . . . 11.2Reduced inspection . . . . . . . . . . . . . . . . . . . . . . . . . . . . . . . . . . 8.2, 8.3.3, 8.3.4, 8.5, and 10.1.4Rejection number. . . . . . . . . . . . . . . . . . . . . . . . . . . . . . . . . . . . 10.1.1Responsible authority . . . . . . . . . . . . . . . . . . . . . . . . . . . . . . . . 1.1Resubmitted lots or batches. . . . . . . . . . . . . . . . . . . . . . . . . . . . 6.4Sample . . . . . . . . . . . . . . . . . . . . . . . . . . . . . . . . . . . . . . . . . . . . 7.1Sample size . . . . . . . . . . . . . . . . . . . . . . . . . . . . . . . . . . . . . . . . 7.1Sample size code letter . . . . . . . . . . . . . . . . . . . . . . . . . . . . . . . 4.1 and 9.3Sampling plan . . . . . . . . . . . . . . . . . . . . . . . . . . . . . . . . . . . . . . 9.5Scheme Performance . . . . . . . . . . . . . . . . . . . . . . . . . . . . . . . . . 11.1Single sampling plan . . . . . . . . . . . . . . . . . . . . . . . . . . . . . . . . . 10.1.1Small-sample inspection . . . . . . . . . . . . . . . . . . . . . . . . . . . . . . 9.2Switching procedures . . . . . . . . . . . . . . . . . . . . . . . . . . . . . . . . 8.3Tightened inspection . . . . . . . . . . . . . . . . . . . . . . . . . . . . . . . . . 8.2, 8.3.1, and 8.3.2Unit of product . . . . . . . . . . . . . . . . . . . . . . . . . . . . . . . . . . . . . 1.5
Copyright American Society for Quality Provided by IHS under license with ASQ
Not for ResaleNo reproduction or networking permitted without license from IHS
--`,,```,,,,````-`-`,,`,,`,`,,`---
(This page intentionally left blank)
Copyright American Society for Quality Provided by IHS under license with ASQ
Not for ResaleNo reproduction or networking permitted without license from IHS
--`,,```,,,,````-`-`,,`,,`,`,,`---
T004Printed in the United States of America
Copyright American Society for Quality Provided by IHS under license with ASQ
Not for ResaleNo reproduction or networking permitted without license from IHS
--`,,```,,,,````-`-`,,`,,`,`,,`---