salaries survey 2015 - bvna.org.uk · dear member, welcome to the latest spvs salary survey. spvs...
TRANSCRIPT

SALARIES SURVEY 2015NURSES
supporting vets developing practice

Dear Member,
Welcome to the latest SPVS Salary survey. SPVS is all about supporting vets to develop their practices and our Fee and Salary Surveys are an integral part of that. Over the next year, we will be developing these surveys further, making it easier for practices to complete the survey online and adding a new ‘profitability’ survey. Our Vet Viewer Benchmarking Survey was launched last year, in partnership with Veterinary Insights and already around 250 practices have signed up and this number is growing steadily. This sort of data, as well as being of real value to individual practices, will make SPVS voice very relevant within the profession. For more information on all our surveys and benchmarking, visit www.spvs.org.uk Of course that’s not the only reason to be a member of SPVS. We offer great opportunities to network and meet like minded colleagues through our social events such as Snowscene, Cyclescene and Spascene, a fantastic range of Regional CPD events, Focus Days, and the best non-clinical Congress in the UK.
If you are not already a member, join today. If you are, then help us grow our membership, and with it our influence, by spreading the word and taking part in our surveys.
Best wishes
Nick StuartSenior Vice President
President’s Welcome
Executive SummaryThe SPVS Salaries Survey is the largest of its kind, and this year it drew 1900 responses between October and November 2015, although some of these were incomplete, meaning analysis has been limited in some instances.
VetsThis year there was a slight reduction in the number of responses received compared to last year, with a similar distribution in terms of age, gender, type of work and geographical location.
87.5% of respondents were full-time, working a median 40 hour week. Women comprised 66.5% of all respondents and 79.7% of part-timers, meaning more men who responded to our survey worked part-time than last year. The pattern of out-of-hours (OOH) working was similar to last year, and whilst all practices in the >75% Small Animal/Exotic category did OOH work, this may be an aberration of the small sample size for this group.

Once again, salaries we analysed by years qualified, work type, gender and geographical location and overall there are only marginal changes from last year’s survey, although this did vary widely between categories. However, it is possible to discern a widening gap between newly qualified vets, whose median salary actually fell by 3.7%, and more experienced vets, with all groups qualified 10 years or more showing increases of between 2.6% and 10.8%. The variation between various groups should counsel caution in interpretation, but this does seem to bear out the results of a previous survey carried out by SPVS which suggested that there was a shortage of more experienced vets, with many practices experiencing difficulty in recruiting for these posts. Despite this it is worth noting that whilst newly qualified vets compared favourably with their equivalents in the medical and dental profession, those more qualified still lag behind, with a 11-15 year qualified vet, for example, expecting to earn £44,194 to £65,217 (median £48,750) compared to £55,412 to £83,617 for doctors, and £55,000 to £110,000 for dentists (source: www.prospects.ac.uk )
It is disappointing to report no further progress in closing the gender pay gap in the profession which remains stubbornly at 16.7% for full time salaries and up at 15.8% for hourly rates.
The majority of respondents worked in small animal practice, which showed a 5% increase in median salary to £43,200, whilst practices that were predominantly small animal actually recorded a slight drop of 13.8%. Salaries in equine practice also rose by 10.3% to a median figure of £47,449, whist mixed practice recorded an increase of 3.9% to £42,791 and large animal practice showed an increase of 0.1% to £44,184. By contrast veterinarians employed in industry earned a median £64,870, up on last year’s figure of £59,106.
Across the regions the variation in salaries was less marked than last year, ranging from £40,825 for Merseyside and the Midlands to £45,695 in greater London.
Nurses1057 nurses responded to the survey, significantly more than last time, and most of these (86.2%) were qualified, the remainder consisting of students and a handful of Veterinary Care Assistants and others.
Full-time qualified nurses recorded a median salary of £21,350, up 1.7% on last year, while students were paid a median £14,060, the same as last year. The hourly rates (including part-timers) were £12.05 for qualified nurses and £7.84 for students. Regionally, the median full–time salary for all respondents varied from £19,900 in Merseyside and the Midlands to £25,000 in Greater London.
Receptionists and Practice Managers/Administrators154 managers/administrators responded, similar in number to last year, but only 43 receptionists. Their hourly rate was £8.89, with an interquartile range of £7.95 to £10.54. Managers were paid between £13.77 and £22.66 an hour (median £17.53) with those possessing a management qualification enjoying a 35.9% premium over those who did not.
Peter Brown
Fees Survey 2015
Welcome to the latest SPVS Fees Survey. The results are compiled from responses received between March an April 2015 and in total 355 respondents answered at least some of the questions. We are extremely grateful to all those practices that took part.
This full report contains the results broken down into regional figures. For each question the number of responses (n), the lower and upper quartile figures (LQ and UQ), which represent the middle 50% of all responses, and the median are shown along with the overall figures from the 2014 Survey as a comparison (the 2014 results were gathered between November 2013 and January 2014, so some 15 months prior to this survey). All figures are quoted net of VAT.
I hope you find the survey helpful. Members tell us that these surveys are one of the most useful benefits of SPVS membership and I am keen that they continue to remain relevant to modern veterinary practice, so if you have any comments regarding the contents, or suggestions for future surveys, please let me know.
Peter Brown
SPVS
The Governor’s House, Cape Rd, Warwick, CV34 5DJ
Email: [email protected] Web: www.spvs.org.uk

©2015 Society of Practising Veterinary Surgeons
2SPVS SALARIES SURVEY 2015
It was gratifying to see over 1000 nurses responding to this year’s survey, 1057 giving data to assess the salary package. Of these, 14 were directors in a corporate practice. 28 (3.3%) of all respondents were male.
The graphs below show the distribution of responses by practice type and region:
Nurses Salaries
Figure 2: Distribution of Respondents by Practice Type (ii)
Figure 1: Distribution of Respondents by Practice Type (i)
First Opinion & Referral, 233
First Opinion, 719
Referral, 52
Charity, 28
Non-Clinical, 31
Equine, 21
100% SA/Exotic, 770
Mixed, 160
Specialist OOH, 19
>75% Large Animal, 1
>75% Large Animal, 1
Non-Clinical, 31
>75% Small Animal, 61

©2015 Society of Practising Veterinary Surgeons
3SPVS SALARIES SURVEY 2015
No. %
I am currently a student (VN or other qualification) 134 12.6%
I am a qualified VN 914 86.2%
I have a veterinary nursing degree 206
I have a veterinary nursing diploma 602
Other* 68
I am a qualified Veterinary Care Assistant (VCA) or ANA 13 1.2%
Figure 3: Respondents by Region
The table below shows the number of respondents in each category:
Table 1: Respondents by Status* Respondents specified other qualifications such as “Green Book”, “RANA”, HNC/D, NVQ or RVN.
The proportion of respondents was similar to before, with slightly fewer VCAs responding.
A - Wales/SW, 217
B - London, 56
C - SE England, 335
D - Scotland/NI, 74
E - N England, 151
F - Mersey/Midlands, 213

©2015 Society of Practising Veterinary Surgeons
4SPVS SALARIES SURVEY 2015
Figure 4: Percentage of Respondents with Stated Number of Contractual Hours per Week
The median number of contractual hours for all respondents was 38.5, compared to 39 last year. Only 0.3% of respondents were contracted to work more than 48 hours per week. The median number of hours actually worked was 40. 63.7% of nurses say they worked more hours than they were contracted to do, with a median figure of 4 hours, similar to last year.
General Comments
Contract of Employment89.7% of respondents said they had a written contract of employment, which is slightly higher than the figure from last year.
Full-time or Part-timeAs in previous years, fulltime employees we defined as those working 35 or more hours a week, but the division is necessarily somewhat arbitrary and 44 respondents said they worked between 30.5 and 34.5 hours. This year 210 responses were received from part-time employees.
Contractual Hours and ‘Hourly Rate’As in the previous survey, a notional figure of ‘annual contractual hours’ was derived to give an hour-ly rate. This was calculated by dividing total number of days holiday (including bank holidays) by the number of days worked per week and subtracting this from 52 to give the actual number of weeks worked per year. This figure is then multiplied by the contractual hours as stated to produce the annual contractual hours. The hourly rate is then given by the total salary package divided by the annual contractual hours. It should be noted that this is not the actual hourly rate of pay (as holidays are ‘paid’ annual leave) but we believe that the figures given by this calculation allow a better compari-son between differing remuneration packages, given the variation in terms and conditions offered by employers, hence its use here.
Contractual Hours v. Actual HoursThe distribution of contractual hours stated is shown in the graph below which follows a similar pat-tern to previous years.
50.0%
60.0%
40.0%
20.0%
30.0%
10.0%
0.0%<20 ≥39<49 ≥49≥20<35 ≥35<39
% 2014
% 2015

©2015 Society of Practising Veterinary Surgeons
5SPVS SALARIES SURVEY 2015
Weekend and Out-of-Hours (OOH) WorkingNights62% of those who responded said they worked nights. Of those who gave a figure (412) the median number of nights worked per year was 40 and the range was 1 to 365.
WeekendsThe table below shows the numbers working Saturday and Sunday, both daytime hours present at the surgery, and additional hours on call:
Table 2: Weekend Working
These figures are similar to last year, except that more nurses reported being on call on Sundays for additional hours.
Remuneration for Nights and WeekendsOf the 976 nurses who answered this question, 23.4% of respondents received time off in lieu, 29.4% received payment above their basic salary and 36.2% received a combination of the two. 11.1% did not receive any additional remuneration for such work.
Directors15 Nurses stated that they were company directors. The median salary of those who stated they were directors was £29,194, with an hourly rate of £18.95, compared to the overall figures of £20,588 and £11.68 respectively. Because of the relatively small numbers they have been included in the overall analysis.
Student LoansOf the 919 people who answered this question 242 (26.3%) had a loan when they qualified and 238 gave figures. The numbers are shown below, with the percentages expressed as a proportion of these 238 respondents:
Saturday DaytimeSat. Additional Hours On-Call
Sunday DaytimeSun. Additional Hours On-Call
% Working 88.7% 31.6% 54.3% 42.6%
Median Annual No. 12 - 10 -
Median Hours 7 12 7 19.5
Range (Hours) 2 - 24 1-24 1 - 24 1 - 24
Range (No of days) 1 - 52 - 1-52 -
Table 3: Student Loans
Number % Number %
I did not have a loan/I have paid it off 14 5.9%
Up to £10,000 58 24.4% 61 25.6%
£10,001 to £20,000 78 32.8% 72 30.3%
£20,001 to £30,000 66 27.7% 60 25.2%
£30,001 to £40,000 25 10.5% 20 8.4%
£40,001 to £60,000 7 2.9% 7 2.9%
£60,001 to £85,000 3 1.3% 4 1.7%
£85,001 - £100,000 1 0.4% 0 0.0%
At Graduation Still Outstanding
©2015 Society of Practising Veterinary Surgeons
6SPVS SALARIES SURVEY 2015
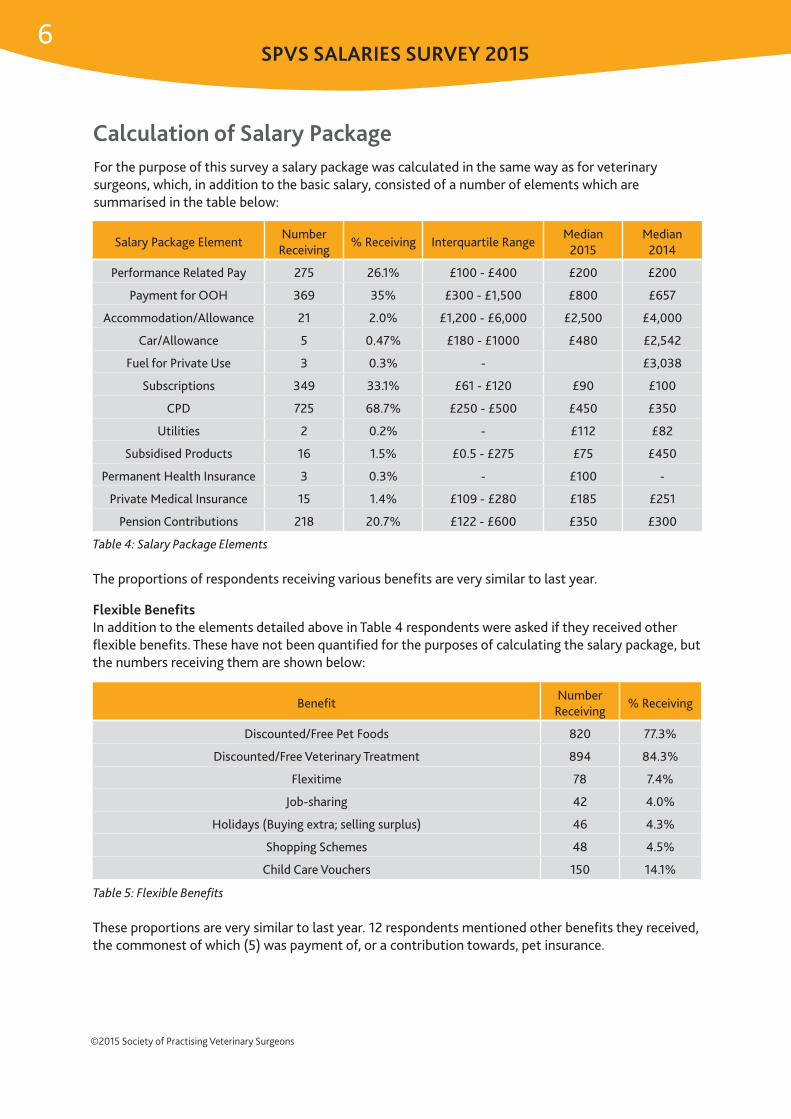
For the purpose of this survey a salary package was calculated in the same way as for veterinary surgeons, which, in addition to the basic salary, consisted of a number of elements which are summarised in the table below:
Table 4: Salary Package Elements
The proportions of respondents receiving various benefits are very similar to last year.
Flexible BenefitsIn addition to the elements detailed above in Table 4 respondents were asked if they received other flexible benefits. These have not been quantified for the purposes of calculating the salary package, but the numbers receiving them are shown below:
Table 5: Flexible Benefits
These proportions are very similar to last year. 12 respondents mentioned other benefits they received, the commonest of which (5) was payment of, or a contribution towards, pet insurance.
Salary Package ElementNumber
Receiving% Receiving Interquartile Range
Median 2015
Median 2014
Performance Related Pay 275 26.1% £100 - £400 £200 £200
Payment for OOH 369 35% £300 - £1,500 £800 £657
Accommodation/Allowance 21 2.0% £1,200 - £6,000 £2,500 £4,000
Car/Allowance 5 0.47% £180 - £1000 £480 £2,542
Fuel for Private Use 3 0.3% - £3,038
Subscriptions 349 33.1% £61 - £120 £90 £100
CPD 725 68.7% £250 - £500 £450 £350
Utilities 2 0.2% - £112 £82
Subsidised Products 16 1.5% £0.5 - £275 £75 £450
Permanent Health Insurance 3 0.3% - £100 -
Private Medical Insurance 15 1.4% £109 - £280 £185 £251
Pension Contributions 218 20.7% £122 - £600 £350 £300
BenefitNumber
Receiving% Receiving
Discounted/Free Pet Foods 820 77.3%
Discounted/Free Veterinary Treatment 894 84.3%
Flexitime 78 7.4%
Job-sharing 42 4.0%
Holidays (Buying extra; selling surplus) 46 4.3%
Shopping Schemes 48 4.5%
Child Care Vouchers 150 14.1%
Calculation of Salary Package

©2015 Society of Practising Veterinary Surgeons
7SPVS SALARIES SURVEY 2015
The table below shows the value of the total annual salary package for full-time employees (those working 35 hours or more per week) in various categories.
This year we have introduced a table to show how the hourly rate of qualified nurses changes with the period qualified. As might be expected, there is a tendency for the amount to increase with experience, and again there are modest increases compared with the previous year.
Table 6: Full-Time Salaries
The same breakdown is shown below for hourly rates, this time including part-time employees:
Table 7: Hourly Rates for All Employees
Across the various categories rates of pay have increased by between 0% and 8%.
Table 8: Hourly Rate by Period Qualified
Category n Interquartile Range Median 2015 Median 2014
All F/T 846 £17,762 - £24,172 £20,588 £20,229
Students 111 £12,400 - £16,218 £14,060 £14,061
ALL Qualified Nurses 725 £19,000 - £24,800 £21,350 £21,000
Degree Holders 183 £18,968 - £23,450 £20,700 £20,615
Qualified Nurses with Postgraduate Qualification
145 £20,800 - £28,665 £24,500 £23,565
Veterinary Care Assistant 9 £12,168 - £17,000 £14,950 £14,224
Category n Interquartile Range Median 2015 Median 2014
All 849 £10.04 – £13.70 £11.68 £11.20
Students 96 £6.91 - £8.87 £7.84 £7.56
ALL Qualified Nurses 742 £10.64 - £14.10 £12.05 £11.58
Degree Holders 170 £10.25 – £13.57 £11.52 £11.39
Qualified Nurses with Postgraduate Qualification
151 £11.69 - £16.05 £13.64 £13.54
Veterinary Care Assistant 11 £7.22 - £9.59 £8.63 £7.99
Period Qualified n Interquartile Range Median 2015 Median 2014
< 1 year 122 £8.34 - £10.79 £9.66 £9.64
≥1 and <5 years 278 £9.08 - £11.97 £10.74 £10.68
≥5 and <10 years 179 £11.17 - £14.07 £12.56 £11.77
≥10 and <20 years 192 £11.77 - £15.96 £13.50 £12.98
≥20 years 78 £11.90 - £16.49 £13.30 £13.22
Salaries by Period Qualified
Annual Salary
©2015 Society of Practising Veterinary Surgeons
8SPVS SALARIES SURVEY 2015
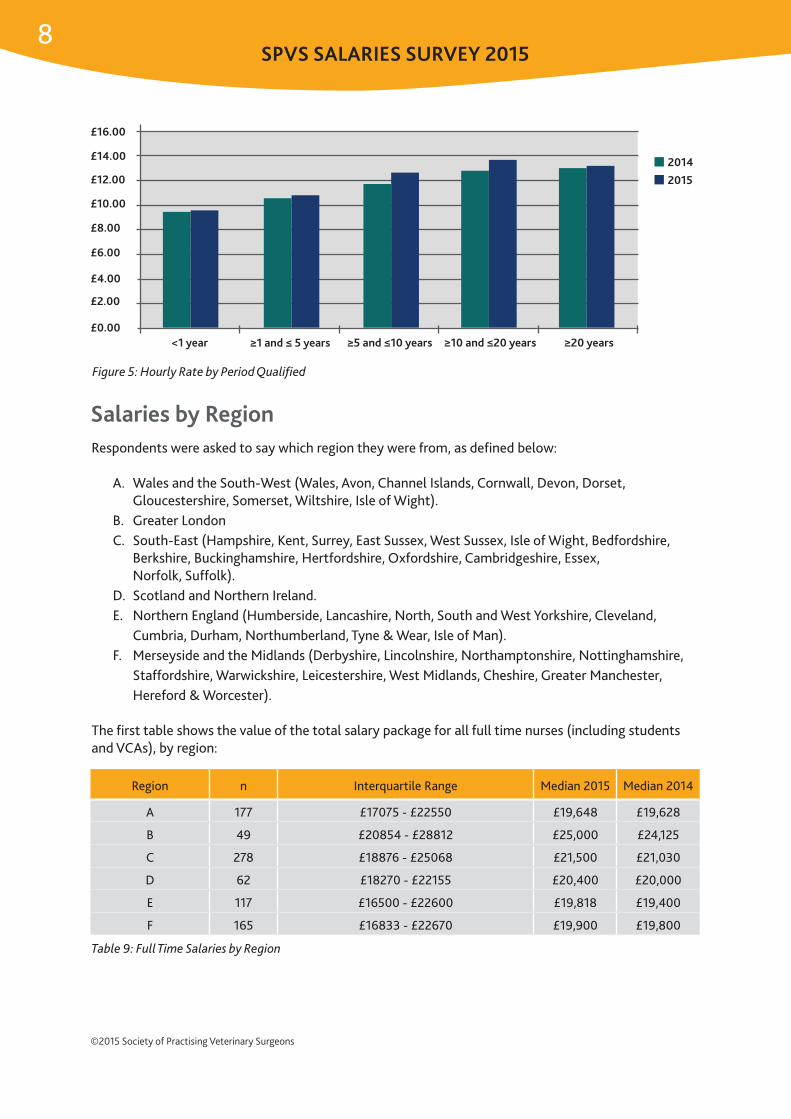
Respondents were asked to say which region they were from, as defined below:
A. Wales and the South-West (Wales, Avon, Channel Islands, Cornwall, Devon, Dorset, Gloucestershire, Somerset, Wiltshire, Isle of Wight). B. Greater London C. South-East (Hampshire, Kent, Surrey, East Sussex, West Sussex, Isle of Wight, Bedfordshire, Berkshire, Buckinghamshire, Hertfordshire, Oxfordshire, Cambridgeshire, Essex, Norfolk, Suffolk). D. Scotland and Northern Ireland. E. Northern England (Humberside, Lancashire, North, South and West Yorkshire, Cleveland, Cumbria, Durham, Northumberland, Tyne & Wear, Isle of Man). F. Merseyside and the Midlands (Derbyshire, Lincolnshire, Northamptonshire, Nottinghamshire, Staffordshire, Warwickshire, Leicestershire, West Midlands, Cheshire, Greater Manchester, Hereford & Worcester).
The first table shows the value of the total salary package for all full time nurses (including students and VCAs), by region:
Table 9: Full Time Salaries by Region
Figure 5: Hourly Rate by Period Qualified
Region n Interquartile Range Median 2015 Median 2014
A 177 £17075 - £22550 £19,648 £19,628
B 49 £20854 - £28812 £25,000 £24,125
C 278 £18876 - £25068 £21,500 £21,030
D 62 £18270 - £22155 £20,400 £20,000
E 117 £16500 - £22600 £19,818 £19,400
F 165 £16833 - £22670 £19,900 £19,800
Salaries by Region
£10.00
£12.00
£8.00
£4.00
£6.00
£2.00
£0.00<1 year ≥1 and ≤ 5 years ≥5 and ≤10 years
2014
2015
£14.00
£16.00
≥10 and ≤20 years ≥20 years
©2015 Society of Practising Veterinary Surgeons
9SPVS SALARIES SURVEY 2015
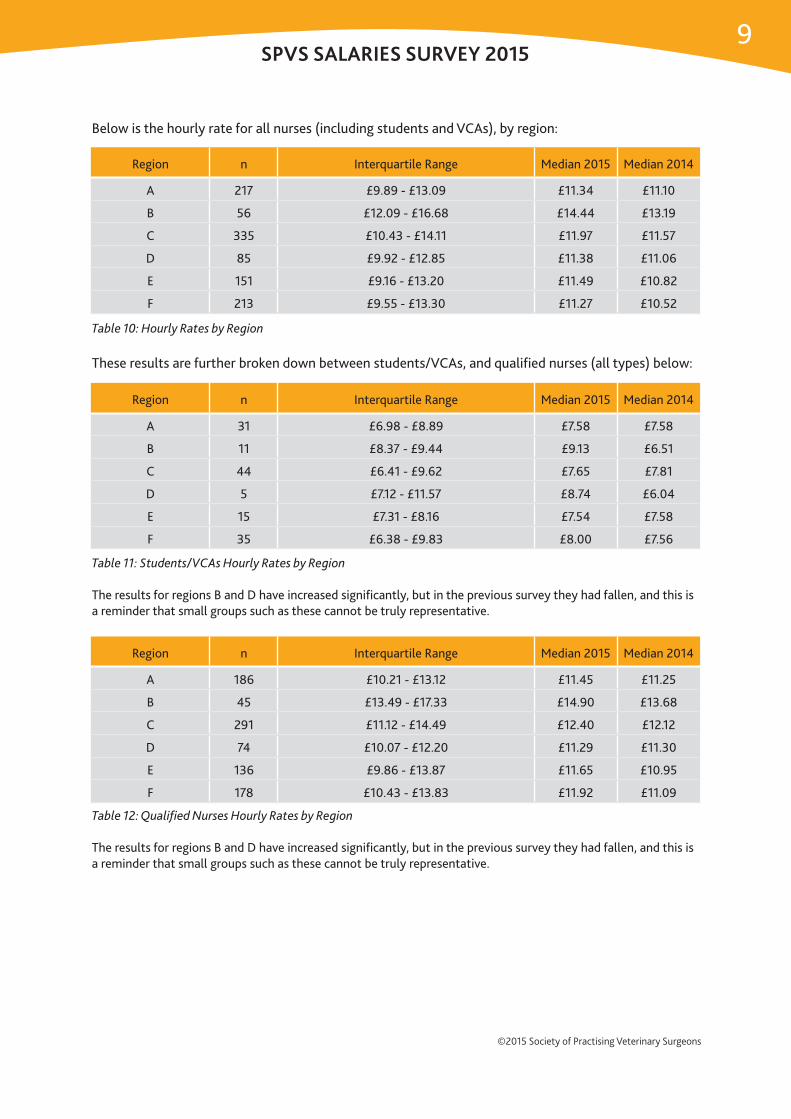
Below is the hourly rate for all nurses (including students and VCAs), by region:
These results are further broken down between students/VCAs, and qualified nurses (all types) below:
Region n Interquartile Range Median 2015 Median 2014
A 217 £9.89 - £13.09 £11.34 £11.10
B 56 £12.09 - £16.68 £14.44 £13.19
C 335 £10.43 - £14.11 £11.97 £11.57
D 85 £9.92 - £12.85 £11.38 £11.06
E 151 £9.16 - £13.20 £11.49 £10.82
F 213 £9.55 - £13.30 £11.27 £10.52
Region n Interquartile Range Median 2015 Median 2014
A 31 £6.98 - £8.89 £7.58 £7.58
B 11 £8.37 - £9.44 £9.13 £6.51
C 44 £6.41 - £9.62 £7.65 £7.81
D 5 £7.12 - £11.57 £8.74 £6.04
E 15 £7.31 - £8.16 £7.54 £7.58
F 35 £6.38 - £9.83 £8.00 £7.56
Region n Interquartile Range Median 2015 Median 2014
A 186 £10.21 - £13.12 £11.45 £11.25
B 45 £13.49 - £17.33 £14.90 £13.68
C 291 £11.12 - £14.49 £12.40 £12.12
D 74 £10.07 - £12.20 £11.29 £11.30
E 136 £9.86 - £13.87 £11.65 £10.95
F 178 £10.43 - £13.83 £11.92 £11.09
Table 10: Hourly Rates by Region
Table 11: Students/VCAs Hourly Rates by Region
The results for regions B and D have increased significantly, but in the previous survey they had fallen, and this is a reminder that small groups such as these cannot be truly representative.
Table 12: Qualified Nurses Hourly Rates by Region
The results for regions B and D have increased significantly, but in the previous survey they had fallen, and this is a reminder that small groups such as these cannot be truly representative.

©2015 Society of Practising Veterinary Surgeons
10SPVS SALARIES SURVEY 2015
For more information and to join: www.spvs.org.uk 01926 840318
ReceptionistsNo regional figures are shown for receptionists this year in view of the small number responding.
Managers/AdministratorsRegional hourly rates for all managers/administrators are show below:
Table 6: Hourly Rates for Managers/Administrators by Region
Apart from region C all regions have shown an increase this year.
Region n Lower Quart Upper Quart Median Median 2014
A 38 £15.95 £22.66 £17.47 £16.62
B 7 £20.67 £22.51 £21.82 £20.55
C 50 £14.13 £23.49 £17.19 £18.26
D 8 £11.86 £23.51 £16.85 £14.68
E 19 £13.95 £21.52 £19.61 £13.88
F 26 £12.31 £20.35 £15.27 £14.07
Make the most of your membership.....Many SPVS members say the Fee and Salary Surveys are why they joined SPVS, but there is so much more on offer. Here are a few more reasons why just £12 per month makes your membership so worthwhile:
We keep you up to date on the issues that really impact on the profession via our various events and networking channels
Practice Life, our quarterly magazine is one of the most widely read veterinary publications
We influence the debate on behalf of our members through our contributions to a wide range of working parties and forums from RCVS ‘Mind Matters’ to BVA’s debate on Governance
Snowcene, Cyclescene and now, Spascene allow networking and first rate CPD while doing the sport you love... or just chilling out!
SPVS/VPMA Congress. Simply the best non-clinical veterinary congress in the country, if not the world. If you’ve never been, you are really missing out
Access to preferential rates and affiliated deals to save you or your practice money. These alone can cover the cost of membership
Regional CPD covering everything from employment law to improving profitability with events from Belfast to Surrey, Bristol to Milton Keynes plus 2 Focus Days on Technology and Human Resources
Free advice from our Employers’ helpline provided by Citation and access to a range of H&S fact sheets
Our email discussion group offers quick and confidential access to a large group of colleagues in practice who are happy to share their experiences and advice and to learn from you too
A growing and developing benchmarking service which will offer robust data on a whole range of crucial figures to help your practice improve profitability
3
3
3
3
3
3
3
3
3
3

©2015 Society of Practising Veterinary Surgeons
SPVS SALARIES SURVEY 2015
Unit 19aHatton Country World
Hatton, WarwickCV35 8XA
T: 01926 840318E. [email protected]
join now This invaluable SPVS Salary Survey is free of charge to SPVS members.If you’re not a member, join now by calling 01926 840318 or visiting www.spvs.org.uk