rwe group in 2008 rwe in poland · “rwe in poland” was prepared by rwe polska corporate...
TRANSCRIPT
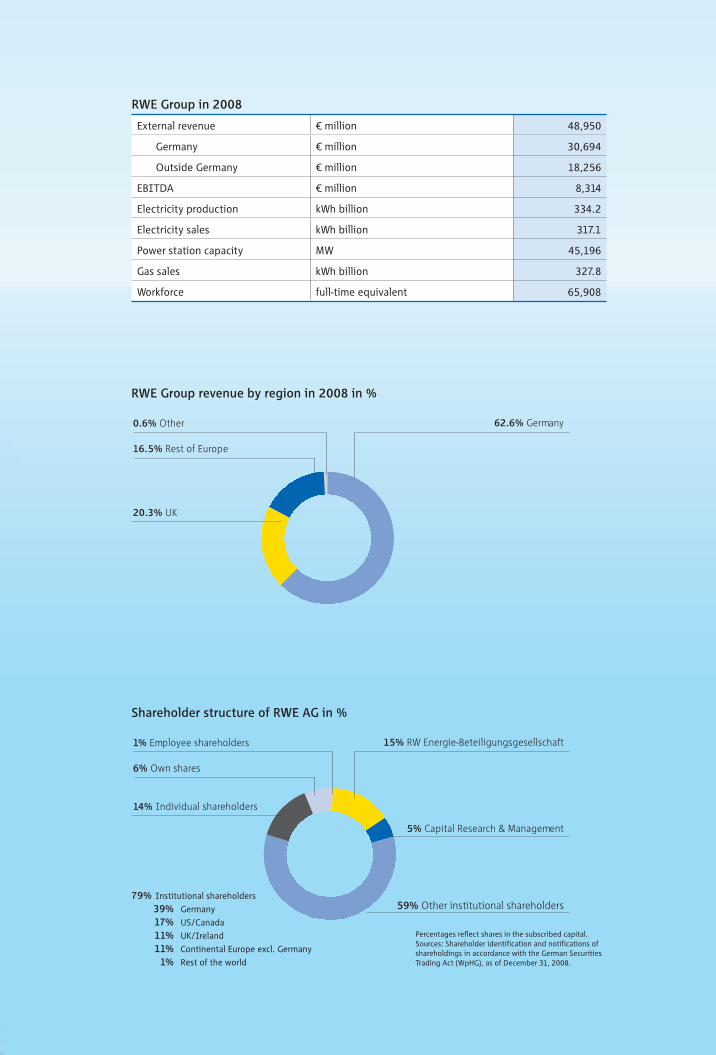
External revenue € million 48,950
Germany € million 30,694
Outside Germany € million 18,256
EBITDA € million 8,314
Electricity production kWh billion 334.2
Electricity sales kWh billion 317.1
Power station capacity MW 45,196
Gas sales kWh billion 327.8
Workforce full-time equivalent 65,908
RWE Group in 2008
Shareholder structure of RWE AG in %
15% RW Energie-Beteiligungsgesellschaft
5% Capital Research & Management
59% Other institutional shareholders
1% Employee shareholders
6% Own shares
14% Individual shareholders
79% Institutional shareholders
39% Germany
17% US/Canada
11% UK/Ireland
11% Continental Europe excl. Germany
1% Rest of the world
Percentages reflect shares in the subscribed capital. Sources: Shareholder identification and notifications of shareholdings in accordance with the German Securities Trading Act (WpHG), as of December 31, 2008.
RWE Group revenue by region in 2008 in %
62.6% Germany0.6% Other
16.5% Rest of Europe
20.3% UK
RWE in Poland
RWE_okl_EN-Final_2209.indd 2RWE_okl_EN-Final_2209.indd 2 9/23/09 11:52:14 AM9/23/09 11:52:14 AM
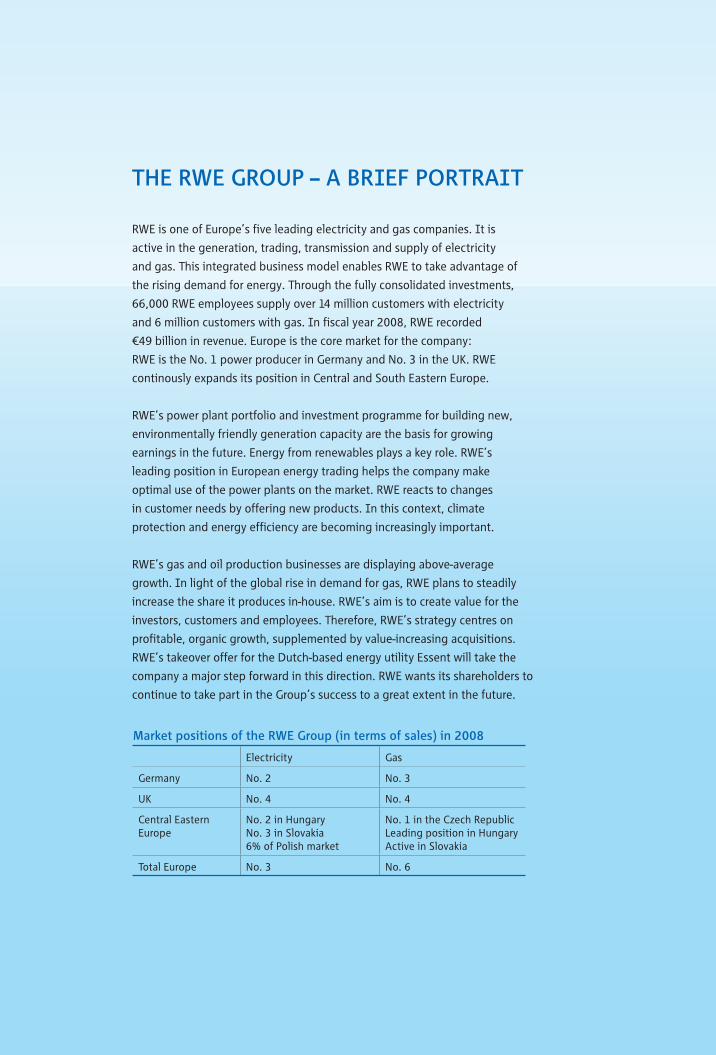
RWE is one of Europe’s five leading electricity and gas companies. It is
active in the generation, trading, transmission and supply of electricity
and gas. This integrated business model enables RWE to take advantage of
the rising demand for energy. Through the fully consolidated investments,
66,000 RWE employees supply over 14 million customers with electricity
and 6 million customers with gas. In fiscal year 2008, RWE recorded
€49 billion in revenue. Europe is the core market for the company:
RWE is the No. 1 power producer in Germany and No. 3 in the UK. RWE
continously expands its position in Central and South Eastern Europe.
RWE’s power plant portfolio and investment programme for building new,
environmentally friendly generation capacity are the basis for growing
earnings in the future. Energy from renewables plays a key role. RWE’s
leading position in European energy trading helps the company make
optimal use of the power plants on the market. RWE reacts to changes
in customer needs by offering new products. In this context, climate
protection and energy efficiency are becoming increasingly important.
RWE’s gas and oil production businesses are displaying above-average
growth. In light of the global rise in demand for gas, RWE plans to steadily
increase the share it produces in-house. RWE’s aim is to create value for the
investors, customers and employees. Therefore, RWE’s strategy centres on
profitable, organic growth, supplemented by value-increasing acquisitions.
RWE’s takeover offer for the Dutch-based energy utility Essent will take the
company a major step forward in this direction. RWE wants its shareholders to
continue to take part in the Group’s success to a great extent in the future.
THE RWE GROUP – A BRIEF PORTRAIT
Electricity Gas
Germany No. 2 No. 3
UK No. 4 No. 4
Central EasternEurope
No. 2 in HungaryNo. 3 in Slovakia6% of Polish market
No. 1 in the Czech RepublicLeading position in HungaryActive in Slovakia
Total Europe No. 3 No. 6
Market positions of the RWE Group (in terms of sales) in 2008
“RWE in Poland” was prepared by RWE Polska Corporate Communications.
T +48 22 821 41 30
This report is also available in the Polish language.
Published in August 2009.
RWE Renewables Polska
RWE Renewables Polska Sp. z o.o.
ul. Wybrze e Ko ciuszkowskie 41
00-347 Warszawa, Poland
RWE Innogy GmbH
Karolingerstraße 94
45141 Essen, Germany
T +49 201 12 14 499
F +49 201 12 14 498
www.rweinnogy.com
RWE Polska Contracting
RWE Polska Contracting Sp. z o.o.
ul. Powsta ców l skich 28/30
53-333 Wroc aw, Poland
T +48 71 335 03 30
F +48 71 335 03 31
www.rwe.pl
B dzin Cogeneration Power Station
Elektrociep ownia “B dzin” SA
ul. Ma ob dzka 141
42-500 B dzin, Poland
T +48 32 267 95 99
+48 32 266 40 71–5
F +48 32 266 44 11
www.ecb.com.pl
D browa Górnicza Water and Sewers Company
Przedsi biorstwo Wodoci gów i Kanalizacji Sp. z o.o.
ul. Powsta ców 13
41-300 D browa Górnicza, Poland
T +48 32 639 51 00
F +48 32 262 22 10
www.pwik-dabrowa.pl
RWE Dea Polska
RWE Dea Polska Oil Sp. z o.o.
ul. Lindleya 16/114
02-013 Warszawa, Poland
T +48 22 627 36 15
F +48 22 583 15 17
www.rwedea.com
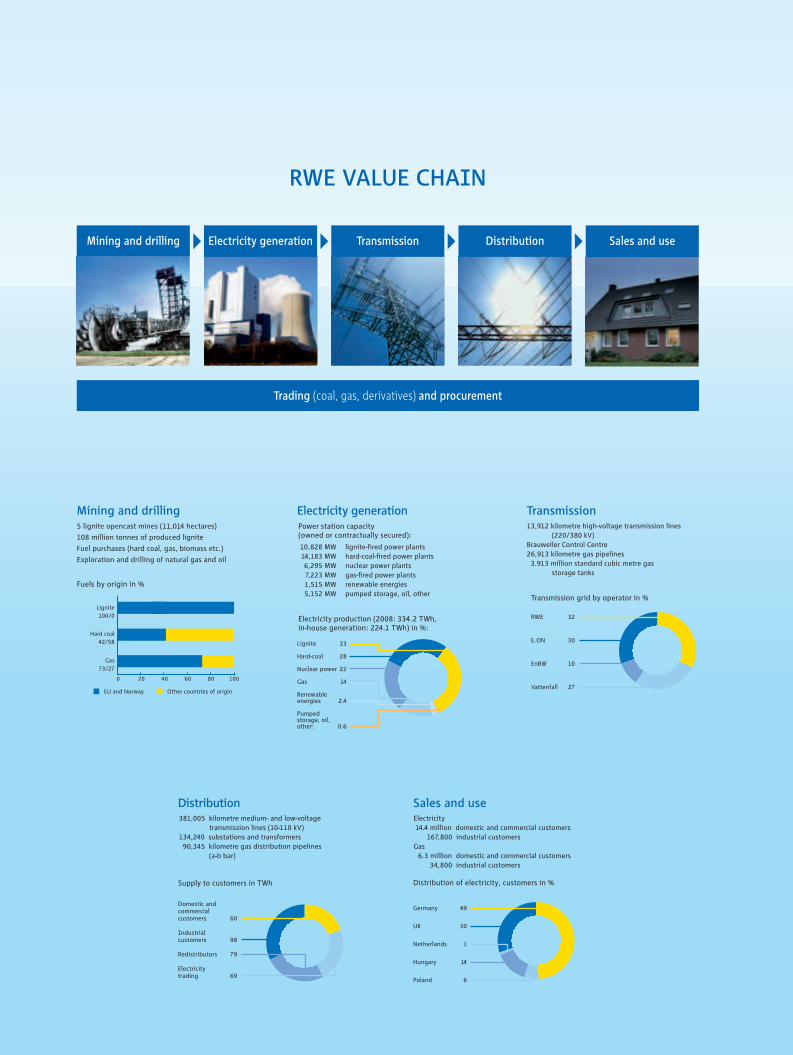
RWE VALUE CHAIN
Mining and drilling
Trading (coal, gas, derivatives) and procurement
Electricity generation Transmission Distribution Sales and use
5 lignite opencast mines (11,014 hectares)
108 million tonnes of produced lignite
Fuel purchases (hard coal, gas, biomass etc.)
Exploration and drilling of natural gas and oil
Lignite
100/0
EU and Norway
Hard coal
42/58
Gas
73/27
0 20 40 60 80 100
Fuels by origin in %
Other countries of origin
Mining and drilling
10,828 MW
14,183 MW
6,295 MW
7,223 MW
1,515 MW
5,152 MW
lignite-fired power plants
hard-coal-fired power plants
nuclear power plants
gas-fired power plants
renewable energies
pumped storage, oil, other
Lignite
Hard-coal
Nuclear power
Gas
Renewableenergies
Pumped storage, oil, other:
33
28
22
14
2.4
0.6
Electricity production (2008: 334.2 TWh,in-house generation: 224.1 TWh) in %:
Power station capacity(owned or contractually secured):
Electricity generation
381,005 kilometre medium- and low-voltage
transmission lines (10-110 kV)
134,240 substations and transformers
90,345 kilometre gas distribution pipelines
(a-b bar)
Domestic andcommercialcustomers
Industrial customers
Redistributors
Electricitytrading
60
98
79
69
Supply to customers in TWh
Distribution
13,912 kilometre high-voltage transmission lines
(220/380 kV)
Brauweiler Control Centre
26,913 kilometre gas pipelines
3.913 million standard cubic metre gas
storage tanks
RWE
E.ON
EnBW
Vattenfall
32
30
10
27
Transmission grid by operator in %
Transmission
Electricity
14.4 million domestic and commercial customers
167,800 industrial customers
Gas
6.3 million domestic and commercial customers
34,800 industrial customers
Germany
UK
Netherlands
Hungary
Poland
49
30
1
14
6
Distribution of electricity, customers in %
Sales and use
RWE_okl_EN-Final_2209.indd 3RWE_okl_EN-Final_2209.indd 3 9/23/09 11:52:19 AM9/23/09 11:52:19 AM
External revenue € million 48,950
Germany € million 30,694
Outside Germany € million 18,256
EBITDA € million 8,314
Electricity production kWh billion 334.2
Electricity sales kWh billion 317.1
Power station capacity MW 45,196
Gas sales kWh billion 327.8
Workforce full-time equivalent 65,908
RWE Group in 2008
Shareholder structure of RWE AG in %
15% RW Energie-Beteiligungsgesellschaft
5% Capital Research & Management
59% Other institutional shareholders
1% Employee shareholders
6% Own shares
14% Individual shareholders
79% Institutional shareholders
39% Germany
17% US/Canada
11% UK/Ireland
11% Continental Europe excl. Germany
1% Rest of the world
Percentages reflect shares in the subscribed capital. Sources: Shareholder identification and notifications of shareholdings in accordance with the German Securities Trading Act (WpHG), as of December 31, 2008.
RWE Group revenue by region in 2008 in %
62.6% Germany0.6% Other
16.5% Rest of Europe
20.3% UK
RWE in Poland
RWE_okl_EN-Final_2209.indd 2RWE_okl_EN-Final_2209.indd 2 9/23/09 11:52:14 AM9/23/09 11:52:14 AM
RWE is one of Europe’s five leading electricity and gas companies. It is
active in the generation, trading, transmission and supply of electricity
and gas. This integrated business model enables RWE to take advantage of
the rising demand for energy. Through the fully consolidated investments,
66,000 RWE employees supply over 14 million customers with electricity
and 6 million customers with gas. In fiscal year 2008, RWE recorded
€49 billion in revenue. Europe is the core market for the company:
RWE is the No. 1 power producer in Germany and No. 3 in the UK. RWE
continously expands its position in Central and South Eastern Europe.
RWE’s power plant portfolio and investment programme for building new,
environmentally friendly generation capacity are the basis for growing
earnings in the future. Energy from renewables plays a key role. RWE’s
leading position in European energy trading helps the company make
optimal use of the power plants on the market. RWE reacts to changes
in customer needs by offering new products. In this context, climate
protection and energy efficiency are becoming increasingly important.
RWE’s gas and oil production businesses are displaying above-average
growth. In light of the global rise in demand for gas, RWE plans to steadily
increase the share it produces in-house. RWE’s aim is to create value for the
investors, customers and employees. Therefore, RWE’s strategy centres on
profitable, organic growth, supplemented by value-increasing acquisitions.
RWE’s takeover offer for the Dutch-based energy utility Essent will take the
company a major step forward in this direction. RWE wants its shareholders to
continue to take part in the Group’s success to a great extent in the future.
THE RWE GROUP – A BRIEF PORTRAIT
Electricity Gas
Germany No. 2 No. 3
UK No. 4 No. 4
Central EasternEurope
No. 2 in HungaryNo. 3 in Slovakia6% of Polish market
No. 1 in the Czech RepublicLeading position in HungaryActive in Slovakia
Total Europe No. 3 No. 6
Market positions of the RWE Group (in terms of sales) in 2008
“RWE in Poland” was prepared by RWE Polska Corporate Communications.
T +48 22 821 41 30
This report is also available in the Polish language.
Published in August 2009.
RWE Renewables Polska
RWE Renewables Polska Sp. z o.o.
ul. Wybrze e Ko ciuszkowskie 41
00-347 Warszawa, Poland
RWE Innogy GmbH
Karolingerstraße 94
45141 Essen, Germany
T +49 201 12 14 499
F +49 201 12 14 498
www.rweinnogy.com
RWE Polska Contracting
RWE Polska Contracting Sp. z o.o.
ul. Powsta ców l skich 28/30
53-333 Wroc aw, Poland
T +48 71 335 03 30
F +48 71 335 03 31
www.rwe.pl
B dzin Cogeneration Power Station
Elektrociep ownia “B dzin” SA
ul. Ma ob dzka 141
42-500 B dzin, Poland
T +48 32 267 95 99
+48 32 266 40 71–5
F +48 32 266 44 11
www.ecb.com.pl
D browa Górnicza Water and Sewers Company
Przedsi biorstwo Wodoci gów i Kanalizacji Sp. z o.o.
ul. Powsta ców 13
41-300 D browa Górnicza, Poland
T +48 32 639 51 00
F +48 32 262 22 10
www.pwik-dabrowa.pl
RWE Dea Polska
RWE Dea Polska Oil Sp. z o.o.
ul. Lindleya 16/114
02-013 Warszawa, Poland
T +48 22 627 36 15
F +48 22 583 15 17
www.rwedea.com
RWE VALUE CHAIN
Mining and drilling
Trading (coal, gas, derivatives) and procurement
Electricity generation Transmission Distribution Sales and use
5 lignite opencast mines (11,014 hectares)
108 million tonnes of produced lignite
Fuel purchases (hard coal, gas, biomass etc.)
Exploration and drilling of natural gas and oil
Lignite
100/0
EU and Norway
Hard coal
42/58
Gas
73/27
0 20 40 60 80 100
Fuels by origin in %
Other countries of origin
Mining and drilling
10,828 MW
14,183 MW
6,295 MW
7,223 MW
1,515 MW
5,152 MW
lignite-fired power plants
hard-coal-fired power plants
nuclear power plants
gas-fired power plants
renewable energies
pumped storage, oil, other
Lignite
Hard-coal
Nuclear power
Gas
Renewableenergies
Pumped storage, oil, other:
33
28
22
14
2.4
0.6
Electricity production (2008: 334.2 TWh,in-house generation: 224.1 TWh) in %:
Power station capacity(owned or contractually secured):
Electricity generation
381,005 kilometre medium- and low-voltage
transmission lines (10-110 kV)
134,240 substations and transformers
90,345 kilometre gas distribution pipelines
(a-b bar)
Domestic andcommercialcustomers
Industrial customers
Redistributors
Electricitytrading
60
98
79
69
Supply to customers in TWh
Distribution
13,912 kilometre high-voltage transmission lines
(220/380 kV)
Brauweiler Control Centre
26,913 kilometre gas pipelines
3.913 million standard cubic metre gas
storage tanks
RWE
E.ON
EnBW
Vattenfall
32
30
10
27
Transmission grid by operator in %
Transmission
Electricity
14.4 million domestic and commercial customers
167,800 industrial customers
Gas
6.3 million domestic and commercial customers
34,800 industrial customers
Germany
UK
Netherlands
Hungary
Poland
49
30
1
14
6
Distribution of electricity, customers in %
Sales and use
RWE_okl_EN-Final_2209.indd 3RWE_okl_EN-Final_2209.indd 3 9/23/09 11:52:19 AM9/23/09 11:52:19 AM
RWE in Poland 1RWE in Poland
Being a leading European energy company, RWE takes responsibility for the customers, shareholders and employees. And also for the environment. Long term. Because energy supply is a promise to future generations.
This means that RWE has to think and act far beyond
the day-to-day business: identifying market changes
in good time. Developing supply concepts for
decades ahead. Deciding early to invest billions.
Always keeping its ambitions high, offering the best
possible service to the customers, along with the
most environmentally friendly technology
and the most efficient processes.
And RWE’s driving force is clearly: The energy to lead.
How does RWE do that?
Don’t delay. Decide.
Don’t wait. Make it happen.
Don’t stand still. Go the extra mile.
Don’t cling to the old. Embrace the new.
Don’t hesitate. Make ideas reality.
Don’t hinder. Enable.
Don’t follow. Lead.
THE ENERGY TO LEAD
RWE in Poland2 RWE in Poland
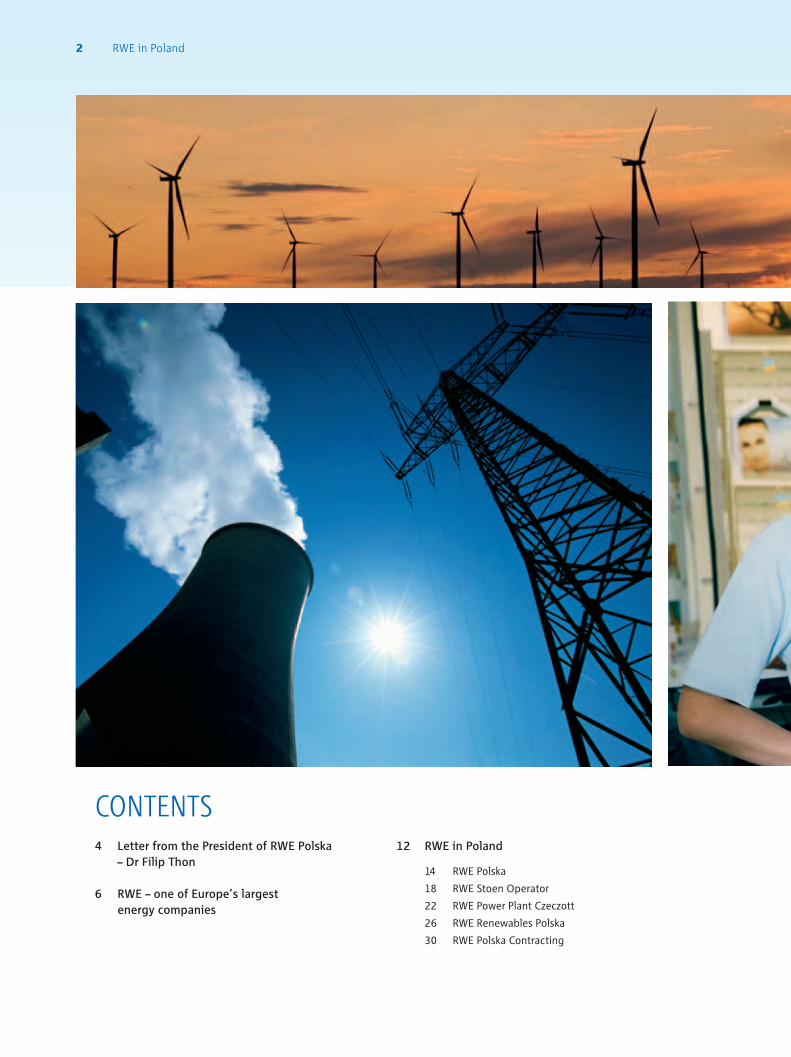
CONTENTS12 RWE in Poland
14 RWE Polska
18 RWE Stoen Operator
22 RWE Power Plant Czeczott
26 RWE Renewables Polska
30 RWE Polska Contracting
4 Letter from the President of RWE Polska – Dr Filip Thon
6 RWE – one of Europe’s largest energy companies
RWE in Poland 3RWE in Poland
38 Sustainability
40 RWE – a responsible employer
42 ”RWE Conscious Energy”
44 ”Enlightened Warsaw”
46 For students
48 ”RWE Safe Energy”
50 ”Orliki RWE”
RWE in Poland
32 B dzin Cogeneration Power Station
34 D browa Górnicza Water
and Sewers Company
36 RWE Dea Polska
RWE in Poland4 RWE in PolandRWE in Poland4 RWE in Poland
Since the beginning of 2008 I have had the pleasure of representing the RWE Group in Poland at a time that is very important to the Polish energy sector, when the energy issues, just like in other parts of Europe, are exceptionally important and subject to on-going public debate.
RWE has been active in Poland since 1991 and is consistently building up its position in Poland and in Central Europe. In the “List of 500”, presenting the 500 biggest companies of Central Europe, published in September 2008 by reputable Polish daily ”Rzeczpospolita”, RWE is among the top 10 biggest foreign investors in the region. In 2009 RWE Polska - the largest RWE company in Poland - is ranked by ”Rzeczpospolita” as the 33rd most valuable firm in Poland.
RWE Polska is responsible for further development of RWE in Poland and it is the energy sales company, which supplies electricity to over 880,000 customers, including the largest public and private institutions.
The Group also owns RWE Stoen Operator – the operator of the electricity network of Warsaw, RWE Power Plant Czeczott – responsible for development of planned inwestment in power plant in Silesia, RWE Renewables Polska, which is building renewable energy sources and RWE Polska Contracting – provider of district heating and energy related services. RWE has majority stake in B dzin Cogeneration Power Station and stock of D browa Górnicza Water and Sewers Company. A local division of RWE Dea, dealing with natural gas and oil exploration, is also present in Poland.
The three biggest challenges the Polish energy sector is facing at the moment are: need for clear distinction between
regulated and free market energy business, CO2 issues and lack of sufficient generating capacities in Poland.
Firstly, based on legal guidelines arising from EU directives, Poland needs to define the right balance between the regulated and non-regulated areas of the energy business. We have to differentiate between the transmission and the distribution grid, which are naturally regulated activities, and energy sales, which should be driven by market supply and demand.
Secondly, the implementation of the Climate Package obviously influences the European and the national energy sectors, as well as every energy sector company. However, the consequences will be primarily felt by the customers that is both the industrial clients as well as the households. CO2 has a price and in future it will be an important factor influencing the wholesale electricity market. Even though individual forecasts differ, all of them assume an increase of wholesale prices in the coming years.
Obligations resulting from the EU Climate Package are particularly significant and expensive for countries like Poland, where over 90% of power generation is based on coal. Despite development of alternative sources of energy, the energy fuel mix will not change radically over the coming ten to twenty years, with coal remaining the primary energy source. The obligation to continually increase the share of renewable and cogenerated energy as well as the power stations’ need to purchase additional CO2 emission allowances, will not be without consequences for the energy price.
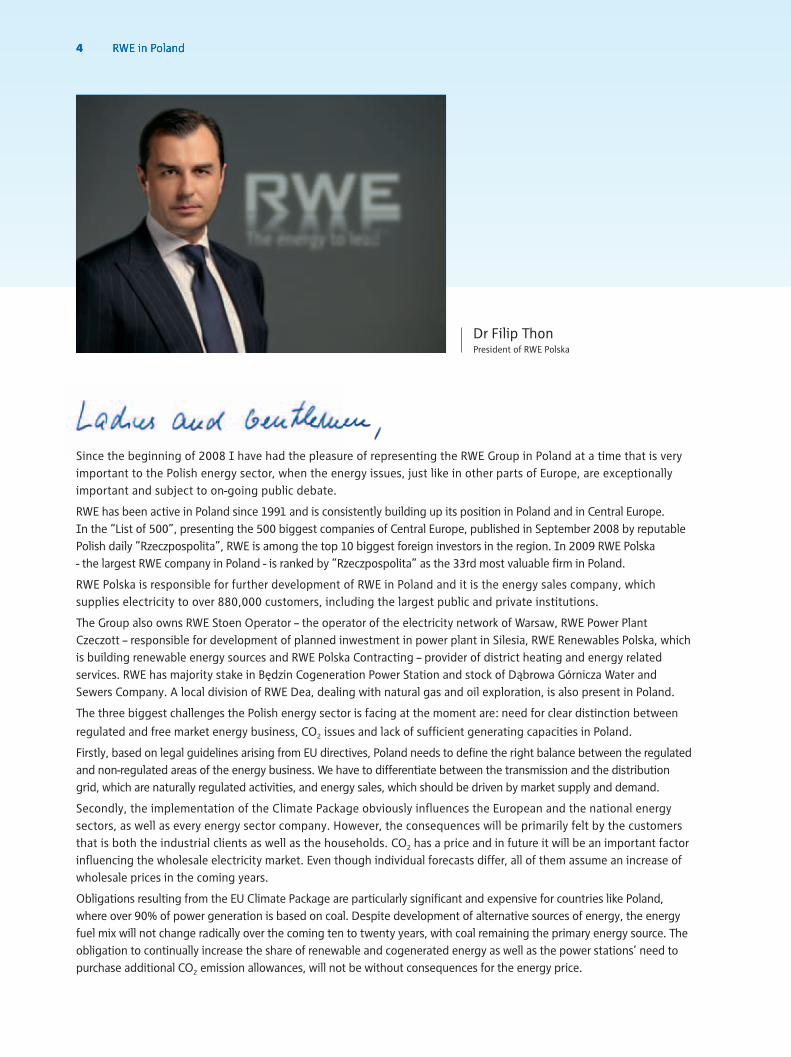
Dr Filip ThonPresident of RWE Polska
RWE in Poland 5RWE in PolandRWE in Poland 5RWE in Poland
Thirdly, despite the economic downturn, Poland needs to invest in new generating capacity and needs this as soon as possible. Energy is a long-term business and investment projects last many years before they are connected to the system. According to industry experts, to avoid an energy deficit in 2012-2015, Poland will need around 1,000 MW of additional generating capacity every year. Over a span of ten years we are talking about 10,000 MW and investments in the range of ¤16-19 billion.
RWE’s operations in Europe include all stages of the supply chain, commencing with electricity generation, through its distribution, up to sales to the end-users. Being one of the largest coal-based energy producers, RWE has specialised know how of safe and efficient operation of hard-coal and lignite power stations, but also has long-term experience in the generation of energy from other sources - gas, renewable and nuclear.
I am very proud that RWE plans to make significant investments in the Polish generation sector, both in conventional power stations and in renewable sources. Thanks to already implemented investments and planned projects to build wind farms and a hard-coal power generating unit, RWE is becoming one of the largest foreign investors in Poland.
The 800 MW hard-coal power station worth ¤1.5 billion is planned to be located at the premises of the Piast Ruch II
coal mine (earlier known as KWK Czeczott) in Wola village in Silesia, belonging to Polish partner of the project – Kompania W glowa. The new plant will help to meet the growing energy demand and will improve security of supply. It will be built using highly efficient cutting-edge technologies. It is planned to come on-stream in 2015.
We are also well positioned to build wind power stations with an output of 300 MW in Poland by 2015, which will significantly contribute to Poland’s achievement of its EU goal of 15% share of renewable energy by 2020. The wind farms will be located in the regions of Pomerania, Mazuria and Wielkopolska. The first one goes on-stream in Suwa ki in 2009.
The investments in the Polish generation sector are part of RWE’s strategy of “More growth, less CO2”, announced in 2008, which includes the largest investment programme in the Group’s history. I am glad that some of these projects are planned to be located in Poland.
Poland is one of the largest and most promising European markets. I am convinced that as one of the leading energy companies in Europe, RWE is a good strategic partner for Poland. We contribute not only to the capital, but also the expertise, know-how, access to advanced technologies and innovative solutions that will allow reduction of CO2 emissions and a significant improvements of efficiency.
I believe the Group will keep developing in Poland for the benefit of the company and its employees, as well as for the Polish energy industry and the Polish people.
Yours faithfully,
Filip Thon
6 RWE in Poland6 RWE in Poland
7RWE in Poland 7RWE in Poland
RWE – ONE OF EUROPE’S LARGEST ENERGY COMPANIES
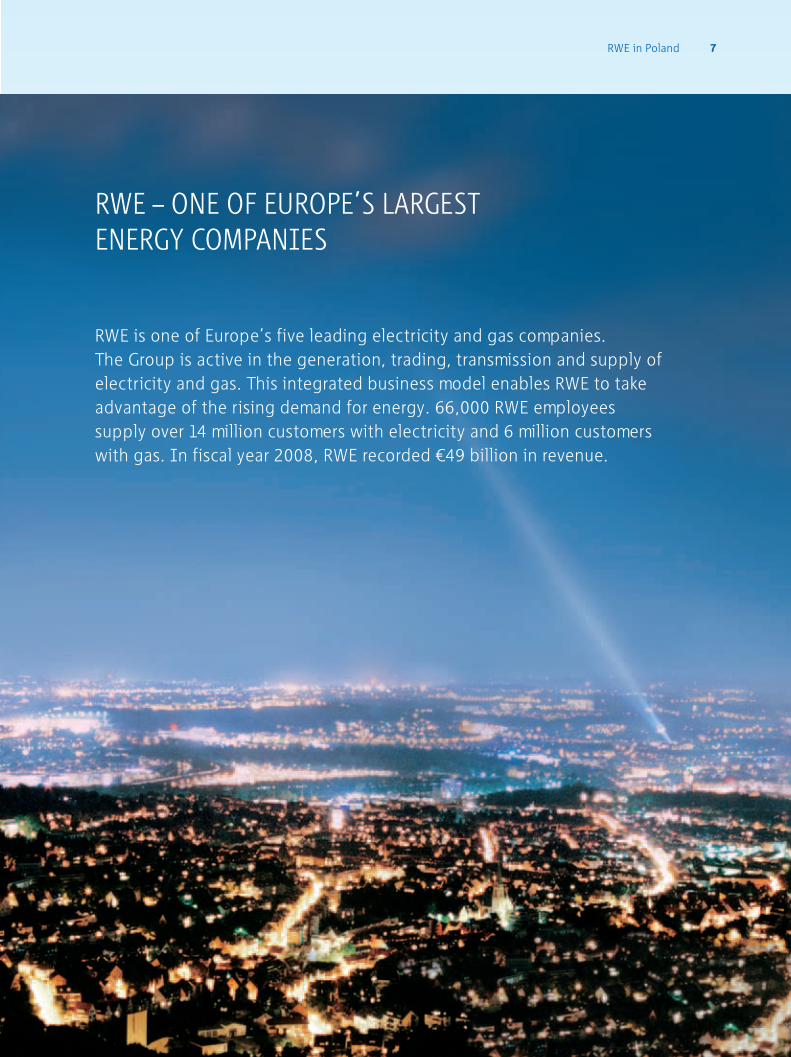
RWE is one of Europe’s five leading electricity and gas companies. The Group is active in the generation, trading, transmission and supply of electricity and gas. This integrated business model enables RWE to take advantage of the rising demand for energy. 66,000 RWE employees supply over 14 million customers with electricity and 6 million customers with gas. In fiscal year 2008, RWE recorded ¤49 billion in revenue.
RWE in Poland8 RWE in Poland
RWE becomes greener, more robust and more international. Foundation for development is a strong, integrated business. Innovative technologies, business models and products set the stage for future success.
Geographical structure
In 2008 the Group sold to external customers
317.1 billion kWh of electricity, of which 75% in
Germany, 17% in the UK, 6% in Hungary and the
remaining 2% in other countries. At the same time,
RWE sold 327.8 billion kWh of gas, of which 47%
went to Germany, 25% to the Czech Republic,
18% to the UK and 11% to other countries.
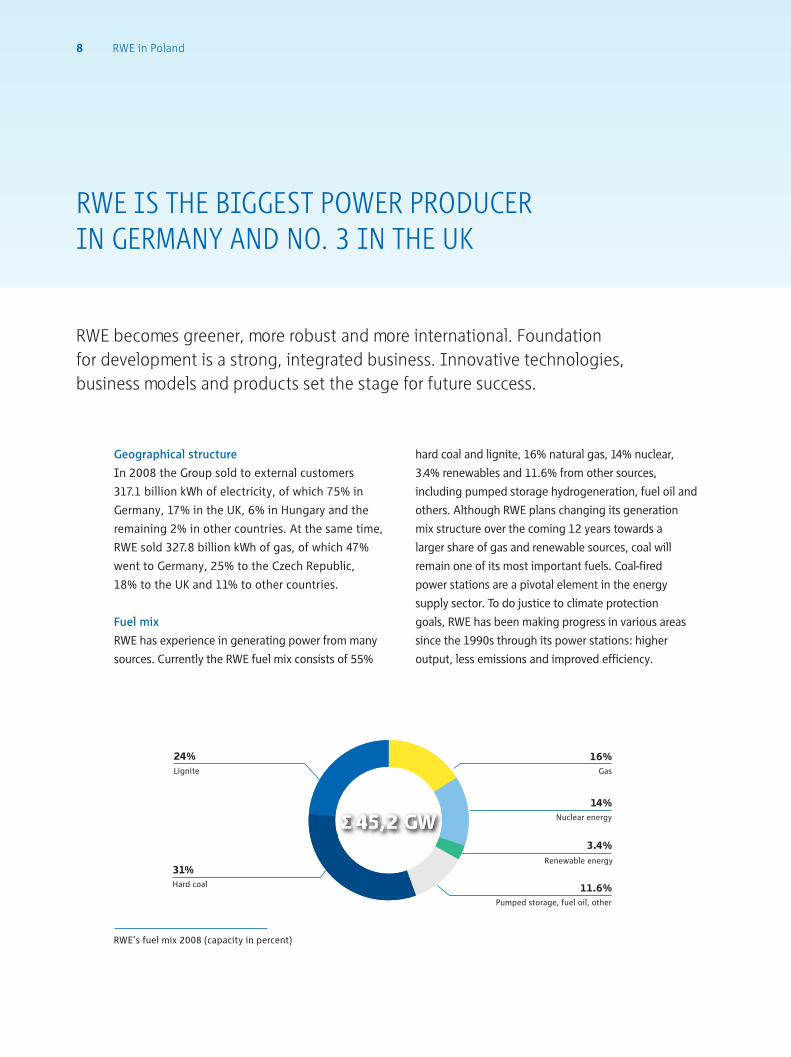
Fuel mix
RWE has experience in generating power from many
sources. Currently the RWE fuel mix consists of 55%
hard coal and lignite, 16% natural gas, 14% nuclear,
3.4% renewables and 11.6% from other sources,
including pumped storage hydrogeneration, fuel oil and
others. Although RWE plans changing its generation
mix structure over the coming 12 years towards a
larger share of gas and renewable sources, coal will
remain one of its most important fuels. Coal-fired
power stations are a pivotal element in the energy
supply sector. To do justice to climate protection
goals, RWE has been making progress in various areas
since the 1990s through its power stations: higher
output, less emissions and improved efficiency.
RWE IS THE BIGGEST POWER PRODUCER IN GERMANY AND NO. 3 IN THE UK
RWE’s fuel mix 2008 (capacity in percent)
3.4%
11.6%
14%
16%24%
31%
GasLignite
Hard coal
Nuclear energy
Renewable energy
Pumped storage, fuel oil, other
RWE in Poland 9RWE in Poland
Innovations
Research and development at RWE is of strategic
importance. RWE’s scientists and engineers find
answers to vital technological issues and their
expertise is in international demand. This innovative
power strengthens the company in a setting of
growing competition and on its road towards the
future. It creates the prerequisite for a high security
of supplies and economic success.
RWE plans to expand installed renewable energy
capacity, but first of all wants to develop by
building new, highly efficient power stations,
modernising its power station portfolio and
investing in clean-coal technologies.
RWE engineers are on a constant quest for new
records: they have already used cutting-edge
plant technologies to achieve efficiency rates
of 43% in lignite-fired power stations and 46%
in hard-coal power stations. Most recently, they
have set their sights on obtaining efficiencies
in excess of 50% using novel materials and
methods. RWE plans to build one of the world’s
first large-scale coal-fired power plants featuring
carbon capture and underground storage if the
company can count on state subsidies. The plant
is to be constructed near Cologne by 2014.
Innovation is an integral part of the company’s
motto “The energy to lead”. Major highlights in
innovations include an algae harvesting plant for
capturing carbon dioxide, electricity production
from tidal and wave movements and “smart”
power meters, thanks to which around 100,000
households will constantly monitor their energy
consumption on the Internet by the end of 2010.
A new trend supported strongly by RWE is
electromobility. In Berlin, RWE has already set up
56 charging points for electric cars. By mid 2010
this number will grow to some 500. Electromobility
will increase the share of environmentally friendly
power generation. Since the batteries of the electric
cars can be charged for variable periods of time,
the share of renewables in the grid, which fluctuate
depending on time of day or year, can be utilised
more efficiently. Charging points will be set up
in Dortmund, Düsseldorf, Essen, Frankfurt/Main,
Hamburg, Stuttgart and Munich before the end of
2009. The long-term aim is to have a network of
charging points to cover the whole of Europe.
RWE in Poland10 RWE in Poland
The Strategy Agenda 2012, announced by RWE in
2008, has a guiding principle “More growth, less
CO2”. This translates into the biggest investment
programme in RWE’s history. In years 2008-2012
RWE plans to earmark about ¤30 billion, ¤20 billion of
which are reserved for outside Germany, to expand and
modernise energy infrastructure in environmentally
friendly power plants, supra-regional and cross-boarder
electricity grids, gas pipelines and storage facilities
as well as gas and oil production. Besides being the
largest capital expenditure programme in RWE’s
111-year history, this also makes RWE one of Europe’s
largest private investors. No other utility is building
more generation capacity in Europe than RWE. One of
RWE priorities is also expansion of renewable sources.
An important part of implementing the Strategy Agenda
is the ¤9.3 billion takeover of Essent, the leading
energy company in Benelux, planned to be completed
in 2009. Due to a large share in its generation by gas-
fired power stations, the company’s CO2 intensity is
much lower than current RWE level. Essent is set up
similarly to RWE, with electricity generation, energy
trading, as well as electricity and gas supply operations.
Combining Essent with German RWE activities will put
the Group among the leaders in North-Western Europe.
Roadmap
The roadmap for RWE’s medium-term development
focuses on six major goals, which the company
intends to achieve by 2012:
Earnings growth in the core markets: RWE’s focus •
is directed especially at markets, which are most
important to the company at present – Germany
and the UK.
Stronger regional diversification: RWE wants the •
share of earnings achieved by the activities
outside of Germany to increase to between
40 and 50%. In fiscal year 2008, it was 27%.
Value-added growth by expanding the •
renewable energy business: by 2012, RWE aims
to have 4,500 MW of renewables-based
generation capacities in operation or under
construction. This would be more than three
times its current level.
Improved emissions balance: RWE plans to •
reduce CO2 emissions substantially. The target
for 2012 is 20% less than the current level. This
excludes the impact of growth investments on
RWE’s emissions balance.
Expansion of the midstream gas position: RWE •
intends to increase its purchasing volume from
40 to 60 billion cubic metres a year.
RWE ranks among Europe’s five leading energy companies and wants to improve this position. Growing competition, increased customer expectations, a more complex regulatory and political situation, as well as the convergence of the European energy market, significantly influence the environment RWE is operating in. By implementing The Strategy Agenda 2012 RWE intends to take advantage of the undergoing changes.
MORE GROWTH, LESS CO2 – THE STRATEGY AGENDA 2012
RWE in Poland 11RWE in Poland
0.61.5
0.61.1
1.41.5
4.62.0
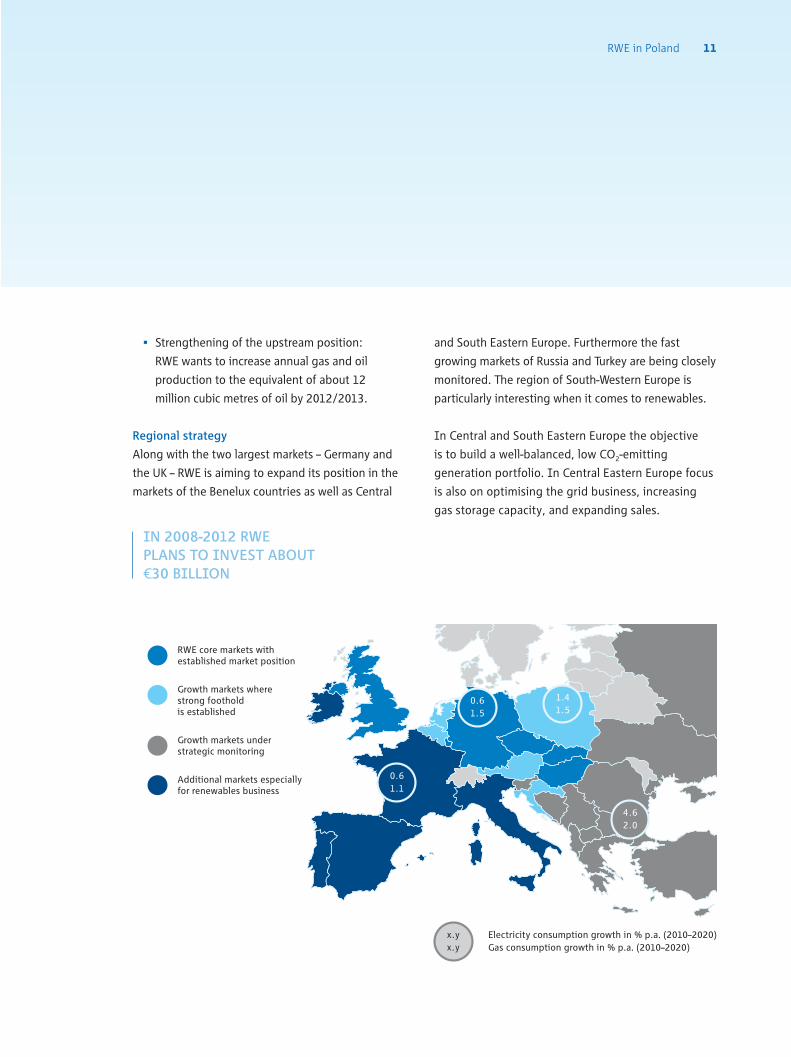
RWE core markets with established market position
Growth markets where strong foothold is established
Growth markets under strategic monitoring
Additional markets especially for renewables business
x.yx.y
Electricity consumption growth in % p.a. (2010–2020)
Gas consumption growth in % p.a. (2010–2020)
Strengthening of the upstream position: •
RWE wants to increase annual gas and oil
production to the equivalent of about 12
million cubic metres of oil by 2012/2013.
Regional strategy
Along with the two largest markets – Germany and
the UK – RWE is aiming to expand its position in the
markets of the Benelux countries as well as Central
and South Eastern Europe. Furthermore the fast
growing markets of Russia and Turkey are being closely
monitored. The region of South-Western Europe is
particularly interesting when it comes to renewables.
In Central and South Eastern Europe the objective
is to build a well-balanced, low CO2-emitting
generation portfolio. In Central Eastern Europe focus
is also on optimising the grid business, increasing
gas storage capacity, and expanding sales.
IN 2008-2012 RWE PLANS TO INVEST ABOUT ¤30 BILLION
12 RWE in Poland12 RWE in Poland
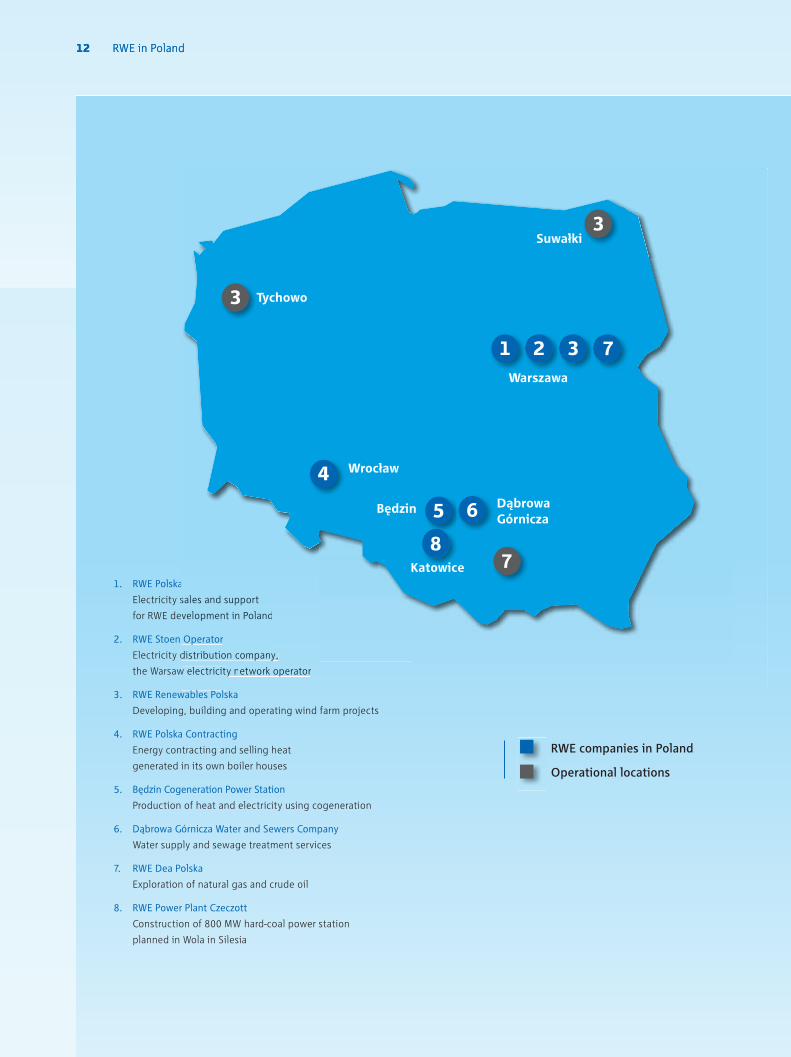
1. RWE Polska
Electricity sales and support
for RWE development in Poland
2. RWE Stoen Operator
Electricity distribution company,
the Warsaw electricity network operator
3. RWE Renewables Polska
Developing, building and operating wind farm projects
4. RWE Polska Contracting
Energy contracting and selling heat
generated in its own boiler houses
5. B dzin Cogeneration Power Station
Production of heat and electricity using cogeneration
6. D browa Górnicza Water and Sewers Company
Water supply and sewage treatment services
7. RWE Dea Polska
Exploration of natural gas and crude oil
8. RWE Power Plant Czeczott
Construction of 800 MW hard-coal power station
planned in Wola in Silesia
RWE companies in Poland
Operational locations
a
s
v
d
w electricity network operator
bl l k
a
sales and support
velopment in Poland
Operator
distribution company,
6
3
3
321
4
5
7Warszawa
Suwałki
Tychowo
DąbrowaGórnicza
8
Wrocław
Będzin
7Katowice
13RWE in Poland 13RWE in Poland
RWE IN POLAND
RWE has been present in Poland since 1991. The largest companies of the Group in Poland are: RWE Polska – responsible for support of RWE development in Poland and a trading company selling electricity to 900,000 customers and RWE Stoen Operator, which operates the distribution system and manages the Warsaw electricity network.
Today RWE Polska and RWE Stoen Operator belong to
the leading energy companies in Poland. They have
been transformed into efficient private firms paying
special attention to customer care, high network
reliability, efficiency and cooperation with local
communities.
The RWE Group is interested in continuing its
development in Poland, especially in the energy
generation sector. Jointly with Kompania W glowa,
RWE is planning the construction of a new
800 MW power station using state-of-the-art low CO2
emission technologies. This investment will amount
to ¤1.5 billion. Simultaniously, RWE is investing in
other energy sources including renewables. 300 MW
of wind power plants is the target by 2015. The
Suwa ki Wind Park is RWE’s first wind farm in Poland
and will be commissioned in autumn 2009.
RWE Group also owns other companies in Poland:
RWE Power Plant Czeczott – developing planned
inwestment in 800 MW hard-coal power plant in
Silesia, RWE Renewables Polska – in charge of
construction of wind power stations in the regions of
Mazuria, Pomerania and Wielkopolska, RWE Polska
Contracting – providing contracting services related
to heat and electrical energy, and RWE Dea Polska
– exploring natural gas and crude oil deposits. RWE
also has stakes in B dzin Cogeneration Power Station
and D browa Górnicza Water and Sewers Company.
Poland has always been an important country on the
RWE roadmap. Poland’s strategic position in the
European energy sector opens up significant
opportunities for further investments and allows
leveraging the solid business foundations achieved
by RWE on the Polish market.
14 RWE in Poland14 RWE in Poland
15RWE in Poland 15RWE in Poland
RWE POLSKA
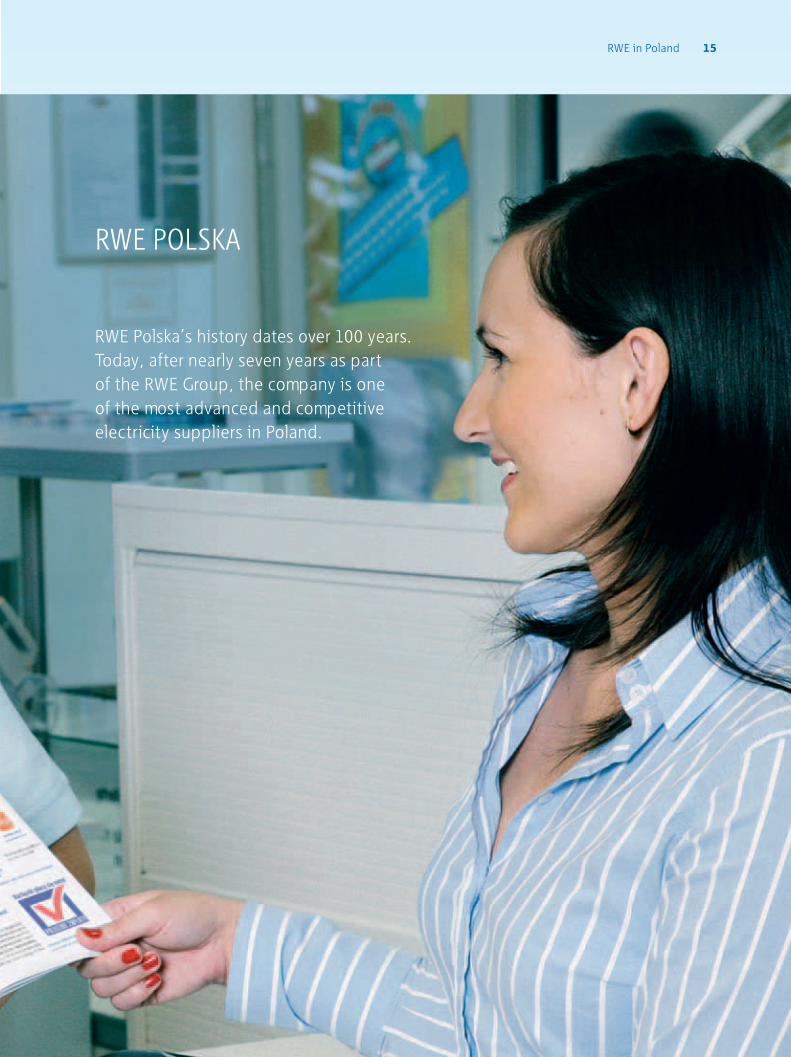
RWE Polska’s history dates over 100 years. Today, after nearly seven years as part of the RWE Group, the company is one of the most advanced and competitive electricity suppliers in Poland.
RWE in Poland16 RWE in Poland
RWE Polska strives to observe the highest world
standards of management, employee development,
customer care and social responsibility. The company
draws on the experience of the RWE Group, which
operates on the most competitive European markets.
Thanks to the commitment of its employees and the
support from the RWE Group, RWE Polska provides its
customers with good service and attractive prices.
The company conducts regular surveys and listens
to customer feedback, allowing it to introduce
the requested changes and adapt its offer to new
trends in lifestyle.
Round-the-clock customer support
RWE Polska was the first energy sector company in
Poland to offer its customers a 24/7 telephone and
mail customer call centre. There are also seven
customer care centres for individual customers and an
additional centre for business clients.
All customer data is at the same time available to all
the centres as well as to the customer call centre, so
all formalities may be dealt with in any place. On-line
services are being developed to streamline customer
support further.
RWE Polska offers flexible payment mechanisms,
allowing its customers to pay their bills in cash or
using other payment methods. RWE Polska was the
first energy supplier in Poland to introduce the direct
debit functionality. All RWE Polska customers are
billed using the SAP IS-U system, one of the most
modern IT tools in its class.
For business customers
Corporate customers are supported by dedicated key
account managers. The scope of auxiliary services is
being continually expanded. RWE Polska introduces
new products like fixed energy prices for a predefined
volume throughout the year. In preparing the
solutions for its corporate customers RWE Polska
leverages the experience of other Group companies
from the UK or Germany. Thanks to this, the company
is ready to provide tailored services to large business
accounts.
Customer opinion polls on the company, its offering
and quality of service show that customers do notice
the changes taking place at RWE Polska: the
modernisation of the care centres, call centre
functionality, a friendly approach to customers and
RWE POLSKA – ONE OF THE MOST ADVANCEDAND COMPETITIVE ELECTRICITY SUPPLIERS IN POLAND
RWE Polska is the largest regional company operating within the RWE Group in Poland. It plays a dual role – an electricity trading company and a business unit supporting the development of the RWE Group in Poland. In 2008 RWE Polska reported an energy sales volume of 6,719 GWh and revenues amounting to 2.3 billion PLN (approximately ¤652 million).
RWE in Poland 17RWE in Poland
a higher level of employee competence. The company
is regarded as a reliable and competent supplier.
Good preparation for energy market deregulation
According to the provisions of the Polish Energy Law
resulting from the alignment of Polish legislation
with EC directives, the Polish electricity market
became deregulated from 1st July 2007. As a result,
not only business customers but also private
customers are free to choose their electricity
provider. At the same time, the energy companies
had to unbundle their trading and distribution
activities by creating independent Distribution
Systems’ Operators. RWE Polska spun off RWE Stoen
Operator, which manages electricity grid in Warsaw.
RWE Polska was recognized for its activities and in
2008 it was honoured with the title of “The company
that changes the Polish industry” for “exceptionally
successful privatisation, and thus demonstrating that
privatisation in the energy sector may be a process
that is beneficial to the economy and society.” RWE
Polska was considered as one of the companies best
prepared for the energy market deregulation that
took place in mid-2007.
18 RWE in Poland18 RWE in Poland
19RWE in Poland 19RWE in Poland
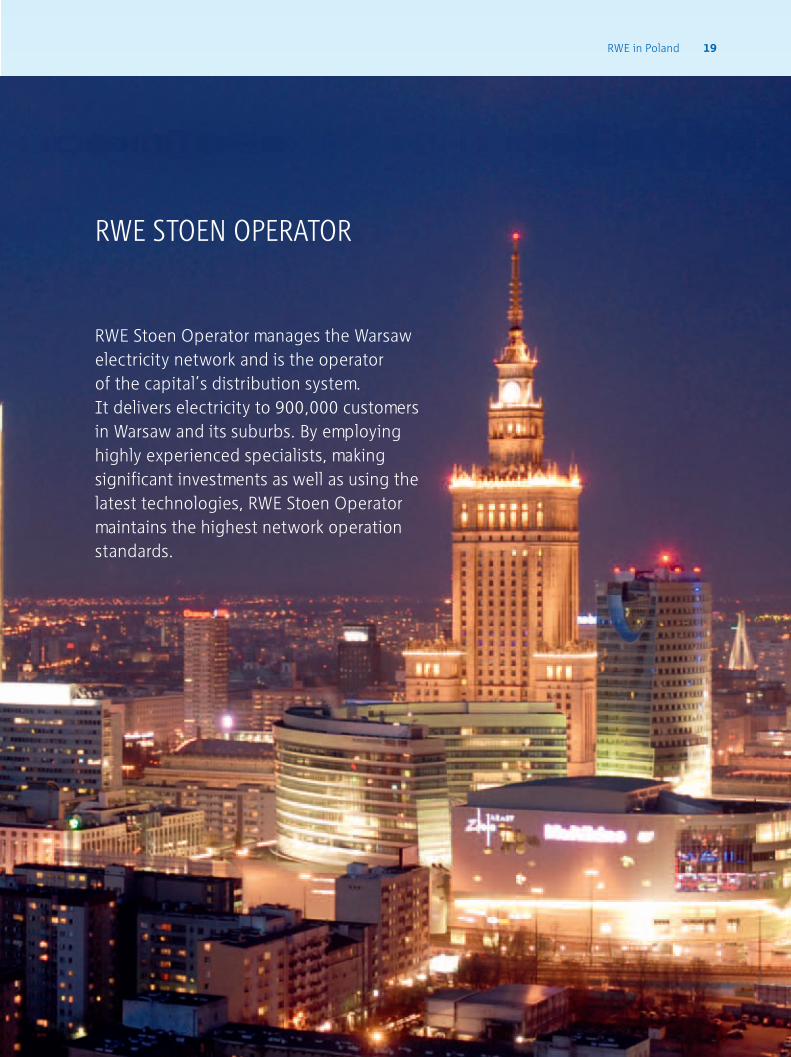
RWE Stoen Operator manages the Warsaw electricity network and is the operator of the capital’s distribution system. It delivers electricity to 900,000 customers in Warsaw and its suburbs. By employing highly experienced specialists, making significant investments as well as using the latest technologies, RWE Stoen Operator maintains the highest network operation standards.
RWE STOEN OPERATOR
RWE in Poland20 RWE in Poland
RWE Stoen Operator began its operations on 1st July 2007, as a result of mandatory unbundling of sale and distribution operations, continuing the investments in the Warsaw grid. Investments into the development and modernisation of the energy infrastructure of the Warsaw network from 2002–2008 amounted to over 890 million PLN (approximately ¤251 million).
The strategic investment projects were focused
on the modernisation and expansion of a high
voltage grid. The “Pa ac” 110/15 kV substation is
unique in Poland, as it was the first underground
substation of this type. It was installed in
chambers built during the construction of the
Warsaw subway under the Plac Defilad square.
The “Pa ac” substation plays an important role
in supplying electricity to Warsaw city centre.
The “Pa ac” substation puts the idea of re-utilisation
of part of the losses into practical use for the
first time. The power transformer chambers are
designed to allow utilisation of heat generated
during the operation of transformers to heat
other spaces, e.g. the underground parking lot
neighbouring the substation. The idea to reutilise
the transformer’s waste heat was subsequently
adopted as the standard design guideline for
new facilities and was implemented in three new
substations, “Po udniowa”, “Imielin” and “Powi le”.
In 2006 the high-voltage “Po udniowa” substation
was commissioned, which supplies electricity to
the districts of Mokotów, Ochota and W ochy.
ACCORDING TO DATA FROM THE POLISH ENERGY MARKET AGENCY, RWE STOEN OPERATOR’S NETWORK IS ONE OF THE MOST RELIABLE NETWORKS IN POLAND
In 2008 the “Powi le” substation was put into
operation. It is important to Warsaw, as it
improves electricity supply security and powers the
areas of ródmie cie and Powi le. Placing a latest
generation substation in a historical building
supervised by the Polish National Inspector of
Historical Monuments relates to the traditions
of the first Warsaw “Powi le power station.”
The building housing the new substation was
erected in 1936 and was designed as a building
for electrical equipment, with zoning regulations
provided for such a use right from the start.
The next state-of-the-art facility of RWE Stoen
Operator is „Wilanów” substation, which is
planned to be completed in 2009. It is an
indoor unmanned site using gas insulation
technology, similarly to the other nine stations.
In 2009 RWE Stoen Operator plans to invest over
165 million PLN (approximately ¤37 million) in the
infrastructure.
The investment development in Warsaw, intensive
development of infrastructure, as well as plans
RWE in Poland 21RWE in Poland
related to UEFA Euro 2012 cause the electricity
network to develop alongside the city. Estimates
indicate that in the coming years the fastest
developing areas will be the outskirts of Warsaw:
Targówek, Bia o ka, Wawer and Powsin. RWE
Stoen Operator plans the construction of new
substations as well as high- and medium-voltage
lines. This will significantly improve the quality of
power supply in southern areas of Wawer, boost
the power supply to the districts of Ochota, Ok cie
and W ochy. New “Stadion” substation, related to
UEFA Euro 2012, will supply the centre of Praga.
The “Centrum” substation will be a very interesting
facility. It will be built underground like the “Pa ac”
substation, and the equipment will be installed
in basements at levels -1 and -2 of the new office
building currently under construction at Bagno Street.
RWE Stoen Operator makes sure the inhabitants of
Warsaw are provided with reliable power supply.
In-house technical services constantly monitor the
state of the electrical network. They also perform
the necessary maintenance work around the clock
to assure security of energy supply for the city.
The operation of the network of RWE Stoen Operator
is supported by state-of-the-art technologies, like
the Scada EX dispatch system, which allows remote
monitoring and control of network operation and
the Geographical Information System (GIS) used
for storing, validating, analysing and visualising
data on power system facilities. The SAP-integrated
Workforce Management IT system will improve
efficiency of network operation, streamline the
procedures for documenting work performed and
will allow more efficient customer technical support.
The activity of distribution system operators,
including RWE Stoen Operator, is subject to
regulation and mandatory submission of
distribution tariffs for approval of the Polish Energy
Regulatory Office.
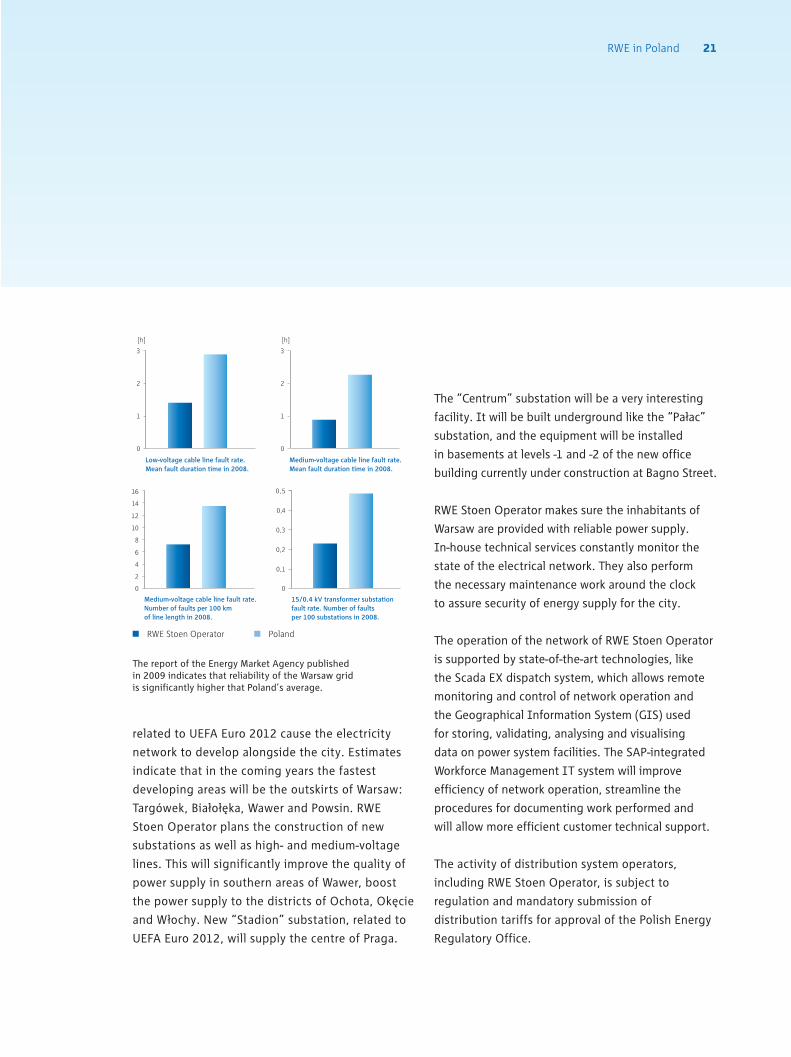
RWE Stoen Operator Poland
Low-voltage cable line fault rate.Mean fault duration time in 2008.
[h] [h]
Medium-voltage cable line fault rate. Mean fault duration time in 2008.
3
2
1
0
3
2
1
0
16
12
10
8
6
4
2
0
14
Medium-voltage cable line fault rate.Number of faults per 100 kmof line length in 2008.
15/0.4 kV transformer substation fault rate. Number of faultsper 100 substations in 2008.
0,5
0,3
0,2
0,1
0
0,4
The report of the Energy Market Agency published
in 2009 indicates that reliability of the Warsaw grid
is signifi cantly higher that Poland’s average.
22 RWE in Poland22 RWE in Poland
23RWE in Poland 23RWE in Poland
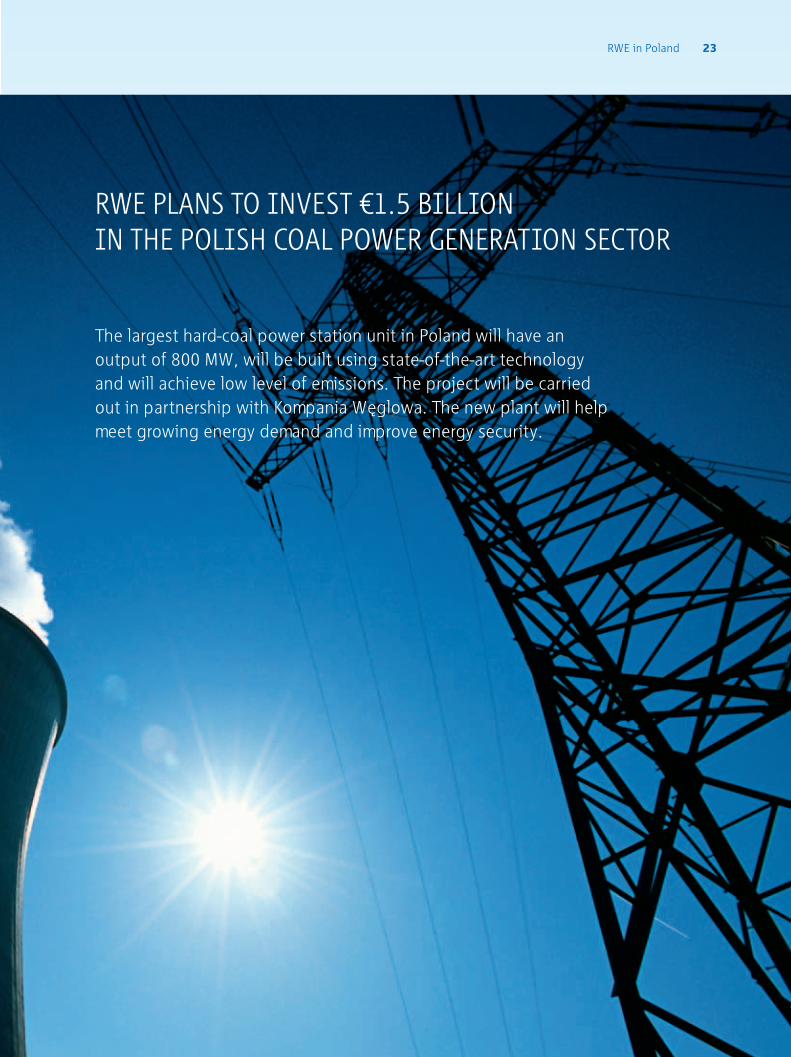
RWE PLANS TO INVEST ¤1.5 BILLIONIN THE POLISH COAL POWER GENERATION SECTOR
The largest hard-coal power station unit in Poland will have an output of 800 MW, will be built using state-of-the-art technology and will achieve low level of emissions. The project will be carried out in partnership with Kompania W glowa. The new plant will help meet growing energy demand and improve energy security.
RWE in Poland24 RWE in Poland
The new power station will significantly contribute to meeting the long-term growth of demand for energy in Poland and will improve country’s energy security of supply. The planned investment will amount to ¤1.5 billion. RWE Power Plant Czeczott – newly estabilished company – is responsible for construction of the new plant.
The planned location of the power station is the
premises of the Piast Ruch II coal mine (earlier
known as KWK Czeczott) in Wola village, Silesian
voivodship, which belongs to Kompania W glowa.
It will come on-stream in 2015.
High efficiency
The new power station, like other units currently
being built by RWE in Germany and planned in
Netherlands, will have very high efficiency level
of 46%. Therefore, it will belong to the most
modern power stations of its kind worldwide and
will be the most modern in Poland. In comparison
the current efficiency of Polish power stations
amounts to 33–35%. The new unit will emit
significantly less CO2 than today’s systems in
Poland. The power station will need up to 30%
less coal per generated kWh and annual CO2
emissions will be reduced by 1.3 million tons.
Joint venture
The project will be implemented through a joint
venture between RWE and Kompania W glowa,
EU’s largest coal company, in which RWE has
a dominant shareholding. Kompania W glowa
contributes the location as well as the infrastructure,
which will be required during the construction period.
A final investment decision based on economic viability
has yet to be made.
The new investment is very important to the region
and it will support its social and economic revival.
Several thousand jobs will be created or secured during
the construction phase and when the plant begins
operation. There are hundreds of long-term positions at
the plant and in companies, which will be established in
the vicinity of the power station e.g. for overhauls and
maintenance. In addition, the partnership with RWE
will ensure Kompania W glowa a long-term contract for
delivery of about 2.5 million tons of coal per annum.
It is important to the Polish power generation
sector to construct new generation capacity as
soon as possible. In the long term, despite the
current economic downturn, demand for the energy
will be growing. In addition 60% of Polish power
stations are older than 30 years and there is also
a CO2 emissions issue. All this means that if no
significant investments into generating capacity take
place, Poland may face problems with its electricity
RWE POWER PLANT CZECZOTT – RWE PLANS THE LARGEST HARD-COAL POWER UNIT IN POLAND
RWE in Poland 25RWE in Poland
supply. To avoid an energy deficit in 2012–2015,
Poland will need an additional generating capacity
of around 1,000 MW per annum. In a 10-year
horizon, this means about 10,000 MW and
investments of around ¤16–19 billion.
As one of the largest European utilities, RWE is
a serious partner for Poland, and can bring not only the
necessary capital, but also the know-how, advanced
technologies and its long-term extensive experience
in generation of energy, particularly from coal.
Just for comparison – the total installed power in
Poland is equal to RWE’s installed power in Germany,
of which around 60% is coal-based. The Group produces
over 73 billion kWh of lignite-based and 62 billion kWh
of hard coal-based energy. In 2008 the total capacity of
power stations owned or contractually secured by RWE
amounted to 45.2 GW.
RWE – one of the largest foreign investors in Poland
With the already implemented investments and the
planned projects which total around ¤2.5 billion,
RWE is becoming one of the top foreign investors in
Poland.
In partnership with Kompania W glowa, RWE was
awarded the ”White Coal” prize for improving the
independance of the Polish energy and fuel sector
and the security of energy supply. This was achieved
through plans of the joint construction of an
energy-efficient hard coal power station.
In addition, in 2009 RWE Polska and Kompania
W glowa received the “New Impulse” award
presented to persons and institutions contributing to
the development of the electricity and gas sector.
The companies were distinguished for the planned
new power station joint project.
26 RWE in Poland26 RWE in Poland
27RWE in Poland 27RWE in Poland
RWE RENEWABLES POLSKA
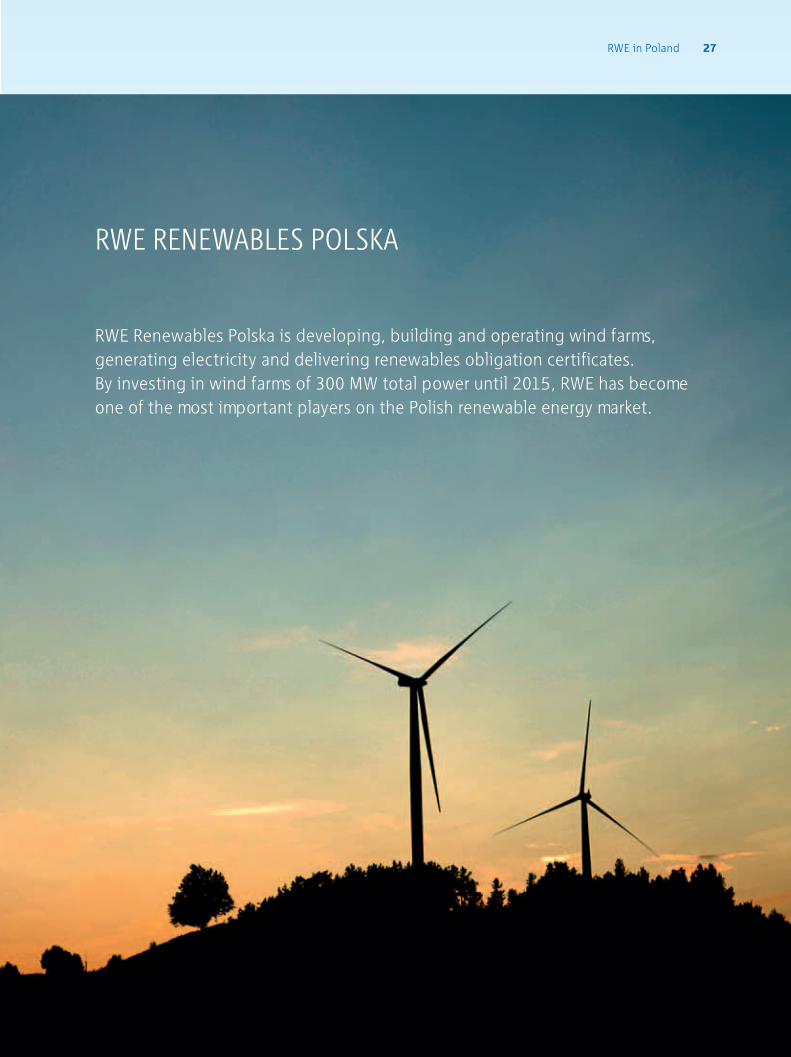
RWE Renewables Polska is developing, building and operating wind farms, generating electricity and delivering renewables obligation certificates.By investing in wind farms of 300 MW total power until 2015, RWE has become one of the most important players on the Polish renewable energy market.
RWE in Poland28 RWE in Poland
By 2015, RWE Renewables Polska, owned by RWE Innogy, is planning to build wind farms in Poland with a capacity of 300 MW. The farms will be built in the Polish regions of Mazuria, Pomerania and Wielkopolska. It will significantly support Poland in meeting the EU requirements to generate 15% energy from renewable sources by 2020.
In 2009 RWE erected the first turbines in windfarm
in Poland. The first investment, the Suwa ki Wind
Park in the Podlaski district consists of 18 wind
turbines, each with 2.3 MW installed capacity.
Once in operation it will produce at least 80 million
kWh of electricity, equivalent to the electricity
consumption of around 40,000 statistical
households. It will be commissioned in autumn
2009. The next farm – in Tychowo – is planned to
be completed by 2010.
As Polish law is being adapted to the European
Commission’s directives, the demand for
renewable energy in Poland will grow significantly
– from the level of 5.8 TWh in 2007 to 10.8 TWh
forecasted for 2010, and will constitute 5.1% and
10.4% respectively of the total energy delivered
to end users. At the same time, the goverment
plans to install around 1,000 MW in the wind
energy sector and reach a 2.7% share in the total
electricity capacities in Poland by 2010. This means
that from 2007-2010 there will be a requirement
for power growth of around 800 MW, translating
to an annual input of about 200 MW.
RWE invests ¤1 billion p.a. in renewables in Europe
At the beginning of 2008, RWE announced its new
strategy of “More growth, less CO2” and the largest
investment plan in the history of RWE. The Group
intends to invest at least ¤1 billion per year, from
2008 until 2012 in the development of projects
related to wind, hydro and biomass energy as well
as to new technologies in the renewable energy
sector.
Growth is not the only top priority – adding value is
also of special importance. RWE recorded a strong
growth in offshore wind capacity over 2008. In the
UK, RWE already operates the 60 MW North Hoyle
offshore wind farm off the coast of Wales and is in
the process of putting into operation the Rhyl Flats
wind farm with an installed capacity of 90 MW. In
addition, RWE Innogy acquired a 50% stake in the
Greater Gabbard wind farm off the South-Eastern
coast of England. On completion in 2011, the wind
farm will have an installed capacity of 509 MW. The
partner companies – RWE Innogy and Scottish and
Southern Energy – will invest a total of £1.3 billion,
excluding grid connections.
RWE PLANS TO BUILD WIND FARMS IN POLAND WITH A TOTAL CAPACITY OF 300 MW BY 2015
RWE in Poland 29RWE in Poland
2007
1.3 GW1)
2012
4.5 GW
> 10 GW
2020
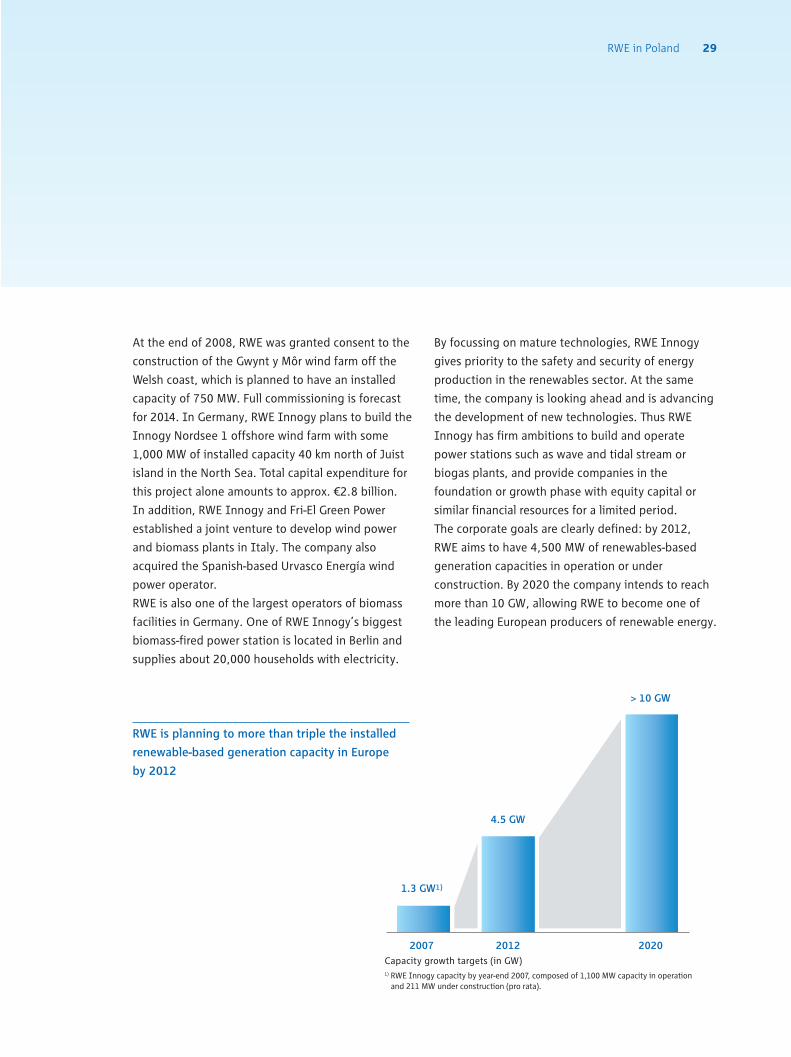
At the end of 2008, RWE was granted consent to the
construction of the Gwynt y Môr wind farm off the
Welsh coast, which is planned to have an installed
capacity of 750 MW. Full commissioning is forecast
for 2014. In Germany, RWE Innogy plans to build the
Innogy Nordsee 1 offshore wind farm with some
1,000 MW of installed capacity 40 km north of Juist
island in the North Sea. Total capital expenditure for
this project alone amounts to approx. ¤2.8 billion.
In addition, RWE Innogy and Fri-El Green Power
established a joint venture to develop wind power
and biomass plants in Italy. The company also
acquired the Spanish-based Urvasco Energía wind
power operator.
RWE is also one of the largest operators of biomass
facilities in Germany. One of RWE Innogy’s biggest
biomass-fired power station is located in Berlin and
supplies about 20,000 households with electricity.
By focussing on mature technologies, RWE Innogy
gives priority to the safety and security of energy
production in the renewables sector. At the same
time, the company is looking ahead and is advancing
the development of new technologies. Thus RWE
Innogy has firm ambitions to build and operate
power stations such as wave and tidal stream or
biogas plants, and provide companies in the
foundation or growth phase with equity capital or
similar financial resources for a limited period.
The corporate goals are clearly defined: by 2012,
RWE aims to have 4,500 MW of renewables-based
generation capacities in operation or under
construction. By 2020 the company intends to reach
more than 10 GW, allowing RWE to become one of
the leading European producers of renewable energy.
Capacity growth targets (in GW)1) RWE Innogy capacity by year-end 2007, composed of 1,100 MW capacity in operation
and 211 MW under construction (pro rata).
RWE is planning to more than triple the installed
renewable-based generation capacity in Europe
by 2012
30 RWE in Poland30 RWE in Poland
31RWE in Poland 31RWE in Poland
RWE POLSKA CONTRACTING
RWE Polska Contracting deals in energy sector contracting, mainly in the area of thermal energy. The company sells heat generated in its own 49 gas, oil and coal-fired boiler houses with a total installed thermal power of 111 MW. The boiler houses are located in nine regions of Poland, mainly in the West and the South.
The company is also implementing pilot contracting
projects related to electricity. They are concerned
with the modernisation of metering systems for
customers supplied with high and medium voltages,
reactive power compensation circuits and emergency
power supplies, energy-saving lighting systems as
well as heat pumps and intelligent electrical heating
systems. Subsequent plans include entry to the
renewable energy market with investments in small-
scale cogeneration sources based on biomass.
In 2008 the company’s revenues were
23.6 million PLN (approximately ¤6.7 million).
The company builds new heat sources in the
design-finance-build-and-operate model. It also
has two older district heating systems fired by
coal dust. The long-term heat delivery contracts
with customers guarantee the ability to recover
the investments made by the company and
after the contracts expire the boiler houses
will become the property of the customers.
The delivery of heat is an end-to-end operation
including the purchase of fuel, production and
distribution of heat, operation, modernisation
and overhauls of boiler houses as well as customer
support beginning with the preparation of contracts,
through to billing and invoicing the heat supplies.

32 RWE in Poland32 RWE in Poland
33RWE in Poland 33RWE in Poland
B DZIN COGENERATION POWER STATION
RWE Group is the majority stakeholder in B dzin CogenerationPower Station – an important producer of heat and electricity usinghigh-efficiency cogeneration with primary energy saving technology.
The heat is generated for the D browa Basin
(Zag bie D browskie), while electricity is supplied
to the national grid. The company was established
in 1913 and is one of the oldest professional
power companies in Silesia and D browa Basin.
Since 1998 B dzin Cogeneration Power Station
is listed on the Warsaw Stock Exchange.
Currently it is on the primary market with
single price auctions held twice a day.
The company’s main shareholder is envia
Mitteldeutsche Energie AG, a member of the
RWE Group, holding 69.56% of the shares.
The share capital of B dzin Cogeneration Power
Station is 15,746,000 PLN (approximately ¤4.5 million)
and is divided into 3,149,200 A-series shares.
B dzin Cogeneration Power Station has an
Integrated Management System and is certified
for compliance with EN ISO 9001:2000, EN ISO
14001:2004 and PN-N 18001:2004 standards.
In 2008 the company’s revenues were over
120 million PLN (approximately over ¤34 milion).
34 RWE in Poland34 RWE in Poland
35RWE in Poland 35RWE in Poland
D BROWA GÓRNICZA WATER AND SEWERS COMPANY
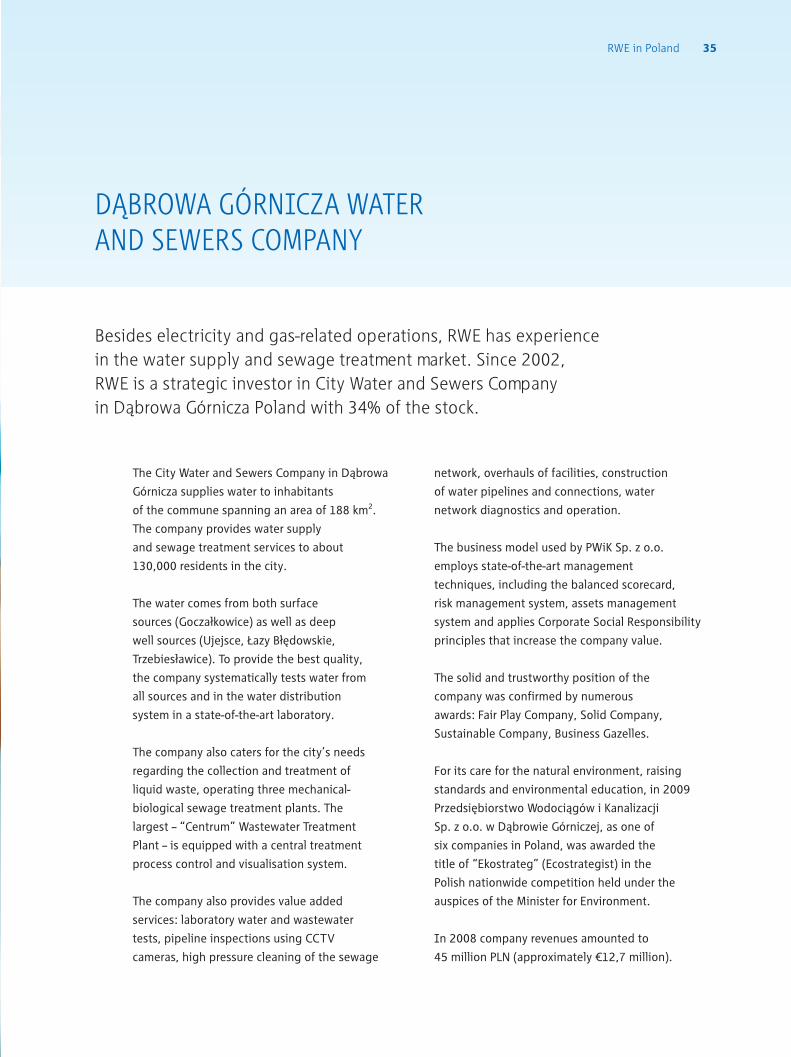
Besides electricity and gas-related operations, RWE has experience in the water supply and sewage treatment market. Since 2002, RWE is a strategic investor in City Water and Sewers Company in D browa Górnicza Poland with 34% of the stock.
network, overhauls of facilities, construction
of water pipelines and connections, water
network diagnostics and operation.
The business model used by PWiK Sp. z o.o.
employs state-of-the-art management
techniques, including the balanced scorecard,
risk management system, assets management
system and applies Corporate Social Responsibility
principles that increase the company value.
The solid and trustworthy position of the
company was confirmed by numerous
awards: Fair Play Company, Solid Company,
Sustainable Company, Business Gazelles.
For its care for the natural environment, raising
standards and environmental education, in 2009
Przedsi biorstwo Wodoci gów i Kanalizacji
Sp. z o.o. w D browie Górniczej, as one of
six companies in Poland, was awarded the
title of “Ekostrateg” (Ecostrategist) in the
Polish nationwide competition held under the
auspices of the Minister for Environment.
In 2008 company revenues amounted to
45 million PLN (approximately €12,7 million).
The City Water and Sewers Company in D browa
Górnicza supplies water to inhabitants
of the commune spanning an area of 188 km2.
The company provides water supply
and sewage treatment services to about
130,000 residents in the city.
The water comes from both surface
sources (Gocza kowice) as well as deep
well sources (Ujejsce, azy B dowskie,
Trzebies awice). To provide the best quality,
the company systematically tests water from
all sources and in the water distribution
system in a state-of-the-art laboratory.
The company also caters for the city’s needs
regarding the collection and treatment of
liquid waste, operating three mechanical-
biological sewage treatment plants. The
largest – “Centrum” Wastewater Treatment
Plant – is equipped with a central treatment
process control and visualisation system.
The company also provides value added
services: laboratory water and wastewater
tests, pipeline inspections using CCTV
cameras, high pressure cleaning of the sewage
36 RWE in Poland36 RWE in Poland
37RWE in Poland 37RWE in Poland
RWE DEA POLSKA
RWE Dea Polska is a subsidiary of RWE Dea – an international operator in the field of exploration and production of natural gas and crude oil. The company deploys state-of-the-art drilling and production technologies along with the vast know-how and skills acquired in 111 years of corporate history. RWE Dea is also a leader in terms of safety and environmental protection.
In south-east Poland, RWE Dea has rights
to hydrocarbon exploration and production
within 5 concession blocks with a total area
of 3,296 km2. Work is proceeding on the
interpretation for the definition of drilling
prospects and also recently seismic analyses
and intensive drilling are being carried out.
RWE Dea operates production facilities
in Germany, the UK, Norway, Denmark and
Egypt, and also holds exploration licences
in Poland, Algeria, Libya and Malta.
In Germany, RWE Dea also operates high-volume
underground storage facilities for natural gas.
In 2008 RWE Dea produced 3.32 billion cubic
metres of gas and 2.52 million cubic metres of oil.
Technical expertise of RWE Dea:
In-house know-how of state-of-the-art •
E & P technologies e.g. formation
evaluation, geostatistical modelling
Laboratory for applied geoscience, •
core analysis, production chemistry
Extended-reach drilling•
Offshore operation in sensitive •
National Park environments
High-pressure and high-temperature drilling•
Gas storage construction and operation•

38 RWE in Poland38 RWE in Poland
39RWE in Poland 39RWE in Poland
and transparent pricing structure and to enable the
customers to have more control over their energy
consumption rates and energy costs.
Engagement in the Community
RWE supports the local communities in which it
operates. The RWE Foundation in Poland is a unique
example of a corporate foundation, which plans and
develops its own original programmes. RWE also
established the employees’ volunteering programme.
Demographic change
RWE will support the health and well-being of the
employees, help them to remain productive and
recruit a more diverse workforce.
Supply chain
RWE will ensure that all its suppliers and service
providers work according to internationally
recognised standards.
Occupational health and safety
RWE supports the health and safety of both its own
and its subcontractors’ employees. The company
also promotes the ”RWE Safe Energy” programme
among children at primary schools, teaching them
how to safely use the electricity. Additionally RWE
trains its staff to give first aid to the inhabitants of
Warsaw.
Environmental protection
RWE strives to minimise the environmental impact of
its operations.
RWE develops responsibly, bearing in mind the main
interest of the company’s stakeholders. The Group is
a member of the United Nations Global Compact and
follows the ten principles of ethical and sustainable
development in its day-to-day operations. RWE is also
included in the internationally renowned Dow Jones
Sustainability Index.
In Poland RWE integrates the sustainability issues
in its strategies and focuses on the following areas:
Climate protection
RWE’s planned investments in 300 MW wind farms as
well as an 800 MW highly-efficient cutting edge
technology coal-based power plant, will significantly
contribute to Poland’s CO2 reduction plan. The coal
plant will emit 1.3 million tonnes of CO2 less annually
in comparison to present power plants.
Energy efficiency
RWE is one of the first companies to promote the
efficient use of energy both among the customers
and within the company. “RWE Conscious Energy” is
the flagship programme in Poland.
Security of supply
The energy distribution network in Warsaw is among
the most reliable in Poland. RWE Stoen Operator
continuously invests in the new infrastructure of the
expanding Warsaw city.
Pricing
Warsaw households pay one of the lowest total
energy bills in Poland. RWE aims to establish a fair
SUSTAINABILITY
What can we do to combat climate change without jeopardizing the security and economic viability of the electricity supply? Will RWE have access to enough skilled staff 20 years from now? Sustainable action requires that such questions be asked.
40 RWE in Poland40 RWE in Poland
RWE in Poland 41RWE in Poland
DEMOGRAPHIC DEVELOPMENTS:RWE – A RESPONSIBLE EMPLOYER
The employees and their skills are the most important potential of a company. This is why human resources management issues are given a great deal of attention at RWE Polska, RWE Stoen Operator and other RWE Group companies. It is primarily about staff development, employee motivation and a friendly and creative working environment.
Every two years, an anonymous opinion poll is
conducted among the employees in order to assess
their perception of the company. There is also an
“Idea Management” programme through which the
staff can submit their proposals for improvements
to company operations in technical, commercial
and organisational areas. The “Employee of the
Year” contest allows us to find the most committed
persons, admired by their supervisors and peers.
The company also supports students and university
graduates in their first steps in the labour market
through a 15-month internship programme called
“Trainee – Generation of the Future.” The graduates
perform tasks in selected departments of RWE
Polska and RWE Stoen Operator and take part in
national and international RWE Group projects.
The RWE Group employs 66,000 people. Around
1,600 people are employed in Poland of whom over
1,200 work in RWE Polska and RWE Stoen Operator.
Employee qualifications and satisfaction
improvement are achieved through training
programmes and tools for streamlining
communication and exchange of information
between employees. The staff has opportunities to
gain additional skills, discover other RWE
organisations and participate in international
projects. The most important ones are “FAME” –
a programme for young managers, “Discovery” – for
employees with potential for further development
and promotion to management positions, “Job
Rotation” – a several-months-long internship in one
of the RWE companies, and the “Team Leaders
Programme” supporting development of employees,
especially those from the technical sector.
42 RWE in Poland42 RWE in Poland
43RWE in Poland 43RWE in Poland
ENERGY EFFICIENCY:”RWE CONSCIOUS ENERGY”
individual household appliances as well as practical
tips can be found in the “Home user’s guide”,
developed in collaboration with the Polish National
Energy Conservation Agency. The publication is
available free of charge at all RWE Polska customer
care centres, and can also be downloaded in electronic
format from the programme’s website:
www.swiadomaenergia.pl. The campaign also included
the “Guide for businesses”, promoting energy
efficiency in companies and institutions. The campaign
was awarded the European Energy Trophy, a prize
recognised throughout Europe and supported by the
EU – RWE Poland won second place in the category for
the ”Best Information and Motivation campaign for
employees”. RWE Polska was the only Polish company
awarded among over 155 candidates from all over Europe.
Thanks to the campaign addressed to employees and the
low budget investments, the “RWE Conscious Energy”
has also brought internal benefits to the company.
The energy consumption in one of the office buildings
was reduced by nearly 24%.
The “RWE Conscious Energy” long-term social
campaign was launched in October 2007. It is a
response to customers’ needs and the growing prices
of electricity and gas.
From the customers’ perspective “advising on
efficiency as well as promoting the use of
energy-efficient equipment and light sources” is one
of the most sought-after methods of demonstrating
that the company is considering their needs. The
important factors that led to the commencement of
the programme were also: low awareness among
Poles of the possibilities of more rational use of
electricity and their willingness to receive guidelines
in this area as well as the RWE Group’s activities
supporting the European Energy Conservation Policy.
The goal of the “RWE Conscious Energy” programme
is to demonstrate to energy consumers that by
changing their day-to-day behaviour and paying
attention to the energy efficiency of household
electrical appliances, they can lower their
consumption of electricity in the long term even by
40% without decreasing quality of life.
The campaign is based on the dissemination of
information and advice on the conscious use of
electricity addressed to individuals and households.
Detailed information on the energy consumption of
RWE was one of the first companies in Poland to educate on the rational use of electricity and promote the idea of energy conservation. In 2009 the campaign was awarded the European Energy Trophy presented during EU Sustainability Week in Brussels and nominated to the international Stevie Business Award in New York.
RWE Conscious
Energy
44 RWE in Poland44 RWE in Poland
RWE in Poland 45RWE in Poland
COMMUNITY ENGAGEMENT:”ENLIGHTENED WARSAW”
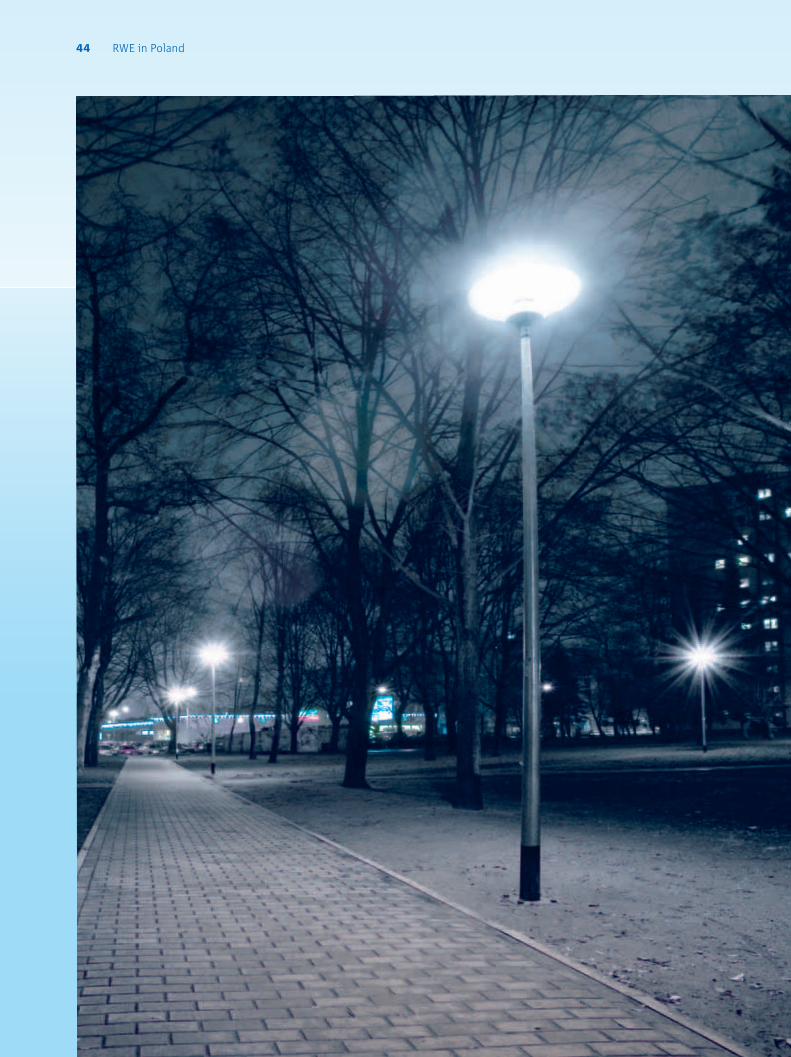
The “Enlightened Warsaw” initiative was established to improve the public safety perception of inhabitants of Warsaw. The main goal of the initiative was to install lighting in places considered unsafe after dark. By putting up 100 streetlights in the most dangerous spots of Warsaw, the Foundation wanted to eliminate “dark alleys” and, as a result, decrease the number of robberies in Warsaw.
As a result of a poll in which the inhabitants of
Warsaw actively participated, the RWE in Poland
Foundation installed 100 new streetlights in
10 locations throughout Warsaw. Dark spots had
been selected from among several dozen deemed by
the Warsaw City Hall and the Warsaw Police as
particularly dangerous.
”Enlightened Warsaw” programme was accomplished
thanks to strong support of the partners: the Warsaw
City Hall, the Warsaw Police and local media.
Detailed information about the enlightened locations
can be found at: www.oswieconawarszawa.pl.
The “Enlightened Warsaw” programme was
established by the RWE in Poland Foundation in
response to the needs of the inhabitants of Warsaw.
The “Warsaw Safety Map” report indicated that
lighting is one of the key factors contributing to
a feeling of security. There are many places in
Warsaw that are unsafe because of insufficient
lighting or no lighting at all. This can be seen in the
information gathered by the Warsaw Police and the
City Hall, as well as in results of opinion polls
conducted by a research institute engaged by the
RWE in Poland Foundation.
The poll indicates that 77% of inhabitants of
Warsaw encounter dark unlit places when crossing
the city at night. Almost one in four respondents
came across a dangerous situation in such areas,
and 70% said they feel uneasy in dark places.
According to 85% of those polled, security could be
improved by installing streetlights.

46 RWE in Poland46 RWE in Poland
47RWE in Poland 47RWE in Poland
COMMUNITY ENGAGEMENT:FOR STUDENTS
RWE caters to the development of the Polish power sectorby cooperating with the leading technical universities in Poland,including the AGH University of Science and Technology in Cracow, Warsaw University of Technology and Wroc aw University as well as Wroc aw University of Technology.
2005–2008 the Foundation offered a similar
scholarship programme for students of the Electrical
Engineering Faculty of the Warsaw University of
Technology.
For future engineers, participation in such a
scholarship programme is an excellent opportunity
not only to obtain funding, but also to undertake
internship in Polish and foreign companies belonging
to one of the largest utility groups in Europe. For
RWE, in turn, this is an opportunity to attract good
employees who, beside having excellent grades,
are truly passionate about their specialties and are
looking for innovative solutions and challenges.
The most talented students are offered internships at
RWE Polska, RWE Stoen Operator and are given the
opportunity to visit foreign companies of RWE Group.
As of October 2008, students of the Mining and
Geoengineering, Mechanical Engineering and
Robotics, Electrical Engineering, Automatics,
Computer Science and Electronics as well as Metal
Engineering and Industrial Computer Science
faculties of AGH University of Science and
Technology in Cracow may apply for the RWE in
Poland Foundation scholarships.
About one hundred students from the faculties
mentioned above filled in applications for
scholarship in the first edition of the scholarship
programme at AGH. The programme is run in
cooperation with RWE Power.
The RWE in Poland Foundation has already conducted
scholarship programmes for students of technical
universities for several years. In the period

48 RWE in Poland48 RWE in Poland
49RWE in Poland 49RWE in Poland
COMMUNITY ENGAGEMENT:”RWE SAFE ENERGY”
The objective of this programme is to teach children the principles of using electricity and to train them in the safe handling of electrical equipment and installations. The programme is aimed mainly at seven-year-old children. It is conducted free of charge in public primary schools in Warsaw and in Podlaskie Voivodship.
operates as a series of classes delivered by the
teachers themselves. Teaching consultants from
the Mazovia Local Government Teaching Skills
Competence Centre and RWE experts designed
scenarios and educational materials for six
lessons. A special handbook in cartoon format
and the website www.bezpiecznaenergia.pl were
designed for the programme. The children from
the Podlaskie region, where RWE constructed its
first wind park in Poland, have been taking part in
the programme since the beginning of 2009.
Since 2005 four series of ”RWE Safe Energy” were
attended by about 20,000 children.
The programme was very highly regarded by the
teachers and is endorsed by the Mazovia Education
Supervision Body and by the Podlaski Education
Supervision Body.
”RWE Safe Energy” expresses concern for children’s
safety. Despite the widespread use of electricity, the
number of accidents caused by the inappropriate
handling of electrical equipment has remained
constant for many years. Electrical injury statistics
show that electrical incidents result in an average
of 200 deaths annually in Poland. The vast majority
of accidents happen during daily household
activities. By implementing a long-term educational
programme, the Foundation intends to increase
public awareness of how electricity works and reduce
the number of electrical injuries among children.
The programme was established as an initiative of
the employees of the Emergency Repair Service.
During its first round in the 2005/2006 school
year, the Foundation conducted over 340 lessons
in roughly one hundred Warsaw primary schools.
Since 2006 the ”RWE Safe Energy” programme
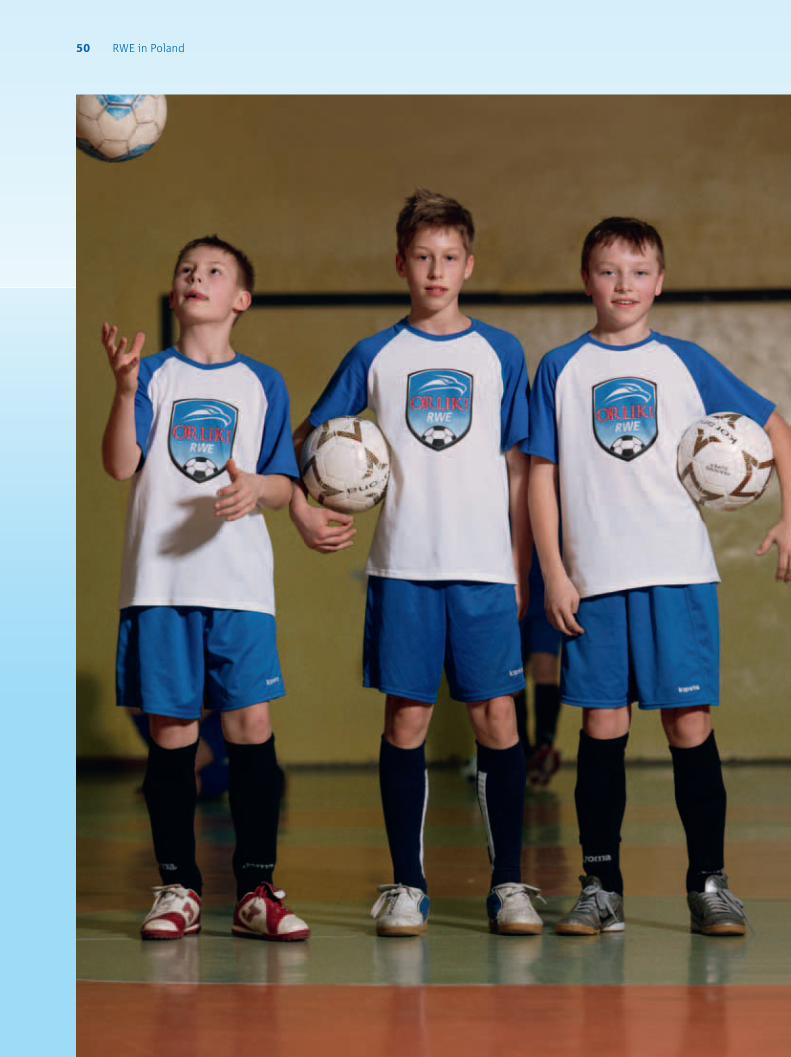
50 RWE in Poland50 RWE in Poland
51RWE in Poland 51RWE in Poland
COMMUNITY ENGAGEMENT:”ORLIKI RWE”
The RWE in Poland Foundation supports the
most talented 10-year-old football players from
Warsaw and its suburban football clubs, taking
part in playoffs of Mazovia Soccer Association.
The name of the programme – ”Orliki RWE” –
means Eagles and relates to the name of the
youngest player divisions in Polish football clubs.
The list of clubs invited to take part in the
programme is made with the Mazovia Football
Association, while household income is validated
via the Institute of Labour and Welfare.
Team trainers’ opinions are essential for the
organisation of the programme, as they constitute
an important support allocation criterion.
During the four rounds of the programme since
2005, the Foundation has provided support to 217
young football players from dozens of football clubs.
Perhaps there are future professionals among the
young Orliks. Let’s hope we will have the opportunity
to applaud them at the future UEFA Championships.
However, the most important goal of the Foundation
is to provide equal opportunities, a good start,
motivate the boys to train harder and teach
them persistence in pursuing objectives.
„Orliki RWE” programme initiated the activity of RWE in Poland Foundation in 2005 and was supported by proceeds from charity football game between Bayer Leverkusen and Legia Warszawa organised by RWE. The programme is designed for talented and promising young football players from low-income families. The RWE in Poland Foundation provides the boys with sports gear and a subsidy for training camps.
52 RWE in Poland
RWE Polska
Headquarters
RWE Polska SA
ul. Wybrze e Ko ciuszkowskie 41
00-347 Warszawa, Poland
T +48 22 821 31 11
F +48 22 821 41 05
www.rwe.pl
INDIVIDUAL CUSTOMERS
Postal address
RWE Polska SA
ul. W odarzewska 68
02-384 Warszawa, Poland
RWE Polska 24/7 Customer Contact Centre
T +48 22 821 46 46
F +48 22 821 46 47
CORPORATE CUSTOMERS
Helplines for customers with annual energy
consumption in the range of 0.5 GWh – 10 GWh
T +48 22 821 34 31
+48 22 821 30 29
+48 22 821 34 33
+48 22 821 30 33
+48 22 821 30 32
Helplines for customers with annual energy
consumption exceeding 10 GWh
T +48 22 821 30 27
+48 22 821 30 23
+48 22 821 30 25
+48 22 821 30 36
RWE Stoen Operator
Headquarters
RWE Stoen Operator Sp. z o.o.
ul. Pi kna 46
00-672 Warszawa, Poland
T +48 22 821 51 03
www.rwestoenoperator.pl
INDIVIDUAL CUSTOMERS AND SMALL
TO MEDIUM BUSINESSES (SMB)
RWE Stoen Operator 24/7 Customer Contact Centre
T +48 22 821 31 31
F +48 22 821 31 32
Postal address
RWE Stoen Operator Sp. z o.o.
ul. W odarzewska 68
02-384 Warszawa, Poland
Direct contact
RWE Stoen Operator Sp. z o.o.
Customer Support Centre – Distribution
ul. Rudzka 18, Ist floor
01-689 Warszawa, Poland
CORPORATE CUSTOMERS
RWE Stoen Operator Business Customer Care Centre
T +48 22 821 30 11
F +48 22 821 30 13
Postal address
RWE Stoen Operator Sp. z o.o.
ul. E. Tyszkiewicza 21
01-157 Warszawa, Poland
CONTACT
RWE is one of Europe’s five leading electricity and gas companies. It is
active in the generation, trading, transmission and supply of electricity
and gas. This integrated business model enables RWE to take advantage of
the rising demand for energy. Through the fully consolidated investments,
66,000 RWE employees supply over 14 million customers with electricity
and 6 million customers with gas. In fiscal year 2008, RWE recorded
€49 billion in revenue. Europe is the core market for the company:
RWE is the No. 1 power producer in Germany and No. 3 in the UK. RWE
continously expands its position in Central and South Eastern Europe.
RWE’s power plant portfolio and investment programme for building new,
environmentally friendly generation capacity are the basis for growing
earnings in the future. Energy from renewables plays a key role. RWE’s
leading position in European energy trading helps the company make
optimal use of the power plants on the market. RWE reacts to changes
in customer needs by offering new products. In this context, climate
protection and energy efficiency are becoming increasingly important.
RWE’s gas and oil production businesses are displaying above-average
growth. In light of the global rise in demand for gas, RWE plans to steadily
increase the share it produces in-house. RWE’s aim is to create value for the
investors, customers and employees. Therefore, RWE’s strategy centres on
profitable, organic growth, supplemented by value-increasing acquisitions.
RWE’s takeover offer for the Dutch-based energy utility Essent will take the
company a major step forward in this direction. RWE wants its shareholders to
continue to take part in the Group’s success to a great extent in the future.
THE RWE GROUP – A BRIEF PORTRAIT
Electricity Gas
Germany No. 2 No. 3
UK No. 4 No. 4
Central EasternEurope
No. 2 in HungaryNo. 3 in Slovakia6% of Polish market
No. 1 in the Czech RepublicLeading position in HungaryActive in Slovakia
Total Europe No. 3 No. 6
Market positions of the RWE Group (in terms of sales) in 2008
“RWE in Poland” was prepared by RWE Polska Corporate Communications.
T +48 22 821 41 30
This report is also available in the Polish language.
Published in August 2009.
RWE Renewables Polska
RWE Renewables Polska Sp. z o.o.
ul. Wybrze e Ko ciuszkowskie 41
00-347 Warszawa, Poland
RWE Innogy GmbH
Karolingerstraße 94
45141 Essen, Germany
T +49 201 12 14 499
F +49 201 12 14 498
www.rweinnogy.com
RWE Polska Contracting
RWE Polska Contracting Sp. z o.o.
ul. Powsta ców l skich 28/30
53-333 Wroc aw, Poland
T +48 71 335 03 30
F +48 71 335 03 31
www.rwe.pl
B dzin Cogeneration Power Station
Elektrociep ownia “B dzin” SA
ul. Ma ob dzka 141
42-500 B dzin, Poland
T +48 32 267 95 99
+48 32 266 40 71–5
F +48 32 266 44 11
www.ecb.com.pl
D browa Górnicza Water and Sewers Company
Przedsi biorstwo Wodoci gów i Kanalizacji Sp. z o.o.
ul. Powsta ców 13
41-300 D browa Górnicza, Poland
T +48 32 639 51 00
F +48 32 262 22 10
www.pwik-dabrowa.pl
RWE Dea Polska
RWE Dea Polska Oil Sp. z o.o.
ul. Lindleya 16/114
02-013 Warszawa, Poland
T +48 22 627 36 15
F +48 22 583 15 17
www.rwedea.com
RWE VALUE CHAIN
Mining and drilling
Trading (coal, gas, derivatives) and procurement
Electricity generation Transmission Distribution Sales and use
5 lignite opencast mines (11,014 hectares)
108 million tonnes of produced lignite
Fuel purchases (hard coal, gas, biomass etc.)
Exploration and drilling of natural gas and oil
Lignite
100/0
EU and Norway
Hard coal
42/58
Gas
73/27
0 20 40 60 80 100
Fuels by origin in %
Other countries of origin
Mining and drilling
10,828 MW
14,183 MW
6,295 MW
7,223 MW
1,515 MW
5,152 MW
lignite-fired power plants
hard-coal-fired power plants
nuclear power plants
gas-fired power plants
renewable energies
pumped storage, oil, other
Lignite
Hard-coal
Nuclear power
Gas
Renewableenergies
Pumped storage, oil, other:
33
28
22
14
2.4
0.6
Electricity production (2008: 334.2 TWh,in-house generation: 224.1 TWh) in %:
Power station capacity(owned or contractually secured):
Electricity generation
381,005 kilometre medium- and low-voltage
transmission lines (10-110 kV)
134,240 substations and transformers
90,345 kilometre gas distribution pipelines
(a-b bar)
Domestic andcommercialcustomers
Industrial customers
Redistributors
Electricitytrading
60
98
79
69
Supply to customers in TWh
Distribution
13,912 kilometre high-voltage transmission lines
(220/380 kV)
Brauweiler Control Centre
26,913 kilometre gas pipelines
3.913 million standard cubic metre gas
storage tanks
RWE
E.ON
EnBW
Vattenfall
32
30
10
27
Transmission grid by operator in %
Transmission
Electricity
14.4 million domestic and commercial customers
167,800 industrial customers
Gas
6.3 million domestic and commercial customers
34,800 industrial customers
Germany
UK
Netherlands
Hungary
Poland
49
30
1
14
6
Distribution of electricity, customers in %
Sales and use
RWE_okl_EN-Final_2209.indd 3RWE_okl_EN-Final_2209.indd 3 9/23/09 11:52:19 AM9/23/09 11:52:19 AM

External revenue € million 48,950
Germany € million 30,694
Outside Germany € million 18,256
EBITDA € million 8,314
Electricity production kWh billion 334.2
Electricity sales kWh billion 317.1
Power station capacity MW 45,196
Gas sales kWh billion 327.8
Workforce full-time equivalent 65,908
RWE Group in 2008
Shareholder structure of RWE AG in %
15% RW Energie-Beteiligungsgesellschaft
5% Capital Research & Management
59% Other institutional shareholders
1% Employee shareholders
6% Own shares
14% Individual shareholders
79% Institutional shareholders
39% Germany
17% US/Canada
11% UK/Ireland
11% Continental Europe excl. Germany
1% Rest of the world
Percentages reflect shares in the subscribed capital. Sources: Shareholder identification and notifications of shareholdings in accordance with the German Securities Trading Act (WpHG), as of December 31, 2008.
RWE Group revenue by region in 2008 in %
62.6% Germany0.6% Other
16.5% Rest of Europe
20.3% UK
RWE in Poland
RWE_okl_EN-Final_2209.indd 2RWE_okl_EN-Final_2209.indd 2 9/23/09 11:52:14 AM9/23/09 11:52:14 AM