rural-urban labor migration and urban ...pure.iiasa.ac.at/1545/1/rr-81-024.pdfrural-urban labor...
TRANSCRIPT
RURAL-URBAN LABOR MIGRATION AND URBAN UNEMPLOYMENT IN KENYA
Henry Rempel University of Manitoba, Canada
RR-8 1-24 October 1981
INTERNATIONAL INSTITUTE FOR APPLIED SYSTEMS ANALYSIS Laxenburg, Austria

International Standard Book Number 3-7045-00194
Researclt Reports, which record research conducted at IIASA, are independently reviewed before publication. However, the views and opinions they express arc not necessarily those of the Institute or the National Member Organizations that support it.
Copyright O 1981 International Institute for Applied Systems Analysis
All rights reserved. No part of this publication may be reproduced or transmitted in any form or by any means, electronic or mechanical, including photocopy, recording, or any information storaze or retrieval systc~n, without permission in writing from the publisher.

DEDICATION
To Grace. Ruth, Clark, and Gwen. who shared both the exci ten~ent ofliving in Kenya and the drudgery of Iny writing about i t .

FOREWORD
Roughly 1.8 billion people, 42 percent of the world's population, live in urban areas today. At the beginning of the last century, the urban population of the world was only 25 million. According to recent United Nations estimates, about 3.1 billion people,almost twice today's urban population, will be living in urban areas by the year 2000.
This rapid pace of urbanization makes it imperative that we obtain a better under- standing of both the causes and the consequences of urbanization. Such an understanding requires a theoretical framework that leads to findings consistent with the stylized facts of development and that serves to describe the past, permits an assessment of the future, and facilitates the evaluation of policy options. A general model that meets these require- ments cannot be expected, at the same time, to explain the behavior of a particular low- income econorny. This task requires country-specific case studies.
This report is a case study of Kenya carried out by Professor Henry Rempel of the University of Manitoba in Canada. The starting point is a model of rural household decision- making, which generates a set of testable hypotheses regarding the determinants and con- sequences of rural -urban migration. A combination of census and survey data is then used to test these hypotheses. On the basis of the results, the study concludes with a general discussion of several aspects of the urbanization process that can be influenced by policy actions.
A list of reports in the Population, Resources, and Growth Series appears at the end of this report.
ANDRE1 ROGERS Chairrnan
Human Settlements and Services Area

ABSTRACT
The starting point of this study is a model of rural household decision-making, which generates a set of testable hypotheses regarding the determinants and consequences of rural--urban migration. A survey of one of Kenya's eight largest urban centers was carried out in December 1968 to provide data that were then combined with census data to test these hypotheses. The questionnaire that was distributed was designed t o obtain the ~nigra- tion, eniployment, and income history of each migrant from 1 year before his move t o the time of the survey as well as the migrant's opinions on why he moved, how long he intended t o stay, and what he thought of life in urban centers. This volume is an analysis of those data. The basic thesis is that rural -urban migration is a rational response t o devel- opment in Kenya. Migration does not shape this development; it is merely one symptonl o f growth. On the basis of the results obtained, the study concludes with a general discus- sion of several aspects of the urbanization process that can be influenced by policy actions.

ACKNOWLEDGMENTS
The author expresses his appreciation to the following agencies: the Mid-West Con- sortium and the International Development Research Centre, each of which provided fund- ing for a year of research in Kenya; the Rockefeller Foundation for funding the survey; the Canada Council for a doctoral fellowship and then a subsequent research grant t o facilitate analysis of the data; the Faculty of Graduate Studies, University of Manitoba, for provid- ing funds for computer time and research assistants; the Institute for Development Studies, University of Nairobi, and inore specifically the respective directors, James Coleman and Dharam Ghai, who arranged for the use of institute facilities and the availability of research assistants; the Office of the President of the Government of Kenya for granting the research clearance to carry out the survey; the Central Bureau of Statistics, Ministry of Finance and Planning, for providing unpublished data used in this study; and the International Institute for Applied Systems Analysis for funding the completion of the study as well as making available its facilities.
In addition to these institutions, my appreciation is extended to the many people who assisted in this study. First, there are John Harris and Michael Todaro who granted perinission to carry out this aspect of their larger research project and who assisted in carry- ing out the survey. John Harris was also extensively involved in outlining in detail the vari- ous chapters of this study and has provided valuable comments on some of the chapters.
Second, mention must be made of the people involved in the survey: the 1,400 respondents who gave of their time; the many students from the University of Nairobi who carried out the interviews and who assisted in preparing the data for computer analy- sis; and Elaine Berman, who played a key role in preparing the data for analysis. Third, my appreciation is extended to the students who have served as research assistants: Valerie Collier, Linda Cooper, Marina Malmer, and Shah K.E. Rahrnan. Fourth, the diligent typing of earlier drafts of some of the chapters by Georgina Buddick is much appreciated.
Further appreciation is expressed to the people who have taken time to read parts or all of the manuscript and who provided valuable comments. Explicit mention must be made of Richard Lobdell, Josef Gugler, Bruce Johnston, and Gary Fields. This includes also the members of the Human Settlements and Services Area at IIASA who took time to talk with me during the final writing and who provided valuabIe comments.
Finally, my appreciation is expressed to various members at IIASA who made possible the completion of this study. I wish to thank Andrei Rogers for making the necessary arrangements and for his assistance and encouragement. Also, mention must be made of the assistance provided by the support staff: Bernhard Schweeger for carryingout the final computer analysis, Eduard Loeser and Peter Popper for obtaining necessary publications, and Alduild Fuerst for taking responsibility for the typing of the final draft.
To all of these I am indeed grateful. Without their assistance this study would not have been completed in its present form. Needless t o say, the contents of the study represent the positions taken by the author and are not necessarily shared by the agencies who sup- ported the research. The responsibility for any errors or shortcomings of the study must fall on me.

CONTENTS
A THEORY OF RURAL --URBAN LABOR MIGRATION
THE KENYAN SETTING
DATA SOURCES AND MIGRATION PATTERNS
DETERMINANTS OF RURAL-TO-URBAN MIGRATION
THE MIGRATION SELECTION PROCESS IN RURAL AREAS
THE URBAN EMPLOYMENT AND INCOME EXPERIENCE OF THE MIGRANTS
THE ROLE OF URBAN-BASED KIN
THE IMPORTANCE OF AMENITIES
MAINTENANCE OF RURAL-URBAN TIES
INTERURBAN MOVEMENTS
THE IMPACT OF PUBLIC POLICY ON MIGRATION AND EMPLOYMENT
REFERENCES
AF'PENDIXES

1 A THEORY OF RURAL-URBAN LABOR MIGRATION
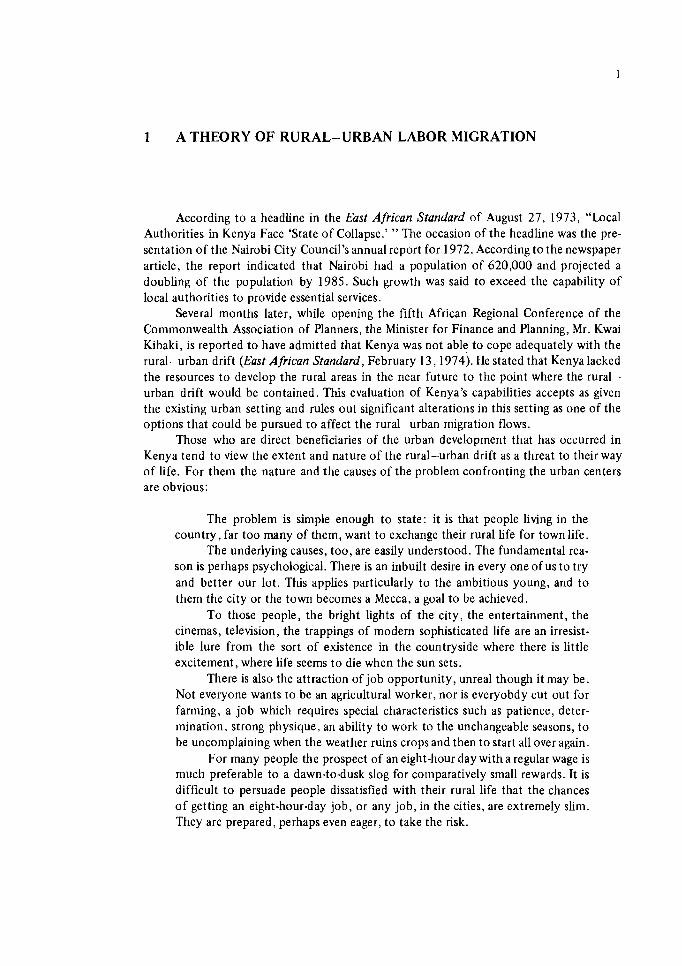
According to a headline in the East African Standard of August 27, 1973, "Local Authorities in Kenya Face 'State of Collapse.' " The occasion of the headline was the pre- sentation of the Nairobi City Council's annual report for 1972. According to the newspaper article, the report indicated that Nairobi had a population of 620,000 and projected a doubling of the population by 1985. Such growth was said to exceed the capability of local authorities to provide essential services.
Several months later, while opening the fifth African Regional Conference of the Commonwealth Association of Planners, the Minister for Finance and Planning, Mr. Kwai Kibaki, is reported to have admitted that Kenya was not able to cope adequately with the rural-urban drift (East African Standard, February 13,1974). He stated that Kenya lacked the resources to develop the rural areas in the near future to the point where the rural- urban drift would be contained. This evaluation of Kenya's capabilities accepts as given the existing urban setting and rules out significant alterations in this setting as one of the options that could be pursued to affect the ruralurban migration flows.
Those who are direct beneficiaries of the urban development that has occurred in Kenya tend to view the extent and nature of the rural-urban drift as a threat to their way of life. For them the nature and the causes of the problem confronting the urban centers are obvious:
The problem is simple enough to state: it is that people living in the country, far too many of them, want to exchange their rural life for town life.
The underlying causes, too, are easily understood. The fundamental rea- son is perhaps psychological. There is an inbuilt desire in every one of us to try and better our lot. This applies particularly to the ambitious young, and to them the city or the town becomes a Mecca, a goal to be achieved.
To those people, the bright lights of the city, the entertainment, the cinemas, television, the trappings of modern sophisticated life are an irresist- ible lure from the sort of existence in the countryside where there is little excitement, where life seems to die when the sun sets.
There is also the attraction of job opportunity, unreal though it may be. Not everyone wants to be an agricultural worker, nor is everyobdy cut out for farming, a job which requires special characteristics such as patience, deter- mination, strong physique, an ability to work to the unchangeable seasons, t o be uncomplaining when the weather ruins crops and then to start all over again.
For many people the prospect of an eight-hour day with a regular wage is much preferable to a dawn-to-dusk slog for colnparatively small rewards. It is difficult to persuade people dissatisfied with their rural life that the chances of getting an eight-hour-day job, or any job, in the cities, are extremely slim. They are prepared, perhaps even eager, to take the risk.
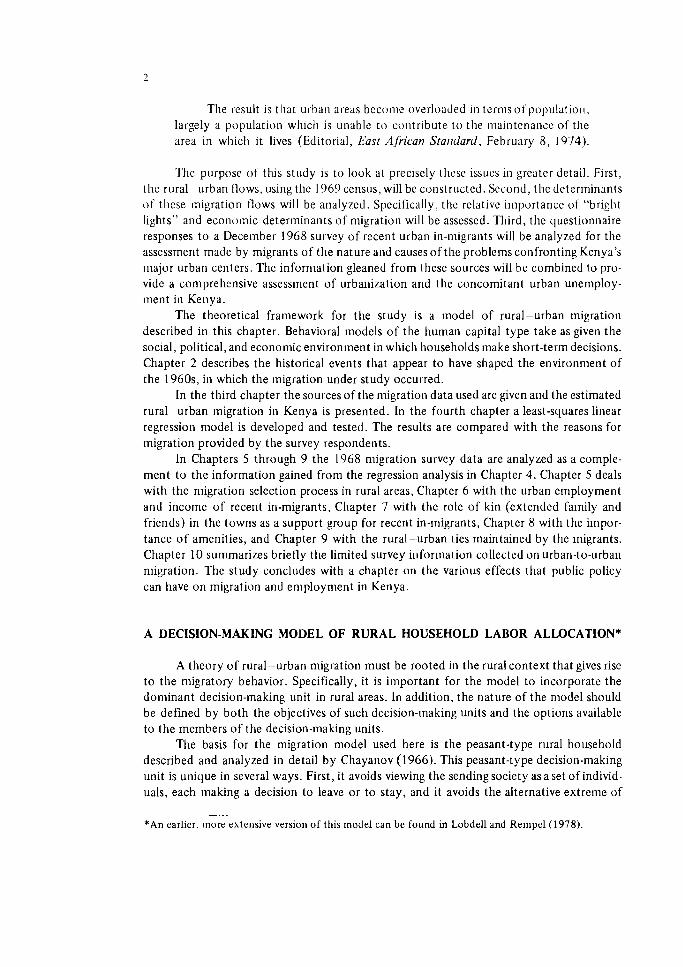
The result is that urban areas bccomc overloaded in tcrlns of pol)nlatioll, largely a population which is unable t o colltributc t o the ~naintcnancc of the area i l l which it lives (Editorial. l a s t African Statldard, February 8 , 1974).
Thc purpose of this study is to look at precisely these issucs in greater detail. First, the rural urban flows. using the 1969 census, will be constructed. Second, the determinants of thcse migration flows will be analyzed. Specifically, the relative importance of "bright lights" and economic determinants of migration will be assessed. Third, the questionnaire responses t o a December 1968 survey of rccent urban in-migrants will be analyzed for the assessment made by migrants of the nature and causes of the problems confronting Kenya's major urban centers. The information gleaned from these sources will be combined to pro- vide a con~prehensive assessment of urbanization and the concomitant urban unemploy- ment in Kenya.
The theoretical framework for the study is a model of rural-urban ~nigration described in this chapter. Behavioral models of the human capital type take as given the social, political, and economic environment in which households make short-term decisions. Chapter 2 describes the historical events that appear t o have shaped the environment of the 1960s, in which the migration under study occurred.
In the third chapter the sources of the migration data used are given and the estimated rural urban migration in Kenya is presented. In the fourth chapter a least-squares linear regression model is developed and tested. The results are compared with the reasons for migration provided by the survey respondents.
In Chapters 5 through 9 the 1968 migration survey data are analyzed as a comple- ment t o the information gained from the regression analysis in Chapter 4. Chapter 5 deals with the migration selection process in rural areas, Chapter 6 with the urban employment and income of recent in-migrants, Chapter 7 with the role of kin (extended family and friends) in the towns as a support group for recent in-migrants, Chapter 8 with the impor- tance o f amenities, and Chapter 9 with the r u r a l u r b a n ties maintained by the migrants. Chapter 10 summarizes briefly the limited survey i~lformation collected on urban-to-urban migration. The study concludes with a chapter on the various effects that public policy can have on migration and employment in Kenya.
A DECISION-MAKING MODEL OF RURAL HOUSEHOLD LABOR ALLOCATION*
A theory of r u r a l u r b a n migration must be rooted in the rural context that gives rise t o the migratory behavior. Specifically, it is important for the model to incorporate the dominant decision-making unit in rural areas. In addition, the nature of the model should be defined by both the objectives of such decision-making units and the options available to the members of the decision-making units.
The basis for the migration model used here is the peasant-type rural household described and analyzed in detail by Chayanov (1966). This peasant-type decision-making unit is unique in several ways. First, it avoids viewing the sending society as a set of individ- uals, each making a decision to leave or to stay, and it avoids the alternative extreme of
- - -. - - - -
*An earlier. more extensive version of this model can be found in Lobdell and Relnpel(1978)
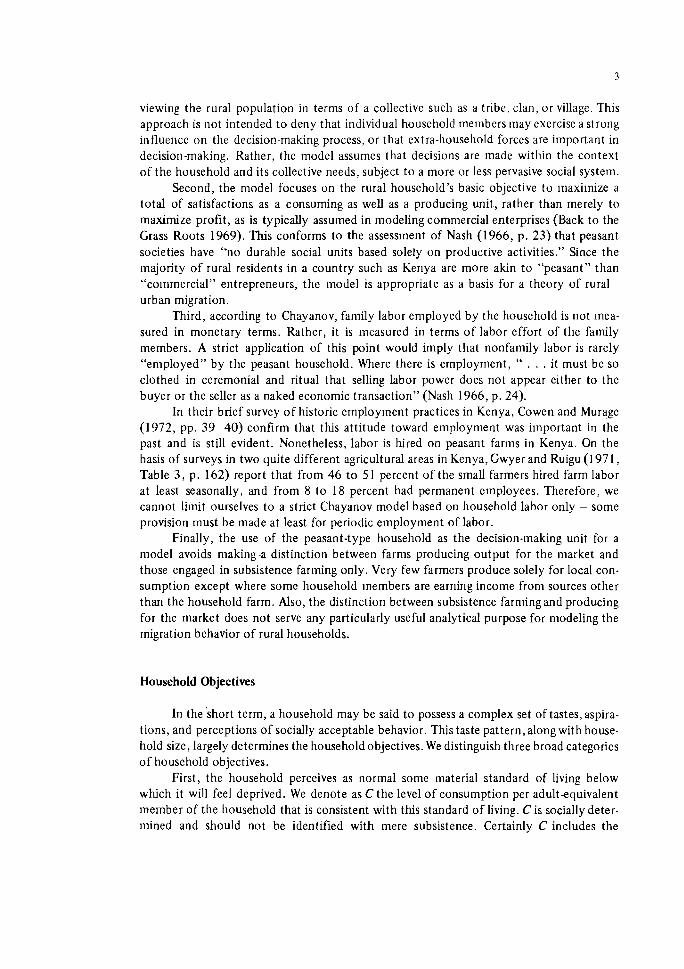
viewing the rural population in terms of a collective such as a tribe, clan, o r village. This approach is not intended t o deny that individual household m e ~ r ~ b e r s [nay exercise a strong i~iflueiice on the decision-making process, or that extra-household forces are important in decision-making. Rather, the model assumes that decisions are made within the context of the household and its collective needs, subject t o a more or less pervasive social system.
Second, the model focuses on the rural household's basic objective to inaxiinize a total of satisfactions as a consuming as well as a producing unit, rather than merely t o maximize profit, as is typically assumed in modeling commercial enterprises (Back t o the Grass Roots 1969). T h s conforms t o the assessment of Nash (1966, p. 23) that peasant societies have "no durable social units based solely o n productive activities." Since the majority of rural residents in a country such as Kenya are more akin t o "peasant" than "coinmercial" entrepreneurs, the model is appropriate as a basis for a theory of rural- urban migration.
Third, according to Chayanov, family labor employed by the household is not Inea- sured in monetary terms. Rather, it is measured in terms o f labor effort of the family members. A strict application of this point would imply that nonfamily labor is rarely "employed" by the peasant household. Where there is employment, " . . . it must be so clothed in ceremonial and ritual that selling labor power does not appear either to the buyer or the seller as a naked economic transaction" (Nash 1966, p . 24).
In their brief survey o f historic employlnent practices in Kenya, Cowen and Murage (1972, pp. 3 9 4 0 ) confirm that this attitude toward employment was important in the past and is still evident. Nonetheless, labor is hired on peasant farms in Kenya. On the basis of surveys in two quite different agricultural areas in Kenya, Gwyer and Ruigu (197 1 , Table 3 , p. 162) report that from 4 6 t o 51 percent of the small farmers hired farm labor at least seasonally, and from 8 t o 18 percent had permanent employees. Therefore, we cannot limit ourselves t o a strict Chayanov model based on household labor only - some provision must be made at least for periodic employment of labor.
Finally, the use of the peasant-type household as the decision-making unit for a model avoids making ,a distinction between farms producing output for the market and those engaged in subsistence farming only. Very few farmers produce solely for local con- sumption except where some household members are earning income from sources other than the household farm. Also, the distinction between subsistence farrningand producing for the market does not serve any particularly useful analytical purpose for modeling the migration behavior of rural households.
Household Objectives
In the 'short term, a household may be said t o possess a complex set of tastes, aspira- tions, and perceptions of socially acceptable behavior. This taste pattern,along with house- hold size, largely determines the household objectives. We distinguish three broad categories o f household objectives.
First, the household perceives as normal some material standard of living below which it will feel deprived. We denote as C the level of consumption per adult-equivalent member of the household that is consistent with this standard of living. C i s socially deter- mined and should not be identified with mere subsistence. Certainly C includes the
"minimum caloric rations" identified by Wolf (1966, pp. 5--10). Since C i s determined primarily by the relationship of a household to its peers, it bears a strong resemblance to Mill's "scale or standard of comfort" and Ricardo's "natural price of labor."*
Second, household objectives include the maintenance of a set of social relationships. This obliges the household t o acquire real resources (time, goods, money) with which to service social relationships such as reciprocal exchange, feast day celebrations, and ceremo- nial occasions associated with births, marriages, and deaths. Wolf (1 966, pp. 5 1 0) describes this objective as the need to provide for a "ceremonial fund". We use R to denote the mini- mum expenditure on social relationships per adult-equivalent member of the household. One aspect of R can be a sharing of household output and effort with other households. In this form, R serves to prevent a household from aspiring to a standard of living well above that of its peers.
Third, the household's objectives include provision for a target level of surplus Q to be used for a variety of purposes. First, it encompasses what Wolf (1966, pp. 5---lo) has called a fund for "replacement" of productive resources. Further, it represents a partial defense against the misfortune and risk inherent especially in small-scale farming but also in various forms of employment and self-employment. In addition, a household may wish to increase consumption or ceremonial expenditures beyond what is judged to be a socially acceptable minimum; if so, Q represents a means to pursue this objective. Finally, the household may wish to save for investment in land, physical capital, or the education ofi ts members; hence Q represents a fund for investment.
In summary, the short-term desired level of income P for the household can be defined as:
where C is the minimum socially acceptable level of consumption per adult-equivalent member, R is the minimum expenditure on the maintenance of social relationships per adult-equivalent member, A is the number of adult-equivalent members, and Q is the desired level of surplus.
One element conspicuously absent from this set of objectives is a trade-off between work effort and leisure. There are several reasons for not entering leisure as an element in the objective function. First, in a rural, small farm, or small firm setting the opportunity cost of work is not as easily identified as in a society where most people work a 40-hour week. For the peasant-type household it is typically a trade-off between types of work and between more or less work effort rather than between work and leisure per se. This is evident from survey work, as reported by Gwyer (1971, p. 1 l ) , where farms relying on only family labor were found to use more labor per unit of land during the slack period than farms that also hired labor. But in Nyeri district the farms that hired labor usedmore family labor during the peak period than farms that utilized family labor only.
Second, in any society where significant amounts of time and effort are invested in maintaining relationships within the faniily or clan, the distinction between work and leisure becomes difficult to identify. Other than at peak seasons in the agricultural cycle, it is likely
*J.S. Mill's socially defined concept of subsistence appears in both his discussion "Of Wages" (Book Two. 11). and "Of the Stationary State" (Book Four. I) in his Principles of Political EconomJ1; D . Ricardo, The Principles of Political Economy and Taxation. Homewood: Richard D . Irwin, Inc., 1963, p. 47.
that there is room within the household for some greater "self-exploitation" of its labor (Chayanov 1966, Ch. 2). While this possibility exists, to incorporate it into a decision- rnaking model is difficult.
Another possibility is t o express the objective function in terms of expected lifetime earnings, which would have the advantage of giving a specific, current value to a major ele- ment of Q. But, as Hutton (1973, p. 85) found in her survey in Uganda, with only a few exceptions, men expect that land that they will buy with their earnings or the children that they will have been able to educate with their earnings will be their sources of security in old age. If local inheritance practices do not ensure that children will adequately provide for elderly parents, current expenditures on R may be required as an additional means of socializing children to ensure that they will take this expected responsibility. Therefore, the dominant concern for the household is the current time period, the allocation oflabor to attain even though longer-term interests may have some effect on how such labor is being allocated. As a result, our interest is limited to defining household objectives in the short term.
Over time, the values of C, R, and Q can be expected to change. Household prefer- ences and perceptions of acceptable behavior are shaped by the social, political, and eco- nomic environment. The example that public officials set, the ideology they promote, the industries they encourage, as well as the policies they carry out can exercise a powerful influence on households. Also, the future values of Cand Q (and possibly R ) can be affected by current decisions. For example, a household that plans t o dispatch certain of its mem- bers to an urban area is likely t o perceive a need for schooling these individuals. This deci- sion will affect the composition and possibly the value of C and Q. Both the education and residency in town are likely t o have a positive feedback effect on C. Similarly. chang- ing perceptions of risk and revisions of investment plans will affect the desired level of sur- plus. Finally, expansion of markets and changes in prices will affect both the composition and value of C, R , and Q.
Determinants of Household Income
To achieve its objectives the household must acquire income, whether in cash or in kind, from its productive activities. From its point of view, the immediate concern is net income: gross receipts less costs associated with the acquisition of those receipts. Prominent among these costs are taxes, rent, depreciation, amortization of debt,and purchased inputs. As stated earlier, labor enters as one of these costs of production only if it is hired directly for a wage. In the short run, net income earned from any source is simply the amount of household labor involved in that activity times the average net return to labor from that activity.
T11er.e is much evidence that rural households derive income from a variety of sources. The set of relevant possible income sources can be disaggregated as follows:
And, more generally,
where Y, is net household income derived from agricultural activity undertaken by house- hold members, Y,, is net household income derived from rural nonagricultural activity undertaken in the local area by household members, Y, is income derived from household members employed in local activity not organized by the household, and Y, is the net change in household income caused by the emigration of a member. Included are net remit- tances plus the reduction in household consumption less the change in output caused by the absence of the household member. (Parents may promote emigration because they derive satisfaction from seeing a family member enjoy a higher standard of living in town even though there are insignificant remittances. This possibility of a psychic return t o parental sacrifice is recognized but not built explicitly into the model.) The subscript j refers t o the community and the subscript k refers t o external areas. Li is the number o f adult-equivalent labor units engaged in activity i, Wi is the average net return per adult- equivalent labor unit engaged in activity i, and Pi = Y,/LiWi.
In allocating its labor, the perceived values of the Wi's are of paramount importance t o the household. Since these values can be known only after the work has been done, planning becomes subject to risk. Moreover, the degree of risk is likely t o vary from one activity to another. In general, activities located outside the local area (sources o f Y,) are likely t o have a greater variance around an expected average net income than activities centered in the local area (e.g., sources of Y,), concerning which the household is better informed. Over time the household may be able t o increase labor productivity and/or diminish risk through judicious investment and the adaptation of new production tech- niques. But, in the short term, the household can only attempt to guard against risk through a careful estimation of the Wi's and the use of its surplus fund Q for a buffer against unantici- pated adventure.
Out-Migration as One Aspect of Household Labor Allocation
The most important short-term constraint on any household is the work it can do . If some members are exempt from economic activity for reasons of health, age, or sex, o r in order t o pursue other valued objectives such as schooling, then the household has less than I, t o allocate. Labor allocation may be constrained in other ways as well. For example, if the household cannot gain access to land, Y, is 0. Similarly, if barriers exist t o rural self- employment activities or if the household lacks the capital required t o initiate a business activity, Y, may be 0 as well.
Operating within such constraints, the household attempts t o acquire a total net income equal t o the desired level of household income as set out in Eq. (1 . l ) above. Sym- bolically,
In the unlikely event that Y > the household faces an "embarrassment of riches" and may choose t o work less, consume or save more, or make additional investment in human or pl.lysica1 capital. If net income falls below desired income (Y < P), then the household will be disappointed and will have t o reassess its labor allocation. In rural com- munities where formal schooling for the children is considered desirable and there is
considerable contact with urban centers, either through trade or because of previous rural urban migration, we postulate that f will rise over time so Y < 9 is likely t o be the more characteristic situation for households in the community.
Such households will pursue one or more o f several labor reallocation strategies. If the household has ready access t o an adequate supply of productive land the strategy employed will involve, at least in the peak seasons, a decision to intensify work effort. possibly forego some leisure, and reassess the exemptions from work for some household members. Alternatively, if educated members of the household are deemed t o have good employment opportunities elsewhere and an adequate supply of labor is available locally, one or more household members may be encouraged t o emigrate from the village and local, low-wage labor is substituted.
A decision to employ nonhousehold labor provides a special incentive to seek tech- nological changes or labor-augmenting capital t o increase the productivity of labor. In some areas limited availability of cash has been found to be an effective constraint t o both innovation and the hiring of more labor t o work land more intensively. (Both Gwyer (1 971, p. 18) and Moock (1973, pp. 306-307) report evidence of cash shortages for parts of Kenya.) Either a shift t o more cash crop production or the successful dispatchingofhouse- hold labor to outside employment can serve as a means for obtaining the needed cash. Also, externally employed labor spreads the household's earning sources over several different types, which can serve as a hedge against the risk involved in adopting new technology in an activity. Connell et al. (1976, p. 24) identify both of these effects of migration as the probable reason for "linked" migration observed in a number of low-income countries.
If land t o generate Y = P is not available, the labor reallocation strategy becomes more complex. Where some land exists, Goddard's findings (1 974, p. 270) for three villages in Sokoto Province in northern Nigeria probably apply - this land will be used first t o produce the basic food requirements for the household. For any other land, the household will weigh the returns of cash crop production and nonagricultural employment and allo- cate its labor accordingly. For one area where land is in short supply, the Maragoli subloca- tion in Kakamega district, Moock (1973, p. 307) reports that cash crop farming is viewed as merely a supplement to wage income. In this setting parents prepared their children for employment outside the local community by purchasing formal schooling for them as a substitute for the land that they as parents were no t able t o provide. Moock (1973, p. 304) implies that one aspect of R is declining in this setting in that "status is acquired more by accumulation of wealth than by its distribution."
In general, households prefer t o supplement income with local nonagricultural self- employment or periodic wage employment in the home community. In settings where social relationships between family as well as clan members are important, out-migration carries an added cost in that the maintenance of effective relationships becomes more dif- ficult. Where such local employment opportunities d o not exist or returns to labor are per- ceived t o be significantly below what is available externally, out-migration of household members is t o be expected. Where food is grown locally, the household will be able t o expend labor for external uses only where an adequate supply of labor exists. On the basis of a 1966 - 1967 survey of 7 0 households in Acuitzio, Mexico, Wiest (1 973, Figure 1 , p. 204) argues that out-migration of members occurs only if the household has three or more adult members. For smaller households, either the whole household leaves permanently t o take up secure employment elsewhere or migration does no t occur. We expect that seasonal
out-migration of a member would also be an option for srnall households. Landless house- holds, unable to find local employment, will have no choice but to leave their home coni- rnunity and seek econo~llic opportunities elsewhere.
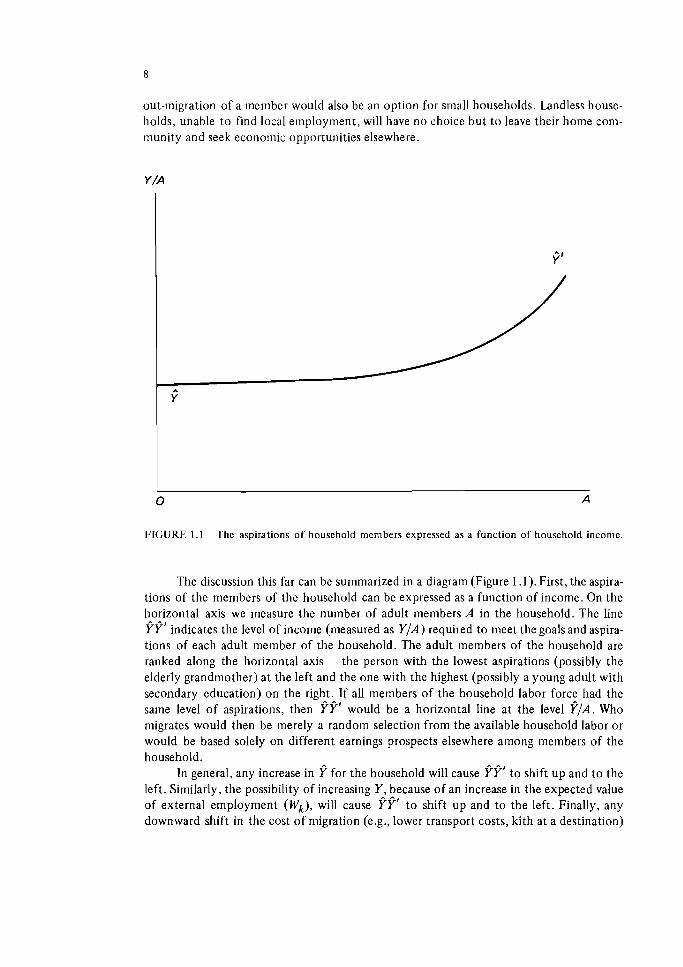
FIGURE 1 . 1 The aspirations of household members expressed as a function of household income.
The discussion this far can be summarized in a diagram (Figure 1 . I ) . First, the aspira- tions of the members of the household can be expressed as a function of income. On the horizontal axis we measure the number of adult members A in the household. The line PP' indicates the level of income (measured as Y / A ) required to meet the goals and aspira- tions of each adult member of the household. The adult members of the household are ranked along the horizontal axis - the person with the lowest aspirations (possibly the elderly grandmother) at the left and the one with the highest (possibly a young adult with secondary education) on the right. If all members of the household labor force had the same level of aspirations, then PP' would be a horizontal line at the level ?/A. Who migrates would then be merely a random selection from the available household labor or would be based solely on different earnings prospects elsewhere among members of the household.
In general, any increase in ? for the household will cause PP' to shift up and to the left. Similarly, the possibility of increasing Y, because of an increase in the expected value of external employment ( W k ) , will cause Pf' to sh f t up and to the left. Finally, any downward shift in the cost of migration (e.g., lower transport costs, kith at a destination)
will cause PP' t o shift up and to the left. Increased migration costs would have the oppo- site effect.
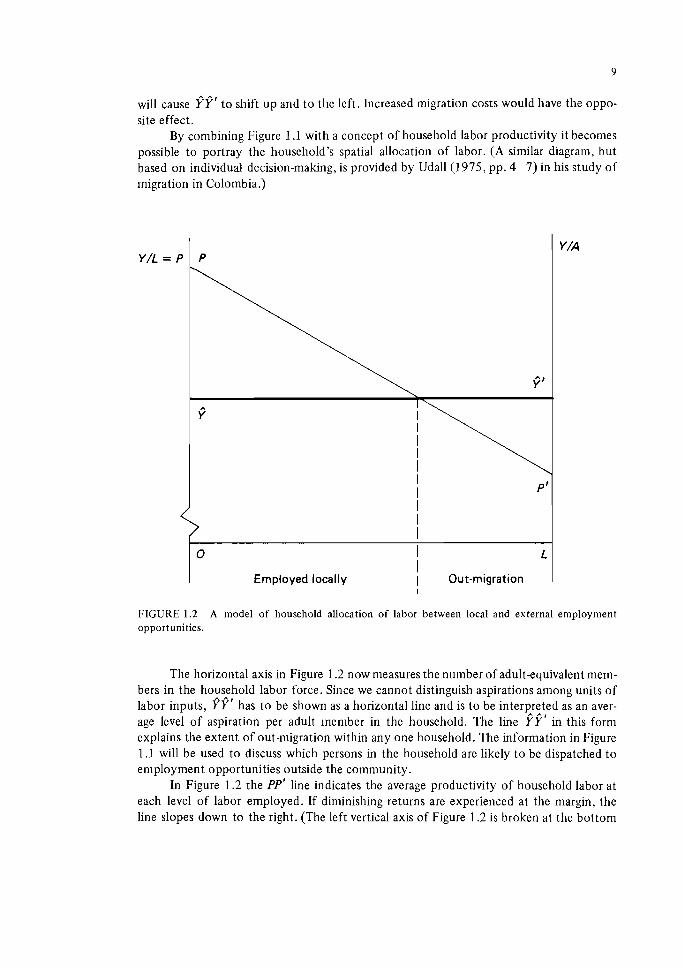
By combining Figure 1.1 with a concept of housellold labor productivity it becomes possible to portray the household's spatial allocation of labor. (A similar diagram, but based on individual decision-making, is provided by Udall (1975, pp. 4-7) in his study of migration in Colombia.)
FIGURE 1.2 A rnodel of household allocation of labor between local and external ernployn~ent opportunities.
The horizontal axis in Figure 1.2 now measures the number of adultequivalent mem- bers in the household labor force. Since we cannot distinguish aspirations among units of labor inputs, PP' has t o be shown as a horizontal line and is t o be interpreted as an aver-
,. ,.# . age level of aspiration per adult member in the household. The line YY in this form explains the extent of out-migration within any one household. The information in Figure 1.1 will be used to discuss which persons in the housel~old are likely t o be dispatched to enlployment opportunities outside the community.
In Figure 1.2 the PP' line indicates the average productivity of household labor at each level of labor employed. If diminishing returns are experienced at the margin, the line slopes down to the right. (The left vertical axis of Figure 1.2 is broken at the bottom
because of difficulties in specifying the output of the marginal unit of labor. If labor pro- ductivity is defined by the labor inputs required over an agricultural cycle, then the mar- ginal productivity of labor cannot be zero in most if not all rural areas in Kenya.) In a peasant-type household, family income is shared so the average rather than the marginal product of labor is relevant for measuring the supply of labor available for use outside of the comnlunity (Knight 1967, p. 239; Gugler 1976, p. 188).
In general, an increase in Y caused by better transport t o facilitate the sellingof out- put and the bringing in of purchased inputs, labor-augmenting technical change, the acquisi- tion of more land or a favorable shift in either household output or input prices will shift PP' t o the right. A downward movement in Y would have the opposite effect.
One complicating aspect of modeling household labor allocation in this manner is that shifts in PP' and PP' are not completely independent of each other. According t o Hutton (1973, p. 100): " . . . such evidence as exists suggests that aspirations d o seem t o be stimulated by rising incomes within a given area." Huntington (1973, pp. 2-3) discusses this in terms of rising rural income (a parallel shift in PP' up and t o the right), creating both a substitution effect (the rural home has become Inore attractive relative t o external alternatives) and an income effect. The latter could increase out-migration (i.e ., cause PE' t o shift up). Specifically, Huntington postulates that the increase in income caused by a spread of the cash economy could create a larger demand for market goods, reduce the cost of migration as the household beconles niore involved in marketing its goods, and provide the type of work experience that would improve the ability of household Inem- bers t o obtain urban employlnent.
This approach t o modeling out-migration (as sunimarized in Figure 1.2) is preliiised on the assumption that migration is the result of purposeful behavior on the part of the rural household. Both the person leaving and the household rneliibers remaining believe that the move will be be~ieficial. With the use of this model an explicit attempt is made to avoid separating the causes of migration as either "push" or "pull" forces. The households are seen to have basically a rural orientation. Any decision t o dispatch liousel~old members t o an urban location is based on perceived income opportunities available there relative t o their local employment. The motives for migration are seen t o be primarily economic, given the way PP' and PP' are defined, but fE' allows for nonecononlic elements as well.
Several possible types of migration are ignored by this approach. First, desperate migration in the wake of natural disaster or armed conflict, both of which may suppress income below an acceptable level (Y < (C + R ) A ) , is not included. In recent years there has been such migration in the Sahel and in areas of prolonged drought or severe flooding in India, Pakistan, and Bangladesh. Armed conflict was sufficiently evident in Colornbia that Schultz (1971, p. 158) chose to enter "interregional differences in the level of vio- lence" as an explanatory variable in his study of migration in Colon~bia. Neither of these forces has been particularly evident in Kenya in the postindependence period. Where they are, out-migration has been primarily t o other rural areas rather than t o one of the towns.
In addition, the people who felt corripelled t o leave theirllome communities because of divorce, disputes, or witchcraft are not covered by this model. Among200 une~nployed nien interviewed at factory gates in Kampala and Jinja (Uganda), ftutton (1973, p. 72) found three who gave such causes as their reason for out-migration. Being an orphan or the death of the last remaining close relative was given more often (seven times). Therefore, whereas we d o not deny such causes of migration, we expect the number of migrants t o
be so small relative t o the total rural-urban flow that they can be omitted in modeling the overall movenlent into towns and cities of Kenya.
THE MIGRATION DECISION-MAKING PROCESS
In the previous section, the decision t o leave a particular community was placed within the context of the household's allocation of its available labor. The summary state- ment , as presented in Figure 1.2, provides the general parameters affecting migration deci- sions within a household.
In this section the household model will be used t o discuss various aspects of the process of deciding whether or not t o migrate to an urban location. Specifically, we will seek t o provide the theoretical basis for answering such questions as: (1) what determines whether migrants leave a household in a rural area; (2) what determines the selection of an urban or a rural destination; (3) what determines which individuals in a household choose a particular urban destination; and (4) what determines whether migrants return, circulate between rural and urban areas, or relocate permanently.
The Determinants of Out-Migration
According t o our model, the average product of labor interacting with the goals and aspirations of the household determines the proportion of the household labor that will leave the rural home area. For a given set of external economic and social opportunities this would imply that in rural areas it is the poorest households that leave: this can be seen clearly in Figure 1.2. For a given household size with a given P P ' , the households with PP' closest t o the origin provide the largest proportion of migrants. Where opportu- nities t o employ the household's labor are severely constrained or the net return on labor employed is very low it is t o be expected that out-migration rates will be high.
Empirically, this result cannot be substantiated. In Kenya, as in other countries (Connell e t al. 1976, pp. 200-201 ; Lipton 1976, p. 1 7 ; Sabot 1975a, pp. 15-16), some of the poorest regions of the country provide a relatively low proportion of the urban in- migrants. (Data for Kenya are t o be found in Tables 3.1 and 3.2. The lowest income areas of Kenya are in the migration source area designated Northern.) There are several reasons.
First, there are differences between households in their goals and aspirations (the position of the PP' line). According t o Hutton (1973, p. 97): "These apparent inconsis- tencies are best looked at in terms of relative aspiration." Aspirations are formed by a household's position in the community and by stimuli external t o the community. In a poor region, with a fairly even distribution of income and limited contact with external sources, it is t o be expected that the position of the P f ' line will be closer t o the Ilorizon- tal axis for all households in the region than it will be in regions with higher income - dis- tributed unevenly - and extensive external interactions (Lipton 1976, p. 5). In addition. the ability of households to fulfill their aspirations will vary inversely with the concentra- tion of wealth and the barriers t o access t o the productive resources of the community. Where access is severely constrained for some households in the community, it will be the poorest households. other things equal, that are most likely to migrate.
But other things are not necessarily equal anlong the households in such a commu- nity. To move t o a place where better opportunities exist is costly. The poorer members of the community, especially those with rent commitments, may not be able t o pay for moving nor be free to seek bettcr opportunities elsewhere (Connell et al. 1976, p . 21). For such households, the most promising (low risk) prospect probably will be t o take up employment opportunities within the richer households that require labor because they have dispatched their better educated young inen to urban employment opportunities.
The Selection of a Destination
According t o our model, out-migration will occur only if net earning opportunities elsewhere are perceived by the household t o be sufficiently better than local sources of income t o more than cover all costs associated with moving. Possibly, a number of loca- tions are perceived t o have better employment opportunities than the home region, but the destination selected is perceived t o have the best opportunities.
The logic of this general position implies that households in one region would all dis- patch their emigrants t o the one location that had the highest earning prospect. Again, this does not occur because of other factors that d o not apply equally across all households.
The dominant factor here is the need t o play the urban employment lottery. "The game is very serious: rural income is foregone, costs are incurred in migration, severe hard- ship is experienced in urban unemployment. But new migrants keep joining in the 'gold rush' prospecting for urban employment" (Cugler 1976, p. 192).
Todaro (1976b, p. 2 15) defines the probability U of a migrant's finding employment in any one urban center in time t as:
where g is the net rate of growth of modern sector employn~ent opportunities in that loca- tion, and u is the rate of unemployment in that urban center. A probability less than one of obtaining an urban job enters a distinct risk into both the decision t o move and the selection of a destination. As a result, the personalities of household members - are they "dynamic risk-taking beings"? (Sahota 1968, p. 220) -- and the household's ability t o finance a risky venture enter into the decision-making. In general, migrations by school- leavers tend t o have a low opportunity cost because the school-leavers are just beginning their working lives, their travel and support costs in town tend t o be low, and their aspira- tions are most likely to be shaped by what towns have t o offer. Therefore, it is to be expected that they will have a relatively high propensity to migrate (Byerlee 1972, pp. 18-19). Whether a school-leaver is likely t o be a sufficient risk-taker t o select an urban destination will depend on several personal factors which will be developed below.
A second element in the decision t o move and in the selection of a destination is the cost of the move. Direct pecuniary costs include the cost of the trip, the income fore- gone while moving and during the job search, and the cost of establishing a place of residence
at the destination. In addition, there may be significant nonpecuniary costs of separation from family and clan.
Costs of income foregone are expected t o be higher for urban in-migration because the cost of establishing a residence will be higher than in the rural areas and the job search is bound to take longer given the urban employment lottery. Therefore, rural jobs that pay less than urban jobs may well be selected by migrants who have limited resources t o finance the move and/or who are risk-avoiders. Indeed, for the poorest rural residents without land " . . . it is often likely t o be the migration of despair, unplanned, uprooting the whole household, and increasingly degenerating into a wandering search for work" (Lipton 1976, p. 17).
A factor that can offset significantly the cost of moving to town are friends and rela- tives (kin) in town who finance the transition into urban life and assist in securing employ- ment. For the unemployed interviewed by Hutton ( 1 9 7 3 , ~ . 83): "It was generally accepted that relatives and tribesmen had a duty t o help each other and i t was therefore inevitable that those without the necessary contacts would have difficulty in finding work."
It has been argued by some that certainty of earning income in the urban informal sector also overcomes the cost and uncertainty involved in selecting an urban destination (Connell et al. 1976, p. 16; Reynolds 1969, p. 91). The role of the urban informal sector in the migration process is deduced from assumptions about the informal sector. These assumptions, and hence the validity of the role of the informal sector will need to be tested empirically.
One final aspect of the role of e~nployrnent opportunities in the choice of a destina- tion is the term and security of the job. Although urban unemployment exists in Kenya, Gwyer (1972, p. 4) reports vacancies for permanent staff on tea and pineapple plantations and openings for casual employees on coffee farms. He argues that the reason for this seem- ing anomaly is the difference in the wages of these agricultural jobs and other formal sector jobs. Wasow (1973, p. 25) suggests that part of the answer is the length of enlployment that the job promises. He observed that interdistrict movement was evident to long-term positions in tea plantation areas but not to the seasonal work on coffee plantations. Hart (1973, p. 78), on the basis of a study in a slum on the outskirts of Accra, Ghana, places primary emphasis on the greater job security inherent in formal sector employment: "Thus, for subsistence purposes alone, regular wageemployment, however badly paid, has some solid advantages; and hence men who derive substandard income from informal activities may still retain or desire fomial employment."
Beyond these economic determinants, there are a variety of other factors that may draw people t o the cities:
. . . it is quite obvious that the more important urban centers offer the better .opportunities for education and training. Furthermore, a whole range of ame- nities not available in rural areas is found in the towns, especially in the capital cities. Such amenities as public housing, pipe-borne water,electricity and medi- cal care are typically heavily subsidized (Gugler 1976, pp. 189--190).
The value that household members place on such amenities probably varies within house- holds. It is in this sense that the level of aspirations of household members P f ' varies as shown in Figure 1 . l .
The Migration Selection Process
The next step required of a theory of migration is t o identify who i t is in the rural areas that decides t o relocate. Given our discussion above on the determinants of out- migration and on the selection of a destination, this part can be limited t o those who decide t o move t o an urban destination. The migration selection process for rural-to-rural migra- tion is no t discussed.
The migration selection process includes the members of a household who move t o an urban location and the households in the rural areas that are likely t o dispatch members t o an urban location. The conscious selection of a destination from a set of possible loca- tions implies that the household has some information on the various locations. Very little is known about the process by which information is transmitted t o rural residents so i t is difficult t o identify the causal role of information o n the selection process. Huntington (1973, p. 5) proposes the following set of hypotheses:
1. Information is scarce and hence an important component in the migration decision.
2. The more information that flows between two areas, the more widely dispersed i t will be over the population of the emigration area . . . .
3. Information is channeled within an ethnic group from one area t o another but not between groups.
As a result, i t is expected that sorne areas, each inhabited by a particular ethnic group, will have more information than others. The propensity for households in any one area t o dispatch mernbers t o particular urban destinations will vary directly with the extent of information available in each area. As proposed by Huntington and cited previously, commercial contact with an urban center is likely to be a prime source of information in an area about that town or city.
In addition t o such general information, specific information about a possible migra- tion destination may be available t o a household from kin who live o r have lived there. Reliance on such personal sources provides extensive information on one or several des- tinations but does no t ensure that the household is well informed o n all possible destina- tions. As a result, a move may be less than optimal for a household, or a decision may be reached not t o move.
Given the important role of information in migration it is t o be expected that some households will seek information from impersonal sources as well. Such a search provides the possibility of obtaining information on a larger range of destinations, serves as a means of verifying information drawn from personal sources, and can provide more information about a destination than the kin who were resident there.
For the purposes of this study we will designate as passive the migrants who drew primarily o n personal information sources. Conversely, the men who relied primarily on impersonal information sources will be designated active migrants. There is n o reason t o believe that households that dispatch active migrants have access to less information of a personal nature than households that dispatch passive migrants.
A second important aspect of the migration selection process is the distribution of skills both within and among households. In general. skills obtained from schooling tend t o
be significantly better paid in urban locations than in rural areas. Therefore, the incentive to acquire information about urban possibilities and t o move to an urban location will vary directly with the amount of schooling. In contrast, skills learned "by doing" in rural areas have a known payoff there but not necessarily a significantly higher return in urban areas. Since experience is gained over time, persons with such skills are likely t o be somewhat older and an urban job search will have larger opportunity costs for them than for school- leavers. Hence skills gained in rural areas need not be transferable t o an urban location.
In addition, the probability of obtaining employment in an urban center will vary directly with the level of schooling completed by prospective migrants. First, their proba- bility of being selected in the urban employment lottery will vary directIy with the amount of schooling. In part this reflects the use by employers of schooling as an indicator o f work habits and the capability of learning more. Second, the better educated can always turn t o lower-skill jobs should they fail t o get the better employment opportunities, while the less well educated d o not have a corresponding range of options.
Beyond these economic effects of education, i t is t o be expected that education affects the values and aspirations of the migrants. Hutton (1973, pp. 71 -72) describes the better educated in her sample as follows: "What they wanted was a good life and for this they felt they had t o have urban jobs which would bring them a steady income and utilize their capacities t o the full. They felt an aversion t o agriculture only t o the extent that they thought they could d o better in unskilled urban work than they could in any capacity in the village." This effect of education can be incorporated into Figure 1.1 by a shift up and
. t o the left of the YY llne which, in turn, would shift PP' in Figure 1.2 upward.
A t h r d aspect of the migration selection process is the role of age. In general, i t is t o be expected that young adults will be most prone t o migrate t o urban areas (Mitchell 1969, p . 178). In part, this reflects the differences between rural residents in the time they have t o collect the difference in expected income from urban and rural jobs. Since this time varies inversely with age, the young adults have a greater incentive t o move. Also, the degree t o w h c h the future is discounted tends t o vary directly with age (Zucker 1967, pp. 538--540). Both of these factors will make the young more willing t o consider the better paying, but higher risk, urban employment opportunities.
Also, farming as a direct income source for young men becomes a viable alternative only when the father provides the land. For some this may occur when they marry; for others only on the death of their father. In the meantime, urban employment opportuni- ties, even in low paying jobs, hold ou t considerably better prospects for the young men than what is available t o them in the rural areas as either an employee or merely another member on the family farm (Hutton 1973, p. 7 1 ; Elkan 1970, p. 520).
Another hypothesis is that time spent in an urban center may carry a degree ofpres- tige bordering on initiation into manhood (evidence on the subject is summarized by Gugler (1969, p. 137), although he does not lend support t o the argument). This explanation implies that the urban stay probably will be temporary and it reduces the importance of differences between age groups in the length of time horizons or rates of discount of the future.
In their study of urbanization in Africa, Hanna and Hanna (1971, pp. 27 and 4 4 ) propose a combination of these possible determinants. Placing primary emphasis on the economic determinants, they also note the social compulsion of the younger generation t o defer t o the elders. Therefore, ambitious youths need t o migrate t o the towns in order t o obtain the freedom t o realize their ambitions.
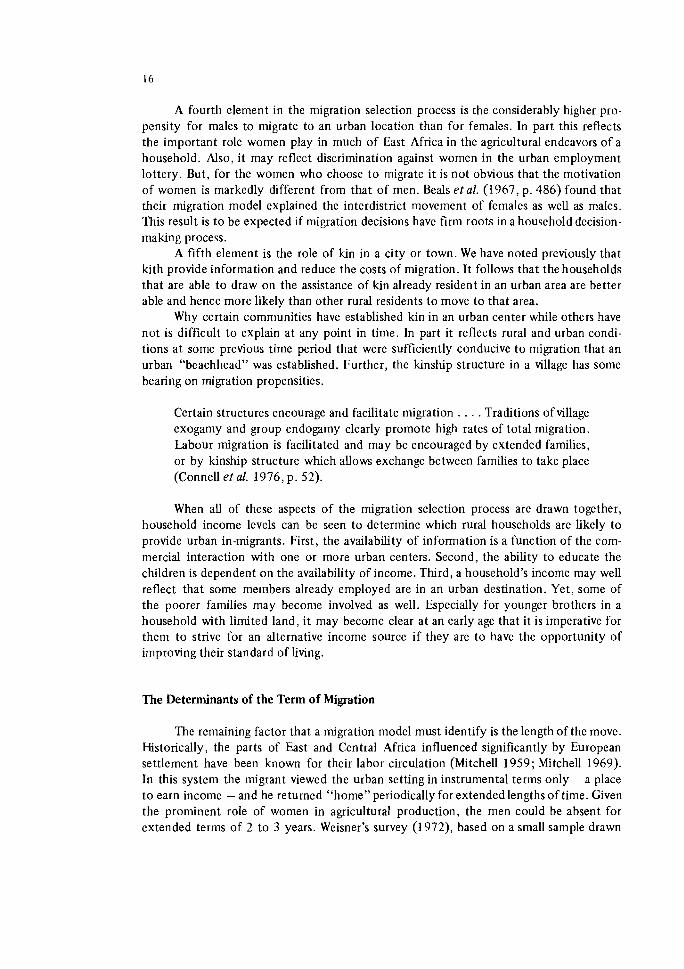
A fourth element in the migration selection process is the considerably higher pro- pensity for males to migrate to an urban location than for females. In part this reflects the important role women play in much of East Africa in the agricultural endeavors of a household. Also, i t may reflect discrimination against women in the urban employment lottery. But, for the women who choose t o migrate i t is no t obvious that the motivation of women is markedly different from that of men. Beds et al. (1967, p. 486) found that their migration model explained the interdistrict movement of females as well as males. This result is t o be expected if migration decisions have firm roots in a household decision- making process.
A fifth element is the role of kin in a city or town. We have noted previously that kith provide information and reduce the costs of migration. It follows that the households that are able t o draw o n the assistance of kin already resident in an urban area are better able and hence more likely than other rural residents t o move t o that area.
Why certain communities have established kin in an urban center while others have no t is difficult t o explain a t any point in time. In part it reflects rural and urban condi- tions a t some previous time period that were sufficiently conducive t o migration that an urban "beachhead" was established. Further, the kinship structure in a village has some bearing on migration propensities.
Certain structures encourage and facilitate migration . . . . Traditions of village exogamy and group endogamy clearly promote high rates of total migration. Labour migration is facilitated and may be encouraged by extended families, or by kinship structure which allows exchange between families t o take place (Connell et al. 1976, p. 52).
When all of these aspects of the migration selection process are drawn together, household income levels can be seen t o determine which rural households are likely to provide urban in-migrants. First, the availability of information is a function of the com- mercial interaction with one or more urban centers. Second, the ability t o educate the children is dependent o n the availability of income. Third, a household's income may well reflect that some members already employed are in an urban destination. Yet, some of the poorer families may beconie involved as well. Especially for younger brothers in a household with limited land, i t may become clear a t an early age that i t is imperative for the111 t o strive for an alternative income source if they are to have the opportunity of improving their standard of living.
The Determinants of the Term of Migration
The remaining factor that a migration model must identify is the length of the move. Historically, the parts of East and Central Africa influenced significantly by European settlement have been known for their labor circulation (Mitchell 1959; Mitchell 1969). In this system the migrant viewed the urban setting in instrumental terms only - a place t o earn income - and he returned "home" periodically for extended lengths of time. Given the prominent role of women in agricultural production, the men could be absent for extended terms of 2 t o 3 years. Weisner's survey (1 972), based on a small sample drawn
from one part of Nairobi and one sublocation in Western Province, presents evidence that such circulation was still occurring recently.
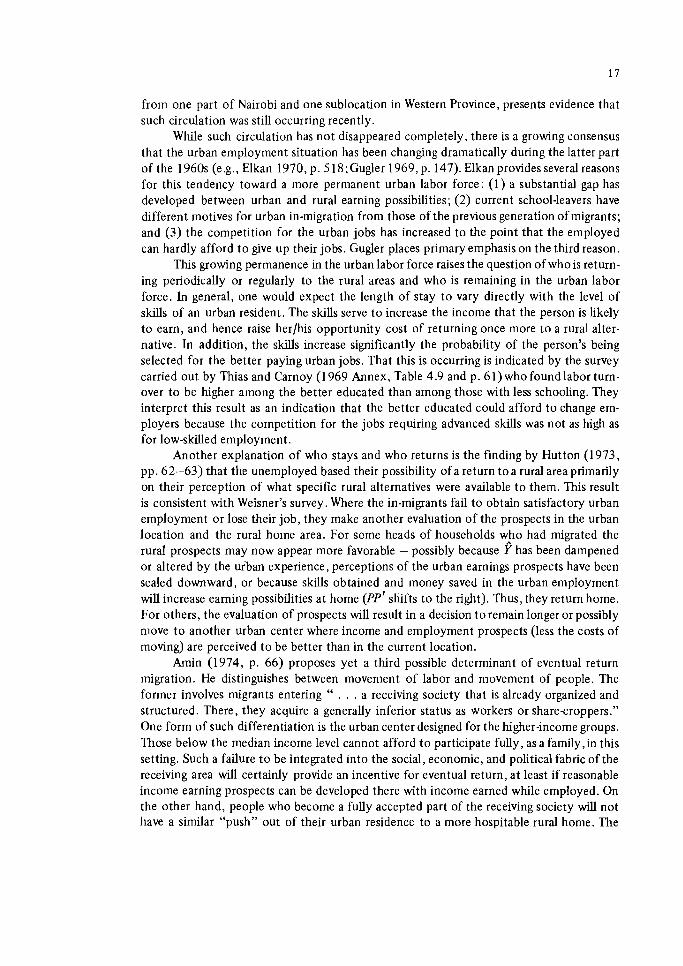
While such circulation has not disappeared completely, there is a growing consensus that the urban employment situation has been changing dramatically during the latter part of the 1960s (e.g., Elkan 1970, p. 5 18;Gugler 1969, p. 147). Elkan provides several reasons for this tendency toward a more permanent urban labor force: (1) a substantial gap has developed between urban and rural earning possibilities; (2) current school-leavers have different motives for urban in-migration from those of the previous generation of migrants; and (3) the competition for the urban jobs has increased to the point that the employed can hardly afford t o give up their jobs. Gugler places primary emphasis on the third reason.
This growing permanence in the urban labor force raises the question of who is return- ing periodically or regularly to the rural areas and who is remaining in the urban labor force. In general, one would expect the length of stay to vary directly with the level of skills of an urban resident. The skills serve to increase the income that the person is likely t o earn, and hence raise her/his opportunity cost of returning once more to a rural alter- native. In addition, the skills increase significantly the probability of the person's being selected for the better paying urban jobs. That this is occurring is indicated by the survey carried out by Thias and Carnoy (1 969 Annex, Table 4.9 and p. 61) who found labor turn- over t o be higher among the better educated than among those with less schooling. They interpret this result as an indication that the better educated could afford to change em- ployers because the competition for the jobs requiring advanced skills was not as high as for low-skilled employment.
Another explanation of who stays and who returns is the finding by Hutton (1 973, pp. 62-63) that the unemployed based their possibility ofa return t o a rural area primarily on their perception of what specific rural alternatives were available t o them. This result is consistent with Weisner's survey. Where the in-migrants fail t o obtain satisfactory urban employment or lose their job, they make another evaluation of the prospects in the urban location and the rural home area. For some heads of households who had migrated the rural prospects may now appear more favorable - possibly because f has been dampened or altered by the urban experience, perceptions of the urban earnings prospects have been scaled downward, or because skills obtained and money saved in the urban employment will increase earning possibilities at home (PP' shifts t o the right). Thus, they return home. For others, the evaluation of prospects will result in a decision toremain longer or possibly move t o another urban center where income and employment prospects (less the costs of moving) are perceived t o be better than in the current location.
Arnin (1974, p. 66) proposes yet a third possible determinant of eventual return migration. He distinguishes between movement of labor and movement of people. The former involves migrants entering " . . . a receiving society that is already organized and structured. There, they acquire a generally inferior status as workers or share-croppers." One form of such differentiation is the urban center designed for the higher-income groups. Those below the median income level cannot afford t o participate fully, as a family ,in this setting. Such a failure t o be integrated into the social, economic, and political fabric of the receiving area will certainly provide an incentive for eventual return, at least if reasonable income earning prospects can be developed there with income earned while employed. On the other hand, people who become a fully accepted part of the receiving society will not have a similar "push" out of their urban residence to a more hospitable rural home. The
failure to be integrated into the destination area and the pull back to the social network of the home area have been modeled by Mitchell (1959).
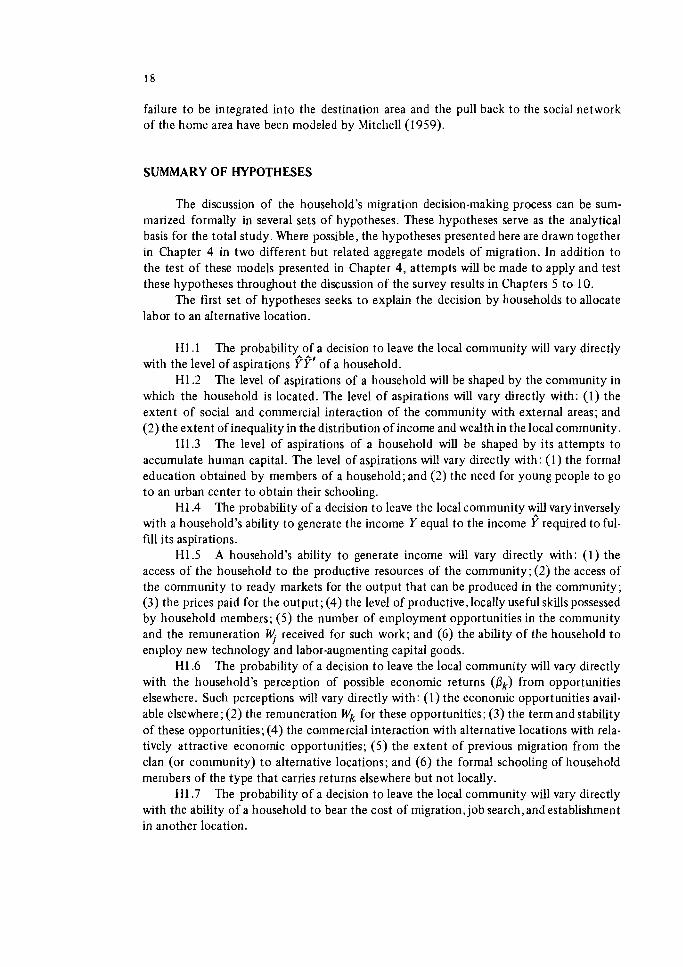
SUMMARY OF HYPOTHESES
The discussion of the household's migration decision-making process can be sum- marized formally in several sets of hypotheses. These hypotheses serve as the analytical basis for the total study. Where possible, the hypotheses presented here are drawn together in Chapter 4 in two different but related aggregate models of migration. In addition to the test of these models presented in Chapter 4 , attempts will be made to apply and test these hypotheses throughout the discussion of the survey results in Chapters 5 to 10.
The first set of hypotheses seeks to explain the decision by households to allocate labor to an alternative location.
I I l . l The probability of a decision to leave the local community will vary directly with the level of aspirations ?9' of a household.
H1.2 The level of aspirations of a household will be shaped by the community in which the household is located. The level of aspirations will vary directly with: (1) the extent of social and commercial interaction of the community with external areas; and (2) the extent of inequality in the distribution of income and wealthin the local community.
t11.3 The level of aspirations of a household will be shaped by its attempts to accumulate human capital. The level of aspirations will vary directly with: (1) the formal education obtained by members of a household; and (2) the need for young people to go to an urban center to obtain their schooling.
HI .4 The probability of a decision to leave the local community ?ill vary inversely with a household's ability to generate the income Y equal to the income Y required to ful- fill its aspirations.
H1.5 A household's ability to generate income will vary directly with: (1) the access of the household to the productive resources of the community; (2) the access of the community to ready markets for the output that can be produced in the community; (3) the prices paid for the output; (4) the level of productive, locally useful skills possessed by household members; (5) the number of employment opportunities in the community and the remuneration 9 received for such work; and ( 6 ) the ability of the household t o enlploy new technology and labor-augmenting capital goods.
H1.6 The probability of a decision to leave the local community will vary directly with the household's perception of possible economic returns (Pk) from opportunities elsewhere. Such perceptions will vary directly with: ( I ) the economic opportunities avail- able elsewhere; (2) the remuneration Wk for these opportunities; (3) the term and stability of these opportunities; (4) the commercial interaction with alternative locations with rela- tively attractive economic opportunities; (5) the extent of previous migration from the clan (or community) to alternative locations; and (6) the formal schooling of household members of the type that carries returns elsewhere but not locally.
H1.7 The probability of a decision to leave the local community will vary directly with the ability of a household to bear the cost of migration,job search,and establishment in another location.
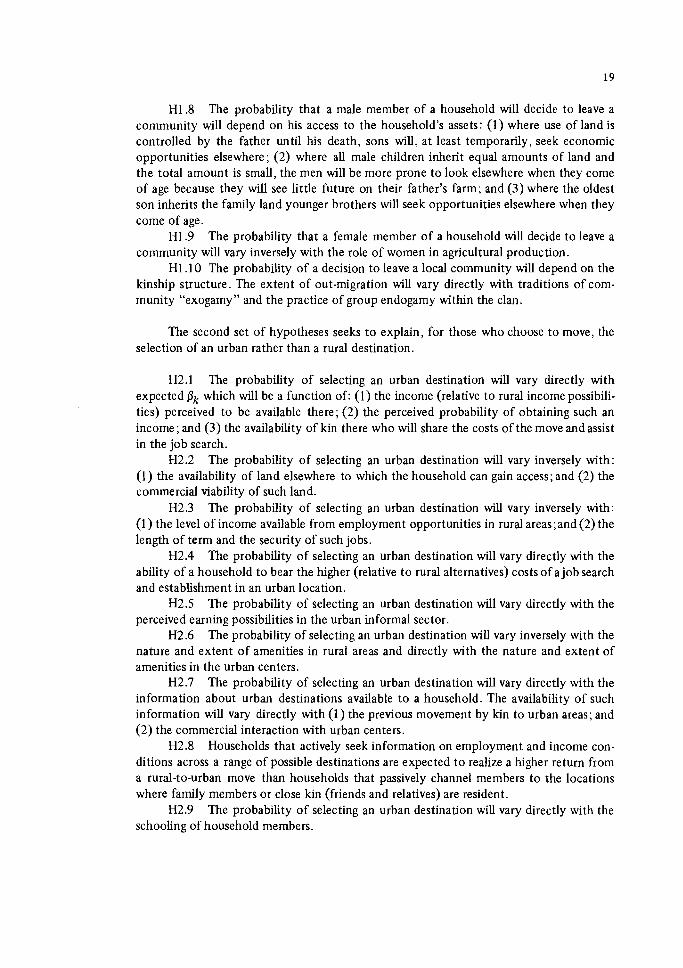
H1.8 The probability that a male member of a household will decide to leave a community will depend on his access to the household's assets: (1) where use of land is controlled by the father until his death, sons will, at least temporarily, seek economic opportunities elsewhere; (2) where all male children inherit equal amounts of land and the total amount is small, the men will be more prone to look elsewhere when they come of age because they will see little future on their father's farm; and (3) where the oldest son inherits the family land younger brothers will seek opportunities elsewhere when they come of age.
H1.9 The probability that a female member of a household will decide to leave a community will vary inversely with the role of women in agricultural production.
H1.10 The probability of a decision to leave a local community will depend on the kinship structure. The extent of out-migration will vary directly with traditions of com- munity "exogamy" and the practice of group endogamy within the clan.
The second set of hypotheses seeks to explain, for those who choose to move, the selection of an urban rather than a rural destination.
H2.1 The probability of selecting an urban destination will vary directly with expected Pk which will be a function of: (1) the income (relative to rural income possibili- ties) perceived to be available there; (2) the perceived probability of obtaining such an income; and (3) the availability of kin there who will share the costs of the move and assist in the job search.
H2.2 The probability of selecting an urban destination will vary inversely with: (1) the availability of land elsewhere to which the household can gain access; and (2) the commercial viability of such land.
H2.3 The probability of selecting an urban destination will vary inversely with: (1) the level of income available from employment opportunities in rural areas;and(2) the length of term and the security of such jobs.
H2.4 The probability of selecting an urban destination will vary directly with the ability of a household to bear the higher (relative to rural alternatives) costs of a job search and establishment in an urban location.
H2.5 The probability of selecting an urban destination will vary directly with the perceived earning possibilities in the urban informal sector.
H2.6 The probability of selecting an urban destination will vary inversely with the nature and extent of amenities in rural areas and directly with the nature and extent of amenities in the urban centers.
H2.7 The probability of selecting an urban destination will vary directly with the information about urban destinations available to a household. The availability of such information will vary directly with (1) the previous movement by kin to urban areas; and (2) the commercial interaction with urban centers.
H2.8 Households that actively seek information on employment and income con- ditions across a range of possible destinations are expected to realize a higher return from a rural-to-urban move than households that passively channel members to the locations where family members or close kin (friends and relatives) are resident.
H2.9 The probability of selecting an urban destination will vary directly with the schooling of household members.
H2.10 The probability of selecting an urban destination will vary inversely with the age of adults in a household.
H2.11 The probability of selecting a particular urban destination will vary directly with the cultural, social, and linguistic similarity between the urban center and the rural source area.
H2.12 The probability of selecting a particular urban destination will vary directly with the number and variety of jobs available there.
H2.13 Where the perceived urban income Wk is inadequate to enable a household to forego rural food production and to support the family in an urban setting, the proba- bility of a rural-to-urban move by a household member will vary directly with the number of adult members in a household's labor force.
H2.14 The probability that a female member of a household will select an urban destination will vary inversely with the discrimination against females in the urban formal sector directly with the nature and extent of urban informal sector employment opportu- nities.
The third set, the personal characteristics that affect the migration process, cannot be separated from the other determinants of migration. As a result, they have been incor- porated into the two sets of hypotheses listed above. The fourth set involves the term of the urban stay.
H4.1 The probability of a "permanent" relocation of a family to an urban area will vary directly with the income Wk available there and the perceived security of employ- ment associated with Wk. Where the relocation becomes permanent any rural-based house- hold members will lose most of the benefits from having a member in urban employment because remittances will be reduced to sporadic contributions.
H4.2 The probability of a decision to remain in town will vary inversely with the rural opportunities that exist or can be obtained.
H4.3 The length of an urban stay by males will depend on: (1) whether the imme- diate family remains t o take care of the sharnba (family land); and (2) the respective roles of males and females in agricultural production.
H4.4 The length of an urban stay will vary directly with the degree of social and political acceptance obtained by the migrant in herlhis chosen destination.
2 THE KENYAN SETTING
The growth of both rural-urban migration and urban unemployment occurred as a result of the historical, demographic, and economic realities of the Kenyan economy. Therefore, prior t o our analysis of the migration data, we will describe the most relevant aspects of this Kenyan setting. The first part of the chapter focuses on the lustorical evolu- tion of the employment situation: it was shaped at first by colonial decisions and actions and then by the response of the business community and the government t o the Mau Mau emergency. Following this historical sketch, the setting relevant t o the migration, as sur- veyed in December 1968 and reported in the 1969 census, is discussed. The growth of the economy and changes in the structure of production and employment in the postindepen- dence period up to the time of the survey and census are outlined, and the growing public concern over the unemployment problem is documented. Developments in Kenya subse- quent t o 1969 are discussed in Chapter 1 1.
The map of Kenya (Figure 2.1)indicates the current provincial and district boundaries and the location of the eight urban centers included in the survey. The bulk of Kenya's economic activity is located in Western, Nyanza, and Central provinces, and in parts of Rift Valley, Eastern and Coast provinces. The northern half of Kenya, much of Coast Province, and some parts of southern Rift Valley and Eastern provinces receive insufficient rainfall t o support more than limited agricultural activity.
THE HISTORICAL SETTING
Colonial Rule
The determinants of the observed pattern of rural--urban migration reported in this study have their roots in the colonial period. At an early stage in the colonial period a decision was made t o allow European settlement in the Protectorate of Kenya. Although the size of the European settlement, relative t o the African population, was small, this European minority dominated political and econoinic development in Kenya in the twen- tieth century. Brett (1973, pp. 161- 171) asserts that British commitment t o settlement was no t "overwhelming" but sufficiently strong t o ensure the continued "viability of set- tler agriculture."
The economic domination by the settler community included alienation of land, setting up of limits on access for Africans t o econo~nic opportunities, actions t o obtain needed African labor for European endeavors, and the importation of Asian workers from India and a subsequent restriction of their access t o economic opportunities. Each of these factors will be discussed in turn.
The British colonial policy appears t o have had at least two identifiable goals: the colony was t o pay for itself and colonial acts were t o be beneficial t o the indigenous
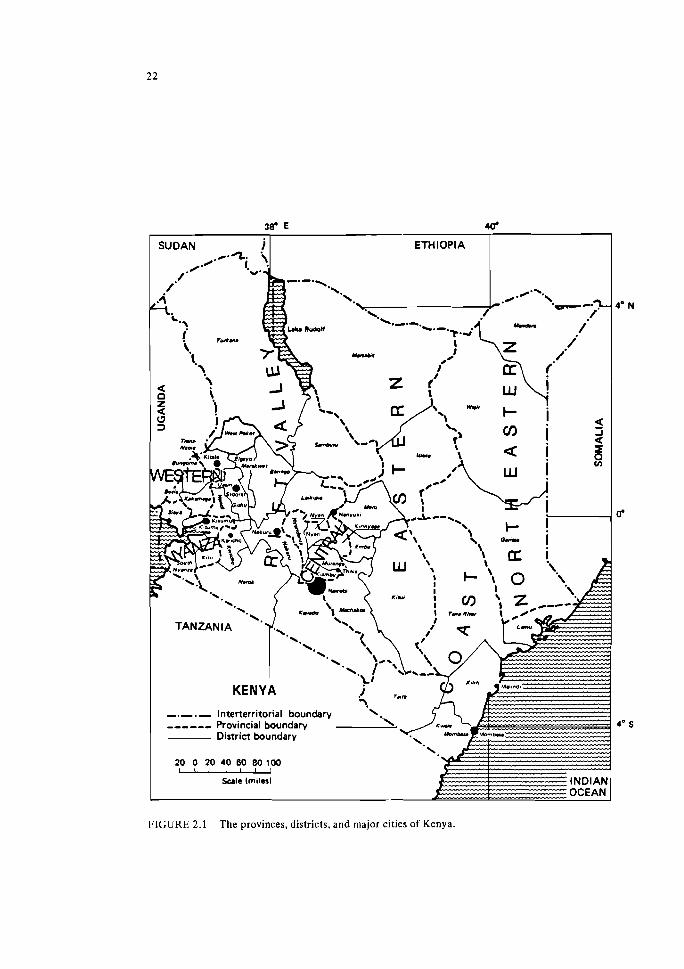
FIGURE 2.1 The provinces, districts, and rnajor cities o f Kenya.
population. The inducement of European settlement and the subsequent protection and stin~ulation of production by the settlers made the first goal a reality (Van Zwanenberg 1972a, p. 28). The presence of the settlers and their importance to the colonial administra- tion frequently gave the European minority the power to define what was beneficial for the Africans. Although the exercise of this power is evident with reference to all four factors mentioned above, it was most noticeable in the alienation of African land for European use.
By the end of 190 1, the Uganda Railway, which made European farming of the Kenya highlands economically feasible, was completed to Lake Victoria at ksumu. Pre- viously, in 1897, the colonial administration had barred the alienation of land if such action was injurious to native interests (Ross 1927, p. 48). In 1901, by order-incounci1,purchase of land by Europeans became possible, but some protection was provided for Africans in that only land not occupied could be so alienated (Ingham 1965, pp. 2 12-2 13). A com- bination of several factors prevented the effective use of this protection against the aliena- tion of native land. First, a severe smallpox epidemic had significantly reduced the Kikuyu population of Kiambu (Ingham 1965, p. 2 14), and a civil war, a smallpox epidemic, and rinderpest among the cattle had reduced the numbers and the fortunes of the Masai (Ros- berg and Nottingham 1970, p. 4). As a result, at the turn of the century the land use by both the Kikuyu and the Masai was lower than it had been earlier. Further, the Kikuyu practice of shifting agriculture and the Masai reliance on grazing animals made it appear that land important for their existence over time was sometimes lying idle. Therefore, when several hundred farmers from South Africa arrived in Nairobi in 1904 demanding land immediately, the surveyors did not take time to establish whether land that appeared to be vacant was actually unoccupied (Ingham 1965, p. 213). Once considerable land in Kiambu district had been alienated, the 1901 order-incouncil was interpreted quite liber- ally: some Kikuyu villages were included in the land alienated for the benefit of Europeans (Ross 1927, p. 51).
A second phase of land policy was undertaken in 1906 when four native reserves were created. In addition to defining land areas for the major tribes, this action removed the Masai from the choice farming land in the Rift Valley, which had a climate suitable for Europeans (Ingham 1965, pp. 214-215). Unfortunately for the Africans, the land policy did not provide them with a title to their lands in the reserves. Asa result more land from these reserves could be alienated as required for European settlement. For example, in 1920, 50 square miles of land was taken from the Nandi whenmore World War [veterans than anticipated responded to an invitation to settle in Kenya (Ross 1927, p. 77).
The definition of the size of native reserves appears to have embodied the principle enunciated by John Ainsworth before the Land Committee of 1904-1905 (Rosberg and Nottingham 1970, p. 156). He stated that the basic requirement was to provide enough land for the existence of the natives plus what might be needed for a reasonable increase in the numbers of a tribe. Initially, the colonial action did little more than limit in principle the amount of land available, but after 1920 Africans, especially the Kikuyu, began to experience land shortages (Van Zwanenberg 1972a, p. 12). By the early 1930s the shortage of land in the reserves and the insecure position of the squatters on European lands created sufficient political pressure that a new Kenya Land Commission had to be convened. According to Rosberg and Nottingham (1970, p. 156), this commission did no more to meet the concerns of the Kikuyu for secure access to more land than implement the Ains- worth position as placed before the 1904-1905 Land Committee allnost 30 years earlier.
The strong Kikuyu concerns on the land issue emerged from the growing awareness that land was the sole remaining means to a livelihood above a subsistence level in a settler- dominated economy. This position was articulated as early as 1924: "Deprived of our land, we Kikuyu should be dispossessed wanderers, dependent upon the Whiteman for home and livelihood" (this quote is from testimony before the Ormsby-Gore Commission, as pro- vided by Rosberg and Nottingham (1 970, p. 89)). Alternative avenues for realizing social and economic development had been cut off by the settler-dominated colonial administra- tion. These restrictions included limitations on what crops could be grown by Africans, less access for Africans than Europeans to markets for farm output, and,in the early years, the limiting of formal education for Africans to that provided by missionaries.
By the 1930s it was becoming evident that the land in parts of the native reserves was deteriorating rapidly but the colonial administration attributed this to overstocking, not to excessive population pressure (Rosberg and Nottingham 1970, p. 167). At the same time large tracts of land claimed by the Europeans were not used for agricultural purposes (Van Zwanenberg 1972a, p. 8). Not only were Africans denied access to this vacant land, they also were prevented from growing such cash crops as coffee, tea,and pyrethrum. Fur- ther, access to grade cattle (cattle of a slightly improved quality over indigenous cattle) or sheep with better wool was limited (Ross 1927, p. 100). This did not mean that Africans were excluded completely from the export market. Prior to World War I, Africans provided more than half of the total protectorate exports in the form of hides, skins, wattle, and cotton, and they produced most of the maize used domestically (Ingham 1965, p. 222). The production of these cash crops provided some farmers in the reserves with the means to acquire more land which increased the extent of landlessness in the reserves.
Unequal access to markets took the form of a road and railroad network to service the European areas without a comparable investment for the natives. Also, rail transport of maize was subsidized from colony revenues. Prior to 1936 this was of benefit t o Euro- peans only because African-grown maize was not graded, which was essential for exporta- tion (Van Zwanenberg 1972a, p. 18). Further, African agriculture provided the bulk of Kenya's food, plus some exports, but its contribution was less than its potential because colonial investment in improving farming techniques was limited almost exclusively t o the settler areas. Support for education for Africans was limited to one technical school plus subsidization of the instruction of some technical courses in the missionary schools (Ingham 1965, p. 364). Finally, Africans, under the guise of protecting them from indebtedness, were prevented from obtaining capital through borrowing.
The stated intent for these limitations ofAfrican access to economic opportunities was t o protect the African and preserve his traditional way of life. Regardless of the intent, the effect was to reinforce the various European efforts to obtain the needed African labor without paying the price necessary to attract a sufficient supply of labor. These policies to obtain African labor have shaped the current urban situation and the pattern of rural- urban migration.
The need for more low-cost African labor in the European sector of the protectorate was evident as early as 1907. Initially the government resisted usingcoinpulsion to provide adequate supplies of labor. According to Rosberg and Nottingham (1 970, pp. 20-21), the colonial administration accepted the position that the role of the African in the economy was to be confined to providing wage labor. This decision arose from a need for rapid growth, based on White settlement, plus the assumption that Africans would be more
productive working for Europeans than they could be in their own areas. (Brett (1973, p. 45) carries this one step further to encompass the social realm as well. "Since Africans could only benefit from what Europeans brought with them, no special guarantees were required to ensure that their interests were safeguarded; instead the Europeans could be exclusively entrusted with running of the country in accordance with their superior scale of civilized values.") The adoption of this policy on the role of the African in the economy shaped the government policy on access to economic opportunities discussed above.
The use of monetary incentives to induce an adequate labor supply was rejected because Africans were thought to be unresponsive to changes in money wages. A series of taxes - poll tax, hut tax, and then import duties on goods demanded by Africans - were introduced, and subsequently increased when more labor was required. The poll tax and the hut tax were increased by one-third in 1920 to 1921, which coincided with the rapid increase in the demand for labor caused by the influx of European settlers (Rosberg and Nottingham 1970, p. 45). Although the expressed purpose of these taxes was to raise rev- enue, The Commission Report by Lord Moyne in 1932 indicated that Africans received few benefits from their substantial contribution to the colony's tax revenue (Ingham 1965, p. 337).
More direct means for supplying adequate labor were passed in 1915 and iniple- mented in 1919 in the form of the kipende system. The kipende made it mandatory that all African males were to be registered and required each to carry with him a paper contain- ing a fingerprinted copy of his employment record. The expressed purpose of the kipende was to ensure that Africans had provided their given number of days of service to the gov- ernment in the reserves, but it also served effectively to control the provision of labor to the settlers. Men who escaped from undesirable employers could be traced with this system and punished for breach of contract (Arnsden 1971, p. 8). This provision of labor under conditions requiring control had become a reality under a labor circular signed by Sir Edward in 1919, instructing government officials to use "every possible lawful influence" to ensure adequate labor supplies. For the chiefs implementing this instruction the dis- tinction between influence and force was not obvious (Rosberg and Nottingham 1970, pp. 60--61).
Although the Europeans preferred nonwage means for obtaining adequate labor sup- plies, they were not able to prevent some employers from increasing wages during periods of rapid economic expansion. An alternative use of wages was concerted action by employ- ers to reduce all wages, which produced more labor, given the level of cash requirements for tax purposes. By 1952 the average wage for unskilled labor was KShs.25 per month, which was considered to be inadequate to provide for the basic needs of a worker (Rosberg and Nottingham 1970, pp. 204-205). A government committee set up in 1952 to study African wages indicated that many Africans received an "inadequate wage" for the work they performed.
One of the more effective means for obtaining labor at low cost was to have Africans live on the European estates with their families and a limited number of cattle. Large num- bers entered into such "squatting" relationships, especially the Africans whose land had been alienated. This approach to the problem was altered somewhat by the Kenya Land Commission Report, accepted by the British government in 1938, which argued for more intensive land cultivation in the European areas based on increased European immigration and a large mobile African labor force. The Africans were to serve their time in the European
areas but their roots, family, and cattle were t o remain in the reserves and the laborers were expected t o retire there.
This concept of African labor prevailed also in the urban areas throughout most of the colonial period. h t t l e concern was shown for the well-being of the workers, few ameni- ties were provided, and few provisions were made for family living in the African sections of the towns (Van Zwanenberg 1972b, p. 14). In this setting the urban workers could not improve their productive capability nor could they develop a permanent urban way oflife.
The African found himself trapped in a vicious circle. It was assumed that his productive capacity would have t o rise in order t o bring about real wage increases, but the low wages paid inhibited him from acquiring the train- ing for the skills necessary for higher productivity.
One inherent consequence of this low wage economy was that nearly all African workers had t o maintain an economic, social, and political stake in their own tribal areas in order t o meet the minimum requirements of sustenance and security for themselves and their families (Rosberg and Nottingham 1970, p. 205).
Therefore, prior t o independence, even though a number of Africans were employedin the towns at any point in time, it was not possible t o speak of an urban, African labor force.
As a footnote t o this discussion some mention should be made of the role of the Asians in the development of Kenya. Indians were active traders living on the coast of East Africa before Europeans became interested in the area. The Asians moved inland t o trade with the natives as the British opened administration stationsinside the territory. However, the goods traded were not Indian but primarily British and in some cases American; they were usually obtained from India. There was a significant influx of Asians during the con- struction of the Uganda Railway, but the majority left after it wascompleted. The Uganda Railway, however, continued t o be dominated by Asian employees as clerks, ticket agents, and the like (Ross 1927, p. 300). Racial agitation by Europeans against Asians began early in the century as the settlers feared economic competition from Indians. Thus i t was very difficult for Asians, even though they outnumbered the Europeans by more than three t o one in 1948, t o obtain farm land in Kenya and i t was impossible for them t o obtain land in the "white highlands." Urban areas were racially divided and Asians did not receive similar consideration t o that of the Europeans in the provision of such amenities as sanita- tion and education. In urban employment Whites received the highest wage for a given job, Asians received less, Africans the least. Entrance t o some professions was restricted t o Whites as were some types of business. The one activity in which Asians maintained a monopoly was rural trade. Their activities in native areas, with their wholesale contacts, made conlpetition from Africans inlpossible. (An example of the inability of Africans t o c o ~ n p e t e with the Asian traders is cited by Marris and Somerset (1971, Ch. 2 ) in their description of African trade in Mahiga, Central Province.)
Postindependence Developments
By the beginning of the 1950s the pressure on land in the reserves. the income and wealth disparity between the Europeans and the Africans, and the effect of the denial of
access to the economic opportunities that made the European way of life possible had reached crisis proportions. In part, this crisis was fueled by the broadened awareness of Kenyan soldiers returning from abroad and the taste of a better life by smaU-scale farmers made possible by rising prices during the war (Hunter 1969, p. 1 16). Political independence was not realized for another decade, but the colonial policies toward Africans, as outlined in the previous section, were changed significantly during the emergency of the 1950s. Land reform was initiated, education for Africans was supported by the government, the basis for industrial unions was laid (Sandbrook 1975, p. 33), and minimum wage levels were legislated. Political independence in late 1963 allowed the acceleration of the policies initiated during the emergency. Further, there were more opportunities for Africans to claim land in the "white highlands" and to replace noncitizens in the high-wage adminis- tration and technical jobs. With the opening of high-wage jobs in the urban areas, follow- ing the removal of controls on urban in-migration in 1959, rural-urban migration increased to a level beyond the absorptive capacity of the urban economies (International Labour Office 1972, p. 85). By the time of independence, migration resulting in urban unemploy- ment was an established pattern.
The need for land reform and increased access for Africans to land were especially obvious by the time of the Mau Mau emergency. The colonial response was the Swynnerton Plan, developed in 1954 and initiated shortly thereafter. The aim of the plan was "to pro- vide 600,000 African economic farming units and raise the productivity of each unit from present sales valued at mere £5 to £20 per family to £100 a year or more after providing for the needs of the family" (Swynnerton 1954, p. 12). African farmers were to be pro- vided with secure tenure to a plot of land of economic size and the technical, educational, financial, and marketing assistance to grow "high-priced cash crops for which a long-term demand is probable" (Swynnerton 1954, pp. 8-9). By the time of independence much of the agricultural land in Central Province had been appropriately registered. This approach to land reform has been continued after independence and the amount of land registered has increased from 3 percent in 1963 to 8 percent in 1968. These percentages were calcu- lated from Central Bureau of Statistics (1969, p. 80; 1973, p. 79). Since 1966 the quantity of coffee produced by smallholders has exceeded that produced by the large estates (Cen- tral Bureau of Statistics 1969, p. 70).
The result of the Swynnerton Plan, which enabled Africans to purchase and sell land, was to create landed and landless classes in the rural areas. Although settlement schemes were initiated by the colonial administration during the 1950s, their use has been expanded considerably since independence, providing land in the former European areas for some of the landless. The number of hectares purchased for settlement schemes increased from 173,813 in 1963 to 513,849 in 1968. By 1968, 33,131 families had been settled on 127 schemes producing agricultural output from a variety of crops valued at £2,425,729 (Cen- tral Bureau of Statistics 1969, pp. 78 79) .
A second important grievance leading to the emergency was the low level of wages. Labor unrest under conditions of labor shortages during World War I1 forced the colonial administration to consider changes. A Commission of Inquiry in 1939 found that 52 per- cent of the railway staff in Mombasa received KShs.20 a month, and many of them received no housing. Mombasa Municipality road laborers received KShs.16 a month and lived in quarters that had been condemned (Rosberg and Nottingham 1970, p. 184). In 1944 minimum wages were introduced in Nairobi and in 1946 they were extended to Mombasa. Although it was recognized as early as 1946 that the minimum wage had to include some
provision for supporting a family, it was not formally recommended until 1954 and not effectively implemented prior t o independence (Hunter 1969, p . 121). As of 1962, the minimum wage in 13 towns for an adult male was only 45 percent above that for a youth or a single woman, although housing allowances were doubled for men if they were over 21 years of age (International Bank for Reconstruction and Development 1963, p. 21 8). From 1959 t o 1963 the minimum wage for adult males in Nairobi and Mombasa increased from KShs.95 t o 1 15 a month while housing allowances increased from KShs.24.5 t o 35. In the smaller towns the comparable increases were from KShs.92.5 t o 109 for wages and from KShs.20.5 t o 26 for housing allowance (Central Bureau of Statistics 1966, p. 216). Postindependence action was not immediate, but in 1967 minimum wages for males 18 years and older were set a t KShs.175 per month in Nairobi and Mombasa, and KShs.160 per month in other towns. For Nairobi employees this represented a 5 percent real increase in minimum wages. (The Wage Earner's Consumer Price Index increased during this period from 101 in 1 9 6 3 t o 1 1 2 i n 1967.)
Of greater significance than these changes in minimum wages has been the increase in wages for Africans. Although n o supporting data are provided, Hunter argues that in the mid-1950s there was little o r no difference in real earnings between urban and agricul- tural workers (Hunter 1969, p. 121). Wages had risen significantly in the towns during the first half of the 1950s, but the increases had done little more than offset price increases during the same period (Amsden 197 1 , p. 14). The Carpenter Report of 1954 advanced a formal argument for a high-wage economy as a means of achieving a more stable labor force (Hunter 1969, pp. 121 -1 22). The inclusion of family responsibilities in calculating the minimum wage was part of this argument.
Within large "modern" manufacturing firms the movement t o a high-wage, limited- size labor force was evident from the 1950s onward. It took the form of more capital inten- sive production plus the reorganization of operations where attempts were made t o reduce labor turnover and supervision costs by providing on-the-job training and offering relatively attractive wages t o Africans with some education and vocational training (Hunter 1969, p. 120). Therefore, during the 1950s there emerges, even among Africans, what has been termed an "aristocracy of labor" receiving wages significantly above the level of the vast majority in either unskilled jobs or in more traditional industries (Van Zwanenberg 1972b, p. 16). Even with this improved status for Africans with some education, prior t o indepen- dence their mobility upward into the high-paying jobs held by Europeans and Asians was severely inhibited (Rosberg and Nottingham 1970, pp. 352--353). Access t o these jobs was increased after 1967 when a policy of Kenyanization was instituted.
This improvement in employment opportunities for some Kenya Africans from the late 1950s onward was made possible by the colonial administration's acceptance of some responsibility for providing education for Africans. In the decade up t o 1962 the enroll- ment of African primary pupils increased from 333,000 t o 800,000. African enrollment in Standards V t o VIII increased from 7,600 in 1958 t o 156,000 in 1961, and entrance into secondary schools doubled between 1957 and 1961 (International Bank for Recon- struction and Development 1963, pp. 224-230). This improved access for Africans was much accelerated after independence. In 1968 there were 1,2 12,680 Africans enrolled in primary school, 101,361 in secondary school, 6,634 in teacher training schools, 8,637 in technical o r vocational secondary schools, and 1,605 in the University of Nairobi. From 1963 t o 1968 the percentage increases in enrollments were: primary schools - 36;
secondary school - 169; teacher training - 61 ; technical and vocational - 393; and uni- versity - 242 (Development Plan : 1970-1 974 (1 969), p. 45 1). Using the percentage passes of the external exams for the Cambridge School Certificate and Higher School Certificate as a unit of measurement, the quality of secondary school education does not appear to have deteriorated during this period of rapid expansion.
Along with the advancementof Kenyan Africans as employees there emerged the need for setting up machinery for handling labor disputes. Official recognition of unions dates back to World War 11, although effective concerted action by a group of employees dates back at least to the Mombasa strike of 1939. By 1961 the Kenya Federation of Labour and the Federation of Kenya Employers cooperated to form a National Joint Consultative Council as a voluntary means of heading off strikes or lockouts (Hunter 1969, p. 134). One year later these voluntary arrangements were formalized somewhat in the Industrial Relations Charter. As a means of handling labor disputes these arrangements were of limited success because more man-days were lost because of strikes during 1962 than during the whole period from 1948 to 1959 (Amsden 1971, pp. 74-77). The increased power of unions was evident in that some 50 percent of the 1962 strikes were over issues that the Federation of Kenya Employers considered non-negotiable.
In 1964, as a part of a larger program to stabilize the employment situation, the government established the Industrial Court. Disputes that could not be resolved through normal collective bargaining and conciliation channels were to be referred to the court. For many disputes it had no direct power because its decisions became binding only if they were accepted by both sides in the dispute, except in cases involvingessential services (Hunter 1969, p. 136).
The effect of unions in the postindependence period has been to maintain, if not increase, the income disparity among different wage groups. Unionization has had this effect because only some employees, primarily in the urban centers, are effectively repre- sented. Also, among unionized employees there are differences in the capability of unions to demand and receive wage increases from firms with an ability to pay. Conversely, the Industrial Court has reduced wage differences among unionized employees in part because of a tendency to award a fixed sum increase for all employees rather than a percentage increase (Ghai and Hollen 1968, pp. 7-10). For all employees the court probably has increased income disparities because the need to hand down decisions acceptable to both parties has tended to promote wage increases for employees who are involved in bringing disputes before the court.
Therefore, by the time of our migration survey, there existed in the larger towns a small but relatively high-wage labor force. The report of the 1967 Public Service Salaries Review Commission (1967, p. 23) estimated that earnings in the towns in 1965 were on the average approximately twice the total earnings of farmers. This portion of the econ- omy was characterized by a slow rate of growth in new employment opportunities and a declining rate of labor turnover (Thias and Carnoy 1969, pp. 57 and 61). The result was an increased inducement to migrate into the towns but a decliningprobability for a migrant to obtain one of the high-paying jobs. The government had furthered the likelihood of migration into urban unemployment through its rapid expansion of education facilities, but had not changed the structure of the economy to enable the absorption of this grow- ing labor force in meaningful employment.
. . . Kenyan attitudes and aspirations had perhaps been moulded more than was realized by the style and ethos of the divided economy, by the colonial experience of having t o accommodate oneself and t o work within the existing structure of the economy rather than t o change it . Thus, when national inde- pendence was achieved the political aim of taking over the economy became merged almost imperceptibly with individual aspirations to take over the jobs, positions and life styles which the economy made possible (International Labour Office 1972, p. 87).
DEMOGRAPHIC FACTORS
According t o the 1969 census the population of Kenya was 10,942,705, of which 9 8 percent was designated as African. As in other developing countries, the rate of popula- tion increase has been rapid: 3.4 percent annually from 1948 t o 1969. The average rate for Africans increased from 3.3 percent during the 1948 t o 1962 period, t o 3.6 percent from 1962 t o 1969. This increase in the rate of population growth was offset by a decline during the 1962 t o 1969 period of 4.5 percent annually for Europeans and 3.4 percent for Asians. From 1948 to 1962 both groups were increasing at annual rates of 4.5 and 4.2 percent. The decline of the European population was evident throughout the 1962 t o 1969 period, but the decline of the Asian population only started in 1967 (Central Bureau of Statistics 1972, p. 13). This indicates the magnitude of the Asian exodus during the last 2 years t o produce an average decrease of 3.4 percent a year over a 7-year period.
The population indigenous t o Kenya is frequently divided into five major ethnic groups. As indicated in Table 2.1, the dominant group is the Central Bantu; they com- prise the Kikuyu of Central Province and the Meru, Embu, and Kamba of Eastern Province. The other two Bantu groups are the Western Bantu, which include the Luhya of Western Province and the Kisii and Kuria of Nyanza Province, and the Coastal Bantu located along Kenya's southeastern coast. The Nilotic group is the Luo tribe,located primarily in Nyanza Province. Among "other Kenyan" are included various tribes in Rift Valley Province, including the Masai and the nomadic tribes of northern Kenya.
Just over 8 percent of Kenya's population was enumerated as resident in the eight urban centers under consideration. The majority of the population that is not indigenous t o Kenya is urbanized but accounts for only 3 percent of the total population. Above average urbanization is evident among the Coastal Bantu, located almost exclusively in Mombasa, and the Central Bantu. Both Nairobi and Mombasa draw from the full range of ethnic groups, while Nyeri, Nanyuki, and Thika are quite limited in the range of migrants that they attract. The presence of significant numbers of all ethnic groups, with the possible exception of the Coastal Bantu, in Rift Valley Province is an indication of the in-migration froin Central, Western, and Nyanza provinces as many Europeans and Asians departed.
More detailed information on interprovincial migration can be obtained by considera- tion of data on place of birth as reported in the 1969 census. As indicated in Table 2.2, 1 ,3 11,790 people were born in a province other than the one in which they were enumer- ated. An additional 158,692 were born outside of Kenya. The two most important receiv- ing provinces are Rift Valley and Nairobi. But, Nairobi is also the second most important sending province, next t o Central Province. If net interprovincial movements are considered,
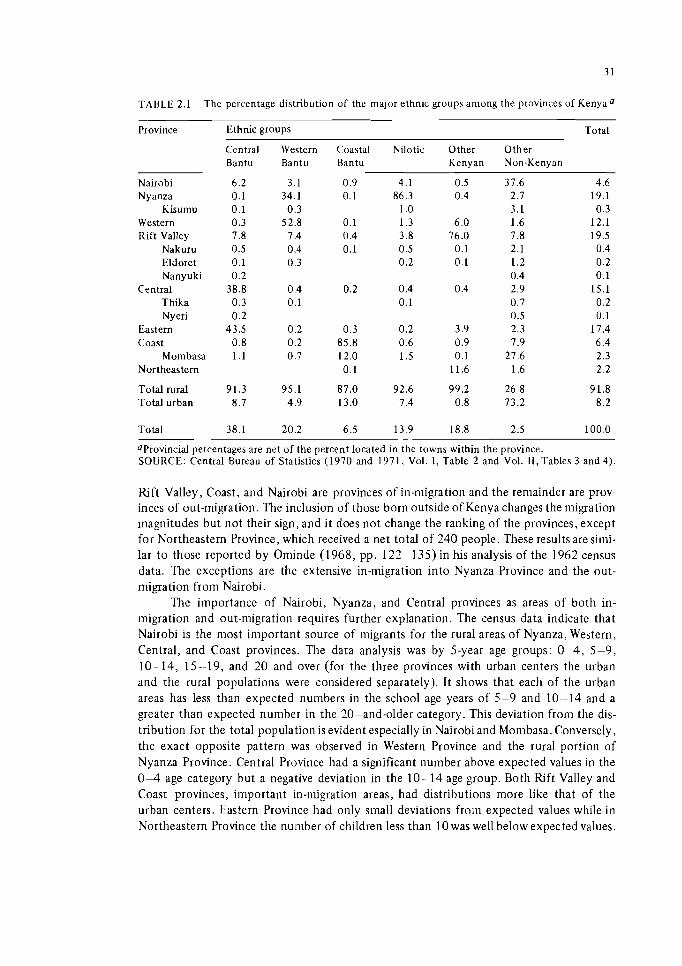
TAHLE 2.1 The percentage distribution of the major ethnic groups anlong the prdvinces of Kenya0 - -
Province Ethnic groups Total
Central Western Coastal Nilotic Other Other Bantu Bantu Bantu Kenyan Non-Kenyan
Nairobi Nyanza
Kisumu Western Rift Valley
Nakuru Eldoret Nanyuki
Central Thika Nyeri
Eastern Coast
Mombasa Northeastern
Total rural Total urban
Total
0Provincial percentages are net of the percent located in the towns within the province. SOURCE: Central Bureau of Statistics (1970 and 1971, Vol. I , Table 2 and Vol. 11, Tables 3 and 4).
Rift Valley, Coast, and Nairobi are provinces of in-migration and the remainder are prov- inces of out-migration. The inclusion of those born outside of Kenya changes the migration magnitudes but not their sign, and it does not change the ranking of the provinces, except for Northeastern Province, which received a net total of 240 people. These results are siini- lar t o those reported by Ominde (1968, pp. 1 2 2 135) in his analysis of the 1962 census data. The exceptions are the extensive in-migration into Nyanza Province and the out- migration from Nairobi.
The importance of Nairobi, Nyanza, and Central provinces as areas of both in- migration and out-migration requires further explanation. The census data indicate that Nairobi is the most important source of migrants for the rural areas of Nyanza, Western, Central, and Coast provinces. The data analysis was by 5-year age groups: 0 4 , 5-9, 10-14, 15- 19, and 20 and over (for the three provinces with urban centers the urban and the rural populations were considered separately). It shows that each of the urban areas has less than expected numbers in the school age years of 5-9 and 10--14 and a greater than expected number in the 20-and-older category. This deviation from the dis- tribution for the total population is evident especially in Nairobi and Mombasa. Conversely, the exact opposite pattern was observed in Western Province and the rural portion of Nyanza Province. Central Province had a significant number above expected values in the 0 4 age category but a negative deviation in the 10-14 age group. Both Rift Valley and Coast provinces, important in-migration areas, had distributions more like that of the urban centers. Eastern Province had only small deviations from expected values while in Northeastern Province the number of children less than 1 0 was well below expected values.
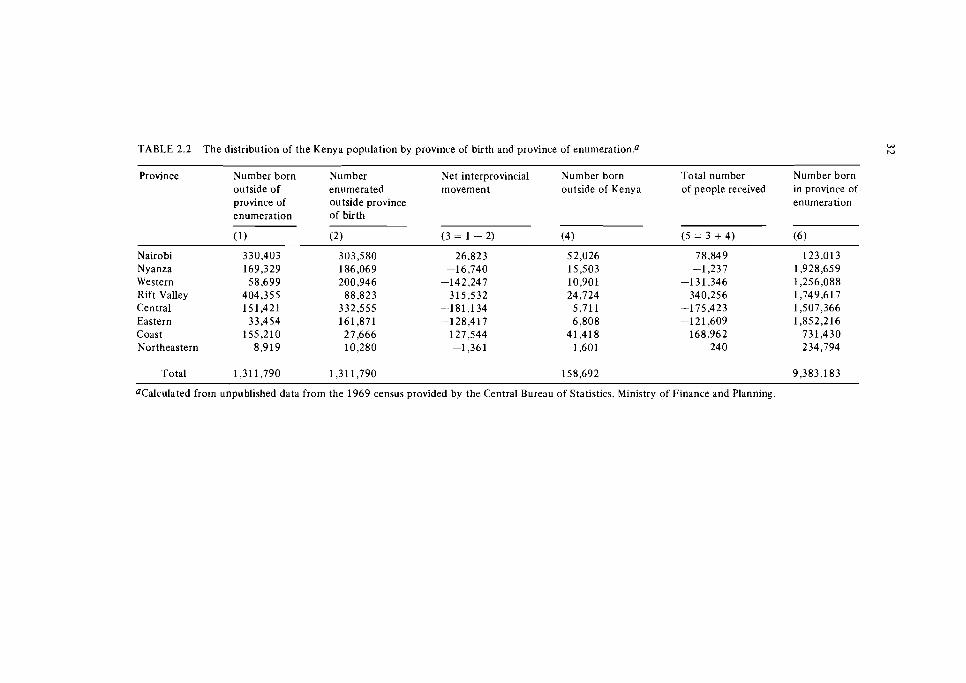
TABLE 2.2 The distribution of the Kenya population by province of birth and province of enumerationP W N
Province Number born Number Net interprovincial Number born Total number Number born outside of enumerated movement outside of Kenya of people received in province of province of outside province enumeration enumeration of birth
(1) (2) (3 = 1 - 2) (4) (5 = 3 + 4) (6)
Nairobi Nyanza Western Rift Valley Central Eastern Coast Northeastern
Total
acalculated frorn unpublished data from the 1969 census provided by the Central Bureau of Statistics. Ministry of Finance and Planning
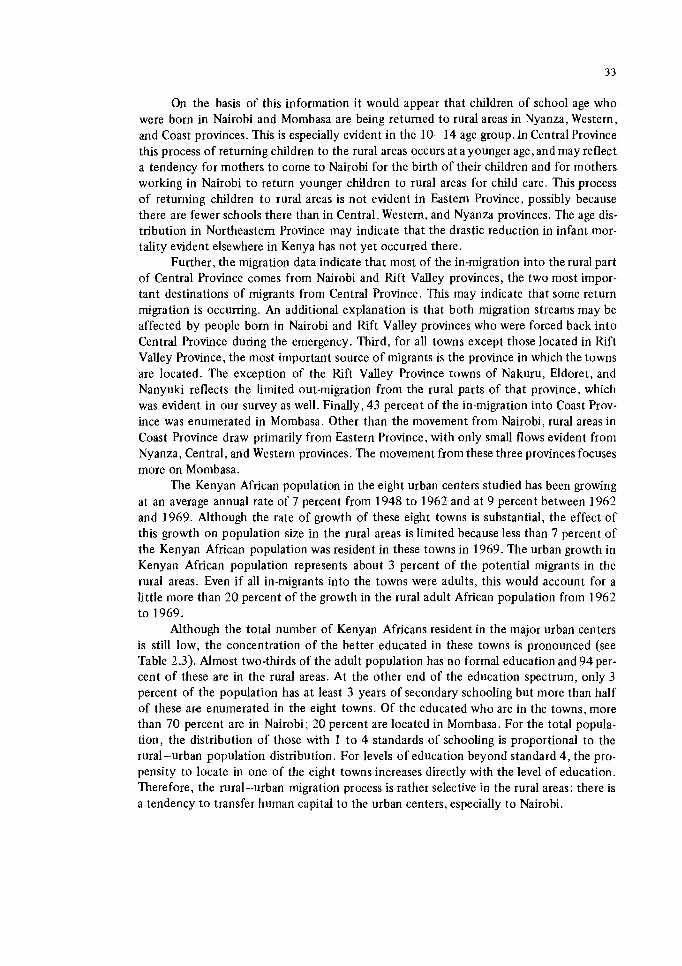
On the basis of this information it would appear that children of school age who were born in Nairobi and Mombasa are being returned to rural areas in Nyanza, Western, and Coast provinces. This is especially evident in the 10--14 age group. In Central Province this process of returning children to the rural areas occurs at a younger age, and may reflect a tendency for mothers t o come to Nairobi for the birth of their children and for mothers working in Nairobi t o return younger children to rural areas for child care. This process of returning children to rural areas is not evident in Eastern Province, possibly because there are fewer schools there than in Central, Western, and Nyanza provinces. The age dis- tribution in Northeastern Province inay indicate that the drastic reduction in infant mor- tality evident elsewhere in Kenya has not yet occurred there.
Further, the migration data indicate that most of the in-migration into the rural part of Central Province comes from Nairobi and Rift Valley provinces, the two most impor- tant destinations of migrants from Central Province. This may indicate that some return migration is occurring. An additional explanation is that both migration streams may be affected by people born in Nairobi and Rift Valley provinces who were forced back into Central Province during the emergency. Tlurd, for all towns except those located in Rift Valley Province, the most important source of migrants is the province in which the towns are located. The exception of the Rift Valley Province towns of Nakuru, Eldoret, and Nanyuki reflects the limited out-migration from the rural parts of that province, which was evident in our survey as well. Finally, 43 percent of the in-migration into Coast Prov- ince was enumerated in Mombasa. Other than the movement from Nairobi, rural areas in Coast Province draw primarily from Eastern Province, with only small flows evident from Nyanza, Central, and Western provinces. The movement from these three provinces focuses more on Mombasa.
The Kenyan African population in the eight urban centers studied has been growing at an average annual rate of 7 percent from 1948 to 1962 and at 9 percent between 1962 and 1969. Although the rate of growth of these eight towns is substantial, the effect of this growth on population size in the rural areas is limited because less than 7 percent of the Kenyan African population was resident in these towns in 1969. The urban growth in Kenyan African population represents about 3 percent of the potential migrants in the rural areas. Even if all in-migrants into the towns were adults, this would account for a little more than 20 percent of the growth in the rural adult African population from 1962 to 1969.
Although the total number of Kenyan Africans resident in the major urban centers is still low, the concentration of the better educated in these towns is pronounced (see Table 2.3). Almost two-thirds of the adult population has no formal education and 94per- cent of these are in the rural areas. At the other end of the education spectrum, only 3 percent of the population has at least 3 years of secondary schooling but more than half of these are enumerated in the eight towns. Of the educated who are in the towns, more than 70 percent are in Nairobi; 20 percent are located in Mombasa. For the total popula- tion, the distribution of those with 1 t o 4 standards of schooling is proportional to the rural-urban population distribution. For levels of education beyond standard 4 , the pro- pensity t o locate in one of the eight towns increases directly with the level of education. Therefore, the rural--urban migration process is rather selective in the rural areas: there is a tendency to transfer human capital to the urban centers, especially to Nairobi.
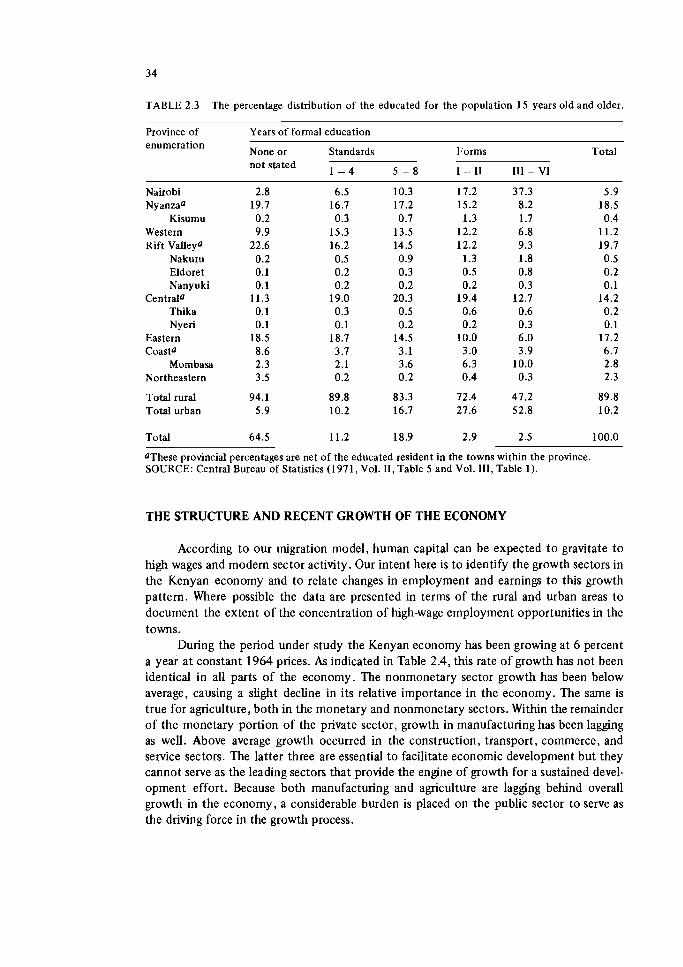
TABLE 2.3 The percentage distribution of the educated for the population 15 years old and older.
Province of Years of formal education enumeration
None or Standards Forms Total not stated
1 - 4 5 - 8 I - 11 I11 - V1
Nairobi N y anzaa
Kisumu Western Rift Valleya
Nakuru Eldoret Nanyuki
Central0 Thika Nyeri
Eastern Coasta
Mombasa Northeastern
Total rural Total urban
Total -- - -
aThese provincial percentages are net of the educated resident in the towns within the province. SOURCE: Central Bureau of Statistics (1971, Vol. 11, Table 5 and Vol. 111, Table 1).
THE STRUCTURE AND RECENT GROWTH OF THE ECONOMY
According to our migration model, human capital can be expected to gravitate to high wages and modem sector activity. Our intent here is to identify the growth sectors in the Kenyan economy and to relate changes in employment and earnings to this growth pattern. Where possible the data are presented in terms of the rural and urban areas to document the extent of the concentration of high-wage employment opportunities in the towns.
During the period under study the Kenyan economy has been growing at 6 percent a year at constant 1964 prices. As indicated in Table 2.4, this rate of growth has not been identical in all parts of the economy. The nonmonetary sector growth has been below average, causing a slight decline in its relative importance in the economy. The same is true for agriculture, both in the monetary and nonmonetary sectors. Within the remainder of the monetary portion of the private sector, growth in manufacturing has been lagging as well. Above average growth occurred in the construction, transport, commerce, and service sectors. The latter three are essential to facilitate economic development but they cannot serve as the leading sectors that provide the engine of growth for a sustained devel- opment effort. Because both manufacturing and agriculture are lagging behind overall growth in the economy, a considerable burden is placed on the public sector to serve as the driving force in the growth process.
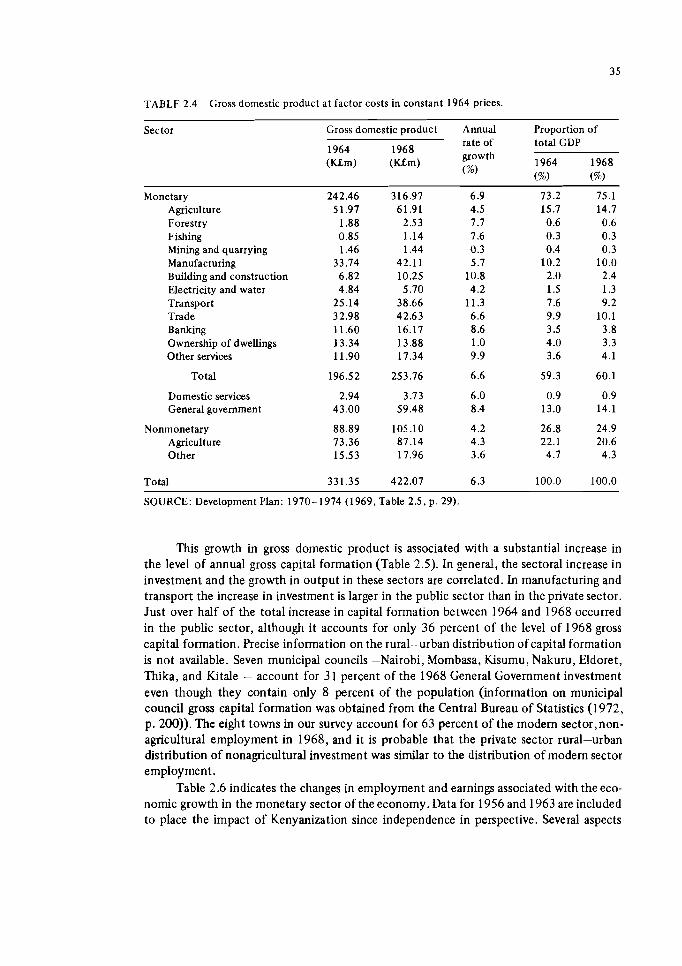
TABLE 2.4 Gross domestic product at factor costs in constant 1964 prices.
Sector Gross domestic product Annual Proportion of
1964 1968 rate of total GDP
( U r n ) ( a m ) growth (%I
1964 1968 (%I (%)
Monetary Agriculture Forestry Fishing Mining and quarrying Manufacturing Building and construction Electricity and water Transport Trade Banking Ownership of dwellings Other services
Total 196.52 253.76 6.6 59.3 60.1
Domestic services 2.94 3.73 6 .O 0.9 0.9 General government 43.00 59.48 8.4 13.0 14.1
Nonmonetary Agriculture Other
Total 331.35 422.07 6.3 100.0 100.0
SOURCE: Development Plan: 1970-1974 (1969, Table 2.5, p. 29).
This growth in gross domestic product is associated with a substantial increase in the level of annual gross capital formation (Table 2.5). In general, the sectoral increase in investment and the growth in output in these sectors are correlated. In manufacturing and transport the increase in investment is larger in the public sector than in the private sector. Just over half of the total increase in capital formation between 1964 and 1968 occurred in the public sector, although it accounts for only 36 percent of the level of 1968 gross capital formation. Precise information on the rural-urban distribution of capital formation is not available. Seven municipal councils -Nairobi, Mombasa, Kisumu, Nakuru, Eldoret, Thika, and Kitale - account for 31 percent of the 1968 General Government investment even though they contain only 8 percent of the population (information on municipal council gross capital formation was obtained from the Central Bureau of Statistics (1972, p. 200)). The eight towns in our survey account for 63 percent of the modem sector,non- agricultural employment in 1968, and it is probable that the private sector rural-urban distribution of nonagricultural investment was similar to the distribution of modem sector employment.
Table 2.6 indicates the changes in employment and earnings associated with the eco- nomic growth in the monetary sector of the economy. Data for 1956 and 1963 are included to place the impact of Kenyanization since independence in perspective. Several aspects
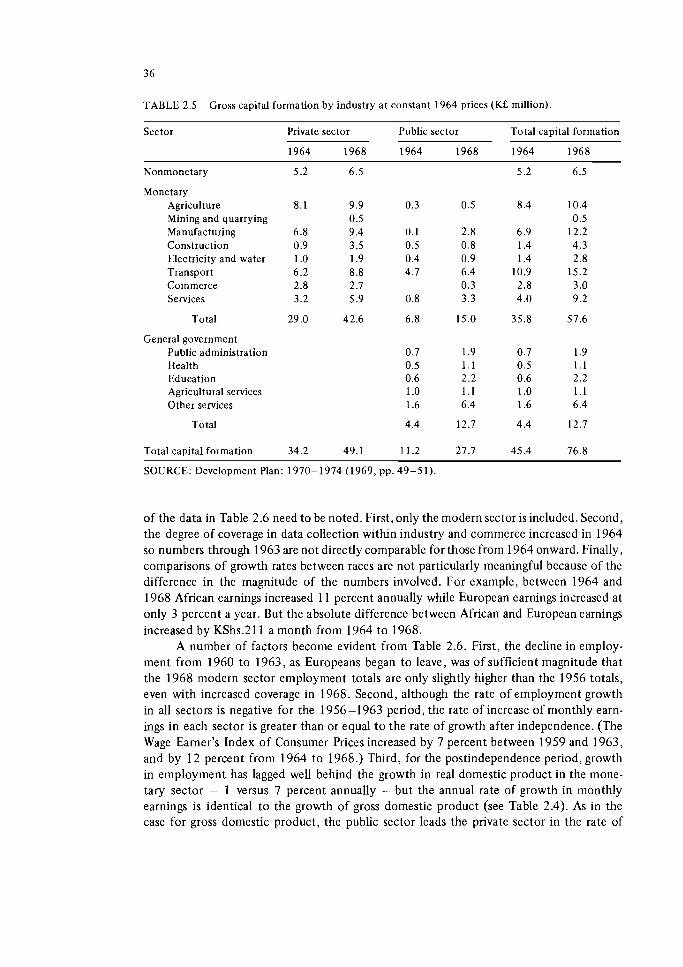
TABLE 2.5 Gross capital formation by industry at constant 1964 prices (Kg million).
Sector Private sector Public sector Total capital formation
1964 1968 1964 1968 1964 1968
Nonmonetary
Monetary Agriculture Mining and quarrying Manufacturing Construction Electricity and water Transport Commerce Services
Total
General government Public administration Health Education Agricultural services Other services
Total
Total capital formation
SOURCE: Development Plan: 1970-1974 (1969, pp. 49-51).
of the data in Table 2.6 need to be noted. First,only the modern sector is included. Second, the degree of coverage in data collection within industry and commerce increased in 1964 so numbers through 1963 are not directly comparable for those from 1964 onward. Finally, comparisons of growth rates between races are not particularly meaningful because of the difference in the magnitude of the numbers involved. For example, between 1964 and 1968 African earnings increased 11 percent annually while European earnings increased at only 3 percent a year. But the absolute difference between African and European earnings increased by KShs.211 a month from 1964 t o 1968.
A number of factors become evident from Table 2.6. First, the decline in employ- ment from 1960 t o 1963, as Europeans began t o leave, was of sufficient magnitude that the 1968 modern sector employment totals are only slightly higher than the 1956 totals, even with increased coverage in 1968. Second, although the rate of employment growth in all sectors is negative for the 1956-1963 period, the rate of increase of montldy earn- ings in each sector is greater than or equal t o the rate of growth after independence. (The Wage Earner's Index of Consumer Prices increased by 7 percent between 1959 and 1963, and by 12 percent from 1964 t o 1968.) Third, for the postindependence period, growth in ernployment has lagged well behind the growth in real domestic product in the mone- tary sector - 1 versus 7 percent annually - but the annual rate of growth in monthly earnings is identical t o the growth of gross domestic product (see Table 2.4). As in the case for gross domestic product, the public sector leads the private sector in the rate of
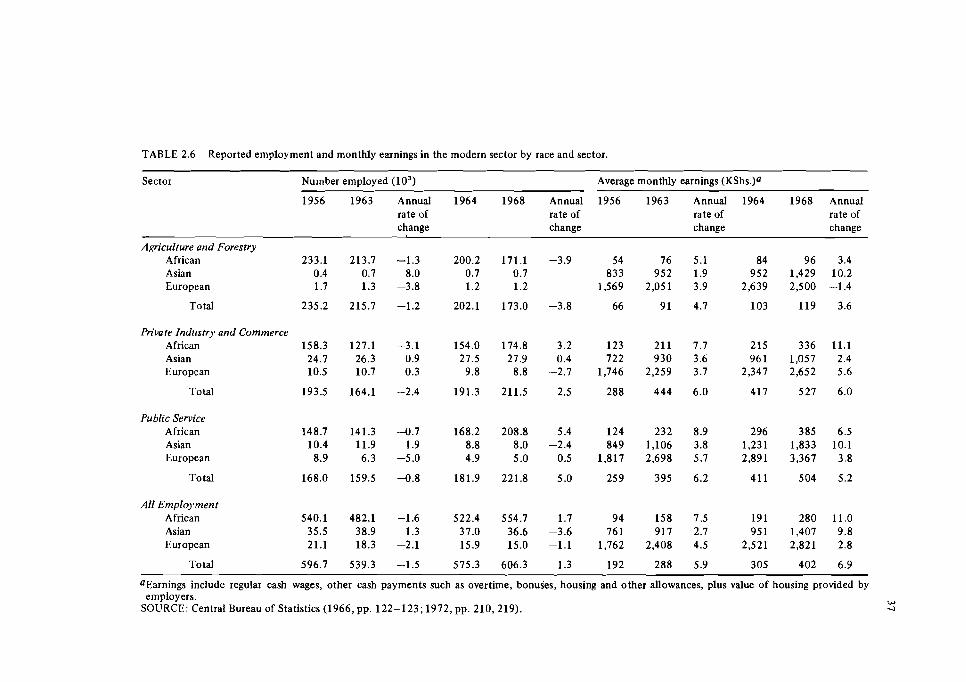
TABLE 2.6 Reported employment and monthly earnings in the modern sector by race and sector.
Sector Number employed (10') Average monthly earnings (KShs.)a
1956 1963 Annual 1964 1968 Annual 1956 1963 Annual 1964 1968 Annual rate of rate of rate of rate of change change change change
Agriculture and Forestry African 233.1 213.7 -1.3 200.2 171.1 -3.9 54 84 96 3.4 76 5.1 Asian 0.4 0.7 8.0 0.7 0.7 833 952 1.9 952 1,429 10.2 European 1.7 1.3 -3.8 1.2 1.2 1,569 2,051 3.9 2,639 2,500 -1.4
Total 235.2 215.7 -1.2 202.1 173.0 -3.8 66 91 4.7 103 119 3.6
Private Indzrstrj~ and Commerce African 158.3 127.1 -3.1 154.0 174.8 3.2 123 211 7.7 215 336 11.1 Asian 24.7 26.3 0.9 27.5 27.9 0.4 722 930 3.6 961 1,057 2.4 European 10.5 10.7 0.3 9.8 8.8 -2.7 1,746 2,259 3.7 2,347 2,652 5.6
Total 193.5 164.1 -2.4 191.3 211.5 2.5 288 444 6.0 417 527 6.0
Public Service African Asian European
Total
All Employment African 540.1 482.1 -1.6 522.4 554.7 1.7 94 158 7.5 191 280 11.0 Asian 35.5 38.9 1.3 37.0 36.6 -3.6 76 1 917 2.7 951 1,407 9.8 European 21.1 18.3 -2.1 15.9 15.0 1 . 1 1,762 2,408 4.5 2,521 2,821 2.8
Total 596.7 539.3 -1.5 575.3 606.3 1.3 192 288 5.9 305 402 6.9 - -
aEarnings include regular cash wages, other cash payments such as overtime, bonuses, housing and other allowances, plus value of housing provided by employers.
SOURCE: Central Bureau of Statistics (1966, pp. 122-1 23; 1972, pp. 210,219).
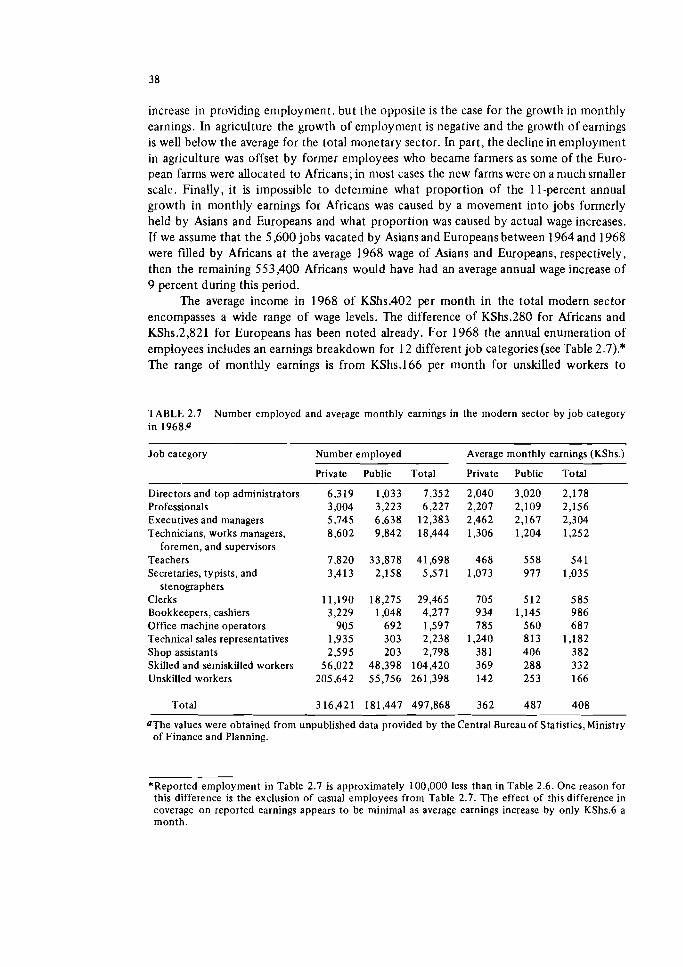
increase in providing employment, but the opposite is the case for the growth in monthly earnings. In agriculture the growth of employment is negative and the growth of earnings is well below the average for the total monetary sector. In part, the decline in employment in agriculture was offset by former en~ployees who became farmers as some of the Euro- pean farms were allocated to Africans; in most cases the new farms were on a much smaller scale. Finally, it is impossible t o determine what proportion of the 11-percent annual growth in monthly earnings for Africans was caused by a movement into jobs formerly held by Asians and Europeans and what proportion was caused by actual wage increases. If we assume that the 5,600 jobs vacated by Asians and Europeans between 1964 and 1968 were filled by Africans at the average 1968 wage of Asians and Europeans, respectively, then the remaining 553,400 Africans would have had an average annual wage increase of 9 percent during this period.
The average income in 1968 of KShs.402 per month in the total modern sector encompasses a wide range of wage levels. The difference of KShs.280 for Africans and KShs.2,821 for Europeans has been noted already. For 1968 the annual enumeration of employees includes an earnings breakdown for 1 2 different job categories (see Table 2.7).* The range of monthly earnings is from KShs.166 per month for unskilled workers t o
TABLE 2.7 Number employed and average monthly earnings in the modern sector by job category in 1968.0
Job category Number employed Average monthly earnings (KShs.)
Private Public Total Private Public Total
Directors and top administrators Professionals Executives and managers Technicians, works managers,
foremen, and supervisors Teachers Secretaries, typists, and
stenographers Clerks Bookkeepers, cashiers Office machine operators Technical sales representatives Shop assistants Skilled and semiskilled workers Unskilled workers
Total
"The values were obtained from unpublished data provided by thecentral Bureauof Statistics, Ministry of Finance and Planning.
*Reported employment in Table 2.7 is approximately 100,000 less than in Table 2.6. One reason for this difference is the exclusion of casual employees from Table 2.7. The effect of this difference in coverage on reported earnings appears to be minimal as average earnings increase by only KShs.6 a month.
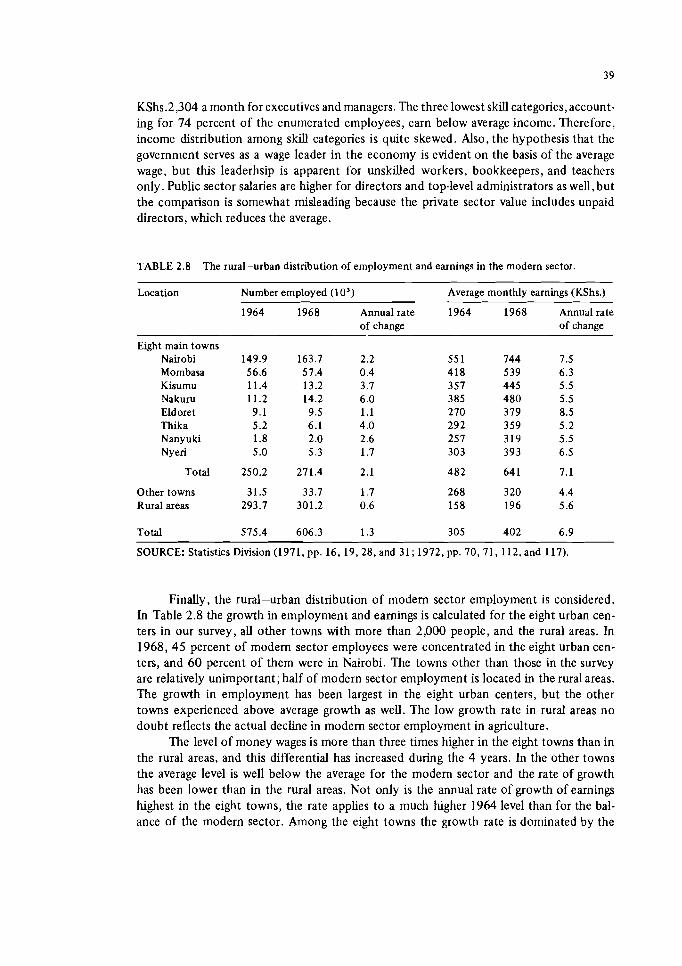
KShs.2,304 a month for executives and managers. The three lowest skill categories,account- ing for 74 percent of the enumerated employees, earn below average income. Therefore, income distribution among skill categories is quite skewed. Also, the hypothesis that the government serves as a wage leader in the economy is evident on the basis of the average wage, but this leaderhsip is apparent for unskilled workers, bookkeepers, and teachers only. Public sector salaries are higher for directors and top-level administrators as well, but the comparison is somewhat misleading because the private sector value includes unpaid directors, which reduces the average.
TABLE 2.8 The rural-urban distribution of employment and earnings in the modern sector.
Location Number employed ( l o3 ) Average monthly earnings (KShs.)
1964 1968 Annual rate 1964 1968 Annual rate of change of change
Eight main towns Nairobi Mombasa Kisumu Nakuru Eldoret Thika Nanyuki Nyeri
Total 250.2 271.4 2.1 482 64 1 7.1
Other towns 31.5 33.7 1.7 268 320 4.4 Rural areas 293.7 301.2 0.6 158 196 5.6
Total 575.4 606.3 1.3 305 402 6.9
SOURCE: Statistics Division (1971, pp. 16, 19 ,28 , and 31; 1972, pp. 70, 71, 112, and 117).
Finally, the rural-urban distribution of modem sector employment is considered. In Table 2.8 the growth in employment and earnings is calculated for the eight urban cen- ters in our survey, all other towns with more than 2,000 people, and the rural areas. In 1968, 45 percent of modem sector employees were concentrated in the eight urban cen- ters, and 60 percent of them were in Nairobi. The towns other than those in the survey are relatively unimportant; half of modern sector employment is located in the rural areas. The growth in employment has been largest in the eight urban centers, but the other towns experienced above average growth as well. The low growth rate in rural areas no doubt reflects the actual decline in modem sector employment in agriculture.
The level of money wages is more than three times higher in the eight towns than in the rural areas, and this differential has increased during the 4 years. In the other towns the average level is well below the average for the modern sector and the rate of growth has been lower than in the rural areas. Not only is the annual rate of growth of earnings highest in the eight towns, the rate applies to a much higher 1964 level than for the bal- ance of the modern sector. Among the eight towns the growth rate is dominated by the
average growth rate in Nairobi. Also, there does appear to be somewhat of an inverse rela- tionship between the rate of increase of monthly earnings and the rate of increase of employment. Not only is the modern sector employment per capita much higher in the major towns, the rate of remuneration in each of the eight towns is, by 1968,significantly higher than in either the smaller towns or the rural areas.
THE GROWING CONCERN ABOUT URBAN UNEMPLOYMENT
Along with the concentration of modern sector economic activity in the major towns there appears to be a growing number of people in the towns trying their chances at obtaining employment. Explicit government concern about the extent of this highly visible urban unemployment became evident within weeks of independence. In January 1964 there was a revolution in Zanzibar and disturbances in the armies of all three East African countries. Also, the unemployed in Nairobi demonstrated for action on the lack of employment opportunities (Amsden 1971, p. 122). The government moved quickly with a 1-year Tripartite Agreement involving the Kenya Federation of Labour and the Federation of Kenya Employers. Under the terms of the agreement there were to be no strikes or go-slows, wages were to remain at existing levels, a limited form of price control was instituted, the private sector was to increase employment by 10 percent while employ- ment in the public sector was to be increased by 15 percent, and an Industrial Court was established with power to resolve disputes that could not be settled through voluntary means (Amsden 1971, pp. 100-101).
The Tripartite Agreement was initiated at a time when employment levels in the modem sector had been declining steadily for 3 years. The effects of the agreement on employment were only temporary, but it did cover the period when a reversal in the employment trend was accomplished. Some 34,000 were employed under the agreement plus some 4,000 more during a 2-month extension in 1965. The public sector accounted for only 6,000 new jobs and many hirings in the private sector merely filled openings caused by normal labor turnover. As a result, the net number of jobs created during the agree- ment has been estimated at 18,000; in some cases casual jobs were made permanent and in others adult labor was substituted for child labor (International Labour Office 1972, p. 541). Therefore, the more lasting effects of the agreement are to be found primarily in the Trade Disputes Act of 1965 which increased the power of the Minister of Labour to handle disputes and established the Industrial Court on a permanent basis, although its binding powers were limited to essential services only. The government did not follow through at the time with its commitment to establish a more permanent policy on prices and income. For a brief discussion of postindependence legislation dealing with labor dis- putes and policy on prices and incomes, see Sandbrook (1975).
In 1965 the government published Sessional Paper No. 10, "African Socialism and Its Application to Planning in Kenya." In this definition of African socialism relevant for the Kenya setting, primary emphasis was placed on economic growth to solve such prob- lems as poverty, unemployment, and limited access to important social services. Growth was to be realized through incentives to private businesses including considerable reliance on foreign capital and expertise. This policy statement shaped Kenya's economic growth. With extensive investment, considerable economic growth was realized but, as documented
previously, the rate of employment creation lagged well behind the growth in gross domes- tic product.
More explicit government action to open new employment opportunities for Kenyan Africans was initiated in 1967 with the White Paper "Kenyanization of the Private Sector," and the Immigration and Trade Licensing Acts. Along with placing more control of the economy in Kenyan hands, this legislation increased access for Kenyan Africans to the high- wage jobs held previously by foreigners. Since the majority of these high-wage jobs were in the major towns, the attempt to increase employment would, according to our migration model, induce more urban in-mnigration. This hypothesis will be tested in Chapter 4.
This growing urban une~nployment problem required further action. Along with moral suasion on the part of President Kenyatta urging the unemployed to return to the land, several steps were taken. In 1963 the Youth Department of the Christian Council of Kenya and the Christian Churches' Educational Association initiated a study on one group of unemployed, the school-leavers. In 1966 these two groups published a report (Christian Council of Kenya 1966) that documented the extent of unemployment among school- leavers. They advocated an explicit "Responsible Parenthood Campaign," reform of the educational system, and urged the establishment of Village Polytechnics to train school- leavers for productive involvement in the rural areas. The government responded by pub- licly supporting family planning; the Village Polytechnic movement was supported after it had been initiated by the National Christian Council of Kenya. Actual reform of the educational system proved to be too complex and elusive for immediate implementation.
An additional step toward reducing the extent of rural-urban migration was a strong commitment for rural development in the second Development Plan (1969, p. 2): "Rural Development should not be seen as a special programme but as the underlying strategy of the whole Plan." This rural development strategy included improving the range and extent of economic opportunities and providing more amenities in the rural areas. The latter had been initiated earlier by the Town Planning Department of the Ministry of Lands and Settlement in the form of an inventory of amenity availability in each province; this formed the basis for formulating Provincial Physical Development Plans. To facilitate the rural development effort the central government withheld, from 1968 on, 50 percent of the graduated personal tax collected in Nairobi and Mombasa for use in county councils in financial difficulties (Diejomaoh 1970).
The above steps were designed to reduce the urban in-migration by action at the source; additional action was required to deal with the existing urban unemployment problem. For this purpose the Vagrancy Act was passed in 1968. The act empowers tlie police to arrest people in the towns who do not have legal employment or other lawful means of subsistence and people who have no fixed abode. If found guilty the courts can sentence such vagrants to a rehabilitation center, to a detention center or to their respec- tive home areas and to restrict movement to these home areas for up to 3 years (Kenya Gazette Supplement 1968, pp. 904-905). This act enables urban centers to repatriate to the rural areas migrants who fail to take advantage of productive and legal economic oppor- tunities in the towns.
The principle of discouraging rural people who lack legal means of maintaining themselves in the towns from taking up residence in the towns is well established in Kenya. A conimon approach during the colonial period was to set building codes and health regu- lations for each town. All housing that did not conform to these codes and regulations
was considered unauthorized and could be destroyed by the municipal officials. Although extensive action has been taken to provide Municipal Council housing and site and service plots, the pattern of establishing building codes and health regulations and maintaining the right t o destroy unauthorized housing has continued since independence (Stren 1970).
In summary then, there is considerable evidence of a growing concern about urban unemployment. This concern has been translated into some government action,but action has been directed more at the symptoms than a t the causes of the problem. The strong conunitment t o economic growth has maintained an economic structure that is urban based and that proves attractive t o job-seekers, but it does no t appear t o provide adequate means for creating sufficient employment opportunities.
SUMMARY
The eight towns covered by the survey for this study grew directly from European settlement in Kenya. Six are located in the settlement area and Mombasa and Kisumu were the terminal points of the original Uganda Railway. In this chapter the colonial practice of limiting African economic opportunities primarily t o wage labor while denying them the possibility of foriuing a stable urban labor force is discussed in some detail.
In the postindependence period the structure of the economy has not changed sig- nificantly while conditions that were hypothesized in Chapter 1 t o contribute to rural-- urban migration have intensified. Population growth has been rapid, educational oppor- tunities have expanded considerably in the rural areas, and the welleducated have had increased access t o those high-wage jobs previously held by noncitizens. Given a limited ability t o absorb the urban in-migrants in productive employment, the government has found it necessary to resort to various indirect means of controlling the extent of rural- urban migration.
The reasons why the structure of the economy has remained quite stable could not be explored in detail in such a brief survey of the context of the migration under study. Also, the various mechanisms that preserved the structure of the economy during the period of political transition -- transportation networks, credit practices, foreign invest- ment, taxation, policies on education, labor prices and incomes, and foreign exchange, plus the use of parastatal agencies t o transfer ownership of assets t o Kenyans -have not been discussed.
We turn now t o an analysis of the extent of the migration response t o the distribu- tion of econonic opportunities and social amenities. Specifically, we will seek t o identify the relative importance of various causal forces in the migration process. In the concluding chapter, as part of the discussion of the effects of policies on the migration process, we will examine how these mechanisms have affected both the structure of the Kenyan econ- omy and the responses of the labor force t o this structure.
3 DATA SOURCES AND MIGRATION PA'ITERNS
Migration studies typically are based on one of two data sources, a census or a migration survey. A census provides a comprehensive picture of the current location of the population and indicates the net movement that has occurred t o that time. The major weakness of the 1969 census conducted in Kenya is that i t is a stock concept merely pro- viding a picture at one point in time. Therefore, one can determine movement by relat- ing place of birth t o current residence, but i t is not possible to determine when the migra- tion took place. As a result, the act of migrating cannot be related to such personal char- acteristics as the age of the migrant at the time of the migration nor t o external forces that prevailed a t the time of the migration. In short, analysis of the causes of the migration is possible solely on the basis of assumptions about when the migration occurred.
The dominant weakness of census data can be overcome with survey data. A survey makes i t possible t o uncover relevant characteristics of the migrants and to date the time of the migration. The role of environmental factors in the migration decision can then be analyzed. A major weakness of the survey conducted for this study is that it represents a set of samples drawn from different urban centers in a country rather than one sample from the process of urbanization throughout the country. As a result, considerable cau- tion must be exercised in generalizing to the total country unless one has an objective basis for determining the relative importance of each urban center in the urbanization process.
The timing of our rural-urban migration survey, relative to the 1969 census, enables us t o combine the two sources of information. Such a combination provides us with the benefits of both approaches and the means for overcoming the dominant weakness of each. In this chapter the two information sources are described, the method used for com- bining the two information sources is outlined, and the observed patterns of migration are summarized.
THE 1969 POPULATION CENSUS
The most recent general census in Kenya was carried out in August 1969. The politi- cal units ranged from the government administration areas down to the sublocation level. The information collected includes age, education completed, sex, tribe, race andnational- ity, relationship to the head of the household, the place of birth, and the place of current residence. Many of the data have been published in a four-volume set ofgovernment docu- ments (Central Bureau of Statistics 1970, 1971, 1977), but the migration data in this chap- ter are based on unpublished material made available by the Central Bureau of Statistics.
The published census material contains only one caution about possible errors in the census. A comparison of the age distribution of males and females indicated that the proportion of females aged 20 to 39 is higher than that of males, while the opposite is
true for people 1 0 t o 1 9 years old. The conclusion reached by the census administrators was: "It is particularly probable that girls in fact aged under 1 6 years may frequently have been shown as adults . . . . For this reason, the figures shown should not be regarded as an accurate representation of the age distribution of the population" (Central Bureau of Sta- tistics 1970, p. i). The only other possible error in the census that we have detected is in the population size of the town of Eldoret. A comparison of the estimated labor force, from census data, with modern sector employment in Eldoret revealed that there were more people employed there than there were in the Iabor force. After consultation with the town clerk o f Eldoret, Mr. J. Asembo, and members of his staff, we accepted their population estimates. For our purposes, this means all census totals for Eldoret have been increased by a scale of 1.558.
The locations of some of the boundaries for government administrative areas were changed after independence. As a result, the 1969 census totals are not directly comparable with the 1962 census totals in all cases. For the limited use made of the 1962 census migra- tion information, percentages in the relevant table (Statistics Division 1966, Vol. 3 , Table IV.e), were adjusted t o reflect the 1969 boundaries. These adjustments provided direct information on the migration flows into the two major urban centers, Nairobi and Mom- basa. For the other six towns it was assumed that the proportion and the composition of the in-migration into a district flowing into the town located in the district was the same for the 1962 census and the 1969 census. On the basis of this assumption interdistrict flows were used t o construct estimates of urban in-migration as reported in the 1962 cen- sus. The 1962 census contained warnings about the accuracy of data collected in Northern Province. Therefore, the seven districts in Northern Province were treated as one unit. This has only limited bearing on migration studies because the largely nomadic tribes of North- e m Province play an insignificant role in rural-urban migration in Kenya.
THE RURAL-URBAN MIGRATION SURVEY
The second source of data was a survey questionnaire given in December 1968 t o a representative sample in the eight largest urban centers in Kenya. (A copy of the question- naire is included in Appendix A. A brief description of the sampling technique, the adminis- tration of the survey, and the sample obtained, plus a comment on the quality of the data, are provided in Appendix B.) The population sampled included all African males who voluntarily had entered one of these urban centers after independence (December 1963). No attempt was made tointerview rural residents who had chosen not t o migrate o r migrants who had left the urban centers before the survey. Limiting the survey in this manner deprived us of important information but was necessitated for cost reasons. The bias, if any, introduced by this limitation will understate the magnitude of the variables in which we are interested. Therefore, the direction of the statistical significance of results based on our survey would not be reversed by a more comprehensive survey.
T o obtain a random sample from the relevant population, buildings were selected from aerial maps of each town. Stratified sampling was used in towns where sufficient information was available t o divide the buildings into housing types. Information on the distribution of the migration population among housing types was not available so 1962 census information was used to determine how extensive our random sampling of buildings from each housing type should be.
The interviews were conducted and the questionnaires were completed by students from the University of Nairobi during their December break. The intent of the survey was to reconstruct the respondent's income and migration history from 1 year prior to the rural-to-urban move until the time of the survey to test the Todaro migration model. First the employment history during this period was constructed and then the relevant place and income information associated with each job was added. In addition, questions were asked about the migrant's reasons for moving, his information sources, the assistance he received, his opinions on various economic and political issues, and his personal character- istics. A total of 1,091 completed questionnaires were obtained from the survey.
THE OBSERVED MIGRATION FLOWS
The most complete picture of urban in-migration in Kenya is provided by the 1969 census. This census information for the Kenyan African population in the eight towns under study is provided in Tables 3.1 and 3.2. Adjustments to population size have been made for two towns, Kisumu and Eldoret, as indicated in the footnotes to the tables. In each case it was assumed that the relative size of the flows from alternative sources remained the same.
Between the 1962 and the 1969 censuses the average annual rate of increase of African population in the eight towns was 9 percent. The growth was dominated by Nairobi with an annual rate of growth of 1 1 percent. All the other urban centers had below-average rates of growth, and Nanyuki had less than the average growth rate for all of Kenya.
As indicated in Tables 3.1 and 3.2, 75 percent of the African population in these towns were born outside of the urban center in which they were enumerated. The urban in-migration was dominated by several sources: three of the five districts in Central Prov- ince, Kitui and Machakos districts in Eastern Province, three of the four districts in Nyanza Province, and Kakamega district in Western Province. Nairobi and Mombasa tend to attract sizable numbers from most parts of Kenya. A comparison with the map in Figure 2.1 in Chapter 2 indicates that the other six towns, with the possible exception of the towns in Rift Valley Province,,attract migrants primarily from the surrounding districts. Residents of Coast Province move prin~arily to the two towns in the province. The urban sex imbal- ance (1.5 males for every female) is maintained because, on average, six of every ten migrants is male. The total in-migration is 5 percent of the population listed as born in the rural areas.
As stated previously, it is not possible to determine when the migrants make their move. Information about the timing of the movement for the period 1964 to 1968 isavail- able for each of the eight towns covered in the survey. It is necessary to establish a set of weights to adjust the sample size for each town to reflect its relative position in the total in-migration experienced by the eight towns. In establishing these weights one cannot avoid making some assumptions about when the movement observed in the census occurred.
One extreme is to assume that all the migrants arrived recently and that the 1969 census information reflects the net migration picture for the survey period. This position would be consistent with the literature of the early 1960s which emphasized the tendency for urban in-migrants to circulate back to a rural home at least once every 2 years (Elkan 1960; Mitchell 1962; Southall 1962). In the survey, information was collected on the total number of men resident in the buildings selected during the sampling procedure. From this
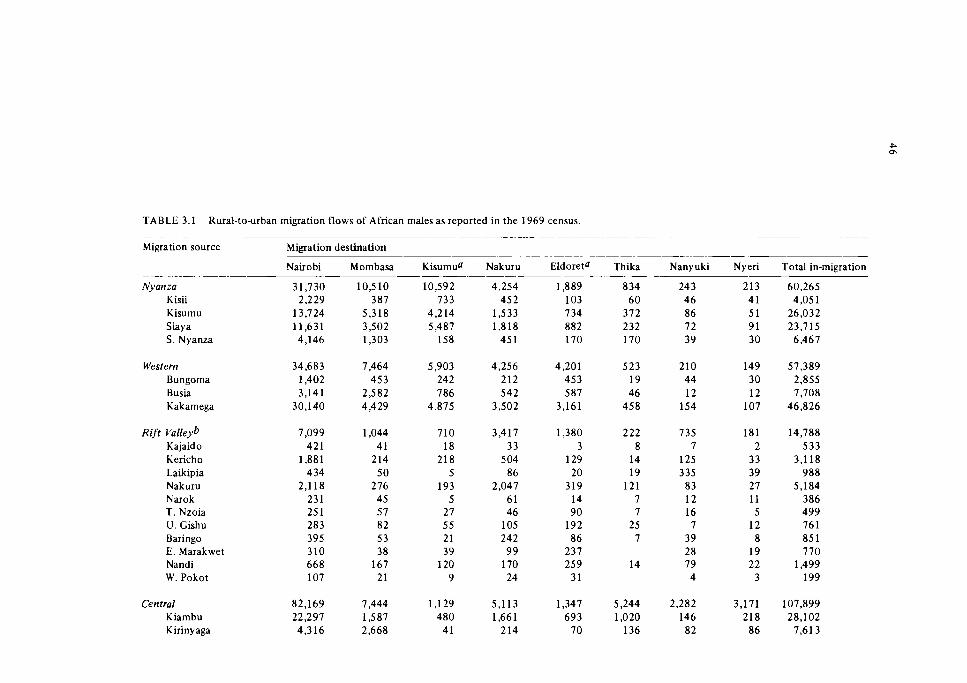
TABLE 3.1 Rural-to-urban migration flows of African males as reported in the 1969 census. . - - - - - -.
Migration source
- - . - - - -
Nyanza Kisii Kisumu Siaya S. Nyanza
.- - - - - -. -. - - - - - - - - - - -. .- - - -
Migration destination -~ --
Nairobi Mombasa Kisumua Nakuru Eldoreta Thika Nanyuki Nyeri Total in-migration -~ - --
31,730 10,510 10,592 4,254 1,889 8 34 24 3 213 60,265 2,229 387 733 452 103 60 46 4 1 4,051
13,724 5,318 4,214 1,533 7 34 372 86 51 26,032 11,631 3,502 5,487 1,818 882 232 72 91 23,715 4,146 1,303 158 45 1 170 170 39 30 6,467
Western 34,683 7,464 5,903 4,256 4,201 523 210 149 57,389 Bungoma 1,402 453 24 2 212 453 19 44 30 2,855 Busia 3,141 2,582 786 542 587 46 12 12 7,708 Kakamega 30,140 4,4 29 4,875 3,502 3,161 458 154 107 46.826
Rift ~ a l l e ~ b Kajaido Kericho Laikipia Nakuru NaIok T. Nzoia U. Gishu Baringo E. Marakwet Nandi W. Pokot
Central 82,169 7,444 1,129 5,113 1,347 5,244 2,282 3,171 107,899 Kiambu 22,297 1,587 480 1,661 693 1,020 146 218 28,102 Kirinyaga 4,316 2,668 4 1 2 14 70 136 8 2 86 7,613
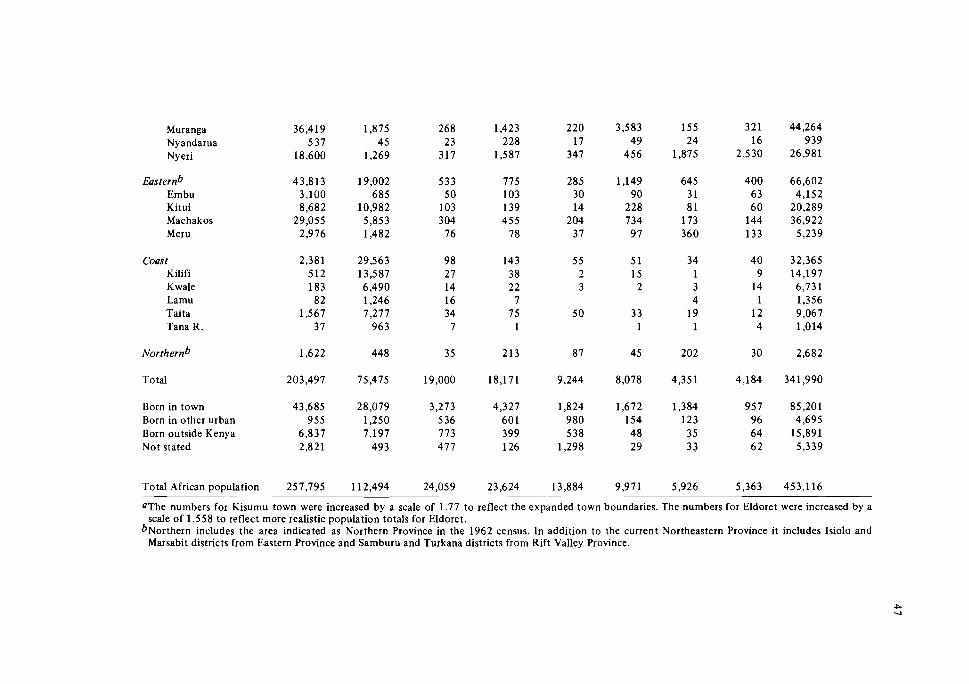
Muranga Nyandarua Nyeri
~ a s t e r n b Em bu Kitui Machakos Meru
Coast Kilifi Kwale Lamu Taita Tana R .
Total
Born in town Born in other urban Born outside Kenya Not stated
Total African population
aThe numbers for Kisumu town were increased by a scale of 1.77 t o reflect the expanded town boundaries. The numbers for Eldoret were increased by a scale of 1.558 t o reflect more realistic population totals for Eldoret.
b ~ o r t h e r n includes the area indicated as Northern Province in the 1962 census. In addition to the current Northeastern Province it includes lsiolo and Marsabit districts from Eastern Province and Samburu and Turkana districts from Rift Valley Province.
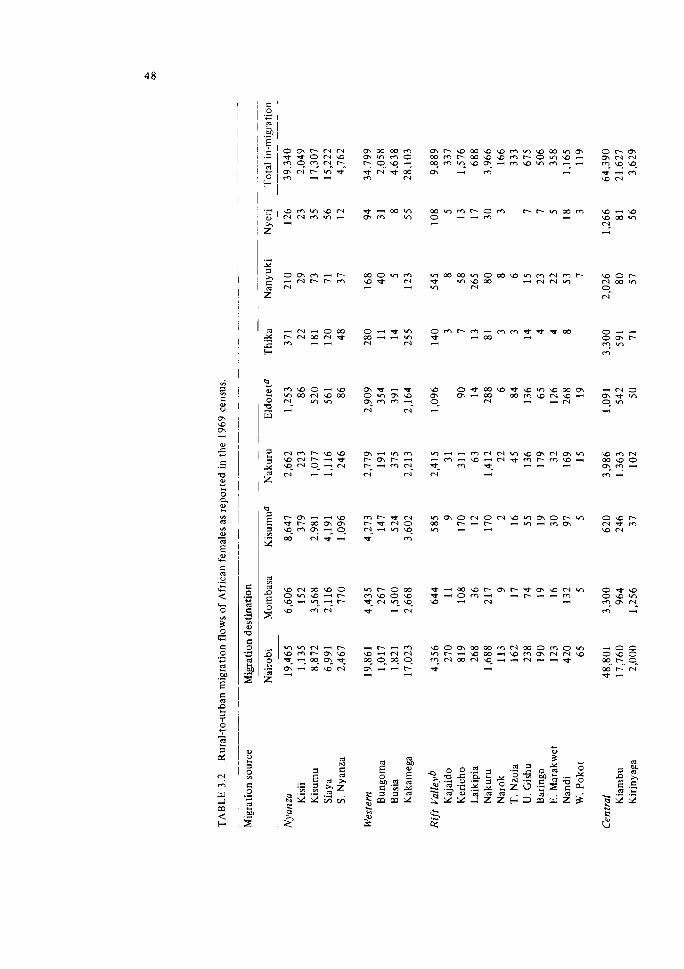
m m m m m m m o P- 0- -- 7 b N b W m N
g i " m - o - - 0 e m - b - - - m 2 - N o $ : v ) m ~ \ o m o m m a m m - m m m \ o m \ o
y lnln q m m -- 0- N - - N m e -
8 1 1 : 1 - - r - 4 r - 4 - 3 0" -
m 1
,,, < .- o m - - r - m w o w b - o m - - - - e m 3
o w - "" 0' -.
b - N m
m m m - r - - r - - m ~ o m w m m m m o m o w - 0 0 i - m m m r - - - a - r m m m m r o r 0
" y m m m n e m m-omm"on m " m w m w - - - m - - e m - W W N m- -1 . - b - m- '-- 0" - - W F .
.- b -
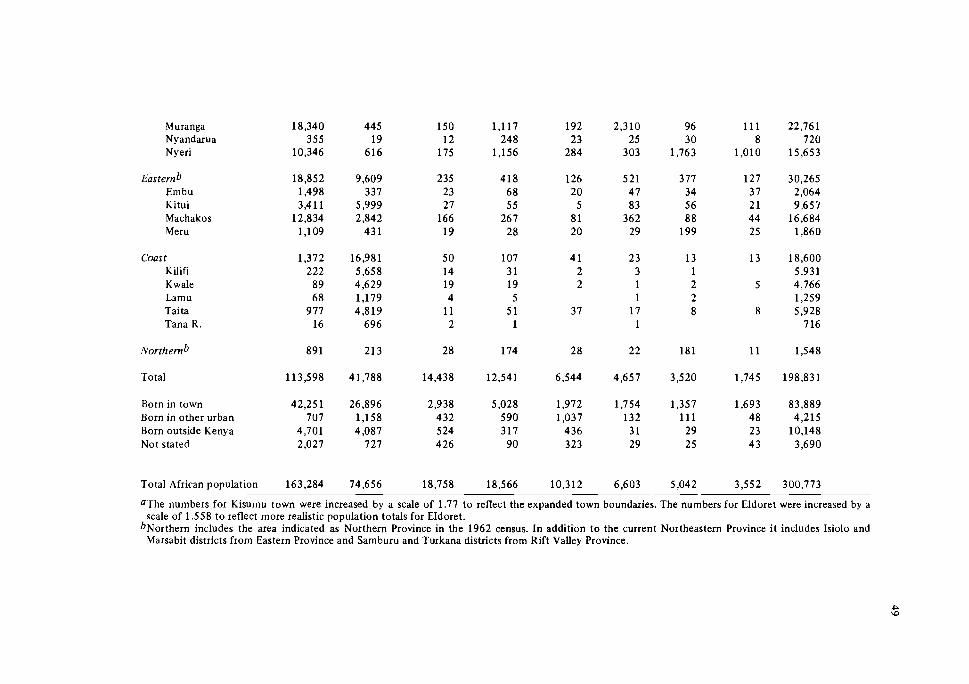
Muranga 18,340 445 150 1,117 192 2,310 96 111 22,761 Nyandarua 355 19 12 248 23 25 30 8 720 Nyeri 10,346 616 175 1,156 284 303 1,763 1,010 15,653
~ a s t e r n b 18,852 9,609 235 418 126 521 377 127 30,265 Embu 1,498 337 23 6 8 20 4 7 34 37 2,064 Kitui 3,411 5.999 27 55 5 83 5 6 2 1 9,657 Machakos 12,834 2,842 166 267 81 362 88 44 16,684 Meru 1,109 43 1 19 28 20 29 199 25 1,860
Coast Kilifi Kwale Lamu Taita Tana R.
'Total 113,598 41,788 14,438 12,541 6,544 4,657 3,520 1,745 198,831
Born in town 42,25 1 26,896 2,938 5,028 1,972 1,754 1,357 1,693 83,889 Born in other urban 707 1,158 432 590 1,037 132 111 48 4,215 Born outside Kenya 4,701 4,087 524 317 436 3 1 29 23 10,148 Not stated 2,027 727 426 90 323 29 2 5 43 3,690
Total African population 163,284 74,656 ~~~~~~ ~
18,758 18,566 10,312 6,603 5,042 - --
3,552 300,773
OThe numbers for Kisumu town were increased by a scale of 1.77 t o reflect the expanded town boundaries. The numbers for Eldoret were increased by a scale of 1.558 t o reflect more realistic population totals for EIdoret.
b ~ o r t h e r n includes the area indicated as Northern Province in the 1962 census. In addition t o the current Northeastern Province i t includes Isiolo and Marsabit districts from Eastern Province and Samburu and Turkana districts from Rift Valley Province.
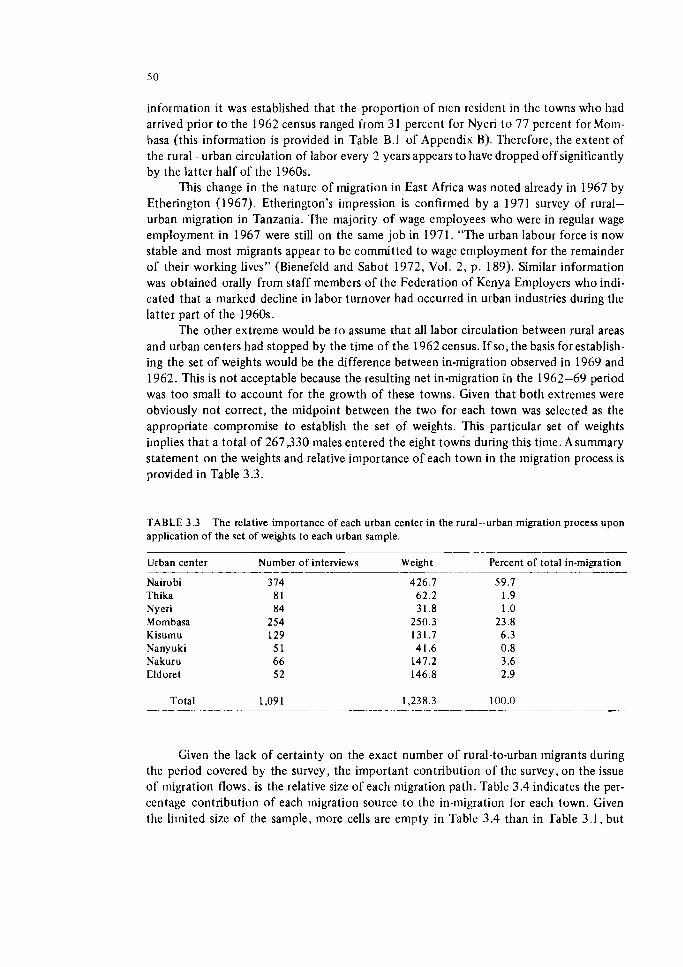
information it was established that the proportion of men resident in the towns who had arrived prior to the 1962 census ranged from 3 1 percent for Nyeri to 77 percent for Mom- basa (this information is provided in Table B.1 of Appendix B). Therefore, the extent of the rural-urban circulation of labor every 2 years appears to have dropped off significantly by the latter half of the 1960s.
This change in the nature of migration in East Africa was noted already in 1967 by Etherington (1967). Etherington's impression is confirmed by a 1971 survey of rural- urban migration in Tanzania. The majority of wage employees who were in regular wage employment in 1967 were still on the same job in 197 1. "The urban labour force is now stable and most migrants appear to be committed to wage employment for the remainder of their working lives" (Bienefeld and Sabot 1972, Vol. 2, p. 189). Similar information was obtained orally from staff members of the Federation of Kenya Employers who indi- cated that a marked decline in labor turnover had occurred in urban industries during the latter part of the 1960s.
The other extreme would be to assume that all labor circulation between rural areas and urban centers had stopped by the time of the 1962 census. If so, the basis for establish- ing the set of weights would be the difference between in-migration observed in 1969 and 1962. This is not acceptable because the resulting net in-migration in the 1962-69 period was too small to account for the growth of these towns. Given that both extremes were obviously not correct, the midpoint between the two for each town was selected as the appropriate compromise to establish the set of weights. This particular set of weights implies that a total of 267,330 males entered the eight towns during this time. Asummary statement on the weights and relative importance of each town in the migration process is provided in Table 3.3.
TABLE 3.3 The relative importance of each urban center in the rural--urban migration process upon application o f the set of weights to each urban sample.
Urban center Number o f interviews Weight Percent of total in-migration
Nairobi Thika Nyeri Mombasa Kisumu Nanyuki Nakuru Eldoret
Total - - - - - -. . - -. - -
Given the lack of certainty on the exact number of rural-to-urban migrants during the period covered by the survey, the important contribution of the survey, on the issue of migration flows, is the relative size of each migration path. Table 3.4 indicates the per- centage contribution of each migration source to the in-migration for each town. Given the limited size of the sample, more cells are empty in Table 3.4 than in Table 3.1, but
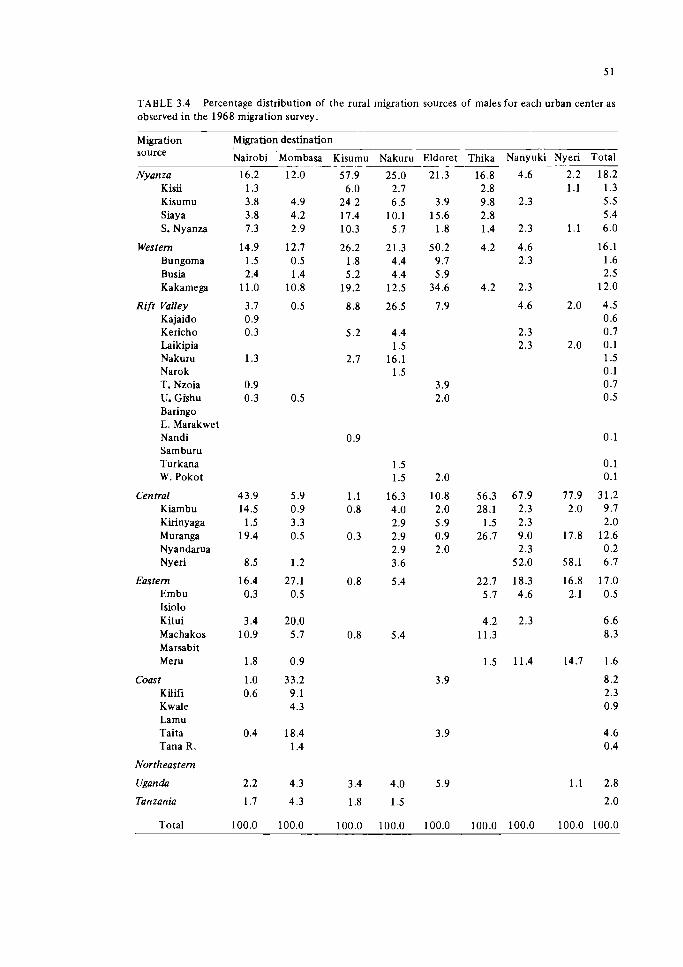
TABLE 3.4 Percentage distribution of the rural migration sources of males for each urban center as observed in the 1968 migration survey.
Migration source
Nyanza Kisii Kisumu Siaya S. Nyanza
Western Bungoma Busia Kakamega
Rift Valley Kajaido Kericho Laikipia Nakuru Narok T. Nzoia U. Gishu Baringo E. Marakwet Nandi Samburu Turkana W. Pokot
Central Kiambu Kirinyaga Muranga Nyandarua Nyeri
Eastern Embu Isiolo Kitui Machakos Marsabit Meru
Coast Kilifi Kwale Lamu Taita Tana R.
Northeastern
Ugan ah
Tanzania
M b a t i o n destination
Nairobi Mombasa Kisumu Nakuru Eldoret Thika Nanyuki Nyeri Total -- - - - - - -- - ---- -
16.2 12.0 57.9 25.0 21.3 16.8 4.6 2.2 18.2
Total 100.0 100.0 100.0 100.0 100.0 100.0 100.0 100.0 100.0

the overall correspondence between the two tables is high. The percentage contributions of the provinces to the migration process differ by less than two in the two tables.
The survey was designed to capture a rural-to-urban rnove in the 1964--68 period but it also made provision for up t o a maxinium of two urban-to-urban moves subsequent t o the initial move. As a result, sorne analysis of urban-to-urban migration is possible. The extent of the urban-to-urban migration flows and the analysis of the data available will be presented in Chapter 10.
4 DETERMINANTS OF RURAL-TO-URBAN MIGRATION
The preferred test of the hypotheses on the deterininants of migration presented in Chapter 1 would require survey data drawn from the rural areas of Kenya. Information would have t o be obtained from household members who have left the region, from com- plete households that have emigrated, as well as from household members who have remained. Data of this nature are not yet available for Kenya.
As is frequently the case, the method of analysis tends to be defined by the data. The primary measure of migration is the 1969 census data o n numbers born in one area but enumerated in another at the time of the census. Our migration survey is based on a sample drawn from recent in-migrants who were still resident in the urban areas at the time of the survey. Neither returnees nor nonmigrants were surveyed. As a result, the analysis of the determinants of migration will have t o be based on an aggregate model ofmigration.
In this chapter several aggregate models, each consistent with the micro decision- making process outlined in Chapter 1 , are formulated. Then the models are tested with the use of least-squares regression technique. Finally, the results of the regression analysis are compared with the reasons given by the men surveyed for leaving their rural homes and selecting a destination.
The discussion in Chapter 1 indicated that there are two separate but related dimen- sions to the migration decision-making. First, there is the need to identify the probability that a member of the labor force in rural district i will relocate duringsome defined period t o an urban location, say town j. Second, there is a need to identify the determinants of a selection of urban destination j from a set of m possible destinations. Here two models, which are considered appropriate t o address the questions posed by these two dimensions of the migration process, are presented and tested.
DETERMINANTS O F THE PROBABILITY O F A RURAL-TO-URBAN MOVE
According t o our model of labor allocation decision-making, households, on the basis of the information available, allocate their labor among local and external employ- ment opportunities so as t o realize their income objectives. To make this model operational a t a regional level of aggregation it becomes necessary to specify the migration behavior in terms of "average" benefits, costs, and characteristics associated with sending regions and receiving regions.
A Polytornous Logistic Model of Migration
The probability Pij that an individual faced with m possible urban locations, plus his current rural location i, will be residing in one of these m urban areas in any one time
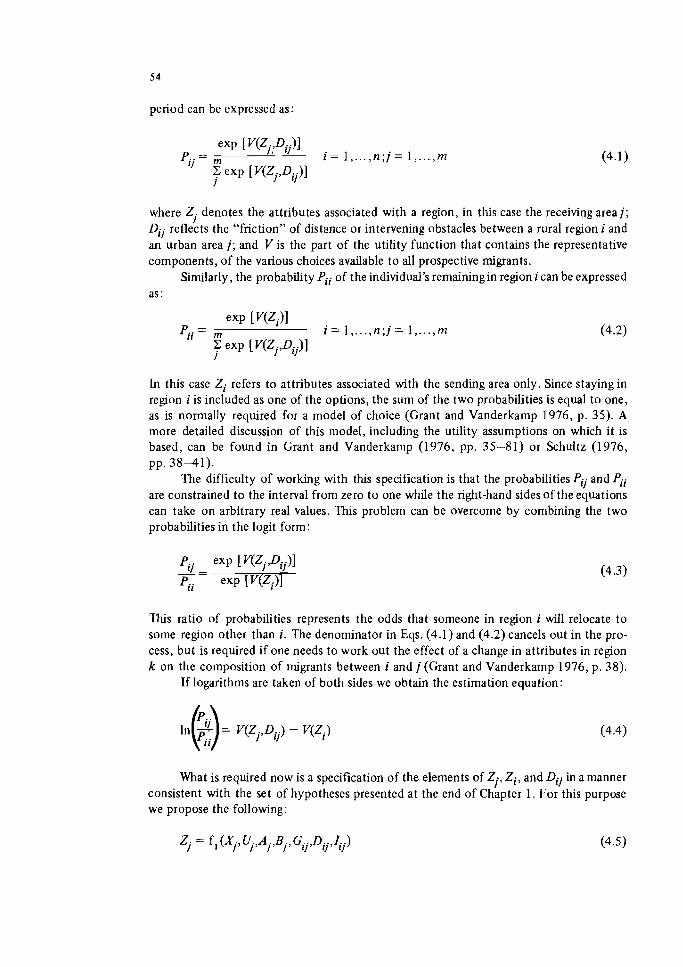
period can be expressed as:
eXP [ V(Zj:Dij)l P. . = ,
'I i = 1 ,..., n ; j = 1 ,..., m
c exp [ V(Zj,Dij)l I
where Z. denotes the attributes associated with a region, in this case the receiving area j ; I
Dij reflects the "friction" of distance or intervening obstacles between a rural region i and an urban area j ; and V is the part of the utility function that contains the representative components, of the various choices available to all prospective migrants.
Similarly, the probability Pii of the individual's remainingin region i can be expressed as :
eXP [V(Zi)l P.. = , i = 1 ,..., n ; j = 1 ,..., m
I
In this case Zi refers to attributes associated with the sending area only. Since staying in region i is included as one of the options, the sum of the two probabilities is equal to one, as is normally required for a model of choice (Grant and Vanderkamp 1976, p. 35). A more detailed discussion of this model, including the utility assumptions on which it is based, can be found in Grant and Vanderkamp (1 976, pp. 35-8 1) or Schultz (1 976, pp. 3 8 4 1 ) .
The difficulty of working with this specification is that the probabilities Pij and Pii are constrained to the interval from zero to one while the right-hand sides of theequations can take on arbitrary real values. This problem can be overcome by combining the two probabilities in the logit form:
This ratio of probabilities represents the odds that someone in region i will relocate to some region other than i . The denominator in Eqs. (4.1) and (4.2) cancels out in the pro- cess, but is required if one needs to work out the effect of a change in attributes in region k on the composition of nligrants between i and j (Grant and Vanderkamp 1976, p. 38).
If logarithms are taken of both sides we obtain the estimation equation:
What is required now is a specification of the elements of Zj, Zi, and Dij in a manner consistent with the set of hypotheses presented at the end of Chapter 1. For this purpose we propose the following:
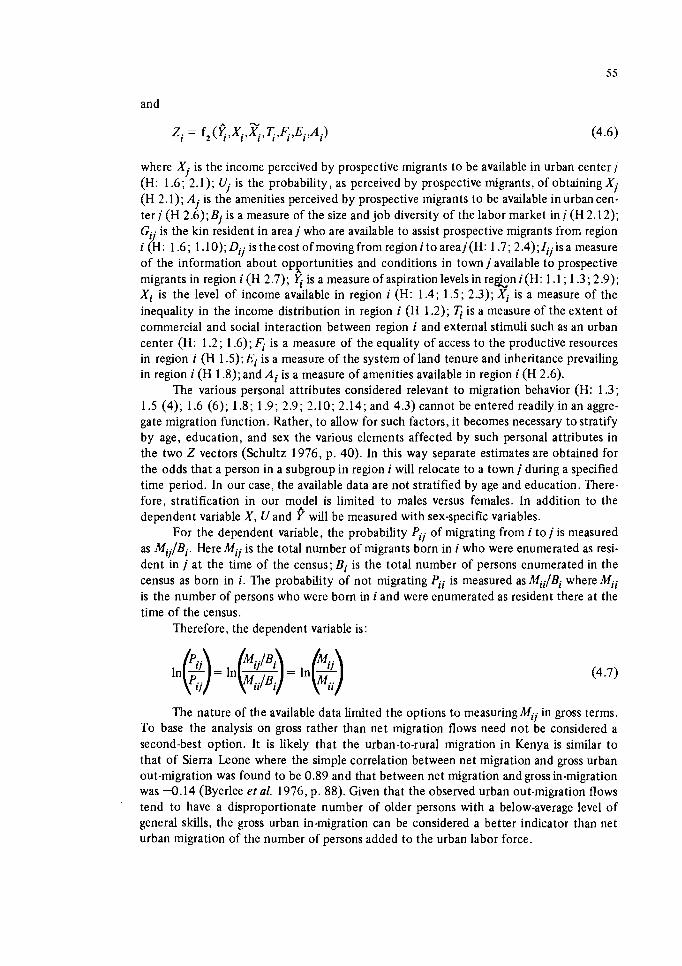
and
where Xi is the income perceived by prospective migrants to be available in urban center j (H: 1.6; 2.1); Uj is the probability, as perceived by prospective migrants, of obtaining Xi (H 2.1); A j is the amenities perceived by prospective migrants to be available in urban cen- ter j (H 2.6); Bj is a measure of the size and job diversity of the labor market in j (H 2.12); Gij is the kin resident in area j who are available to assist prospective migrants from region i (H: 1.6; 1 .lo); Dij is the cost of moving from region i t o area j(H: 1.7; 2.4); Iiiis a measure of the information about op~ortunit ies and conditions in town j available t o prospective migrants in region i (H 2.7); is a measure of aspiration levels in re&on i(H: 1.1 ; 1.3; 2.9); Xi is the level of income available in region i (H: 1.4; 1.5; 2.3); Xi is a measure of the inequality in the income distribution in region i (H 1.2); 7;: is a measure of the extent of commercial and social interaction between region i and external stimuli such as an urban center (H: 1.2; 1.6); F;: is a measure of the equality of access to the productive resources in region i (H 1.5); Ei is a measure of the system of land tenure and inheritance prevailing in region i (H 1.8); and Ai is a measure of amenities available in region i (H 2.6).
The various personal attributes considered relevant to migration behavior (H: 1.3; 1.5 (4); 1.6 (6); 1.8; 1.9; 2.9; 2.10; 2.14; and 4.3) cannot be entered readily in an aggre- gate migration function. Rather, to allow for such factors, it becomes necessary tostratify by age, education, and sex the various elements affected by such personal attributes in the two Z vectors (Schultz 1976, p. 40). In this way separate estimates are obtained for the odds that a person in a subgroup in region i will relocate to a town j during a specified time period. In our case, the available data are not stratified by age and education. There- fore, stratification in our mopel is limited to males versus females. In addition to the dependent variable X , U and Y will be measured with sex-specific variables.
For the dependent variable, the probability Pij of migrating from i to j is measured as M i j / B i Here Mij is the total number of migrants born in i who were enumerated as resi- dent in j at the time of the census; Bi is the total number of persons enumerated in the census as born in i. The probability of not migrating Pii is measured as Mii/Bi where Mii is the number of persons who were born in i and were enumerated as resident there at the time of the census.
Therefore, the dependent variable is:
The nature of the available data limited the options to measuring Mij in gross terms. To base the analysis on gross rather than net migration flows need not be considered a second-best option. It is likely that the urban-to-rural migration in Kenya is similar t o that of Sierra Leone where the simple correlation between net migration and gross urban out-migration was found to be 0.89 and that between net migration and gross in-migration was -0.14 (Byerlee etal. 1976, p. 88). Given that the observed urban out-migration flows tend to have a disproportionate number of older persons with a below-average level of general skills, the gross urban in-migration can be considered a better indicator than net urban migration of the number of persons added to the urban labor force.
In specifying the urban income variable Xi in an aggregate migration model, it is necessary to identify the wage that can be "assumed to be perceived equally by all poten- tial migrants" (Nelson et al. 197 1, p. 57). One would expect prospective migrants to aspire to the wage consistent with their schooling and experience. Yet, the one study in which the sample was stratified into five occupational groupings obtained a higher coefficient of determination when using the average urban wage for all occupations than when using the occupation-specific wage rates (Carvajal and Geithrnan 1974, p. 114). They interpret this to indicate that prospective migrants perceive their income in terms of the regional average rather than the wages paid in their current or desired occupations. Given that wage struc- tures tend to be similar among regions, even if levels differ, the average wage can serve as a good proxy measure for expected income. As a result, the average formal sector wage in each urban center was used as the measure of Xi.
For the rural areas, a weighted average of district formal sector wages and wages paid on small farms and settlement schemes was used t o estimate the value of Xi. The weights used were the respective number employed in each. Given a reasonably competitive labor market in rural areas, the rural wage level can be considered a good approximation of the supply price of labor in a setting where labor allocation is decided by households rather than by individuals (Byerlee et al. 1976, p. 86). Because relevant data required to adjust these income levels were not available, it was necessary to assume that the income levels had comparable values in the respective locations.
The variable Ui is intended to measure the perception by rural household members of their respective probabilities of obtaining the urban wage Xi. The precise specification of thls variable is difficult given the elementary development of the jobsearch theory as it relates to migration models.
In a survey of the literature that seeks to incorporate the concept of job search into migration theory, Miron (1978) separates the literature premised on differential wages from the literature that focuses on the uncertainty involved in obtaining desired employ- ment. We concur with Miron (1978, p. 527) that the former is not particularly relevant in that prospective migrants are reasonably aware of average wages and the postulated wage illusion cannot be demonstrated empirically.
A more recent, intermediate position is that of Harris and Sabot (1976). They allow that migrants are informed of wages available within each firm and they accept that wages vary considerably among firms. Harris and Sabot (1976, pp. 3 9 4 0 ) attribute the varia- tion in wages among firms to: (1) rapidly expanding firms' raising wages to attract more applicants, and (2) firms with significant training and managerial costs inducing low labor turnover by paying above average wages. (On the basis of analysis of the formal sector labor market in Kenya (House and Rempel 1976a; House and Rempel 1978a), the latter is deemed to be the more appropriate for Kenya.) Their model involved sequential job search where an individual compares an existing job offer with the expected costs of search- ing for a "better" offer and then decides whether to accept the original offer or to search further. The decision to search further is seen to be a function of: (1) the migrant's sub- jective evaluation of the labor market conditions; (2) his attitude toward risk and his abil- ity t o bear risk; (3) the cost of the kind of search involved; and (4) the extent of disper- sion of wages among firms (Harris and Sabot 1976, pp. 40-41). Because of imperfect information available to migrants and possibly because of a tendency to overestimate their respective "critical" (reservation) wages, migrants tend to search longer than might be considered optimal which, in turn, affects adversely the urban unemployment rates.
While this approach to specifying the probability of obtaining employment for a migration model seems pronusing, it has not been integrated as yet into a model of migra- tion in an operational manner (Miron 1978, p. 527; Todaro 1976a, p. 44). As a result, we confine our approach to specifying (li to that subset of the job-search literature that focuses on the uncertainty involved in obtaining employment.
Within this subset of the relevant literature Miron (1978, pp. 529-530) identifies three job-search mechanisms: a queuing model of job hiring, the "bingo" model, and Todaro's model. The first assumes that firms maintain lists of all who apply for a position and offer a position to the person at the top of the list at the time the job becomes avail- able. While possibly relevant for high-skill jobs in Kenya, this assumption is not realistic for the hiring mechanisms confronting the vast majority of the rural-urban migrants.
The bingo model is the opposite extreme of the queuing model. Here no waiting lists are maintained and a job is offered to the first qualified person who applies after the job becomes available. The Todaro model is a special case of the bingo model that enables the probability of obtaining employment in a given time period to be specified as a func- tion of the ratio of new openings in the labor market and the number of unemployed in that labor market at that time (Todaro 1969; Miron 1978, p. 530). In subsequent work this probability was simplified in that it was equated to the enlployment rate (Harris and Todaro 1970; Todaro 1976a, pp. 34-35).
This last specification has several undesirable properties. First, it assumes that all jobs turn over every time period (Fields 1975, p. 178). Second, it represents the special case for the bingo model where the net growth in job creation in the particular labor market is set at zero (Stightz 1974, pp. 223-226). Removing these unnecessarily restric- tive assumptions, we obtain the more general specification of U , the probability of obtain- ing urban employment (Tobin 1972, p. 1 ; Stiglitz 1974, p. 224; Barnum and Sabot 1975, pp. 13-14;Sabot 1975a, p. 12;Todaro 1976b, p. 213). Thus,
where g is the rate of new job creation; q is the quit rate, including retirement; u is the unemployment rate; and t identifies the time period. In his discussion, Stiglitz (1974, p. 226) also specifies the amount of unemployinent and the migrant's expected time of unemployment for the queuing model.
This general specification, with the following modifications, was used in our regres- sion model. First, information on q was not available. %s omission of q from the specifi- cation of Ui will bias downward the coefficient for Ui. Second, employment and labor force data by district and town first became available in 1964 so it was not possible to measure Ui for period t - 1.
In addition to these measurement problems, several other shortcomings of this speci- fication of (li have been identified. First, the model in this form assumes that migrants have to be in town to be able to search for a job. Where this is probably the case for most migrants, there no doubt are exceptions which should be allowed for in Eq. (4.8) (Fields 1975, pp. 169-171). Second, this specification assumes that the migrant is unemployed during the job search. Some migrants get part-time employment in the informal sector while they search for a permanent job so that they can remain in town for a longer period
(Fields 1975, pp. 171 -1 76; Sabot 1975a, pp. 1 1 -1 3). The omission of these two factors introduces an upward bias t o our coefficient for Ui. A third factor is that the probability of being selected from a given stock of unemployed is not equal among all the unemployed. Specifically, the probability of being selected is expected t o vary directly with the level of formal schooling completed (Fields 1975, pp. 176-1 77 ; Gugler 1976, p. 194). Unfortu- nately, the data did not allow us t o incorporate any of these suggested modifications into the general specification.
Finally, and possibly of greatest significance for our purpose here, the manner in which this general specification of Ui is incorporated into migration models assumes that 9 is known by prospective migrants before they move (Miron 1978, p. 531). The Harris and Sabot approach (1976) is more realistic in that migrants are seen to act on the basis of their subjective evaluation of the conditions prevailing in a particular labor market. It is to be expected that this subjective evaluation draws more on information regarding new jobs becoming available than on the rate of job creation over time. In an attempt to account for this fact, another specification of Ui was tested. InEq. (4.8), g was defined as the number of new jobs created in town j during time period t divided by the sum of all jobs created during this period in all eight urban centers.
The urban income level Xi and the probabihty of obtaining employment Ui were entered in the migration model separately to avoid the restrictive assumption, typical of the Todaro migration model, that migrants are risk neutral. We concur with Bausell(1975) that migrants are more likely risk averse. But his position is rather extreme: that the risk inherent in farming, relative to the risk of investing in human capital in the form of a rural- to-urban move, is so low that it can be assumed to be zero (Bausell 1975, pp. 70-71). There is no a priori reason fo t assuming that farming is a less risky means of obtaining a desired level of income (Y = Y) than the search for urban employment. Rather, the secur- ity inherent in farming is that it is a form of protection against income falling below sub- sistence (Y < (C-A)). Also we postulate (H 2.10) that it is the young men who are the most willing to take risk and hence are more likely than older men to select an urban destination. Because the precise role of risk was not known, no attempt was made to build assumptions about risk into the migration model.
Given that our measures of amenity availability were indices only, a decision was made to enter the two indices as one ratio (Aii = Ai/Ai). The urban amenity index Ai was weighted by the population size of town j. The rationale here was that two towns may have the same level of amenities, but the larger town, other things equal, is preferred by prospective migrants because a larger quantity and hence variety of this level of amenities is available there. This weighting of Ai by population size incorporates into Ai the labor market size and diversity dimension associated with the manner in which our variable Bi is normally measured (Barnum and Sabot 1975, pp. 3 - 4 ; Grant and Vanderkamp 1976, p. 4). As a result, Bi was dropped from the regression equation and the interpretation of the coefficient for Aij will have t o be expanded to incorporate the role of Bi.
Similarly, our sole measure for Iii, the information about town j available to resi- dents of rural area i , was the kin resident in j , Gii As a result, Iii was dropped from the regression equation and the coefficient for Gii will have t o be interpreted to incorporate the effect of Iii.
In most migration models the distance, Dii, between i and j , is entered as a measure of both the pecuniary costs of moving as well as the various noneconomic (e.g., psychic)
costs such as being separated from family and friends. (For an extended discussion of this subject see Levy and Wadycki 1974a.) In addition, a complete specification of the pecuni- ary costs of moving should encompass the cost of subsistence during job se~rch as well as the costs of the job search itself. For this purpose Dij was split into two parts: (1) DAij, the pecuniary cost of moving - bus fare, subsistence cost duringjob search, and jobsearch costs; and (2) DBij, the extent of psychic separation between i and j measured in terms of the length of a bus trip from i to j.
For the remaining rural variables, direct measures were not availaye so a variety of proxy measures had to be employed. In the case of aspiration levels 5, the postulated link between the desire for formal schooling and aspirations suggested that the proportion of school-age children who had attended school was a means of measuring the level of 6 in a district.
Income distribution data within districts and most towns are not available for Kenya. As a result, the dominant means of generating income in the rural areas, land, was used as a proxy measure. For the smalI farmers, income beyond subsistence is earned from cash crops. Therefore, the proportion of land held by smallholders and the proportion of land in seLtlement schemes in each district that is devoted to cash crops was used as a measure for Xi. It is postulated that the larger the proportion of small farmers growing cash crops the more equal the income distribution within the district. In the case of 4, equality of access to productive resources, the proportion of land in each district (adjusted for qual- ity) that was held by small farmers and in settlement schemes was considered an appro- priate measure.
For q, the extent of commercial and social interaction between i and j, the length of roads per square kilometer in district i was used as a proxy measure. The more devel- oped a road system within a district the more likely that people in the district would have both the interest and the means for interaction with outside areas such as a town or a city. The effect of q on out-migration is not defined precisely. Improved means for commercial interaction can serve to increase local income possibilities, so out-migration may be reduced. Conversely, if increased interaction with the outside heightens awareness of opportunities available elsewhere but does not have a corresponding positive effect on local income possibilities, then out-migration can be expected to increase.
Finally, several local area studies in Kenya have shown that local inheritance laws have an effect on rural out-migration (Weisner 1972, p. 72;Moock 1973,p. 304).(Mendels (1978) makes a similar argument based on historical data for Europe.) Where only the oldest son inherits, the younger siblings must seek economic opportunities elsewhere. Similarly, if all inherit equally, the amount of land is small, and a strong kinship system exists, some household members may be encouraged to seek empIoyment elsewhere. Con- versely, a claim to land that cannot be sold, because local traditions prohibit permanent alienation of land, may deter some rural residents from breaking completely from their rural home.
Given that it was impossible to measure directly variations between districts in inheritance laws and land tenure systems a proxy measure also had to be employed for Ei, the measure of the system of land tenure and inheritance prevailing in region i. One that was considered appropriate was the proportion of land in a district available for small- holder registration that had been registered. Registration sets minimum limits on the size of farm holdings, so those with registered land are likely to have a viable farm unit which
would serve to deter out-migration. Conversely, if land cannot be subdivided further, some children may not be able to inherit directly. Since registration facilitates their selling claims to such land, registration may serve to induce more out-migration.
Given this possibility of effects in opposite directions on both and Ei on out- migration, it was not possible to postulate a sign for these two variables. For all the other explanatory variables-a one-tad significance test was considered appropriate. Th-e signs for Xi , 5, Aii, Gij, and are hypothesized to be positive and for DAii, DBii, X i , Xi , and 4 a negative sign is expected.
The functional form considered appropriate for this migration model is log-linear. This form avoids the problem associated with the linear function of assuming that the mar- ginal utility of money income is constant (Grant and Vanderkamp 1976, p. 37). Also, in the log-linear form the marginal effect of individual explanatory variables depends on the values of the other explanatory variables in the function (Knowles and Anker 1977a,p.4).
An econometric problem associated with this specification of the migration function is the possibility of simultaneity of the dependent variable and some of the explanatory variables. Specifically, the flow of migrants into j , in response to Xi, can be expected to have feedback effects on the level of Xi. A simultaneous equation model would be one method of capturing this interaction between in-migration and wage levels. But, given our choice of model, a simultaneous equation system is not practical because Xi would be affected by the in-migration from all sources, not merely from the one source i.
Our earlier analysis of labor market pressure in Kenya indicates that the labor force is highly responsive to interregional differences in economic opportunities but wages were found to be unresponsive to growing labor market pressure (House and Rempel 1978). Therefore, the simultaneity problem does not appear to be a major obstacle and our pro- posed model is deemed appropriate for the purposes of this study.
Regression Results
The singleequation ordinary least-square regression results for males and females are reported in Table 4.1. Table 4.2 contains the correlation matrix for the variables in these two equations. The manner in which the variables were measured, including the data sources, is given in the appendix to this chapter.
The postulated regression model serves to explain 85 percent of the interdistrict variation in the odds of a rural resident's relocating to an urban area. The coefficients of determination (R2) are significant at the 1 -percent level.
The effect of economic opportunities in the destination areas, as measured by aver- age wages in the urban modem sector, has the postulated effect on rural--urban migration. The coefficients for Xi are significant in both cases and have the expected positive sign. The effect of urban income on migration of males is almost twice that of females. In each of the two equations the coefficient for Xi is somewhat larger than the coefficient for any of the other explanatory variables, indicating the prime importance of urban income pros- pects in migration decision-making.
The other measure of urban economic opportunities, 5, has an unexpected nega- tive sign in both cases and is statistically significant for males. (Given the opposite sign, a two-tail significance test was used for I!.$. The coefficient for females is significant at the
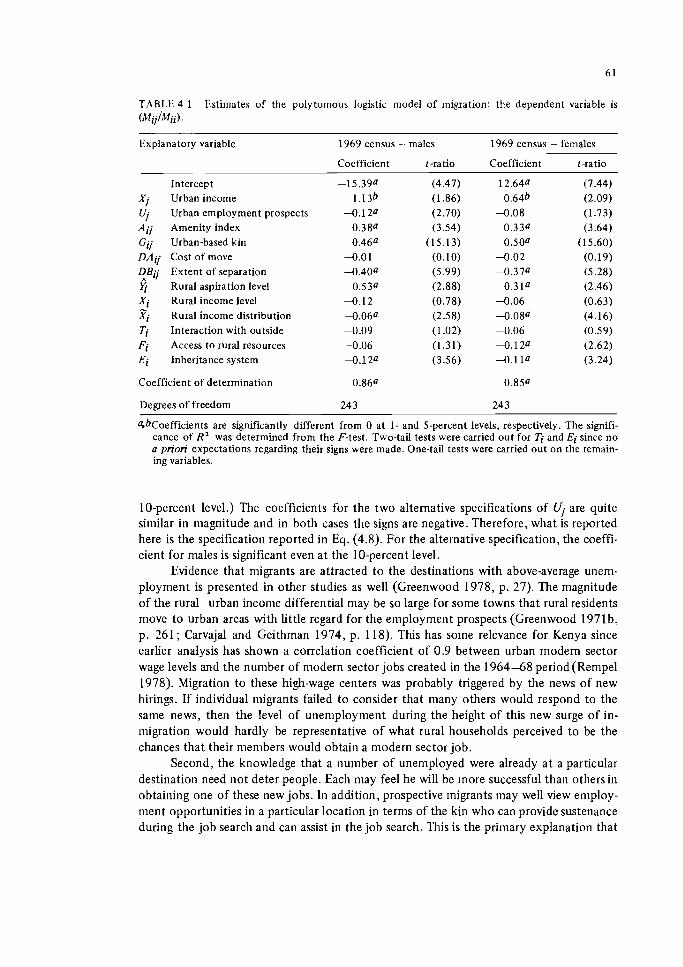
TABLE 4.1 Istimates of the polytomous logistic model of migration: the dependent variable is (MiiIMii).
Explanatory variable - - - - -
1969 census - males 1969 census - females
Coefficient t-ratio Coefficient t-ratio
Intercept Urban income Urban employment prospects Amenity index Urban-based kin Cost of move Extent of separation Rural aspiration level Rural inconie level Rural income distribution Interaction with outside Access to rural resources Inheritance system
Coefficient of determination
D e ~ e e s of freedom -
4 b ~ o e f f i c i e n t s are significantly different from 0 at 1- and 5-percent levels, respectively. The signifi- cance of R 2 was determined from the F-test. Two-tail tests were carried ou t for Ti and Ei since n o a pnon expectations regarding their signs were made. One-tail tests were carried ou t on the remain- ing variables.
10-percent level.) The coefficients for the two alternative specifications of Ui are quite similar in magnitude and in both cases the signs are negative. Therefore, what is reported here is the specification reported in Eq. (4.8). For the alternative specification, the coeffi- cient for males is significant even at the 10-percent level.
Evidence that migrants are attracted to the destinations with above-average unem- ployment is presented in other studies as well (Greenwood 1978, p. 27). The magnitude of the rural--urban inconie differential may be so large for some towns that rural residents move to urban areas with little regard for the employment prospects (Greenwood 1971b, p. 261 ; Carvajal and Geithman 1974, p. 1 18). This has some relevance for Kenya since earlier analysis has shown a correlation coefficient of 0.9 between urban modem sector wage levels and the nuinber of modern sector jobs created in the 1964-68 period(Rempe1 1978). Migration to these high-wage centers was probably triggered by the news of new hirings. If individual migrants failed to consider that many others would respond to the same news, then the level of unemployment during the height of this new surge of in- migration would hardly be representative of what rural households perceived to be the chances that their members would obtain a modern sector job.
Second, the knowledge that a nuinber of unemployed were already at a particular destination need not deter people. Each may feel he will be more successful than others in obtaining one of these new jobs. In addition, prospective migrants may well view employ- ment opportunities in a particular location in terms of the kin who can provide sustenance during the job search and can assist in the job search. This is the primary explanation that
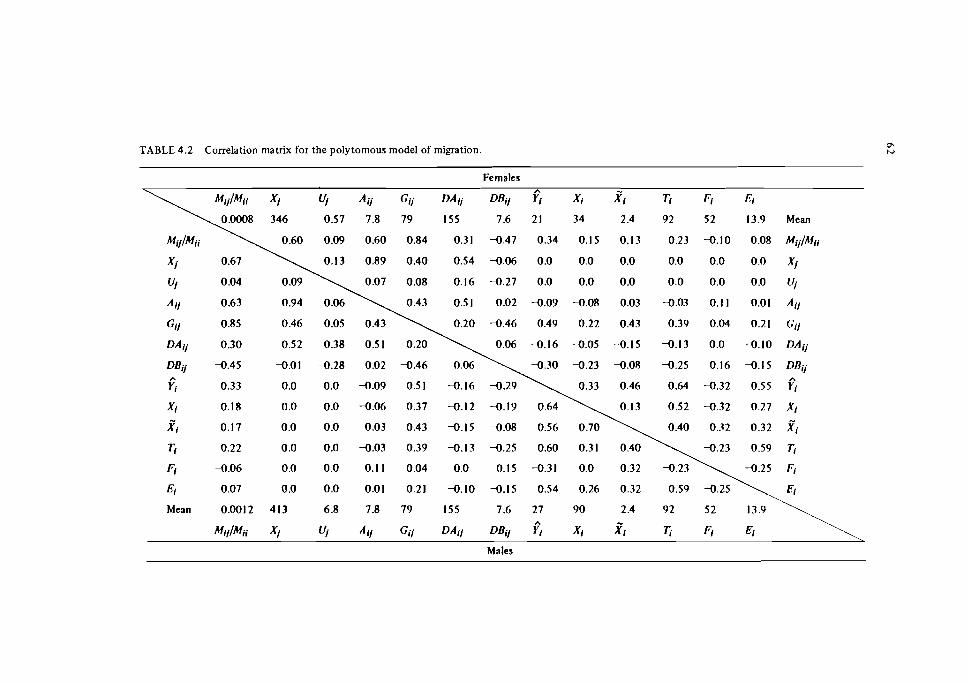
TABLE 4.2 Correlation matrix for the polytomous model of migration.
Females
Wj Ail Gij DAij DRil 6 Xi Zi Ti 4 Ei
0.57 7.8 79 155 7.6 21 34 2.4 92 52 13.9 Mean
Xi 0.18 0.0 0.0 -0.06 0.37 -0.12 -0.19 0.64 0.13 0.52 -0.32 0.27 XI
f 0.17 0.0 0.0 0.03 0.43 -0.15 -0.08 0.56 0.70 0.40 0.32 0.32 ,fi
Ti 0.22 0.0 0.0 -0.03 0.39 -0.13 -0.25 0.60 0.31 0.40 -0.23 0.59 Ti
Fi -0.06 0.0 0.0 0.1 1 0.04 0.0 0.15 -0.31 0.0 0.32 -0.23
Ei 0.07 0.0 0.0 0.01 0.21 -0.10 -0.15 0.54 0.26 0.32 0.59 -0.25
Mean 0.0012 413 6.8 7.8 79 155 7.6 27 9 0 2.4 92 52 13.9
MijlMii X/ Uj All Gi/ DAi/ DB~/ El X, f i Ti Fi Ei
Males
Byerlee et al. ( I 976: pp. 95-96) attach t o the low value of the coefficient that they obtain for their unemployment variable in their Sierra Leone survey. We will consider this possi- bility in the analysis of our survey results, both in the latter part of this chapter and in Chapter 7.
The third measure of urban attractiveness, the amenity index Aij , is statistically sig- nificant for both males and females and has the postulated positive sign. This result is obtained even though there is a high correlation between the urban income level Xi and Ai i The results stand in contrast to earlier analysis where amenities were found to be a significant determinant of migration for females only (Rempel 1978, Table 7:4). One major difference between this earlier analysis and the results reported here is our weighting of the urban amenity index by the population sizes of the eight towns.
The effect of this weighting procedure suggests that the impact of Bi, the measure of the size and diversity of the labor market in j , is expressed prominently in our measure of amenities. An attempt will be made to separate the amenity availability effect from the effect of Bi in our analysis of the survey results in the latter part of this chapter and in Chapter 8.
In almost all migration studies distance has been shown to be a significant deterrent to migration. The magnitude of the coefficient has frequently been interpreted to indicate that distance stands as a proxy for more than merely the monetary costs of moving (Greenwood 1969, pp. 285-286, 1971b, pp. 256-257; Levy and Wadycki 1973,1974b, p. 384; Byerlee et al. 1976, p. 92; Rempel 1978; House and Rempel 1978a, p. 14). Our two measures of the cost of moving separate explicitly the total costs of the transition from rural to urban employment, DAij, from the psychic cost (in terms of the length of a bus ride) of being separated from kin, DBii Although the two variables are not highly correlated with each other, the monetary cost of moving is correlated positively with Xi and Ai i These positive correlations indicate the town with the highest wage levels and with the largest, most diverse labor forces attract migrants from a wider circle of rural areas.
The regression coefficients support the conclusion of some scholars that psychic costs and the effect of distance on information flows predominate in migration decision- making (Levy and Wadycki 1973; 1974b, p. 385). When the average one-period rural income differentials of KShs.323 a month for males and KShs.3 12 for females are projected over a time horizon of several years, then the average cost per person of KShs.155 (Shs. = Shillings) is small indeed and it is not surprising that DAii is not significant when it no longer measures the psychic costs of a move.
Conversely, the measure of contact between the rural area and an urban center - kin who have migrated previously as measured by Gii - serves as a consistent, strong determinant of rural-urban migration. The size of the coefficients for Gii are less than for Xi, but rank second for females and third for males among all the coefficients. Both the information and the assistance provided by the urban-based kin will be analyzed in detail in Chapter 7.
Of the determinants specific to the origin of migration, the measure of aspiration levels 6 has the most pronounced effect. The significant positive effect issomewhat higher for males than for females. In contrast, the measure of interaction Ii of region i with out- side areas, which was postulated to affect aspirations as well as provide information, is not significant. A similar result for this variable was obtained by Knowles and Anker (1977a, Table 1, p. 15) in their analysis ofinterdistrict migration in Kenya. The correlation
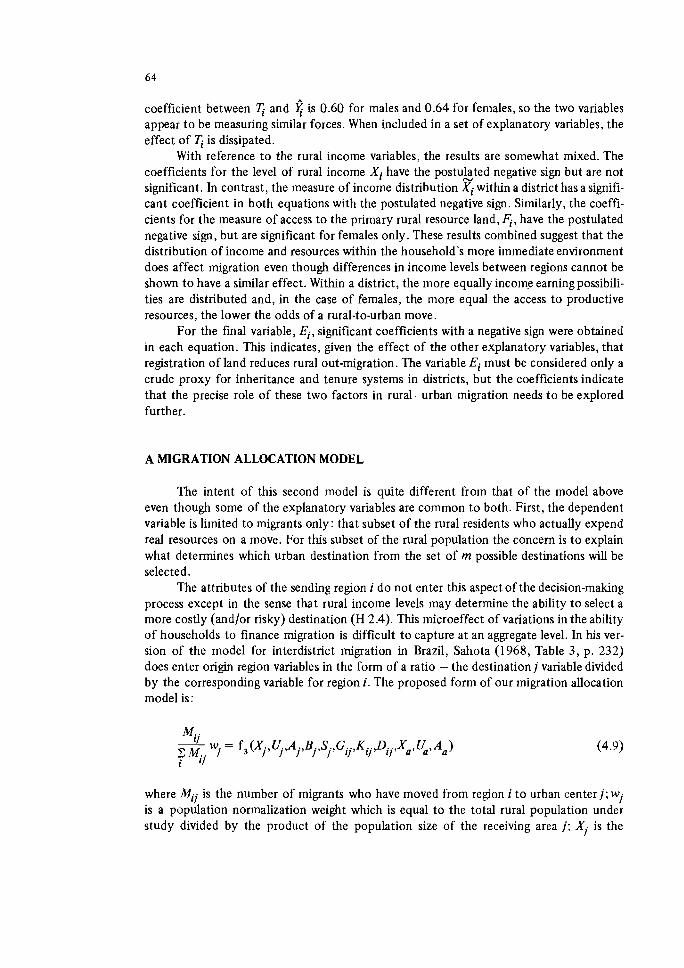
coefficient between q and is 0.60 for males and 0.64 for females, so the two variables appear t o be measuring similar forces. When included in a set of explanatory variables, the effect of q is dissipated.
With reference t o the rural income variables, the results are somewhat mixed. The coefficients for the level of rural income Xi have the postukted negative sign but are not significant. In contrast, the measure of income distribution Xi within a district has a signifi- cant coefficient in both equations with the postulated negative sign. Similarly, the coeffi- cients for the measure of access to the primary rural resource land, 6, have the postulated negative sign, but are significant for females only. These results combined suggest that the distribution of income and resources within the household's more immediate environment does affect migration even though differences in income levels between regions cannot be shown t o have a similar effect. Within a district, the more equally income earningpossibili- ties are distributed and, in the case of females, the more equal the access to productive resources, the lower the odds of a rural-to-urban move.
For the final variable, Ei, significant coefficients with a negative sign were obtained in each equation. This indicates, given the effect of the other explanatory variables, that registration of land reduces rural out-migration. The variable Ei must be considered only a crude proxy for inheritance and tenure systems in districts, but the coefficients indicate that the precise role of these two factors in rural-urban migration needs t o be explored further.
A MIGRATION ALLOCATION MODEL
The intent of this second model is quite different from that of the model above even though some of the explanatory variables are common t o both. First, the dependent variable is limited to migrants only: that subset of the rural residents who actually expend real resources on a move. For this subset of the rural population the concern is t o explain what determines which urban destination from the set of m possible destinations will be selected.
The attributes of the sending region i do not enter this aspect of the decision-making process except in the sense that rural income levels may determine the ability to select a more costly (and/or risky) destination (H 2.4). This microeffect of variations in the ability of households to finance migration is difficult t o capture at an aggregate level. In his ver- sion of the model for interdistrict migration in Brazil, Sahota (1968, Table 3 , p. 232) does enter origin region variables in the form of a ratio - the destination j variable divided by the corresponding variable for region i. The proposed form of our migration allocation model is:
where Mij is the number of migrants who have moved from region i t o urban center j; wi is a population normalization weight which is equal to the total rural population under study divided by the product of the population size of the receiving area j; Xi is the
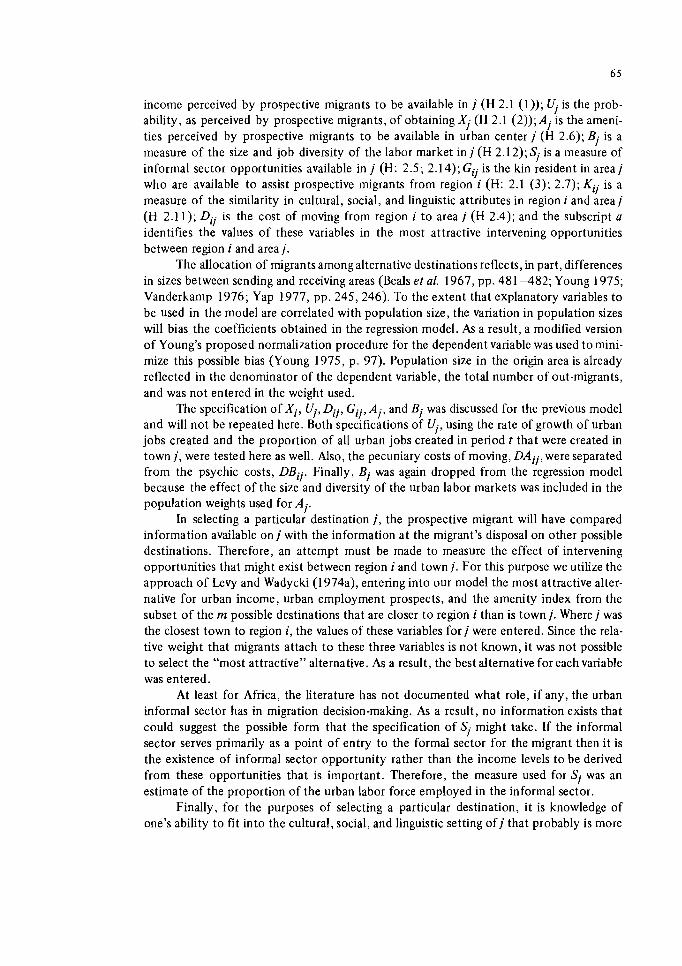
income perceived by prospective migrants to be available in j (H 2.1 (1)); Ui is the prob- ability, as perceived by prospective migrants, of obtaining Xi (H 2.1 (2)); Ai is the ameni- ties perceived by prospective migrants to be available in urban center j (H 2.6); Bi is a measure of the size and job diversity of the labor market in j (H 2.1 2); Si is a measure of informal sector opportunities available in j (H: 2.5; 2.14);Gii is the kin resident in area j who are available to assist prospective migrants from region i (H: 2.1 (3); 2.7); Kii is a measure of the similarity in cultural, social, and linguistic attributes in region i and area j (H 2.1 1); Dii is the cost of moving from region i to area j (H 2.4); and the subscript a identifies the values of these variables in the most attractive intervening opportunities between region i and area j .
The allocation of migrants among alternative destinations reflects, in part, differences in sizes between sending and receiving areas (Beds et al. 1967, pp. 481 4 8 2 ; Young 1975; Vanderkamp 1976; Yap 1977, pp. 245,246). To the extent that explanatory variables to be used in the model are correlated with population size, the variation in population sizes will bias the coefficients obtained in the regression model. As a result, a modified version of Young's proposed normalization procedure for the dependent variable was used to mini- mize this possible bias (Young 1975, p. 97). Population size in the origin area is already reflected in the denominator of the dependent variable, the total number of out-migrants, and was not entered in the weight used.
The specification of Xi, Ui, Dii, Gii, Ai, and Bi was discussed for the previous model and will not be repeated here. Both specifications of Ui, using the rate of growth of urban jobs created and the proportion of all urban jobs created in period t that were created in town j , were tested here as well. Also, the pecuniary costs of moving, DAii, were separated from the psychic costs, DBii Finally, Bi was again dropped from the regression model because the effect of the size and diversity of the urban labor markets was included in the population weights used for Ai.
In selecting a particular destination j, the prospective migrant will have compared information available o n j with the information at the migrant's disposal on other possible destinations. Therefore, an attempt must be made to measure the effect of intervening opportunities that might exist between region i and town j. For this purpose we utilize the approach of Levy and Wadycki (1974a), entering into our model the most attractive alter- native for urban income, urban employment prospects, and the amenity index from the subset of the m possible destinations that are closer to region i than is town j. Where j was the closest town to region i, the values of these variables for j were entered. Since the rela- tive weight that migrants attach to these three variables is not known, it was not possible to select the "most attractive7' alternative. As a result, the best alternative for each variable was entered.
At least for Africa, the literature has not documented what role, if any, the urban informal sector has in migration decision-making. As a result, no information exists that could suggest the possible form that the specification of Si might take. If the informal sector serves primarily as a point of entry to the formal sector for the migrant then it is the existence of informal sector opportunity rather than the income levels to be derived from these opportunities that is important. Therefore, the measure used for Si was an estimate of the proportion of the urban labor force employed in the informal sector.
Finally, for the purposes of selecting a particular destination, it is knowledge of one's ability to fit into the cultural, social, and linguistic setting o f j that probably is more
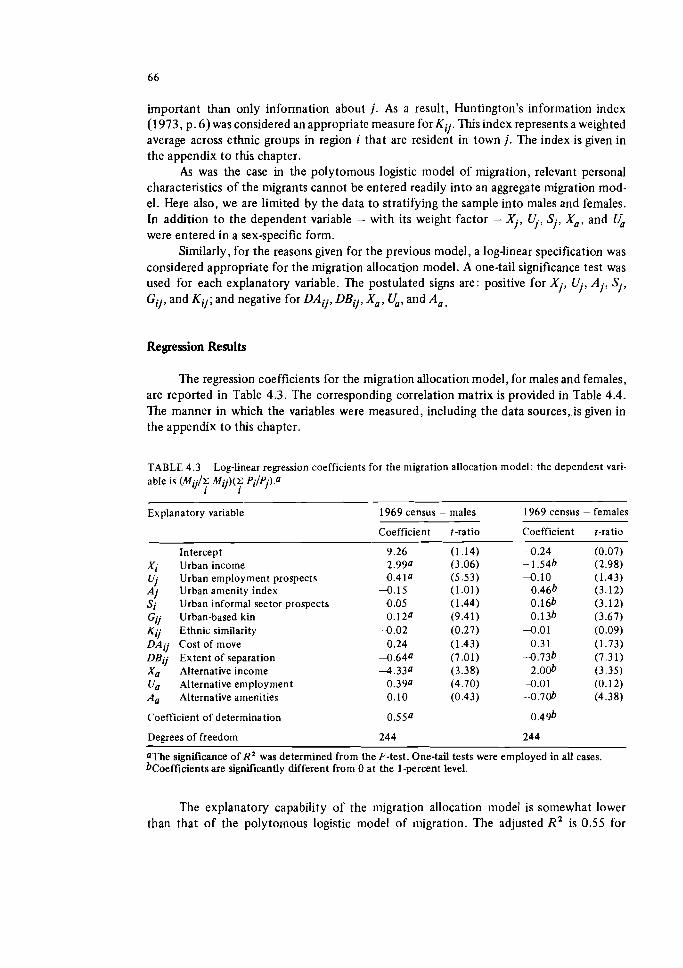
important than only information about j . As a result, Huntington's information index (1 973, p. 6) was considered an appropriate measure for Kij . This index represents a weighted average across ethnic groups in region i that are resident in town j . The index is given in the appendix to this chapter.
As was the case in the polytomous logistic model of migration, relevant personal characteristics of the migrants cannot be entered readily into an aggregate migration mod- el. Here also, we are limited by the data to stratifying the sample into males and females. In addition to the dependent variable - with its weight factor - Xi, 5, Sj, Xu, and U0 were entered in a sex-specific form.
Similarly, for the reasons given for the previous model, a log-linear specification was considered appropriate for the migration allocation model. A one-tail significance test was used for each explanatory variable. The postulated signs are: positive for Xi, q, A j , Sj , G j j , and K j j ; and negative for DAij, DBjj, Xu, U,, and A,.
Regression Results
The regression coefficients for the migration allocation model, for males and females, are reported in Table 4.3. The corresponding correlation matrix is provided in Table 4.4. The manner in which the variables were measured, including the data sources, is given in the appendix to this chapter.
TABLE 4.3 Log-linear regression coefficients for the migration allocation model: the dependent vari- able is ( ~ ; j / ? Mij) (T P ; / P ~ ) . ~
1 1 -- Explanatory variable 1969 census - males 1969 census - females
Coefficient t-ratio Coefficient t-ratio
Intercept Xi Urban income Uj Urban employment prospects Aj Urban amenity index Si Urban informal sector prospects Gij Urban-based kin Kij Ethnic similarity DAij Cost of move DBjj Extent of separation Xu Alternative income U0 Alternative enlployment A, Alternative amenities
Coefficient of determination
Deerees of freedom
0The significance of R 2 was determined from the F-test. One-tail tests were employed in all cases. b~oefficients are significantly different from 0 at the 1-percent level.
The explanatory capability of the migration allocation model is somewhat lower than that of the polytomous logistic model of nligration. The adjusted R~ is 0.55 for
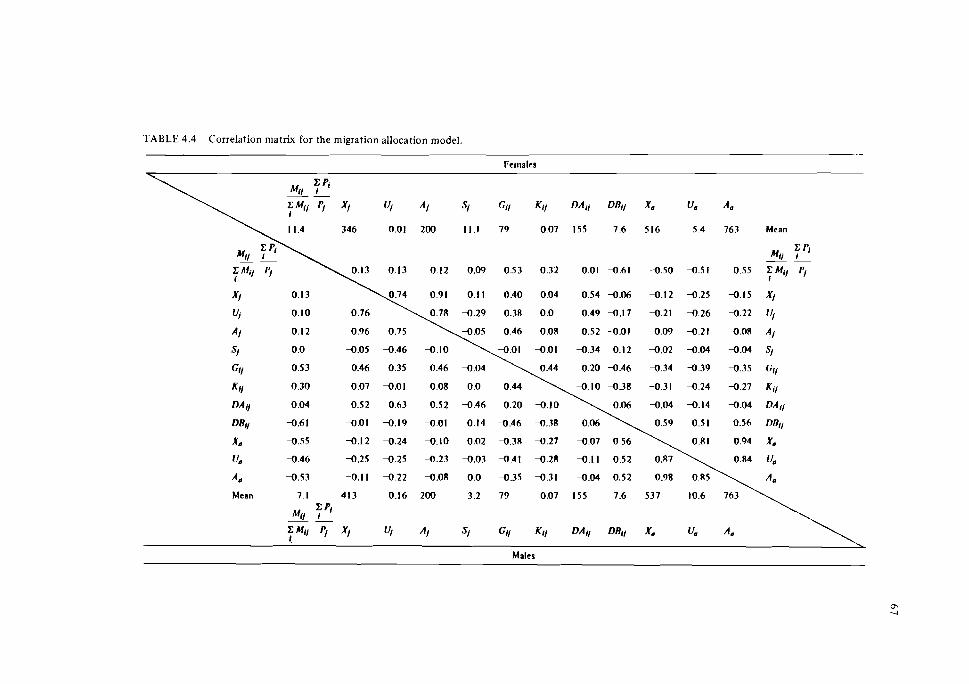
TABLE 4.4 Correlation matrix for the migration allocation model. .-
Fe~nales
Mean
Mean 7.1 413 0 .16 2 0 0 3.2 79 0.07 155 7 .6 537 10.6 763 \
1
Males
males and 0.49 for females. The set of regression coefficients, on the basis of the F-test, is significant in each case.
For males, the magnitude of the coefficients for urban income levels dominates the results. The coefficient for Xi has the expected positive sign and that of X, is negative as postulated. Both coefficients are significant at the 1 -percent level. For females, in contrast, the signs for the two coefficients are reversed. (For females Xi and Ai are highly correlated, but the coefficient for Xi still has a negative sign (though the coefficient is not significant) even if Ai is dropped.) Clearly, females are drawn to a particular urban center by forces other than the level of modern sector income available to females there.
For the urban employment variable Uj, the second specification of g in Eq. (4.8) - modem sector jobs created in jduring 1964-68 divided by the totalnumber ofjobs created in the eight towns during this period - was used.* The results obtained for Uiare the same as those in the polytomous logistic model. The coefficients of l$ both have an unexpected negative sign although for females it is insignificant. Consistent with these results, the coefficient of U, for males has an unexpected positive sign and is significant. For females it has the predicted negative sign but again it is not significant. The only explanations that we can offer for these results are the same ones provided in our interpretation of the results obtained for U in the polytomous logistic model.
Our measure of informal sector opportunities serves as a significant determinant of migration destination selection for females only.** This result shows that both extensive discrimination against women exists in modern sector employment and that women who have accompanied their husbands seek to supplement family income in a secondary labor market. The aggregate nature of the data makes it impossible to distinguish between these two plausible explanations.
Again, urban amenities available is also a significant determinant of destination selec- tion for females only. Consistent with the positive sign for the coefficient ofAi for females, the coefficient of A, for females has the expected negative sign and it is significant. For females the magnitude of the coefficients obtained for Ai and A, ranks below the urban income variable but above that of all the other explanatory variables.
The presence of kin in a particular destination, Gii, is a significant determinant of the selection of that destination. The effect of kin is similar for both males and females. In contrast, given the effect of the other explanatory variables, our measure of cultural, social, and linguistic similarity, Kii. is not significant.
The results obtained for the two "distance" variables are also quite similar t o those obtained in the model presented previously. When the monetary costs of moving are sepa- rated from the psychic costs, the former is not significant as a determinant ofthe selection of a destination. (A two-tail test was used for the coefficient of DAii for females because of the unexpected negative sign. The coefficient realized is significant at the 10-percent level.) As was the case in the previous model, DBii, the measure of the separation between region i and j, varies inversely with the proportion of out-migrants from region i who select town j as a destination.
*The coefficients obtained were quite similar -- -0.32 for males, -0.11 for females, significant at the 1-percent level in the first case and a t the 10-percent level in the second case - but this specification did not cause the coefficient of Xi for males t o become insignificant. The first specification o f g , as reported in Eq. (4.8), was used throughout for Ua
**For both males and females the conelation coefficient between Sj and Ui is negative, yet the regres- sion coefficients for U, are negative. As a result, Sj can be seen as a measure of informal sector alter- natives rather than merely the place where an increasing number of unemployed must seek tosubsist.
In summary then, many of the hypotheses developed in the first chapter stand up well o n the basis of the two migration models developed and tested here. The polytomous logistic model of migration has a relatively high degree of predictive capability. Although the focus of the model is the odds of a rural-to-urban move, rather than the rate of migra- tion frequently used in migration models, any one coefficient can be interpreted in the normal sense of an elasticity, given the effect of the other explanatory variables. The mod- eling of decision-making for destination selection appears t o be quite complex, which is captured only partially by our migration allocation model.
Several summary conclusions can be drawn from the results. Variations in income levels among urban centers are the dominant factor in both the decision whether t o migrate and in the selection of a particular destination. The one exception is the selection of a destination by females. Given the effect of the other explanatory variables, urbanemploy- ment prospects, as specified here, cannot be seen as a significant determinant of either the decision t o migrate or the selection of a particular destination. Amenity availability enters into the decision whether t o migrate but is significant for females only in selecting a par- ticular destination. The cumulative evidence indicates that i t is the size and diversity of what is available in town rather than the level of amenities that a town has t o offer, that is important. Variation among rural areas in income levels was not found t o be a signifi- cant determinant of migration but variation in access t o rural income earning possibilities and variation in levels of aspiration among districts were found t o be significant. The sepa- ration of a rural area from a given town was found t o dominate over the monetary cost of moving when the two were separated. The presence of urban-based kin consistently served as a positive factor in both the decision whether t o move and in the selection of a particular destination. Finally while the predictive capabilities of the two models were quite similar for males and females, there are substantial differences between the two groups, both in the magnitude of the coefficients and the particular explanatory variables that were found t o be significant. As a result, the rural-urban migration of women must be seen as a com- plex process that cannot be reduced t o their merely accompanying husbands who have decided t o move.
THE REASONS F O R MIGRATION GIVEN BY THE MIGRANTS
As part of the migration survey the men were asked t o explain why they had moved t o town. First, the men were asked: "What made you decide t o leave the home you had in the district before you came to this town?" (Question 6) . The results broken down by education and age are provided in Table 4.5.
The migrants' explanations of their own behavior indicate that economic factors are the determining forces. If the first two rows in Table 4.5 are combined, 82 percent of the men said that their primary reason for leaving was limited economic opportunities. In con- trast, only 1 percent listed a lack of social amenities as a primary reason for leaving, while another 5 percent listed their inability t o gain entrance t o the schools in their home area.
If we compare their second reason for leaving with the primary reason, for the men who said that they could not find work as the primary reason, 73 percent did not state a second reason, 12 percent listed that land was not available, and I I percent listed other reasons. Similarly, for the men who gave "land was not available" as a primary reason, 6 percent did not state a second reason while 93 percent gave "could no t find work" as
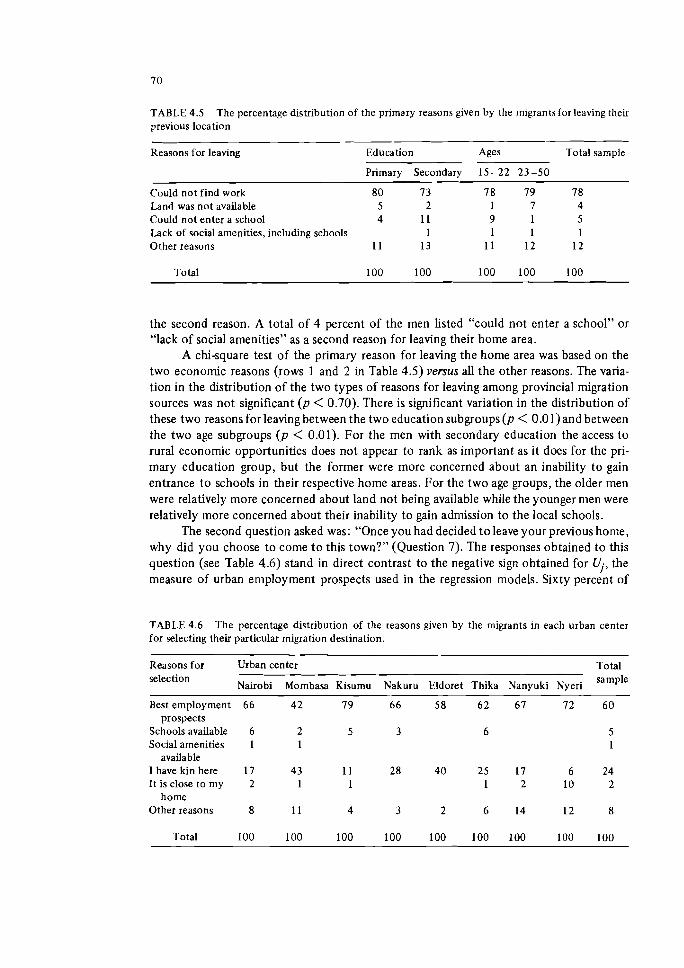
TABLE 4.5 The percentage distribution of the primary reasons given by the migrants for leaving their previous location. -
Reasons for leaving Education Ages Total sample
Primary Secondary 15-22 23-50
Could not find work 80 7 3 7 8 79 7 8 Land was not available 5 2 1 7 4 Could not enter a school 4 11 9 1 5 Lack of social amenities, including schools 1 1 1 1 Other reasons 11 13 11 12 12
Total 100 100 100 100 100
the second reason. A total of 4 percent of the men listed "could not enter a school" or "lack of social amenities" as a second reason for leaving their home area.
A chi-square test of the primary reason for leaving the home area was based on the two economic reasons (rows 1 and 2 in Table 4.5) versus all the other reasons. The varia- tion in the distribution of the two types of reasons for leaving among provincial migration sources was not significant (p < 0.70). There is significant variation in the distribution of these two reasons for leaving between the two education subgroups (p < 0.0 I) and between the two age subgroups (p < 0.01). For the men with secondary education the access to rural economic opportunities does not appear to rank as important as it does for the pri- mary education group, but the former were more concerned about an inability to gain entrance to schools in their respective home areas. For the two age groups, the older rnen were relatively more concerned about land not being available while the younger men were relatively more concerned about their inability to gain admission to the local schools.
The second question asked was: "Once you had decided t o leave your previous home, why did you choose to come to this town?" (Question 7). The responses obtained to this question (see Table 4.6) stand in direct contrast to the negative sign obtained for C$, the measure of urban employment prospects used in the regression models. Sixty percent of
TABLE 4.6 The percentage distribution of the reasons given by the migrants in each urban center for selecting their particular migration destination.
Reasons for Urban center Total selection sample
Nairobi Mombasa Kisumu Nakuru Eldoret Thika Nanyuki Nyeri - -
Best employment prospects
Schools available Social amenities
available I have kin here It is close to my
home Other reasons
Total
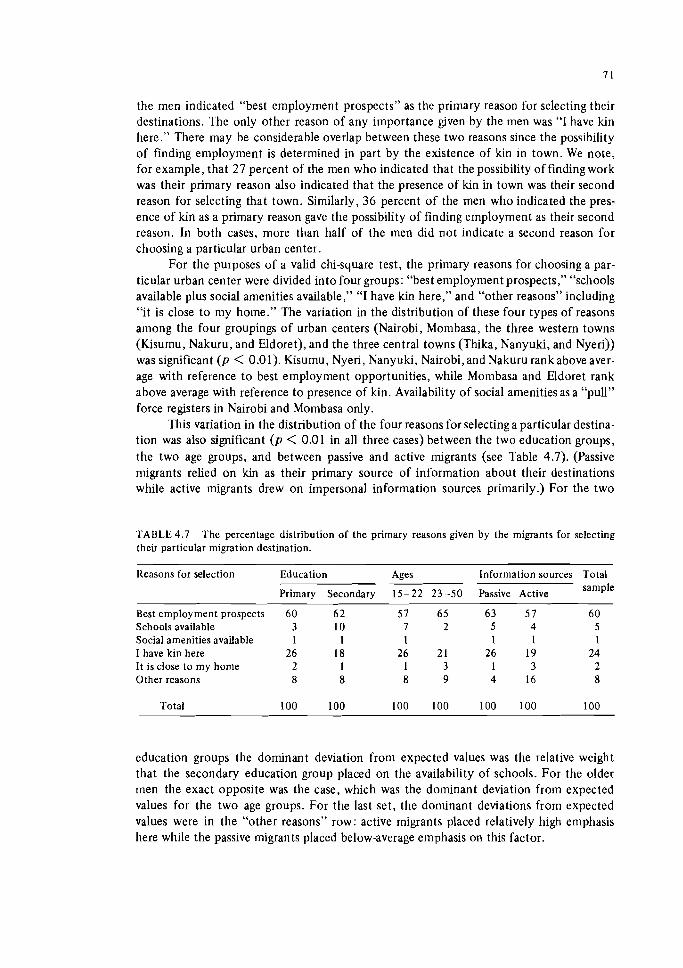
the men indicated "best employment prospects" as the primary reason for selecting their destinations. The only other reason of any importance given by the men was "I have kin here." There may be considerable overlap between these two reasons since the possibility of finding employment is determined in part by the existence of kin in town. We note, for example, that 27 percent of the men who indicated that the possibility of finding work was their primary reason also indicated that the presence of kin in town was their second reason for selecting that town. Similarly, 36 percent of the men who indicated the pres- ence of kin as a primary reason gave the possibility of finding employment as their second reason. In both cases, more than half of the men did not indicate a second reason for choosing a particular urban center.
For the purposes of a valid chi-square test, the primary reasons for choosing a par- ticular urban center were divided into four groups: "best employment prospects," "schools available plus social amenities available," "I have kin here," and "other reasons" including "it is close t o my home." The variation in the distribution of these four types of reasons among the four groupings of urban centers (Nairobi, Mombasa, the three western towns (Kisumu, Nakuru, and Eldoret), and the three central towns (Thika, Nanyuki, and Nyeri)) was significant (p < 0.01). Kisumu, Nyeri, Nanyuki, Nairobi,and Nakuru rankabove aver- age with reference t o best employment opportunities, while Mombasa and Eldoret rank above average with reference t o presence of kin. Availability of social amenities as a "pull" force registers in Nairobi and Mombasa only.
This variation in the distribution of the four reasons for selecting a particular destina- tion was also significant (p < 0.01 in all three cases) between the two education groups, the two age groups, and between passive and active migrants (see Table 4.7). (Passive migrants relied o n kin as their primary source of information about their destinations while active migrants drew on impersonal information sources primarily.) For the two
TABLE 4.7 The percentage distribution of the primary reasons given by the migrants for selecting their particular migration destination.
Reasons for selection Education Ages Information sources Total sample
Primary Secondary 15- 22 23 -50 Passive Active
Best employment prospects 60 62 57 65 63 57 6 0 Schools available 3 10 7 2 5 4 5 Social amenities available 1 1 1 1 I 1 I have kin here 26 18 26 21 26 19 24 It is close to my home 2 1 1 3 1 3 2 Other reasons 8 8 8 9 4 16 8
Total 100 100 100 100 100 100 100
education groups the dominant deviation from expected values was the relative weight that the secondary education group placed on the availability of schools. For the older men the exact opposite was the case, which was the dominant deviation from expected values for the two age groups. For the last set, the dominant deviations from expected values were in the "other reasons" row: active migrants placed relatively high emphasis here while the passive migrants placed below-average emphasis on this factor.
Relating these responses of the migrants to the results obtained from the regression analysis, we note first the primary evidence placed by the migrants on a lack of rural opportunities as a reason for leaving; yet the coefficient for the rural income level was not significant. The rural "push" into the urban scene does not appear to take the form of a desperate search for a livelihood. Rather, the significant coefficient with a negative sign for ?i, the measure of the distribution of rural income earning possibilities, suggests that where cash crop earnings are available to a wider range of people the likelihood of rural- urban migration is reduced.
Further, the survey results suggest that there is limited access to land (shown as not significant for males in the regression analysis on the basis of the coefficient for 4) and jobs in rural areas. This raises the question whether it is the poorest in the rural areas who are migrating. The regression data at the district level were too aggregated to enable us to answer this question. Rather, it will be necessary to address this question on the basis of survey results which form an important part of the next chapter. The evidence presented here points much more to a relative "push" - an inability to meet household aspirations on the basis of rural opportunities open to the household. This is borne out by the positive significant coefficient for the measure of aspiration levels, c. Also, the survey results reported in Table 4.5 can be seen as consistent with this interpretation. A possible gap between aspirations and rural income earning opportunities is especially relevant for young men whose income earning prospects from farming would be limited at this stage in their lives. The median age at the time of migration for the men in our sample was between 22 and 23.
The survey results and the regression results for males for urban income levels (Xi and X,) obtained in both models indicate the prime importance of urban income levels as a major "pull" force. The evidence for urban employment prospects is not as consistent given the negative sign of the coefficient for Ui. It is possible that the emphasis placed on employment prospects as a reason for selecting a destination merely shows that there are kin there who can assist in the job search process, and hence is reflected in Gii in the regres- sion equations. But this is not fully convincing given that some men listed both good employment prospects and kin as their first and second reasons for selecting a destination. The actual role played by urban-based kin will be analyzed in detail in Chapter 7. The emphasis on employment as a reason for selecting a destination suggests that l$ in our nlodels is misspecified. First, the simultaneity problem between in-migration and urban unemployment rates will need to be overcome. Second, the rural household's subjective assessment of the employment prospects in town for its members would appear not to be captured accurately in a variable built around the rate of unemployment in the urban labor market.
With reference to the role of amenity availability as a determinant in the migration process, the survey results are not supportive. Neither the lack of amenities in rural areas nor the existence of amenities in town registers as an important reason for migration. This is consistent with the regression results for males for the amenity index in the migration allocation model but contrary to that obtained in the polytomous logistic model ofmigra- tion. In the latter case the effect of Bi. the size and diversity of the urban job market, appears to be an important element in the coefficient obtained for Aii Thissubject will be discussed further in Chapter 8 where urban amenity use by the migrants will be analyzed.
SUMMARY
Given the structure of the economy and its effect both on aspiration levels as well as the spatial distribution of income earning possibilities, as outlined in Chapter 2, and given the dominance of urban income as an explanatory variable, the rural-urban niigra-- tion can be seen as a rational decision by migrants that serves t o reallocate resources t o where they are in greatest demand. But it does not follow that the many who have chosen not t o move are therefore irrational. The evidence presented here suggests that the migra- tion process is complex, and Amin (1974, pp. 88-89) oversirnplifies considerably when he argues that the decision t o migrate is "completely predetermined." In the chapters that follow the survey results are analyzed in detail t o shed as much light as possible on this complex process; we address the questions of who migrates and why d o they migrate. In the concluding chapter we return t o the potential in public policy of shaping the structure of the economy and hence affecting the spatial distribution of Kenya's population.
APPENDIX: MEASUREMENT O F THE REGRESSION VARIABLES
The Polytomous Logistic Model of Migration
Mii - migration flows. The numbers used in the regression flows are those reported in Tables 3.1 and 3.2. The source is unpublished data from the 1969 census made available by the Central Bureau of Statistics. In addition t o the adjustments t o the data noted in the footnotes of the two tables, an adjustment was made for Nyeri, where 3 7 percent of the enumerated population did no t provide a place of birth. It was assumed that the pro- portions conling from each district were basically correct as reported, so the number of in-migrants from each district was increased by 3 7 percent. For Nairobi and Mombasa the flows are based on the total population while for the smaller towns they are limited t o African population.
Mji - nonmigrants. The value of Mii for males and females is the total number enumerated as born in i (enumerated population less in-migrants plus out-migrants) in the 1969 census less Ci Mii The source for people born in i is Rempel(1974b, Table 2). For the districts that contained one of the six smaller towns, the relevant urban population was subtracted from the number enumerated as born in i.
Xi - urban income. The urban wage data were obtained froin the Annual Enumera- tion of Employees in the modern sector for the years 1964 t o 1968 (Statistics Division 1971, 1972). Because the data for 1964 probably were affected significantly by the Tri- partite Agreement (see Chapter 2), a simple average for the 5 years was used. Wage levels for males and females are given for the private sector in 1968 only. This ratio of male t o female wages was used t o divide the simple average wage level for the 5 years into levels for males and females.
Ui - urban enlployment prospects. Employment data for males and females were obtained from the Annual Enumeration of En~ployees in the modern sector for the years 1964 t o 1968 (Statistics hvis ion 197 1, 1972). Self-employment in the modern sector is enumerated for 1968 only. The ratio of self-employed t o wage employed in 1968 was used
to arrive at an estimate of self-employment in the years 1964 t o 1967. Labor force esti- mates were taken from corrected versions of Tables 1 and 3 of Rempel (1974a). Again, because of the possible distortive effect of the Tripartite Agreement, a simple average of the unemployment rate for the 5 years was used. The unenlployed were defined as labor force less employed and self-employed in the modern sector.
A - amenity index. The amenity index is based on the amenity availability data provided in Table 8.1. For the purpose of this index, the industry column was omitted because the effect of industry was probably expressed already in our measure of modern sector employment. T o arrive a t an index the level of amenity availability for each town and district was obtained by summing across the 2 0 colulnns in Table 8.1. This sum was then weighted by population size t o obtain an index of amenity availability. For the urban centers a relative population weight based o n Pj/Ci Pi such that the weight for Nanyuki remained at one, was used. For the rural areas, the Regional Physical Development Plans rank the towns and villages into four groups depending on the size of the hinterland that each serves. There is some indication that the minimum size of population served is: urban center - 150,000; rural center - 50,000; market center - 15,000; and local center - 5,000. These values were used t o calculate a district weighted average across all relevant towns and villages in each district.
Gii - urban-based kin. The measure for kin was the number of people in town j who were from district i as reported in the 1962 census (Statistics Division 1966, Vol. 111, Appendix 1V.c). The method of estimating rural-urban migration prior t o 1962 from the 1962 census information is outlined in Renipel (1974a, p. 1).
DAii - cost of move. The monetary costs associated with the move are the sum of the cost of the trip, cost of sustenance during the job search multiplied by the average length of time until the first job was obtained, plus the cost of the job search. The cost of the trip was the bus fare from the district headquarters t o town j as given in the fare sched- ule of East African Road Services. In the l i~ni ted number of cases where a fare was not given the sample average of KShs.0.0496 per kilometer was used. The estimated costs of sustenance and job search were taken from Collier and Rernpel(1977, pp. 207 --208). The average number of months unemployed prior t o the first job was estimated from our sur- vey data. A separate value was entered for each region i t o each town j. For the districts where the number of observations was less than five the provincial average was used for the district.
DBii extent of separation. The nonnionetary costs of the move were measured in terms of the time of a bus trip from the headquarters of district i t o town j. The informa- tion was obtained from the schedule of East African Road Services. In the limited number of cases where the district was not serviced, the sample average of 0.0256 hours per kilo- meter was used.
- rural aspiration levels. Aspiration levels were measured in ternis of the percent- age of children aged 5 - 1 4 in each district that were enumerated in the 1969 census as having some formal schooling. The number of persons aged 0-14 who had completed some formal education was obtained from Central Bureau of Statistics (1971, Vol. 111, Table 1). The number of persons aged 5-14 was obtained from unpublished census data. For the purpose of calculating the percentage it was assumed that the cluldren aged 0-4 had not completed any formal education.
Xi - rural income level. The rural income level for males and females was measured as a weighted average of formal sector wages and wages paid on small farms and settlement schemes. The formal sector wage levels were obtained in the same manner as they were for Xi. Information on small farms and settlement schemes was obtained from a 1969 sur- vey as reported in Central Bureau of Statistics (1972, Tables 334 and 235). The weights used wzre the proportions in each type of employment.
Xi - rural income distribution. The income distribution in the rural areas was mea- sured in terms of the percentage of the land held by small farmers and in settlement schemes that were devoted t o cash crops. The amount of land held by small farmers and in settle- ment schemes was obtained from Central Bureau of Statistics (1971, Tables 8 2 and 87). The aggregate area of this land devoted t o cash crops was obtained from Central Bureau of Statistics (1 971, Table 82).
I;: - interaction with outside. This variable was measured as the kilometers of road per square lulometer in each district as given in Singer and Reynolds (1974, Table 1 1 , p. 42).
F;: - access t o rural resources. Access was measured in terms of the percentage of arable land in each district that is available for smallholder registration. The amount of arable land in each district was obtained froin Central Bureau of Statistics (1977, Vol. IV, Table 22). The amount available for registration was taken from Central Bureau of Statis- tics (1972, Table 5 , p. 5). In the few instances where the numerator exceeded the denomi- nator, the amount not alienated, as given in Table 5, was used as the denominator.
.Ei -- inheritance system. This variable was measured as the percentage of land avail- able for registration that had been registered, as given in Central Bureau of Statistics (1972, Table 5, p. 5).
The Migration Allocation Model
There are two additional variables in the allocation model: Si - urban informal sector prospects. From our survey sample, self-employment
activities that were not obviously in the formal sector were obtained. From the survey sample for each urban center the ratio of the informally self-employed t o the sum of the informally self-employed and the unemployed during the first quarter after migration was calculated. This ratio was applied t o the portion of the labor force in town j that was not engaged in the modern sector to obtain the portion of the labor force engaged in the urban infor~nal sector. The same ratio was applied t o the labor force for males and females t o obtain separate estimates for males and females.
Kii - ethnic si~nilarity. The formula provided by Huntington (1973, p. 6) was used:
where Pit is the population of region i in ethnic group t ; Pit is the population of urban area j in ethnic group t ; P is total population; and T i s the rrumber of ethnic groups. The data were obtained from Central Bureau of Statistics (1970, Vol. I, Table 11 and 1971, Vol. IIt Table 4).

5 THE MIGRATION SELECTION PROCESS IN THE RURAL AREAS
From the vantage point of the towns, the magnitude of the urban in-migration appears large. The views of the urban employed on the matter find expression in the words of the editorial writer quoted previously: " . . . far too many of them want to exchange their rural life for town life" (Editorial, East Afncan Standard, February 8 , 1974). From the perspective of the total rural population, as reported in Chapter 3 , the proportion of the population born in the rural areas that is resident in one of the towns is very small indeed. Jn any one year only a select few leave a rural area for one of the towns.* There- fore, it is important to determine who is leaving the rural areas.
Jn this chapter the personal and economic characteristics of the men in the sample are related, where possible, to those of the adult males who have remained in the rural areas. The intent of such a comparison is t o shed as much light as possible on the migration selection process in the rural areas. The question of who migrates really cannot be separated from the question of why people migrate. Therefore, the comparisons made here supple- ment the discussion in the previous chapter on the determinants of migration. Specifically, such personal characteristics as age and education could not be dealt with readily at the aggregate level so they are discussed here.
PERSONAL CHARACTERISTICS OF THE MIGRANTS
Among the more general determinants of migration decision-making in the rural areas, as developed in Chapter 1 and tested in Chapter 4 , there is a built-in selection pro- cess based on personal factors. Two of these, formal schooling completed and age, can be examined in detail.
According to our migration model the likelihood of a rural-to-urban move will vary directly with the level of education of the household members. Summarizing our hypothe- ses: (I) the extent of information of rural households about the towns will be correlated directly with the education of the household members; (2) because of the better access to information and a greater ability t o adapt t o new situations, the educated are more likely to undertake the risk of a rural-urban move; (3) the return reahzed for an additional year of education is higher in the towns than in the rural areas; and (4) given the high level of unemployment in the towns, the probability of being selected from a given stock of un- employed will vary directly with the level of education of the unemployed. As a result, the probability of being able to profit from an urban job will vary directly with the educa- tion of the prospective migrants.
*Certain locations, of course, represent distinct exceptions to this general rule. For example, Moock (1973, p. 303) reports that two-thirds of the adult males in a sublocation in Kakamega district were employed or searching for work outside of the district. But, not all o f these men will be in the larger urban centers; it is to be expected that some proportion will be in towns of less than 10,000 and in rural areas.
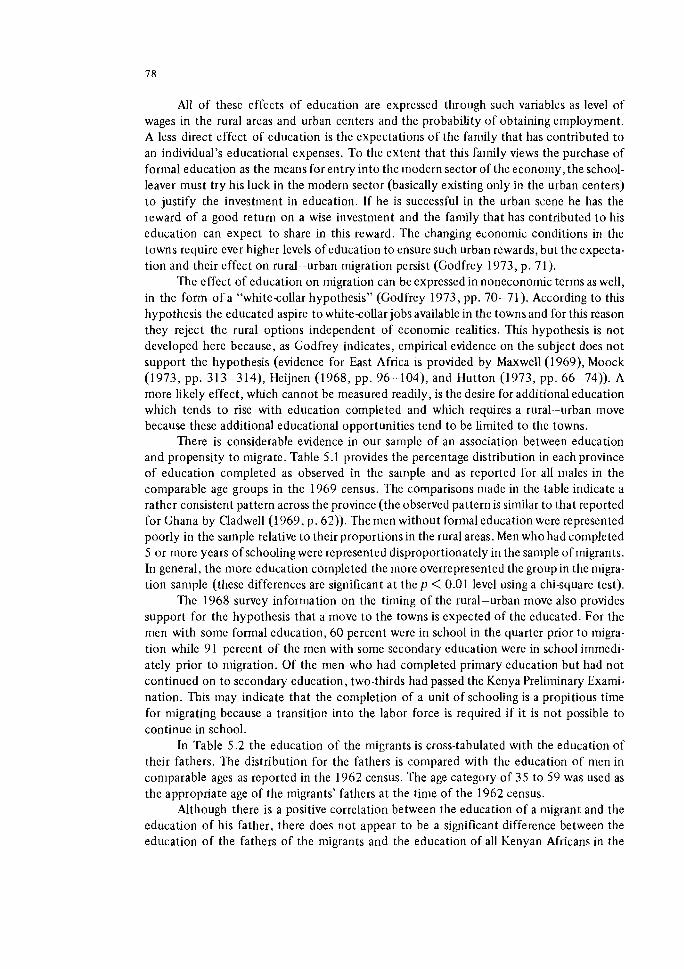
All of these effects of education are expressed through such variables as level of wages in the rural areas and urban centers and the probability of obtaining employment. A less direct effect of education is the expectations of the fanlily that has contributed t o an individual's educational expenses. To the extent that this family views the purchase of formal education as the means for entry into the ~nodcrn sector of the economy, the school- leaver must try his luck in the modern sector (basically existing only in the urban centers) t o justify the investment in education. If he is successful in the urban scene he has the reward of a good return o n a wise investment and the fanlily that has contributed t o his education can expect to share in this reward. The changing economic conditions in the towns require ever higher levels of education to ensure such urban rewards, but the expecta- tion and their effect o n rural--urban migration persist (Godfrey 1973, p. 71).
The effect of education o n migration can be expressed in noneconornic terms as well, in the form of a "whitecollar hypothesis" (Godfrey 1973, pp. 70--71). According to this hypothesis the educated aspire t o white-collar jobs available in the towns and for this reason they reject the rural options independent of economic realities. This hypothesis is not developed here because, as Godfrey indicates, empirical evidence on the subject does not support the hypothesis (evidence for East Africa is provided by Maxwell (1969), Moock (1973, pp. 313-314), Heijnen (1968, pp. 96-104), and Hutton (1973, pp. 66-74)). A more likely effect, which cannot be measured readily, is the desire for additional education which tends t o rise with education completed and which requires a rural--urban move because these additional educational opportunities tend t o be limited t o the towns.
There is considerable evidence in our sample of an association between education and propensity t o migrate. Table 5.1 provides the percentage distribution in each province of education completed as observed in the sainple and as reported for all inales in the comparable age groups in the 1969 census. The comparisons made in the table indicate a rather consistent pattern across the province (the observed pattern is similar t o that reported for Ghana by Cladwell (1969, p. 62)). The men without formal education were represented poorly in the sarnple relative t o their proportions in the rural areas. Men who had completed 5 or more years of schooling were represented disproportionately in the sample of migrants. In general, the more education completed the more overrepresented the group in the migra- tion sanple (these differences are significant a t the p < 0.01 level using a chi-square test).
The 1968 survey information o n the timing of the rural-urban move also provides support for the hypothesis that a move t o the towns is expected of the educated. For the men with some formal education, 6 0 percent were in school in the quarter prior t o migra- tion while 91 percent of the men with some secondary education were in school immedi- ately prior to migration. Of the men who had completed primary education but had not continued on to secondary education, two-thirds had passed the Kenya Preliminary Exami- nation. This may indicate that the completion of a unit of schooling is a propitious time for migrating because a transition into the labor force is required if i t is no t possible to continue in school.
In Table 5.2 the education of the migrants is cross-tabulated with the education of their fathers. The distribution for the fathers is compared with the education of men in comparable ages as reported in the 1962 census. The age category of 3 5 to 59 was used as the appropriate age of the migrants' fathers a t the time of the 1962 census.
Although there is a positive correlation between the education of a migrant and the education of his father, there does not appear t o be a significant difference between the education of the fathers of the migrants and the education of all Kenyan Africans in the
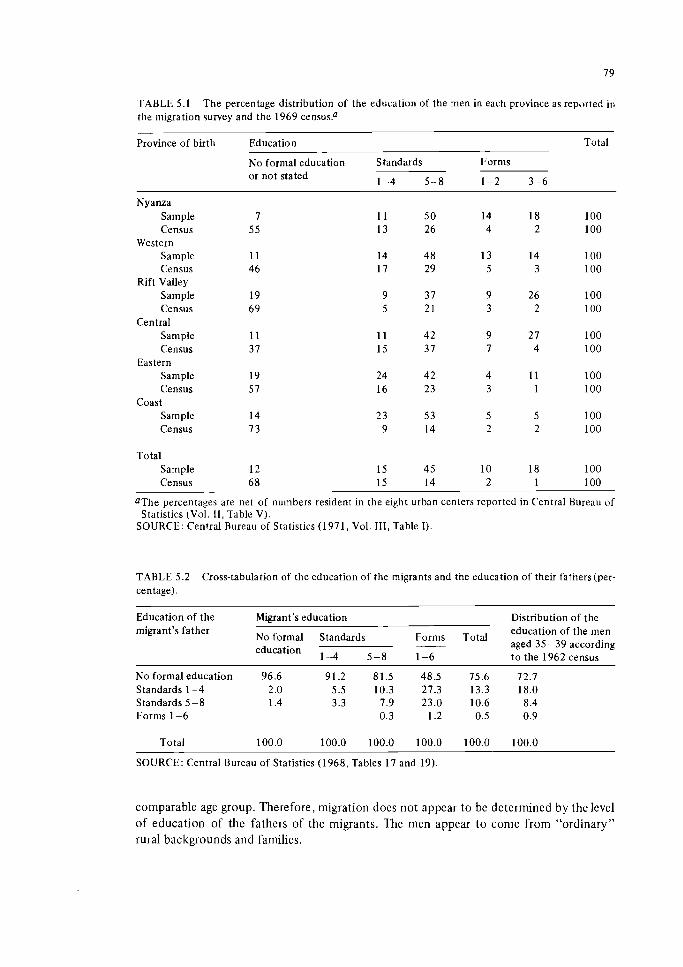
TABLE 5.1 The percentage distribution of the education of the men in each province as reported in the migration survey and the 1969 census."
Province of birth Education Total
No formal education Standards Forms or not stated 1- 4 5--8 1-2 3-6
Nyanza Sample Census
Western Sample Census
Rift Valley Sample Census
Central Sample Census
Eastern Sample Census
Coast Sample Census
Total Sample 12 15 45 1 0 18 100 Census 6 8 15 14 2 1 100
aThe percentages are net of numbers resident in the eight urban centers reported in Central Bureau of Statistics (Vol. 11, Table V).
SOURCE: Central Bureau of Statistics (1971, Vol. 111, Table I).
TABLE 5.2 Cross-tabulation of the education of the migrants and the education of their fathers(per-
Education of the Mierant's education Distribution of the - migrant's father
No formal Standards education of the men
education ?!!! Total aged 35-39 according
1 4 5-8 1-6 to the 1962 census
No formal education 96.6 91.2 81.5 48.5 75.6 72.7 Standards 1 - 4 2 .O 5.5 10.3 27.3 13.3 18.0 Standards 5-8 1.4 3.3 7.9 23.0 10.6 8.4 Forms 1 -6 0.3 1.2 0.5 0.9
Total 100.0 100.0 100.0 100.0 100.0 100.0
SOURCE: Central Bureau of Statistics (1968, Tables 17 and 19).
con~parable age group. Therefore, migration does not appear t o be determined by the level of education of the fathers of the migrants. The men appear t o come from "ordinary" rural backgrounds and families.
Another aspect of the relationship between education and rural-urban migration is the significant variation in the distribution of the levels of education among migrants from different provinces.* Central Province and to a certain extent Nyanza Province provide proportionately more men in the secondary education group. Conversely, Coast and East- ern provinces provide a low number. Eastern and Rift Valley provinces provide propor- tionately more men with n o formal schooling and Coast and Nyanza provinces provide a disproportionate number with only some primary education.
This variation could be the result of three factors: (1) variations between provinces in employment opportunities in the rural areas that lead t o migrations t o obtain employ- ment; (2) variations between provinces in the quality of primary education which deter- mines a student's ability t o compete for the limited number of secondary school admissions available in Kenya; or (3) an unequal distribution of secondary schools among provinces which restricts opportunities for higher education in Eastern, Coast, and Rift Valley provinces.
Given that rural families view formal education as an important means of purchasing entrance t o the urban formal sector, one would expect a high correlation between the extent of out-migration and both the availability and quality of rural educational opportu- nities. If successful entrance into the urban formal sector generates remittances t o rural areas, then the high out-~nigration areas have a greater capability t o expand and improve educational facilities. Therefore, the latter two of the three factors listed above probably explain most of the variations among provinces in the level of education completed by the migrants. If so, the type of out-migration observed from Eastern, Coast, and Rift Valley provinces may well reflect a disproportionately low level of rural employment opportunities within these provinces.
THE AGE DISTRIBUTION O F THE MIGRANTS
In part, the tendency for a disproportionate number of the rural young t o move t o the towns reflects the correlation between age and education. The rapid expansion in the provision of educational opportunities after independence means many of the better- educated Kenyans are relatively young.
According t o our migration model there are several additional economic reasons for the higher tendency of the young t o migrate: (1) the opportunity costs of moving and job search are lower for the young who have not become established as yet , have not acquired specific skills, or have not taken on immediate family obligations; (2) the young typically discount the future a t a lower rate; and (3) the young have a longer time horizon over which t o recover the higher costs associated with an urban move. Finally, various social and personal factors that serve to induce rural-urban migration have a great effect on young adults (Mitchell 1969, p. 178).
The 1968 survey confirmed the expected youthfulness of the migrants. The median age of the men a t the time of migration was between 22 and 23. More than 8 0 percent of the men were less than 3 0 at the time of their migration. As indicated in Table 5.3, the propensity t o migrate is consistently higher in the 20--24 age category. The age
*A chi-square test was used for the six provinces and two education groups, primary versus secondary. The chi-square value was significant at the p < 0.01 level.
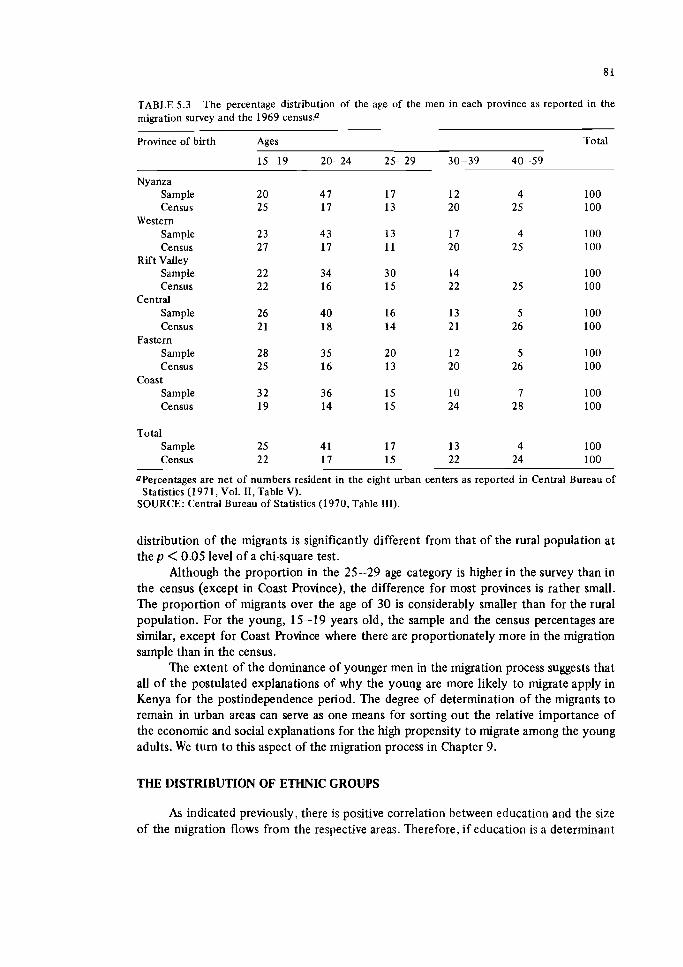
TABLE 5.3 The percentage distribution of the age of the men in each province as reported in the migration survey and the 1969 censusP
Province of birth Ages Total
Nyanza Sample Census
Western Sample Census
Rift Valley Sample Census
Central Sample Census
Eastern Sample Census
Coast Sample Census
Total Sample 25 41 17 13 4 100 Census 22 17 15 22 24 100
UPercentages are net of numbers resident in the eight urban centers as reported in Central Bureau of Statistics (1971, Vol. 11, Table V).
SOURCE: Central Bureau of Statistics (1970, Table 111).
distribution of the migrants is significantly different from that of the rural population at the p < 0.05 level of a chi-square test.
Although the proportion in the 25-29 age category is higher in the survey than in the census (except in Coast Province), the difference for most provinces is rather small. The proportion of migrants over the age of 30 is considerably smaller than for the rural population. For the young, 15-19 years old, the sample and the census percentages are similar, except for Coast Province where there are proportionately more in the migration sample than in the census.
The extent of the dominance of younger men in the migration process suggests that all of the postulated explanations of why the young are more likely to migrate apply in Kenya for the postindependence period. The degree of determination of the migrants t o remain in urban areas can serve as one means for sorting out the relative importance of the economic and social explanations for the high propensity to migrate among the young adults. We turn to this aspect of the migration process in Chapter 9.
THE DISTRIBUTION OF ETHNIC GROUPS
As indicated previously, there is positive correlation between education and the size of the migration flows from the respective areas. Therefore, if education is a determinant
of migratory behavior, then the variation in educational achievement among provinces may explain the relative importance of Central and Nyanza provinces as sources of migra- tion and, conversely, the relative unimportance of Eastern and Coast provinces. On the other hand, there may be conditions within these provinces that determine both the educa- tional level and the propensity t o migrate.
In order t o check on such a common determinant of education and migration, a comparison was made of the distribution of major ethnic groups among provinces in the survey sample and the 1969 census (see Table 5.4). We assumed that the ratio ofmales aged 15 t o 5 0 to the total African population is the same within each province; the distribution of male Africans in each ethnic group within each province was considered t o be the expected value. The deviation of observed migrants in each ethnic group within each province from the corresponding expected values is statistically significant. The dominant deviations from expected values, in order o f importance (with an indication whether the observed value is above or below the expected value) are as follows: Kikuyu, Central Province - above; other tribes, Rift Valley Province - below; Kisii and Kipsigi, Rift Valley Province - below; Kisii and Kipsigi, Nyanza Province - below; Luo, Nyanza Province - above; Embu and Meru, Eastern Province - below; other tribes, Eastern Province -below; Kamba, Eastern Province - above; Luhya, Western Province - above. Therefore there is a distinct tendency for the Kikuyu and, t o a lesser extent, the Luo, Kamba, and Luhya t o have an above-average propensity t o migrate. Conversely, other tribes, the Kisii, Kipsigi, Embu, and Meru have a low propensity t o migrate.
These results are not fully consistent with those of Segal who seeks toexplain differ- ences in the extent of rural-to-urban migration among ethnic groups on the basis of their respective traditional cultural characteristics. According t o Segal (1970, pp. 107-108):
The major theoretical framework utilized in formulating this study's major hypothesis of ethnically based urban migratory differential was scale theory as explicated by Godfrey and Monica Wilson. The major aspect of the scale theory involved was the prediction that largescale traits will be associated with high urban migratory rates and that small-scale traits will be associated with lower ones. Assuming that my identification of specific traits as large or small in scale is accurate, this general prediction is borne out.
On the basis of lus analysis of the 1962 census data the Luo were seen t o have a higher propensity t o migrate than the Kikuyu.* It is possible that the ranking of the Luo above the Kikuyu in 1962, but the reverse in 1969, reflects the proximity of the 1962 census t o the emergency. Kikuyu had been forced out of some of the major urban centers, especially Nairobi, and Luo were brought in t o replace them. The 3 years between the lift- ing of the emergency regulations and the census may have been t o o short a period for a natural adjustment in the spatial allocation of people t o have occurred.
*The analysis of Segal is open to question because of errors in measurement. If as many Luo were urbanized as he claimed, more than 100 percent of the population in the major urban centers in Kenya would be Luo. This error need not totally invalidate his thesis because differences in rural and urban sex ratios among ethnic groups, rather than the number of migrants, is used to measure migra- tion in his analysis.
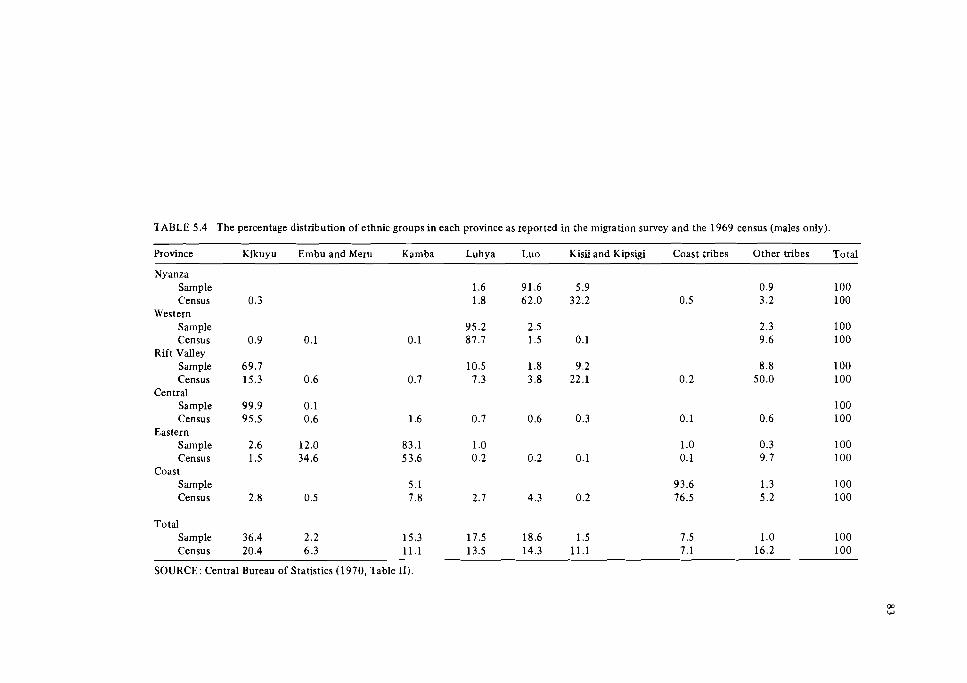
TABLE 5.4 The percentage distribution of ethnic groups in each province as reported in the migration survey and the 1969 census (males only).
Province Klkuyu Embu and Meru Kamba Luhya Luo Kisii and Kipsigi Coast tribes Other tribes Total
Nyanza Sample Census
Western Sample Census
Rift Valley Sample Census
Central Sample Census
Eastern Sample Census
Coast Sample Census
Total Sample 36.4 2.2 15.3 17.5 18.6 1.5 7.5 1.0 100 Census 20.4 6.3 11.1 13.5 14.3 11.1 7.1 16.2 100
SOURCE: Central Bureau of Statistics (1970, Table 11).
In our regression analysis, as reported in the previous chapter, five ethnic groupings - Central Bantu, Western Bantu, Coastal Bantu, Nilotic, and other tribes - were entered as dummy variables in the polytomous logistic model of migration. In the analysis, Coastal Bantu was omitted so the coefficients for the other four indicate whether their propensities t o migrate differ from that of the Coastal Bantu. The results were not reported in Table 4.1 for three reasons: only the coefficient for other tribes was statistically significant, R' for each changed by one percentage point only, and several of the other explanatory vari- ables were then found t o be no longer significant. As expected, other tribes had a signifi- cantly below-average propensity t o migrate. For the ethnic groups that show considerable rural-urban migration there are not significant differences between them in migration propensities, given the effect of the other explanatory variables.
In conclusion then, variation between ethnic groups in their propensity t o migrate cannot be denied. Our analysis merely questions whether these differences are a function of cultural influences independent of the economic realities of each ethnic group. The regression coefficients for the ethnic groups that dominate the migration process typically are not significant, while other tribes (those not listed specifically) stand out as a distinct exception in our economic analysis; this indicates that Segal's thesis may be a better explanation for why some groups do not migrate than for why other groups d o migrate.
ECONOMIC CHARACTERISTICS OF THE MIGRANTS
The identification of the economic variables in the migration selection process is more difficult because the rural data available are not directly comparable t o those obtained in the survey. The year 1969 has been selected as the reference point because more data are available for that year. In addition t o the population census, surveys were made of small farm and settlement scheme employment and of the operation of small-scale, nonagricultural rural enterprises. Although a reference point in the 196440-1 968 period would have been preferable, the year-to-year structural changes in rural economic activity tend t o be small. As a result, the use of 1969 data does not inject a known bias into the analysis.
The Nature of Employment Rior t o Migration
The dominant activity of the men in the quarter prior t o migration was obtaining an education (see Table 5.5). Fifty-two percent of the men were in school, ranging from 20 percent of the older men in Coast Province t o 9 6 percent of the younger men in Rift Valley Province. Only a small minority, 15 percent, were engaged in farmingprior to migra- tion. The proportion is somewhat higher for older men, with the exceptions of Central and Rift Valley provinces. In the latter case, only 2 percent of the men in the sample had been engaged in farming. As inany men were employed for wages as were engaged in farm- ing. Again, the proportion engaged in wage employment is consistently higher for the older men. Almost twice as many men were unenlployed as the sum of the self-employed and the part-time employed. Given that many of the younger men were in school, the unemployment rate was higher for the older men.
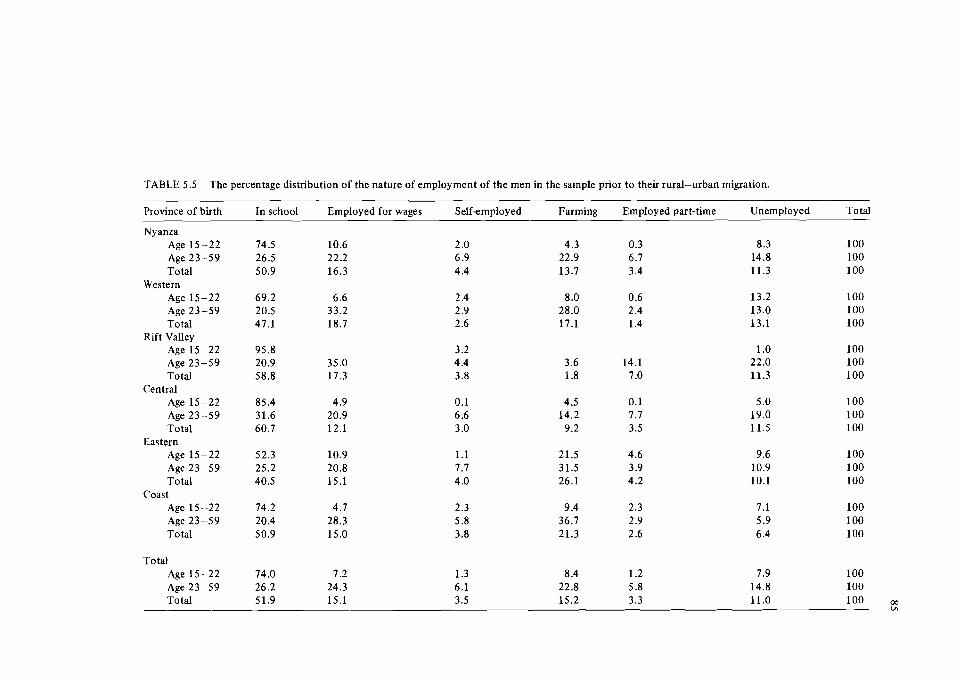
TABLE 5.5 The percentage distribution of the nature of employment of the men in the sample prior to their rural-urban migration.
Province of birth In school Employed for wages Self-employed Farming Employed part-time Unemployed Total
Nyanza Age 15-22 74.5 10.6 2 .O 4.3 0.3 8.3 100 Age 23-59 26.5 22.2 6.9 22.9 6.7 14.8 100 Total 50.9 16.3 4.4 13.7 3.4 11.3 100
Western Age 15-22 69.2 6.6 2.4 8.0 0.6 13.2 100 Age 23-59 20.5 33.2 2.9 28.0 2.4 13.0 100 Total 47.1 18.7 2.6 17.1 1.4 13.1 100
Rift Valley Age 15-22 95.8 3.2 1 .O 100 Age 23-59 20.9 35.0 4.4 3.6 14.1 22.0 100 Total 58.8 17.3 3.8 1.8 7 .O 11.3 100
Central Age 15-22 85.4 4.9 0.1 4.5 0.1 5.0 100 Age 23 --59 31.6 20.9 6.6 14.2 7.7 19.0 100 Total 60.7 12.1 3.0 9.2 3.5 11.5 100
Eastern Age 15-22 52.3 10.9 1.1 21.5 4.6 9.6 100 Age 23-59 25.2 20.8 7.7 31.5 3.9 10.9 100 Total 40.5 15.1 4 .O 26.1 4.2 10.1 100
Coast Age 15--22 74.2 4.7 2.3 9.4 2.3 7.1 100 Age 23--59 20.4 28.3 5.8 36.7 2.9 5.9 100 Total 50.9 15.0 3.8 21.3 2.6 6.4 100
Total Age 15--22 74.0 7.2 Age 23-59 26.2 24.3 Total 51.9 15.1
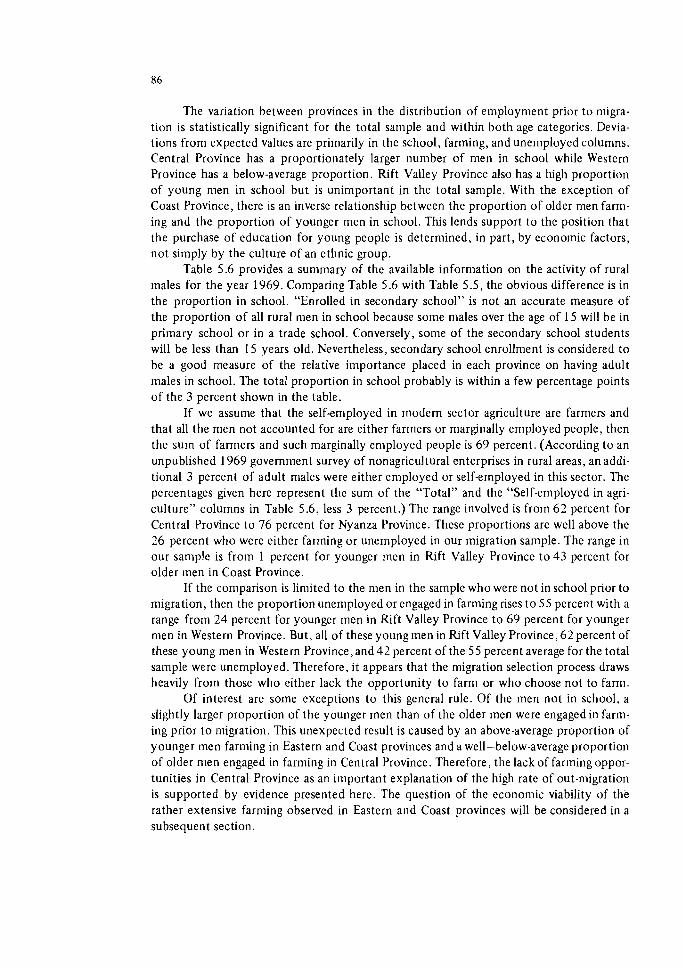
The variation between provinces in the distribution of employment prior t o migra- tion is statistically significant for the total sample and within both age categories. Devia- tions from expected values are primarily in the school, farming, and unemployed columns. Central Province has a proportionately larger number of men in school while Western Province has a below-average proportion. Rift Valley Province also has a high proportion of young men in school but is unimportant in the total sample. With the exception of Coast Province, there is an inverse relationship between the proportion of older men farm- ing and the proportion of younger men in school. This lends support t o the position that the purchase of education for young people is determined, in part, by economic factors, not simply by the culture of an ethnic group.
Table 5.6 provides a summary of the available information on the activity of rural inales for the year 1969. Comparing Table 5.6 with Table 5.5, the obvious difference is in the proportion in school. "Enrolled in secondary school" is not an accurate measure of the proportion of all rural men in school because some males over the age of 15 will be in primary school o r in a trade school. Conversely, some of the secondary school students will be less than 15 years old. Nevertheless, secondary school enrollment is considered t o be a good measure of the relative importance placed in each province on having adult males in school. The total proportion in school probably is within a few percentage points of the 3 percent shown in the table.
If we assume that the self-employed in modern sector agriculture are farmers and that all the men not accounted for are either farmers or marginally employed people, then the sum of farmers and such marginally eniployed people is 6 9 percent. (According t o an unpublished 1969 government survey of nonagricultural enterprises in rural areas, an addi- tional 3 percent of adult males were either eniployed or self-employed in this sector. The percentages given here represent the sum of the "Total" and the "Self-employed in agri- culture" columns in Table 5.6, less 3 percent.) The range involved is from 6 2 percent for Central Province to 76 percent for Nyanza Province. These proportions are well above the 26 percent who were either farming or unemployed in our migration sample. The range in our sample is from 1 percent for younger men in Rift Valley Province t o 4 3 percent for older men in Coast Province.
If the comparison is limited to the men in the sample who were not in school prior to migration, then the proportion unemployed or engaged in farming rises t o 55 percent with a range from 24 percent for younger men in Rift Valley Province t o 6 9 percent for younger men in Western Province. But, all of these young men in Rift Valley Province, 6 2 percent of these young men in Western Province,and42 percent of the 55 percent average for the total sample were unenlployed. Therefore, it appears that the migration selection process draws heavily from those who either lack the opportunity t o farm or who choose not to farm.
Of interest are some exceptions t o this general rule. Of the men not in school, a slightly larger proportion of the younger nlen than of the older men were engagedin farm- ing prior t o migration. This unexpected result is caused by an above-average proportion of younger Inen farming in Eastern and Coast provinces and a well-below-average proportion of older nlen engaged in farming in Central Province. Therefore, the lack of farming oppor- tunities in Central Province as an important explanation of the high rate of out-migration is supported by evidence presented here. The question of the econonlic viability of the rather extensive farming observed in Eastern and Coast provinces will be considered in a subsequent section.
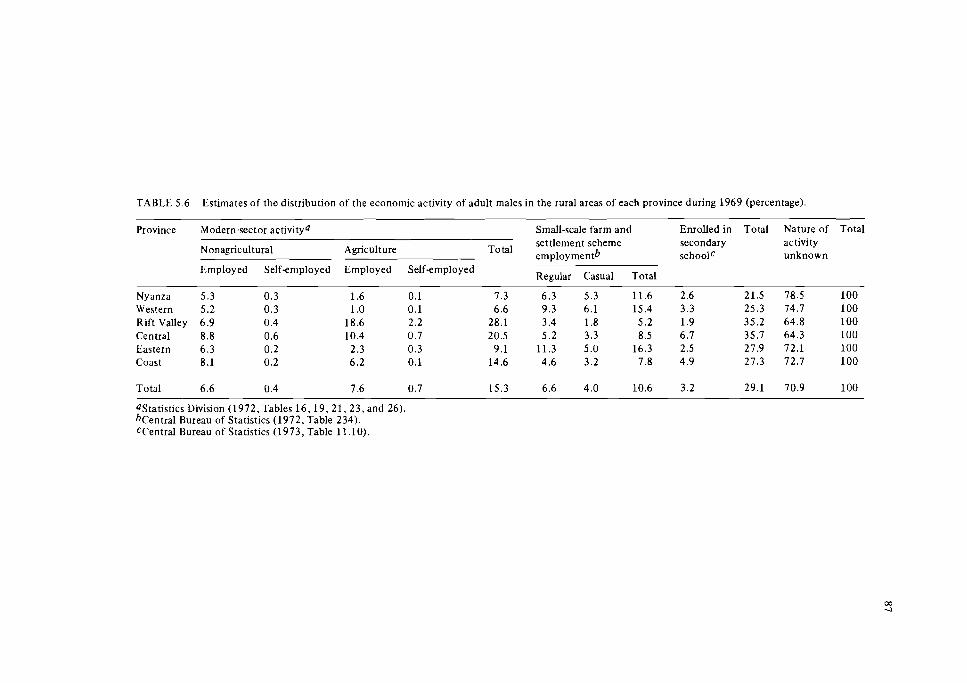
TABLE 5.6 Estimates of the distribution of the economic activity of adult males in the rural areas of each province during 1969 (percentage).
Province Modern.sector activity0 Small-scale farm and Enrolled in Total Nature of Total settlement scheme
Nonagricultural Agriculture etnploymentb Employed Self-employed Employed Self-employed
Regular Casual Total
secondary schoolC
activity unknown
Nyanza 5.3 0.3 1.6 0.1 7.3 6.3 5.3 11.6 2.6 21.5 78.5 100 Western 5.2 0.3 1 .O 0.1 6.6 9.3 6.1 15.4 3.3 25.3 74.7 100 Rift Valley 6.9 0.4 18.6 2.2 28.1 3.4 1.8 5.2 1.9 35.2 64.8 100 Central 8.8 0.6 10.4 0.7 20.5 5.2 3.3 8.5 6.7 35.7 64.3 100 Eastern 6.3 0.2 2.3 0.3 9.1 11.3 5.0 16.3 2.5 27.9 72.1 100 Coast 8.1 0.2 6.2 0.1 14.6 4.6 3.2 7.8 4.9 27.3 72.7 100
Total 6.6 0.4 7.6 0.7 15.3 6.6 4.0 10.6 3.2 29.1 70.9 100
astatistics Division (1972, Tables 16, 19, 21, 23, and 26). b ~ e n t r a l Bureau of Statistics (1972, Table 234). CCentral Bureau of Statistics (1973, Table 11.10).
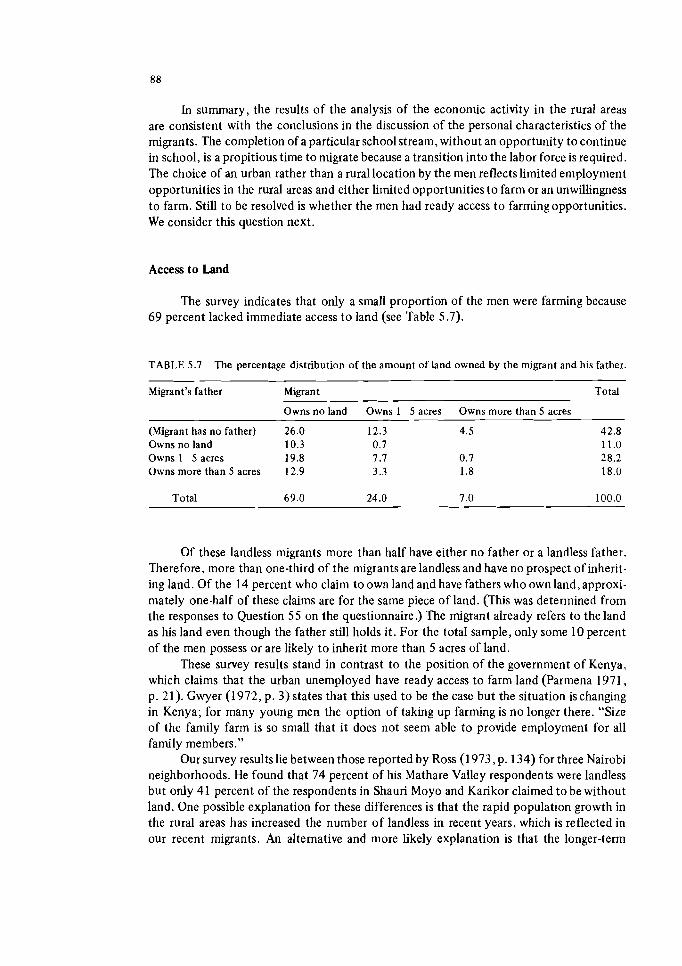
h summary, the results of the analysis of the economic activity in the rural areas are consistent with the conclusions in the discussion of the personal characteristics of the migrants. The completion of a particular school stream, without an opportunity to continue in school, is a propitious time to migrate because a transition into the labor force is required. The choice of an urban rather than a rural location by the men reflects limited employment opportunities in the rural areas and either limited opportunities to farm or an unwillingness to farm. Still to be resolved is whether the men had ready access to farming opportunities. We consider this question next.
Access to Land
The survey indicates that only a small proportion of the men were farming because 69 percent lacked immediate access t o land (see Table 5.7).
TABLE 5.7 The percentage distribution of the amount of land owned by the migrant and his father.
Migrant's father Migrant Total
Owns no land Owns 1 5 acres Owns more than 5 acres
(Migrant has no father) 26.0 12.3 4.5 Owns no land 10.3 0.7 Owns 1 acres 19.8 7.7 0.7 Owns more than 5 acres 12.9 3.3 1.8
Total 69.0 24.0 7 .O
Of these landless migrants more than half have either no father or a landless father. Therefore, more than one-third of the migrants are landless and have no prospect of inherit- ing land. Of the 14 percent who claim to own land and have fathers who own land, approxi- mately one-half of these claims are for the same piece of land. (This was determined from the responses to Question 55 on the questionnaire.) The migrant already refers to the land as his land even though the father still holds it. For the total sample, only some 10 percent of the men possess or are likely to inherit more than 5 acres of land.
These survey results stand in contrast to the position of the government of Kenya, which claims that the urban unemployed have ready access to farm land (Parmena 1971, p. 21). Gwyer (1972, p. 3)states that this used to be the case but the situation ischanging in Kenya; for many young men the option of taking up farming is no longer there. "Size of the family farm is so small that it does not seem able to provide employment for all family members."
Our survey results lie between those reported by Ross (1 973, p. 134) for three Nairobi neighborhoods. He found that 74 percent of his Mathare Valley respondents were landless but only 41 percent of the respondents in Shauri Moyo and Karikor claimed to be without land. One possible explanation for these differences is that the rapid population growth in the rural areas has increased the number of landless in recent years, which is reflected in our recent migrants. An alternative and more likely explanation is that the longer-term
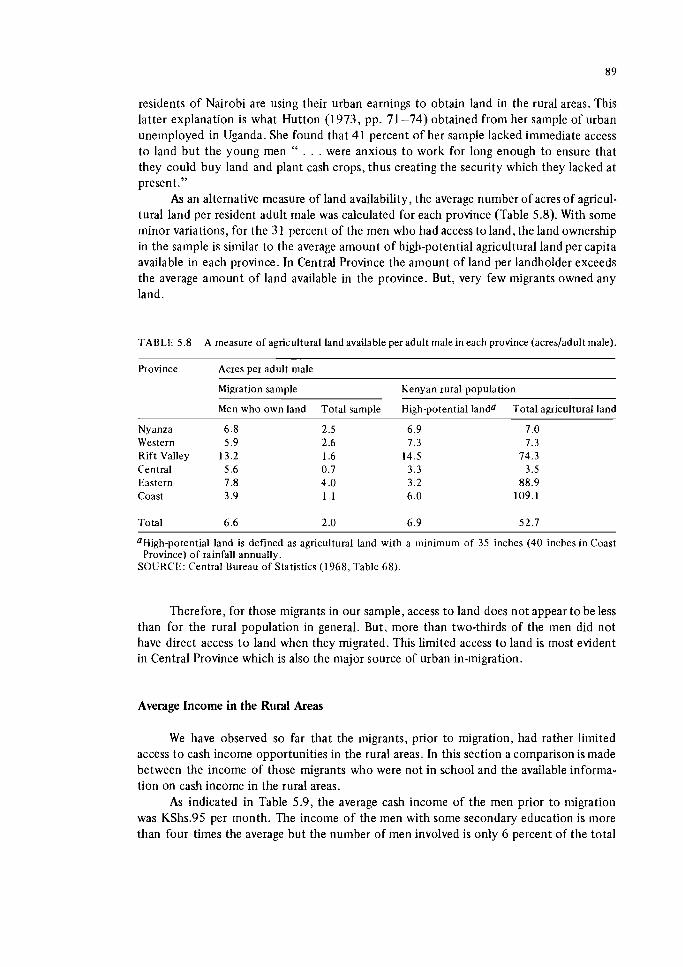
residents of Nairobi are using their urban earnings t o obtain land in the rural areas. This latter explanation is what 1-Iutton (1973, pp. 71-74) obtained from her sample of urban unerrlployed in Uganda. She found that 41 percent of her sample lacked immediate access t o land but the young men " . . . were anxious t o work for long enough t o ensure that they could buy land and plant cash crops, thus creating the security which they lacked a t present."
As an alternative measure of land availability, the average number of acres of agricul- tural land per resident adult male was calculated for each province (Table 5.8). With some minor variations, for the 3 1 percent of the men who had access t o land, the land ownership in the sample is similar to the average amount of high-potential agricultural land per capita available in each province. In Central Province the amount of land per landholder exceeds the average amount of land available in the province. But, very few migrants owned any land.
TABLE 5.8 A measure of agricultural land available per adult male in each province (acresladult male).
Province Acres per adult male
Migration sample Kenyan rural population
Men who own land Total sample High-potential land0 Total agricultural land
Nyanza 6.8 2.5 6.9 Western 5.9 2.6 7.3 Rift Valley 13.2 1.6 14.5 Central 5.6 0.7 3.3 Eastern 7.8 4 .O 3.2 Coast 3.9 1.1 6 .0
Total 6 .6 2 .O 6.9
OHigh-potential land is defined as agricultural land with a minimum of 35 inches (40 inches in Coast Province) of rainfall annually.
SOURCE: Central Bureau of Statistics (1968, Table 68).
Therefore, for those migrants in our sample, access t o land does not appear t o be less than for the rural population in general. But, more than two-thirds of the men did not have direct access t o land when they migrated. This limited access t o land is most evident in Central Province which is also the major source of urban in-migration.
Average Income in the Rural Areas
We have observed so far that the migrants, prior to migration, had rather limited access t o cash income opportunities in the rural areas. In this section a comparison is made between the income of those migrants who were not in school and the available informa- tion on cash income in the rural areas.
As indicated in Table 5.9, the average cash income of the men prior t o migration was KShs.95 per month. The income of the men with some secondary education is more than four times the average but the number of men involved is only 6 percent of the total
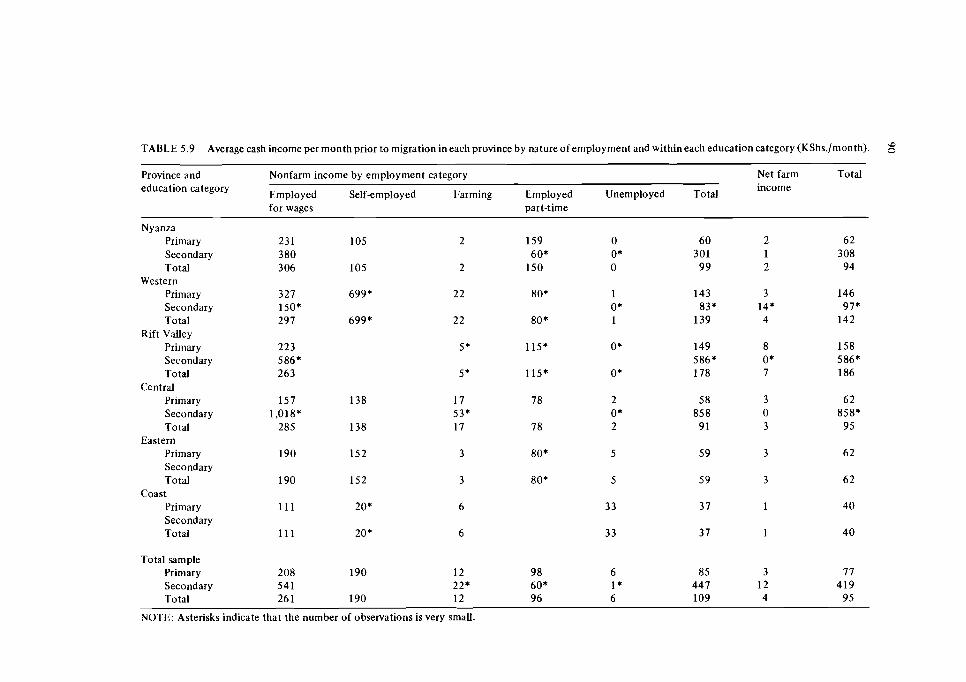
TABLE 5.9 Average cash income per month prior to migration in each province by nature of employment and withineach education category (KShs./month).
Province and Nonfarm income by employment category Net farm Total education category income
Employed Self-employed 1:arming Employed Unemployed Total for wages part-time
Nyanza Primary Secondary Total
Western Primary Secondary Total
Rift Valley Primary Secondary Total
Central Primary Secondary Total
Eastern Primary Secondary Total
Coast Primary Secondary Total
Total sample Primary 208 190 12 98 6 85 3 7 7 Secondary 541 22* 60* I * 447 12 419 Total 26 1 190 12 96 6 109 4 95
NOTE: Asterisks indicate that the number of observations is very small.
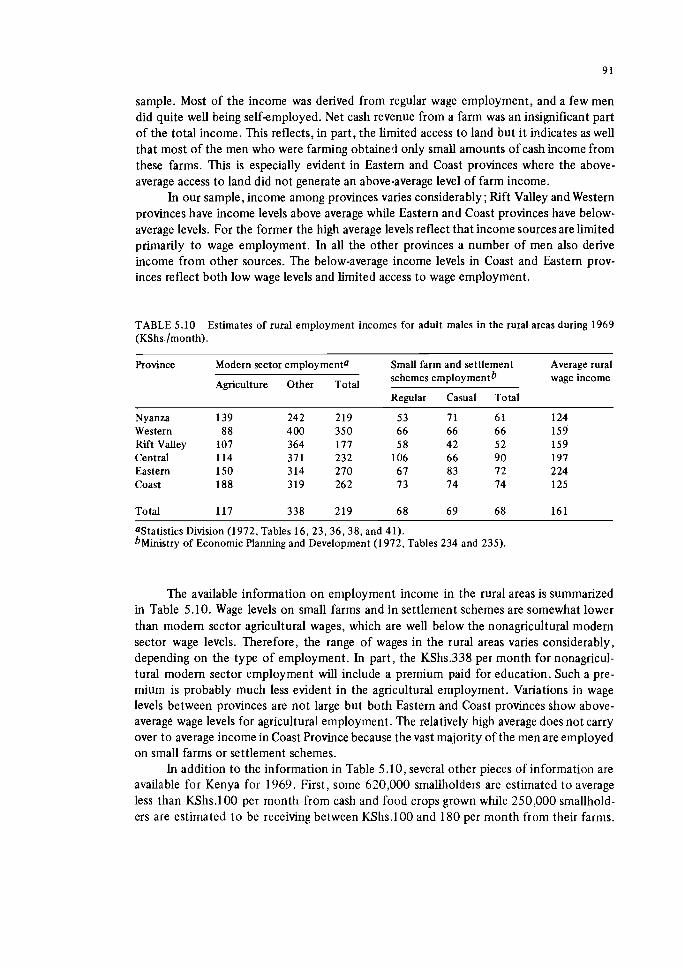
sample. Most of the income was derived from regular wage employment, and a few men did quite well being selfemployed. Net cash revenue from a farm was an insignificant part of the total income. This reflects, in part, the limited access to land but it indicates as well that most of the men who were farming obtained only small amounts ofcash income from these farms. This is especially evident in Eastern and Coast provinces where the above- average access to land did not generate an above-average level of farm income.
In our sample, income among provinces varies considerably; Rift Valley and Western provinces have income levels above average while Eastern and Coast provinces have below- average levels. For the former the high average levels reflect that income sources are limited primarily to wage employment. In all the other provinces a number of men also derive income from other sources. The below-average income levels in Coast and Eastern prov- inces reflect both low wage levels and limited access to wage employment.
TABLE 5.10 Estimates of rural employment incomes for adult males in the rural areas during 1969 (KShs./month).
Province Modern sector employments Small farm and settlement Average rural schemes employmentb wage income
Agriculture Other Total Regular Casual Total
Nyanza 139 242 219 53 71 61 124 Western 88 400 350 66 66 66 159 Rift Valley 107 364 177 58 4 2 52 159 Central 114 371 232 106 66 9 0 197 Eastern 150 314 270 6 7 83 7 2 2 24 Coast 188 319 262 73 74 74 125
Total 117 338 219 6 8 69 68 161
astatistics Division (1972, Tables 16 , 23, 36, 38, and 41). b ~ i n i s t r y of Economic Planning and Development (1972, Tables 234 and 235).
The available information on employment income in the rural areas is summarized in Table 5.10. Wage levels on small farms and in settlement schemes are somewhat lower than modem sector agricultural wages, which are well below the nonagricultural modern sector wage levels. Therefore, the range of wages in the rural areas varies considerably, depending on the type of employment. In part, the KShs.338 per month for nonagricul- tural modem sector employment will include a premium paid for education. Such a pre- mium is probably much less evident in the agricultural employment. Variations in wage levels between provinces are not large but both Eastern and Coast provinces show above- average wage levels for agricultural employment. The relatively high average does not carry over to average income in Coast Province because the vast majority of the men are employed on small farms or settlement schemes.
In addition to the information in Table 5.10, several other pieces of information are available for Kenya for 1969. First, some 620,000 smallholders are estimated to average less than KShs.100 per month from cash and food crops grown while 250,000 smallhold- ers are estimated to be receiving between KShs.100 and 180 per month from their farms.
Second, according to an unpublished 1969 survey of nonagricultural enterprises, average monthly wages paid for men were KShs.103, ranging from KShs.87 for casual employees to KShs.118 for regular employees. Third, net income of the proprietors of these enter- prises averaged KShs.414 per month. Seventy-five percent of these proprietors were far- mers as well. Finally, the average monthly income from all sources, including subsistence agriculture, per rural household has been estimated at KShs.223 (International Labour Office 1972, p. 333).
A comparison of the two income tables indicates that the wage levels of the employed men in the migration sample were similar to the modem sector wages paid in the rural areas. The wage level of men with primary education, probably most typical of the general rural pattern, is only KShs.11 per month below the average rural modem sector wage. (The 1969 wages overstate the rural income for the survey period but the difference is probably small because the price levels were quite stable during the latter part of the 1960s.) Con- versely, cash income from farming is very low. It is questionable that many of the farmers in the sample produced enough food to bring their farm income to the KShs.100-a-month ceiling observed for the majority of the rural smallholders.
Therefore, we conclude that the migrants lacked access to commercial farming oppor- tunities. In addition, for the employed at least, wage levels compare favorably with the rural average. What rural push was exerted was more in the form of limited access to such opportunities. To obtain a wage at least comparable to the nonagricultural rural wage, the majority of the men had to turn to the urban scene.
SUMMARY
The migration selection process in the rural areas is complex. Nevertheless, some general patterns emerge. Rapid population expansion in the rural areas focuses attention on the limited amount of agricultural land available in some areas and probably is a cause of restlessness, especially among younger men. Add to this emerging restlessness the higher levels of education, bringing with it greater awareness of alternative opportunities outside the immediate home area, and the stage is set for growing out-migration. It is the ethnic groups with best access to educational opportunities and who are under the greatest land pressure that show the highest propensity to migrate.
Within this changing rural scene we find the expected selective process at work. It is the younger men with above-average education who move to the urban centers. The fact that migration follows directly after school for the majority of the men in the sample indicates that the rural-to-urban move may be the expected response from the young men who have reached the end of a particular educational stream. The importance of formal schooling in the rural--urban migration process suggests that it is not the poorest in the rural areas who are most prone to move to town.
6 THE URBAN EMPLOYMENT AND INCOME EXPERIENCE OF THE MIGRANTS
People go to the cities for the following reasons (Ross 1973, p. 42):
1. They believe that they can earn more cash income than in the rural areas. This seems equally important for people with very high and very low levels of education.
2. They feel that there will be better opportunities for education and employment for their children.
3 . They have heard stories of urban life from relatives and friends, and want to experience it themselves.
4 . They wish t o enjoy the technological features of modern society, which are mainly confined t o the urban areas.
These reasons for urban in-migration provided by Ross are similar t o our hypotheses about why a particular urban migration destination is selected (Chapter 1 , H: 2.1 to 2.14). The dominant difference is that we place more emphasis on the economic determinants of migration. Specifically, we argue that a household decision will be reached after an evalua- tion of the perceived urban income opportunities relative t o the economic alternatives in rural areas.
The evidence presented thus far provides support for our emphasis on economic deter- minants of migration. In our regression models, the urban income levels, rural aspiration levels, and distribution of rural income earning possibilities were all significant determinants of rural-urban migration. Further. in Chapter 5 we have shown that some combination of rural modern sector wages, small business profits, and cash crop farming income need not be considered inferior t o urban alternatives, but most of the migrants did not have direct access t o such combinations of rural income earning possibilities. Third, prior t o migration some of the men were earning relatively good incomes. In addition, more than half of the men were attending school. As a result, it was concluded, in most cases, that it was not the poorest in the rural areas who were migrating. Yet, these men claimed that their primary reason for selecting a particular urban destination was the good employment prospects perceived t o exist there.
In this chapter we seek t o determine whether these stated economic objectives of the migrants were realized in town. First, we discuss the published evidence on rural- urban income differentials and then the evidence as reported by the migrants. Second, the changes in employment status and incomes during the first 2 years after migration are analyzed. In addition, hypotheses, as presented in Chapter 1 , on personal attributes that affect employment status and income earned are tested. Finally, we compare the employ- ment and income experience of the migrants with available data on urban employment and earnings t o determine how the migrants have fared relative t o the total urban labor force.
THE RURAL-URBAN INCOME DIFFERENTIAL
The Published Evidence
As reported in Chapter 2 , the emergence of differences in wage levels between the rural and urban parts of the Kenyan economy was the result of a fundamental shift in power within the economy which occurred during the emergency of the 1950s. Before that, the settler community dominated the economy in general, and in wage policy in par- ticular. With a shift in economic power t o industry and modern sector services, the pur- chase of labor force stability took priority over the level of wages.
The effect of this shift in emphasis in modern sector employment policy was t o move the economy from a reported position of rural-urban wage parity t o an urban modem sector wage which was more than three times the level of the rural modern sector wage (see Table 2.8). During the period under study, 1964 t o 1968, the extent of the rural- urban wage differential increased from KShs.324 t o KShs.445 a month. Further, as of 1969, the gross domestic product per employee in the nonagricultural portion of the modem sector was estimated to be 7 or 8 times that of rural activity (Public Service Struc- ture and Remuneration Commission 1971, pp. 4 1 4 2 ) . Because of the combined effect of these differentials, average urban household income in 1972 was reported t o exceed average rural household income by a multiple of five (Development Plan: 1974-1978 (1974) p. 95).
An inherent weakness of these data is that they ignore differences in the cost of living between rural and urban areas. The matter has been studied in detail for West Africa by Knight (1972), and he concludes that real rural-urban income differentials are some- what less than the gross income differentials. Yet, the rural and urban ways of life are fundamentally different and it is not clear that it is merely a matter of adjusting for differ- ences in the cost of living. As stated by Arnin (1974, p. 107): "The town, in spite of pov- erty and unemployment, still offers some advantages in conlparison with the countryside . . . . Filtered water is one of them, which should not be underestimated, because this alone has reduced infant mortality by half." Such advantages are part of the "technological features of modern society" listed by Ross in the quote provided above.
T o participate fully in the advantages of the urban centers an "urban income" is necessary, but that income buys a qualitatively different product. As a result, t o be con- strained by the data available t o a discussion of money income differentials need not invali- date the analysis.
The Income Differential Experienced by the Migrants
A comparison of income earned prior t o migration with the income that the men in our sample were able to obtain during the first full quarter after their arrival in town has t o be limited t o the subset of the sample who were not students immediately prior to migration. This eliminates more than half of the sample and reduces the number of men with secondary education t o the point where province-by-province comparison of the income differential for these men becomes impossible.
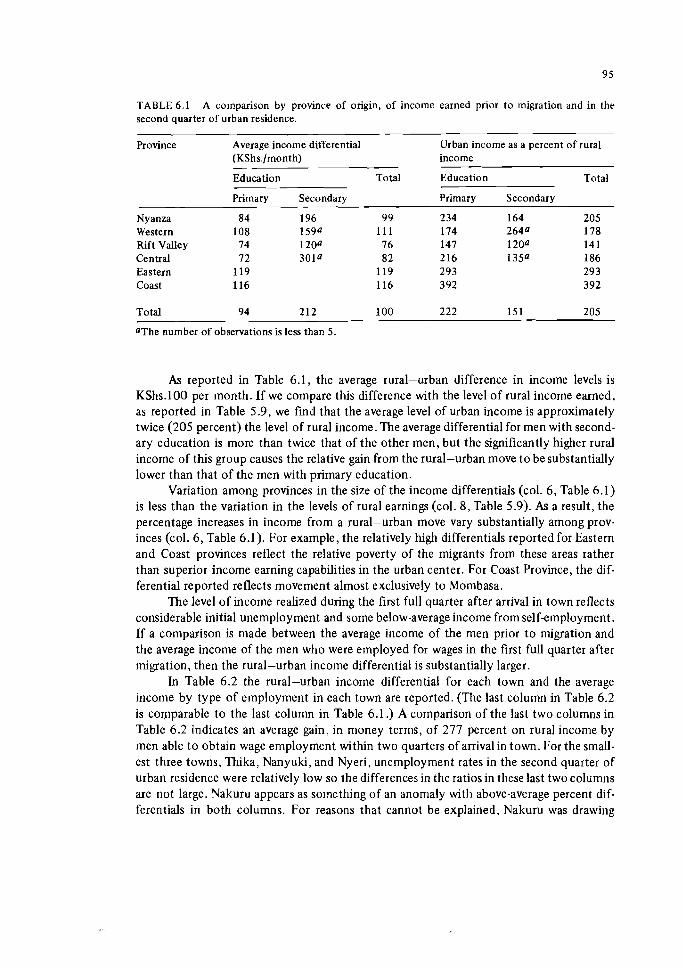
TABLE 6.1 A comparison by province of origin, o f income earned prior to migration and in the second quarter of urban residence.
Province Average income differential Urban income as a percent of rural (KShs./month) income
Education Total Education Total
Primary Secondary Primary Secondary
Nyanza 84 196 99 234 164 205 Western 108 159" 11 1 174 264" 178 Rift Valley 74 120" 76 147 120" 141 Central 7 2 301" 82 216 135" 186 Eastern 119 119 293 29 3 Coast 116 116 392 392
Total 94 212 100 222 151 205
"The number of observations is less than 5.
As reported in Table 6.1, the average rural-urban difference in income levels is KShs.100 per month. If we compare this difference with the level of rural income earned, as reported in Table 5.9, we find that the average level of urban income is approximately twice (205 percent) the level of rural income. The average differential for men with second- ary education is more than twice that of the other men, but the significantly higher rural income of this group causes the relative gain from the rural-urban move t o be substantially lower than that of the men with primary education.
Variation among provinces in the size of the income differentials (col. 6 , Table 6.1) is less than the variation in the levels of rural earnings (col. 8, Table 5.9). As a result, the percentage increases in income from a rural-urban move vary substantially among prov- inces (col. 6, Table 6.1). For example, the relatively high differentials reported for Eastern and Coast provinces reflect the relative poverty of the migrants from these areas rather than superior income earning capabilities in the urban center. For Coast Province, the dif- ferential reported reflects movement almost exclusively to Mombasa.
The level of income realized during the first full quarter after arrival in town reflects considerable initial unemployment and some below-average income from self-employment. If a comparison is made between the average income of the men prior t o migration and the average income of the men who were employed for wages in the first full quarter after migration, then the rural-urban income differential is substantially larger.
In Table 6.2 the rural-urban income differential for each town and the average income by type of employment in each town are reported. (The last column in Table 6.2 is comparable to the last column in Table 6.1 .) A comparison of the last two columns in Table 6.2 indicates an average gain, in money terms, of 277 percent on rural income by men able t o obtain wage employment within two quarters of arrival in town. For the small- est three towns, Thika, Nanyuki, and Nyeri, unemployment rates in the second quarter of urban residence were relatively low so the differences in the ratios in these last two columns are not large. Nakuru appears as something of an anomaly with above-average percent dif- ferentials in both columns. For reasons that cannot be explained, Nakuru was drawing
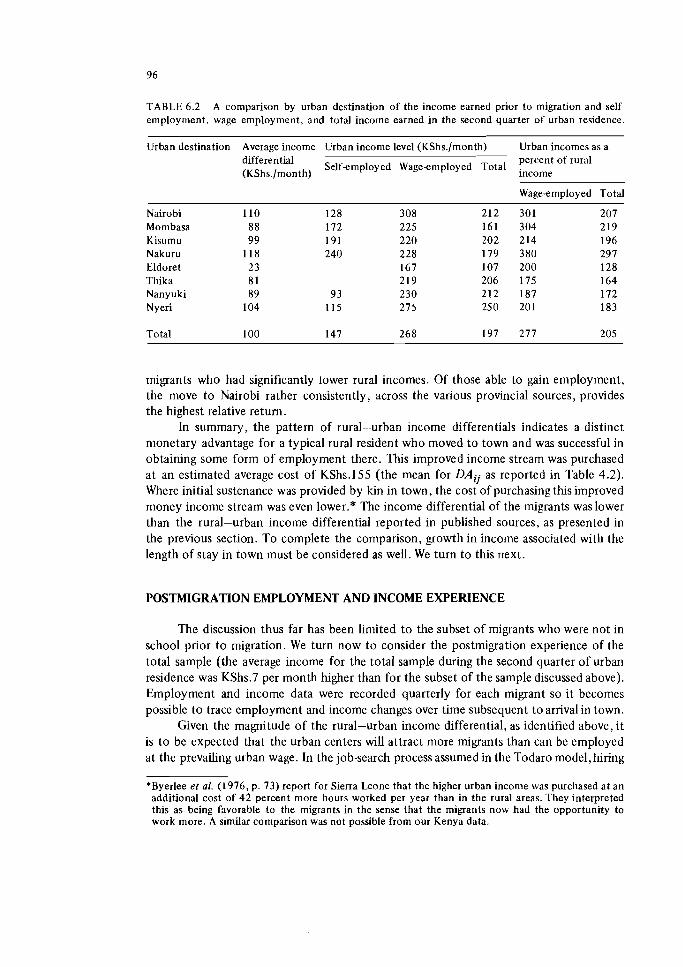
TABLE 6.2 A comparison by urban destination of the income earned prior t o migration and self- employment, wage employment, and total income earned in the second quarter of urban residence.
Urban destination Average income Urban income level (KShs./month) Urban incomes as a percent of rural
Self-employed Wage-employed Total income (KShs./month)
Wage-employed Total
Nairobi Mombasa Kisumu Nakuru Eldoret Thika Nanyuki Nyeri
Total
migrants who had significantly lower rural incomes. Of those able to gain en~ployment, the move to Nairobi rather consistently, across the various provincial sources, provides the highest relative return.
In summary, the pattern of rural--urban income differentials indicates a distinct monetary advantage for a typical rural resident who moved to town and was successful in obtaining some form of employment there. This improved income stream was purchased at an estimated average cost of KShs.155 (the mean for DAii as reported in Table 4.2). Where initial sustenance was provided by kin in town, the cost of purchasing this improved money income stream was even lower.* The income differential of the migrants waslower than the rural-urban income differential reported in published sources, as presented in the previous section. To complete the comparison, growth in income associated with the length of stay in town must be considered as well. We turn to this next.
POSTMIGRATION EMPLOYMENT AND INCOME EXPERlENCE
The discussion thus far has been limited to the subset of migrants who were not in school prior to migration. We turn now to consider the postmigration experience of the total sample (the average income for the total sample during the second quarter of urban residence was KShs.7 per month higher than for the subset of the sample discussed above). Employment and income data were recorded quarterly for each migrant so it becomes possible to trace employment and income changes over time subsequent to arrival in town.
Given the magnitude of the rural-urban income differential, as identified above, it is to be expected that the urban centers will attract more migrants than can be employed at the prevailing urban wage. In the job-search process assumed in the Todaro model, hiring
*Byerlee et al. (1976, p. 73) report for Sierra Leone that the higher urban income was purchased at an additional cost of 42 percent more hours worked per year than in the rural areas. They interpreted this as being favorable to the migrants in the sense that the migrants now had the opportunity to work more. A similar comparison was not possible from our Kenya data.
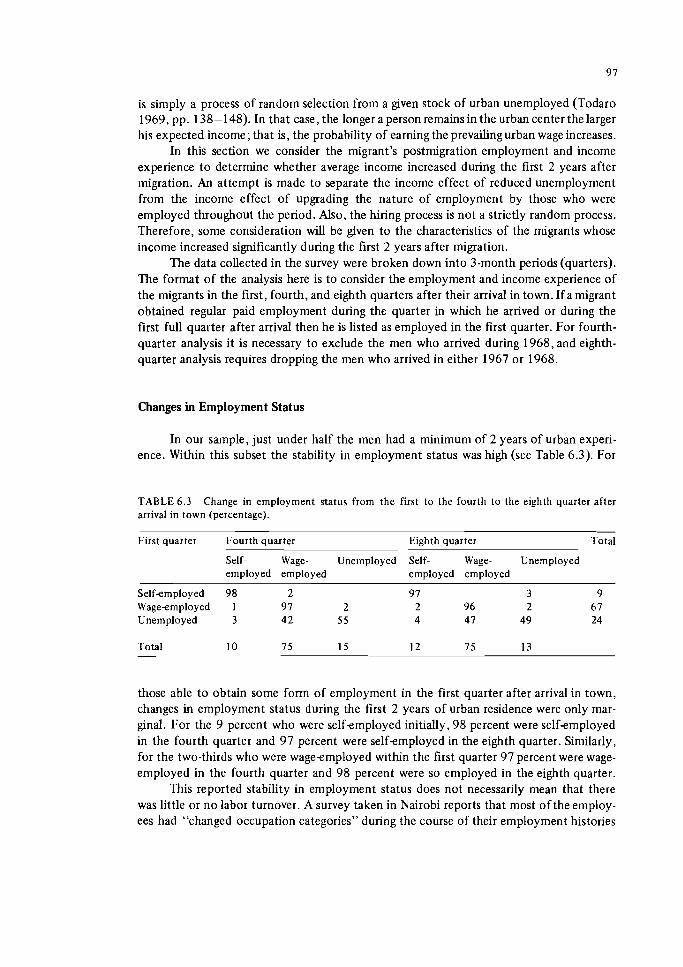
is simply a process of random selection from a given stock of urban unemployed (Todaro 1969, pp. 138-1 48). In that case, the longer a person remains in the urban center the larger his expected income; that is, the probability of earning the prevailing urban wage increases.
In this section we consider the migrant's postmigration employment and income experience to determine whether average income increased during the first 2 years after migration. An attempt is made to separate the income effect of reduced unemployment from the income effect of upgrading the nature of employment by those who were employed throughout the period. Also, the hiring process is not a strictly random process. Therefore, some consideration will be given to the characteristics of the migrants whose income increased significantly during the first 2 years after migration.
The data collected in the survey were broken down into 3-month periods (quarters). The format of the analysis here is to consider the employment and income experience of the migrants in the first, fourth, and eighth quarters after their arrival in town. If a migrant obtained regular paid employment during the quarter in which he arrived or during the first full quarter after arrival then he is listed as employed in the first quarter. For fourth- quarter analysis it is necessary to exclude the men who arrived during 1968, and eighth- quarter analysis requires dropping the men who arrived in either 1967 or 1968.
Changes in Employment Status
In our sample, just under half the men had a minimum of 2 years of urban experi- ence. Within this subset the stability in employment status was high (see Table 6.3). For
TABLE 6 .3 Change in employnlent status from the first to the fourth to the eighth quarter after arrival in town (percentage).
First quarter Fourth quarter
Self- Wage- Unemployed employed employed
Self-employed 98 2 Wageemployed 1 9 7 2 Unemployed 3 4 2 55
Eighth quarter Total
Self- Wage- Unemployed employed employed
97 3 9 2 96 2 6 7 4 47 49 24
Total 10 7 5 15 12 7 5 13
those able to obtain some form of employment in the first quarter after arrival in town, changes in employment status during the first 2 years of urban residence were only mar- ginal. For the 9 percent who were selfemployed initially, 98 percent were self-employed in the fourth quarter and 97 percent were selfemployed in the eighth quarter. Similarly, for the two-thirds who were wageemployed within the first quarter 97 percent were wage- employed in the fourth quarter and 98 percent were so employed in the eighth quarter.
This reported stability in employment status does not necessarily mean that there was little or no labor turnover. A survey taken in Nairobi reports that most ofthe employ- ees had "changed occupation categories" during the course of their employment histories
(Thias and Carnoy 1969, p. 53). Conversely, for a sample of 186 trade test candidates in 1973 in Nairobi and Kisumu who had entered the job market in the postindependence period, Godfrey (1975, p. 5) reports that 6 9 percent had not changed their initial job.
In our sample the major reported changes in employment status occurred among the 24 percent of the men who were still unemployed during the first quarter. Of these, 4 2 percent were wageemployed by the fourth quarter and an additional 3 percent were self-employed. These percentages change slightly t o 4 7 and 4 by the eighth quarter. The vast majority of the men (85 percent) had obtained some form of gainful employment within the first year of urban residence.
The extent of unemployment for our sample was somewhat lower than that obtained by Godfrey (1975, p. 5) for his sample of trade test candidates. He reports that 71 percent had experienced some unemployment when they first entered the job market. (Godfrey (1975, p. 5 , footnote) defines unemployment as a "failure t o obtain the sort of job that one has been led t o expect.") A total of 4 6 percent reported 6 months o r more of initial unemployment, and 2 6 percent had spent a minimum of 16 months searching for their first job.
hsaggregating the changes in employment status in our sample into education groups (Table 6.4), we note first that self-employment is limited almost exclusively t o men with primary education only. Second, unemployment rates are slightly, but not significantly, lower for the secondary education group than for the men with primary education only.
Among urban centers, the three smallest towns - Thika, Nanyuki, and Nyeri - had very low levels of unemployment throughout (see Table 6.4). For the latter two thisis off- set by considerably larger proportions in self-employment. Conversely, self-employment is relatively limited in Nakuru and Eldoret but unemployment is well above average throughout, except for Eldoret in the eighth quarter.
The Growth in Average Income
The first concern here is the growth in expected income: the average income of all men in the sample regardless of their employment status. In Table 6.5 the growth in aver- age income during the first 2 years after migration is shown. For the total sample, the average income increased by 3 0 percent; approximately three-fourths occurred during the first year of urban residence.
Comparing the two education groups, we note that the growth in income was larger for the primary education group (44 percent), than for the men with some secondary education (16 percent). This lower percentage reflects the larger initial income of the secondary education group since the absolute increase in income was only slightly higher for the primary education group. In several cases there was an actual decline in average income from the fourth to the eighth quarter. For the secondary education group in Nan- yuki the number involved was too small t o attach any significance t o the average values reported. For the primary education group in Eldoret and the secondary education group in Nairobi the decline reflects a drop in average employment earnings from 1967 t o 1968 for these subgroups in these two locations. The cause of this decline in employment earn- ings as well as the decline in average eighthquarter income for the secondary education group in Nyeri is not known.
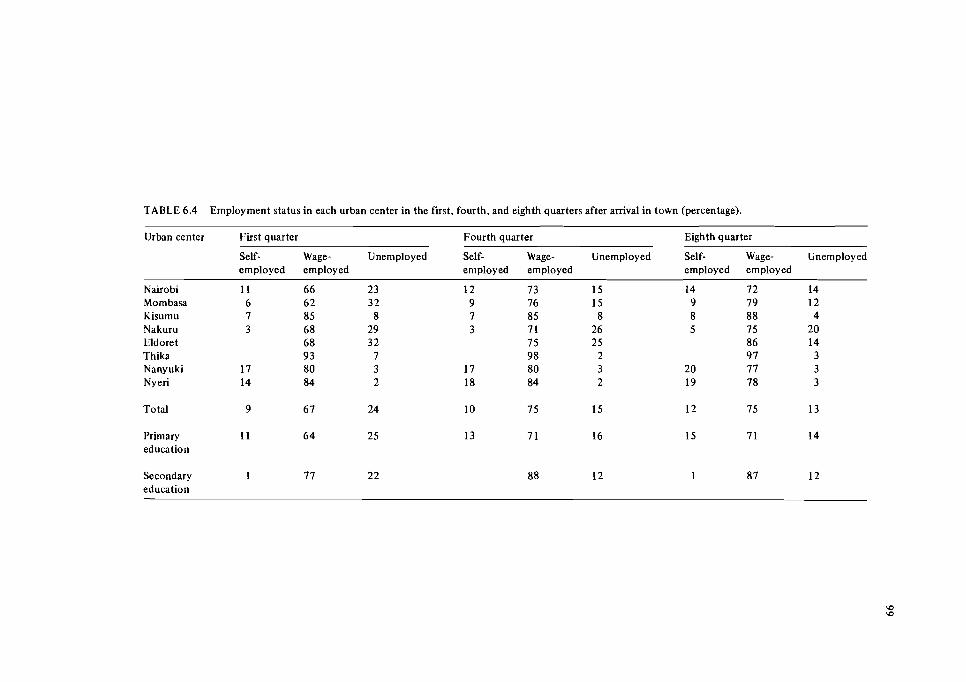
TABLE 6.4 Employment status in each urban center in the first, fourth, and eighth quarters after arrival in town (percentage)
Urban center
Nairobi Mombasa Kisumu Nakuru Eldoret Thika Nanyuki Ny e n
First quarter Fourth quarter Eighth quarter
Self- Wage- Unemployed Self- Wage- Unemployed Self- Wage- Unemployed employed employed employed employed employed employed
11 66 23 12 7 3 15 14 7 2 14 6 6 2 32 9 76 15 9 79 12 7 85 8 7 85 8 8 8 8 4 3 68 29 3 7 1 26 5 75 20
68 32 7 5 25 86 14 9 3 7 98 2 9 7 3
17 80 3 17 80 3 20 7 7 3 14 84 2 18 84 2 19 7 8 3
Total 9 6 7 24 10 7 5 15 12 75 13
Primary 11 64 25 education
Secondary 1 7 7 2 2 education
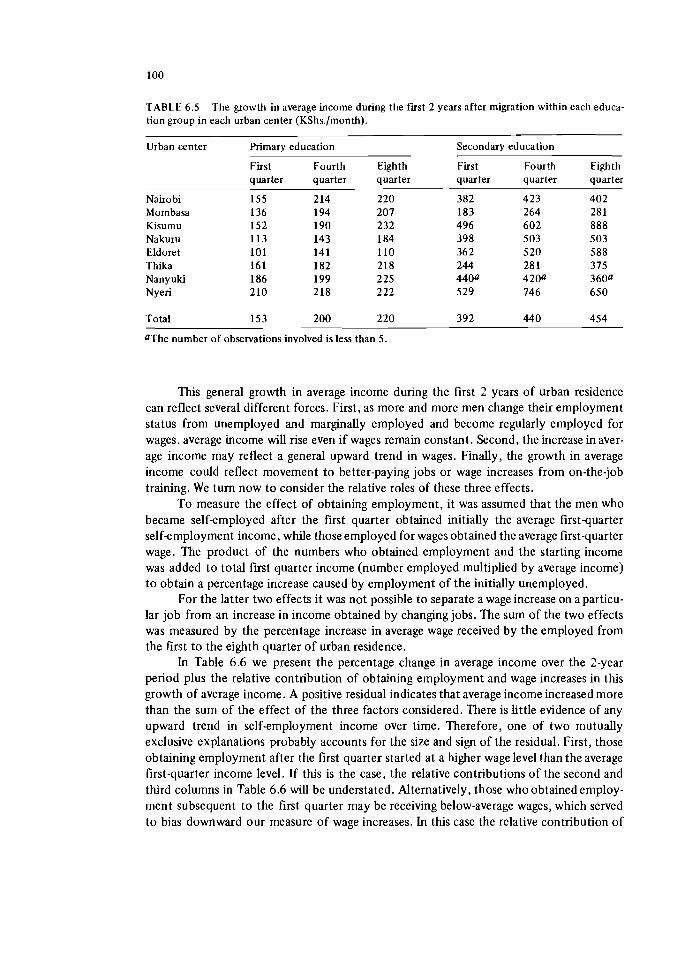
TABLE 6.5 The growth in average income during the first 2 years after migration within each educa- tion group in each urban center (KShs./month).
Urban center Primary education Secondary education
Nairobi Mombasa Kisumu Nakuru Eldoret Thika Nanyuki Nyeri
First Fourth quarter quarter
155 214 136 194 152 190 113 143 101 141 161 182 186 199 210 218
Eighth quarter
220 207 232 184 110 218 2 25 222
First Fourth Eighth quarter quarter quarter
382 423 402 183 264 281 496 602 888 398 503 503 362 5 20 588 244 28 1 375 4400 4200 3600 529 746 650
Total 153 200 220 392 44 0 454
aThe number of observations involved is less than 5.
This general growth in average income during the first 2 years of urban residence can reflect several different forces. First, as more and more men change their employment status from unemployed and marginally employed and become regularly employed for wages, average income will rise even if wages remain constant. Second, the increase in aver- age income may reflect a general upward trend in wages. Finally, the growth in average income could reflect movement t o better-paying jobs or wage increases from on-the-job training. We turn now to consider the relative roles of these three effects.
To measure the effect of obtaining employment, it was assumed that the men who became self-employed after the first quarter obtained initially the average first-quarter selfemployment income, while those employed for wages obtained the average first-quarter wage. The product of the numbers who obtained employment and the starting income was added t o total first quarter income (number employed multiplied by average income) t o obtain a percentage increase caused by employment of the initially unemployed.
For the latter two effects it was not possible t o separate a wage increase on a particu- lar job from an increase in income obtained by changing jobs. The sum of the two effects was measured by the percentage increase in average wage received by the employed from the first t o the eighth quarter of urban residence.
h Table 6.6 we present the percentage change in average income over the 2-year period plus the relative contribution of obtaining employment and wage increases in this growth of average income. A positive residual indicates that average income increased more than the sum of the effect of the three factors considered. There is little evidence of any upward trend in self-employment income over time. Therefore, one of two mutually exclusive explanations probably accounts for the size and sign of the residual. First, those obtaining employment after the first quarter started at a higher wage level than the average first-quarter income level. If this is the case, the relative contributions of the second and third columns in Table 6.6 will be understated. Alternatively, those who obtained eniploy- rncnt subsequent to the first quarter may be receiving below-average wages, which sewed to bias downward our measure of wage increases. In this case the relative contribution of
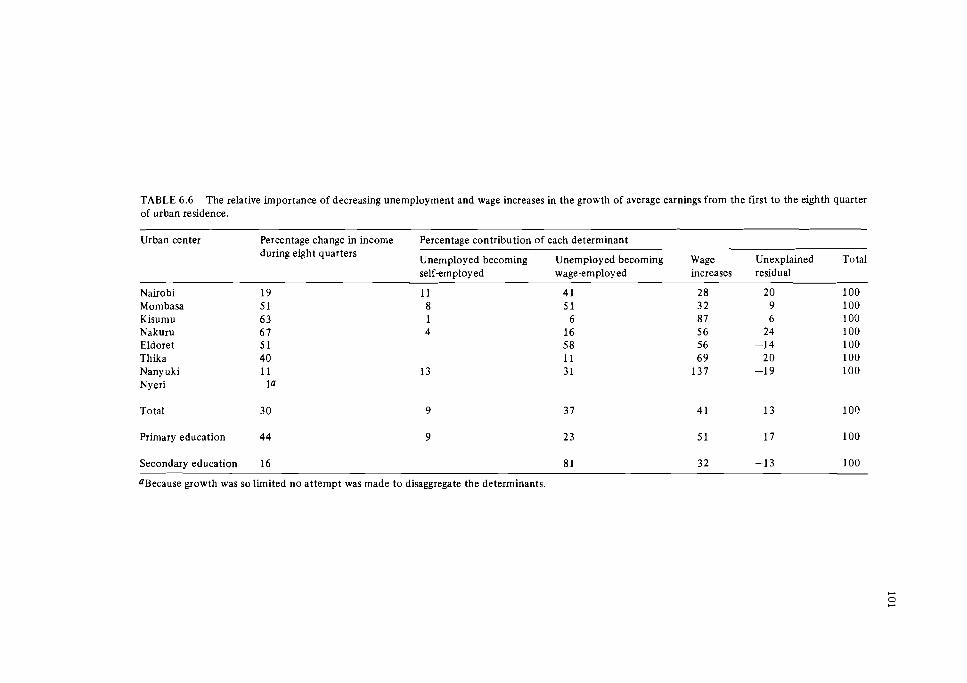
TABLE 6.6 The relative importance of decreasing unemployment and wage increases in the growth of average earnings from the first t o the eighth quarter of urban residence.
Urban center Percentage change in income Percentage contribution of each determinant during eight quarters
Unemployed becoming Unemployed becoming Wage Unexplained Total selfemployed wage-employ ed increases residual
Nairobi 19 11 4 1 28 20 100 Mombasa 5 1 8 5 1 3 2 9 100 Kisumu 63 1 6 8 7 6 100 Nakuru 6 7 4 16 56 24 100 Eldoret 5 1 5 8 5 6 -14 100 Thika 40 11 6 9 2 0 100 Nany uki 11 13 -3 1 137 -19 100 Nyeri la
Total
Primary education 44
Secondary education 16 8 1 32 -1 3 100
aBecause growth was so limited no attempt was made t o disaggregate the determinants.
columns two and three may be overstated and column four will be understated. For a negative residual, the opposite of these explanations would be the case.
For the total sample, most of the growth in income isaccounted for by the combina- tion of obtaining wage employment and wage increases. The effect of the latter is slightly greater than the former. For the primary education group wage increases account for half of the growth of average income. For the nzen with secondary education, obtaining wage employment dominates the explanation. The magnitude of the effect of obtaining wage employment (81 percent) and the negative residual point t o the reverse of our first explana- tion - those who were employed subsequent t o the start of the first quarter started at a level below the sample average.
Among urban centers, wage increases had an above-average effect in all townsexcept Nairobi, Mombasa, and Nyeri. Employment growth appears to have been stagnant in Nan- yuki, where self-employment took up some of the slack. In Eldoret selfemployment does not appear t o have been an option,so the unemployed accepted wage employment at initial wage levels below the average income for the first quarter.
Determinants of Differences in Postmigration Incomes
In a labor market with significant levels of unemployment, employers can afford to be somewhat selective in the hiring process. In contrast, the freedom of the elnployees t o be selective in accepting employment is restricted, especially if job seekers do not have specialized skills in great demand in the market and cannot afford t o remain unemployed for an extended time period. Therefore, it is relevant t o consider the characteristics of the migrants to determine causes of significant deviations from the average employment and income experiences reported above.
In order t o study the deviations from the average experience for the total sample and yet allow for different wage levels in each urban center, tlze average employment earn- ings for each center were calculated. Then the average deviation in employment earnings from each of these urban averages was calculated for each subgroup of the total population. A positive deviation indicates above-average employment earnings and a negative deviation indicates the opposite. A "student-t" test was used to determine whether the deviations from zero and differences among the means were statistically significant. A significance level of 5 percent was used as a cut-off.
Average incomes depend both on the proportion of the group finding employment and o n the earnings of those who are employed. Generally, higher wages are associated with jobs requiring higher-level skills and employers may have preference for more educated job seekers regardless of skill. As indicated in Table 6.7, there is considerable difference between the average earnings of men who have up t o a primary certificate and the men who have some secondary education. All mean deviations are significantly different from zero. The level of average earnings increased KShs.37 per month from the first t o the eighth quarter. Also deviations from the average wage increased somewhat from the fourth t o the eighth quarter for the secondary education group but remained constant for the others. As noted in Table 6.4, the uneinployment rate for the men with secondary education was not significantly lower than for the other men in the sample. This could indicate that the men with secondary education do not have a significantly higher probability of being
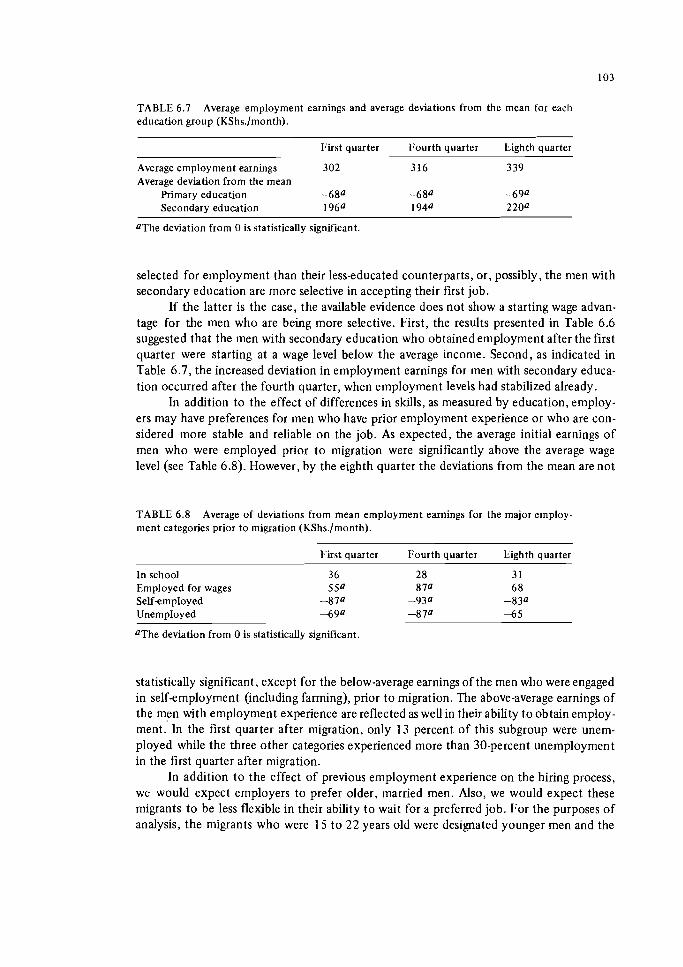
TABLE 6.7 Average employment earnings and average deviations from the mean for each education group (KShs./month).
First quarter Fourth quarter Eighth quarter
Average employment earnings 302 316 339 Average deviation from the mean
Primary education - 6 8 0 -6 80 - 6 9 O Secondary education 1960 1940 2200
aThe deviation from 0 is statistically significant.
selected for employment than their less-educated counterparts, or , possibly, the men with secondary education are more selective in accepting their first job.
If the latter is the case, the available evidence does not show a starting wage advan- tage for the men who are being more selective. First, the results presented in Table 6.6 suggested that the men with secondary education who obtained employment after the first quarter were starting at a wage level below the average income. Second, as indicated in Table 6.7, the increased deviation in employment earnings for men with secondary educa- tion occurred after the fourth quarter, when employment levels had stabilized already.
In addition t o the effect of differences in skills, as measured by education, employ- ers may have preferences for men who have prior employment experience or who are con- sidered more stable and reliable o n the job. As expected, the average initial earnings of men who were employed prior t o migration were significantly above the average wage level (see Table 6.8). However, by the eighth quarter the deviations from the mean are not
TABLE 6 .8 Average of deviations from mean employment earnings for the major employ- ment categories prior to migration (KShs./month).
First quarter Fourth quarter Eighth quarter
In school 3 6 28 3 1 Employed for wages 5S0 8 70 6 8 SelfempIoyed -870 -930 -830 UnempIoyed -69O -87' - 6 5
aThe deviation from 0 is statistically significant.
statistically significant, except for the below-average earnings of the men who were engaged in self-employment (including farming), prior t o migration. The above-average earnings of the men with employment experience are reflected as well in their ability t o obtain employ- ment. In the first quarter after migration, only 13 percent of this subgroup were unem- ployed while the three other categories experienced more than 30-percent unemployment in the first quarter after migration.
In addition t o the effect of previous employment experience on the hiring process, we would expect employers t o prefer older, married men. Also, we would expect these migrants t o be less flexible in their ability t o wait for a preferred job. For the purposes of analysis, the migrants who were 15 t o 22 years old were designated younger men and the
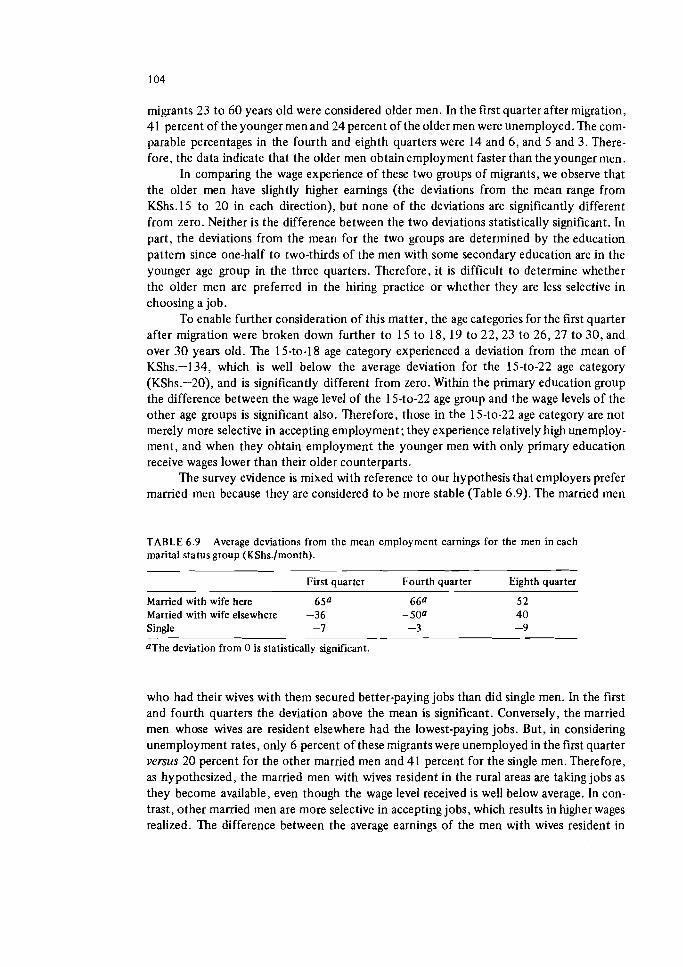
migrants 23 to 60 years old were considered older men. In the first quarter after migration, 41 percent of the younger men and 24 percent of the older men were unemployed. The com- parable percentages in the fourth and eighth quarters were 14 and 6 , and 5 and 3. There- fore, the data indicate that the older men obtain employment faster than the younger men.
In comparing the wage experience of these two groups of migrants, we observe that the older men have slightly higher earnings (the deviations from the mean range from KShs.15 to 20 in each direction), but none of the deviations are significantly different from zero. Neither is the difference between the two deviations statistically significant. In part, the deviations from the mean for the two groups are determined by the education pattern since one-half to two-thirds of the men with some secondary education are in the younger age group in the three quarters. Therefore, it is difficult to determine whether the older men are preferred in the hiring practice or whether they are less selective in choosing a job.
To enable further consideration of t h s matter, the age categories for the first quarter after migration were broken down further to 15 to 18,19 to 22 ,23 to 26,27 to 30, and over 30 years old. The 15-to-1 8 age category experienced a deviation from the mean of KShs.-134, which is well below the average deviation for the 15-to-22 age category (KShs.-20), and is significantly different from zero. Within the primary education group the difference between the wage level of the 15-to-22 age group and the wage levels of the other age groups is significant also. Therefore, those in the 1540-22 age category are not merely more selective in accepting employment; they experience relatively high unemploy- ment, and when they obtain employment the younger men with only primary education receive wages lower than their older counterparts.
The survey evidence is mixed with reference to our hypothesis that e~nployers prefer married men because they are considered to be more stable (Table 6.9). The married men
TABLE 6 .9 Average deviations from the mean employment earnings for the men in each marital status group (KShs./month).
First quarter Fourth quarter Eighth quarter
Married with wife here 65a 660 5 2 Married with wife elsewhere -36 -500 4 0 Single -7 -3 -9
OThe deviation from 0 is statistically significant.
who had their wives with them secured better-paying jobs than did single men. In the first and fourth quarters the deviation above the mean is significant. Conversely, the married men whose wives are resident elsewhere had the lowest-paying jobs. But, in considering unemployment rates, only 6 percent of these migrants were unemployed in the first quarter versus 20 percent for the other married men and 41 percent for the single men. Therefore, as hypothesized, the married men with wives resident in the rural areas are taking jobs as they become available, even though the wage level received is well below average. In con- trast, other mamed rnen are more selective in accepting jobs, which results in higher wages realized. The difference between the average earnings of the men with wives resident in
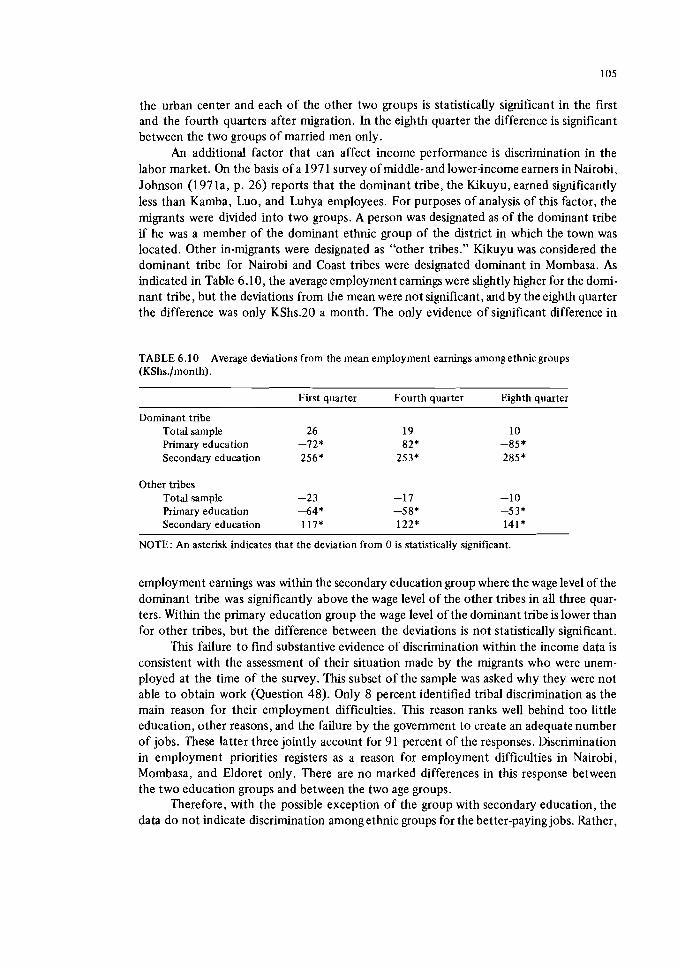
the urban center and each of the other two groups is statistically significant in the first and the fourth quarters after migration. In the eighth quarter the difference is significant between the two groups of married men only.
An additional factor that can affect income performance is discrimination in the labor market. On the basis of a 1971 survey of middle-and lower-income earners in Nairobi, Johnson (1971a, p. 26) reports that the dominant tribe, the Kikuyu, earned significantly less than Kamba, Luo, and Luhya employees. For purposes of analysis of this factor, the migrants were divided into two groups. A person was designated as of the dominant tribe if he was a member of the dominant ethnic group of the district in which the town was located. Other in-migrants were designated as "other tribes." Kikuyu was considered the dominant tribe for Nairobi and Coast tribes were designated dominant in Mombasa. As indicated in Table 6.10, the average employment earnings were slightly higher for the domi- nant tribe, but the deviations from the mean were not significant, and by the eighth quarter the difference was only KShs.20 a month. The only evidence of significant difference in
TABLE 6.10 Average deviations from the mean employment earnings among ethnicgroups (KShs./month).
First quarter Fourth quarter Eighth quarter
Dominant tribe Total sample 26 19 10 Primary education -72* -82* -85 * Secondary education 256* 253* 285*
Other tribes Total sample -23 -1 7 -1 0 Primary education 4 4 * -58* -53* Secondary education 117* 122* 141*
NOTE: An asterisk indicates that the deviation from 0 is statistically significant.
employment earnings was within the secondary education group where the wage level of the dominant tribe was significantly above the wage level of the other tribes in all three quar- ters. Within the primary education group the wage level of the dominant tribe is lower than for other tribes, but the difference between the deviations is not statistically significant.
This failure t o find substantive evidence of discrimination within the income data is consistent with the assessment of their situation made by the migrants who were unem- ployed at the time of the survey. This subset of the sample was asked why they were not able to obtain work (Question 48). Only 8 percent identified tribal discrimination as the main reason for their employment difficulties. This reason ranks well behind too little education, other reasons, and the failure by the government to create an adequate number of jobs. These latter three jointly account for 91 percent of the responses. Discrimination in employment priorities registers as a reason for employment difficulties in Nairobi, Mombasa, and Eldoret only. There are no marked differences in this response between the two education groups and between the two age groups.
Therefore, with the possible exception of the group with secondary education, the data do not indicate discrimination among ethnic groups for the better-paying jobs. Rather,
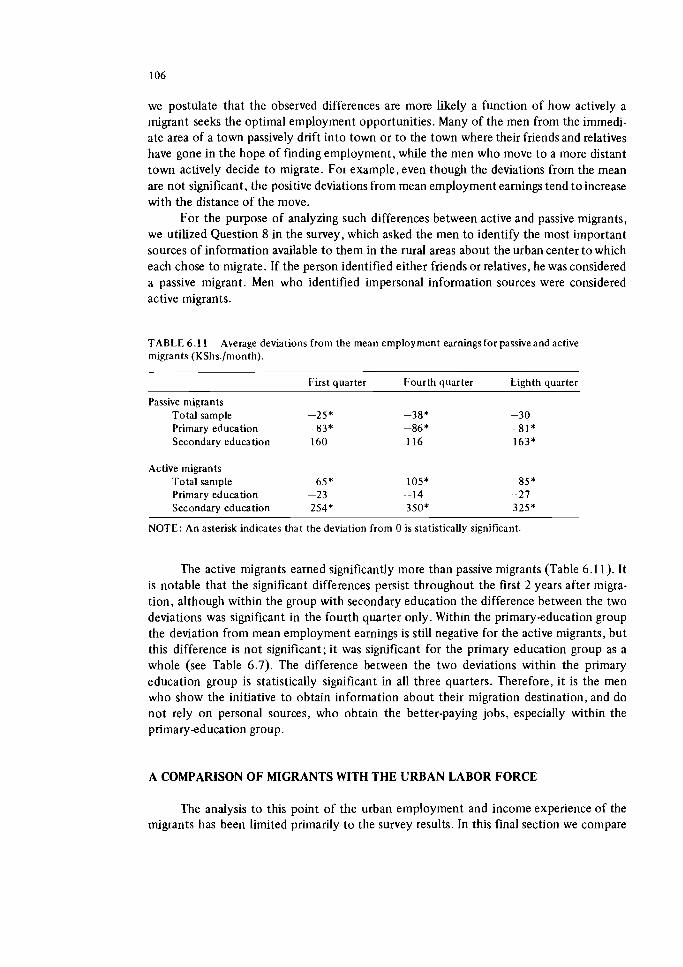
we postulate that the observed differences are more likely a function of how actively a migrant seeks the optimal employment opportunities. Many of the men from the immedi- ate area of a town passively drift into town or to the town where their friends and relatives have gone in the hope of finding employment, while the men who move to a more distant town actively decide to migrate. For example, even though the deviations from the mean are not significant, the positive deviations from mean employment earnings tend to increase with the distance of the move.
For the purpose of analyzing such differences between active and passive migrants, we utilized Question 8 in the survey, which asked the men to identify the most important sources of information available to them in the rural areas about the urban center to which each chose to migrate. If the person identified either friends or relatives, he was considered a passive migrant. Men who identified impersonal information sources were considered active migrants.
TABLE 6.1 1 Average deviations from the mean employ ment earnings for passive and active migrants (KShs./month).
First quarter Fourth quarter Eighth quarter
Passive migrants Total sample -25* -38* -30 Primary education -83* -86* -81* Secondary education 160 116 163*
Active migrants Total sample 65 * 105* 85 * Primary education -23 -14 -27 Secondary education 254* 350* 325*
NOTE: An asterisk indicates that the deviation from 0 is statistically significant.
The active migrants earned significantly more than passive migrants (Table 6.1 1). It is notable that the significant differences persist throughout the first 2 years after migra- tion, although within the group with secondary education the difference between the two deviations was significant in the fourth quarter only. Within the primaryeducation group the deviation from mean employment earnings is still negative for the active migrants, but this difference is not significant; it was significant for the primary education group as a whole (see Table 6.7). The difference between the two deviations within the primary education group is statistically significant in all three quarters. Therefore, it is the men who show the initiative to obtain information about their migration destination, and do not rely on personal sources, who obtain the better-paying jobs, especially within the primaryeducation group.
A COMPARISON OF MIGRANTS WITH THE URBAN LABOR FORCE
The analysis to this point of the urban employment and income experience of the migrants has been limited primarily to the survey results. In this final section we compare
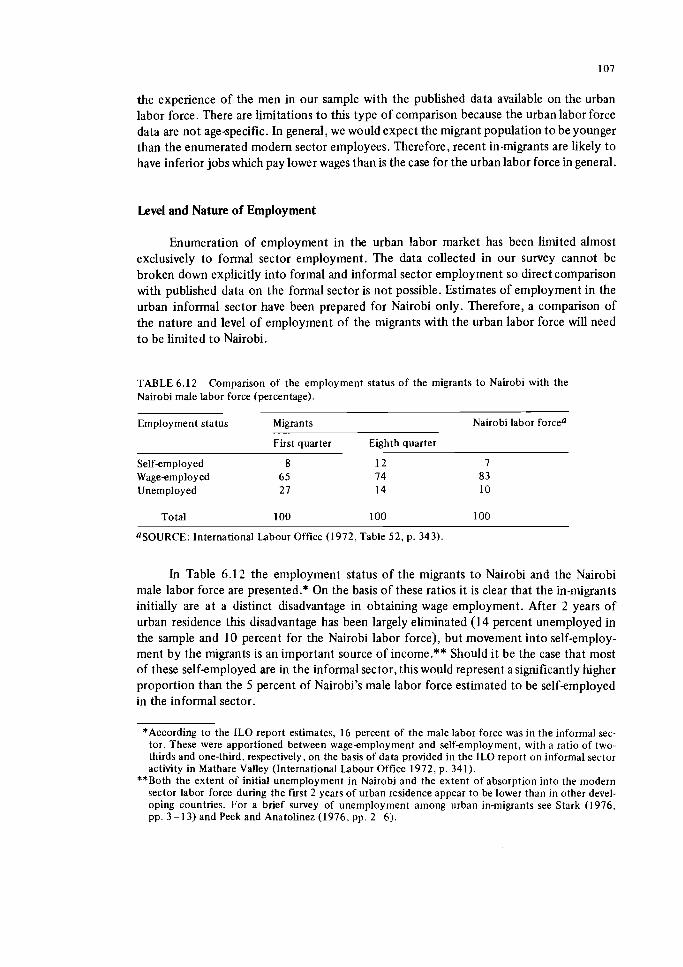
the experience of the men in our sample with the published data available on the urban labor force. There are limitations t o this type of comparison because the urbanlabor force data are not age-specific. In general, we would expect the migrant population to be younger than the enumerated modem sector employees. Therefore, recent in-migrants are likely t o have inferior jobs which pay lower wages than is the case for the urban labor force in general.
Level and Nature of Employment
Enumeration of employment in the urban labor market has been limited almost exclusively to formal sector employment. The data collected in our survey cannot be broken down explicitly into formal and informal sector employment so direct comparison with published data on the formal sector is not possible. Estimates of employment in the urban informal sector have been prepared for Nairobi only. Therefore, a comparison of the nature and level of employment of the migrants with the urban labor force will need to be limited to Nairobi.
TABLE 6.12 Comparison of the employment status of the migrants t o Nairobi with the Nairobi male labor force (percentage).
Employment status Migrants Nairobi labor forcea
First quarter Eighth quarter
Selfemployed 8 1 2 7 Wageemployed 6 5 74 8 3 Unemployed 2 7 1 4 1 0
Total 100 100 100
USOURCE: lnternational Labour Office (1972, Table 52, p. 343).
In Table 6.12 the e~nployment status of the migrants t o Nairobi and the Nairobi male labor force are presented.* On the basis of these ratios it is clear that the in-migrants initially are at a distinct disadvantage in obtaining wage employment. After 2 years of urban residence this disadvantage has been largely eliminated (1 4 percent unemployed in the sample and 10 percent for the Nairobi labor force), but movement into self-employ- ment by the migrants is an important source of income.** Should it be the case that most of these self-employed are in the informal sector, this would represent a significantly higher proportion than the 5 percent of Nairobi's male labor force estimated to be self-employed in the informal sector.
*According to the 1LO report estimates, 16 percent of the male labor force was in the informal sec- tor. These were apportioned between wageemployment and selfemployment, with a ratio of two- thirds and one-third, respectively, on the basis of data provided in the 1LO report on informal sector activity in Mathare Valley (International Labour Office 1972. p. 341).
**Both the extent of initial unemployment in Nairobi and the extent of absorption into the modern sector labor force during the first 2 years of urban residence appear to be lower than in other devel- oping countries. For a brief survey of unemployment among urban in-migrants see Stark (1976, pp. 3 1 3 ) and Peek and Anatolinez (1976, pp. 2 6 ) .
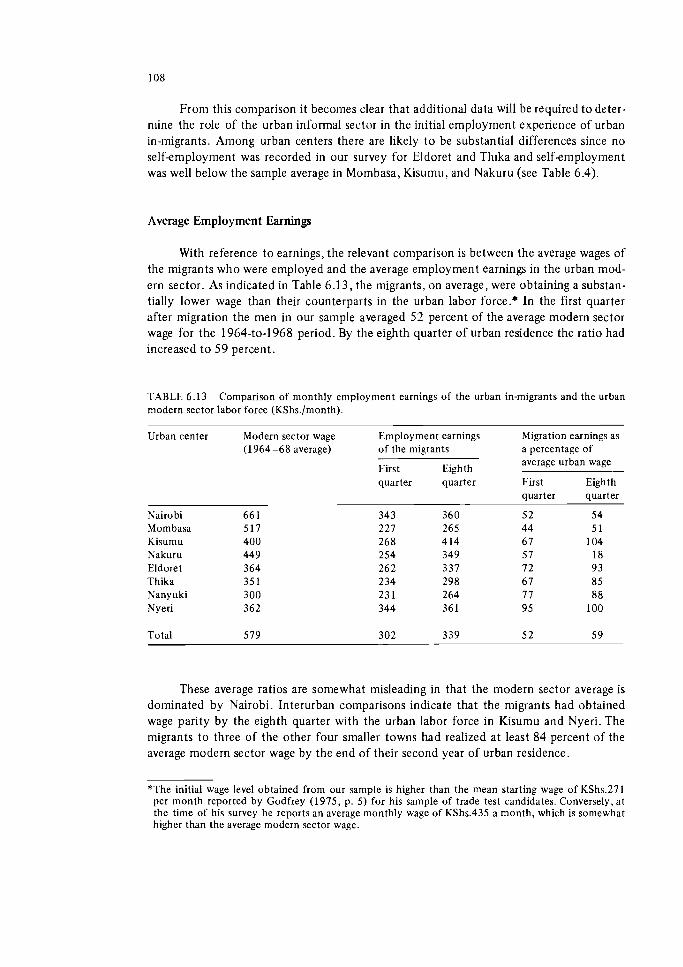
From this comparison it becomes clear that additional data will be required t o deter- mine the role of the urban informal sector in the initial employment experience of urban in-migrants. Among urban centers there are likely t o be substantial differences since n o selfemployment was recorded in our survey for Eldoret and Thika and selfemployment was well below the sample average in Mombasa, Kisumu, and Nakuru (see Table 6.4).
Average Employment Earnings
With reference t o earnings, the relevant comparison is between the average wages of the migrants who were employed and the average employment earnings in the urban mod- ern sector. As indicated in Table 6.13, the migrants, on average, were obtaining a substan- tially lower wage than their counterparts in the urban labor force.* In the first quarter after migration the men in our sample averaged 52 percent of the average modern sector wage for the 1964-to-1968 period. By the eighth quarter of urban residence the ratio had increased t o 5 9 percent.
TABLE 6.13 Comparison of monthly employment earnings of the urban in-migrants and the urban modern sector labor force (KShs./month).
Urban center Modern sector wage Employment earnings Migration earnings as (1 964 -68 average) of the migrants a percentage of
Eighth average urban wage
First -
quarter quarter First Eighth
Nairobi Mombasa Kisumu Nakuru Eldoret Thika Nanyuki Nyeri
quarter quarter
5 2 54 44 5 1 67 104 57 18 72 9 3 67 85 77 8 8 9 5 100
Total 579 302 339 5 2 5 9
These average ratios are somewhat misleading in that the modern sector average is dominated by Nairobi. Interurban comparisons indicate that the migrants had obtained wage parity by the eighth quarter with the urban labor force in Kisumu and Nyeri. The migrants t o three of the other four smaller towns had realized at least 8 4 percent of the average modern sector wage by the end of their second year of urban residence.
*The initial wage level obtained from our sample is higher than the mean starting wage of KShs.271 per month reported by Godfrey (1975, p. 5) for his sample of trade test candidates. Conversely, at the time of his survey he reports an average monthly wage of KShs.435 a month, which is somewhat higher than the average modern sector wage.
It is primarily in Nairobi and Mombasa where a substantial differential between the wage of the migrants and the modern sector employment wage is maintained over time. For Nairobi, the limited growth in wages from the first to the eighth quarter reflects an inability of the men with secondary education to advance significantly on the wage scale. In Mombasa the men in our survey earned below-average wages for the sample even though modern sector wages rank second among the eight urban centers.
Two explanations are consistent with the findings for Nairobi and Mombasa. First, the average modern sector wage is not as accurate a measure of what is available t o in- migrants to Nairobi and Mombasa as it is for the smaller towns. Second, both of these cities may prove attractive for the potential for advancement that they represent as well as for the initial level of wages available. These two explanations are not necessarily mutu- ally exclusive.
High urban wages not directly attainable by in-migrants are consistent with the regression results reported in Chapter 4. There it was determined that migration for males varied directly with the level of modern sector wages (Xi) and inversely with the measure of employment prospects (Ui) A comparison of average modern sector wages in each town (Table 6.13) with the proportion who obtained wage employment in the first quarter (Table 6.4), indicates a close, inverse ranking among the five largest urban centers. The sole exception is Kisumu which ranks fourth highest in average modern sector wage levels and second highest in the proportion wageemployed. The explanation here may be that migrants t o Kisumu appear to be unusually successful in obtaining the average modern sector wage (see Table 6.1 3).
The substantial difference between wage levels of the migrants and modern sector wages in Nairobi and Mombasa could mean that a large proportion of the migrants there had to accept jobs below the type that they had hoped to obtain. The same could hold for the disproportionate number of selfemployed in Nairobi (see Table 6.12). To assess whether the respondents saw any causal link between wage levels and job availability they were asked: "Some people claim that the reason why there is so much unemployment in the city is that city wages are very much higher than farm income and that at these high wages, there are not enough jobs for everyone. They say that if city wages were lowered there would be more jobs and less unemployment. Do you agree that there would be more jobs and less unemployment here if the wages here were lowered?" (Question 50).
As reported in Table 6.14, the men were rather equally divided on this question. It is in the three smallest towns, where unemployment was lowest throughout for the migrants, where the men are most prone to disagree. In Nairobi and Mombasa the proportion who disagree is also somewhat larger than the sample average. The distribution in responses among education groups was statistically significant. As might be expected, the men with secondary education were more likely to disagree that high wages caused an unemploy- ment problem than were their less educated-counterparts.
SUMMARY
The analysis of the urban structure of employment and earnings evident in the sam- ple indicates that a substantial urban-rural income differential exists. The precise measure- ment of this income differential is difficult because more than half of the men were in
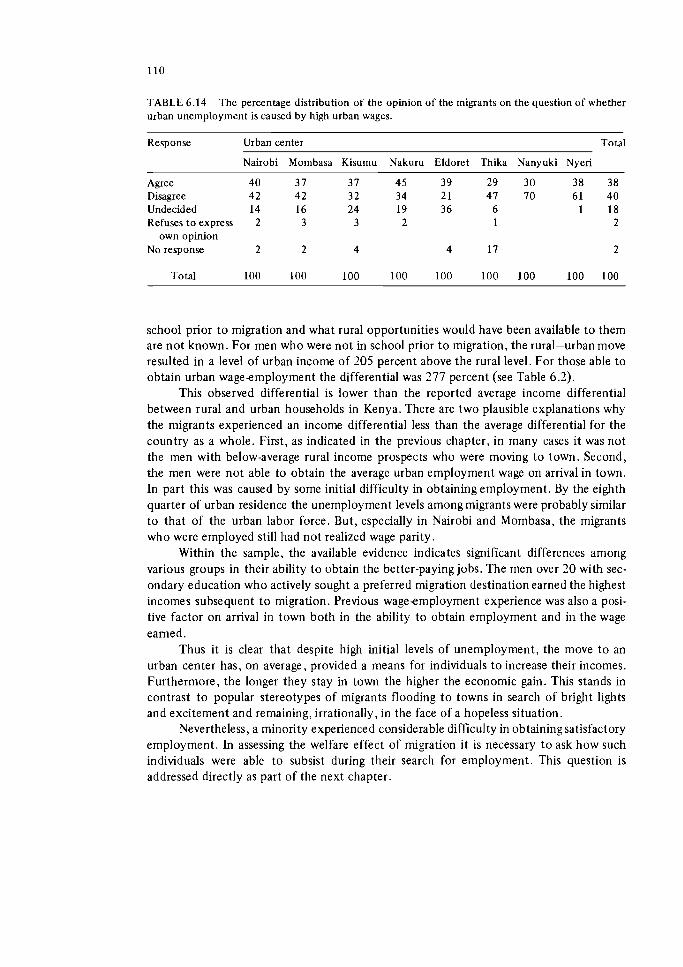
TABLE 6.14 The percentage distribution of the opinion o f the migrants on the question o f whether urban unemployment is caused by high urban wages.
Response Urban center Total
Nairobi Mombasa Kisumu Nakuru Eldoret Thika Nanyuki Nyeri
Agree 40 3 7 37 4 5 3 9 29 30 38 38 Disagree 42 42 3 2 34 2 1 47 70 61 40 Undecided 14 16 24 19 3 6 6 1 18 Refuses t o express 2 3 3 2 1 2
own opinion No response 2 2 4 4 17 2
Total 100 100 100 100 100 100 100 100 100
school prior t o migration and what rural opportunities would have been available t o them are no t known. For men who were not in school prior t o migration, the rural-urban move resulted in a level of urban income of 205 percent above the rural level. For those able t o obtain urban wageemployment the differential was 277 percent (see Table 6.2).
This observed differential is lower than the reported average income differential between rural and urban households in Kenya. There are two plausible explanations why the migrants experienced an income differential less than the average differential for the country as a whole. First, as indicated in the previous chapter, in many cases it was not the men with below-average rural income prospects who were moving t o town. Second, the men were not able to obtain the average urban employment wage on arrival in town. In part this was caused by some initial difficulty in obtaining employment. By the eighth quarter of urban residence the unemployment levels among migrants were probably similar t o that of the urban labor force. But, especially in Nairobi and Mombasa, the migrants who were employed still had not realized wage parity.
Within the sample, the available evidence indicates significant differences among various groups in their ability t o obtain the better-paying jobs. The men over 2 0 with sec- ondary education who actively sought a preferred migration destination earned the highest incomes subsequent t o migration. Previous wageemployment experience was also a posi- tive factor on arrival in town both in the ability t o obtain employment and in the wage earned.
Thus it is clear that despite high initial levels of unemployment, the move t o an urban center has, on average, provided a means for individuals t o increase their incomes. Furthermore, the longer they stay in town the higher the economic gain. This stands in contrast t o popular stereotypes of migrants flooding t o towns in search of bright lights and excitement and remaining, irrationally, in the face of a hopeless situation.
Nevertheless, a minority experienced considerable difficulty in obtainingsatisfactory employment. In assessing the welfare effect of migration it is necessary t o ask how such individuals were able t o subsist during their search for employment. This question is addressed directly as part of the next chapter.
7 THE ROLE OF URBAN-BASED KIN
For a rwal resident, the move to a city or town involves significant costs as well as the prospects of substantial economic gain. Initially, there is the cost of travel t o a n urban center. Once in town, there is the need t o obtain food and shelter, which typically cost more than in rural areas. Third, there are the costs of the job search. In addition t o such economic costs, there are noneconomic costs which are frequently difficult t o measure (Somers 1967, p. 428). Beyond the costs involved there can be considerable uncertainty associated with the move since according t o our migration model, the probability of obtain- ing employment with the desired level of income is somewhat less than 1 in the cities and towns of Kenya.
The economic costs of the move as well as the employment uncertainty can be reduced significantly if the prospective migrant can rely on a relative or friend (kin) t o provide assistance during and after a move. According to Weisiler (1976, p. 200): "The likelihood of a particular male homestead member leaving the countryside and coming t o the city depends on two factors: 1) his own perception of the probability of success in obtaining employment in the town; and 2) the nature of the social and economic support available t o the migrant in the country and in the city." Although our migration model is premised on migration from within the context of a rural household, the data collected in the survey were limited t o assistance provided by urban-based kin. As a result, the role of the rural-based members of the extended family in the migration process, as modeled by Mitchell (1959) and documented in detail by Weisner (1972) for one group in Kenya, is not discussed here. Data on contributions made by rural-based members of the household are limited to money sent t o the migrant, which we analyze in Chapter 9 as part of the discussion of rural -urban remittances.
Potentially, kin can provide information about possible destinations, assist in the move by providing transportation, provide housing and food when the migrant first arrives, and assist the new arrival in finding employment. In this chapter we draw on information provided in our survey t o determine the role of kin in assisting the prospective migrant. First, we consider the information sources about the destination that the respondent has chosen, the material assistance that he received on arrival, and the role of kin in his finding employment.
Second, since some men were unemployed for a considerable time on first arriving in town, we consider how the unemployed subsist. Again, our data were not coded in terms of the formal-informal sector dichotomy featured prominently in the literature that appeared subsequent t o our survey. However, on the basis of our analysis of how the unemployed maintained themselves we seek to addressindirectly the deductive proposition that the urban informal sector serves as the point of entry where recent in-migrants queue for the available formal sector jobs.
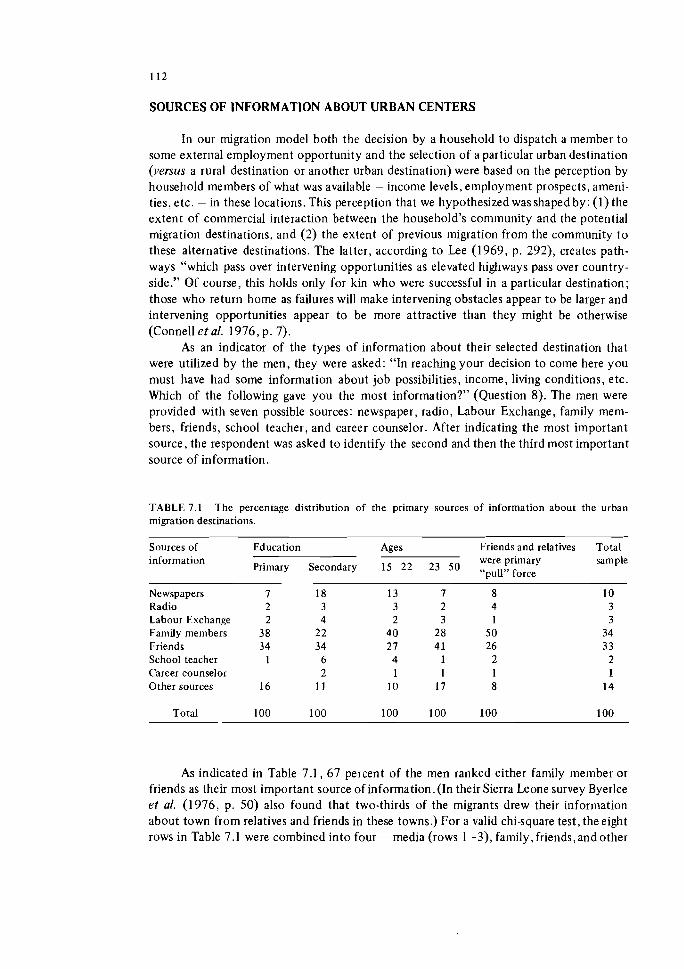
SOURCES O F INFORMATION ABOUT URBAN CENTERS
In our migration model both the decision by a household t o dispatch a member t o some external employment opportunity and the selection of a particular urban destination (versus a rural destination or another urban destination) were based on the perception by household members of what was available - income levels, employment prospects, ameni- ties, e tc . - in these locations. This perception that we hypothesized wasshaped by: ( I ) the extent of commercial interaction between the household's community and the potential migration destinations, and (2) the extent of previous migration from the community t o these alternative destinations. The latter, according t o Lee (1969, p. 292), creates path- ways "which pass over intervening opportunities as elevated highways pass over country- side." Of course, this holds only for kin who were successful in a particular destination; those who return home as failures will make intervening obstacles appear t o be larger and intervening opportunities appear t o be more attractive than they might be otherwise (Connell e t al. 1976, p. 7).
As an indicator of the types of information about their selected destination that were utilized by the men, they were asked: "In reaching your decision t o come here you must have had some information about job possibilities, income, living conditions, etc. Which of the following gave you the most information?" (Question 8). The men were provided with seven possible sources: newspaper, radio, Labour Exchange, family mem- bers, friends, school teacher, and career counselor. After indicating the most important source, the respondent was asked to identify the second and then the third most important source of information.
TABLE 7.1 The percentage distribution of the primary sources of information about the urban migration destinations.
Sources of Education Ages Friends and relatives Total - information were primary
Primary Secondary 15-22 23-50 "pull" force sample
Newspapers Radio Labour Exchange Family members Friends School teacher Career counselor Other sources
Total
As indicated in Table 7.1, 6 7 percent of the men ranked either family member or friends as their most important source of information. (In their Sierra Leone survey Byerlee et al. (1976, p. 50) also found that two-thirds of the migrants drew their information about town from relatives and friends in these towns.) For a valid chi-square test, the eight rows in Table 7.1 were combined into four - media (rows 1 -3), family, friends, and other
sources (the last 3 rows). The variation in the distribution of the information sources between the two education groups and between the two age groups was significant. The younger men rely relatively more on family members and the older men receive more infor- mation from friends. Also, the younger men rely somewhat more on the media, especially newspapers. The men with secondary education have a marked tendency to depend more on sources other than relatives and friends.
The variation in the distribution of these four types of information sources among the eight urban centers was also statistically significant. The men in Nairobi, Thika, and Nyeri show proportionately less reliance on family members while men in Nairobi, Kisumu, and Nyeri rely proportionately more on friends.
With reference to the second most important source of information, 39 percent of the men listed relatives or friends, and an additional 44 percent did not indicate a second source. Of the men who ranked family members as their first source, 37 percent did not have a second source, 53 percent indicated friends as their second source, 77 percent did not indicate a third source, and 4 percent indicated friends as a third source. Of the men who gave friends as their first source, 39 percent did not have a second source, 74 percent did not have a third source, 38 percent listed relatives as a second source, and 3 percent listed relatives as a third source. Of the remaining categories, "other sources" had the high- est frequency but none appeared prominently in the distribution.
As an additional check on the role of kin as a source of information, the distribution of the primary sources of information is provided in Table 7.1 for men who indicated friends or relatives as their primary "pull" to a particular urban center (Question 7). Several conclusions can be drawn from a comparison of this column with the others in the table. First, for this subset of the sample, family members are more important and friends are less important than for the total sample. Second, even though the presence of kin was the primary "pull" force t o town, the distribution of the primary sources of information is not very different from the total sample. Therefore, even thpugh kin are available in the urban center, the migrants have and use other information sources. Indeed, the presence of relatives in town may be the stimulus to use the media to obtain information about a particular center.
The responses to Question 8 indicate the primary importance of personal informa- tion sources. This result could show that other sources have proved to be inadequate. In his Ghana study, Caldwell(1969, p. 122) notes the failure of the press or radio to portray the realities of everyday life in the towns and cities. A comparable evaluation of Kenya's mass media was not undertaken. The importance of newspapers for men with secondary education and men with primary education indicates that newspapers provide information about urban life for those who have a number of years of formal schooling. With consider- able urban unemployment, it is not surprising that Labour Exchanges fail to serve as an important source of information about urban centers for men who choose to take their chances in the urban employment lottery.
Both Caldwell's study for Ghana (1969, p. 122) and the study by Byerlee et al. in Sierra Leone (1976, pp. 50-51) show that urban in-migrants were quite accurately in- formed about their migration destination before they made the move. Although we did not make a direct attempt to measure the quality of the information received, we did ask the men: "When you first arrived here, what type of work were you hoping to get?" (Question 9); and, "When you first arrived, how much income did you expect you could earn?" (Question 10).
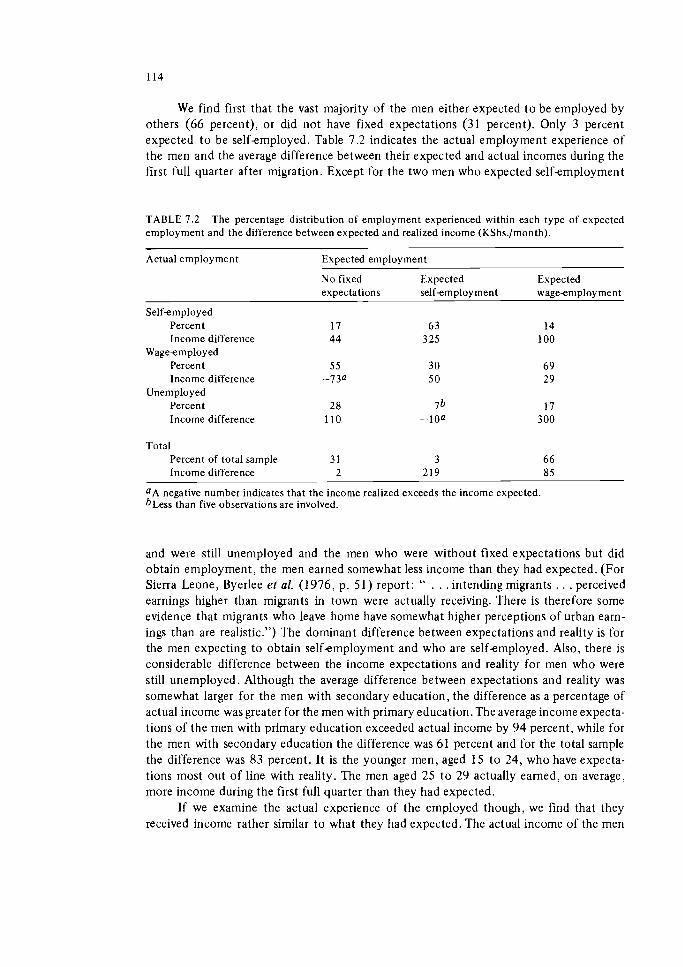
We find first that the vast majority of the men either expected to be employed by others (66 percent), or did not have fixed expectations (31 percent). Only 3 percent expected to be self-employed. Table 7.2 indicates the actual employment experience of the men and the average difference between their expected and actual incomes during the first full quarter after migration. Except for the two men who expected self-employment
TABLE 7.2 The percentage distribution of employment experienced within each type of expected employment and the difference between expected and realized income (KShs./month).
Actual employment Expected ernployment
No fixed Expected Expected expectations self-employment wage-eniploy ment
Self-employed Percent 17 6 3 14 Income difference 44 3 25 100
Wageemployed Percent 5 5 3 0 69 Income difference -730 5 0 29
Unemployed Percent 28 76 17 Income difference 110 - - l o a 3 00
Total Percent of total sample 3 1 3 66 Income difference 2 219 85
aA negative number indicates that the income realized exceeds the income expected. b ~ e s s than five observations are involved.
and were still unemployed and the men who were without fixed expectations but did obtain employment, the men earned somewhat less income than they had expected. (For Sierra Leone, Byerlee et al. (1976, p. 51) report: " . . . intending migrants . . . perceived earnings higher than migrants in town were actually receiving. There is therefore some evidence that migrants who leave home have somewhat higher perceptions of urban earn- ings than are realistic.") The dominant difference between expectations and reality is for the men expecting to obtain selfemployment and who are selfemployed. Also, there is considerable difference between the income expectations and reality for men who were still unemployed. Although the average difference between expectations and reality was somewhat larger for the men with secondary education, the difference as a percentage of actual income was greater for the men with primary education. The average income expecta- tions of the men with primary education exceeded actual income by 94 percent, while for the men with secondary education the difference was 61 percent and for the total sample the difference was 83 percent. It is the younger men, aged 15 to 24, who have expecta- tions most out of line with reality. The men aged 25 to 29 actually earned, on average, more income during the first full quarter than they had expected.
If we examine the actual experience of the employed though, we find that they received income rather similar to what they had expected. The actual income of the men
who expected self-employment but were employed for wages is only 11 percent below their expectations, while the men who expected to be employed for wages earned 8 per- cent less than what they had hoped for. The wide divergence between expectations and reality for men with primary and men with secondary education, as reported above, was caused by an inability to obtain desired employment, not by seriously distorted expecta- tions about income levels in the urban areas.
Therefore, we conclude that the men were rather accurately informed about urban economic possibilities. In general, they were somewhat overly optimistic about incomes at least initially. In part, this optimism may be based on the income experiences of the most successful kin in town, which exceeded average possibilities. It is not surprising that it is the young men and the men with secondary education who have formed unrealistic expectations. It is to be expected that many of them will advance upward on the employ- ment and income scale as they mature and gain experience.
ECONOMIC ASSISTANCE ON ARRIVAL IN TOWN
Once a decision to migrate has been made, the quality of kin relationships becomes important (Moock 1973, p. 313). To what extent can urban-based kin provide the assis- tance needed to reduce both the cost and the uncertainty associated with the rural-to-urban move? The survey questionnaire was designed to collect information on three types of economic assistance received from urban-based kin on arrival of the migrant in town (see Questions 14 to 19).
Food and Housing
Table 7.3 summarizes the information on the proportion of the men in the sample who received food and/or housing assistance from urban-based kin.
The distribution of men receiving such assistance in each urban center is broken down by the primary sources of information about the urban center (Question 8) and by the primary "pull" forces to that particular urban center (Question 7). We note first that there is considerable variation among urban centers, ranging from 55 percent for Nanyuki to 90 percent for Eldoret. Our average of 82 percent receiving support from kin is a little lower than what is reported in two other surveys. Byerlee et al. (1976, pp. 54-55) found that almost 90 percent of the migrants interviewed in Sierra Leone received support from their kin when they first arrived. Similarly, Bienefeld and Sabot (1972, Vol. 11, Ch. 7) indicate that 9 0 percent of the men interviewed in Tanzania received material aid on arrival.
An above-average proportion of migrants received assistance whose relatives were their primary information source, rather than friends, teachers or counselors. But, the per- centage of those who drew their primary information from the media wasnot significantly less. As a result, it is not possible t o conclude that passive migrants(those relying primarily on personal information sources) are more likely t o be provided with food and housingby kin than active migrants (those relying on impersonal information as the primary source).
For the men who identified urban-based kin as the primary "pull" force the propor- tion that received food and/or housing is somewhat higher than for the remainder of the
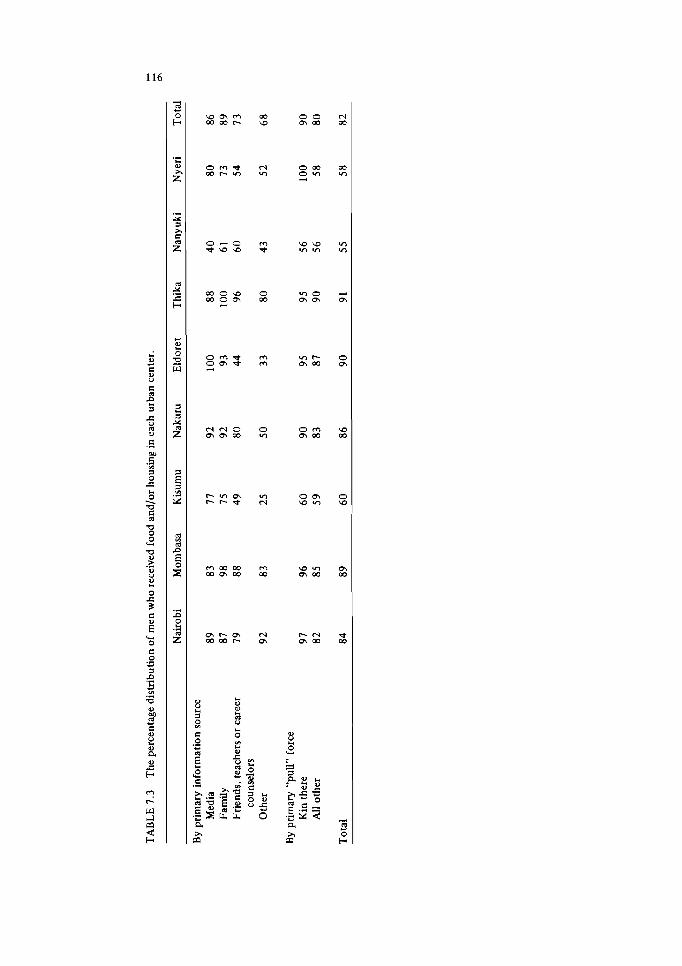
w v ) m m
3 g
.- a
,x
.- Y
X
5 Z
Id
rY- s C
i j
3 4 3
Y" Z
a 5 V) - X
9 P
4 a e .-
w m m m m m ~ w
o m * N m,, m
0 - 0 m * w w *
m o w o - o m * m m m
N N O 0 m m r n m
I - m m m * N
m m m m m m m m
m N m m - m
8 Z 2 V) 2 c s .- C
V)
w 2 e m '2 2 s .5 7 3 h c a , X p : 5 4
E . O 8; Z z b E 0
X CP
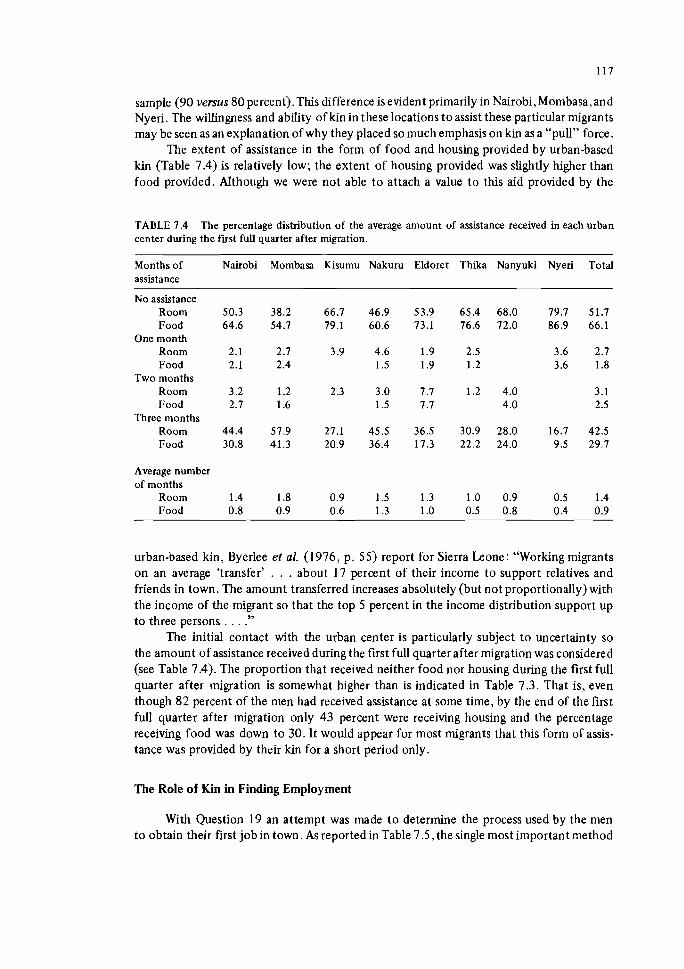
sample (90 versus 80 percent). This difference is evident primarily in Nairobi, Mombasa, and Nyeri. The willingness and ability of kin in these locations t o assist these particular migrants may be seen as an explanation of why they placed so much emphasis on kin as a "pull" force.
The extent of assistance in the form of food and housing provided by urban-based kin (Table 7.4) is relatively low; the extent of housing provided was slightly higher than food provided. Although we were not able t o attach a value t o this aid provided by the
TABLE 7.4 The percentage distribution of the average amount of assistance received in each urban center during the first full quarter after migration.
Months of Nairobi Mombasa Kisumu Nakuru Eldoret Thika Nanyuki Nyeri Total assistance
No assistance Room Food
One month Room Food
Two months Room Food
Three months Room Food
Average number of months
Room 1.4 1.8 0.9 Food 0.8 0.9 0.6
urban-based kin, Byerlee et al. (1976, p. 55) report for Sierra Leone: "Working migrants on an average 'transfer' . . . about 17 percent of their income to support relatives and friends in town. The amount transferred increases absolutely (but not proportionally) with the income of the migrant so that the top 5 percent in the income distribution support up to three persons . . . ."
The initial contact with the urban center is particularly subject to uncertainty so the amount of assistance received during the first full quarter after migration was considered (see Table 7.4). The proportion that received neither food nor housing during the first full quarter after migration is somewhat higher than is indicated in Table 7.3. That is, even though 82 percent of the men had received assistance at some time, by the end of the first full quarter after migration only 43 percent were receiving housing and the percentage receiving food was down to 30. It would appear for most migrants that this form of assis- tance was provided by their kin for a short period only.
The Role of Kin in Finding Employment
With Question 19 an attempt was made t o determine the process used by the men to obtain their first job in town. As reported in Table 7.5, the single most important method
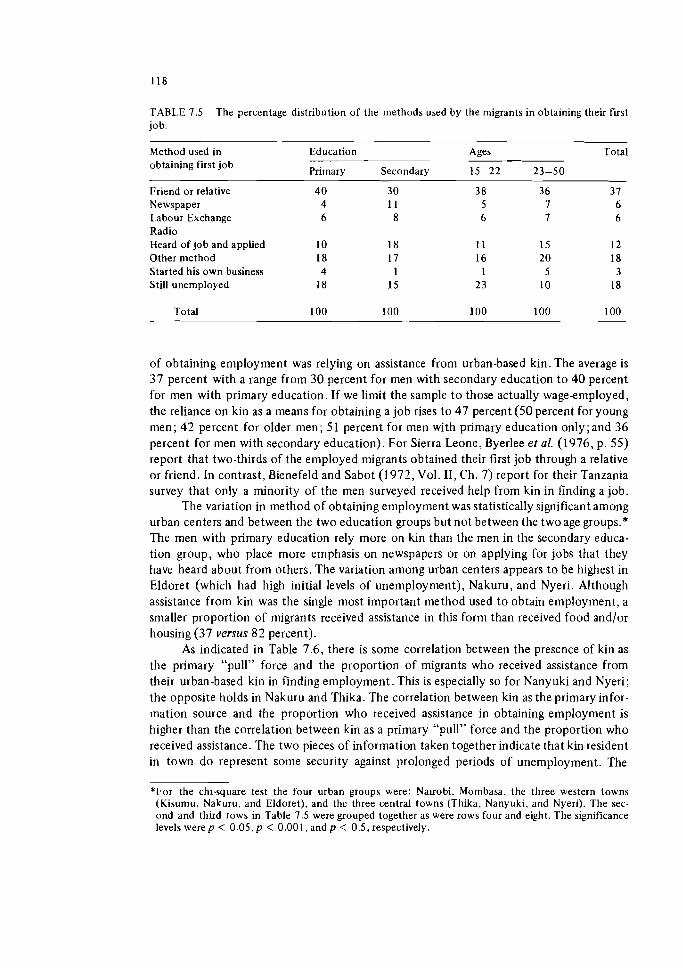
TABLE 7.5 The percentage distribution of the methods used by the migrants in obtaining theu f i s t job.
Method used in Education Ages Total obtaining f i s t job Pri~nar y Secondary 15-22 23-50
Friend or relative Newspaper Labour Exchange Radio Heard of job and applied Other method Started his own business Still unemployed
Total
of obtaining employment was relying on assistance from urban-based kin. The average is 3 7 percent with a range from 3 0 percent for men with secondary education t o 4 0 percent for men with primary education. If we limit the sample t o those actually wageemployed, the reliance o n kin as a means for obtaining a job rises t o 47 percent (50 percent for young men; 4 2 percent for older men; 51 percent for men with primary education on1y;and 3 6 percent for men with secondary education). For Sierra Leone, Byerlee e t al. (1976, p. 55) report that two-thirds of the employed migrants obtained their first job through a relative or friend. In contrast, Bienefeld and Sabot (1972, Vol. 11, Ch. 7) report for their Tanzania survey that only a minority of the men surveyed received help from kin in finding a job.
The variation in method of obtaining employment was statistically significant among urban centers and between the two education groups but not between the twoage groups.* The men with primary education rely more on kin than the men in the secoridary educa- tion group, who place more emphasis on newspapers or on applying for jobs that they have heard about from others. The variation among urban centers appears t o be highest in Eldoret (which had high initial levels of unemployment), Nakuru, and Nyeri. Although assistance from kin was the single most important method used t o obtain employment, a smaller proportion of migrants received assistance in this form than received food and/or housing (37 versus 82 percent).
As indicated in Table 7.6, there is some correlation between the presence of kin as the primary "pull" force and the proportion of migrants who received assistance from their urban-based kin in finding employment. This is especially so for Nanyuki and Nyeri; the opposite holds in Nakuru and Thika. The correlation between kin as the primary infor- mation source and the proportion who received assistance in obtaining employment is higher than the correlation between kin as a primary "pull" force and the proportion who received assistance. The two pieces of information taken together indicate that kin resident in town d o represent some security against prolonged periods of unemployment. The
*For the chi-square test the four urban groups were: Nairobi. Mombasa, the three western towns (Kisumu, Nakuru, and Eldoret), and the three central towns (Thika, Nanyuki, and Nyeri). The sec- ond and thud rows in Table 7.5 were grouped together as were rows four and eight. The significance levels were p < 0.05, p < 0 .001 , and p < 0.5, respectively.
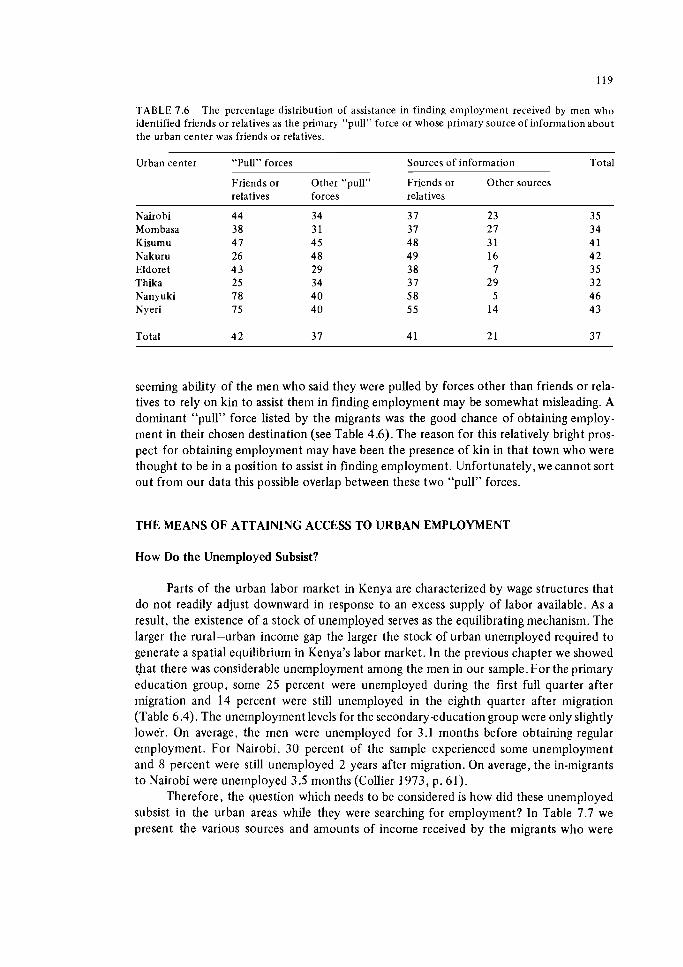
TABLF 7.6 The percentage distribution of assistance in finding employment received by men who identified friends or relatives as the primary "pull" force or whose primary source of information about the urban center was friends or relatives.
Urban center "Pull" forces Sources of information Total
Friends or Other "pull" Friends or Other sources relatives forces relatives
Nairobi Mombasa Kisumu Nakuru Eldoret Thika Nanyuki Nyeri
Total
seeming ability of the men who said they were pulled by forces other than friends or rela- tives t o rely on kin to assist them in finding employment may be somewhat misleading. A dominant "pull" force listed by the migrants was the good chance of obtaining employ- ment in their chosen destination (see Table 4.6). The reason for this relatively bright pros- pect for obtaining employment may have been the presence of kin in that town who were thought to be in a position to assist in finding employment. Unfortunately,we cannot sort out from our data this possible overlap between these two "pull" forces.
THE MEANS OF ATTAINING ACCESS TO URBAN EMPLOYMENT
How Do the Unemployed Subsist?
Parts of the urban labor market in Kenya are characterized by wage structures that do not readily adjust downward in response to an excess supply of labor available. As a result, the existence of a stock of unemployed serves as the equilibrating mechanism. The larger the rural-urban income gap the larger the stock of urban unemployed required to generate a spatial equilibrium in Kenya's labor market. In the previous chapter we showed %at there was considerable unemployment among the men in our sample. For the primary education group, some 25 percent were unemployed during the first full quarter after migration and 14 percent were still unemployed in the eighth quarter after migration (Table 6.4). The unemployment levels for the secondary-education group were only slightly lower. On average, the men were unemployed for 3.1 months before obtaining regular employment. For Nairobi, 30 percent of the sample experienced some unemployment and 8 percent were still uneinployed 2 years after ~l~igrat ion. On average, the in-migrants t o Nairobi were unemployed 3.5 months (Collier 1973, p. 61).
Therefore, the question which needs to be considered is how did these unemployed subsist in the urban areas while they were searching for employinent? In Table 7.7 we present the various sources and amounts of income received by the migrants who were
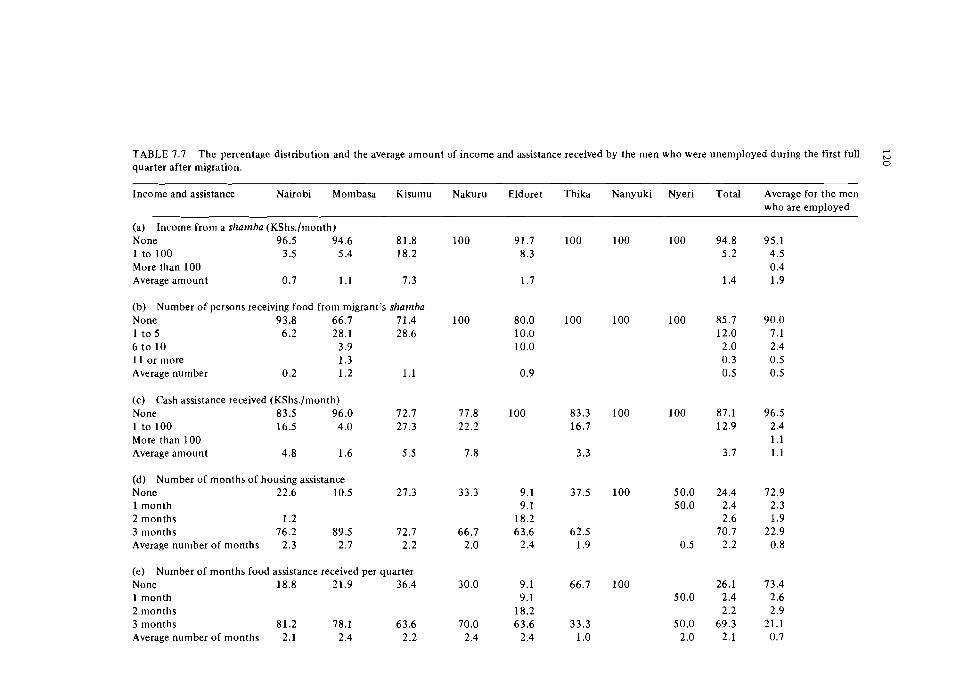
TABLE 7.7 The percentage distribution and the average amount of income and assistance received by the men who were unemployed during the fust full C, quarter after migration. 0
Income and assistance Nairobi Mombasa Kisumu Nakuru Eldoret Thika Nanyuki Nyeri Total Average for the men who are employed
(a) Income from a sl~amba (KShs./month) None 96.5 94.6 81.8 100 91.7 100 100 100 94.8 95.1 1 to 100 3.5 5.4 18.2 8.3 5.2 4.5 More than 100 0.4 Average amount 0.7 1.1 7.3 1.7 1.4 1.9
(b) Number of persons receiving food from migrant's shamba None 93.8 66.7 71.4 100 80.0 100 100 100 85.7 90.0 1 t o 5 6.2 28.1 28.6 10.0 12.0 7.1 6 t o 10 3.9 10.0 2.0 2.4 11 or more 1.3 0.3 0.5 Average number 0.2 1.2 1.1 0.9 0.5 0.5
(c) Cash assistance received (KShs./month) None 83.5 96.0 72.7 77.8 100 83.3 100 100 87.1 96.5 1 t o 100 16.5 4 .O 27.3 22.2 16.7 12.9 2.4 More than 100 1.1 Average amount 4.8 1.6 5.5 7.8 3.3 3.7 1.1
(d) Number of months of housing assistance None 22.6 10.5 27.3 33.3 9.1 37.5 100 50.0 24.4 72.9 1 month 9.1 50.0 2.4 2.3 2 months 1.2 18.2 2.6 1.9 3 months 76.2 89.5 72.7 66.7 63.6 62.5 70.7 22.9 Average number of months 2.3 2.7 2.2 2.0 2.4 1.9 0.5 2.2 0.8
(e) Number of months food assistance received per quarter None 18.8 21.9 36.4 30.0 9.1 66.7 100 26.1 73.4 1 month 9.1 50.0 2.4 2.6 2 months 18.2 2.2 2.9 3 months 81.2 78.1 63.6 70.0 63.6 33.3 50.0 69.3 21.1 Average number of months 2.1 2.4 2.2 2.4 2.4 1 .O 2.0 2.1 0.7
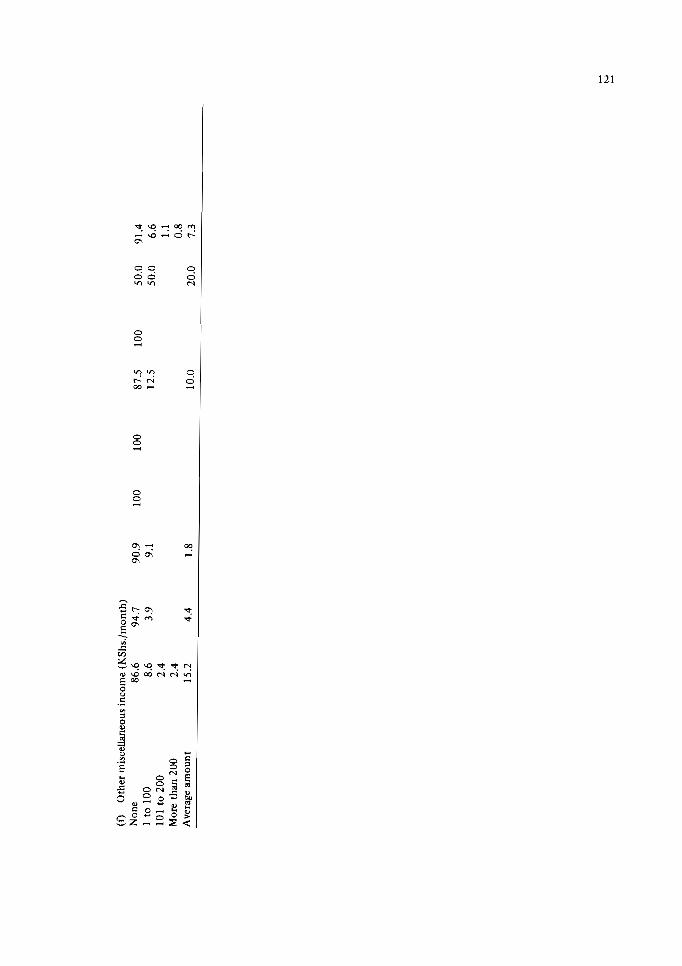
unemployed throughout the first full quarter after migration. T o place these amounts in perspective, we include in the right-hand column the comparable types of income received by men who were employed during the first full quarter after migration.
We observe first that the unemployed receive considerably more housing and food assistance than the employed. Some two-thirds of the unemployed have their basic needs for food and shelter provided for by others. Second, the men average KShs.4 per month of cash income which they receive as gifts from others. Third, 15 percent of the men have a shalnba which is providing food for rural-based household members and which may be providing some food for the migrant as well. Finally, the unemployed migrants average KShs.9 a month of income from either a sharnba or from unspecified sources in the urban areas.
The source of this miscellaneous income is not known. Since some of it may be gained by dlegal means it was decided a t the outset not t o ask for the source. For the limited number with some form of miscellaneous income it is possible that the source was periodic, casual employment. These results are similar t o those obtained by Byerlee et al. (1976, p . 79) for Sierra Leone. They report that very few migrants sought casual work during the initial period of job search because they thought that the chances of obtaining casual day labor were t o o low. In contrast, Hutton (1973, pp. 59-60) reports that 4 8 percent of the unenlployed whom she surveyed in Uganda had found some casual work during the course of their search for regular employment. For Mwanza (Tanzania), Heijnen (1968) cites casual day labor as one means t o "hold out for some time." Bienefeld and Sabot (1972, Vol. 11, Ch. 7 ) state that 8 6 percent of the men whom they interviewed in Tanzania had a source of money other than the assistance rcceived from urban-based kin during the first month of their urban stay. Savings and wage employrnent are listed as the dominant sources.
In our sample considerable variation among urban centers in the income experience of the unemployed is evident, but it is important t o remember that there was little unem- ploynient during tlie first full quarter in Thika, Nanyuki, and Nyeri (see Table 6.4). Llnemploynient was most severe in Eldoret and Nakuru, and we observe that assistance is above average in these towns. Even in Nairobi and Mombasa, inore than three-fourths of the unemployed were receiving housing assistance from urban-based kin.
T o determinc whether the observed assistance received by the unemployed continued over time, we examined the income and assistancc received by men who were unemployed duririg the fourth quarter after migration. During the course of this first year after niigra- tion the housing assistance dwindled t o virtually zero, but the majority (72 percent) were still receiving food. Cash assistance received, miscellaneous income, and income from a shalnba remained virtually unchanged. What is striking is that both the proportion of unemployed with a food-producing shan~ba and the average number of persons receiving food from the shanzba increased slightly. Hutton's finding for Uganda may apply here as well (1973, pp. 7 5 7 6 ) . Even though the amount of income derived from the shalnbas by the unemployed was insignificant, the shamba represented some form of security and was providing maintenance for family members. These factors served t o make further job search possible.
If it is valid t o assume that tlie men with food-producing sharnbas received some of this food themselves, then, by colribining the food obtained from ashalr~ba with food assis- tance reccived from kin in town, it is possible t o conclude that the majority of the unem- ployed received sufficient food t o subsist. But, they must make a t least token payment
for housing and living costs other than food, and they must pay for the job search. Such costs must be covered by savings or miscellaneous income obtained while unemployed.
The bare sustenance costs during job search for Nairobi have been estimated at KShs.110 per month (Collier and Rempel 1977, p. 208). Of this total cost, 55 percent was for food, 32 percent for housing, and 13 percent for job search. The cost of housing and the job search, KShs.49 a month, exceeds by a substantial amount the average income earned and received by the unemployed. Therefore, i t is to be expected that a number have some savings that they were drawing from and some may have had miscellaneous income from questionable sources which they were not prepared to list for the interviewer.
The Urban Informal Sector as a Point of Entry to Formal Sector Employment
One possible option open to the migrant is to finance the time involved in job search with income earned in the urban informal sector. A postulated function of the urban infor- mal sector is that it serves as a point of entry for rural migrants into the urban labor mar- ket. This position is taken especially in migration models based on the Todaro expected income hypothesis (Fields 1975, pp. 171 - 176; Mazumdar 1977,pp. 18-22;Sabot 1975b, pp. 17--19). The hypothesis arises logically from the assumption that each urban formal sector job created in an urban center induces more than one rural resident to move to that urban center.
The hypothesis that the urban informal sector is the place where recent arrivals queue for the formal sector jobs is the direct result of the assumptions made about the job search in these migration models. First, the rural resident must be present in the urban center to be available for the urban jobs when they open up (Mazumdar 1977, p. 18; Sabot 1975b, p. 18). (For Fields's model (1975, p. 169) rural residence means a lower probability of obtaining an urban job (than urban residence) but not a zero probability.) Second, entry to informal sector activity is assumed to be unrestricted (Fields 1975, p. 172; Mazumdar 1977, p. 18; Sabot 1975b, p. 19). Tlurd, participation in informal sector activity need not interfere significantly with fonnal sector job search (Fields 1975, p. 173 ;Mazum- dar 1977, p. 18; Sabot 1975b, pp. 21-22). On the basis of these assumptions, the urban informal sector serves as the means for survival while the migrant waits in the queue for a formal sector job. Given the expected payoff from formal sector employment, the infor- mal sector adapts to take up any slack in the labor maket and, as a result, can be character- ized as the "flexible income sector" (Sabot 1975b, p. 14). Average income in this sector can theoretically reach an equilibrium level below current income possibilities in the rural areas (Fields 1975, p. 176; Mazumdar 1975, p. 54; Mazumdar 1977, p. 3 1).
The evidence with reference to this point-ofentry hypothesis is somewhat mixed. On the one hand, Sethuraman (1976, p. 7 9 , on the basis of ILO-sponsored studies in Abidjan, Sao Paulo, and Jakarta, states: " . . . a disproportionately large share of the addi- tions to the urban labour force, resulting especially from rural--urban migration, tends to be absorbed in such small enterprises." Similarly, for San Salvador, Peek and Antolinez (1 976: p. 13) found that migrants had a "1 2 per cent lower probability of working in the formal sector than the remaining urban population."
On the other side there is the conclusion of Yap (1977, p. 255): "The informal sec- tor is an important source of enlployment for migrants. However, there is little evidence
to suggest that migrants are disproportionately concentrated in that sector." She cites studies for India, Brazil, and Peru. Mazumdar ( 1 9 7 5 , ~ . 59) takes an even stronger position: "There is no evidence to suggest that the informal sector plays a predominant role as a point of entry into the labor market for fresh migrants to the urban area." Another study that does not provide empirical support for the point-ofentry hypothesis is the Tanzania survey (Sabot 1975b, p. 9). One study for Costa Rica (Carvajal and Geithman 1974,p. 11 1) actually found a disproportionate number of recent migrants in "high statuslhigher-paying professional and managerial employment ."
An intermediate position on the point-ofentry hypothesis was obtained for Brazil, Peru, and the Sudan. Yap (1976, pp. 239-240) found that 60 percent of urban in-migrants in Brazil were in the traditional sector while only 50 percent of less-recent migrants and nonmigrants were in the traditional sector. Webb (1975, p. 36) found that the proportion of migrants in the labor force and the average length of urban residence of migrants were similar for both the modern and the urban traditional sector in Peru. But, if the compari- son is limited to migrants with 3 years or less of urban residence, then the proportion of migrants is higher in the urban traditional sector than in the modern sector. For Khartoum, Oberai (1975, p. 17) indicates that recent migrants were slightly more evident in services but, in general, the distribution of labor within an industry was not dependent on migra- tion status.
The evidence on the point-ofentry hypothesis is not conclusive because the defini- tions of what constitutes the informal sector are too diverse and the various studies cited did not limit their analysis to recent migrants. What these migration studies do have in common is that they do not portray the migrant as being forced into some form of subsis- tence selfemployment because of an inability to obtain regular wage employment.
Further, several studies obtained similar results to those reported above for Kenya: urban-based kin represent the dominant means of entry to the urban labor market. For example, Fields (1975, p. 172), on the basis of East African experience, concurs that friends and relatives already resident in town serve as the actual point of entry. Hutton (1973, p. 56) reports that most of the men in her Ugandan sample were able to draw on assistance from urban-based kin during their initial period of unemployment. Sabot (1975b, p. 8), on the basis of the survey in Tanzania, adds personal savings as another means of financing entry into formal sector employment.
As was the case for our sample, some migrants are able to move directly into formal sector jobs. Many of the others are able to engage in virtually full-time job search for at least several months by drawing on their own resources and assistance provided by kin. Some, especially after failing to obtain regular employment during the first few months, are channeled into the informal sector, initially with their hosts (Hutton 1973, p. 56) and eventually on a more commercial basis. This process is documented in detail by Gutkind (1967) on the basis of a relatively small sample drawn in both Lagos and Nairobi. Gugler (1976, p. 195) arrives at a similar conclusion for African cities in general: "If they have not been able to secure employment they are forced to look for casual work, to accept employment well below the legal minimum wage or engage in petty selfemployment."
The inference that can be drawn from this evidence is that being a migrant per se does not restrict accessibility to urban informal sector activity. Further, the many rural residents who seek urban employment rely on relatives or friends for their entry into the urban scene or, possibly, they subsist temporarily on savings. If these means fail to provide
regular employment, then the migrant either returns home or moves into the urban infor- mal sector (Heijnen 1968, p. 77). Whether one returns home is dependent primarily on what rural options exist (Hutton 1973, pp. 62-63). The remaining migrants, those rele- gated to the urban informal sector, have limited rural prospects and have been screened out in the formal sector hiring process. They "include the young and the old, females, the less skilled, and the less educated - as well as recent migrants" (Merrick 1976, p. 351). For his Belo Morizonte (Brazil) sample, Merrick found that when he controlled migrant- native differences for other factors, migrant status was not an important determinant of whether an individual was active in the informal sector.
For some of those relegated to the informal sector, activity there becomes an imme- diate means of survival with little or no prospect for eventual formal sector employment: Temple (1974, p. 97) estimates this to be the case for some 100,000 residents of the slum areas of Jakarta. For others, informal sector activity represents a "prospect of accumula- tion" even though regular wage employment is not available (Hart 1973, p. 88). For many the hope remains alive that some day they will get their "big break" in the urban employment lottery (Hart 1973, p. 67).
One agglomeration of people employed in the informal sector in Kenya is the squatter settlements in Mathare Valley, Nairobi. A survey of 20,000 residents found that there were 6,400 adult males of whom 20 percent were wageemployed (probably outside of the val- ley), 63 percent were selfemployed, and 17 percent were unemployed (Steele 1974, p. 30). According to Ross (1973, p. 89), residents of Mathare Valley were: "urban misfits and rural outcasts in the sense that the individuals lack the skills and activities needed to par- ticipate in the modem economy of Nairobi, while at the same time they have no meaning- ful rural alternative to life in the city." In many cases these residents were performing the services that no one else was willing or able to carry out. The range of activities included beer-brewing, prostitution, renting rooms, operating small shops, hawking, small-scale agri- culture, selling water, workmg in local community or social organizations, and petty theft (Ross 1973, p. 135). Most seemed to have little prospect of ever obtaining formal sector jobs.
But it would be in error to view such communities of the poor as the informal sec- tor; they are merely one subset of a much larger, diverse urban informal sector (Steele 1975, pp. 30-31; Rempel and House 1978, pp. 167--173). Also, while the composition of such communities is predominantly rural-urban migrants, most are not recent in- migrants. For one settlement in Mathare Valley, Ross (1973, Table 8.1, pp. 158--159) reports that the average length of stay in Nairobi was 11 years. Approximately 75 percent had lived in Nairobi for a minimum of 5 years; many had moved to Mathare Valley after a period of residence elsewhere in the city. As Yap (1976, p. 228) indicates, where complete assimilation never occurs, a significant number of migrants who have been resident in town for an extended period will be evident in the urban informal sector.
SUMMARY
Urban-based kin, defined to include friends and relatives who have come previously from the rural home area, make a significant contribution to the rural-urban migration process. They represent a source of information about urban areas, they provide food and

shelter for the majority of the in-migrants when they first arrive,and, for some in-migrants, they are able to assist in finding employment. The importance of these urban-based kin is especially evident for the younger men and for the Inen with limited education. Also, such kin serve a vital function of providing basic necessities for the majority of Inen who remain unemployed for a number of niontlis. These findings are consistent with the regression results reported in Chapter 4; the urban-based kin are an important determinant of both the likelihood of a rural-to-urban move and the selection of a destination.
8 THE IMPORTANCE OF AMENITIES
In a con~plete specification of the determinants of rural urban migratory behavior it is necessary to include both the motives for leaving an area and the motives for moving to some other area (MacDonald and MacDonald 1968, p. 41 7). The pull forces may be seen as a means of eliminating the dissatisfaction represented by the rural push factors. The pull factors may be relative only. A person may not be dissatisfied with his rural life until the pull of additional attractions elsewhere lead him to be dissatisfied. In addition, if the migrant has a destination in mind, pull factors were probably important determinants in his choice. Hanna and Hanna (1971, p. 32) suggest that some African migrantsselect paths of movements rather than specific destinations, and stop off wherever acceptable work and living conditions can be found.
This interaction between rural push and urban pull forces is relevant especially for factors that relate to satisfaction of wants (rather than attainment of the necessities of life). Most amenities would fall in this satisfaction-of-wants category. As a result, differ- ences between the quality of life in rural areas and urban centers must be considered in a discussion of the determinants of migration. Quality of life encompasses a wide range of amenities, from housing and social services or the opportunity to be involved in economic advancement to entertainment, sometunes labeled "bright lights."
There are two opposing positions on the role of "bright lights" in the migration pro- cess. According to the editorial writer quoted at length at thc beginning of the first chap- ter, "bright lights" are an "irresistible lure" to the "ambitious young" in the rural areas. Another expression of the magnetic pull of "briglit lights," especially for young people, is evident in a mapping of the "residential desirability surface" for university students in Ghana.
To a large extent the structure of spatial preferences resembles the sur- face of modernization, with peaks at the highest order urban nodes, ridges con- necting these via rail and road, and pits in rural areas. In Tanzania and Nigeria, the 'bright light' effect of the emerging system of cities is strongly impressed in the minds of the people. In Ghana, also, the remoteness of the Northern and Volta regions is measured by the low preference scores (Could 1972, p. iv).
The opposing position does not deny the favorable evaluation by rural people of the "brigllt lights" of the city, but discounts it as an important determinant of inigration relative to econoiilic factors. According to this position, at least in Subsaharan Africa, the role of amenities in migration can, at best, be relegated to what Gulliver has ternled the "last straw" effect (Gulliver 1955, pp. 28--32). In his summary he rejects his own "bright lights theory" as a prime motive for migration and places primary emphasis on economic factors. Factors other than economic ones serve to affect the timing of the migration, but
are considered unimportant in the selection of a destination. Empirical support for Gulli- ver's position is provided in Caldwell's Ghana study (1969, pp. 88-89).
In this chapter we draw on the available evidence from Kenya t o consider the ques- tion of the effect of amenity availability on rural-urban migration. First, a measure of differences between rural areas and urban centers in access to a range of amenities is pro- vided. Then, changes in the use patterns of several amenities before and after migration are considered. The section on amenity use patterns is quite limited in scope since the questions asked in the survey only covered "bright lights."
A MEASURE OF ACCESS TO AMENITIES
The government of Kenya has an explicit commitment to upgrade the quality of life and the range of economic opportunities in rural areas (Development Plan: 1970- 1974 (1969), p. 2). In preparation for the realization of this objective, the Town Planning Department of the Ministry of Lands and Settlements (1971) has compiled an inventory of existing facilities for each province in Kenya. Included in this inventory is an index of availability across 21 different types of facilities and services in towns and villages in each district that have accumulated some facilities or social services. Each index is based on a range from 0 to 3 ; a 3 indicates the highest level of availability and a 0 indicates that the amenity is not available. Here are some examples of the values for several indices: educa- tion - the existence of a primary school rates a 2 while a secondary school rates a 3;retail selling - wholesale and retail stores rate a 3 , more than five shops rates a 2 and less than five shops rates a I ;industry -- more than 500 employees rates a 3 , 1 0 0 to 500 employees rates a 2 while less than 100 employees rates I . The point level for each type of facility or service is provided in Appendix V of the Central Province Regional Physical Development Plan (Ministry of Lands and Settlements 197 lc).
In addition, the plans rank the towns and villages into four groups depending on the size of the hinterland that each serves. There is some indication that the minimum size of population served is: urban center - 150,000; rural center - 50,000; market center --
15,000; and local center - 5,000. This information is provided in the Rift Valley Province Regional Physical Development Phn, pp. 73-75 (Ministry of Lands and Settlements 1971~) . These values were used to calculate a district weighted average across all relevant towns and villages in the district for each of the 21 amenities (Table 8.1).
The urban centers under study as migration destinations are placed just below the district in which they are included. Mombasa is a district in Coast Province. Nairobi is not included in the regional physical development plans, but it can be assumed that a level of 3 would apply for all 2 1 amenities. The provincial index reported in Table 8.1 is a weighted average across districts in which the 1969 census population figure for each district is the weight.
There are definite limits to what can be derived from Table 8.1. First, it is an index only, not a continuous measure of access to amenities. Second, the rural index is based on villages and towns in the district and overstates the actual availability to the rural popula- tion. This is true for both amenities such as water, sanitation, and electricity, which serve an immediate community only, and for the remote districts which have one well-serviced
town but very few other villages with any amenities of significance. Examples of the latter are Turkana, West Pokot, Narok, Samburu, Isiolo, Marsabit, Tana River, and Lamu. Third, not all measures of quahty of life are included. Housing is an important omission. Fourth, some districts are understated because they benefit from their closeness t o towns in a neigh- boring district. Some obvious examples are Kiambu (bordering on Nairobi), Muranga (close to Thika), Kirinyaga (next to Embu town), and Nyeri district (bordering on Nanyuki).
In addition, the availability of amenities in the urban centers does not necessarily mean that the incoming migrants can afford t o enjoy these amenities. Surveys in Ghana and Sierra Leone report that the dominant unpleasant aspect of town life, according to the in-migrants, is the need t o pay for everything and the limited personal resources avail- able for such payment (Caldwell 1969, p. 96; Byerlee et al. 1976, p. 60). The city of Nai- robi has electricity but the servants' quarters in some areas are not serviced. In other areas electricity is available but turned off because the people cannot afford to pay for it.
Recognizing these limitations of our measures of amenity availability, we still observe a distinct difference in the indices between urban centers under consideration and the dis- tricts. With the exception that there is no railway to Nyeri town, the urban center indices are consistently above the averages of their provinces. The difference between town and country is less pronounced for services for personal improvement such as education, health care, and shopping facilities. Such emphasis on facilities that enable personal improvement is commendable, but when emphasized independently of other dimensions essential for overall rural development, extensive out-migration of the bettereducated young people is likely. This is recognized by Mr. Kibaki, the minister for finance and planning, in his listing as a problem the inability to hold educated young people in their rural home areas.*
The largest differences between the rural and urban areas are in the social overhead capital categories: electricity, communications, transportation, and banking facilities. These can be seen as a "life support system" that is vital to the environment within which rural development can occur. Their limited availability in most rural areas probably explains the concentration of industry in the major towns. Other aspects of rural development, such as rural works programs, some technical services, training of youth for rural occupations, and the organization and control of rural trade and markets are the responsibility of local government. The acute shortage of funds available to county and area councils is reported to have severely constrained action in these areas (Heyer et al. 1971, p. 12).
In summary, rural people have relatively good access to amenities that enhance per- sonal welfare. But they must for now look to the larger urban centers both t o obtain some of the essential means for development as well as t o participate directly in the benefits from economic growth evident in Kenya. Obtaining formal education is a recognized means of gaining entry t o what the towns have to offer. The high education indices in districts such as Kakamega, Kiambu, and Muranga districts are consistent with observations in several recent studies which report that parents in districts with land shortages are investing heavily in education for their children as a substitute for providing land for them (Moock 1973; Gwyer 1972, pp. 14-1 5).
*According to a newspaper account, this concern was listed by Mr. Kawi Kibaki in a speech given at the opening o f the African regional conference o f the Commonwealth Association of Planners, "Africa unable t o cope with 'urban drift' " (East African Standard, February 1 3 , 1974, p. 5 ) .
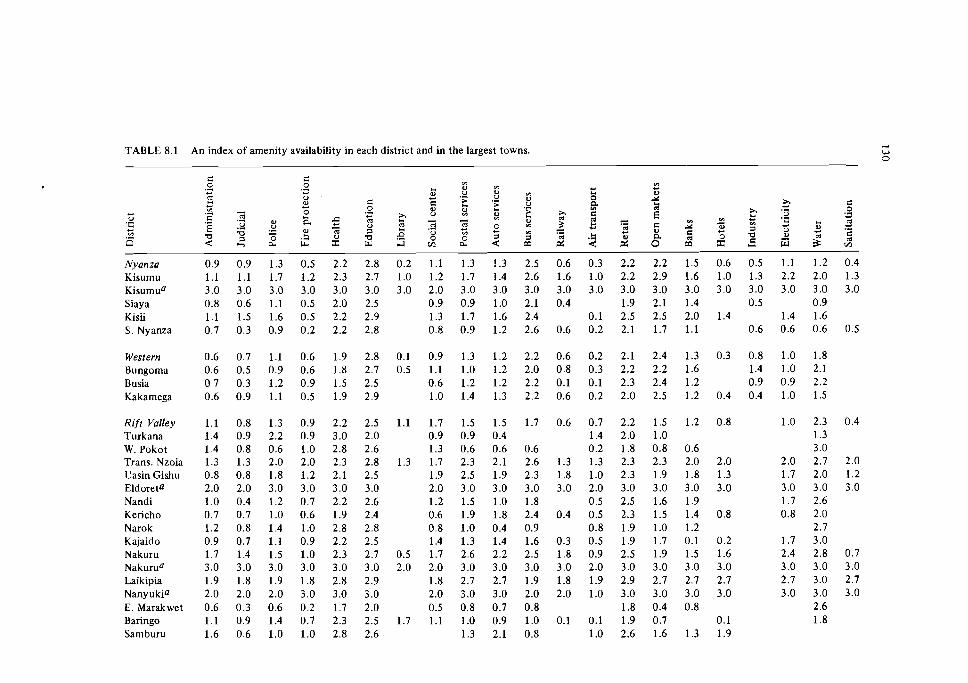
TABLE 8.1 An index of amenity availability in each district and in the largest towns.
Nyanza Kisumu Kisumua Siaya Kisii S. Nyanza
Western Bungoma Busia Kakamega
Rift Valley Turkana W. Pokot Trans. Nzoia Uasin Gishu Eldoreta Nandi Kericho Narok Kajaido Nakuru Nakurua Laikipia Nanyukia E. Marakwet Baringo
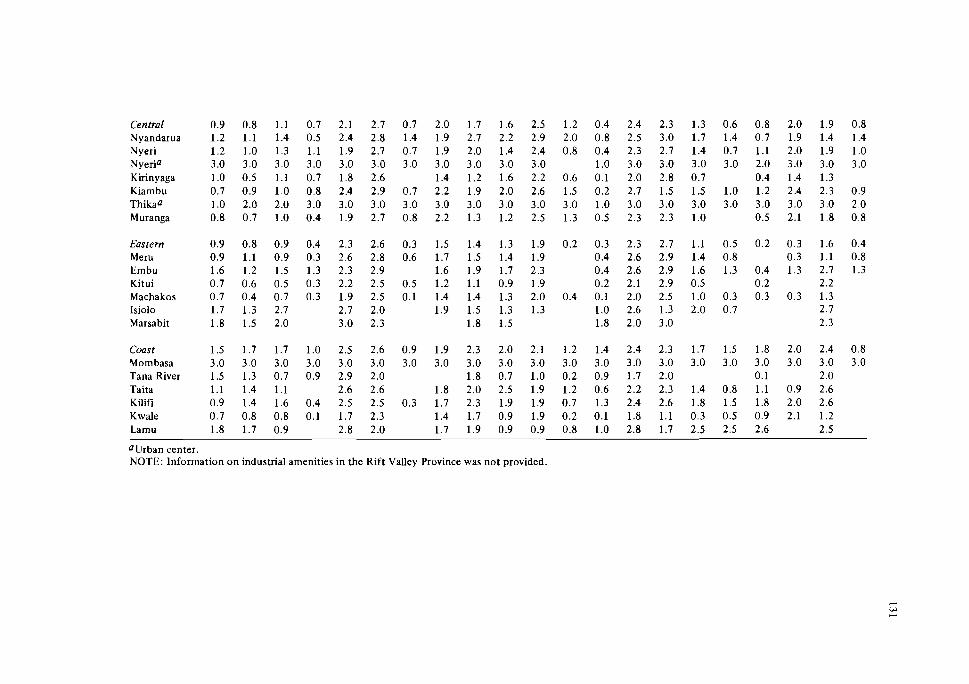
Central Nyandarua Nyeri Nyeria Kirinyaga Kiarnbu Thikaa Muranga
Eastern 0.9 0.8 0.9 0.4 2.3 2.6 0.3 1.5 1.4 1.3 1.9 0.2 0.3 2.3 2.7 1.1 0.5 0.2 0.3 1.6 0.4 Meru 0.9 1.1 0.9 0.3 2.6 2.8 0.6 1.7 1.5 1.4 1.9 0.4 2.6 2.9 1.4 0.8 0.3 1.1 0.8 Ernbu 1.6 1.2 1.5 1.3 2.3 2.9 1.6 1.9 1.7 2.3 0.4 2.6 2.9 1.6 1.3 0.4 1.3 2.7 1.3 Kitui 0.7 0.6 0.5 0.3 2.2 2.5 0.5 1.2 1.1 0.9 1.9 0.2 2.1 2.9 0.5 0.2 2.2 Machakos 0.7 0.4 0.7 0.3 1.9 2.5 0.1 1.4 1.4 1.3 2.0 0.4 0.1 2.0 2.5 1.0 0.3 0.3 0.3 1.3 Isiolo 1.7 1.3 2.7 2.7 2.0 1.9 1.5 1.3 1.3 1.0 2.6 1.3 2.0 0.7 2.7 Marsabit 1.8 1.5 2.0 3.0 2.3 1.8 1.5 1.8 2.0 3.0 2.3
Coast 1.5 1.7 1.7 1.0 2.5 2.6 0.9 1.9 2.3 2.0 2.1 1.2 1.4 2.4 2.3 1.7 1.5 1.8 2.0 2.4 0.8 Mombasa 3.0 3.0 3.0 3.0 3.0 3.0 3.0 3.0 3.0 3.0 3.0 3.0 3.0 3.0 3.0 3.0 3.0 3.0 3.0 3.0 3.0 TanaRiver 1.5 1.3 0.7 0.9 2.9 2.0 1.8 0.7 1.0 0.2 0.9 1.7 2.0 0.1 2.0 Taita 1.1 1.4 1.1 2.6 2.6 1.8 2.0 2.5 1.9 1.2 0.6 2.2 2.3 1.4 0.8 1.1 0.9 2.6 Kilif~ 0.9 1.4 1.6 0.4 2.5 2.5 0.3 1.7 2.3 1.9 1.9 0.7 1.3 2.4 2.6 1.8 1.5 1.8 2.0 2.6 Kwale 0.7 0.8 0.8 0.1 1.7 2.3 1.4 1.7 0.9 1.9 0.2 0.1 1.8 1.1 0.3 0.5 0.9 2.1 1.2 Larnu 1.8 1.7 0.9 2.8 2.0 1.7 1.9 0.9 0.9 0.8 1.0 2.8 1.7 2.5 2.5 2.6 2.5
Ourban center. NOTE: Information on industrial amenities in the Kift Valley Province was not provided.
USE OF AMENITIES REPORTED IN THE MIGRATION SURVEY
Changes in Amenity Use Patterns after Migration
As a check on the assessment made by the men of the role of amenity availability in their migratory behavior, changes in their use of amenities were investigated. Three "bright lights" type of amenities - cinemas, dancing places, and newspapers - were selected for analysis. In each case the men were asked t o compare their current use of these amenities with that prior t o migration (Questions 43 to 45). Where amenity use had increased with migration the men were asked why their use of amenities had increased.
An indication of why the men placed so little emphasis on amenity availability as a determinant of migration can be seen in Table 8.2. Fifty-nine percent of the men did not attend cinemas. In addition, 3 percent of the men had not changed their attendance habits after migration and 10 percent were attending less often than they did prior t o migration. As a result, variations between urban centers in the increased availability of cinemas could have a determinative effect on the migration decisions of only 28 percent of the men. Twenty percent of the men indicated that they were attending more often because there are more cinemas in the urban centers.
The role of dancing places in the urban areas is similar to that of cinemas(Tab1e 8.3). Only 14 percent of the men increased their attendance after migration. The vast majority, 72 percent, did not frequent dancing places. Approximately one-half of the men who did attend more frequently identified the better quality of urban dancing places as the reason why they attended more often. The increased number of dancing places in town was not mentioned as a reason for frequenting dancing places more often.
The reading of newspapers appears to be the one amenity for which there was a considerable increase in use after migration: 59 percent of the men increased their reading of newspapers (Table 8.4). The greater availability of newspapers in the urban centers was the most important reason for this increase. Both the availability of more money and the need for reading newspapers for information on jobs were listed as reasons for increased use of newspapers, especially for the men with secondary education.
For all three amenities the interaction between amenity use, the urban centers, and education and age variables is statistically significant (Rempel 1970, pp. 105-107). As expected, i t is the younger men and the men with secondary education who have a pro- portionately greater propensity to increase their use of amenities after they had migrated to an urban center. Among urban centers no distinct pattern is evident. Social amenities registered as a basis for selecting a particular destination for Nairobi and Mombasa only (as reported in Table 4.6). Yet in Tables 8.2 t o 8.4, amenity use after migration is not dis- tinctly higher for Nairobi and Mombasa than for either the three western towns or the three central towns.
The comments included on some of the questionnaires indicate that the availability of specialized training courses in some urban centers, especially Nairobi, was the basis for deciding on a destination. As indicated in Table 8.5,28 percent of the men had completed or were in the process of taking a specialized training course. Also, the proportion enrolled in such courses is somewhat above average for Nairobi. Again, it is the younger men and the men with secondary education who predominate in enrollment in specialized training courses.
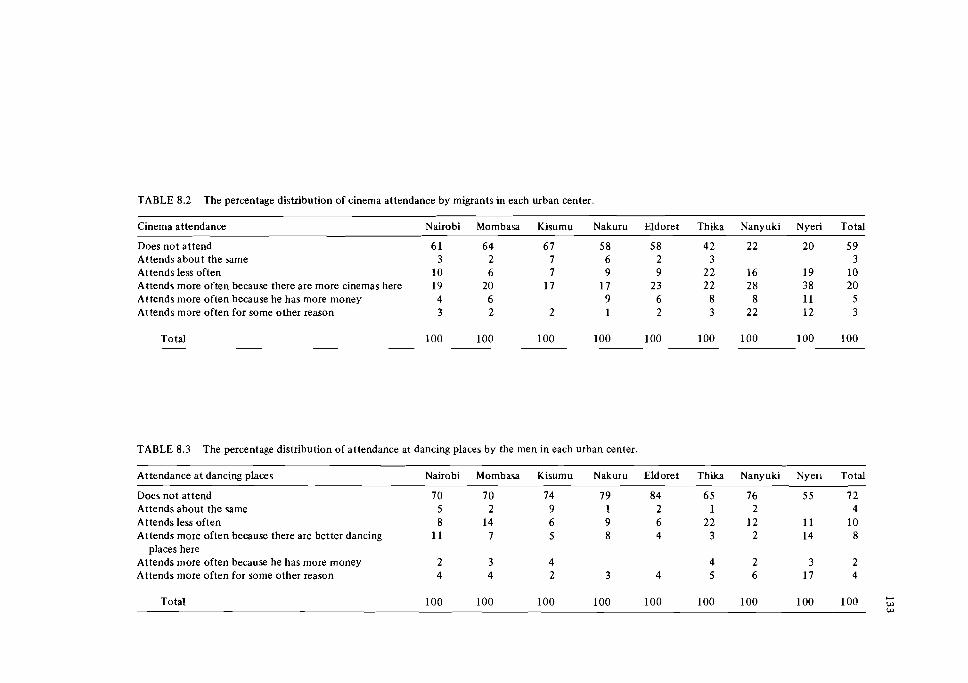
TABLE 8.2 The percentage distribution of cinema attendance by migrants in each urban center.
Cinema attendance Nairobi Mombasa Kisumu Nakuru Eldoret Thika Nanyuki Nyeri Total
Does not attend 6 1 64 6 7 58 5 8 4 2 22 20 59 Attends about the same 3 2 7 6 2 3 3 Attends less often 10 6 7 9 9 2 2 16 19 10 Attends more often because there are more cinemas here 19 20 17 17 23 22 2 8 3 8 20 Attends more often because he has more money 4 6 9 6 8 8 11 5 Attends more often for some other reason 3 2 2 1 2 3 2 2 12 3
Total 100 100 100 100 100 100 100 100 100
TABLE 8.3 The percentage distribution of attendance at dancing places by the men in each urban center.
Attendance at dancing places Nairobi Mombasa Kisumu Nakuru Eldoret Thika Nanyuki Nyeri Total
Does not attend 7 0 7 0 74 7 9 84 6 5 76 55 72 Attends about the same 5 2 9 1 2 1 2 4 Attends less often 8 14 6 9 6 22 12 11 10 Attends more often because there are better dancing 11 7 5 8 4 3 2 14 8
places here Attends more often because he has more money 2 3 4 4 2 3 2 Attends more often for some other reason 4 4 2 3 4 5 6 17 4
Total 100 100 100 100 100 100 100 100 100
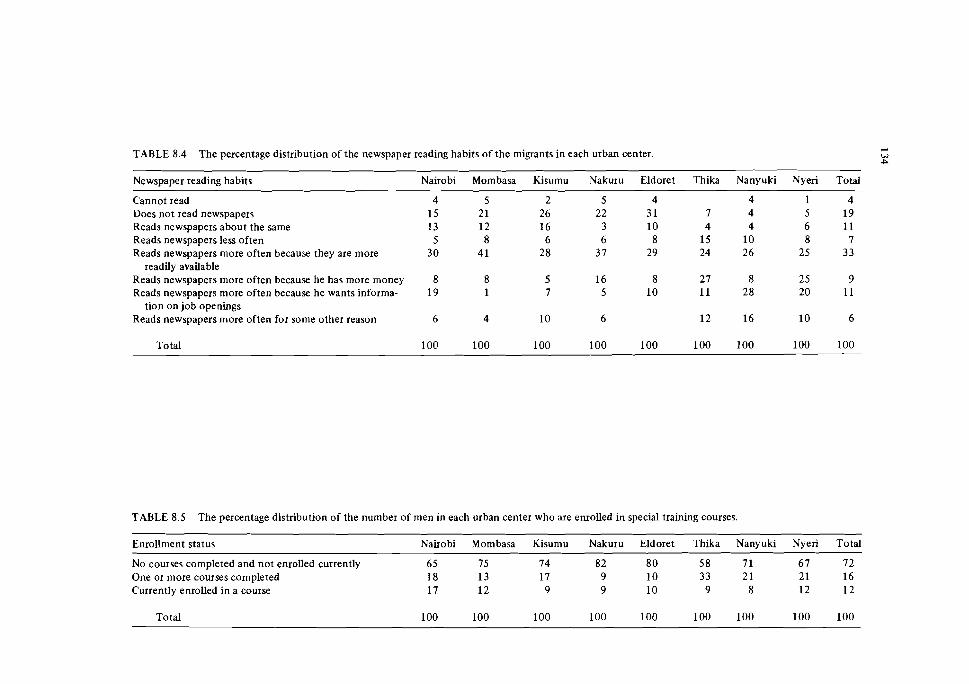
TABLE 8.4 The percentage distribution of the newspaper reading habits of the migrants in each urban center.
Newspaper reading habits Nairobi Mombasa Kisumu Nakuru Eldoret Thika Nanyuki
Cannot read 4 5 2 5 4 4 Does not read newspapers 15 21 26 22 3 1 7 4 Reads newspapers about the same 13 12 16 3 10 4 4 Reads newspapers less often 5 8 6 6 8 15 10 Reads newspapers more often because they are more 3 0 41 28 37 29 24 2 6
readily available Reads newspapers more often because he has more money 8 8 5 16 8 27 8 Reads newspapers more often because he wants informa- 19 1 7 5 10 11 2 8
tion on job openings Reads newspapers more often for some other reason 6 4 10 6 12 16
Nyeri
Total 100 100 100 100 100 100 100 100
- Total -
4 19 11 7
33
TABLE 8.5 The percentage distribution of the number of men in each urban center who are enrolled in special training courses.
Enrollment status Nairobi Mombasa Kisumu Nakuru Eldoret Thika Nanyuki Nyeri Total --- - -
No courses completed and not enrolled currently 65 75 74 82 8 0 58 7 1 6 7 7 2 One or more courses completed 18 13 17 9 10 33 2 1 2 1 16 Currently enrolled in a course 17 12 9 9 10 9 8 12 12
Total 100 100 100 100 100 100 100 100 100
Amenity Availability as a Reason for Migration
The evidence points to greater amenity availability in the urban areas and t o some differences in amenity availability between urban centers. But, thc survey results provide support for the portion of the literature that considers the "bright lights" a relatively unimportant determinant of migration. Evidence t o this effect is consistent: amenities d o not rank as a significant reason for migration (as reported in Tables 4.5 and 4.6), and only a minority of the migrants increased their use of the amenities covered in the questionnaire.
As indicated earlier, the evidence presented here is not conclusive because a number of amenities, such as health care, housing, piped water,and electricity, were not included in the questionnaire. Evidence exists that rural residents consider these amenities t o be more important than "bright lights." A rural survey in Kenya indicated that farmers rated improved health services as a priority item for self-help projects (Heyer et al. 1971, p . 36). Education and improved roads were rated important as well, but agricultural projects were not in demand. Similarly, in our survey, opportunities for advancing one's education and skills were rated more important than the social amenities. In Sierra Leone: "Both migrants and noninigrants attached considerable importance t o social amenities such as school, medical facilities, and utilities (electricity and piped water) in town" (Byerlee et al. 1976, p. 60). The better quality of the schools located in the urban centers was also noted by the respondents.
These amenities are part of the amenity index (Aii and Ai) used in the regression analysis, as reported in Chapter 4 , and no doubt form part of the explanation for the signifi- cant positive coefficient for A i i But for males, A, was found not t o be a significant deter- minant of the selection of a migration destination. The low priority given by our survey respondents t o amenities as a reason for leaving their home area or for selecting a destina- tion provides support for our earlier interpretation of the coefficient for Aii: variations in the range and variety of employment opportunities in the urbancenters form an important part of what Aii is measuring.
In conclusion then, amenities per se enter into the migration decision-making but are no t a central motive for making a move. Hutton (1973, p . 106), on the basis of her survey, concluded:
The introduction of urban amenities as such into the rural areas will not be effective in retaining people at home if the village cannot give them the standard of living which they require. Similarly, if land is not available o r can- not offer a better living, the school cannot hope t o inculcate the attitudes o r skills that will of themselves change the order of things.
On the basis of the evidence presented in Chapter 4 and here, we consider this con- clusion for Uganda applicable t o Kenya as well.

9 MAINTENANCE OF RURAL-URBAN TIES
For the typical migrant a rural-to-urban move does not represent a complete break with the rural area. The literature indicates that various social, economic, and psychological ties with the rural area are maintained. Here we explore the range of such ties, their deter- minants, and their effects. Where possible, survey data will be used to illustrate and test these ideas. Specifically, the evidence on monetary flows between the rural and the urban sectors, the rural stake maintained by the migrants in the form of land ownership and immediate family members who remained behind, the migrant's intention to return to the rural area, and the migrant's preference for urban or rural employment will be analyzed.
THE NATURE OF RURAL-URBAN TIES
The nature of the links maintained by recent urban in-migrants with their home areas has been specified in various forms. According t o Mitchell (1959), the rural centri- fugal forces that propel individuals elsewhere to satisfy their economic wants are offset at least partially by a social network of centripetal forces that hold a person in the rural orb of influence.
This network provides much needed social contact, in the form of visits and possibly letters, which frequently is difficult for a migrant to establish within an urban environ- ment. Further, the social network can protect against the failure to obtain or to maintain an adequate source of income in an urban center or a work camp. To maintain such pro- tection requires certain social obligations. At a minimum, these obligations involve return- ing gifts in the form of money or goods. In some societies it can require a periodic return to the rural area to participate in family or community work. Village ceremonies or festive occasions frequently prove to be opportune times to meet the pecuniary requirements of the social obligations.
Plotnicov (1965, p. 22) enumerates these social obligations also, but he adds a psy- chological dimension.
"Home is elsewhere." This legend reconciles the immigrant to the lone- liness and to the absence of family in the faceless city. Also, if he achieves little success, he has a ready psychological compensation and retreat: he belongs and he has value in a better place - back home.
For Nairobi, Ross (1973, p. 84) argues that the city is not considered "a desirable place to celebrate major thresholds in the social life cycle - birth, initiation, marriage, and death." He provides supporting evidence for this argument in the cases of marriage and death.
A rather different approach to understanding the nature of rural urban links is taken by Stark (1 976, p. 12). His focus is on the rural household as a collective unit rather than on the individual migrant. The household perceives development of its land holdings as the means to its economic advance. To accomplish such agricultural development one or more sons are educated and dispatched to the urban scene to supplement family income from an alternative source. The wageearning son fulfills several basic functions for the rural family: (1) he provides cash needed for technological change in agriculture; (2) he may be a source of alternative, superior technology; (3) he reduces the risk involved for part of the famdy's total investment because his income is not tied to the unpredictable perfomlance of agriculture.
These two specifications of the nature of the rural -urban ties have a number of ele- ments in common but there are also significant differences. Social contact in the form of periodic visits certainly is common to both, as are financial flows between the rural and the urban sectors. Where they tend to differ is in the extent and the purpose of such finan- cial flows.
The dominance of economic factors in the rural centrifugal forces of the Mitchell thesis implies that the rural areas have limited resources available to transfer to the migrant in the urban center. The extent of the rural involvement in financing the move tends to be limited to the cost of the trip, whatever savings the migrant carries at the time of the move, plus occasional gifts of food. Similarly, for the urban-to-rural financial flows, the Mitchell thesis implies a basic social obligation. The income earned beyond the basic obliga- tion will be at the disposal of the migrant. Also, as urban job security and social ties develop, the need t o fulfill rural urban social obligations will decline. Therefore, it is to be expected that the proportion of urban income remitted will vary inversely with the size of the urban income, the ongoing certainty of the urban income, and the length of the urban stay.
The Stark thesis implies that the migrant and the rural-based family have a common interest. The migrant's urban living costs are an important part of the family's resource allocation decisions. Until the migrant obtains the desired wage income, the rural family will provide a living allowance as part of its investment in the migrant's job search. Once he is employed, it is likely that income earned beyond urban living costs will be remitted to the family. Therefore, as the level of income rises over time, it is to be expected that the proportion of this income that is remitted will increase also.
Both specifications make provision for the maintenance of a rural stake. Where they differ is in the reasons offered for the maintenance of that rural stake. The Stark thesis is premised on the existence of viable commercial opportunities for the household in farming. The obstacles to taking advantage of such opportunities are production supply constraints: lack of capital, limited access to technology, and the excessive risk of investing available resources in commercial agriculture.
Conversely, the Mitchell thesis states that at the time of migration rural income earning opportunities are perceived by the migrant to be distinctly inferior to those of the urban centers. Therefore, the maintenance of rural stakes reflects such factors as: ( I ) keep- ing a rural option open in case of failure in town; (2) the possibility that the cost of sup- porting a family in town exceeds the migrant's urban earning potential; and/or (3) the possibility that the family is too poor to forego the farm income of the wife and children if they moved to the urban center.
The final point relates to the migrant's intention to return to his rural home area. According to Mitchell, the likelihood of return migration will depend on the balance between the centrifugal and the centripetal forces on the migrant. If the centrifugal forces persist and the centripetal forces decline, because satisfying relationships are emerging in the urban setting and the urban income sources appear t o be secure, then the likelihood of return migration for an extended time period will be low throughout the working life of the migrant. Further, according to Plotnicov (1965, p. 21), the extended absence from a reIatively closed rural community reinforces the inertia to remain. The dream t o return eventually will not be fulfilled in many cases.
Stark, in contrast, does not address the issue of return migration directly. His focus is on the rural household and it is not clear what eventually happens to the migrant. (In a discussion of the shape of the remittance function over time (1976, p. 15, footnote 2) he notes that the migrant either returns or is joined by his family and remains. The probability of either and the determinants of such a decision are not discussed.) The hypothesized motivation for the initial move was to facilitate the development of rural resources rather than to enjoy the attractions of the urban environment per se. Therefore, one would expect that the migrant will return once adequate funds to build up rural resources have been transferred home or he decides t o establish his own household. Nevertheless, the urban experience may create a desire for an urban way of life and hence, transform a "target" migrant into a long-term urban resident.
In the subsequent parts of this chapter, the relevant evidence on the maintenance of rural urban ties in Kenya will be presented and analyzed. Where possible, the analysis will be related to the above discussion. In the concluding section, the various aspects of the discussion are drawn together into a more comprehensive picture of the rural-urban ties in Kenya.
RURAL-URBAN MONEY TRANSFERS
An important aspect of the h k s maintained by the migrants is the gifts of money received and sent. The significance of these flows exceeds the effect of the money on the finances of the family and the migrant; the flows are indicative of the social relationships.
We consider first the money received from the rural home area by the migrant. Sec- ond, the money remitted to the rural areas is analyzed. In both cases, the magnitude of the flows is presented and the determinants of the flows are discussed.
The Rural Support for the Migrant
According to the migration survey results, the men received an average of KShs.2 per month from their home areas during the first 3 months of their urban stay .*
By the fourth quarter after migration this level of rural support for the migrants had dropped to 5 1 percent of the first-quarter level. Given our estimate of 267,330 male
*As reported in Table 7.7, 86 percent of the unelnployed and 97 percent of the employed did not receive any cash from their home areas. Therefore, the s r ~ ~ a l l minority who were supported received an average of KShs.30 a month.
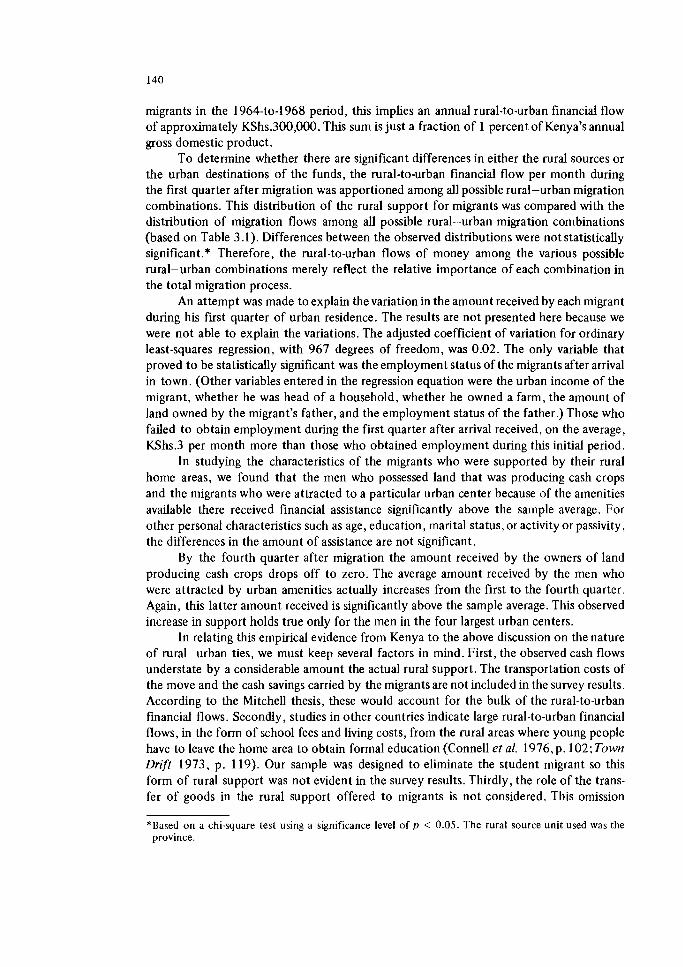
migrants in the 1964-to-1968 period, this implies an annual rural-to-urban financial flow of approximately KShs.300,000. This sum is just a fraction of 1 percent of Kenya's annual gross domestic product.
To determine whether there are significant differences in either the rural sources or the urban destinations of the funds, the rural-to-urban financial flow per month during the first quarter after migration was apportioned among all possible rural-urban migration combinations. This distribution of the rural support for migrants was compared with the distribution of migration flows among all possible rural-urban migration combinations (based on Table 3.1). Differences between the observed distributions were not statistically significant.* Therefore, the rural-to-urban flows of money among the various possible rural-urban combinations merely reflect the relative importance of each combination in the total migration process.
An attempt was made to explain the variation in the amount received by each migrant during his fust quarter of urban residence. The results are not presented here because we were not able to explain the variations. The adjusted coefficient of variation for ordinary least-squares regression, with 967 degrees of freedom, was 0.02. The only variable that proved to be statistically significant was the employment status of the migrants after arrival in town. (Other variables entered in the regression equation were the urban income of the migrant, whether he was head of a household, whether he owned a farm, the amount of land owned by the migrant's father, and the employment status of the father.) Those who failed to obtain employment during the fust quarter after arrival received, on the average, KShs.3 per month more than those who obtained employment during this initial period.
In studying the characteristics of the migrants who were supported by their rural home areas, we found that the men who possessed land that was producing cash crops and the migrants who were attracted to a particular urban center because of the amenities avdable there received financial assistance significantly above the sample average. For other personal characteristics such as age, education, marital status, or activity or passivity, the differences in the amount of assistance are not significant.
By the fourth quarter after migration the amount received by the owners of land producing cash crops drops off to zero. The average amount received by the men who were attracted by urban amenities actually increases from the first to the fourth quarter. Again, this latter amount received is significantly above the sample average. This observed increase in support holds true only for the men in the four largest urban centers.
In relating this empirical evidence from Kenya to the above discussion on the nature of rural urban ties, we must keep several factors in mind. First, the observed cash flows understate by a considerable amount the actual rural support. The transportation costs of the move and the cash savings carried by the migrants are not included in the survey results. According to the Mitchell thesis, these would account for the bulk of the rural-to-urban financial flows. Secondly, studies in other countries indicate large rural-to-urban financial flows, in the form of school fees and living costs, from the rural areas where young people have to leave the home area to obtain formal education (Connell et al. 1976,p. 102:Town Drift 1973, p. 119). Our sample was designed to eliminate the student migrant so this form of rural support was not evident in the survey results. Thirdly, the role of the trans- fer of goods in the rural support offered to migrants is not considered. This omission
*Based o n a chi-square test using a significance level o f p < 0.05. The rural source unit used was the province.
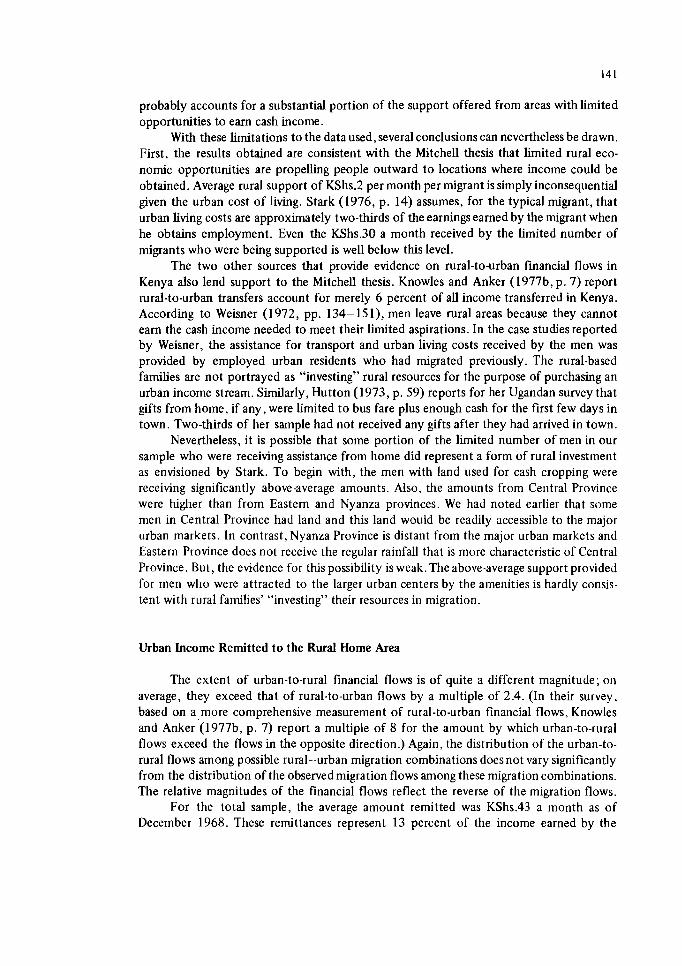
probably accounts for a substantial portion of the support offered from areas withlimited opportunities to earn cash income.
With these limitations to the data used, several conclusions can nevertheless be drawn. First, the results obtained are consistent with the Mitchell thesis that h i t e d rural eco- nomic opportunities are propelling people outward to locations where income could be obtained. Average rural support of KShs.2 per month per migrant is simply inconsequential given the urban cost of living. Stark (1976, p. 14) assumes, for the typical migrant, that urban living costs are approximately two-thirds of the earnings earned by the migrant when he obtains employment. Even the KShs.30 a month received by the limited number of migrants who were being supported is well below this level.
The two other sources that provide evidence on rural-to-urban financial flows in Kenya also lend support to the Mitchell thesis. Knowles and Anker (1977b, p. 7) report rural-to-urban transfers account for merely 6 percent of all income transferred in Kenya. According to Weisner (1972, pp. 134-lSl), men leave rural areas because they cannot earn the cash income needed to meet their limited aspirations. In the case studies reported by Weisner, the assistance for transport and urban living costs received by the men was provided by employed urban residents who had migrated previously. The rural-based families are not portrayed as "investing" rural resources for the purpose of purchasing an urban income stream. Similarly, Hutton (1973, p. 59) reports for her Ugandan survey that gifts from home, if any, were limited to bus fare plus enough cash for the first few days in town. Two-thirds of her sample had not received any gifts after they had arrived in town.
Nevertheless, it is possible that some portion of the limited number of men in our sample who were receiving assistance from home did represent a form of rural investment as envisioned by Stark. To begin with, the men with land used for cash cropping were receiving significantly above-average amounts. Also, the amounts from Central Province were higher than from Eastern and Nyanza provinces. We had noted earlier that some men in Central Province had land and this land would be readily accessible to the major urban markets. In contrast, Nyanza Province is distant from the major urban markets and Eastern Province does not receive the regular rainfall that is more characteristic of Central Province. But, the evidence for this possibility is weak. The above-average support provided for men who were attracted to the larger urban centers by the amenities is hardly consis- tent with rural families' "investing" their resources in migration.
Urban Income Remitted to the Rural Home Area
The extent of urban-to-rural financial flows is of quite a different magnitude; on average, they exceed that of rural-to-urban flows by a multiple of 2.4. (In their survey, based on a more comprehensive measurement of rural-to-urban financial flows, Knowles and ~nker ' (1977b, p. 7) report a multiple of 8 for the amount by which urban-to-rural flows exceed the flows in the opposite direction.) Again, the distribution of the urban-to- rural flows among possible rural--urban migration combinations does not vary significantly from the distribution of the observed migration flows among these migration combinations. The relative magnitudes of the financial flows reflect the reverse of the migration flows.
For the total sample, the average amount remitted was KShs.43 a month as of December 1968. These remittances represent 13 percent of the income earned by the
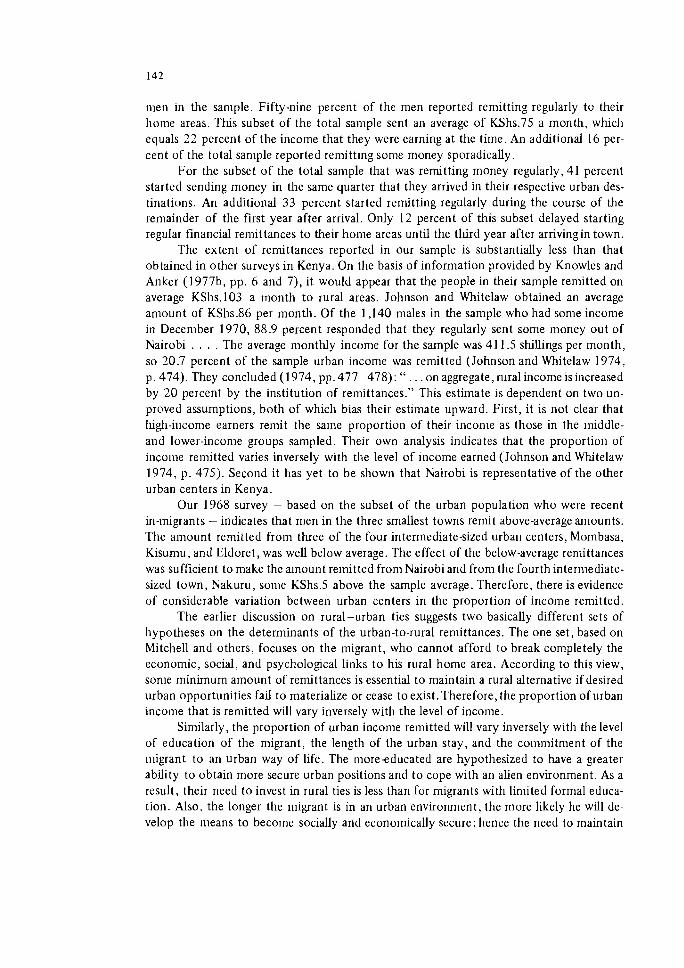
men in the saniple. Fifty-nine percent of the men reported remitting regularly t o their home areas. This subset of the total sample sent an average of KShs.75 a month, whicli equals 22 percent of the income that they were earning at the time. An additional 16 per- cent of the total sample reported remitting some money sporadically.
For the subset of the total sample that was remitting money regularly, 41 percent started sending money in the same quarter that they arrived in their respective urban des- tinations. An additional 3 3 percent started remitting regularly during the course of the remainder of the first year after arrival. Only 12 percent of this subset delayed starting regular financial remittances to their home areas until the tllird year after arrivingin town.
The extent of remittances reported in our sample is substantially less than that obtained in other surveys in Kenya. On the basis of information provided by Knowles and Anker (1977b, pp. 6 and 7), it would appear that the people in their sample remitted on average KShs.103 a month t o rural areas. Johnson and Whitelaw obtained an average amount of KShs.86 per month. Of the 1,140 males in the sample who had some income in December 1970, 88.9 percent responded that they regularly sent some money o u t of Nairobi . . . . The average monthly income for the sample was 41 1.5 shillings per month, so 20.7 percent of the sample urban income was remitted (Johnson and Whitelaw 1974, p. 474). They concluded (1974, pp.477-478): " . . . on aggregate, rural income isincreased by 2 0 percent by the institution of remittances." Tllis estimate is dependent on two un- proved assumptions, both of whicli bias their estimate upward. First, it is not clear that high-income earners remit the same proportion of their income as those in the middle- and lower-income groups sampled. Their own analysis indicates that the proportion of income remitted varies inversely with the level of income earned (Johnson and Whitelaw 1974, p. 475). Second it has yet to be shown that Nairobi is representative of the other urban centers in Kenya.
Our 1968 survey - based on the subset of the urban population who were recent in-migrants - indicates that men in the three smallest towns remit above-average amounts. The amount remitted from three of the four intermediate-sized urban centers, Mombasa, Kisumu, and Eldoret, was well below average. The effect of the below-average remittances was sufficient to make the amount remitted from Nairobi and from the fourth intermediate- sized town, Nakuru, some KShs.5 above the sample average. Therefore, there is evidence of considerable variation between urban centers in the proportion of income remitted.
The earlier discussion on rural-urban ties suggests two basically different sets of hypotheses on the determinants of the urban-to-rural remittances. The one set, based on Mitchell and others, focuses on the migrant, who cannot afford t o break completely the economic, social, and psychological links t o his rural home area. According to this view, some minimum amount of remittances is essential to maintain a rural alternative if desired urban opportunities fail to materialize or cease t o exist.Therefore, the proportion ofurban income that is remitted will vary inversely with the level of income.
Similarly, the proportion of urban income remitted will vary inversely with the level of education of the migrant, the length of the urban stay, and the coinmitment of the migrant t o an urban way of life. The moreeducated are hypothesized to have a greater ability t o obtain more secure urban positions and t o cope with an alien environment. As a result, their need to invest in rural ties is less than for migrants with limited formal educa- tion. Also. the longer the migrant is in an urban environment, the more likely he will de- velop the means to become socially and economically secure; hence the need to maintain
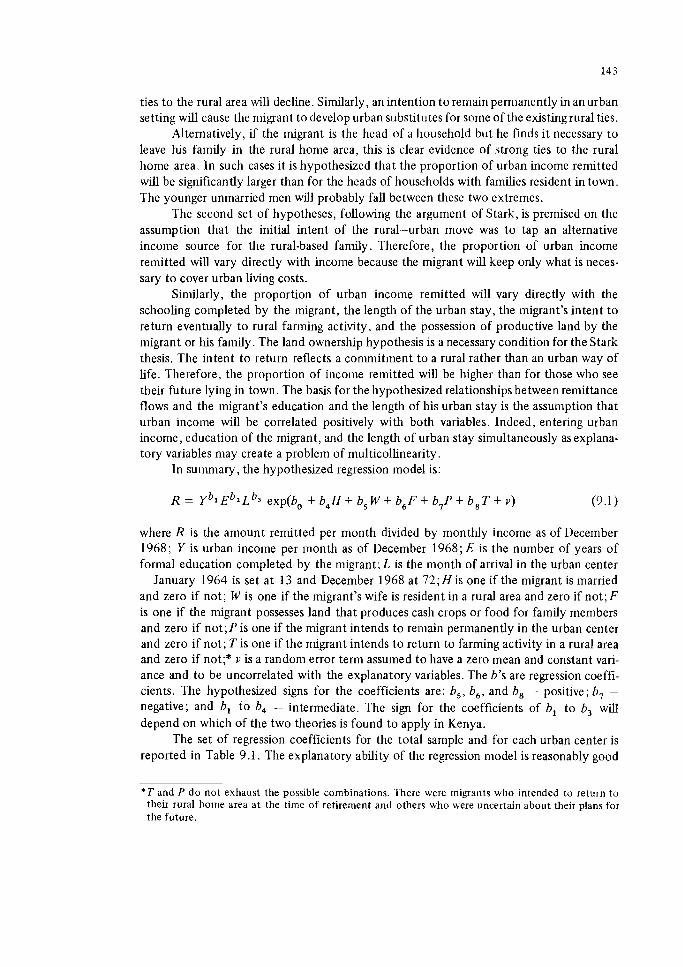
ties to the rural area will decline. Similarly, an intention to remain permanently in an urban setting will cause the migrant to develop urban substitutes for some of the existing rural ties.
Alternatively, if the migrant is the head of a household but he finds it necessary to leave lus family in the rural home area, this is clear evidence of strong ties to the rural home area. In such cases it is hypothesized that the proportion of urban income remitted will be significantly larger than for the heads of households with families resident in town. The younger unmarried men will probably fall between these two extremes.
The second set of hypotheses, following the argument of Stark, is premised on the assumption that the initial intent of the rural-urban move was to tap an alternative income source for the rural-based family. Therefore, the proportion of urban incorne remitted will vary directly with income because the migrant wfl keep only what is neces- sary to cover urban living costs.
Sinlilarly, the proportion of urban income remitted will vary directly with the schooling completed by the migrant, the length of the urban stay, the migrant's intent to return eventually to rural farming activity, and the possession of productive land by the migrant or his family. The land ownership hypothesis is a necessary condition for the Stark thesis. The intent to return reflects a commitment to a rural rather than an urban way of life. Therefore, the proportion of income remitted wdl be higher than for those who see their future lying in town. The basis for the hypothesized relationships between remittance flows and the migrant's education and the length of his urban stay is the assulnption that urban income will be correlated positively with both variables. Indeed, entering urban income, education of the migrant, and the length of urban stay simultaneously as explana- toly variables may create a problem of multicollinearity.
In summary, the hypothesized regression model is:
where R is the amount remitted per month divided by monthly income as of December 1968; Y is urban income per month as of December 1968; E is the number of years of formal education completed by the migrant; L is the month of arrival in the urban center - January 1964 is set at 13 and December 1968 at 72; H i s one if the migrant is married and zero if not; W is one if the migrant's wife is resident in a rural area and zero if not; F is one if the migrant possesses land that produces cash crops or food for family members and zero if not; P is one if the migrant intends to remain permanently in the urban center and zero if not; T is one if the migrant intends to return to farming activity in a rural area and zero if not;* v is a random error term assumed to have a zero mean and constant vari- ance and to be uncorrelated with the explanatory variables. The b's are regression coeffi- cients. The hypothesized signs for the coefficients are: b, , b,, and b, -- positive; b, - negative; and b1 to b4 - intermediate. The sign for the coefficients of bl to b, will depend on which of the two theories is found to apply in Kenya.
The set of regression coefficients for the total sample and for each urban center is reported in Table 9.1. The explanatory ability of the regression model is reasonably good
* T and P d o not exhaust the possible cornbinations. There were migrants who intended to return to their rural home area a t the tirne of retirement and others who were uncertain about their plans for the future.
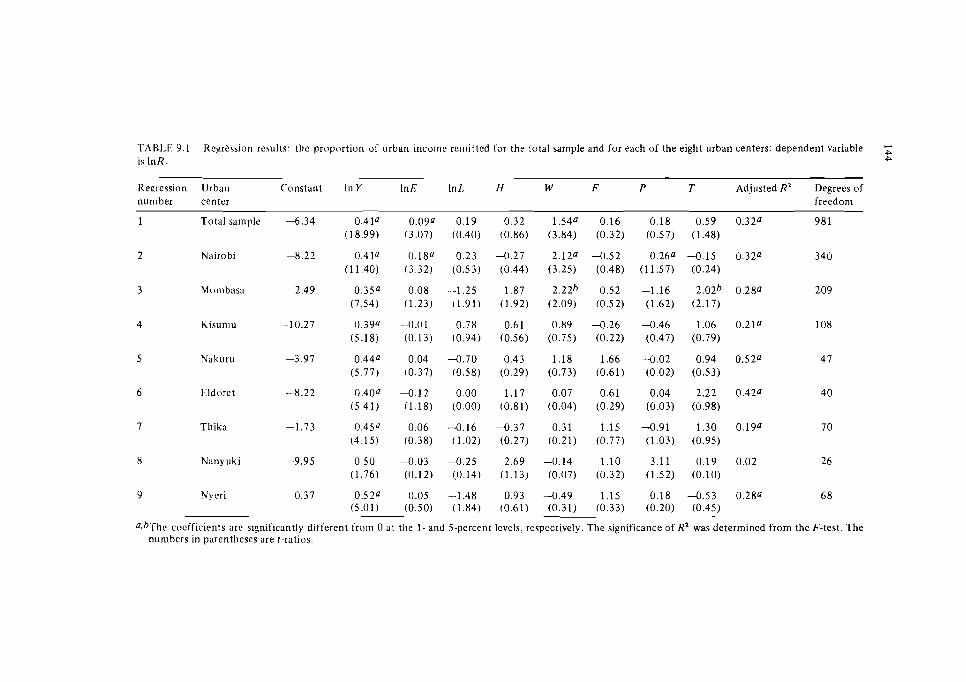
TABLE 9.1 Repression results: the proportion of urban income remitted for the total sample and for each of the eight urban centers: dependent variable is InR. P
Repression Urban Constant In Y 1nE InL H W F P T Adjusted R' Degrees of nurliber center freedom
1 Total sample 4 . 3 4 0.41' 0.09' 0 . 1 9 0 . 3 2 1.54' 0.16 4 . 1 8 0.59 0.32' 981 (18.99) (3.07) (0.40) (0.86) (3.84) (0.32) (0.57) (1.48)
2 Nairobi 8 . 2 2 0.41' 0.18' 0.23 -0.27 2.12' 4 . 5 2 0.26' -0.15 0.32' 340 (1 1.40) (3.32) (0.53) (0.44) (3.25) (0.48) (1 1.57) (0.24)
5 Nakuru 3 . 9 7 0.44' 0.04 4 . 7 0 0.43 1.18 1.66 -0.02 0.94 0.52' 47 (5.77) (0.37) (0.58) (0.29) (0.73) (0.61) (0.02) (0.53)
Q.h.ri~e cocfficients are significantly different frolrl 0 at the I - and 5-percent levels, respectively. The significance of R' was determined from the F-test. The numbers in parentheses are t-ratios.
for cross-section data. The adjusted coefficient of variation indicates that 3 2 percent of the variation in the proportion of income remitted was accounted for with the set of explanatory variables. For the individual urban centers: the explanatory power of the model varies from 2 percent for Nanyuki t o 52 percent for Nakuru. The sets of explana- tory variables taken together were significant a t the I-percent level in all cases except Nanyuki where the F-statistic obtained was not significant.
Considering first Eq. 1 of Table 9.1, for the total sample, we found that the results appear t o support the set of hypotheses associated with the Stark thesis. The coefficients for urban income and education of the migrant are both positive and significant while the coefficient for the length of urban stay has the consistent negative sign, bu t it is not sta- tistically significant. (Given the way L was measured, a negative sign for b, indicates that the most recent in-migrants are remitting a smaller proportion of their urban income.)
These results are basically the opposite of those obtained by Johnson and Whitelaw (1974, Table 2 , p. 475) and Knowles and Anker. (Knowles and Anker (1977b, Table 7 , p. 30, Eq. (2)) report a significant coefficient with a negative sign for urban income bu t neither their education variable nor their length of stay variable has a significant coeffi- cient.) Johnson and Whitelaw, using a Nairobi sample not limited to recent in-migrants, found support for what we have termed the Mitchell set of hypotheses for both the vari- ables of urban income and the length of urban stay. The sign obtained for the education coefficient is positive also, as in our case, but they interpret this t o mean that the more- educated must remit a larger share of their income because the education costs invested in the migrant by the rural support group represent a debt that must be repaid (Johnson and Whitelaw 1974, p. 476). This interpretation for the education variable may apply here as well. Contrary t o expectation, the urban income and the education variables are not correlated. The simple correlation coefficient between the urban income and the education variables was 0.04. This low correlation between the two variables was evident for each of the urban centers as well, with the exception of Eldoret, for which the simple correlation coefficient was 0.39. The better educated chose t o remit a larger portion of their urban income even though their superior educational qualifications did not provide them with above-average urban income opportunities a t this early stage of their urban residence.
For the variables of urban income and the length of urban stay, the results obtained by Johnson and Whitelaw are the opposite of ours and are more difficult t o explain than were the results for the education variable. The men in our sample arrived at their destina- tion during the 2 years before the survey. It is possible that our regression resultsare domi- nated sufficiently by recent in-migrants struggling t o become established --- and hence remitting a low proportion of a below-average level of income - that they produce the coefficient signs for these two variables as reported in Table 9.1. Had it been possible t o observe the behavior of the men in our sample for a longer time period, the signs of these coefficients might have been reversed t o become consistent with the results obtained by Johnson and Whitelaw and also by Knowles and Anker.
The regression results for the other variables are also consistent with the hypothesis that decisions about the proportion of income remitted t o rural areas are being shaped by the process of becoming established upon arrival in the urban environment. Both the men who have decided to remain permanently and the men who intend t o return t o their rural home area are not remitting a significantly different proportion of their income from that
of the men who d o not have such concrete plans about the future. Similarly, the possession of productive farmland does not generate an above-average proportion of income remitted. Conversely, the coefficient for the men with wives resident in a rural area is significant a t the 1-percent level and has the expected sign. The size of this coefficient, larger than any others, indicates that this factor has a strong influence on the decision t o remit urban income.
Comparing the regression results for each of the eight urban centers with those of the total sample does not resolve the difficulty in interpreting the results. Three variables, the length of urban stay L , the measure for head of household H, and the measure of land ownership F, indicate differences among towns in that the signs of the coefficients vary, bu t none of the coefficients is significant. The coefficient for the education variable is sig- nificant for Nairobi only and the signs are different for some of the other towns.The coeffi- cient for the measure of the intent t o remain permanently is also significant for Nairobi but has an unexpected positive sign. The intent t o return t o a rural area in the not-too- distant future proves significant in the case of Mombasa only, with the expected positive sign. The presence of a wife in a rural area causes a significantly higher proportion of income t o be remitted only for Nairobi and Mombasa. For the other towns, the magnitude of the coefficients is substantially smaller and actually becomes negative for the smallest two towns - Nanyuki and Nyeri (but the coefficients were no t significant).
The only variable that has a consistent positive sign is that for urban income. The regression coefficients are significant in all cases except for Nanyuki. The magnitude of this elasticity of the proportion of urban income remitted with respect t o urban income earned is very similar throughout, ranging from 0.35 for Mombasa t o 0.52 for Nyeri. The latter is a small town situated in a productive farming area and drawing migrants primarily from the district in which it is located. Mombasa, in contrast, is well removed from the rich farming areas of Kenya with the exception of the narrow coastal strip in which it is located.
Summarizing these results, we find that some men in Nairobi and Mombasa in the early stages of urban residence and, as yet , unable t o support a wife in town provide signifi- cantly above-average support t o their rural-based families. Similarly, the men in Nairobi with higher levels of formal schooling felt obligated t o remit a larger proportion of their income rather independent of the level of that income. In all cases, the higher the urban income earned, the larger the proportion of this income remitted. But the elasticity of the proportion of income remitted with respect t o income earned is less than 0.5, except for the smallest two towns.
T o assist in interpreting these results we turn now t o study in greater detail the migrants' intention t o remain in town or t o return home and their attitudes toward urban employment and rural employment. Such a study of the degree of urban commitment can shed additional light o n the role of urban-to-rural remittances in the Kenyan migration process.
THE DEGREE OF URBAN COMMITMENT
Future Migration Intentions
An issue under considerable debate is whether urban in-migrants plan t o stay perma- nently or whether they are merely circulating between rural and urban areas. Earlier studies
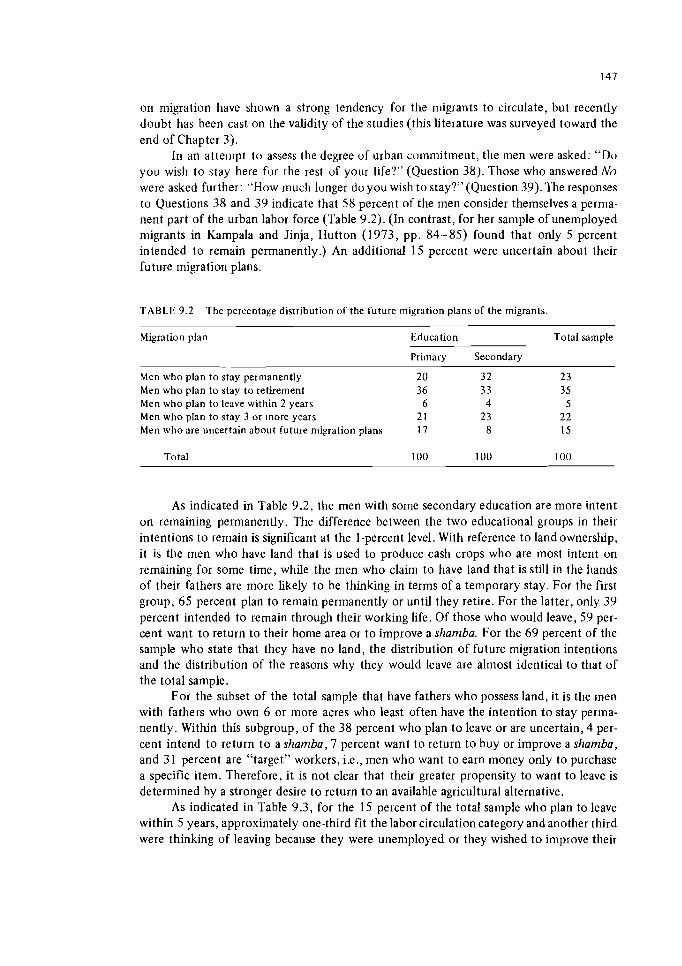
on migration have shown a strong tendency for the migrants to circulate, but recently doubt has been cast on the validity of the studies (this literature was surveyed toward the end of Chapter 3).
111 an attempt to assess the degree of urban co~nmi tmeut , the Inen were asked: "Do you wish t o stay here for the rest of your life?" (Question 38). Those who answered No were asked further: "How much longer do you wish t o stay?" (Question 39). The responses to Questions 3 8 and 39 indicate that 5 8 percent of the men consider themselves a perma- nent part of the urban labor force (Table 9.2). (In contrast, for her sample of unemployed migrants in Kampala and Jinja, Hutton (1973, pp. 8 4 8 5 ) found that only 5 percent intended to remain pemlanently.) An additional 15 percent were uncertain about their future migration plans.
TABLE 9.2 The percentage distribution of the future migration plans o f the migrants.
Migration plan Education Total sample
Primary Secondary
Men who plan t o stay permanently 2 0 3 2 2 3 Men who plan to stay to retirement 36 33 35 Men who plan to leave within 2 years 6 4 5 Men who plan to stay 3 or rnore years 2 1 2 3 2 2 Men who are uncertain about future migration plans 17 8 15
Total 100 100 100
As indicated in Table 9.2, the men with some secondary education are more intent on remaining pemlanently. The difference between the two educational groups in their intentions t o remain is significant at the I-percent level. With reference t o land ownership, it is the men who have land that is used t o produce cash crops who are most intent on remaining for some time, while the men who claim t o have land that is still in the hands of their fathers are more likely t o be thinking in terms of a temporary stay. For the first group, 6 5 percent plan t o remain permanently or until they retire. For the latter, only 39 percent intended t o remain through their working life. Of those who would leave, 59 per- cent want t o return to their home area or t o improve a shamba. For the 6 9 percent of the sample who state that they have n o land, the distribution of future migration intentions and the distribution of the reasons why they would leave are almost identical t o that of the total sample.
For the subset of the total sample that have fathers who possess land, it is the men with fathers who own 6 or more acres who least often have the intention t o stay perma- nently. Within this subgroup, of the 3 8 percent who plan t o leave or are uncertain, 4 per- cent intend t o return t o a shamba, 7 percent want t o return t o buy or improve a shamba, and 31 percent are "target" workers, i.e., men who want t o earn money only t o purchase a specific item. Therefore, i t is not clear that their greater propensity t o want t o leave is determined by a stronger desire t o return t o an available agricultural alternative.
As indicated in Table 9.3, for the 15 percent of the total sample who plan t o leave within 5 years, approximately one-third fit the labor circulation category and another third were thinking of leaving because they were unemployed or they wished t o improve their
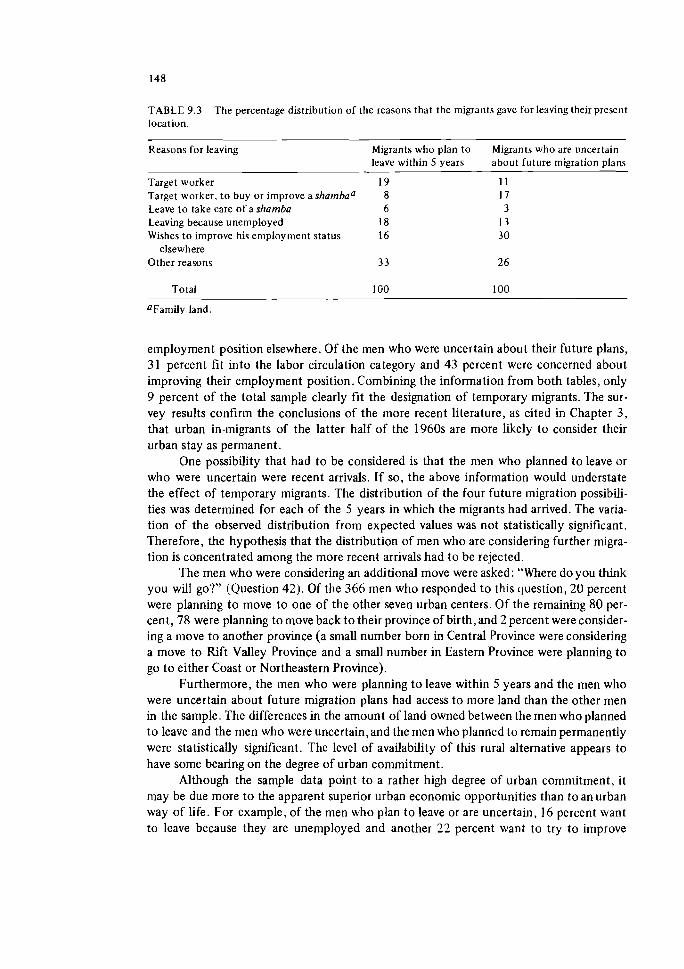
TABLE 9.3 The percentage distribution of the reasons that the migrants gave for leaving their present location.
Reasons for leaving Migrants who plan t o Migrants who are uncertain leave within 5 years about future migration plans
Target worker 19 Target worker, t o buy or improve a shatnbaa 8 Leave t o take care of a shamba 6 Leaving because unemployed 18 Wishes t o improve his employment status 16
elsewhere Other reasons 33
Total 100
OFarnily land
employment position elsewhere. Of the men who were uncertain about their future plans, 31 percent fit into the labor circulation category and 43 percent were concerned about improving their employment position. Combining the information from both tables, only 9 percent of the total sample clearly fit the designation of temporary migrants. The sur- vey results confirm the conclusions of the more recent literature, as cited in Chapter 3 , that urban in-migrants of the latter half of the 1960s are more likely to consider their urban stay as permanent.
One possibility that had to be considered is that the men who planned to leave or who were uncertain were recent arrivals. If so, the above information would understate the effect of temporary migrants. The distribution of the four future migration possibili- ties was determined for each of the 5 years in which the migrants had arrived. The varia- tion of the observed distribution from expected values was not statistically significant. Therefore, the hypothesis that the distribution of men who are considering further migra- tion is concentrated aniong the more recent arrivals had to be rejected.
The men who were considering an additional move were asked: "Where do you think you will go?" (Question 42). Of the 366 men who responded to this question, 20 percent were planning t o move to one of the other seven urban centers. Of the remaining 80 per- cent, 78 were planning to move back t o their province of birth, and 2 percent were consider- ing a move to another province (a small number born in Central Province were considering a move to Rift Valley Province and a small number in Eastern Province were planning to go t o either Coast or Northeastern Province).
Furthermore, the men who were planning to leave within 5 years and the men who were uncertain about future migration plans had access to more land than the other men in the sample. The differences in the amount of land owned between the men who planned to leave and the men who were uncertain,and the men who planned to remain permanently were statistically significant. The level of availability of this rural alternative appears to have some bearing on the degree of urban commitment.
Although the sample data point to a rather high degree of urban commitment, it may be due more to the apparent superior urban economic opportunities than to an urban way of life. For example, of the men who plan to leave or are uncertain, 16 percent want to leave because they are unemployed and another 22 percent want to try to improve
their employment position elsewhere. In the total sample, the men who were employed experienced an average wage increase from KShs.302 t o 339 a month during the first 2 years of urban residence. The men who were employed but uncertain about their future migration intentions started at a lower level (KShs.295) and experienced a smaller increase ( to KShs.299). It is possible that this relative deterioration in their wages is a prime cause for their uncertainty about the future. For the others, the degree of urban commitment may be a function of the degree of employment and income security and their satisfaction.
A final piece of evidence that indicates that the basis for the urban commitment is primarily economic is that 3 5 percent of the men plan t o stay throughout their working life only. Whether they will retire t o their rural home areas when that time comes remains t o be seen. Hanna and Hanna (1971, p. 47), in their brief survey of rural ties, suggest that the desire t o return home eventually may be more symbolic than real. Plotnicov (1965), o n the basis of field work in Nigeria, concurs in the conclusion of the Hannas. The case studies represented by Weisner (1972) suggest that future migration intentions may change dramatically if employment status in town changes significantly. This is confirmed by the Sierra Leone survey, where economic hardship encountered in town was found t o be a more important reason for return migration than a desire t o retire (Byerlee et al. 1976, p. 59). As a result, it is no t unexpected that Hutton (1973, pp. 67-85), for a sample of unemployed men in Uganda, reports substantially lower levels of urban commitment.
The Reference for Urban wrsus Rural Employment
In an attempt t o assess the role of the migrant's perception of superior urban eco- nomic opportunities in the migration process, two types of questions were asked. First, the men were asked if they would prefer basically the same work and income in their rural home area or their current urban location. In addition, the men were invited t o express their opinion o n a "back t o the land" policy announced by the government in neighboring Tanzania.
The first question was quite hypothetical in that it did no t necessarily reflect the migrant's actual urban employment experience. "If you were offered a j o b paying KShs.200 per month in your home district and the same kind of job also paying KShs.200 here, which job would you rather have?" (Question 46).
Seventy-nine percent of the men said they would prefer the job in their home area. Such a strong perference for the rural job had no t been anticipated so, unfortunately, the questionnaire was no t designed t o probe why the men preferred the rural job. The impres- sion gained by some o f the interviewers was that the respondents were well aware of the cost of living in the two locations and recognized that KShs.200 would be a higher real income in their rural home areas than in their current urban location.
I t is of interest that in three intermediate-sized towns - Mombasa, Kisumu, and Eldoret - which reported below-average amounts of urban-to-rural remittances, an above- average proportion of the men expressed a preference for the job in their current location. This is consistent with the contention that remitting income reflects an attempt t o keep open the possibility t o return t o the rural home area.
The men who indicated that they preferred the urban job were asked why this was their preference. Twenty-six percent stated that the living conditions were better in town
and 18 percent stated that they had a better chance of obtaining another job in the event that they would become unemployed. For the remainder, 17 percent said that there were more things to do in town, 13 percent claimed that they had more friends in town, and another 26 percent provided a variety of lniscellaneous answers. The men with secondary education placed considerably more weight on better living conditions and the nearness of friends than was the case for the men with less formal education. It would appear that some men perceive an urban way of life to have a superior quality that is worth the added cost of urban residence.
The results for Question 46 were cross-tabulated with a number of other variables in an attempt to obtain a profde of the type of people who preferred the rural job and the people who preferred the urban job. A substantially lower proportion than the sample average preferred the rural job in those cases where: (1) the men had been attracted to a particular urban center by the amenities available there or by the kin resident there; (2) the men intended t o remain permanently in the urban location; (3) the father of the migrant did not possess any land; and (4) the men were only employed part-time prior to migra- tion. In contrast, a substantially above-average proportion preferred a rural job in those cases where: (1) the men owned land but it was either unproductive or was used to pro- duce food for family members only; (2) the men planned to stay for a limited time period to earn the money needed to buy a shamba; (3) the men were farming prior to migration; (4) the men were married and their wives were resident in their rural home areas; and (5) the men intended to leave their urban place of residence during the course of the next 3 to 5 years or they were uncertain about their migration intentions.
The pattern that emerges from such a study of the dominant deviations from the sample mean indicates that the men with limited access t o rural resources and with a defi- nite commitment to urban residence are less likely to express a preference for a rural job. Those with access to land that does not appear to be commercially viable at this time are most likely to prefer a rural job. This is especially so for the men with a wife resident in their home areas.
The second question was based on a program announced for Tanzania several months before our Kenya survey. "The Tanzania Government has recently established a law which seeks to re-settle the urban unemployed but landless workers on co-operative farming ventures; or for those who have their own land, the Tanzania Government is sending the urban unemployed back to their land to become farmers. Do you think this is a good pol- icy'?" (Question 49). Those who were unemployed were also asked: "Would you be willing to go back to your farm or to a government co-operative, or would you prefer to stay herc and continue to try and find work?" (Question 49). Twenty-four percent of the total sam- ple responded to this second part of the question, which indicates that some who were employed responded as well.
The distribution of the opinions of the urban in-migrants on the Tanzania policy is summarized in Table 9.4. The men with some secondary education have more definite opinions than the men with less formal education. The men with secondary education are more prone to agree in principle that the Tanzania policy is a good one but their willing- ness to participate in such a program is significantly less than that of the men with primary education only. Similarly, the men who had land that was being used to produce cash crops were not interested in such a program.
The men least likely to agree with the policy were those who stated that they were pushed out of their rural home area because they had no land; those who had land that
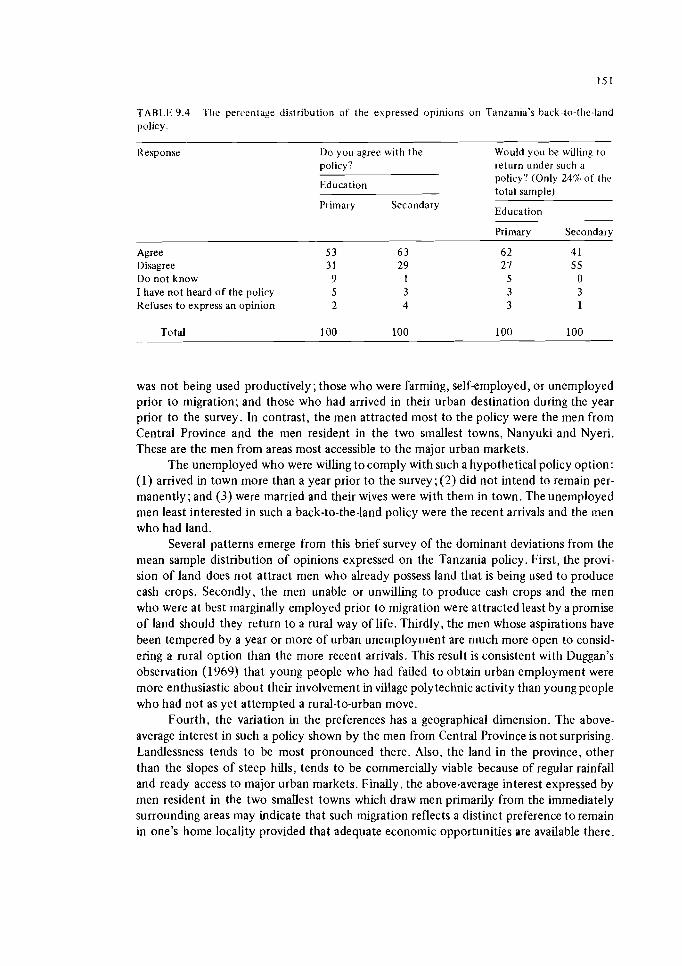
TABLE 9.4 Tlle percentage distribution of the eipressed opinions on Tanzania's back-to-the-land policy
Response Do you agree with the Would you be willing to policy? return under such a
policy? (Only 24%. of the total sample)
Primary Secondary Education
Primary Secondary
Agree 5 3 6 3 Disagree 31 29 Do not know 9 1 1 have not heard of the policy 5 3 Refuses to express an opinion 2 4
Total 1 00 100
was not being used productively; those who were farming, self-employed, or unemployed prior to migration; and those who had arrived in their urban destination during the year prior t o the survey. In contrast, the men attracted most t o the policy were the men from Central Province and the men resident in the two smallest towns, Nanyuki and Nyeri. These are the men from areas most accessible t o the major urban markets.
The unemployed who were willing t o comply with such a hypothetical policy option: (1) arrived in town more than a year prior t o the survey; (2) did not intend to remain per- manently; and (3) were married and their wives were with them in town. The unemployed men least interested in such a back-to-the-land policy were the recent arrivals and the lnen who had land.
Several patterns emerge from this brief survey of the dominant deviations from the mean sample distribution of opinions expressed on the Tanzania policy. First, the provi- sion of land does not attract men who already possess land that is being used t o produce cash crops. Secondly, the men unable or unwilling t o produce cash crops and the men who were at best marginally employed prior t o migration were attracted least by a promise of land should they return t o a rural way of life. Thirdly, the men whose aspirations have been tempered by a year or more of urban unemployment are much more open to consid- ering a rural option than the more recent arrivals. This result is consistent with Duggan's observation (1969) that young people who had failed t o obtain urban employment were more enthusiastic about their involvement in village polytechnic activity than young people who had no t as yet attempted a rural-to-urban move.
Fourth, the variation in the preferences has a geographical dimension. The above- average interest in such a policy shown by the men from Central Province is not surprising. Landlessness tends t o be most pronounced there. Also, the land in the province, other than the slopes of steep hills, tends t o be commercially viable because of regular rainfall and ready access t o major urban markets. Finally, the above-average interest expressed by men resident in the two smallest towns which draw men primarily from the immediately surrounding areas may indicate that such migration reflects a distinct preference t o remain in one's home locality provided that adequate economic opportunities are available there.
THE ROLE OF RURAL -URBAN REMIlTANCES
Summarizing the discussion thus far, we noted that ruralLurban remittances were inherent t o the migration process. For remittance flows in both directions, the distribu- tion of gross flows among the possible rural-urban combinations did not vary significantly from the observed distribution of the movement of men among these possible rural-urban combinations. In brief, the extent of the financial flows in both directions is determined primarily by the number of men who move from a rural district t o an urban center.
Secondly, the purely financial flows on balance favored the rural areas by a substan- tial margin. This is likely the case, although considerable caution needs to be exercised here because the nature of the survey prevented the measurement of what may well be the most significant rural-to-urban financial flows: all forms of nonrnonetary flows were not measured in the survey.
All the evidence on the determinants of remittances and on the degree of urban commitment does not provide support for the hypothesis that the urban in-migrants are seeking to provide an additional means for building up a viable family farming operation. The vast majority of the men interviewed would have preferred to remain in their home areas had it been possible to earn there the income needed to satisfy their aspirations. Given their perception that economic opportunities were more promising in the urban centers than in their home areas, most men indicated an intention to remain in town at least until retirement age. For the minority who were uncertain about their future loca- tion preferences or who were intending to leave their current urban place, the desire to find employment or t o improve one's employment situation was a key motivating factor. With the possible exception of the limited number who possess land that produces cash crops or who have a father who possesses 6 or more acres of land that is commercially viable, the survey does not give any indication that the migrants see their future in farm- ing and are engaging in urban employment as a means for building up that farming oppor- tunity. At best, 10 percent of the sample behave according to the Stark model.
Rather, the dominant role of the urban-to-rural remittances appears t o be to further the interests of the migrant. In effect, such remittances are insurance premiums paid to protect the migrant against the problems associated with losing current urban employment because of lay-offs, disability, or illness. The possibility for such insurance policies exists in Kenya because some form of rural alternative is still available for many migrants even though the income potential is inadequate to satisfy their aspirations.
The determinants of the amount of premiums that need to be paid do not appear to have been studied explicitly. The amount paid tends to vary directly with the size of the urban income, although the proportion of urban income remitted varies inversely with the size of the urban income. The bettereducated pay more, even though the education need not generate a significantly higher urban income. But it is not clear whether such payments are part of the insurance premium, merely repayment of a debt incurred when family members financed the education, or possibly some combination of the two. The effect of the level of wealth and income of the rural-based family on the magnitude of the insurance premium is not known. Where a man has a wife to support in the rural home area, the proportion of urban income remitted is significantly higher than is the case for the men who do not have such immediate family obligations.
According to the Johnson and Whitelaw survey in Nairobi (1974, p. 475), the need for making insurance premium payments declines as urban employment becomes more
remunerative and secure. Greater security is not correlated positively in all cases with the length of urban stay and the level of urban income. As Parkin ( 1 971) has argued, the Luo in the Kaloleni Housing Estate in Nairobi tend t o earn above-average income and they have considerable job security by virtue of their job seniority that dates back, in many cases, t o the Mau Mau emergency in the 1950s. Yet , they have cultivated their ties very carefully with the rural home area through extensive remittances. Parkin attributes this t o a fear by the Luo that their position in the Nairobi economy is threatened by a move by the Kikuyu majority t o gradually take control of economic activity in Nairobi.
Another dimension that must be considered in a discussion of the role of remittances is the use made of the money by those who receive it. [Jnfortunately, an urban-based sur- vey is not particularly useful for gathering information on this subject. In a survey of litera- ture drawn from numerous developing countries, Connell et al. conclude (1976, p. 98): "The overwhelming weight of evidence suggests that the spending of remittances reflects the poverty and lack of investment opportunities from which the migrant came. The major- ity of remittances are consumed in everyday household needs, or in conspicuous consump- tion". Although they find some evidence that remittances are used t o pay debts, build homes, and pay school fees, investment in agriculture was not particularly evident.
The limited evidence on the subject provided by Parkin and Weisner indicates that a t least for western Kenya, well removed from the major urban markets other than Kisumu, the conclusions reached by Connell et al. have general application. Parkin (1971, p . 3) reports that 1 5 percent of his sample had purchased land in their rural home area and 25 percent had constructed permanent homes on their land. On the basis of two case studies in Kisa location, Weisner (1972, pp. 1 3 4 151) lists various uses of remittances: t o bring gifts for one's parents and wife; t o pay the bus fare for clansmen who wish t o seek work in town; t o repair the existing rural house or construct a new house in Kisa; t o pay school fees for younger brothers; t o provide health care and pay school fees for one's own family members;and t o buy light consumer durables. Ile goes on t o argue (1972, p. 152):
Men with wage income are clearly better off in terms of ready cash than those without wage jobs. But there is n o evidence that those with current jobs have more rural productive resources when compared t o rural network men. At a single point in time, some men with cash income will be able t o spend more for school fees, health services, and food than will nonemployed. But for the 7 5 percent of network men who are basically similar in years of urban experience, little difference in productive resources seem t o be present.
In conclusion, the urban-to-rural remittances serve primarily as a means of income redistribution between urban and rural areas. Their effect is t o improve the quality of life in the form of better housing, better health care, more access t o consumer durable goods, etc., for some households in the rural areas. For some young people, the range of oppor- tunities is broadened in that their school fees are paid and bus fare t o an urban center is made available. T o the extent that the remittances flow t o parents and village elders who use them as a means t o enhance their prestige in the village, the remittances can be seen as keeping the traditional systems functioning in the rural areas. Therefore, it is not merely a matter of a failure t o use the remittances for development; they may be used t o prevent the change required for development.

10 INTERURBAN MOVEMENTS
We have already proved that the great body of our migrants only proceed a short distance, and that there takes place consequently a universal shifting or displacement of the population, which produces "currents of migration" setting in the direction of the great centres of commerce and industry which absorb the migrants (Ravenstein 1885, p. 198).
Whenever I was able t o make a comparison I found that an increase in the means of locomotion and a development of manufactures and commerce have led t o an increase of migration. In fact you need only seek ou t those provinces of a country to which migration is proceeding most actively, and you will either find yourself in the great centres of human industry, or in a part of the country whose resources have only recently become available. Migration means life and progress; a sedentary population stagnation (Raven- stein 1889, p. 288).
In subsequent migration literature, it has been assumed that this step migration aspect of Ravenstein's "Laws of Migration" is the basis for the role of interurban migration in the rural --urban migration process. Especially in Latin America, this step migration concept has been found t o be applicable.
The data collected in our survey cannot be used t o analyze the urban-to-urban migra- tion process because long-term residents were not included in the sample. (The full extent of urban-to-urban migration is not known. According t o the 1969 census, 1 percent of all male urban in-migrants and 2 percent of the female urban in-migrants were born in Nairobi and Mombasa.) As a result, our discussion of interurban movement is limited t o the subset of all urban-to-urban migrants who also made a rural-to-urban move at some time during the 1 9 6 4 1968 period. As such, the data are well suited t o determine whether step migra- tion, as observed by Ravenstein in nineteenth-century England, is also evident in Kenya.
MAGNITUDE OF THE FLOW
The results of our migration survey indicate that 12 percent (131) of the men made an urban-to-urban move subsequent to their rural-to-urban move (Table 10.1).* In terms of the number moving between towns, Nairobi provides one-third of the migrants and
*The extent of subsequent urban-to-urban movement observed here is much lower than in Sierra Leone. where the men surveycd had. o n average, lived in two urban centcrsother than theircurrent urban resi- dence by the age of 25 (Byerlee et al. 1976 , p . 54). Conversely, in Uganda, Hut ton ( 1 973 .pp . 5 0 51) reports that almost 8 0 pcrcent of hcr sample had searched for e ~ n p l o y m e n t only in the one urban center which they wcre located in a t the time of her survey.
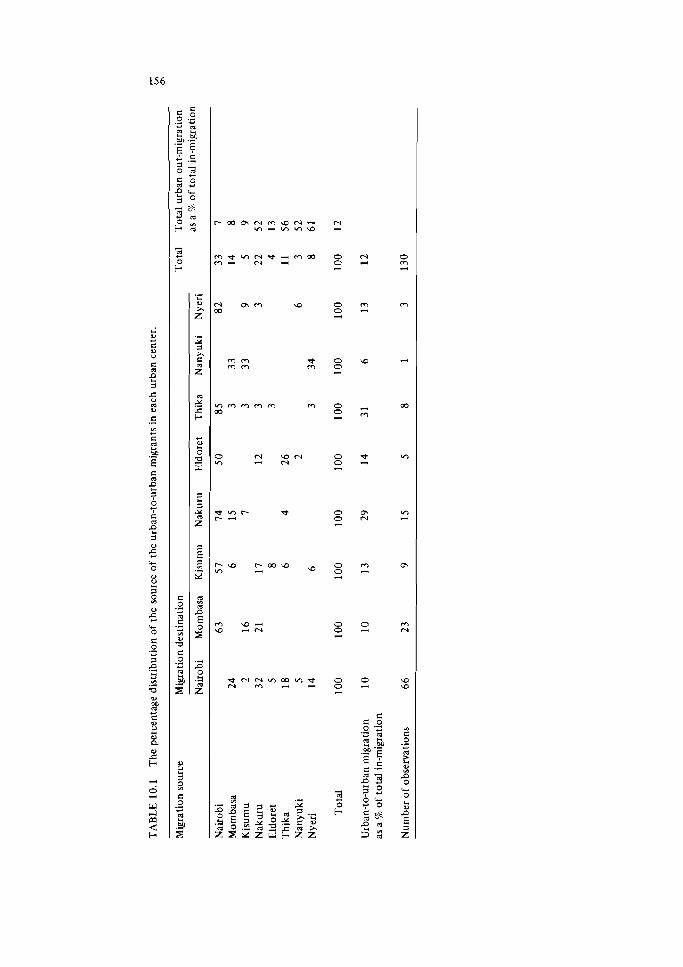
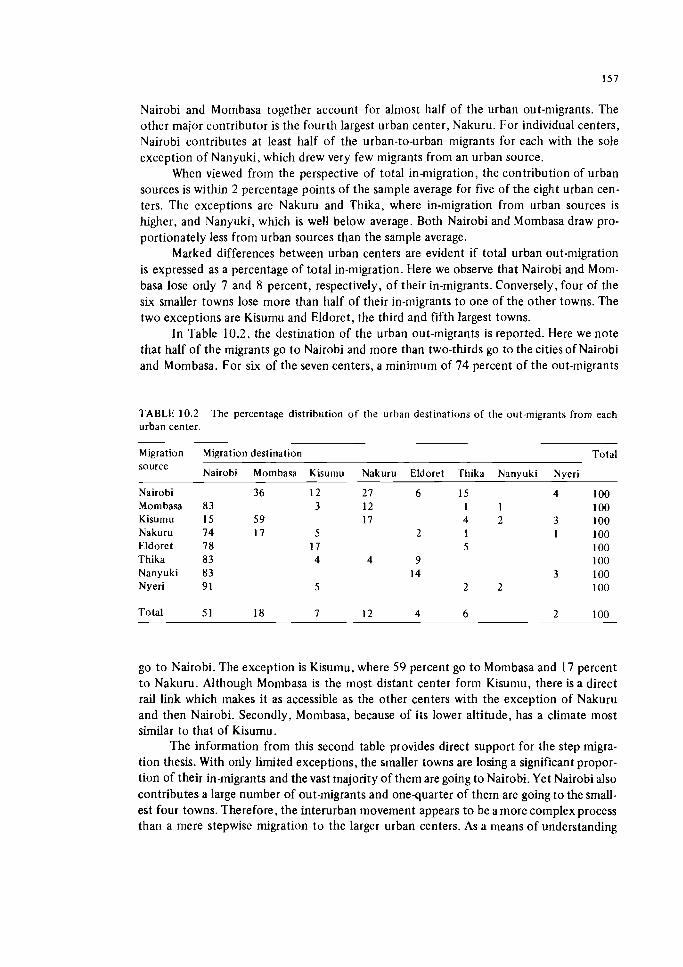
Nairobi and Mombasa together account for almost half of the urban out-migrants. The other major contributor is the fourth largest urban center, Nakuru. For individual centers, Nairobi contributes at least half of the urban-to-urban migrants for each with the sole exception of Nanyuki, which drew very few migrants from an urban source.
When viewed from the perspective of total in-migration, the contribution of urban sources is within 2 percentage points of the sample average for five of the eight urban cen- ters. The exceptions are Nakuru and Thika, where in-migration from urban sources is higher, and Nanyuki, which is well below average. Both Nairobi and Mombasa draw pro- portionately less from urban sources than the sample average.
Marked differences between urban centers are evident if total urban out-migration is expressed as a percentage of total in-migration. Here we observe that Nairobi and Mom- basa lose only 7 and 8 percent, respectively, of their in-migrants. Conversely, four of the six smaller towns lose more than half of their in-migrants t o one of the other towns. The two exceptions are Kisumu and Eldoret, the third and fifth largest towns.
In Table 10.2, the destination of the urban out-migrants is reported. Here we note that half of the migrants go to Nairobi and more than two-thirds go to the cities ofNairobi and Mombasa. For six of the seven centers, a minimum of 74 percent of the out-migrants
TABLE 10.2 The percentage distribution o f the urban destinations o f the out-migrants from each urban center.
Migration source
Nairobi Mornbasa Kisurnu Nakuru Eldoret Thika Nanyuki Nyeri
Total
Migration destination Total
Nairobi Mornbasa Kisurnu Nakuru Eldoret Tl~ika Nanyuki Nyeri
2 7 6 15 4 12 1 1 17 4 2 3
2 1 1 5
4 9 14 3
2 2
go to Nairobi. The exception is Kisumu, where 59 percent go to Mombasa and 17 percent to Nakuru. Although Monlbasa is the most distant center form Kisumu, there is a direct rail link which makes it as accessible as the other centers with the exception of Nakuru and then Nairobi. Secondly, Mombasa, because of its lower altitude, has a climate most similar to that of Kisumu.
The information from this second table provides direct support for the step migra- tion thesis. With only limited exceptions, the smaller towns are losing a significant propor- tion of their in-migrants and the vast majority of them are going to Nairobi. Yet Nairobi also contributes a large number of out-migrants and onequarter of them are going to the small- est four towns. Therefore, the interurban movement appears t o be a more complex process than a mere stepwise migration to the larger urban centers. As a means of understanding
this more complex process, we turn now t o the questions of who is migrating and why they are migrating.
CHARACTERISTICS OF THE MIGRANTS
In his discussion of the characteristics of migrants, Lee (1969, p. 295) puts forth the hypothesis that migrants who are leaving because of minus (push) factors a t their points of origin will be "negatively selected"; that is, these migrants will be economic or social failures in their place of origin. Conversely, if the dominant cause of migration is plus (pull) factors a t the destination, then migrants will be "positively selected."
T o determine the relative importance of such minus and plus factors in the inter- urban movement of the men in our sample, a comparison was made between the employ- nient and income experience of the interurban migrants and the total sample a t both the place of origin and the destination of the interurban migration. At the destination, it is possible t o separate the interurban migrants from those in the total sample who had not moved from their initial urban destination, so the comparison will be made between the urban-to-urban migrants and the remainder of our sample.
Considering employment status first, we note in Table 10.3 that only 2 percent of the interurban migrants were selfemployed in their previous location, but 41 percent were unemployed. The latter is much higher than for the total sample (24 percent unemployed in the first quarter after migration, 15 percent in the fourth, and 1 3 percent in the eighth quarter; see Table 6.4). The few who were selfemployed all obtained wage employment in their new location within the first quarter after migration. For the unemployed. 61 per- cent were employed within the first quarter and 3 7 percent were still searching for employ- ment. For the 5 7 percent who were wageemployed previously, the job search in their new location was more productive; 8 0 percent were again wageemployed and only 1 9 percent were unemployed. Combining all three, we observe that 2 6 percent were unem- ployed, which is slightly higher than the 23 percent for the remainder of the sample. But 7 3 percent were wageemployed, though 6 6 percent were wageemployed in the remainder of the sample. As a result, the interurban migrants either have a distinct aversion t o self- employment or they were not forced t o rely on it as much as the remainder of the sample.
With reference t o average income in the previous urban location, the interurban migrants cannot be seen as obvious economic failures relative t o the total sample. For the interurban migrants, average income was KShs.235 a month, which is 1 0 percent above the first-quarter level for the total sample and 8 5 percent of the eighth-quarter level for the total sample. (Thirty percent of the interurban migrants had been resident in their previous location for less than 1 year, while 7 0 percent had lived there for more than a year.) Among urban centers, there are marked differences: in Mombasa, Nakuru, and Eldoret, the average income of the interurban migrants was above the eighth-quarter aver- age for the total sample; in Nyeri, Kisumu, Nairobi, and Thika, the interurban migrants were earning, on the average, substantially less than the average for the total sample. In these latter locations, a combination of limited enlployment prospects and relatively low wages faced by the interurban migrants may be a reason for their seeking better prospects elsewhere. Therefore, some of the interurban migrants appear t o have been economic fail- ures, but the proportion is sufficiently small that , on the average, this cannot be the case.
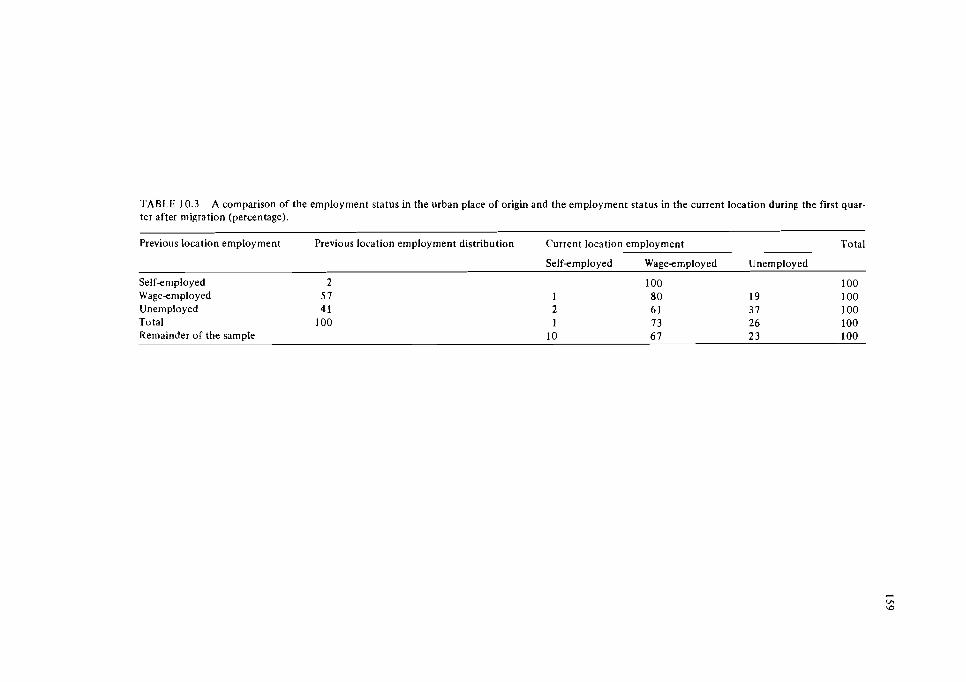
TABLE 10.3 A comparison of the employment status in the urban place of origin and the employment status in the current location during the f i s t quar- ter after migration (percentage).
Previous location employment Previous location employment distribution Current location employment Total
Self-employed Wageemployed Unemployed
Self-eniployed 2 1 0 0 1 0 0 Wageemployed 5 7 1 8 0 19 1 0 0 Unemployed 41 2 6 1 3 7 1 0 0 Total 1 0 0 1 73 26 100 Remainder of the sample 1 0 6 7 2 3 100
Turning to the postmigration income experience of the migrants, we observe evi- dence of plus factors in the destination shaping the interurban migration process (Table 10.4). First, the interurban migrants earned an average income in the first quarter after migration which is 4 6 percent above that for the remainder of the sample.* This advantage is especially evident in Eldoret and Mombasa, while in Nairobi, the relative gain is only slightly above average.
A major part of this superior income status is a wage level for the interurban migrants 3 0 percent above that obtained by the remainder of the sa~nple during the first quarter after migration.** The relative difference in wage levels corresponds directly t o the rela- tive differences in average incomes between the two groups, with the exception of Nakum. There, a 39 percent higher wage level generated an average income only 6 percent above that for the remainder of the sample, indicating that en~ployment prospects a t this rela- tively high wage were not particularly good.
Combining the results obtained from this comparison of employment and income prior to and subsequent t o migration, we obtain only limited evidence of minus factors in the origin area propelling migrants elsewhere. The evidence of plus factors in the destina- tion area attracting migrants is considerably stronger but not conclusive. Neither the higher income nor the higher wage obtained by the interurban migrants was significantly different from the income and wage levels of the remainder of the sample.***
The relative strength of the pull factors indicated that the migrants are positively rather than negatively selected. The available evidence on the personal characteristics of the migrants indicates this t o be the case. First, with reference t o the education, the pro- portion with secondary education is 42 percent for the interurban migrants, which is sig- nificantly above the 26 percent for the remainder of the sample.?
Similarly, the proportion of the interurban san~ple who are "active" migrants is sig- nificantly higher for the interurban migrants (55 percent versus 3 3 percent).
For other personal characteristics such as age, the proportion no t married, the pro- portion who can be identified with the dominant ethnic group in the destination, and the proportion without land, the differences between the two groups are not statistically sig- nificant. This is as expected because none of these characteristics can be identified as obvious positive or negative attributes with reference t o interurban migration.
DETERMINANTS OF THE INTERURBAN MOVE
As indicated previously (Table 4.6), the dominant reason (for 6 0 percent of the sample) for selecting a particular urban destination was the employment prospects per- ceived t o be available there. The presence of kin there ranked a distant second (24 percent).
*The difference bctween the two income levels is not statistically significant on the basisof a "student- t" test.
**The difference between the two wage levels is not statistically significant on the basis of a "student-t" test.
***The average incomc level in Nyeri was also lower for the interurban migrants as was the average wage obtained by the interurban migrants t o Nanyuki, but the numbers involved here were too small to considcr the estimates reliable.
t T h e difference is significant at the lcvel of p < 0.05 using a "student-t" test.
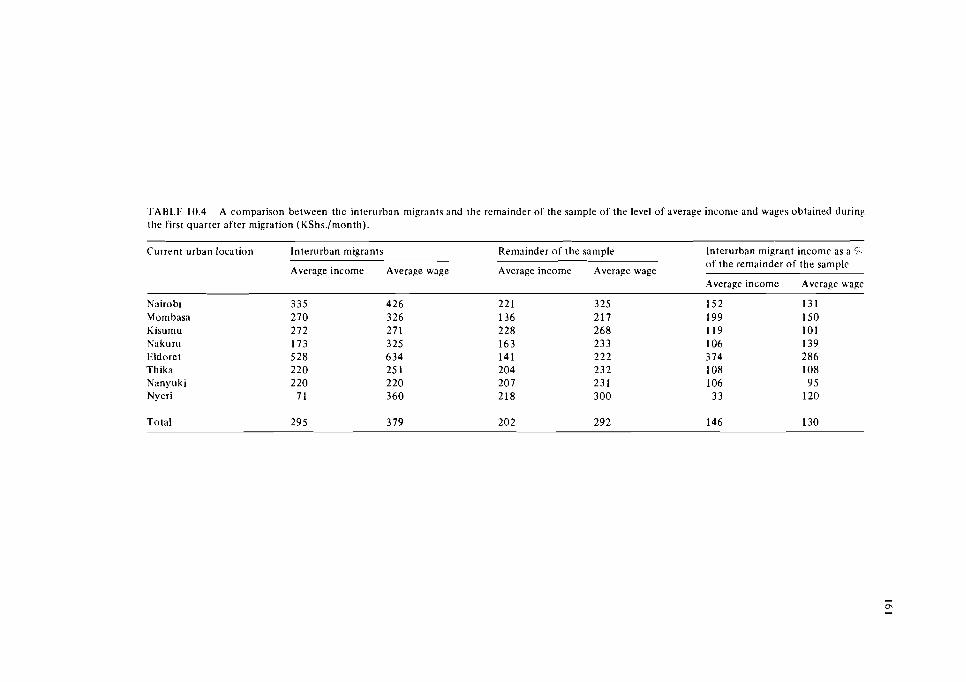
'TARLI: 10.4 A comparison between thc interurban migrants and the remainder of the sample of the level of average income and wages obtained during the first quarter after migration (KShs./month).
Current urban location Interurban migrants Remainder of the sample Interurban migrant income as a R. of the remainder of the sample
Average income Average wage Average income Average wage Average income Average wage
Nai rob~ Mombasa Kisumu Nakuru Eldoret Thika Nanyuki Nyeri
Total
If we compare this distribution of the answers to Question 7 for the total sample wit11 the responses given by the subset of the sample who were interurban migrants, we note that the two distributions are almost identical (see Table 10.5). The only real differ- ence is that the presence of kin is less important for the latter. Given that the current loca- tion is a second choice and that the interurban subset has a significantly higher proportion of "active" migrants, the smaller role of kin as a reason for selecting a particular destina- tion is to be expected. Among urban centers, the dominant differences in the distribution between the two tables are for Eldoret and Nanyuki, where all other reasons have collapsed into the employment prospects category for the interurban migrants.
Given the dominant role of employment prospects and the declining role of the presence of kin as a reason for selecting a particular urban destination, we need t o consider the difference in income earned by the interurban migrants in the two urban locations and whether they received assistance from kin on arrival in their current location. The extent of the income differential is reported in Table 10.6.
We note, first, that all column totals, except for the zero differential for Nanyuki, are positive. On the average, the interurban migrants t o each of the eight centers improved their earning power by KShs.87 a month through their change of location. This improve- ment in income is consistent with the improved employment status reported in Table 10.3 and the higher wages obtained by interurban migrants reported in Table 10.4. There are only four negative income differentials - two of these are in movements t o Nairobi. The four migration sources for these negative differentials were the four intermediate-sized towns. In only one case, Nakuru t o Nyeri, was the flow for a negative differential t o a destination smaller than the source. It is to be expected that the limited number of nega- tive differentials reflects primarily a migrant's inability to obtain employment in a location by the end of tlie first quarter.
With reference to assistance provided by kin, the relevant comparison is between Tables 10.7 and 7.4. Again, the distributions are strikingly similar; the average number of months of assistance received is only marginally lower for interurban migrants. Also, the proportions in the two tables not receiving any assistance are within 5 percentage points of each other. Among urban centers, there are substantial differences between the two for several urban centers. In Kisumu, Thika, and Nanyuki. a larger proportion of the inter- urban migrants were receiving assistance than of the total sample.
Combining the information from Tables 10.6 and 10.7, we found that the results are consistent with the emphasis that the migrants place on e~nployment prospects as the reason for selecting their destination. Even though the presence of kin is less important for tlie interurban migrants than for the total sample, the men did not receive significantly less assistance on arrival from kin than did the total sample. The interurban migrants are basically similar t o tlie total sample in their motivation and in their reliance on kin as a point of entry into the urban scene.
Finally, this similarity between the interurban migrants and tlie total sa~nple is also evident in the future migration intentions of the men (see Tables 10.8 and 9.2). The only real difference in the two distributio~is is that the interurban migrants with secondary education place less emphasis on staying until retirement and more on staying for a given number of years. No doubt , should an opportunity to improve their situation arise, many of the men with secondary education would be willing to move on t o yet another location.
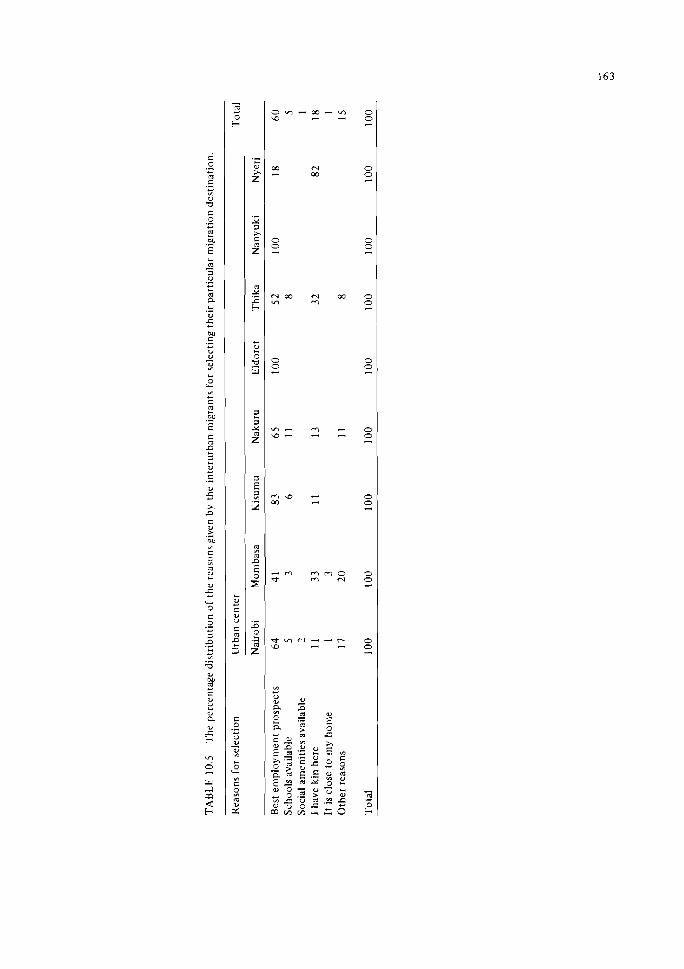
c .- .- 2 .-
4-
aJ -0 C .- - I c& .- E 4 m d
3 .- 4- b
m P
.3 5 CUI
.- - u a - 4 4
0 L
m - C m C OU .* E c 0
5 4 w - C .- U
5 2, 0 c U
.- 3L m C
S W * u 5 L 3 C 9 .- - 3
0 - m .- 0 -1 CUI - C w
2 a U s ' ? 8 0 - m
m - cr m
0
2
c r m cr w m
0
5
m - m - 2 " - - -
m w .- 03 -
;- m m c m cr
z m ' - a - - r - - - M +
8 a
$ 2 e 2 a a z - o $ .c
g2.2 2 g m 2 2 . z : 3 $ 0 g a J - a - E . 5 a E Y m r e 010- - - 0 . 2 Y " 3
Q J a
+ U
E a
2 % " , . " S m ~ ~ Z z 0
.- b
Z
.- Y
A c 2
m Y s - E O
2 Y
z 2 2
a P s E
z z m a
.: 3 Z
c .i?
- 2 E '-
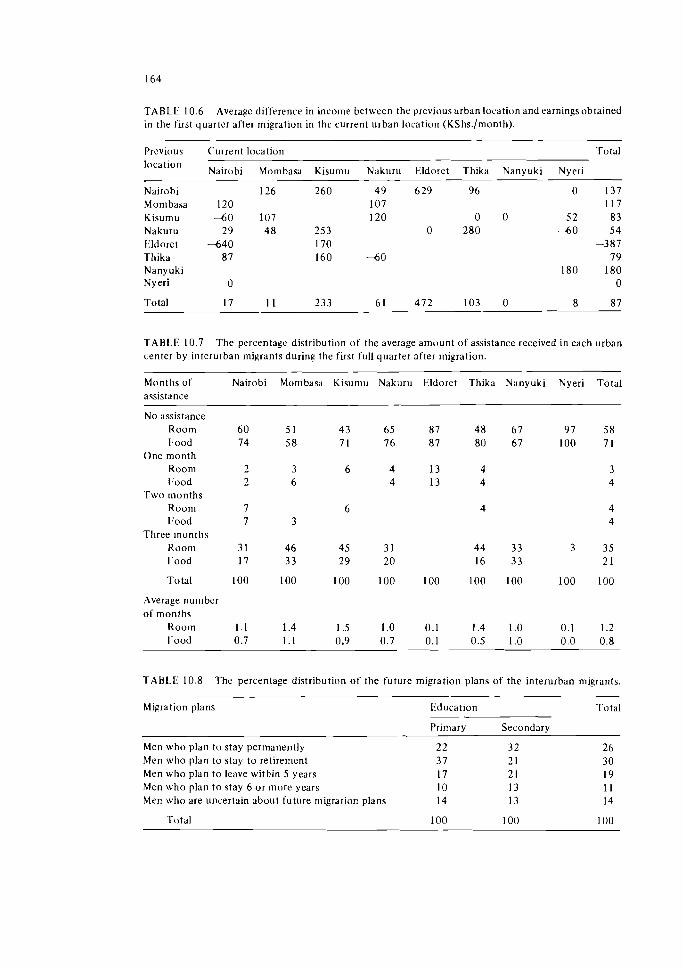
TABLE 10.6 Average difference in income between the previous urban location and earnings obtained in the first quarter after migration in thc current urban location (KShs./month).
Previous location
Nairobi Mombasa Kisumu Nakuru 1:ldorct Thika Nanyuki Nyeri
Total
Current location Total
Nairobi Mombasa Kisumu Nakuru Eldoret Thika Nanyuki Nyeri
4 9 629 96 0 137 107 117 120 0 0 52 8 3
0 280 - 6 0 5 4 -387
4 0 79 180 180
0
TABLE 10.7 The percentage distribution of the average amount of assistance received in each urban center by interurban migrants during the f i s t full quarter after ~nigration.
Months of Nairobi Mombasa Kisumu Nakuru Eldoret Thika Nanyuki Nyeri Total assistance
No assistance Room 60 5 1 4 3 65 87 48 67 9 7 58 Food 74 5 8 7 1 76 8 7 80 67 100 71
One month Room 2 3 6 4 13 4 3 I:ood 2 6 4 13 4 4
Two months Room 7 6 4 4 1:ood 7 3 4
Three months Room 3 1 46 4 5 3 1 44 33 3 35 Irood 17 3 3 2 9 20 16 33 2 1
Total 100 100 100 100 100 1 0 0 1 0 0 100 100
Average number of months
Room 1.1 1.4 1.5 1.0 0.1 1.4 1.0 0.1 1.2 I:ood 0.7 1.1 0.9 0.7 0.1 0.5 1.0 0.0 0.8
TABLE 10.8 The percentage distribution of the future migration plans of the interurban migrants.
Migration plans Education Total
Primary Secondary
Men who plan to stay permanently 2 2 32 26 Men who plan to stay to retirement 37 2 1 3 0 Men who plan to leave within 5 years 17 2 1 19 Men who plan t o stay 6 or more years 10 13 1 I Men who are uncertain about future migration plans 14 13 14
Total 100 100 100
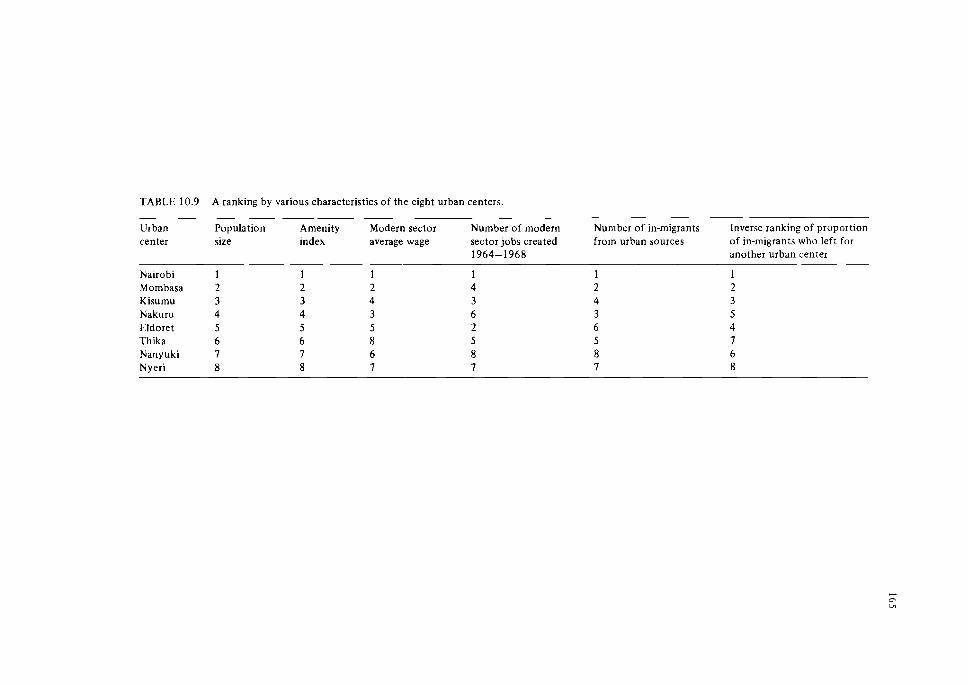
TABLE 10.9 A ranking by various characteristics of the eight urban centers.
Urban Population Amenity Modern sector Number of modern Number of in-migrants Inverse ranking of proportion center size index average wage sector jobs created from urban sources of in-migrants who left for
1964-1968 another urban center
Nairobi Mombasa Kisumu Nakuru Eldoret Thika Nanyuki Nyeri
THE ROLE OF THE DIFFERENT CITIES AND TOWNS
The evidence of step migration in Kenya includes the high proportion ofin-migrants t o most of the smaller towns who move on to another urban center and the improved employnient and income levels of the migrants in this subsequent location. As a final means of assessing the relative roles of the different cities and towns of Kenya in itsurban- ization process, the urban centers were ranked by various indicators of economic activity as well as by the extent of interurban migration (see Table 10.9). In all except the last column, the ranking is from the highest t o the lowest.
We note first that the rankings for population size and the amenity index are identi- cal. Our discussion here will be in terms of population size but it is recognized that this variable also stands for amenity availability. Secondly, with reference to modern sector wage levels, Nakuru advances one level. Thirdly, even though there are marked differences between urban centers in the level of modern sector en~ployment , new job creation is not proportional in all cases t o the level of employment. Here both Nakuru and Thika advance two levels while Mombasa drops to fifth position. The relative positions of Nanyuki and Nyeri are reversed as well.
Comparing interurban migration with these urban indicators, we note that Nakuru, Thika, and Nyeri each move u p one level in the number--of-in-migrants column. For Nyeri, this is consistent with the relative level of wages and the employment creation occurring there, but for Nakuru, it is consistent with the relative wage ranking only, since wage levels there are relatively low. But in Thika, assistance from kin is relatively high. For the proportion of in-migrants who leave for another urban center, the ranking is the inverse of the population size colunm with the exception that both Eldoret and Nanyuki move up one level. For Eldoret this is consistent with its relatively high ranking in the job creation column; for Nanyuki it is consistent with the ranking shown in the wage level column.
In conclusion, Nanyuki and Nyeri are very local towns, drawing migrants primarily from the districts in their immediate vicinity (Chapter 3) and filtering a significant pro- portion of them on t o larger centers. Thika would fall into the same category except that its proximity t o Nairobi complicates the dynamics of the labor market there. Nairobi, and t o some extent Mombasa, by virtue of their size and the extent of high-wage industries concentrated there, dominate the urbanization process. Not only are they the primary destinations for the total sample, but they are also the primary destinations for the inter- urban migrants.
11 THE IMPACT OF PUBLIC POLICY ON MIGRATION AND EMPLOYMENT
In Chapter 2 the colonial policy of concentrating centers of economic growth in a limited number of geographic locations was described briefly. At the conclusion of the chapter the observation was made that the strong commitment to achieving economic growth in the postindependence period has kept the colonial economic structure basically intact. The migration survey results, as reported and analyzed in the subsequent chapters, have shown rural-to-urban migration to be a rational response by some members of the rural labor force to this geographic concentration of economic opportunities.
In this concluding chapter attention is directed t o the aspects of the migration pro- cess that are amenable t o public policy. First, we develop further the precise nature of the aspects of the existing economic structure that shape and determine the migration process. Second, a variety of policy options that can directly affect the migration process are presented and the likely effectiveness of each is assessed. Finally, some attention is devoted to additional, more radical policies that could change the aspects of the existing economic structure that are the underlying causes of the current internal migration.
THE STRUCTURE OF THE URBAN ECONOMY
As summarized in Chapter 2, the Kenyan economy has displayed commendable advances since independence. First, the annual rate of growth of gross domestic product through 1968 was just over 6 percent. This rate of growth has been maintained into the 1970s (Development Plan: 1974-1978 (1974), Vol. I , p. 148). In addition, entrants into secondary schools have more than doubled and the number of secondary school-leavers has more than tripled (Kinyanjui 1973, p. 79).
Less commendable is the unequal distribution of benefits generated by these advances in the economy. The scanty evidence available indicates that most of the benefits accrue to a small minority: approximately 13 percent of the households obtain 72 percent of the annual income flow generated in the economy (Rempel 1975, Table 1). This minority includes owner-operators of large-scale businesses and farms, slulled and some semiskilled employees, and the owners of some of the smaller businesses and cash crop farms.
Their position in the economy provides this minority with several important privi- leges: they control the important means of production; they claim virtually all of the rent and operating surplus generated in the economy; they dominate the demand for output and hence largely determine what goods will be produced in the modem sector.
Given the taste preferences of this wealthy minority, the type of goods and services demanded frequently require technology and capital beyond the immediate capability of existing or potential Kenyan businessmen.* To overcome import constraints, foreign firms
*The effect of this concentration of demand for particular goods and services is reinforced by the emphasis placed on tourism in Kenya's development strategy.
have been invited to supply the required technology and capital. Protection against imports was provided as an inducement where necessary. An additional inducement provided such firms, as a means of obtaining and retaining their services, was the provision ofa particular type of infrastructure in certain urban localities. This infrastructure causes other firms and government to concentrate their activities in these same localities. The combination of these forces has served to agglomerate most modern sector employment in a selected number of urban centers.
For such foreign firms with a limited capacity to manage a diverse local labor force, the type of technology that has minimal labor requirements will be preferred. For this type of technology, high labor turnover increases significantly the risk of being able to maintain a desired level of profits over time. (A foreign-owned firm, relying on a transfer- pricing mechanism to repatriate profits t o a parent company, seeks t o minimize the vari- ance in profits over time as well as to maximize the level of profits. The transfer-pricing mechanism does not lend itself to repatriating widely fluctuating levels of profit.) To obtain the desired labor force stability a firm may well find it advantageous to invest some current profits in higher wages to stabilize a desired level of profits over time.
Where the initial wage increase generates a "reserve army" of visibly unemployed at the factory gates, the firm provides the current employees with a powerful incentive to remain at their jobs. (According to Mr. D. Richmond, Chief Executive Officer of the Federation of Kenya Employers, labor turnover in most of the firms represented by the federation had dropped below 5 percent a year by 1967168.) Once labor force stability has been accomplished, the firm will continue to pay above the wage necessary to obtain a desired supply of labor because of the increased labor efficiency made possible by low labor turnover. For a detailed discussion of this concept see Rempel and House (1978, pp. 78-81).
To initiate this process a firm must have sufficient financial resources to purchase the advanced technology and to pay the initial higher wages. Provided the labor market is competitive, any one firm will not know the exact amount of the initial premium it has to pay t o purchase labor force stability. As a result, a number of firms, and possibly gov- ernment, may well bid up wages beyond the level required for their initial purposes. For the firms that can pass such cost increases on in the form of higher prices and for govern- ment which can pass the higher wage costs on in the form of higher taxes, such initial trial- anderror mistakes need not present a serious problem.
For the purpose of subsequent analysis we will refer to employment in such firms and in government as "sheltered" employment. The employed are sheltered in the sense that the firm pays a wage above what would be necessary to induce an adequate labor sup- ply. The firm pursues this wage policy to obtain a stable labor force so its employees are protected against the unemployed lined up outside the firm's gates. This protection does not reflect control by employees over their work conditions; employers are not beyond using these potential replacements as a means of controlling their present employees.
The remaining modern sector firms, with limited financial resources and facing effective competition in the product market, will be forced out of the game of purchasing a stable, more efficient, selected labor force. As a result, employment in these firms will be labeled "competitive" employment. In practice the two employment lotteries cannot be identified as separate entities but it was useful to separate them conceptually. The bal- ance of the urban labor force will either need to seek some form of employment in the informal sector or will remain unemployed.
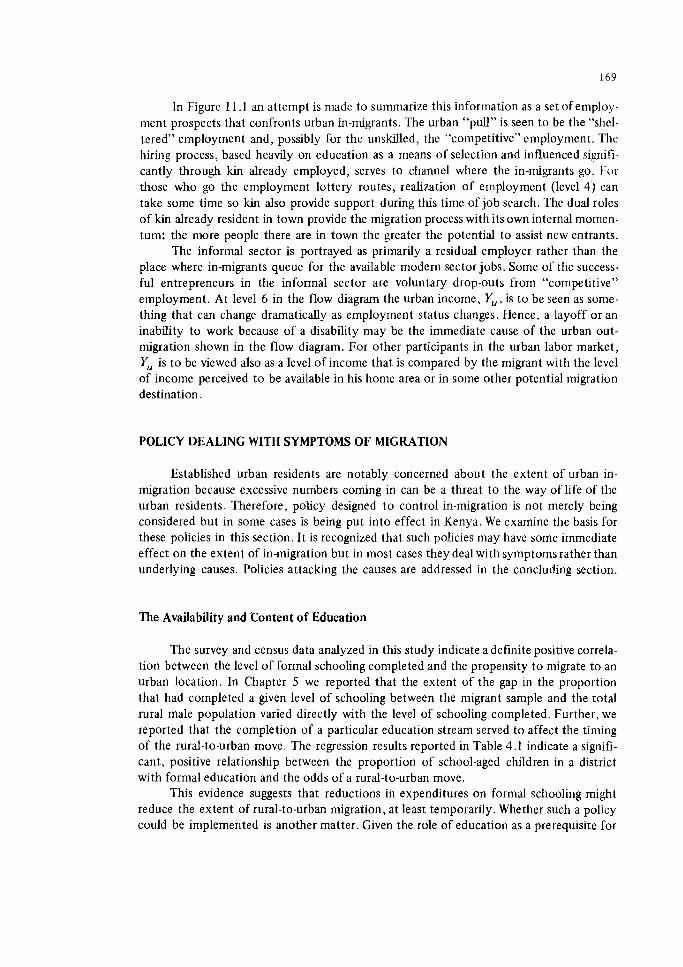
In Figure 11 .I an attcmpt is made to summarize this information as a set of employ- ment prospects that confronts urban in-migrants. The urban "pull" is seen to be the "shel- tered" employment and, possibly for the unskilled, the "competitive" employment. The hiring process, based heavily on education as a means of selection and influenced signifi- cantly through kin already employed, serves to channel where the in-migrants go. Fvi those who go the employment lottery routes, realization of employment (level 4) can take some time so kin also provide support during this time of job search. The dual roles of kin already resident in town provide the migration process withits own internal momen- tum: the more people there are in town the greater the potential to assist new entrants.
The informal sector is portrayed as primarily a residual employer rather than the place where in-migrants queue for the available modern sector jobs. Some of the success- ful entrepreneurs in the informal sector are voluntary drop-outs from "competitive" employment. At level 6 in the flow diagram the urban income, Y,, is to be seen as some- thing that can change dramatically as employment status changes. Hence, a layoff or an inability to work because of a disability may be the immediate cause of the urban out- migration shown in the flow diagram. For other participants in the urban labor market, Y, is to be viewed also as a level of income that is compared by the migrant with the level of income perceived to be available in his home area or in some other potential migration destination.
POLICY DEALING WITH SYMPTOMS OF MIGRATION
Established urban residents are notably concerned about the extent of urban in- migration because excessive numbers coming in can be a threat t o the way of life of the urban residents. Therefore, policy designed to control in-migration is not merely being considered but in some cases is being put into effect in Kenya. We examine the basis for these policies in this section. It is recognized that such policies may have some immediate effect on the extent of in-migration but in most cases they deal with symptomsrather than underlying causes. Policies attacking the causes are addressed in the concluding section.
The Availability and Content of Education
The survey and census data analyzed in this study indicate a definite positive correla- tion between the level of formal schooling completed and the propensity t o migrate to an urban location. In Chapter 5 we reported that the extent of the gap in the proportion that had completed a given level of schooling between the migrant sample and the total rural male population varied directly with the level of schooling completed. Further, we reported that the completion of a particular education stream served to affect the timing of the rural-to-urban move. The regression results reported in Table 4.1 indicate a signifi- cant, positive relationship between the proportion of school-aged children in a district with formal education and the odds of a rural-to-urban move.
This evidence suggests that reductions in expenditures on formal schooling might reduce the extent of rural-to-urban migration, at least temporarily. Whether such a policy could be implemented is another matter. Given the role of education as a prerequisite for
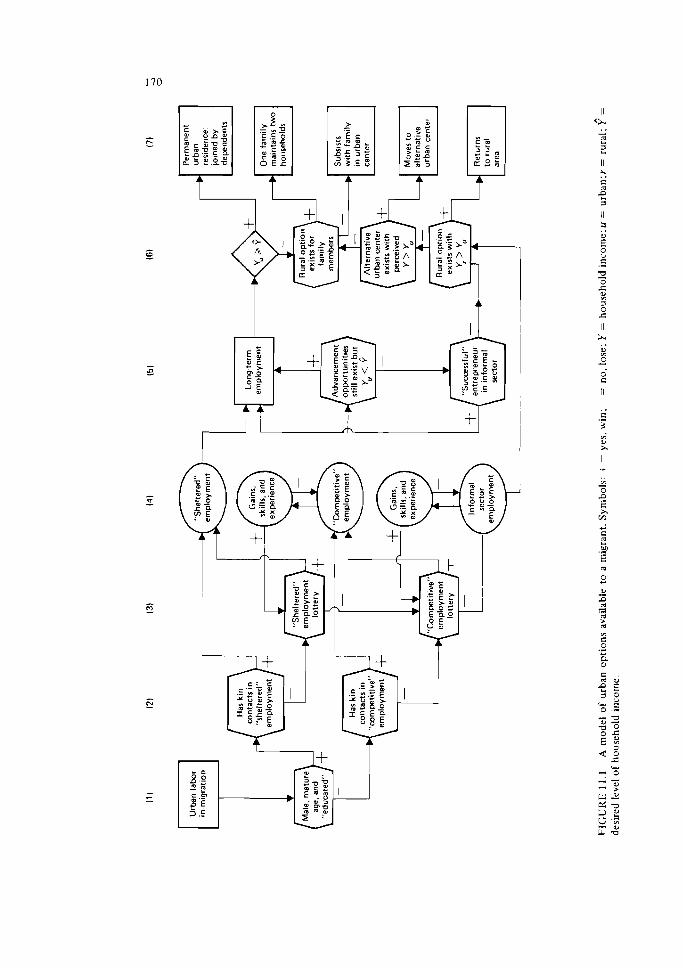
participating in the "sheltered" employment lottery, the stimulus t o obtain formal school- ing is very strong for many young people and parents. According t o the government of Kenya, the rapid increases in secondary school enrollment " . . . have as their basis the conviction, on the part of almost all Kenyans, that education is very nearly the only ladder t o high status, t o good jobs and associated high incomes" (Sessional Paper on Employ- ment 1973, p. 47).
Therefore, the starting point for policy change with reference t o education will have to be the "sheltered" employment: both in the level of wages paid and in the use of education as the primary selection device. Any reduction in the attractiveness of "shel- tered" employment would reduce the role that primary education now plays as the means t o advancement.
Such a change would have several beneficial effects on the economy. First, the pro- jected increase during the period 1975 t o 1985 of school-leavers who will not be absorbed by wage employment is from approximately 150,000 t o 500,000 (Federation of Kenya Employers 1976, Table 13A). Any decline in the enrollment of people who d o not finish school (people who use government education funds bu t d o not contribute t o develop- ment) will better enable the government t o achieve its stated objective of reducing educa- tion costs from 1 5 percent t o 11 percent of its annual expenditures.
Second, the incentive of people t o repeat standard VII in the hope of obtaining sec- ondary school admission would be reduced. The potential reduction in wasted resources here is substantial. A survey in one district reported that as many as 78 percent of the students who failed to gain admission into a secondary school repeated standard VII (Somerset 1973, p. 27). The median time for completing the 7-year program was 8.2 years.
Third, changes in the need for secondary education for an opportunity for rapid personal advancement would open the possibility for redirecting the tremendous commun- ity energies and substantial local resources that have gone into building Harambee (self- help) secondary schools. These schools have become lowquality carbon copies of the government-supported secondary schools. The result is an educational system which is " . . . not only producing the least needed type of manpower bu t also of low academic quality" (Kinyanjui 1973, p. 96). The community development potential of an altema- tive use of these resources and energies could be substantial.
Finally, such a proposed change in the incentive system could open the door for effective curriculum reform. The content of the existing curriculum is characterized by what doctors, engineers, teachers, economists, and administrators will need t o know, no t by what is useful for rural development (Somerset 1973, p. 37). The premium placed on rote learning t o obtain high scores on exams given a t the end of each educational stream is generating graduates who lack both the skills and the selfconfidence t o venture ou t on their own in some form of self-employment (Kinyanjui 1973 , p. 9 5 ; Federation of Kenya Employers 1976, p. 48).
The Federation o f Kenya Employers states (1976, p. 93): "The content of educa- tion even at present, bears little relevance t o the economic needs of the country, especially the rural areas." At another point (p. 39), they argue: " Employers, students and parents have n o significant control over curricula."
I t is our contention here that the federation, in the form of those of its members providing "sheltered" employment, does indeed determine the content of the current cur- riculum. Further, the educational system is serving these firms well. I t provides a suitable
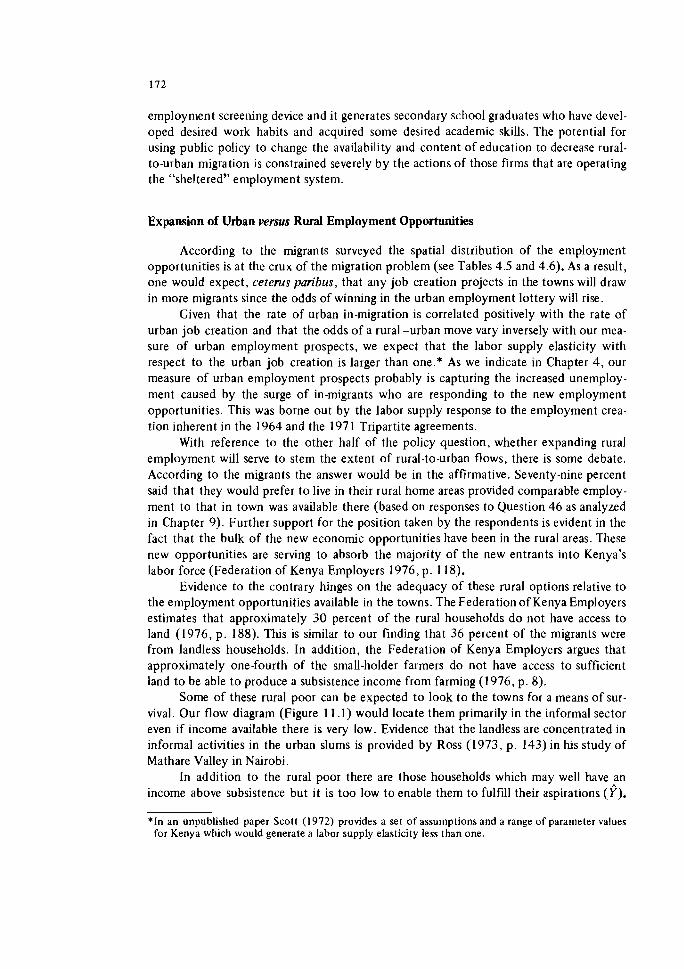
employnlent screening device and it generates secondary school graduates who have devel- oped desired work habits and acquired some desired academic skills. The potential for using public policy to change the availability and content of education to decrease rural- to-urban migration is constrained severely by the actions of those firms that are operating the "sheltered" employment system.
Expa~sion of Urban versus Rural Employment Opportunities
According to the migrants surveyed the spatial distribution of the employment opportunities is at the crux of the migration problem (see Tables 4.5 and 4.6). As a result, one would expect, cetems panbus, that any job creation projects in the towns will draw in more migrants since the odds of winning in the urban employment lottery will rise.
Given that the rate of urban in-migration is correlated positively with the rate of urban job creation and that the odds of a rural-urban move vary inversely with our mea- sure of urban employment prospects, we expect that the labor supply elasticity with respect to the urban job creation is larger than one.* As we indicate in Chapter 4 , our measure of urban employment prospects probably is capturing the increased unemploy- ment caused by the surge of in-migrants who are responding to the new employment opportunities. This was borne out by the labor supply response to the employment crea- tion inherent in the 1964 and the 1971 Tripartite agreements.
With reference to the other half of the policy question, whether expanding rural employment will serve to stem the extent of rural-to-urban flows, there is some debate. According to the migrants the answer would be in the affirmative. Seventy-nine percent said that they would prefer t o live in their rural home areas provided comparable employ- ment to that in town was available there (based on responses to Question 46 as analyzed in Chapter 9). Further support for the position taken by the respondents is evident in the fact that the bulk of the new economic opportunities have been in the rural areas. These new opportunities are serving to absorb the majority of the new entrants into Kenya's labor force (Federation of Kenya Employers 1976, p. 118).
Evidence to the contrary hinges on the adequacy of these rural options relative to the employment opportunities available in the towns. The Federation of Kenya Employers estimates that approximately 3 0 percent of the rural households d o not have access to land (1976, p . 188). This is similar to our finding that 36 percent of the migrants were from landless households. In addition, the Federation of Kenya Employers argues that approximately one-fourth of the small-holder farmers do not have access to sufficient land to be able t o produce a subsistence income from farming (1976, p. 8).
Some of these rural poor can be expected to look to the towns for a means of sur- vival. Our flow diagram (Figure 11 . l ) would locate them primarily in the informal sector even if income available there is very low. Evidence that the landless are concentrated in informal activities in the urban slums is provided by Ross (1973, p . 143) in his study of Mathare Valley in Nairobi.
In addition to the rural poor there are those households which may well have an income above subsistence but it is too low to enable them to fulfill their aspirations (9) .
*In an unpublished paper Scott (1972) provides a set of assumptions and a range of parameter values for Kenya which would generate a labor supply elasticity less than one.
For these llouseholds i t is no t merely a matter that rural employment opportunities are available; if a rural-to-urban move is t o be prevented the level of income generated by the employment must be comparable t o what household members perceive t o be available t o them in town.
Some rural employers find i t difficult t o recruit an adequate labor supply. Thus fact. together with the fact that open unemployment is evident in the towns, indicates that no t all rural employment opportunities provide a level of remuneration comparable t o what people hope t o obtain elsewhere. The Federation of Kenya Employers attributes these rural labor shortages t o the perverse effect o f education which turns people against farm labor (1976, p. 39). In contrast, both Gwyer (1972, p . 4 ) and Wasow (1973, p . 25) attri- bute these labor shortages t o the low wages and poor working conditions inherent in these jobs. For the better educated at least, modem sector employment in town is probable enough that they can exercise some choice with reference t o where they will work.
The creation of new employment opportunities in rural areas is a policy option under direct control of the government. First, i t can exercise some control over the spatial location of its activities. In addition, the Ministry of Agriculture can be instrumental in the promotion of the type of farming techniques which increase labor productivity but minimize the substitution of capital for labor. The Johnston and Kilby (1975) unimodel approach t o agricultural development, with backward linkages t o the type of agricultural inputs that can be produced within Kenya without primary reliance o n outside sources of technology, capital, and entrepreneurship, would be an appropriate model t o pursue.
Where such rural development efforts are implemented i t must be recognized that the aspiration levels of the households involved may also be raised by these development projects. If so, these projects may induce rural-to-urban migration if the increased rural income generated by the projects is less than both the new aspiration levels of the house- holds and the income they perceive t o be available to their members in one of the urban centers.
Changes in Urban versus Rural Wage Levels
The initial extension of the Todaro migration model by Harris and Todaro (1970) advocated an urban wage subsidy as a means for absorbing the urban in-migration. Although they did n o t consider all the implications of such a subsidy (see Stightz 1974), and their position was premised on the unrealistic assumption that modern sector labor-capital ratios are quite responsive t o changes in relative factor prices, this article did serve t o focus attention on wage policy as the prime mechanism for affecting the migration process.
Reducing rural-to-urban wage differentials as a policy approach has considerable intuitive appeal. For a given probability of winning in the urban employment lottery the reward for wihning varies directly with the magnitude of the urban wage. Conversely, the opportunity cost of participating in the urban employment lottery varies directly with rural income opportunities. Therefore, either reducing urban wages or increasing rural wages will reduce rural-to-urban migration.
The regression results reported here (Table 4.1) indicate this t o be the case for Kenya. 'The urban income variables have a direct effect o n the odds of a rural-to-urban move. (For rural areas a negative relationship between these variables was obtained but
these coefficients were not statistically significant.) In the urban areas action on male incomes would have a greater impact than for females since the elasticity of the propensity t o migrate because of urban wages is almost twice as high for males as for females.
The question still to be resolved is: what scope is there for affecting wage levels with public policy? Harris and Todaro see substantial scope since they assume that the migrationdetermining wage is the legislated minimum wage. As indicated in Table 4.2, the average urban income is approximately twice the legal minimum wage.The Federation of Kenya Employers (1976, p. 126) admits that most of its members are paying "far above the statutory minimum." As early as 1963,Amsden (1 971 , pp. 1 4 2 1 43) found the median minimum rate for unskilled labor t o be 28 percent above the statutory minimum. Indeed, she found evidence that the federation had privately favored some minimum wage increases on the grounds that they would reduce a possible competitive advantage by nonmembers (Amsden 1971, p . 24).
In terms of our Figure 11 . l , the minimum wage has relevance, if a t all, in "competi- tive" employment. As a result, reducing or constraining the minimum wage levels will not affect choice of technology, and hence employment levels, for firms operating the "shel- tered" employment system.
As a participant in the "sheltered" employment system the government of Kenya could consider unilateral action with reference t o the wage levels of its own employees. Unfortunately, here the Ndegwa Commission was probably correct: the government is a wage follower not a leader (Public Service Structure and Remuneration Commission 197 1, p. 45). As a result, unilateral wage reductions in the public sector would increase labor turnover there with such concomitant costs t o the public sector as loss of key personnel, reduced morale, and higher training costs. The government has been exercisingwhat moral suasion it can against further wage increases for high-skilled labor paid by foreignawned firms.
With choice of technology in industry controlled primarily by forces outside of Kenya, effective wage constraints in foreignawned firms will affect profit levels in these firms but not necessarily the employment levels. This was recognized by the Select Com- mittee on Unemployment and, as a result, on both fiscal and administrative grounds, it recommended increased taxation of high-income persons t o reduce the rural-urban wage differential (National Assembly 1970, p. 9). In addition, the sales tax on nonessential goods could be increased. Both of these actions would affect primarily the urban-based, high-income earners in "sheltered" employment and the owneraperators of modern sec- tor firms. Hence these policies would serve t o reduce the effect of an important deter- minant of rural-to-urban labor migration as well as limit somewhat the control of t h s wealthy minority over demand for the output of the modern sector.
Improved Transportation and Communication Links within Kenya
Effective changes in internal transportation and communication links affect the mi- gration process in several ways. First, improved links between rural and urban areas provide more ready access t o markets and they make possible reductions in transportation costs. Both effectively serve t o increase the average productivity of rural labor. Second.increased contact with outside areas can facilitate the diffusion of technology in the rural areas.
In contrast, the improved links also reduce the cost and risk involved in making a rural-urban move. Also, the increased contact probably will have a positive effect on rural household aspirations as well as increase the information available about opportunities elsewhere.
Given these different effects, it is not possible t o make an unambiguous statement about the overall effect of improvements in transportation and communication links on the migration process. The increase in labor productivity can be seen as a fundamental, long-term change essential to the development process. In contrast, controlling the current rate of rural-to-urban migration is an immediate but temporary problem. Hence,we would be inclined to favor improvements in the internal transportation and communication links.
One other aspect of improving internal transportation and communication links is the creation of employment inherent in the construction and maintenance of such facili- ties. Most of this employment would be located in rural areas. The government, by virtue of its control over road construction, can use such opportunities to create employment as part of its strategy to increase the attractiveness of the rural areas.
In part, the government of Kenya has pursued this course of action through the use of the National Youth Service to construct roads and in the settlement road construction aspects of the more recent Special Rural Development Programmes (Federation of Kenya Employers 1976, pp. 81-82). Where the government has not been as diligent as it might have been is in the labor intensity of the road construction it has carried out or funded (Kenya, Select Committee on Unemployment 1970, p. 21; International Labour Office 1972, pp. 383-390).
To maximize the employment potential of such road construction, some action will have to be taken. As in much of the modern sector, private contractors are either unable or unwilling to supervise the labor force involved in a labor intensive approach to road construction. The International Labour Office report (1972, pp. 284and 389-390) found that constraints in the form of a limited capability t o supervise a large labor force, rather than relative factor prices, were the reasons given by the contractors interviewed for their choosing a capital intensive approach to construction. Therefore, t o require the use of particular labor intensive construction practices will have to be made an explicit aspect of the bidding process for road construction contracts.
Increased Availability of Amenities in Rural versus Urban Areas
One of the conclusions reached by the Select Committee on Unemployment (1970, p. 9 ) was: "Rural life should be made more attractive through provision of water, better schools, better housing, health services, feeder roads, and better communication facilities. This will stem the tide of migration of rural population, especially the school-leavers, t o the towns."
The desirability of making such basic needs more accessible in rural areas is hardly open to question. Whether the provision of such social services will stem the urban in- migration is questionable. Our analysis indicates that difference~ between rural and urban areas in amenity availability exert a significant, positive effect on the odds of a rural- urban move (Table 4.1). Differences between urban centers in amenity availability exert a positive effect on the selection of a particular urban destination for females only (Table 4.3).
As we indicate in Chapter 4, the first result is probably dominated by our measure of urban amenity availability, wllich captures the effect of the size and diversity of the urban job market. The migrants' reasons for leaving their rural home and selecting a par- ticular urban destination, and the changes that they made in amenity use after migration bear o u t this interpretation of the coefficients for Aii in Table 4.1.
The results of this study cannot be considered definitive because i t is not clear that the migrants who were interviewed distinguished between actual amenities in town and their ability t o take advantage of them. For the lower-income groups, clean water is the primary amenity that is more accessible in town than in the rural areas.
In addition t o the direct effect of amenities o n migration there are several possible indirect effects. First, the provision of social services in rural areas may well raise aspira- tion levels. If so, additional rural-to-urban migration may be induced. Second, the actual provision of social services generates employment. The rural-urban distribution of such employment creation can be expected to affect the migration process.
SHAPING AN ALTERNATIVE ENVIRONMENT FOR RURAL DEVELOPMENT
The majority of Kenya's rural young people, especially those with limited formal schooling, have chosen t o remain rural. Some rural residents have moved t o another dis- trict for employment or t o take advantage of opportunities presented by aland settlement scheme, but they remain rural.
T o be rural in a setting, where potential entrepreneurs have been siphoned off to employment opportunities in town, is a struggle t o maintain a mere existence. There are virtually no possibilities for obtaining a relatively larger portion of the national income. An example of the philosophy of life such a struggle engenders is provided by Gwyer (1972, p. 4 ) : "We have tilled this soil ever since time immemorial; we are as poor as ever: if you want t o live as poor as we d o then stay with us and enjoy our poverty." This quote was taken from an examination answer in the Faculty of Agriculture at the University of Nairobi. It is reputed t o represent the views of parents, as expressed t o their children, in Meru district.
For such rural residents the most successful avenue of escape from persistent poverty has been modern sector employment, usually in the towns. The government basically has granted t o rural residents who so desire the right t o play the urban employment lottery. Those who fail t o win a level of income superior t o their rural alternative return home. Other "losers" have chosen t o remain in town and struggle there for an existence or they have moved o n t o try their fortunes in some other town (see Figure 11 .I).
Our discussion of policy options that attack the symptoms of rural-to-urban labor flows indicates that these policies provide hope for little more than marginal changes. Their potential benefits are limited because they d o not deal directly with the underlying causes of the migration. Also, a t several points it was noted that effective policy action was not likely because of the constraining effect of the existing economic and political structures.
It has been argued by some that fundamental change via policy action is unlikely in Kenya because present decision-makers will not act contrary t o their own vested interests. There is considerable truth in this, but the relevant options are not whether particular
policies are accepted or ignored. As Findley observes (1977, p . 1 1 I ) : " . . . the lack of a decision about migration is a decision in itself. Even in the absence of a conscious policy on population distribution, national agricultural and urban development policies constitute a migration strategy ."
Kenya's existing migration strategy will arrive at its own logical conclusion: access t o quality education limited primarily t o the children of the wealthy will generate sharp class divisions; continuation of existing rates of urban in-migration will exceed the capacity of the urban centers t o cope with their populations; increasing landlessness and rising unemployment will exert growing pressure on the economic and political structures. In the words of Gutkind: the energy of despair is turning into an anger of despair and is likely heading toward an explosion of despair.
A society that chooses t o act before environmental factors force action typically has more directions t o pursue and more ways t o proceed. The concluding remarks here are an attempt t o identify the changes that must be considered seriously if Kenya is t o avoid being forced into one particular course of development.
The ongoing development of the Kenyan economy and a more equitable distribu- tion of the benefits of development are already the explicit objectives of Kenya's develop- ment plans. A variety of partial solutions for the realization of these goals has been pro- posed. They include: an effective family planning program, ongoing educational reform, accelerated rural development, a comprehensive income policy, and a substantial change in government policy toward informal sector activity.
Each proposal has its own partial validity but all share a presupposition that a solu- tion can be imposed in some manner from above. Very little attention has been devoted t o changing the environment within which the Kenyan people make their day-to-day decisions.
For the 60 percent at the bottom of Kenya's income scale life is dominated by their environment. For them the environment has merely become more complex. Now i t is not merely the vagaries of the weather, which can mean temporary prosperity o r starvation; they are subjected also t o the ramifications of the new technology in the modern sector. But, as a people, they are limited still t o merely responding t o such changes. For these poor, technology has not become a recognized tool, something t o be used t o obtain a degree of mastery over one's environment, making possible more than merely a day-to- day struggle for existence.
Policy action t o change this situation must alter the economic environment, making it more conducive for the transition for the people from being mere reactors t o becoming active participants in the development process. The key elements t o the appropriate environment are access t o the means of production, technology, and markets and the incentive system that motivates action.
Given that most of the people are rural and will remain so for some time, the most important resource t o which access will be imperative is arable land. The evidence shows small farms in Kenya t o be relatively efficient in output per unit of land (Singer and Jolly 1973). In addition Gwyer (1972, pp. 5-6) cites evidence from Nyeri district that shows that a combination of land registration and crop intensification on small farms has gen- erated substantial employment gains. Both maximum output per unit of land and labor intensive production techniques are important elements of Kenya's longer-term objectives. The studies cited here indicate that increased access t o land for the rural poor need no t be
viewed as an objective with a substantial opportunity cost, in the form of reduced agricul- tural output , for the Kenyan economy.
Crop intensification by small farmers with limited resources requires a range of sup- porting elements. First. there must be ready access t o markets and t o required inputs that have t o be purchased. The physical aspect of access, roads, is being developed at a com- mendable rate in Kenya. For small farmers, some initial organizational assistance and institutional support may be required t o aid in initiating the agricultural development process. The latter would involve establishing local savings and lending institutions, local processing facilities, and local buying and selling facilities. Also, connecting feeder roads may be required. Means for decentralizing decisions on how local tax revenues are t o be spent should be devised as well.
Although small farmers have been shown t o be responsive t o market opportunities they typically d o not have ready access t o existing and emerging technology. Public pol- icy can increase their access by demonstrating the advantages of alternative technologies in such areas as new crops, improved seeds, and alternative farming techniques. For small businesses, access to technology would include both new products as well as alternative production methods. Family planning methods are another form of technology that would be beneficial t o rural society as a whole.
Access t o means of production, markets, and technology is only part of the rural development process. If farmers are to respond with new production methods and renewed effort, an adequate return for their effort will be required. A weakness of previous plans has been the omission of a system of appropriate production incentives. Specifically,inter- nal pricing policies, the price of foreign exchange, the various subsidies paid, and the cost of credit need to be built into the development plans if their objectives with reference t o employment and income redistribution are t o be realized. What is directly relevant for an employment policy premised heavily on rural development is the internal terms of trade. The evidence indicates that they have been turning against agriculture and in favor of the industrial sector in the postindependence period (Public Service Structure and Remunera- tion Commission 1971, p. 42). This process needs t o be reversed and the implicit tax on agricultural exports, in the form of an overvalued exchange rate, needs t o be reassessed carefully.
In addition t o providing a new set of positive inducements for rural development there is a need t o minimize the disincentive in the formal sector of an adverse demonstra- tion effect and inappropriate wages paid within "sheltered" employment. To dismantle what exists already is always more difficult than to start something new. An appropriate starting point would be the announcement of the intent of phasing ou t the import substi- tution industries requiring substantial rates of effective tariff protection. This would pu t pressure on the firms involved t o rely more on locally produced inputs and t o adopt employment strategies that would enable them t o be competitive on the international market. Also, for new firms wanting t o start up and for the purposes of negotiating for foreign aid, an explicit plan of action would provide the criteria for defining terms that would make the firms' production and the proposed aid contribute t o Kenya's overall development objectives.
The discussion above has focused primarily on rural development. A corresponding policy shift t o provide small-scale, urban-based firms with improved access t o means of production, markets, and technology and to provide them with an appropriate set of

production incentives is called for. This dimension of the elnployment strategy has been developed at length by the lrltrrnational Labour Office employment mission in its recom- mendations with reference to the informal sector ( I 972, pp. 21-77), Althoi~gh we feel that the report is overly optimistic. in that the informal sector is not likely to serve as a leading sector. we concur that such small businesses provide the output that meets most of the needs of the lower-income groups. Also, these firms use labor intensive technology. Hence. the promotion and expansion of small-scale businesses can serve as an integral part of an overall employment strategy. The migration effects of such employment creation will be less than comparable job creation in the formal sector.

REFERENCES
Amin, S. (1974) Introduction, in Modern Migrations in Western Africa. Oxford, London. Amsden, A.H. (197 1) International Firms and Labour in Kenya: 1945-70. Frank Cass, London. Anker, R., and J.C. Knowles (1978) A Micro-Analysis of 'emale Labour Force Participation in Kenya.
Working Paper No. 62, Population and Enlployment Programme, International Labour Office, Geneva.
Back to the Grass Roots (1969) Bulletin. lnstitute of Development Studies, University of Sussex, Brighton.
Barnum, H.N., and R.H. Sabot (1975) Education, Employment Probabilities and Rural-Urban Migra- tion in Tanzania. Econonlics Department, International Bank for Reconstruction and Develop- ment, Washington, D.C.
Bausell. C.W. (1975) The Decision t o Migrate Under Uncertainty: ACaseStudy of Rural--UrbanMigra- tion in Tropical Africa. Unpublished Ph.D. dissertation, Department of Economics, University of Maryland, Baltimore.
Heals, K.E., R.M. Levy, and L. Moses (1967) Rationality and Migration in Ghana. Review of Economics and Statistics 49:480 486.
Bienefeld, M.A. (1974) The Self Employed of Urban Tanzania. Discussion Paper No. 54, lnstitute of Development Studies, University of Sussex, Brighton.
Hienefeld, M.A., and R.H. Sabot (1972) The National Urban Mobility, Employment and Income Sur- vey of Tanzania. Economic Research Ilureau, University of Dar es Salaam, Dar es Salaam.
Bowles, S. (1970) Migration as an Investment: Empirical Tests of the Human Investment Approach t o Geographical Mobility. Review of Economics and Statistics 52:356 3 6 2 .
Brett. E.A. (1973) Colonialism and Underdevelopment in East Africa: ThePoliticsof Economic Change, 1919 3 9 . Heinemann, London.
Bujra. J.M. (1975) Women 'Entrepreneurs' of Early Nairobi. Canadian Journal of African Studies 9 : 213 - 2 4 3 .
Hurford, R.L. (1962) An Index of Distance as Related t o Internal Migration. The Southern Economic Journal 29:77 81.
Byerlee, D. (1972) Research on Migration in Africa: Past, Present and Future. African Rural Employ- ment Paper No. 2, Department of Agricultural Economics, Michigan State University, East Lansing.
Byerlee, D., and C.K. Eicher (1972) Rural Employment, Migration and Economic Development: Theoretical Issues and Empirical Evidence from Africa. African Rural Employment Paper No. 1, Department of Agricultural Economics, Michigan State University, East Lansing.
Byerlee, D., J.L. Tommy, and H. Fatoo (1976) Rural Urban Migration in Sierra Leone: Determinants and Policy Implications, African Rural Economy Paper No. 13, Department of Agricultural Economics, Michigan State University, East Lansing.
Caldwell, J.C. (1969) African Rural Urban Migration: The Movement t o Ghana's Towns. Columbia University Press, New York.
Carvajal, M.J. and D.T. Geithman (1974) An Economic Analysis of Migration in Costa Rica. Economic Development and Cultural Change 23 : 105 122.
Central Bureau of Statistics (1966, 1968, 1972, 1976) Statistical Abstract. Ministry of Finance and Planning, Nairobi.
Central Bureau of Statistics (1969, 1973) Economic Survey. Ministry of k:inance and Planning, Nairobi. Central Bureau of Statistics (1970, 1971. 1977) Kenya Population Census, 1969. Ministry of Finance
and Planning, Nairobi. Central Bureau of Statistics (1977) Integrated Rural Survey: 1974-75, Basic Report. Ministry of
Finance and Planning, Nairobi.
('erase, P.P. (1974) 1,:upectations and Reality: A Case Study ol' Return Migration from the United States to Souillern Italy. International Migration Review 8 ~ 2 4 5 262.
Chayanov. A.V. (1966) The Theory of Peasant Econoriiy. Translated and edited by D. Thorner. D.H. Kerblay and R.I:.l'. Sniith, Irwin, blomcwood, Illinois.
Cllild, I.'.C. (1973a) Employment, Technology and Growth-Role of the lnter~iiediate Sector. Paper pre- pared for conference on St~ategies for Increasing Productive Employment in African Countries. Limuru.
Child, F.C. (1973b) An Empirical Study of Small-Scale Rural Industry in Kenya. Working Paper No. 127, lnstitute for Development Studies. University of Nairobi, Nairobi.
Child, F.C. ( 1 9 7 3 ~ ) Entrepreneurship, Management and Labour in a Society in Transition. Working Paper No. 128, Institute for Development Studies, University of Nairobi, Nairobi.
Cliild, I:.C. (1973d) Programs and Policies for Promoting Growth of the Intermediate Sector in Kenya. Working Paper No. 130, lnstitute for Development Studies, University of Nairobi, Nairobi.
Christian Council of Kenya, Youth Department (1966) After School What'? (Report prepared by ajoint working party on the further education, training, and employment of primary school leavers). Nairobi.
Collier, V.C. (1973) The Private and SociaI Costs of Une~nployed Migrants in Nairobi, Kenya. Unpub- lished M.A. thesis, Department of Economics, University of Manitoba, Winnipeg.
Collier. V.C., and H. Rernpel (1977) The Divergence of Private from Social Costs in Rural--Urban Migration: A Case Study of Nairobi, Kenya. Journal of Development Studies 1 3 : 1 9 9 216.
Connell, J . B . , B . Dasgupta, R. Laishley, and M. Lipton (1976) Migration from Rural Areas: The Evi- dence from Village Studies. Oxford, Delhi.
Cowen, M.P., and F. Murage (1972) Notes on Agricultural Wage Labour in a Kenya Location, in Devel- opment Trends in Kenya. Proceedings of a seminar, Centre of African Studies, University of Edinburgh, Edinburgh.
Development Plan: 1970--1974 (1969) Republic of Kenya, Nairobi. Development Plan: 1 9 7 4 1978 (1974) Republic of Kenya, Nairobi. Diejomaoh, V.P. (1970) 1:inancing Local Government Authorities in Kenya. Discussion Paper No. 96 ,
lnstitute for I)evelopn~ent Studies, University of Nairobi, Nairobi. D u g a n , H.A. (1969) The VilIage Polytechnic in Kenya. Rural Africana 13: 4 0 48. Edgren, G . (1976) On the Politics and Mechanics of WageControl: AComparativeStudy of Experience
in Some Western and African Countries. Paper presented at the East African Countries Research Symposium on Industrial Relations and Employment, lnstitute for Labour Studies, Lusaka.
Elkan, W. (1960) Migrants and Proletarians. Oxford, London. Elkan, W. (1970) Urban Unemployment in East Africa. International Affairs 46:s 17 528. Elkan, W. (1976) Is a Proletariat Emerging in Nairobi? Econoniic Development and Cultural Change
24:695 706. Essang, S.M., and A.1:. Mabawonku (1974) Determinants and Impact of Rural-Urban Migration: A
Case Study of Selected Conimunities in Western Nigeria. African Rural Employment Paper No. 10, Michigan State University, East Lansing.
Etherington, D.M. (1967) Projected Changes in Urban and Rural Population in Kenya and the Implica- tions for Develop~nent Policy, in J.R. Sheffield (Ed.), 13ducation. Employment and Rural Devel- opment. East African Publishing House, Nairobi.
Fabricant, R.A. (1970) An Expectational Model of Migration. Journal of Regional Science 10: 1 3 24. Federation of Kenya Employers (1976) Kenya Country Study on Rural Ernploy~nent Proniotion.
International Labour Office, Geneva. t'ields, G.S. (1975) Rural- Urban Migration, Urban Unemployment and Underemployment, and Job
Search Activity, in LDCs. Journal of Development Economics 2: 165 187. I'indley, S.E. (1977) Planning for Internal Migration: A Review of Issues and Policies in Developing
Countries. Bureau of the Census, U.S. Departnient of Commerce, Washington, D.C. Flanagan, W. (1977) The Extended Family as an Agent in Urbanization: A Survey of Men and Women
Working in Dar es Salaam. Unpublished Ph.D. dissertation, Department of Sociology. University of Connecticut, Storrs.
1,'riedniann. J., and F'. Sullivan (1974) The Absorption of Labor in the Urban Economy: The Case of Developing Countries. Economic Development and Cultural Change 22:385 4 1 3 .
Gaude, J . (1976) ('auses and liepercussions of Rural Migration in 1)eveloping Countries: A Critical Analysis. Working Papcr No. 1 0 , Rural Employment Policy Research Programme. International Labour Office, Geneva.
Gaude, J . , and P. Peek (1976) The Economic Effects of Rural Urban Migration. international Labour Review 114:329 3 3 8 .
Gt~ai , D.P. (1967) Analytical Aspects of an lncolnes Policy for Kenya. Discussion Paper No. 50, Insti- tute for Development Studies, University College, Nairobi.
Ghai, D.P. (1968a) Some Notes on Labour Markets in East Africa. Staff Paper No. 13, lnstitute for Development Studies, University Collegc, Nairobi.
Ghai, D.P. (1968b) Strategy for a Public Sector Wage Policy in Kenya. Discussion Paper No. 65. Insti- tute for Development Studies, University College, Nairobi.
Ghai, D.P. (1970) Employment Performance, Prospects and Politics in Kenya. East Africa Journal 7:4--1 1.
Ghai, D.P. (1973) Incomes Policy in Kenya: Need, Criteria and Machinery, in R. Jolly er 01. (eds.), Third World Employment: Problems and Strategy. Penguin, Harmondsworth.
Ghai, D.P., and C. Ilollen (1968) The Industrial Court in Kenya: An Economic Analysis. Discussion Paper No. 73, lnstitute for Developnient Studies, University College, Nairobi.
Goddard, A.D. (1974) Population Movements and Land Shortages in Sokoto Close-Settled Zone in Nigeria. In S. Amin (ed.), Modern Migrations in Western Africa. Ol ford , London.
Godfrcy, E.M. (1973) Econon~ic Variables and Rural Urban Migration: Some Thouglits on the Todaro Hypothesis. Journal of Development Studies 9 : 6 6 78.
Godfrey, M. (1975) Education, Training Productivity and Income: A Kenyan Case Study. lnternal publication, lnstitute of Development Studies, University of Sussex, Hrighton.
Gould, P. (1972) A Mental Map of Ghana. African Urban Notes 6. Grant, E.K., and J. Vanderkamp (1976) The EconomicCausesand Effectsof Migration: Canada, 1965
7 1. Economic Council of Canada, Ottawa. Greenwood, M.J. (1969) The Determinants of Labour Migration in Egypt. Journal of Regional Science
9 :283 290. Greenwood, M.J. (197 la) An Analysis of the Determinants of lnternal Labor Mobility in India. Annals
of Regional Science 5: 1 3 7 15 1. Greenwood, M.J. (1971b) A Regression Analysis of Migration to Urban Areas of a Less-Developed
Country: The Case of India. Journal of Regional Science 11 :253- 262. Greenwood, M.J. (1972 73) The Influence of Family and Friends on Geographic Labor Mobility in a
Less-Developed Country: The Case of India. The Review of Regional Studies 3 . 2 7 3 6 . Greenwood, M.J. (1978) An Econometric Model of lnternal Migration and Regional E:conomictirowth
in Mexico. Journal of Regional Science 1 8 : 1 7 31. Gugler, J . (1969) On the Theory of Rural Urban Migration: The Case of Subsaharan Africa, in J.A.
Jackson (ed.), Sociological Studies 2: Migration. Cambridge University Press, London. Gugler, J . (1976) Migrating to Urban Centres of Unemployment in Tropical Africa, in A.11. Richmond
and D. Kubat (eds.), lnternal Migration: The New World and the Third World. Sage, London. Gulliver, P.li. (1955) Labour Migration in a Rural Econonly: A Study of the Ngoni and Ndendeuli of
Southern Tanganyika. East African Studies No. 6 , East African lnstitute for Social Research, Kampala.
Gutkind, P.C.W. (I 967) The Energy of Despair: Social Organisation of the Unemployed inTwo African Cities: Lagos and Nairobi. Civilizations 17: 1 8 6 2 2 1.
Gutkind, P.C.W. (1973) Froni the Energy of Despair to the Anger of Despair: The Transition from Serial Circulation to Political Consciousness Among the Urban Poor in Africa. Canadian Journal of African Studies 7:179 1 9 8 .
Gwyer. G.D. (1971) The Agricultural Labour Markets for Two Small-holder Areas of Kenya. Staff Paper No. 94. lnstitute for Developnicnt Studies, University of Nairobi, Nairobi.
Gwyer, G.D. (1972) Trends in Kenya Agriculture in Relation to Employment. Discussion Paper No. 153, lnstitute for Development Studies, University of Nairobi, Nairobi.
Gwyer, G.D., and G. Ruigu (1971) Some Preliminary Findings in the Agricultural Employment Situa- tion in Selected Areas, in M.E. Kenipe and L.D. Smith (eds.), Strategies for Improving Rural Welfare. Occasional Paper No. 4 , Institute of Developlnent Studies. University of Nairobi, Nairobi.
Hall, C.A.S. (1969) Mombasa Labour Force Survey. Interim Working Paper No. 4, Provincial Planning Office, Mombasa.
Hanna, W.J., and J.L. Hanna (1971) Urban Dynamics in Black Africa: An Interdisciplinary Approach. Aldine and Atherton, Chicago.
Harris, J.R., and R.H. Sabot (1976) Urban Unemployn~ent in LDCs: Towards a More General Search Model. Paper prepared for the Research Workshop on Rural Urban Labor Market Interactions. Employment and Rural Development Division. Development Economics Department, Interna- tional Bank for Reconstruction and Development, Washington, D.C.
Harris, J.R., and M.P. Todaro (1 969) Wages, Industrial Employment and Labour Productivity. Eastern Africa Economic Review 1129-~46.
Harris, J.R., and M.P. Todaro (1970) Migration, Unemployment and Development: A Two Sector Analysis. American Economic Review 60: 126 1 4 2 .
Hart, J.K. (1973) Informal Income Opportunities and Urban Unemployment in Ghana. The Journal of Modern African Studies 11 :6 1-89.
tieijnen, J.D. (1968) Development and Education in the Mwanza District (Tanzania): A Case Study of Migration and Peasant Farming. "Bronder-Offset," Rotterdam.
Heyer, J., et a[. (1971) Rural Development in Kenya. East African Publishing House, Nairobi. House, W.J., and H . Rempel (1976a) The Determinants of and Changes in the Structure of Wages and
Employment in the Manufacturing Sector of the Kenya Economy, 1967-1972. Journal of Development Economics 3:83-98.
House, W.J., and H. Kempel (1976b) The Impact of Unionization on Negotiated Wages in the Manu- facturing Sector in Kenya. Oxford Bulletin of Economics and Statistics 38: 11 1--124.
House, W.J.. and H. Rempel ( 1 9 7 6 ~ ) Labour Market Segmentation in Kenya. Eastern Africa Econolnic Review 8 .
House, W.J ., and H. Rempel (1978) Labor Market Pressures and Wage Determination in Less Developed Countries: The Case of Kenya. Economic Development and Cultural Change 26:609-620.
House. W.J., and H. Rempel (1980) The Determinants of Interregional Migration in Kenya. World Development 8 :25 35.
Hunter, G. (1974) Rural--Urban Migration in Tropical Africa. Working Paper No. 141, lnstitute for Development Studies, University of Nairobi, Nairobi.
Hunter, J.13.K. (1969) The Developlnent of the Labour Market in Kenya, in 1.G. Stewart (ed.), Eco- nomic Development and Structural Change. University Press. Edinburgh.
Huntington, H. (1973) Ethnicity in Kenyan Rural Urban Migration: A Test of the Information Hypoth- esis. Working Paper No. 123, lnstitute for Development Studies, University of Nairobi, Nairobi.
Hutton, C. (1973) Reluctant l:armers? A Study of Unemployment and Planned Rural Development in Uganda. East African Publishing House, Nairobi.
Ingham, K. (1965) A History of East Africa. Praeger, New York. lnternational Bank for Reconstruction and Development (1963) The Economic Developnlent of Kenya.
Johns Hopkins, Baltimore. International Labour Office (197 1) Labour Force Projection: 1965 - 1985, Part 11, Africa. ILO, Geneva. International Labour Office (1972) Employment, Incomes and Equality in Kenya: A Strategy for
lncreasing Productive Employment in Kenya. ILO, Geneva. International Labour Office (1976) limployment, Growth and Basic Needs: A One-World Proble~n.
1L0, Geneva. Inukai, 1. (1973) The Legal Framework for the lnformal Sector. Paper prepared for the conference,
Strategies for Increasing Productive Employment in African Countries, Limuru, Kenya. Johnson, G.E. (1971a) The Determination of Individual Hourly Earnings in Urban Kenya. Discussion
Paper No. 115, Institute for Development Studies, University of Nairobi, Nairobi. Johnson, G.E. (1971b) The Structure of Rural-Urban Migration Models. Eastern Africa Economic
Review 3:21- 28. Johnson, G.E., and W.L. Whitelaw (1974) Urban R u r a l Income Transfers in Kenya: An Estimated
Remittances I'unction. Economic Development and Cultural Change 22:473 479. Johnston, B.F., and P. Kilby (1 975) Agricultural and Structural Transformation: Economic Strategies
in Late-Developing Countries. Oxford, London. Kenya Gazette Supplement No. 1 0 2 (1968) Republic of Kenya, Nairobi.
Kenya, Republic of (1965) African Socialisn~ and its Application to Planning in Kenya. Nairobi. Kinyanjui, P.K. (1973) Education, Training and E n ~ p l o y ~ n e n t of Secondary School Leavers in Kenya.
Manpower and Uneniployn~ent Research in Africa: A Newsletter 9:79-98. Knight, J.B. (1967) The Determination of Wages and Salaries in Uganda. Bulletin of the Oxford Uni-
versity Institute of Economics and Statistics 2 9 . 2 3 3 2 6 4 . Knight, J.B. (1968) Earnings, EmpIoyment, Education and Income Distribution in Uganda. Bulletin of
the Oxford University Lnstitute of Economics and Statistics 30:267-297. Knight, J.B. (1972) Rural-Urban lncome Comparisons and Migration inGhana. Bulletin of theOxford
University Institute of Economics and Statistics 34: 199 228. Knowles, J.C., and R. Anker (1975) Economic Determinants of Demographic Behaviour in Kenya.
Working Paper No. 28, Population and Employment Project, lnternational Labour Office. Geneva. Knowles, J.C., and R. Anker (1977a) The Determinants of Internal Migration in Kenya: A District
Level Analysis. Working Paper No. 56 , Population and Employn~ent Project, lnternational Labour Office, Geneva.
Knowles, J.C., and R. Anker (1977b) An Analysis of Income Transfers in a Developing Country: The Case of Kenya. Working Paper No. 59, Population and Employment Project, lnternational Labour Office, Geneva.
Langdon, S. (1975) Multinational Corporations, Taste Transfers, and Underdevelopment: A Case Study from Kenya. Review of African Political Economy 1: 12 35.
Lee, E.S. (1969) A Theory of Migration, in J.A. Jackson (ed.), Sociological Studies 2: Migration. Cam- bridge University Press, London.
Levy, M.B. (1972) Lifetime Versus One-Year Migration in Venezuela. Journal of Regional Science 12: 407-415 .
Levy, M.B., and W.J. Wadycki (1972) A Comparison of Young and Middle-Aged Migration in Venezuela. Annals of Regional Science 6 :73 85.
Levy, M.B., and W.J. Wadycki (1973) The Influence of Family and Friends on Geograpl~ical Labor Mobility: An lnternational Comparison. Review of Economics and Statistics 55 :198-203 .
Levy, M.B., and W.J. Wadycki (1974a) What is the Opportunity Cost of Moving? Reconsideration of the Effects of Distance on Migration. Economic Development and Cultural Change 22: 198-214.
Levy, M.B., and W.J. Wadycki (1974b) Education and the Decision to Migrate: An Econometric Analy- sis of Migration in Venezuela. Econometrica 42:377 3 8 8 .
Leys. C. (1975) Underdevelopment in Kenya: The Political Economy of Neo-Colonialism. Heinemann, London.
Lipton, M. (1969) Transfer of Resources from Agriculture to Non-Agricultural Activities: The Case of India. Communications No. 109, lnstitute of Development Studies, University of Sussex, Brighton.
Lipton, M. (1976) Migration from Rural Areas of Poor Countries: The Impact on Rural Productivity and Income Distribution. Paper prepared for the Research Workshop on Rural-Urban Labor Market Interactions. Employment and Rural Development Division, Development Economics Department, lnternational Bank for Reconstruction ar.d Development, Washington, D.C.
Lobdell, R.A., and H. Rempel(1978) A Model of Labour Allocation Decision-Making in Peasant Type Households. Paper read at the Canadian Economics Association Meetings, University of Western Ontario, London.
Lucas, R.E.B. (1975) Internal migration and Economic Development: An Overview. Internal publica- tion, UCLA, Los Angeles.
MacDonald, L.D., and J.S. MacDonald (1968) Motives and Objectives of Migration: Selective Migra- tion Preferences Toward Rural and Urban Life. Social and Economic Studies 17:417-434.
Marris, P., and A. Somerset (1971) African Businessmen: A Study of Entrepreneurship and Develop- ment in Kenya. Routledge and Kegan Paul, London.
Maxwell, R. (1969) Occupational Inclinations and Attitudes Toward Rural Modernization of Students in Selected Kenyan Secondary Schools. East African Journal of Rural Development 21:60-75.
Mazumdar, D. (1975) The Urban Informal Sector. Staff Working Paper No. 21 1, International Bank for Reconstruction and Development, Washington, D.C.
Mazumdar, D. (1976) The Rural-Urban Wage Gap, Migrationand the Shadow Wage. Oxford Economic Papers 28:406-425.
Ma~clmdar, 1). (1977) Analysis of the Dual Labour Markets in LDCs. in S . Kannappan (ed.), Studies of Urban Labour Market Uehaviour in Developing Areas. International Institute for Labour Studies, Geneva.
Mendels, F.F. (1978) Peasant Household Structure in NineteenthCentury I;rance: An Econornic Approach. lntcrnal publication, University of Maryland, College Park.
Merr~ck, T.W. (1976) Imployment and Earnings in the Informal Sector in Urasil: The Case of Belo Horizonte. Journal of Developing Areas 10:337 353.
Ministry of Economic Planning and Development (1965) High-Level Manpower: Requirements and Resources in Kenya, 1964 1970. Republic of Kenya, Nairobi.
Ministry of Economic Planning and Development (1 968) Economic Survey of Central Province -
1963-64. Republic of Kenya, Nairobi. Ministry of Lands and Settlement (1971) Provincial Regional Physical Development Plans. Republic
of Kenya, Nairobi. Miracle, M.P., and S.S. Uerry (1970) Migrant Labour and Economic Development. Oxford Econonlic
Papers 22:86 - 108. Miron, J.R. (1978) Job-Search Perspectives on Migration Behavior. Environment and Planning A 10:
5 19 -535. Mitchell, J.C. (1959) Migrant Labour in Africa South of the Sahara: Tlie Causes of Labour Migration.
Bulletin of the Inter-African Labour Institute 6 : 1 2 4 7 . Mitchell, J.C. (1962) Wage Labour and African Population Movements in Central Africa, in M.K. Bar-
bour and R.M. Prothero (eds.), Essays on African Population. Praeger, New York. Mitchell J.C. (1969) Structural Plurality, Urbanization and Labour Circulation in Southern Rhodesia.
in J.A. Jackson (ed.), Sociological Studies 2: Migration. Cambridge University Press, London. Moock, J.L. (1973) Pragmatism and the Primary School: The Case of a Non-Rural Village. Africa 43:
302- 316. Morawetz, D. (1974) Employment Implicationsof Industrialization in Developing Countries: A Survey.
Economic Journal 84:49 I 542. Morgan, W.T.W., and N.M. Shaffer (1966) Population of Kenya: Density and Distribution. Oxford,
Nairobi. Muller, J . (1973) Rural Construction Works: The Impact on Rural Technological Change. Paper pre-
sented at the conference, Strategies for Increased Productive Elnployment in African Countries, Limuru, Kenya.
Munro, J.M. (1974) Migration in Turkey. Economic Developnlent and Cultural Change 22:634 653. Nash. M. (1966) Primitive and Peasant Economic Systems. Chandler, San Francisco. National Assembly (1970) Report of the Select Committee o n Unemployment. Republic of Kenya,
Nairobi. Nelson, J.M. (1976) Sojourners Versus New Urbanites: Causes and Consequences of Temporary Versus
Permanent Cityward Migration in Developing Countries. Economic Development and Cultural Change 24:721 -757.
Nelson, R.R., T.P. Schultz, and R.L. Slighton (1971) Structural Change in a Developing Economy: Colombia's Problems and Prospects. Princeton University Press, Princeton.
Nyerere, J.K. (1967) Education for Self-Reliance. Infor~nation Services Division, Ministry of Informa- tion and Tourism, Dar es Salaam.
Oberai, A.S. (1975) An Analysis of Migration to Greater Khartoum (Sudan). Working Paper No. 19, Population and Employment Project. International Labour Office, Geneva.
Ominde, S.H. (1968) Land and Population Movements in Kenva. Heinemann, London. On the Current Economic Situation in Kenya (1974) Sessional Paper No. 1 of 1974, Republic of
Kenya, Nairobi. Pack. Ii. (1972) Employment and Productivity in Kenyan Manufacturing. Eastern Africa Economic
Review 4:29--52. Pack, H. (1976) The Substitution of Labour for Capital in Kenyan Manufacturing. Economic Journal
86:45 5 8 . Pack, II., and M.P. Todaro (1969) Technological Change, Labour Absorption and Economic Develop-
ment. Oxford Economic Papers 21:395-403.
Parkin, D. (1971) Etl~nic ('ontlict as a Cause of Migration in Kenya. Paper presented at the conference on Urban Unemployment in Africa. Institute of Development Studies, University of Susse\. Hrighton.
Parmena, W. (1971) 'Back to the Land' and Industrial Location in Kenya. East Africa Journal 8:21- 24. Peek, P., and P. Antolinez (1976) Migration and the Urban Labour Market: The Case of San Salvador.
Working Paper No. 12, Rural Employ~nent Policy Research Progranlme, International Labour Office, Geneva.
Plotnicov. L. (1965) Nigerians: The Dream is Unfulfilled. Trans-Action 6 : 18 22. Public Service Salaries Review Commission (1967) Report of the Salaries Review Commission, 1967.
Office of the President, Nairobi. Public Service Structure and Remuneration Commission (1971) Report of the Co~nmission of Inquiry,
N.D. Ndegwa, Chairman. Republic of Kenya, Nairobi. Ravenstein, E.G. (1885) The Laws of Migration. Journal of the Royal Statistical Society 48:167 235. Ravenstein, E.G. (1889) The Laws of Migration. Journal of the Royal Statistical Society 52:24 1 3 0 5 . Rempel, H. (1969) Rural-to-Urban Labour Migration: An Interim Report. Staff Paper No. 39, lnstitute
for Development Studies, University of Nairobi, Nairobi. Rempel, H. (1970) Labor Migration into Urban Centers and Urban Unemployment in Kenya. Unpub-
lished Ph.D. dissertation, Department of Economics, University of Wisconsin, Madison. Rempel, H. (1971) The Rural-to-Urban Migration in Kenya. African Urban Notes 6:53-72. Rempel, H. (1974a) An Estimate of Kenya's Labour Force. Working Paper No. 159, lnstitute for
Development Studies, University of Nairobi, Nairobi. Rempel, 11. (1974b) An Analysis of the Information on Inter-District Migration Provided in the 1969
Kenya Census. Working Paper No. 142, lnstitute for Development Studies, University of Nairobi, Nairobi.
Rempel, H. (1975) Rural to Urban Migration as a Means to Greater Equity. Paper presented at the Canadian Association of African Studies Meetings, York University, Toronto.
Rempel, H. (1976) The Determinants of Rural-to-Urban Labour Migration in Kenya. Migration and Development Study Group, Center for International Studies, Massachusetts lnstitute of Tech- nology, Cambridge.
Rempel, H. (1978) The Extent and Nature of the Population Movement into Kenya's Towns, in R.A. Obudho (ed.), Urbanization and Developn~ent Planning in Kenya. East African Literature Bureau, Nairobi.
Rempel, H., J.R. Harris, and M.P. Todaro (1970) Rural-to-Urban Migration: A Tabulation of the Responses to the Questionnaire Used in the Migration Survey. Discussion Paper No. 92, Institute for Development Studies, University of Nairobi, Nairobi.
Rempel, H., and R.A. Lobdell (1977) The Rural Impact of Rural-Urban Migration in Low Income Economies. Draft Manuscript. Department of Economics, University of Manitoba.
Rempel, H., and R.A. Lobdell (1978) The Role of Urban-to-Rural Remittances in Rural Development. Journal of Development Studies 14:324-341.
Rempel, H., and W.J. House (1978) The Kenya Employment Problem: An Analysis of the Modern Sector Labour Market. Oxford, Nairobi.
Reynolds, L.G. (1969) Economic Development with Surplus Labour: Some Complications. Oxford Economic Papers 21 :89 1 0 3 .
Rosberg, C.G., and J. Nottingham (1970) The Myth of 'Mau Mau': Nationalism in Kenya. World, Cleveland.
Ross, M.H. (1973) The Political Integration of Urban Squatters. Northwestern University Press, Evanston. Ross, W.M. (1927) Kenya from Within. Allen and Unwin, London. Sabot, R.H. (1975a) Migration, Education and Urban Surplus Labor. OECD, Development Center
Monograph. Sabot, R.H. (1975b) The Meaning and Measurement of Urban Surplus Labor. Economics Department.
International Bank for Reconstruction and Development, Washington, D.C. Sahota, G . (1968) An Economic Analysis of Internal Migration in Brazil. Journal of Political Economy
76:218 245. Sandbrook, R. (1975) Proletarians and African Capitalism: The Kenyan Case, 1960 1972. Cambridge
University Press, London.
Schuh, G.E. (1976) Out-Migration, Rural Productivity and the Distribution of Income. Paper prepared for the Research Workshop on Rural-Urban Labor Market Interactions, Employment and Rural Development Division. Development Economics Ilepart~nerit. lnternational Bank for Reconstruc- tion and Developnient, Washington, D.C.
Schultz, T.P. (1971) Rural-Urban Migration in Colombia. Review of Economics and Statistics 53: 157-~163.
Schultz, T.P. (1976) Notes on the Estimation of Migration Decision 1;'unctions. Paper prepared for the I<esearch Workshop on R u r a l u r b a n Labor Market Interactions, Employment and Rural Devel- opment Division, Development Econoniics Department, lnternational Bank for Reconstruction and Development, Washington, D.C.
Scott, M.l:.G. (1972) R u r a l Urban Migration and the Urban Shadow Wage in Kenya. Internal publica- tion, Nuffield College, Oxford.
Segal, E.S. (1970) The Cultural Background of East African Urban Migration. Unpublished P11.D. dis- sertation, Department of Anthropology, Indiana University. Bloomington.
Sessional Paper on Employment (1973) Republic of Kenya, Nairobi. Setliuraman, S.V. (1976) The Urban Infornial Sector: Concept, Measurement and Policy. International
Labour Review 1 14:69.-81. Simmons, A.B., and R. Cardona (1972) Rural-Urban Migration: Whocomes, Who Stays, Who Returns'?
Tlie Case of Bogota, Colombia, 1929 - 1968. lnternational Migration Review 6: 166 - 18 1. Simnions. A., S. Diaz-Briquets, and A.A. Laquian (1977) Social Change and Internal Migration: A
Review of Research Findings from Africa, Asia and Latin America. International 1)evelopnient Research Centre, Ottawa.
Singer, I1.W.. and R. Jolly (1973) Unetiiployrnent in an African Setting: Lessons of the Employment Strategy Mission to Kenya. IDS Conirnunication 111, Institute of Development Studies, Univer- sity of Sussex, Brighton.
Singer, Il.W., and S.D. Reynolds (1974) Aspects of the Distribution of Income and Wealth in Kenya. Discussion Paper No. 4 1 , Institute of Development Studies, University of Sussex, Brighton.
Slater, C.C., er al. (1977) Kenism: A Systems Simulation of the Developing Kenyan Economy, 1970 1978. Westvicw Press. Boulder.
Soniers, G.G. (1967) The Returns to Geographic Mobility: A Symposium. Journal of Human Resources 2:427-430.
Somerset, A. (1973) Wlto Goes to Secondary S c h o ~ ~ l ? Efficiency, Equity and Relevance in Secondary School Selection. Discussion Paper No. 184, Institute for Developlnent Studies, University of Nairobi, Nairobi.
Southall, A.W. (1962) Population Movements in East Africa, in M.K. Barbour and R.M. Prothero (eds.), Essays on African Popuiation. Praeger, New York.
Spearc, A. (1971) A Cost-Benefit Model of Rural t o Urban Migration in Taiwan. Population Studies 25:117-130.
Stark, 0. (1976) Rural-to-Urban Migration and Some Economic Issues: A Review Utilising Findings of Surveys and Empirical Studies Covering the 1965 1975 Period. Working Paper No. 38, Popula- tion and Employlncnt Project, World Employinent Programme, lnternational Labour Organiza- tion, Geneva.
Statistics Division (1966) Kenya Population Census, 1962. Ministry of Econolnic Planning and Devel- opment, Nairobi.
Statistics Division (1971) Employment and Earnings: 1963 1967. Ministry of Finance and Planning, Nairobi.
Statistics Division (1972) Employment and Earnings in the Modern Sector: 1 9 6 8 1970. Ministry of Finance and Planning, Nairobi.
Steele, D. (1975) The Theory of the Dual Economy and African Entrepreneurship in Kenya. Journal of Developn~ent Studies 12: 18 3 8 .
Stiglitz, J.E. (1974) Wage Determination and Unemployment in LDC's. Quarterly Journal of Econom- ics 88: 194-227.
Stiglitz, J.E. (1976) The Structure of Labor Markets and Shadow Prices in LDC's. Paper prepared for the Research Workshop, Rural-Urban Labor Market Interactions, Employment and Rural Development Division, Development Economics Department, International Bank for Reconstruc- tion and Development, Washington, D.C.
Stren. R . ( 1 9 7 0 ) T h e tvo lu t ion o f Housing Policy in Kenya, in J . Hut ton (ed.), Urban ('hallenpe in Last Africa. l a s t African Publishing House, Nairobi.
Swynner ton. R.J.M. (1954) A Plan to Intensify the Development o f African Agriculture in Kenya. (iovernment Printer, Nairobi.
T e ~ n p l e , C;.P. (1974) Migration t o Jakar ta : Empirical Research for a Theory. Unpublished Ph.D. disser- ta t ion, Department o f Econo~n ics , University o f Wisconsin, Madison.
Thias. I l .H. , and M. Carnoy (1969) C o s t Benefit Analysis in Educat ion: A Case S tudy o n Kenya. International Bank for Reconstruction and [)evelopment, Washington, D.C.
Thorbecke. 1 . ( 1 9 7 3 ) T h e Employment Problem: A Critical Evaluation of I'our ILO Comprellrnsive Coun t ry Reports. lnternational Labour Review 107:393 423 .
Tobin. J . ( 1 9 7 2 ) Notes o n Search Une~np loymen t and Wage Ilifferentials. Working Paper No. 7 1 , Insti- t u t e for Development Studies, University of Nairobi, Nairobi.
Toda ro , M.P. (1969) A Model o f Labor Migration and Urban Unemployment ill Less 1)eveloped Coun- tries. American Economic Review 5 9 : 139 148 .
Toda ro , M.P. (1976a) Internal Migration in Developing Countries. International Labour Oif ice ,Geneva. Todaro. M.P. (1976b) Urban J o b Espansion, Induced Migration and R i ~ i n g L lne r~~p loymen t . Journal o f
Development Economics 3 :2 1 1 225 . Town Drift: Social and Policy Implications o f Rural- urban Migration in Eight Developing Countries
(1973) Working paper for the [:inn1 (:onference, Rural Urban Migrants and Metropolitan Devel- o p m e n t , sponsored by the International Association for Metropolitan Research and Development and the International Development Research Centre. Istanbul.
Udall, A.T. (1975) The Lf'fect o f Distance on Rural U r b a n Migration ill Colombia. Internal publica- t ion, Department o f Economics. University o f Delaware, Newark.
V a n d e r k a r ~ ~ p , J . ( 1976) T h e Role of Population Size in Migration Studies. Canadian Journal of Eco- nomics 9 : 5 0 8 5 1 7 .
Van Zwancnbcrg, R . 1 1 9 7 2 ~ ) T h e Agricultural History of Kenya to 1939 . East African Publisl~ing House, Nairobi.
Van Zwanenberg, R. ( 1972b) History and Theory of Urban Poverty in Nairobi: The Problem o f Slllrn Developn~ent . Discussion Paper No. 139 , Institute for Development Studies, Llniversity o f Nairobi. Nairobi.
Von Piscl~ke. J .D. ( 1 9 7 4 ) A Critical Survey of Approac l~es t o t h e Role o f Credit in Smallholders Devel- opmen t . Working Paper No. 145 , Institute for i levelopment Studies, l lniversity of Nairobi, Nairobi.
Wasow, B. (1973) Regional Inequality and Migration in Kenya: Some Indirect 1:vidence. Working Paper No. 125 , Ins t i tu te for Development Studies, University of Nairobi, Nairobi.
Webb. R . (1975) Income and E m p l o y n ~ e n t in t he Urban Traditional Sector in Peru. Internal publica- t ion. International Bank for Reconstruction and Development, Washington, D.C.
Weeks, J . (1973) Uneven Sectoral Ilevelopment and the Role of the Sta te . Bulletin, Institute o f Devel- opmen t Studies. University o f Sussex, Brighton.
Weeks, J . ( 1975) Policies for h p a n d i n g Employment in the Informal Urban Sector o f Developing Economies. International Labour Review 1 1 1 : 1 1 3 .
Weisner, T.S. (1972) One 17arnily, T w o Households: Rural-Urban Ties in Kenya. Unpublished Ph.D. dissertation, Depar tment of Social Anthropology, Harvard University, Cambridge.
Weisner, T.S. (1976) T h e Structure of Sociability: Urban Migration and Urban--Rural Ties in Kenya. Urban Anthropology 5 :199- 223.
Wiest, R.E. (1973) Wage-Labor Migration and the Household in a Mexican Town . Journal of Anthro- pological Research 2 9 : 180 209.
Wolf, E.R. (1966) Peasants. Prentice-Hall, Englewood Cliffs. Yap, L.Y.L. (1976) Rural- Urban Migration and Urban Unemployment in Brazil. Journal o f Develop-
men t Economics 3:227-243. Yap, L.Y.L. (1977) The At t ract ion o f Cities: A Review o f theMigrat ion 12iterature. Journal of Develop-
ment Economics 4:239-264. Young, C;. (1975) T h e Choice o f Dependent Variable for Cross-Section Studies o f Migration. Canadian
Journal o f Economics 8 : 9 3 100. Zucker, A. (1967) A Note o n the Declining Tendency with Age for Investment in I luman Capital. The
Journal o f Human Resources 2:538-540.


APPENDIXES

A THE SURVEY QUESTIONNAIRE
The questionnaires were available in both English and Swahili and the interviewers were free t o use the copy that they preferred. In most cases the interviewers came from the general area of the urban center in which they were interviewing. As a result, the inter- viewers were able to translate the questions into the local tribal language if the respondent could not understand either English or Swahili. There were only two or three cases where the interviewer could not converse directly with the respondent and he had to call o n a third person for assistance.
The questionnaires were developed with helpful comments from other members in the Institute for Development Studies. The initial questionnaire was tested prior to the survey. The supervisors were sent t o houses in Nairobi selected in the same manner as for the actual survey. On the basis of this pretest, several changes were made in the question- naire. First. the questions about members of the family were dropped since they were of limited relevance and the Inen seemed t o resent having their family counted. In addition, questions o n the personal characteristics of the migrants were moved t o the end of the questionnaire. This information was of secondary importance so this change enabled us t o obtain the essential information before the respondent lost interest in the interview. Also, the tables were included in the questionnaire to facilitate the recording of employment and income information. The pretest also provided helpful insights o n what to stress in the training of interviewers. Throughout, the term CHECKLIST indicates that the options listed were included t o facilitate recording the answer. These options were not t o be read to the respondent.

Confidential
SURVEY OF RURAL-TO-URBAN MIGRATION
. . . . . . . . . . . . . . . . . . . . . . . . . . . . . . . . . . . . Interviewer. Date. . . . . . . . . . . . .
. . . . . . . . . . . . . . . . . . . . . . . . . . . Urban centre
. . . . . . . . . . . . . . . . . . . . . . . . Building number.
. . . . . . . . . . . (If applicable) Flat (or room) number
FROM THE BUILDING INFORMATION SHEET FILL IN: (a) The number of men staying regularly in this (house, flat, room). . . . . . . . . . . . . . (b) The number of men in this (house, flat, room) who have come to. . . . . . . . . . . . .
. . . . . . . . . . . . . . . . . . . . . . . . . . . . after Uhuru (c) The number of men in this (house, flat, room) who came to . . . . . . . . . . . . . . . . in 1962 or 1963 . . . . . . . . . . . . . . . . . . . . . . . . .
First, I would like to ask some questions about where you have been living since Uhuru. 1. Where were you living at the time of Uhuru? Town or village. . . . . . . . . . . . . . . .
. . . . . . . . . . . . . . . . . . . . . . . . . . . . . in District ? 2. After Uhuru, when did you first come t o . . . . . . . . . . . . . . . . . . . . . . . . . . . . .
Month (approximate). . . . . . . . . . . . . . . . , 196. . . 3. Between the time of Uhuru and when you first came to . . . . . . . . . . . . . . . , did you live for a time (at least three months) in either Nairobi, Mombasa, Kisumu, Nakuru, Thika, Eldoret, Nanyuki or Nyeri? . . . .Yes . . . . No IF YES - (1) Urban centre . . . . . . . . . . . . . . .
from month . . . . . . . . . . . . . . ,196. . . to month. . . . . . . . . . . . . . . . ,196. . .
. . . . . . . . . . . . . . . (2) Urban centre from month . . . . . . . . . . . . . . ,196. . . to month. . . . . . . . . . . . . . . . ,196.. .
4. Since coming to . . . . . . . . . . . . . . . . . . . have there been times when you lived in another district or urban centre? (For at least three months) . . . . Yes . . . . NO
. . . . . . . . IF YES - (1 ) District or urban centre from month . . . . . . . . . . . . . . ,196. . . to month. . . . . . . . . . . . . . . . ,196. . . (2) District or urban centre . . . . . . . . from month . . . . . . . . . . . . . . ,196. . . to month . . . . . . . . . . . . . . . . ,196. . .
FOR FUTURE REFERENCE PURPOSES, FROM QUESTIONS 1,3,2 AND THEN 4, LIST THE RURAL-TO-URBAN MIGRATIONS IN THE ORDER IN WHICH THEY TOOK PLACE. 5. Migration From District To Urban Centre Date
1 196.. .
2 196.. .
Now I would like to ask a few questions about why you came to . . . . . . . . . . . . . . . . . and what you were expecting to find when you first arrived here. 6. What made you decide to leave the home you had in the district before you came
7 to . . . . . . . . . . . . . . . . . . . . . . . . . . . . . . . . . . . Anything else? (CHECKLIST - Use 7 to indicate his first response and 2 to indicate his second response)

. . . . (1) I could not find work where I was living before
. . . . (2) Land was not available so I had to go out to find work
. . . . (3) I was transferred by my employer (4) . . . . I could not get into school in my home areas
. . . . (5) I could not get my child into school there
. . . . (6) The schools were of very low standard there (7) . . . . There were no dancing places, cinemas, etc. there (8) . . . . Others (explain) . . . . . . . . . . . . . . . . . . . . . . . . . . . . . . . . . . . . . . .
7. Once you had decided to leave your previous home, why did you choose to come . . . . . . . . . . . . . to. ? (CHECKLIST- Use 1 and 2 as in 6 above)
(1 ) . . . . That was the place where I had the best chances of finding work (2) . . . . There are good schools here
. . . . (3) There are opportunities here to get into school (4) . . . . I wanted the opportunities for social life (dancing, cinemas, etc.) available
here (5) . . . . I was transferred here by my employer (6) . . . . I have relatives (friends) here (7) . . . . Others (explain) . . . . . . . . . . . . . . . . . . . . . . . . . . . . . . . . . . . . . . .
. . . . . . . . . . . . . . 8. In reaching your decision to come to. you must have had some information about job possibilities, income, living conditions, etc. in. . . . . . . . . . . . . . .
7 Which of the following gave you the most information about. . . . . . . . . . . . . . . . . . . . (Using 1, 2, and 3, rank the three most important)
(1) . . . . Newspapers (2) . . . . Radio (3) . . . . The Labour Exchange (4) . . . . Family members (5) . . . . Friends (6) . . . . School teacher (7) . . . . Career counsellor (8) . . . . Others (explain) . . . . . . . . . . . . . . . . . . . . . . . . . . . . . . . . . . . . . . .
. . . . . . . . . . . . . . 9. When you first arrived in. what type of work were you hoping . . . . . . . . . . . . . . . . . . . . . . . . . . . . . . . to get?
. . . . . . . . . . . . . . . 10. When you first arrived in. .how much income did you expect . . . . . . you could earn? Shs. per (monthlweeklday)
You are being very patient and helpful. Thank you very much. We now come to the most important part of this survey - the type of work you were doing before you moved to the city (or town), the type of work you were doing after you got there, and the income received in each case. Let us start with the first time you moved to a city (or town). (Questions 11 to 13 refer to migration 1 - see 0 . 5)
11. During the year before you moved to . . . . . . . . . . . . . . . .what were you doing? (Mark all that apply)
(1) . . . .Were you in school? (2) . . . . Were you employed for wages? ( I f yes, fill in category (a) in Table 1) (3) . . . .Were you in business for yourself (selling newspapers, shining shoes, or
running your own shop, etc.)? (If yes, fill in category (b) in Table 1) (4) . . . . Were you farming? (If yes, this will be covered in Questions 2 2 to 26) (5) . . . . Were you at any time employed only part-time such as doing casual (day)
labour ? (If yes, fill in category (c) in Table 1) (6) . . . .Were you totally unemployed for a time? (If yes, fill in category (d) in
Table 1) 12. During this year were you at any time staying in either your parents' house, a friend's house, or in a house provided by your employer? . . . . Yes . . . . No 13. IF YES - (a) From month. . . . . . ,196.. .
. . . . . . . . . . to month ,196.

TABLE 1 Job and Income History for the Twelve Months Prior to Migration 1
(a) Employed for wages Type of Starting wage Wages raised Housing From mon.196 ... To mon.196 ... work shs.lmon. to shs.lmon. allowance,
bonuses, etc. shs.lmon.
Job 1
Job 2
(61 Operating his own business Type of business Net income From mon.196 ... To mon.196 ... or trade shs.lvear
Business 1
Business 2
(cl Employed for wages on a part-time or casual basis Type of work Dayslweek Hourslday Wages From mon.196 ... To mon.196 ...
shs.ldav
Job 1 - - - -
Job 2
(dl Totally unemployed From mon.196 ... To mon.196 ...
Period 1
(el Miscellaneous income Shillings From mon.196 ... To mon.196 ...
Source 1
Source 2
(Check columns 6 and 7 to make sure the ful l twelve months have been accounted for.)
(b) Did you pay rent for staying there? . . . . Yes . . . . No (c) Did you get most of your meals there as well?
. . . . . . . . . . . . . . . . A few . . . . About half Most All None . . . . . . . . (d) Did you pay for these meals? Yes No
Now I would like to ask some questions about what you are doing at present here in . . . . . . . . . . . What type of work (if any) do you have? How long have you had this job? What were the starting wages you received? Was there a raise in wages? Is there a housing allow- ance, a bonus, etc., associated with this job? (What about before that, what were you doing? Etc.) (On the basis of questions such as these, fill in Table 2 for the full period of his current stay in . . . . . . . . . . . 1 14. When you first came to. . . . . . . . . . did you stay with a friend, a family member, or in a house provided by an employer? . . . . Yes . . . . No. ( I f yes, continue with 15 and 16. I f no, skip to 0. 17) 15. What job or business did he have? . . . . . . . . . . . . . . . . . . . . . . . . . . . . . . . . . ( If the host appears to be present omit 0. 16) 16. (a) How long did you stay there?
From month. . . . . . . . . . . . . . . . . . ,196. . . to month. . . . . . . . . . . . . . . . . . . . ,196.. . (b) Did you pay rent for staying there? . . . . Yes . . . . No
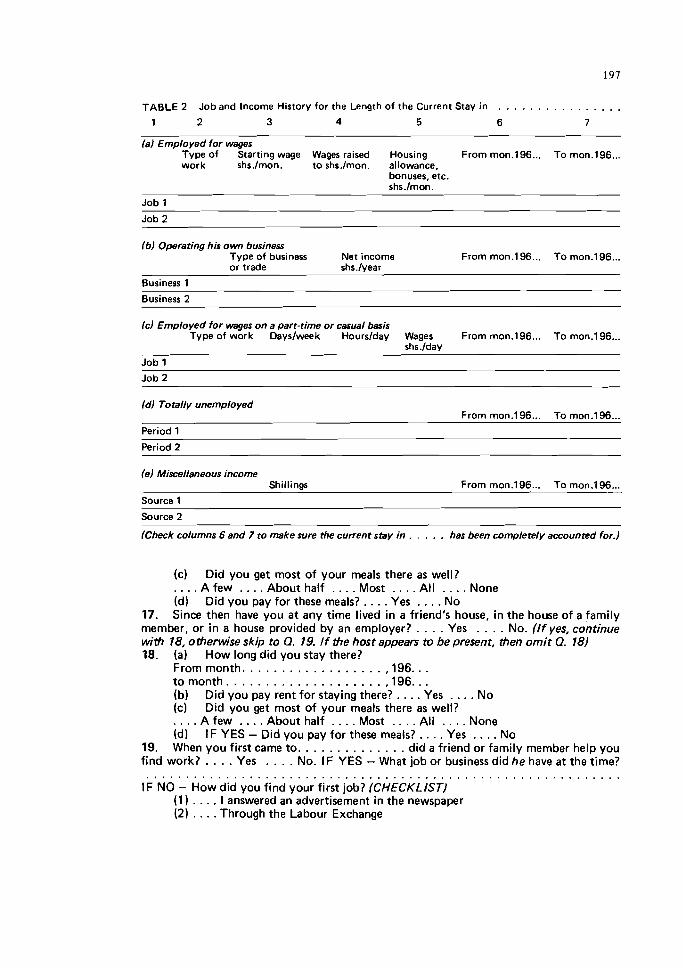
. . . . . . . . . . . . . . . . TABLE 2 Job and Income History for the Length of the Current Stay in
1 2 3 4 5 6 7
(a) Employed for wages Type of Starting wage Wages raised Housing From mon.196 ... To mon. 196 ... work shs.lmon. to shs.lmon. allowance,
bonuses, etc. shs./mon.
Job 1
Job 2
16) Operating his own business Type of business Net income or trade shs./vear
... From mon.196 To mon.196 ...
Business 1
Business 2
(c) Employed for wages on a part-time or casual baris ... ... Type of work Dayslweek Hourslday Wages From mon.196 To mon.196
shs./dav
Job 1
Job 2
M Totally unemployed ... From mon.196 To mon.196 ...
Period 1
Period 2
(el Miscellaneous income Shillinas
-
From mon.196 ... To mon.1 96 ... Source 1
Source 2
(Check columns 6 and 7 to make sure the current stay in . . . . . has been completely accounted for.)
(c) Did you get most of your meals there as well? . . . . . . . . . . . . . . . . A few . . . . About half Most All None
. . . . . . . . (d) Did you pay for these meals? Yes No 17. Since then have you at any time lived in a friend's house, in the house of a family member, or in a house provided by an employer? . . . . Yes . . . . No. (If yes, continue with 18, otherwise skip to 0. 19. If the host appears to be present, then omit 0. 18) 18. (a) How long did you stay there?
From month. . . . . . . . . . . . . . . . . . ,196.. . to month. . . . . . . . . . . . . . . . . . . . ,196. . .
. . . . . . . . (b) Did you pay rent for staying there? Yes No (c) Did you get most of your meals there as well?
. . . . . . . . . . . . . . . . A few . . . . About half Most All None . . . . . . . . (d) IF YES - Did you pay for these meals? Yes No
19. When you first came to. . . . . . . . . . . . . . did a friend or family member help you find work? . . . . Yes . . . . No. IF YES - What job or business did he have at the time? . . . . . . . . . . . . . . . . . . . . . . . . . . . . . . . . . . . . . . . . . . . . . . . . . . . . . . . . . . . .
IF NO - How did you find your first job? (CHECKLIST) (1 . . . . I answered an advertisement in the newspaper (2) . . . . Through the Labour Exchange
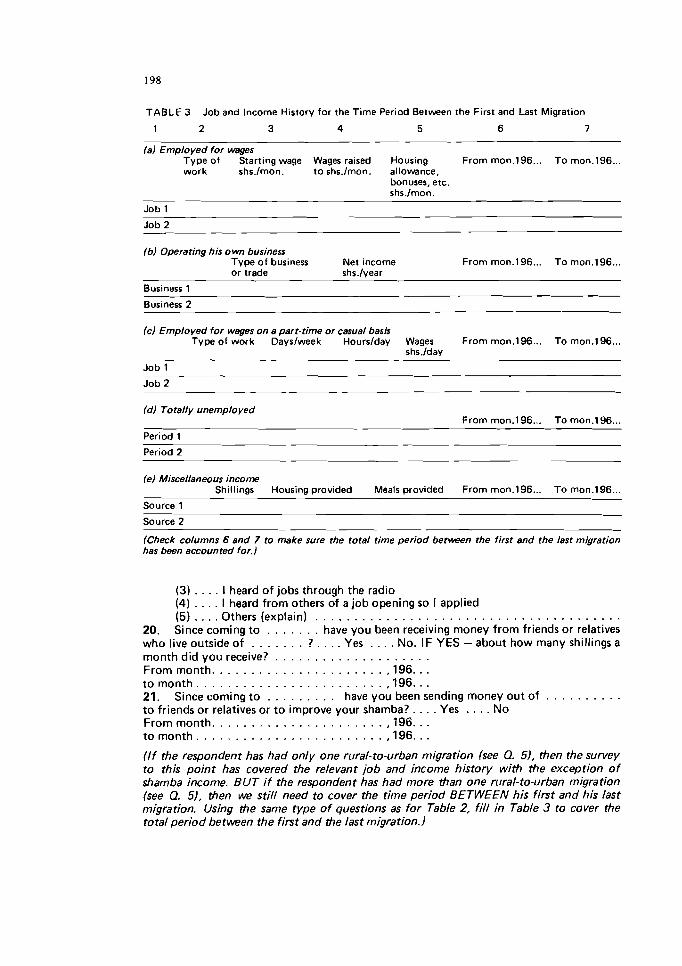
TABLE 3 Job and Income History for the Time Period Between the First and Last Migration
1 2 3 4 5 6 7
lal Employed for wages Type of Starting wage Wages raised Housing From mon.196 ... To mon.196 ... work shs.lmon. to shs.lmon. allowance,
bonuses, etc. shs.lmon.
Job 1
Job 2
(bl Operating his own business Type of business Net income From mon.196 ... To mon.196 ... or trade shs.lyear
Business 1
Business 2
Icl Employed for wages on a part-time or casual basis ... ... Type of work Dayslweek Hourslday Wages From mon.196 To mon.196
shs.lday
Job 1
Job 2
(dl Totally unemployed From mon.196 ... To mon.196 ...
Period 1
Period 2
(el Miscellaneous income Shillings Housing provided Meals provided From mon.196 ... To mon.196 ...
Source 1
Source 2
(Check columns 6 and 7 to make sure the total time period between the first and the last migration has been accounted for.)
(3) . . . . I heard of jobs through the radio (4) . . . . I heard from others of a job opening so I applied (5) . . . . Others (explain) . . . . . . . . . . . . . . . . . . . . . . . . . . . . . . . . . . . . . . .
20. Since coming to . . . . . . . have you been receiving money from friends or relatives who live outside of . . . . . . . ? . . . . Yes . . . . No. IF YES - about how many shillings a month did you receive? . . . . . . . . . . . . . . . . . . . . From month. . . . . . . . . . . . . . . . . . . . . . ,196.. .
. to month. . . . . . . . . . . . . . . . . . . . . . . . ,196.. 21. Since coming to . . . . . . . . . have you been sending money out of . . . . . . . to friends or relatives or to improve your shamba? . . . . Yes . . . . NO From month. . . . . . . . . . . . . . . . . . . . . . ,196.. . to month. . . . . . . . . . . . . . . . . . . . . . . . ,196. . . ( I f the respondent has had only one rural-to-urban migration (see 0. 51, then the survey to this point has covered the relevant job and income history with the exception of shamba income. BUT i f the respondent has had more than one rural-to-urban migration (see 0. 51, then we still need to cover the time period BETWEEN his first and his last migration. Using the same type of questions as for Table 2, fill in Table 3 to cover the total period between the first and the last migration.)
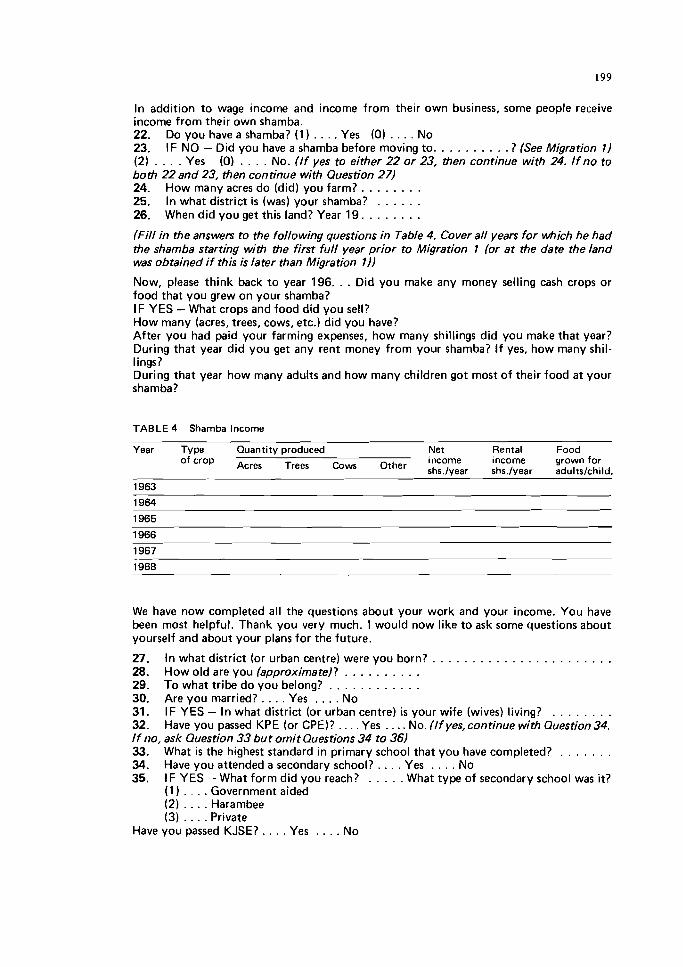
In addition to wage income and income from their own business, some people receive income from their own shamba. 22. Do you have a shamba? (1 ) . . . . Yes (0) . . . . No 23. IF NO - Did you have a shamba before moving to. . . . . . . . . . ? (See Migration 1) (2) . . . . Yes (0) . . . . No. ( I f yes to either 22 or 23, then continue with 24. I f no to both 22 and 23, then continue with Question 27) 24. How many acres do (did) you farm? . . . . . . . . 25. In what district i s (was) your shamba? . . . . . . 26. When did you get this land? Year 19. . . . . . . . (Fill in the answers to the following questions in Table 4. Cover all years for which he had the shamba starting with the first full year prior to Migration 1 (or at the date the land was obtained if this is later than Migration 1) )
Now, please think back to year 196. . . Did you make any money selling cash crops or food that you grew on your shamba? IF YES - What crops and food did you sell? How many (acres, trees, cows, etc.) did you have? After you had paid your farming expenses, how many shillings did you make that year? During that year did you get any rent money from your shamba? If yes, how many shil- lings? During that year how many adults and how many children got most of their food at your shamba?
TABLE 4 Shamba Income
Year Type Quantity produced Net Rental Food
Of Acres Trees Cows Other income income grown for shs./vear shs.1vear adultslchild.
We have now completed all the questions about your work and your income. You have been most helpful. Thank you very much. I would now like to ask some questions about yourself and about your plans for the future.
. . . . . . . . . . . . . . . . . . . . . . . 27. In what district (or urban centre) were you born? . . . . . . . . . . 28. How old are you (approximate)?
. . . . . . . . . . . . 29. To what tribe do you belong? . . . . . . . . 30. Are you married? Yes No
. . . . . . . . 31. IF YES - In what district (or urban centre) is your wife (wives) living? . . . . 32. Have you passed KPE (or CPE)? Yes .... No. ( I f yes, continue with Question 34.
I f no, ask Question 3 3 but omit Questions 34 to 36) . . . . . . . 33. What i s the highest standard in primary school that you have completed?
. . . . . . . . 34. Have you attended a secondary school? Yes No 35. IF YES - What form did you reach? . . . . . What type of secondary school was it?
(1 ) . . . . Government aided (2) . . . . Harambee (3) . . . . Private
. . . . . . . . Have you passed KJSE? Yes No
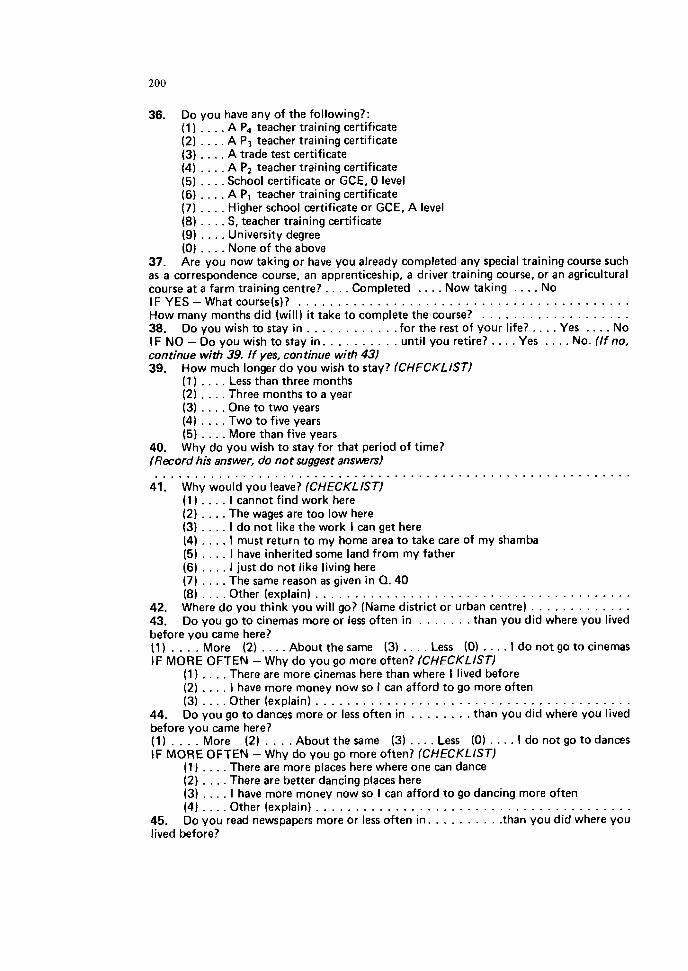
36. Do you have any of the following?: (1) . . . . A P, teacher training certificate (2) . . . . A P, teacher training certificate (3) . . . . A trade test certificate (4) . . . . A P2 teacher training certificate (5) . . . . School certificate or GCE, 0 level (6) . . . . A PI teacher training certificate (7) . . . . Higher school certificate or GCE, A level (8) . . . . S, teacher training certificate (9) . . . . University degree (0) . . . . None of the above
37. Are you now taking or have you already completed any special training course such as a correspondence course, an apprenticeship, a driver training course, or an agricultural course at a farm training centre? . . . . Completed . . . . Now taking . . . . No IF YES - What course(s)? . . . . . . . . . . . . . . . . . . . . . . . . . . . . . . . . . . . . . . . . . . How many months did (will) it take to complete the course? . . . . . . . . . . . . . . . . . . . 38. Do you wish to stay in . . . . . . . . . . . .for the rest of your life?. . . . Yes . . . . No IF NO - Do you wish to stay in. . . . . . . . . . until you retire?. . . . Yes . . . . No. (If no, continue with 39. If yes, continue with 43) 39. How much longer do you wish to stay? (CHECKLIST)
(1) . . . . Less than three months (2) . . . . Three months to a year (3) . . . . One to two years (4) . . . . Two to five years (5) . . . . More than five years
40. Why do you wish to stay for that period of time? (Record his answer, do not suggest answers) . . . . . . . . . . . . . . . . . . . . . . . . . . . . . . . . . . . . . . . . . . . . . . . . . . . . . . . . . . . .
41. Why would you leave? (CHECKLIST) (1 ) . . . . I cannot find work here (2) . . . . The wages are too low here (3) . . . . I do not like the work I can get here (4) . . . . I must return to my home area to take care of my shamba (5) . . . . I have inherited some land from my father (6) . . . . I just do not like living here (7) . . . . The same reason as given in Q. 40 (8) . . . . Other (explain) . . . . . . . . . . . . . . . . . . . . . . . . . . . . . . . . . . . . . . . .
42. Where do you think you will go? (Name district or urban centre) . . . . . . . . . . . . . 43. Do you go to cinemas more or less often in . . . . . . . than you did where you lived before you came here? ( I ) . . . . More (2) . . . . About the same (3) . . . . Less (0) . . . . I do not go to cinemas IF MORE OFTEN - Why do you go more often? (CHECKLIST)
(1) . . . . There are more cinemas here than where I lived before (2) . . . . I have more money now so I can afford to go more often (3) . . . . Other (explain) . . . . . . . . . . . . . . . . . . . . . . . . . . . . . . . . . . . . . . . .
44. Do you go to dances more or less often in . . . . . . . . than you did where you lived before you came here?
. . . . . . . . 1 . More (2) . . . . About the same (3) Less (0) I do not go to dances IF MORE OFTEN -Why do you go more often? (CHECKLIST)
(1 ) . . . . There are more places here where one can dance (2) . . . . There are better dancing places here (3) . . . . I have more money now so I can afford to go dancing more often (4) . . . . Other (explain) . . . . . . . . . . . . . . . . . . . . . . . . . . . . . . . . . . . . . . . .
. . . . . . . . 45. Do you read newspapers more or less often in. .than you did where you lived before?
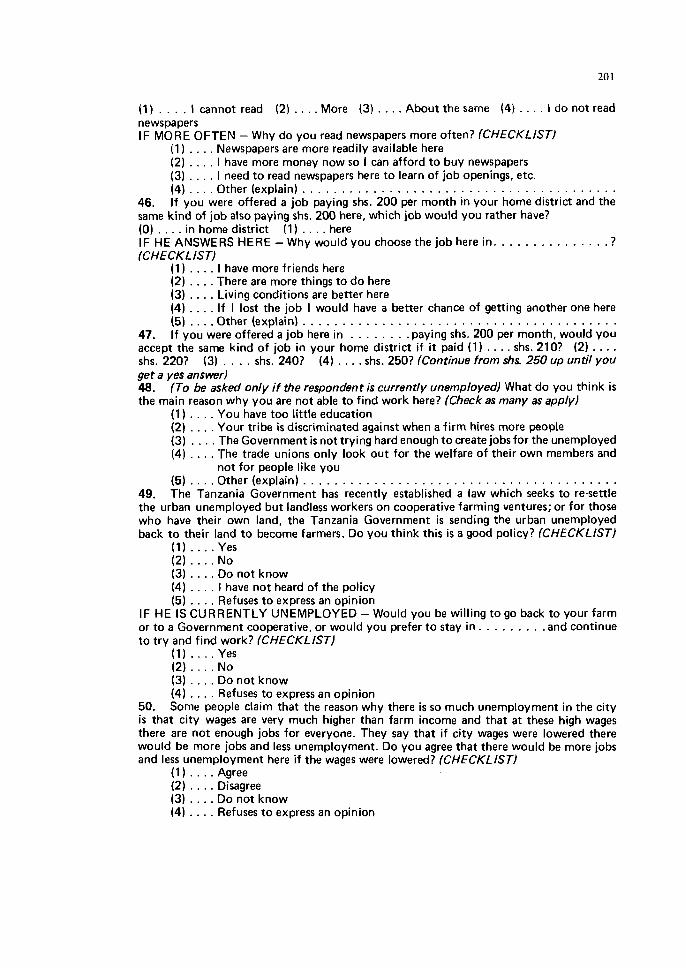
. . . . . . . . . . . . (1) . . . . l cannot read (2) More (3) About the same (4) l do not read newspapers IF MORE OFTEN - Why do you read newspapers more often? (CHECKLIST)
(1) . . . . Newspapers are more readily available here (2) . . . . I have more money now so I can afford to buy newspapers (3) . . . . I need to read newspapers here to learn of job openings, etc. (4) . . . . Other (explain) . . . . . . . . . . . . . . . . . . . . . . . . . . . . . . . . . . . . . . . .
46. If you were offered a job paying shs. 200 per month in your home district and the same kind of job also paying shs. 200 here, which job would you rather have?
. . . . (0) . . . . in home district (1) here . . . . . . . . . . . . . IF HE ANSWERS HERE -Why would you choose the job here in. . ?
(CHECKLIST) (1) . . . . I have more friends here (2) . . . . There are more things to do here
. . . . (3) Living conditions are better here (4) . . . . If I lost the job I would have a better chance of getting another one here (5) . . . . Other (explain) . . . . . . . . . . . . . . . . . . . . . . . . . . . . . . . . . . . . . . . .
47. If you were offered a job here in . . . . . . . .paying shs. 200 per month, would you accept the same kind of job in your home district if i t paid (1) . . . . shs. 210? (2) . . . .
. . . . shs. 2207 (3) . . . . shs. 240? (4) shs. 250? (Continue from shs. 250 up until you get a yes answer) 48. (To be asked only if the respondent is currently unemployed) What do you think i s the main reason why you are not able to find work here? (Check as many as apply)
(1) . . . . You have too little education (2) . . . . Your tribe is discriminated against when a firm hires more people (3) . . . . The Government i s not trying hard enough to create jobs for the unemployed (4) . . . . The trade unions only look out for the welfare of their own members and
not for people like you (5) . . . . Other (explain) . . . . . . . . . . . . . . . . . . . . . . . . . . . . . . . . . . . . . . . .
49. The Tanzania Government has recently established a law which seeks to re-settle the urban unemployed but landless workers on cooperative farming ventures; or for those who have their own land, the Tanzania Government i s sending the urban unemployed back to their land to become farmers. Do you think this i s a good policy? (CHECKLIST)
(1) . . . .Yes (2) . . . . No (3) . . . . Do not know (4) . . . . I have not heard of the policy (5) . . . . Refuses to express an opinion
IF HE IS CURRENTLY UNEMPLOYED -Would you be willing to go back to your farm or to a Government cooperative, or would you prefer to stay in. . . . . . . . .and continue to try and find work? (CHECKLIST)
(1) . . . . Yes (2) . . . . No (3) . . . . Do not know (4) . . . . Refuses to express an opinion
50. Some people claim that the reason why there is so much unemployment in the city i s that city wages are very much higher than farm income and that at these high wages there are not enough jobs for everyone. They say that if city wages were lowered there would be more jobs and less unemployment. Do you agree that there would be more jobs and less unemployment here if the wages were lowered? (CHECKLIST)
(1 ) . . . . Agree (2) . . . . Disagree (3) . . . . Do not know (4) . . . . Refuses to express an opinion

Thank you very much. You have been most helpful. Now I would like to ask a few ques- tions about your father and then we are finished.
. . . . . . . . 51. I s your father living? Yes NO. ( I f yes, continue with 52. If no, go to Question 57)
. . . . . . . . . . . . . . . . . . . 52. In what district (or urban centre) does your father live? . . . . . . . . 53. Does your father have a shamba? Yes NO. IF YES - How many acres of
land does he have? . . . . . . . . . . . . . . . . . . . . . . . 54. How did he get this land? (CHECKLIST)
(1) . . . . Inherited (2) . . . . Clan (3) . . . . Gift (4) . . . . Cleared (5) . . . . Consolidation (6) . . . . Rented (7) . . . . Purchased (8) . . . . Provided by his employer
. . . . . . . . . . . . . . . . . . . . . . . . . . . . . . . . . . . . . . . . (9) . . . . Other (explain) . . . . . . . . 55. IF APPLICABLE - I s this the same shamba as your shamba? Yes NO
. . . . . . . . 56. Does your father work for wages? Yes No. IF YES -What job does he . . . . . . . . have? . . . . . . . . . . . . Does your father have a business of his own? Yes NO.
IF YES - What type of business is it? . . . . . . . . . . . . . . . . . . . . . . . . . . . . . . . . . . . 57. What i s the highest standard (or form) in school that your father completed? . . . . .
. . . . . . . . . . . . . . . . . . . . . . . . . . . . . . . . . . . . . . . . . . . . . . Name of Respondent
IMPRESSIONS OF THE INTERVIEW
1. The respondent was: . . . . (1) Quite cooperative
(2) . . . . Neutral (3) . . . . Not very cooperative
2. The respondent: (1 ) . . . . Seemed to remember well and likely was giving accurate answers
. . . . (2) Had difficulty recalling the information desired from him (3) . . . . May not have been giving accurate answers
3. The interview lasted about . . . . . . . . minutes.
B THE RURAL-URBAN MIGRATION SURVEY
THE SURVEY
Purpose of the Survey
In order to carry ou t a statistical test of the migration model developed in Chapter 1 , i t was necessary t o obtain data on rural-urban migration flows and the expected income variables in both rural areas and the urban centers. In addition t o testing the migration model, there was interest in obtaining as much information as possible about the process of rural-to-urban migration in Kenya. For these purposes a survey was carried ou t in Kenya during December 1968. The questionnaire was administered by some 5 0 students from University College, Nairobi. Complete documentation of the sampling procedure, a descrip- tion of the survey, and a copy of all instruments used in the survey are included in Rempel (1 969).
The Sampling Technique
For sampling purposes, the relevant population included all the people who had migrated t o one of the urban centers in Kenya. For practical reasons, the scope of the sur- vey was limited t o a population of men ranging in age from 15 t o 5 0 who had migrated t o one of Kenya's eight largest urban centers since Kenya's independence (December 1963), and who were still resident in one of these urban centers. This restriction on the survey meant going without information about migrants who had returned t o a rural area. This omission was justified because it reduced considerably the cost of the survey and simplified the sampling procedure. The sample was restricted t o men because the migration flows in Kenya are dominated by males. Also, the migration decision-making model for women is probably more complex, ranging across a larger set of determining variables, given that women have more ready access t o the economic opportunities in the rural areas than they d o t o the available legal economic opportunities in the towns. Finally, limiting the survey t o men did not reduce the validity of the statistical test and enabled us t o use published sources of data which tend t o be limited t o men. A lower age limit of 15 was chosen because this is the break typically found in these data sources. The upper age limit was set deliberately o n the low side t o minimize the effect of the people retiring t o rural areas after a period of employment in an urban center. Kenya's independence was chosen as an obvious reference point t o which all the respondents would readily relate aseach attempted t o recall his migration, employment, and income history.
A critical decision for this study was the definition of the areas of origin and destina- tion. Again, both were defined in terms of what was practical, given the published data sources. Rural areas were defined in terms of Kenya's administrative districts because the
district was the only geographical unit for which the needed data were available. This type of definition proved reasonably acceptable since the most recent redistribution had been based on the distribution of the major ethnic groups.
The migration destinations were limited t o the nine urban centers that had more than 5.000 resident Africans according to the 1962 census. These nine centers are: Nairobi District, Mombasa Municipality, Kisumu Municipality. Nakuru Municipality, Eldoret Municipality, Thika Township, Nanyuki Township, Nyeri Township, and Kitale Munici- pality. Subsequently, Kitale was dropped because we were informed that growth after independence was limited to natural growth rates and, as a result, we would find little in- migration there.
The goal of the sampling procedure was t o select a t random a set of buildings in each of the eight urban centers and then t o interview the male in-migrants resident in each of these buildings. The selection of buildings was made on the most recent maps available for each of the urban centers. The preferred approach would have been t o select buildings within any one urban center in proportion to the distribution of the relevant population throughout the urban center. Since the required information o n the distribu- tion of the migrant population was not available, the existing information on the distribu- tion of the total population was used as a proxy. This proxy is appropriate, provided the average and the variance of the number of people per building are comparable in different areas of the urban center.
In the selection of buildings on a map, some stratification by types of housing was carried out where feasible in order to reduce the cost of the survey. In the majority of the areas involved in the sampling procedure, a table of random numbers was used in the selec- tion of individual buildings. The exceptions were in the category of temporary housing where actual buildings were not indicated on the map (e.g., Mathare Valley in Nairobi), or where the location of buildings would have made it very difficult t o identify a particular house as indicated on the map (e.g., the periurban area of Kisumu). In the latter cases the areas involved were divided into identifiable clusters of buildings; a cluster was selected at random, and then the interviewer was instructed to cover 20 houses in the approximate location of the selected cluster.
Using the approach of selecting buildings t o obtain a sample of migrants, there was a tendency t o miss migrants not residing in known buildings during December 1968. If there were migrants who had no residence and spent all of their time outdoors, then they were missed completely. An alternative situation was people residing in buildings not indicated on the map. In all cases where it was known that new buildings had been erected after the publication of the map, these buildings were incorporated into the sampling pro- cedure. In Nairobi, recent aerial photos were used for updating the maps. Some examples are Uhuru Estate in Nairobi and the new Municipal Council Housing in Thika. A more difficult problem was the unauthorized housing which did not appear o n the available maps. Although it was not possible t o incorporate all the small areas that exist throughout the urban centers, rather extensive sampling was carried out in known areas of unauthorized housing. T o our knowledge, there was adequate and representative sampling in the areas of unauthorized housing.
Although questions can be raised about the procedure of selecting buildings to obtain a sample of men, this procedure appears most suitable given the situation and has been used in other surveys (Mombasa Labor Force Survey in 1969 and the Ministry of
Economic Planning, Budget Survey in Nairobi in 1968). In the selection of buildings it was necessary in some cases t o make allowances for variations in the number of people resident in any one building. During the survey it was impossible to maintain an equal degree of coverage across all eight urban centers of the houses selected in each urban cen- ter, but we attempted t o maintain equal coverage throughout all parts of any urban center. As a result, the interviews should be viewed as eight separate samples. A systematic bias in the type of men who could not be located or who refused an interview was not apparent.
Administration of the Survey
In the actual administration of the survey we attempted t o maintain close super- vision over each interviewer's work t o minimize intentional o r unintentional errors in the way he conducted the interview and filled in the questionnaire. The work of each inter- viewer was checked daily by his supervisor t o ensure that the questionnaire was complete and the information internally consistent. The interviewers were paid a daily rate in an attempt t o emphasize quality rather than quantity of work. All except one supervisor were chosen from an upper-level seminar in economic development. The migration model was analyzed in the seminar to enable the supervisors t o gain some appreciation for the type of data needed. The interviewers were selected from the student body of University College, Nairobi. The vast majority of the students selected had previous survey experience (census enumerator, survey research with a Nairobi firm, or survey research with other faculty members at University College, Nairobi).
Throughout the planning and administration stages of the survey there was consider- able concern about the respondent's ability t o recall and his willingness t o relate his past migration and income history. Experience in other surveys conducted within the Institute for Development Studies, University College, Nairobi, indicated that people who are not used to storing information by writing it down have an amazing ability t o recall past details in their life. We attempted t o use obvious reference dates, such as Independence Day, as aids in recalling information. The questionnaire was designed t o move back from the respondent's present location and employment experience t o the time before and after his migration. The interviewers were asked t o record their impressions about how coopera- tive the respondent had been and whether he appeared t o be giving accurate information t o the best of his ability. Although we have not used these impressions in our analysis, most men appear t o have been quite willing t o cooperate in the survey. If there was a ten- dency t o overstate rural income or understate urban income, this will affect our results primarily if the misstatements were in the opposite direction or of varying proportions of rural or urban income.
On the basis of this survey, 1,091 regular questionnaires plus an additional 353 "short" questionnaires were completed. The questionnaire was designed t o cover up t o three urban in-migrations during the 5-year period under consideration. To the extent that there were multiple migrations, our sample includes some urban-to-urban migration. Com- bining this survey information on rural-to-urban and urban-to-urban migration with other published data, we obtain a matrix of information for 146 migration origin-destination pairs. In the pages that follow, a brief description is provided of the sample obtained in each center and a brief comment is made on the quality of the data obtained in the survey.
THE SAMPLE
In the selection of buildings on a map, some stratification by types of housing was carried out where feasible in order t o reduce the cost of the survey. (A list of the maps used in the survey and the sections withln each housing type in each urban center are listed in Rempel 1969, pp. 3 1 3 5 .) The six housing types were:
A. Highcost, low-density housing B. Medium-cost, medium-density housing C. Transitional area D. Lowcost , high-density housing E. Temporary housing F. Housing in a business section
Mombasa represents a rather major departure from the basic sampling technique because a recent, comprehensive map was not available. The Mombasa Town Planning Department of the Ministry of Lands and Settlement had recently completed a housing survey covering more than 20 percent of Mombasa's housing. This survey was based on a stratification of the different types of housing and provided detailed information on the population in each type of housing. As a result, a decision was made t o select our sample from within this housing survey sample, using the available information t o determine the number of buildings t o be selected in each type of housing.
Table B.l presents a summary of the number of migrants found in the selected build- ings within each housing type. Although the ratio of migrants to total men resident within a housing type tends to be higher in the high-cost, low-density and transitional areas, the majority of the migrants were located in the low-cost, high-density housing areas. The ratio of completed questionnaires t o known sample members was higher than 8 0 percent. The primary reason for not obtaining an interview was the inability to locate the particular respondent. Eighteen men refused t o grant an interview. Twenty-one completed question- naires had t o be rejected because the information provided was incomplete.
THE QUALITY OF THE DATA
It is not possible t o make direct comparisons between our results and results reported in other studies in Kenya because the population from which we were sampling was different from the population under consideration in these other studies. Nevertheless, the results obtained in our study appear to be "reasonable" when compared with the similar information available. For example, the Economic Survey of Central Province - 1963164 reports an average monthly income per household of KShs.294 in urban areas and KShs.138 in rural areas (Ministry of Economic Planning and Devleopment 1968, Table 80). These totals d o not vary substantially from our 1964 average expected income for the Kikuyu of KShs.244 and 178 per month. The Economic Survey, 1969 reports an average monthly earning of all employees ofKShs.322 (Central Bureau of Statistics 1969,Table 8.12). In his 1969 labor force survey of Mombasa, Hall reports a median income between KShs.3 11 and 6 0 0 per month and a mode between KShs.111 and 300 per month (Hall 1969, Table IX).
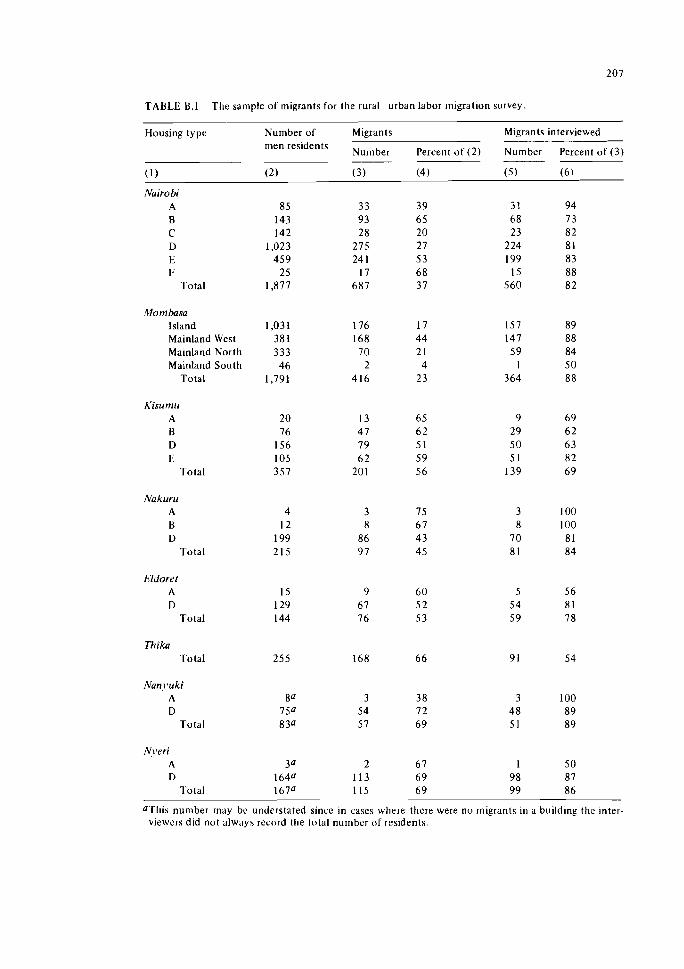
TABLE B.1 The sample of migrants for the rural urban labor ~nigration survey.
Housing type Number of Migrants Migrants interviewed men residents
Nurnber Percent of (2) Number Percent of (3)
(1) (2) (3) (4) (5) (6)
Nairobi A 8 5 33 3 9 3 1 94 B 143 93 6 5 6 8 7 3 C 142 2 8 20 23 8 2 D 1,023 275 27 2 24 8 1 E 459 24 1 5 3 199 83 1: 25 17 6 8 15 88
Total 1,877 687 37 560 8 2
Mombasa Island 1,031 176 17 157 89 Mainland West 381 168 44 147 88 Mainland North 333 7 0 2 1 5 9 84 Mainlaud South 46 2 4 1 5 0
Total 1,791 416 2 3 364 8 8
Kisumlr A 20 13 6 5 9 6 9 B 76 4 7 62 29 62 D 156 7 9 5 1 5 0 6 3 1: 105 6 2 5 9 5 1 8 2
Total 357 201 5 6 139 69
Nakuru A 4 3 7 5 3 100 B 12 8 67 8 100 D 199 86 4 3 7 0 8 1
Total 215 9 7 45 8 1 84
Eldore t A 15 9 6 0 5 5 6 D 129 6 7 5 2 54 8 1
Total 144 7 6 53 59 78
Thikn Total 255 168 6 6 9 1 54
Nanj3uki A 84 3 3 8 3 100 D 754 54 72 4 8 89
Total 8 30 57 69 5 1 89
1hveri A 3a 2 67 1 50 D 164a 113 6 9 98 87
Total 167O 115 6 9 99 86
a'rliis number rnay be understated since in cases wlirre thcrr were no migrants ill a building the inter- viewers did not always record the total number of residents.

These values compare reasonably well with our 1968 expected average monthly income for all tribes, other than Kikuyu and Luo, of KSlls.322. especially if we recognize that according t o Hall's sample, 7 6 percent of the labor force in Mombasa had always lived there.
An alternative check on the reliability of the survey is a comparison of the observed migration flows with the migration flows reported in the 1962 census and the 1969 census. Although comparison with the 1962 census is complicated by the changes in provincial boundaries, there does appear to be a very close correspondence between the survey migration flows and the migration flows reported in each census. The relative importance of each migration stream appears t o have remained fairly stable during the 1960s and the weighted sample, as used in this study, is a good representation of these flows.
REPORTS IN THE POPULATION, RESOURCES, AND GROWTH SERIES
Andrei Rogers. Migration. Urbanization, Resources, and Development. RR-77-14. Jacques Ledent, Comparative Dynamicsof Three Demographic Modelsof Urbanization. RR-80-1. Warren Sanderson, Economic-Demographic Simulation Models: A Review of Their Usefulness for Policy Analysis. RR-80-14. Allen Kelley and Jeffrey Williamson, Modeling Urbanization and Economic Growth. RR-80-22. Nathan Keyfitz, Do Cities Grow by Natural Increase or by Migration? RR-80-24. Reprinted from Geographical Analysis 12(2): 1 4 2 165. Zbigniew Pawlowski, A Demoeconometric Model of Poland and Its Application to Counter- factual Simulations. RK-80-35. Clark Reynolds, A Shift-Share Analysis of Regional and Sectoral Productivity Growth in Con- temporary Me\ico. RR-8041. Urban Karlstrom, Urbanization and Industrialization: Modeling Swedish Demoeconomic Devel- opment from 1870 to 1914. RR-8044 .


THE AUTHOR
Henrj* Rempel is an associate professor in the Ilepartment of Economics at the University of Manitoba, Winnipeg, Canada and was a visiting scholar in the Human Settlements and Services Area at IIASA. Professor Rempel graduated from the University of Manitoba in 1961 and received his M.A. in Economics (1 964) from Ohio State University; in 1971 he obtained his Ph.D. in Economics from the University of Manitoba. He has been a lecturer at Bluffton College (Ohio) and a research associate a t the University of Nairobi, Kenya.
