rural services survey 2013 - wales rural observatory services... · rural services survey 2013. 2...
TRANSCRIPT

1
Rural Services Survey
2013

2
CONTENTS
Outline of project 3
Methods 4
SECTION 1 Shops, Financial, Food and Drink 7 SECTION 2 Medical and Emergency Services 16 SECTION 3 Education and Day-care 18 SECTION 4 Places of worship, information and welfare 23 SECTION 5 Recreation Facilities and Community Activities 29 SECTION 6 Transport 33 SECTION 7 Community Recycling 36 SECTION 8 Concluding Remarks 39 APPENDICES 43

3
This report provides the results and analysis from a survey of rural services in Wales, conducted by the Wales Rural Observatory [WRO] in 2013. The 2013 survey is the fourth in a series, following the 2004, 2007 and 2010 services surveys. Following the pattern of the previous surveys, the spatial level of analysis was the Community or Town Council (henceforth ‘community’). Survey questionnaires were sent to the representative clerk of each community.
The 2013 survey explored: service provision within each community; changes in the levels of provision; perceptions of service levels; quality and accessibility of services; and problems experienced by different groups. Following this outline, the survey report is divided into the following sections: Methods 1. Retail, Food and Drink – including: permanent shops, post offices, farmers markets, food outlets, petrol stations, banks and buildings societies, and public houses. 2. Medical and Emergency Services – including: GP surgeries, dental surgeries, pharmacies, health centres, hospitals, ambulance, police, fire and rescue. 3. Education and Day Care – including: pre-school facilities, schools, and day-care services for the elderly or disabled. 4. Places of worship, information and Welfare – including: active places of worship, libraries, internet facilities, broadband, support services for
vulnerable groups and advice services, and ‘low level interventions’ (see the discussion at Section 4.3). 5. Recreation Facilities and Community Activities – including: meeting places, play areas, sports facilities and clubs or groups for the young or elderly. 6. Transport – including bus, train and community transport. 7. Community Recycling – bottle banks, clothes, paper, cans and plastic recycling. 8. Concluding remarks - Section Eight draws together the previous sections of the report to discuss the findings and to make some concluding remarks.
OUTLINE OF THE PROJECT

4
This section outlines the methods used to
conduct the 2013 survey. The research
framework remained broadly the same as
the 2010 survey.
Unit of analysis For statistical purposes, Wales can be entirely divided into communities, meaning that no parts of Wales are outside a community spatial unit1. These spatial units fit entirely within and change with unitary authorities. Around 84 per cent of communities (the spatial unit) in rural Wales have some form of council or council meetings.2 As a result there are officially-defined ‘communities’ in Wales for which no council exists. Communities with councils have similar powers to English parish councils and may also choose to call themselves town councils. Unlike parishes in England, communities as spatial units cover the whole of Wales. The population size of community and town council areas range from under the hundreds to tens of thousands. They cover approximately 94% of the land area and 70% of the population of Wales. All community and town councils in Wales were sent a questionnaire in English and Welsh, with a covering letter outlining the services research project, and emphasising the importance of the study. The covering letter also acknowledged the
1Further details can be found using the
following link:
http://www.ons.gov.uk/ons/guide-
method/geography/beginner-s-
guide/administrative/england/parishes-and-
communities/index.html
support for the project of One Voice Wales. This organisation is the representative body for Town and Community Councils in Wales and holds the definitive list of communities and the contact details of their representatives. Constructing the sample One Voice Wales helped to construct the mailing list of representative spokespersons, for both urban and rural communities. The first round of questionnaires was sent out in April 2013, with a reminder letter sent out in the following months. All returned questionnaires were further organised and combined with existing official statistics. As a result, survey responses were linked with community population size and rural classification. This research procedure is detailed further below. The questionnaire The questionnaire is shown in Appendix One, and the first letter together with the two reminder letters in Appendix Two. As in 2010, respondents could also participate using an online questionnaire available through the WRO website. 3 The questionnaire was designed to take approximately 30 minutes to complete. Questions were similar, in content and style, to those in the 2010 survey, to facilitate longitudinal analysis. However, the 2013 survey questionnaire contained several new questions.
3 Online completion was the preferred option
because it facilitates faster and less labour-intensive data input of questionnaire data to the ‘Statistical Package for Social Science’ [SPSS], for subsequent analysis.
METHODS

5
The response rate
The first step in carrying out the analysis was to identify the rural Community Councils to be included in the survey. It was decided to employ the RDP 2007-2013 classification of rural Wales4. Using this classification, 610 (83 per cent) of the total 735 communities in Wales were identified as rural. The response rate from these 610 rural communities was 379 (62 per cent).
Figure 1.1 is a map that shows the distribution of responses. From the map, it may be seen that there was a representative distribution of responses across rural Wales. This has been further verified by comparing the survey response rate to the cross section of all communities in Wales, according to population size. This showed that the survey response rate was not biased towards one particular
group1 and is similar to previous surveys.
Figure 1.1 Distribution of survey responses within Wales
4 Further details can be found by using the link
http://wales.gov.uk/topics/environmentcountry
side/farmingandcountryside/cap/ruraldevelop
ment/ruraldevelopmentplan4wales2007/?lang=
en
Presentation of the survey data
The survey findings are presented in each section using a series of tables and charts. Responses were linked to the Wales Rural Observatory’s GIS, which enabled some of the results to be visually represented on maps and also facilitates future comparison with other data. GIS methodology has made possible the analysis of service levels in terms of the population size of the communities, taken from the 2011 Census. The question of population distribution in the communities surveyed is an important one. Previous work conducted by the WRO found that particular services were more likely to be present in areas with higher population concentrations. Figure 1.2 displays the number of communities within particular population bands in Wales, and also in the surveyed communities. Clearly, a large proportion of those communities surveyed had populations below 500, and between 500-1000 people. In these Community Council areas, we might expect relatively low levels of service provision, beyond the most basic service facilities (shop, public house, post office, primary school).

6
The population distribution of communities is also shown in spatial terms at Appendix Three. This map clearly shows the concentration of communities containing fewer than 1,000 people throughout rural Wales. The spatial pattern of distribution is more apparent in mid and west Wales.
Figure 1.2 :Population of Town and Community Councils in Wales

7
1.1 Introduction This section explores the provision of services linked to retail, food and drink establishments in rural Wales. While the section covers shops (food and non-food), it also includes banks and building societies, post offices, food establishments and public houses. The analysis compares the presence of these types of services and facilities between communities. Survey responses are split according to the population size of each responding community. The findings are amalgamated and presented as a series of tables. This format of analysis is found throughout the report. 1.2 Headline Statistics – Shops, General Stores and Supermarkets The overall levels of provision of shops were as follows:
Shops selling food only (e.g. greengrocer, butchers): 63 per cent (62 per cent in 2010) did not have this service facility in their community;
Shops selling non-food only (e.g. clothes, furniture): 78 per cent (74 per cent in 2010) did not have this service facility in their community;
General stores: 49 per cent (46 per cent in 2010) did not have this service facility in their community; and
Supermarket: 90 per cent did not have this service facility in their community.
Approximately half of rural communities had had a general store. There was a large proportion of communities without a shop specifically for food or non-food items. Previous WRO
studies, such as the Deep Rural Project (2009) have shown that, under these circumstances, not only were local services less frequently used, because they tended to charge higher prices, but residents had to make longer journeys for many basic household items. The majority of surveyed communities did not have larger supermarkets and those that did tended to contain the largest populations. However, the availability of larger supermarkets also had the potential to negatively impact the viability of existing services in nearby communities, which was potentially problematic for communities that depended on these facilities. 1.2.1 Population analysis - Shops, General Stores and Supermarkets The following analysis looks more closely at the variations between communities with specific population levels. Tables 1.1 – 1.4 present this information.
Table 1.1 shows the proportion of
communities with at least one food or non
food shop varied between communities
with different population thresholds. In
2013, shops selling food tended to be
concentrated in councils with higher
populations. For example, only four per
cent of communities in the 0-399
population band had a food shop,
compared with 73 per cent of communities
with a population of over 3,999.
Shops selling non-food items also displayed a similar pattern. These tended to be concentrated in community councils in the higher population bands. Consequently, the proportion with this service decreased sharply in communities below the 1,000 threshold: with 27 per cent in the 1,000-1,999 population band,
SECTION 1 Shops, Financial, Food and Drink
DDDRDRDRINKNTRODUCTION

8
compared with eight per cent in the 700-999 population band. This represented the highest level of provision in communities with fewer than 1,000 people.
Table 1.1: Proportion of communities with a food only and non-food shop
Community Population Size
0-399
400-499
500-599
600-699
700-999
1,000-1,999
2,000-3,999
4,000 +
Total
% % % % % % % % %
One or more food shop 3 16 28 30 30 45 63 73 37 One or more non-food shop 3 2 7 7 8 27 49 65 22
General stores were less limited in availability than other shop types. A similar trend to the previous table (Table 1.1) was seen in general stores (Table 1.2); the larger communities were more likely to have this service. Despite general stores not being abundant in the least populated communities, they were more likely to be found than other types of shop.
Table 1.2 also shows that few communities had a supermarket. However, over half (51 per cent) of communities with a population exceeding 3,999 had this service. The proportion of communities with a supermarket was much lower below this community population size.
Table 1.2: Proportion of communities with a General Store (selling food and non-food items)
Community Population Size
0-399
400-499
500-599
600-699
700-999
1,000-1,999
2,000-3,999
4,000 +
Total
% % % % % % % % %
One or more general store 14 18 34 26 42 69 81 86 51
One or more supermarket 0 2 0 4 2 7 19 54 10
1.2.2 Change in provision since 2010 – Retail Community representatives were also asked how service levels had changed since 2010, which enabled an assessment of short term fluctuation in provision. Although providing a useful yardstick to assess change in provision, it is important to consider these responses with regard to existing provision. Some community clerks reported that their community had undergone no change in provision between 2010 and 2013. However, this result could potentially equate to the community continuing with
low or zero level of service provision. It is therefore useful to focus on the increase and decrease aspects to indicate a short term improvement or worsening of service levels. With regard to retail, 67 per cent of community clerks considered that provision had remained the same. Looking more closely at respondents additional comments revealed that in some communities, the number of retail facilities remained the same but the type of service offered had changed; while in other cases food shops were replaced by other shops, such as charity shops.

9
Issues relating to reduced opening hours, relatively high prices and limited choice, were also frequently noted. A link between retail and tourism in some communities was also implied by respondents, in that with shops geared to the tourist trade, any reduction in tourism led to reduced stock and choice.
Others noted that despite retail provision remaining the same in their community, reduced levels in surrounding communities had the potential to increase already lengthy journey times to reach such services. Increased travel time was noted as being increasingly problematic for those less mobile in the community. In addition, when retail services moved further away from communities, it could also have financial implications for residents in terms of increased travel. More than one in four community clerks (26 per cent) suggested permanent shops had decreased in their community since 2010, sometimes due to a decline in local support. Only six per cent reported an increase. Some of these increases had resulted from community led initiatives. 1.3 Headline Statistics – Post Offices
While post offices are routinely perceived to be ‘the centre of a rural community’ and a key service in rural areas5, the number of post offices in the UK has declined. The survey confirmed this decline. It showed that 43 per cent of communities in rural Wales had a post office. This compared with 52 per cent in the previous survey (conducted in 2010), and 70 per cent in 2004, which represents a steep decline over the life of the survey. The post office is widely seen as a key service, helping to reduce isolation and
5 Many survey respondents commented on the
social function of the post office, in addition 82% of people in Deep Rural Wales found the service to be essential. A simple Internet search will provide a multitude of additional examples (e.g. WLGA Manifesto for rural Wales, 2011).
supporting the provision of retail opportunities, in addition to its role in postal services, bill payments to government services, and banking and financial services. Consequently, the elderly population are among those who may be disproportionably impacted by this type of service reconfiguration. It is important to note that recent WRO research (Business Survey, Household Survey and Young People – all 2013) indicates that rural Wales has an increasingly ageing population. Wales also has a slightly higher proportion of residents of retirement age (65 and over), at 18.4 per cent compared to 16.5 per cent for the UK. The proportion of residents in Wales aged 65 has been steadily increasing over the last century. One in six residents in the population was 65 and over in 2011. By comparison, in 2001 only one in twenty residents was aged 65 and over (ONS, 2012a).
The rural authorities in Wales meanwhile, have a larger share of residents in the retirement age category (65 and over) compared to the rest of Wales – just over a fifth (21.7 per cent) of the rural population in Wales are aged 65. Recent developments in communications technology such as the widespread use of e-mail, the direct payment of state benefits, and the provision of online services for banking and other retail activities have resulted in a reduction of customers to the post office branch network. To address these issues the UK government implemented the Network Change Programme to modernise the Post Office network. Over an 18 month period commencing in October 2007, across the UK, approximately 2,500 branches were closed, with more than 500 of them replaced by outreach services. Evidence of these activities and the reduced opening hours and services offered was noted in the survey. 6
6 The recent privatisation of Royal Mail, which
severed the link between it and the post office

10
1.3.1 Population analysis – Post offices Table 1.3 clearly shows that as community population size increased, so did the likelihood of post office availability in rural Wales. Communities with populations of 1,000 and above were more likely to have a post office situated in their local area than those with fewer people.
network, potentially threatens the future
viability of post offices.

11
Table 1.3: Proportion of communities with a Post Office
Community Population Size
0-399
400-499
500-599
600-699
700-999
1,000-1,999
2,000-3,999
4,000 +
Total
% % % % % % % % %
One or more post office 25 25 45 26 47 76 84 95 57
1.3.2 Change in provision since 2010 – Post offices
While in three out of four communities the number of post offices had remained unchanged, 24 per cent of respondents observed that the number of post offices had decreased in their community since 2010, and there was concern about imminent and future closures. It is also important to keep in mind that although the level of provision might have remained the same, this did not necessarily mean that the range of facilities available within each post office was unchanged or that opening hours were unaffected. For example the following points were made by community representatives, “Dedicated post office closed and facility relocated to general stores” (Pop. 1,000-1,999) “Old Post Office closed following transfer
of the counter to the local Spar.” (700-999) “Mobile post office service provided two days per week to some areas.” (0-399) “Our post office is a satellite within the Methodist Church. Open one morning and one afternoon a week.” (1,000-1,999). Only two per cent of community clerks reported an increase in post offices in their local area.
1.4 Headline Statistics – Eating Establishments In rural Wales, many eating establishments are largely dependent on tourist trade7 and have seasonal or restricted opening hours.
Restaurants – 65 per cent did not have this service facility in their community o 26 per cent of restaurants
were seasonal
Café – 62 per cent did not have this service facility in their community o 38 per cent of cafés were
seasonal
Takeaway – 67 per cent did not have this service facility in their community o 21 per cent of takeaways
were seasonal Few communities had an eating establishment that opened all year round. Overall, 35 per cent of responding communities had a restaurant, 30 per cent had a café, and 30 per cent had a takeaway.
7
http://wales.gov.uk/topics/tourism/develop
mentl1/food/?lang=en

12
1.4.1 Population analysis - Eating Establishments
Tables 1.4, 1.5 and 1.6 show the proportion of community council areas with a restaurant, café or takeaway. Although restaurants were the most common type of eating establishment in rural Wales, the service levels decreased
relative to the size of population. Similarly to the other types of eating establishments, restaurants tended to be concentrated in communities with populations over 1,999. Takeaway venues were least likely to be found in smaller communities (fewer than 1,000 people).
Table 1.4: Proportion of communities with an eating establishment open all year
Community Population Size
0-399
400-499
500-599
600-699
700-999
1,000-1,999
2,000-3,999
4,000 +
Total
% % % % % % % % %
One or more restaurant 11 16 24 30 30 40 56 68 35
One or more café 14 9 10 22 21 34 44 76 30
One or more take- away 8 7 10 15 14 38 65 70 30
1.5 Headline Statistics – Farmers Market
Farmers market – 84 per cent did not have this service facility in their community
Existing farmers markets were most likely to be held on a monthly basis (in 27 of the 60 communities), however, 25 communities held them more frequently.
1.6 Headline Statistics – Banks and Building Societies Banks and building societies have become strongly associated with urban parts of the country due to the effects of the rationalization and centralization of financial services. A consequence of these service changes is that banks and building societies have tended to disappear from rural villages. Increases in Internet banking and the 2008 financial crisis have had the potential to reinforce this effect. In addition, there has been streamlining of
the post office network (evidence of this in rural Wales can be found at section 1.3.2), which could affect the proportion of facilities offering banking services for those claiming benefits or with savings. Some banks now provide outreach banking facilities for the more remote communities and some basic banking services can be provided by cash machines.
Bank or building society – 83 per cent did not have this service facility in their community
1.6.1 Population analysis - Banks and Building Societies Headline statistics show that substantial proportions of the total communities in rural Wales were without a bank or building society in 2013. Figure 1.3 clearly demonstrates the centralisation of banks and building societies, showing that only communities with a population size over

13
1,999 had above average provision for rural Wales. Communities with 4,000 people or more contained the majority of banks in rural Wales. However, banks
and building societies were most likely to be part-time.
Figure 1.3 - Proportion of communities with a bank or building society
1.6.2 Change in provision since 2010 – Banks and building societies
Just under a quarter (23 per cent) of community councils reported that the number of banks and building societies had decreased in their local area since 2010, while 77 per cent of communities had witnessed no change in provision. In the majority of cases this represented a continuation of low service levels, as there were few communities that contained these services in 2010. There were no communities in the survey that reported an increase in these facilities. 1.7 Headline Statistics – Public Houses
Public houses can provide essential services beyond the usual drinks, food and entertainment. The importance of the public house as a service in rural areas has been recognized
by the implementation of the ‘Pub is the Hub’ project, which has been operational in Wales for several years. This project provides advice to rural pubs and licensees who are thinking of broadening their range of services. The ‘Pub is the Hub’ project suggests that pubs are often the centre or hub of community life.
Public house –16 per cent did not have this service facility in their community area (8 per cent in 2004).
Almost three out of every four public houses (73 per cent) served meals.
1.7.1 Population analysis - Public Houses Pubs serving meals were fairly well represented across all population bands in Welsh rural communities (Table 1.7). The overall distribution of pubs is shown in Figure 1.4. Clearly, communities with

14
fewer than 400 people were much less likely to contain a pub when compared with other communities in rural Wales.
Table 1.7: Proportion of communities with a pub (serving meals)
Community Population Size
0-399
400-499
500-599
600-699
700-999
1,000-1,999
2,000-3,999
4,000 +
Total
% % % % % % % % %
One or more pub (serving meals) 44 70 69 78 79 88 84 89 78
Figure 1.4 Proportion of communities with a pub (either with or without meals)
1.8 Headline Statistics – Petrol Stations with shops For some smaller communities a shop attached to a petrol station can be the only service in the community. As noted in previous Rural Services Survey reports, in addition to their primary role of providing fuel for private or commercial transport, most petrol stations had shops selling convenience items, such as newspapers and confectionery. Many petrol stations sold a wider range of goods, including basic foods.
Petrol stations – 71 per cent did not have this service in their community area
1.8.1 Population analysis – Petrol stations
The customer base of petrol stations tends not to be confined to the immediate vicinity. Many customers are longer distance travellers, passing through a locality. Consequently, it is generally more important to locate a petrol station on a main transport route or close to a larger population base rather than in a smaller rural settlement. This is reflected in Figure

15
1.5, which shows the proportion of communities with a petrol station
Figure 1.5 Proportion of communities with a Petrol Station (containing a shop)
1.9 Perceptions of General Retail Provision
The community clerk of each council was asked to make an overall assessment of retail provision in their local area. At 46 per cent the highest proportion rated retail provision as adequate; 13 per cent considered general retail provision to be good; and the remaining 41 per cent of respondents rated it as bad. Each community clerk was asked to provide further comments on retail provision. Problems declared generally related to the lack of shops in a community, the types of shops available, and, more broadly, to the state of the national economy.
The rates of provision in rural Wales for banks, building societies and post offices, and, more particularly, for retail outlets such as shops, public houses and restaurants, had not improved since the 2010 Services survey. In many cases, rates of provision had declined. This evidence pointed to a struggling rural economy. Perceptions of a rural economy
still suffering the effects of recession are supported by the evidence from the 2013 WRO Rural Business survey.

16
Taking together the importance of medical services and the efficiency criterion of an adequate population base or catchment area, one might expect that these types of services would tend to be based in the main settlement areas of rural Wales. This section examines the levels of provision in rural Wales of GP surgeries, health centres, hospitals, dental surgeries and pharmacies. Respondents were also asked to assess the quality of services and emergency service provision. 2.1 Headline Statistics – Medical Services
GP – 70 per cent did not have this service facility in their community
Dental practice – 84 per cent did not have this service facility in their community. There were slightly more NHS dentists than private practices.
Pharmacy – 73 per cent did not have this service facility in their community
Health Centre – 82 per cent did not have this service facility in their community
Hospital (of any type) – over 93 per cent did not have this service facility in their community
Hospital (A&E/Acute) – 97 per cent did not have this service facility in their community, or in an adjacent community, or town council. The average distance for these communities to an A & E or Acute hospital was 18 miles.
Community Hospital – 95 per cent did not have this service facility in their community or in an adjacent community or town council. The average distance for these communities to a
community hospital was 11 miles.
Half of respondents perceived the ambulance service as good or very good service in the local area.
Of the other emergency services, the police received the worse ratings whereas fire and rescue services came out top.
2.2 Population analysis – Medical Services A concentration of medical services in communities with larger populations is apparent from Table 2.1. GPs, dentists, health centres and pharmacies all had below average provision in communities with fewer than 1,000 people.
SECTION 2 Medical and Emergency Services

17
Table 2.1: Proportion of communities with medical services
Community Population Size
0-399
400-499
500-599
600-699
700-999
1,000-1,999
2,000-3,999
4,000 +
Total
% % % % % % % % %
One or more GP 0 5 7 11 12 38 65 95 30
One or more Dentist 0 5 0 7 3 14 28 81 16
One or more Health centre 0 5 7 7 11 16 30 68 18
One or more Pharmacy 0 7 3 11 15 30 53 89 27
One or more Hospital 0 5 3 4 3 2 7 41 7
2.3 Change in provision since 2010 – Medical Services Overall medical service provision remained stable with over 90 per cent of communities having the same number of GPs, dentists, health centres, pharmacies, and hospitals as in 2010. Consequently, many communities remained remote from medical services. Many respondents observed that although there was apparent stability, the functionality of existing facilities had changed. For example, services might now have had reduced or limited opening times and long waiting lists. In addition, stability meant that many communities had no local services and that those available were ‘distant’. This meant that in comparison to people living in larger settlements, for many rural residents a premium was added to the misfortune of being ill, due to travel costs. For some communities, increasing tourism in the area had the unforeseen result of making medical services difficult to access, especially at certain times of the year. Another problem noted was the vulnerability of communities that were remote from medical services, but still reliant on the specialist services offered. Given the ageing population of rural Wales there is likely to be an increasing demand
for medical services. Small local changes to the range of services offered could have wide ranging ramifications for peripheral communities in other parts of Wales. Removal of specialist units and reduced opening hours were examples of change that could be masked if broad headline figures are considered in isolation. Despite not being specifically explored within the survey, respondents identified the Air Ambulance service as an important, if not vital, service in rural Wales.

18
3.1 Headline Statistics – Groups for children Given that in the modern economic climate, many mothers with school-age and younger children choose to engage in paid work8 the provision of childcare services is seen to be important.
Nursery – 51 per cent (was 73 per cent in 2010) did not have this service facility in their community
Parent and toddler/ Playgroups – 39 per cent did not have this service facility in their community
Out of school groups – 49 per cent did not have this service facility in their community
Nursery provision had increased substantially since 2010. Now almost half (49 per cent) of rural communities had a nursery. A similar proportion of communities reported running out-of- school groups. Approximately three-out- of-five communities had playgroups. 9 3.1.1 Population analysis – Groups for children Despite the general growth of childcare provision, the majority of communities in rural Wales below the 1,000 population
8 Further details refer to -
http://www.nomisweb.co.uk/articles/ref/stories/3/Mother%20story.pdf 9 This growth may follow the Childcare Act
2006, which requires all Local Authorities to secure sufficient childcare for working parents. Since 2007 Local Authorities have had to measure the supply and demand for different types of childcare and to increase provision where necessary.
threshold had no nursery provision, which could have social (and economic) implications for the families in these locations. Figure 3.1 displays the proportion of communities with nurseries.
SECTION 3 Education and Day-care

19
Figure 3.1: Proportion of communities with a nursery
Playgroups and out-of-school groups had a similar distribution to that shown at Figure 3.1. 3.1.2 Change in provision since 2010 – Groups for children The majority of communities (88 per cent) stated that since 2010 there had been no change in the number of facilities. A similar proportion of communities perceived no change either in play groups or out of school activities (87 per cent and 86 per cent respectively). 3.2 Headline Statistics – Schools
The comments made in the 2010 report regarding the importance of schools to rural communities still pertained. That is, as other WRO work such as the ‘Deep Rural Localities’ report has revealed, the school is seen by many rural residents as a key institution in rural communities. It is argued that the loss of a school can lead to excessive travelling and over-long days for children who have to travel to more distant schools, together with transport issues for their families. In terms of the sustainability of rural communities the
school is seen as a focal point for the community and as an attractor for potential in-movers.
Primary School – 30 per cent did not have this service facility in their community
Secondary School – 88 per cent did not have this service facility in their community
Sixth Form or Further Education College – 94 per cent did not have this service facility in their community
There had been a decline in the provision of schools since 2010. Primary schools provision was down by five percentage points: secondary schools by three percentage points; and sixth form colleges by seven percentage points. Education facilities for the higher age groups continued to be found only in the minority of communities. 3.2.1 Population analysis – Schools The majority of communities were well served by primary schools (ages 5-11),

20
with seven in every ten reporting that they had at least primary school provision - see Table 3.3. In population bands above 400 people, over half of communities had a primary school.
Table 3.3: Proportion of communities with a Primary School
Community Population Size
0-399
400-499
500-599
600-699
700-999
1,000-1,999
2,000-3,999
4,000 +
Total
% % % % % % % % %
One or more Primary School 28 50 62 56 62 85 98 100 70
One or more Secondary School 0 2 0 4 2 9 28 59 12
One or more Sixth Form or Further Education College 0 0 0 0 2 3 12 41 6
Unsurprisingly, the proportion of communities with schools for older age groups was a function of population size. Communities in the higher population bands had the highest levels of provision: e.g. 59 per cent of communities had a secondary school in the 4,000+ band, compared with the rural average of 12 per cent. 3.2.2 Change in provision since 2010 – Schools There were few changes in the rates of school provision. For each school age group, in excess of 86 per cent of respondents reported that the number of schools had remained the same in their community. At 14 per cent, primary schools were the only school type reported to have decreased by more than three percentage points. A total of only two communities reported an increase in primary schools.
3.3 Perceptions of Education Provision As in 2010, perceptions of the amount of school provision were positive. Over half (51 per cent) rated the level of provision as good, while only six per cent rated it as bad. The remaining 43 per cent of community clerks perceived adequate levels of provision. A number of respondents from smaller communities pointed out that nearby schools were used as there was no service in their own community. In other cases, school reorganization and closure, or the threat of these was seen as a problem.
3.4 Headline Statistics – Day-care
Groups for people with disabilities – 91 per cent did not have this service facility in their community
Groups for the elderly – 82 per cent did not have this service facility in their community

21
3.4.1 Population analysis – Day-care As the headline statistics indicate, the provision of day-care groups for the elderly and the disabled was minimal in rural communities. Provision continued to be correlated with the population size of the community. The highest levels of
provision were in the 4,000+ population band (see Figures 3.3 and 3.4).
Figure 3.3: Proportion of communities with a group for the elderly
Figure 3.4: Proportion of communities with a group for people with disabilities

22
3.4.2 Change in provision since 2010 – Day-care Nine per cent of respondents indicated that provision of groups for the elderly had decreased since 2010. Four per cent observed a decrease in groups for people with disabilities. A total of only five communities reported any increase in these types of facilities. High proportions stated that the provision of groups had stayed at the same low level for the elderly (90 per cent) and for people with disabilities (96 per cent). 3.4.3 Perceptions of Day-care Day-care facilities were not rated highly by respondents. Half of respondents considered day-care provision to be adequate; 15 per cent rated day-care facilities as good; and 35 per cent rated them as bad.

23
This section examines welfare provision in a broad sense. Formal interventions such as community wardens, luncheon clubs, handy person/repair schemes, and befriending are examined together with places of worship and different types of ‘low level interventions’: i.e. services that delay or prevent people in communities needing more formal interventions – see the discussion below at 4.3. The section also explores the availability of facilities that enable communities to access information, libraries and the availability and quality of the internet and broadband. 4.1 Headline Statistics – Places of worship
Places of worship – At 94 per cent almost all communities contained an active place of worship.
Nearly a quarter of communities contained a place of worship that was used for
public meetings: 24 per cent were used for arts and music; 11 per cent for school assemblies; 39 per cent had no other use; but 13 per cent of respondents were unaware of how the facilities were used.
Other uses included tea and coffee shops, community lunches, flower shows, mother and toddler groups, concerts, youth groups, fitness activities, choir practice, and foodbanks.
Clearly, places of worship were common in rural communities; over a fifth of communities had two or three places of worship. As Figure 4.1 shows, greater proportions had two, three or four places of worship than had only one. In addition to being a place of worship, 47 per cent of respondents observed that these facilities were being utilised for additional activities, such as for arts and music, public meetings and school assemblies.
Figure 4.1 Number of places of worship in each rural community
SECTION 4 Places of Worship, Information and Welfare

24
Most (82 per cent) respondents reported that the number of places of worship in the community had stayed the same since 2010, whereas 18 per cent reported that levels of provision had decreased. In only one community was an increase in provision reported. 4.2. Headline Statistics – Libraries and information services
Permanent Libraries – 79 per cent did not have this service facility in their community
Mobile Libraries – 38 per cent did not have this service facility
Public/Council Noticeboard – 14 per cent did not have this facility
Community Newsletter – 42 per cent (35 per cent in 2010) did not have this service facility in their community
Community Internet facility – 73 per cent did not have this service facility. Places where these facilities were located included permanent libraries, community centres, village halls,
church/chapels, cafes, pubs, post offices and shops. Community internet provision appeared to be reliant on communities initially containing these types of buildings.
Broadband was reported to be available in the community by 93 per cent of respondents.
In terms of the general quality of broadband service in the local area 35 per cent of respondents suggested it was poor or very poor.
Only two in five communities had a community council webpage
Figure 4.2 and Figure 4.3 display data on the proportion of communities with a permanent library and mobile library. Clearly, permanent libraries were concentrated in the communities with higher populations. Conversely, mobile libraries were more common in the least populated communities.
Figure 4.2: Proportion of communities with a permanent library

25
Figure 4.3: Proportion of communities with a mobile library
Most communities were well served in terms of notice-boards or newsletters. However, since 2010 the number of communities with a newsletter had declined.
Provision of community internet facilities was low in the smaller communities with populations lower than 1,000. Figure 4.4 illustrates this in terms of population size. The pattern shown in Figure 4.4 reflects the availability of built facilities to accommodate community internet facilities.
Figure 4.4: Proportion of communities with a community internet facility

26
Broadband was available in most communities, although there were issues concerning the quality of service provided.
Figure 4.5 shows how community clerks rated the general quality of the service for their local area.
Figure 4.5: Quality of broadband in communities
Clearly, more respondents rated the quality of broadband as poor or very poor (35 per cent), than good or very good (21 per cent). Respondents claimed that the broadband services provided had slow transfer speeds, were unreliable and intermittent, and offered a limited service at peak times. Some respondents also noted that service coverage was not consistent between settlements within a community, and described the general service as ‘patchy’. 4.3 Headline Statistics – Provision of ‘Low level’ interventions A report by the Personal Social Services Research Unit (PSSRU, 2010) 10 defines low level interventions as a concept that generally refers to interventions that seek
10
Measuring the outcomes of
low-level services: Final report (PSSRU, 2010).
to help to maintain or improve health before it is compromised; also known as ‘upstream interventions’. 11 Broadly, low level or low intensity interventions tend to be those services or initiatives that require minimal resources in terms of working hours and do not necessarily require the input of specialists. Examples could be help with tasks that people find difficult as they get older, such as gardening, laundry, cleaning and shopping. Other ‘low-level interventions’ could include home adaptations, such as the installation of
11
The concept focuses both on interventions
within the healthcare system that address some of the social determinants of health and on interventions in upstream factors such as housing, neighbourhood conditions, and increased socioeconomic status that can lead
to improvements in health. Brownson RC,
Seiler R, Eyler AA. Measuring the impact of public health policy. Preventing Chronic Disease.2010;7(4):A77.http://www.cdc.gov/pcd/issues/2010/jul/09_0249.htm. Accessed 4/12/2013)

27
handrails and ramps. It is argued that low level interventions can assist with ‘successful ageing’. The implication is that if we can maintain good health, through prevention, then the need for more costly services will be reduced, or delayed or, in some cases, even prevented. 12
Low level interventions were found in 58 per cent of rural communities.
The most common types of low level intervention had the common theme of food – meal services (in 30 per cent of communities) and luncheon clubs (in 27 per cent of communities).
Table 4.1 shows the proportions of communities where low level interventions were provided.
Table 4.1 Proportion of communities with low level interventions
Low level intervention
Percentage with
Intervention
%
Handyperson/ repairs scheme 17
Luncheon club 27
Befriending 10
Meals service 30
Mobile care service 21
Community warden scheme 17
None 42
4.4 Headline Statistics – Advice
services
Community legal service – 98 per cent did not have this service facility in their community.
12 Note that the PSSRU report uses the terms
‘low level interventions’ and ‘low level services’ interchangeably. To avoid confusion with other text in this WRO report, ‘low level intervention’ is used.
Counselling Service – 96 per cent did not have this service facility in their community.
Citizen’s Advice Bureau – 94 per cent did not have this service facility in their community.
Job Centre – 95 per cent did not have this service facility in their community.
Formal advice services were scarce in rural communities. Provision of all of these types of service was very much dependent on population size, with only the most populated communities having substantial levels of such services. The majority of communities (91 per cent) operated none of the advice services mentioned above. 4.5 Headline Statistics – Support services Levels of provision of sources of support for particular vulnerable groups in the local community were explored by the survey. These included support groups for the elderly, young people, the disabled, the unemployed, the homeless, those with drug problems, and those who had been subjected to domestic violence. Support services for vulnerable groups:
Elderly – 86 per cent did not have these support services in their community
Young – 86 per cent did not have these support services in their community
Disabled – 94 per cent did not have these support services in their community
Unemployed – 94 per cent did not have these support services in their community
Homeless – 97 per cent did not have these support services in their community
People with drug / alcohol problems – 96 per cent did not have these support services in their community

28
Those experiencing domestic violence – 96 per cent did not have these support services in their community.
Support services for the elderly and young were the most common, although only 14 per cent of communities had immediate access to these services. All support services (including those for the disabled, the unemployed, the homeless, those with drug problems, and those who had been subjected to domestic violence) tended to be concentrated in those community councils with larger populations (4,000+). Overall, 21 per cent of all responding communities had support services for some of these vulnerable groups. 4.6 Change in provision since 2010 –
Support and advice services
Since 2010 the majority of communities in rural Wales had continued with the same low level of support and advice services: 83 per cent of respondents suggested the level of provision had stayed the same; 16 per cent suggested that there had been a decrease; and in a total of only three communities (1%) was there a perceived increase in service provision.
4.7 Perceptions of Welfare
Data on various types of support and advice services are presented in Sections 4.4 to 4.6. In all cases, the proportion of communities with these services was positively correlated with population size, with only the most populated communities having substantial levels of such services. In communities with small populations, it was suggested that there was effectively no level of welfare and that informal modes of welfare support were a
necessity, particularly in view of the ageing rural population. The 2004 WRO Service report highlighted the potential to operate mobile and drop-in services in more isolated communities and to utilise existing infrastructure in these communities, such as village halls. This potential was also pointed to in the 2010 report. Unfortunately, the 2013 services survey failed to reveal any evidence of improvement in the situation since 2004. Moreover, when asked how they perceived the longer-term situation concerning the provision of welfare services, 28 per cent of respondents perceived that it had changed for the worse; 68 per cent that it had stayed the same; and only three per cent perceived that the provision of welfare services in their community had improved.

29
This section discusses the provision of services such as recreation facilities and community activities. 5.1 Headline Statistics – Meeting places
Village Hall – 28 per cent did not have this service facility in their community
Church/Chapel Hall – 40 per cent did not have this service facility in their community
Community Centre – 64 per cent did not have this service facility in their community
School Hall – 58 per cent did not have this service facility in their community
Table 5.1 displays the proportions of communities with meeting places of various types. Village halls and church/chapel halls existed in large proportions of communities, with slightly less evidence of provision of school halls and community centres in the councils with populations below 1,000. A third of the community areas containing schools did not have a school hall. Of the 356 community areas containing a place of worship, only 57 per cent had a church/chapel hall. Note that these meeting places could potentially have multiple social functions.
Table 5.1: Proportion of communities with a meeting place
Community Population Size
0-399
400-499
500-599
600-699
700-999
1,000-1,999
2,000-3,999
4,000 +
Total
% % % % % % % % %
One or more Village Hall 72 61 72 74 71 79 65 73 72 One or more Church/Chapel Hall 42 41 48 59 64 65 72 78 60 One or more Community Centre 11 23 14 22 24 49 53 68 36 One or more School Hall 6 25 31 41 32 54 67 70 42
5.2 Headline Statistics – Recreation facilities
Formal play area – 27 per cent did not have this service facility in their community
Swimming pool – 91 per cent did not have this service facility in their community
Sports Hall – 83 per cent did not have this service facility in their community
Playing field - 32 per cent did not have this service facility in their community
The proportion of communities with formal play areas with equipment was relatively high compared to other recreation facilities with 72 per cent having this facility. More generally, provision remained good across rural Wales, with only the 0-400 population band dropping below 50 per cent for this service. Other sports facilities were more closely correlated with community size (Table 5.2).
SECTION 5 Recreation Facilities and Community Activities
DDDRDRDRINKNTRODUCTION

30
Table 5.2: Proportion of communities with recreational facilities
Community Population Size
0-399
400-499
500-599
600-699
700-999
1,000-1,999
2,000-3,999
4,000 +
Total
% % % % % % % % % One or more play area 33 55 52 67 67 90 95 95 73
One or more swimming pool 0 2 0 4 0 4 21 51 9 One or more sports hall 0 5 0 7 12 13 35 68 17 One or more playing field 33 43 34 56 71 80 95 92 68
Figure 5.2 Proportion of communities with clubs for the over 60s and retired
5.3 Perceptions of Recreation facilities Two- in- five respondents rated the level of recreational facilities as adequate, but more (36 per cent) rated it as bad than rated it as good (15 per cent). Considering these results with regard to population size revealed that the proportions of respondents rating recreation facilities as bad rose with decreasing community population sizes: e.g. over half of respondents rated recreation facilities as bad when the population size was fewer than 600 people.
5.3 Headline Statistics – Community activities
Sports clubs existed in 41 per cent of communities, and 39 per cent held sports events.
Pub games were available in 47 per cent of communities.
Two- in- five communities held arts or music events and agricultural or horticultural shows, and a quarter had Eisteddfodau13.
13
An eisteddfod (the plural is eisteddfodau) is a Welsh festival of music, literature and performance.

31
Other examples of community activities included: carnivals, village fetes, keep-fit classes, karate, bingo, indoor bowls, bowling, W.I., rowing, surfing, lifesaving, film nights, seasonal parties and fund raising activities.
Fifteen per cent of respondents indicated that they did not have, or were not aware of, any of the aforementioned activities in their community.
Most rural communities tended to have at least one form of community activity and it was common for communities to hold at least four different types of community activity. Qualitative data from respondents suggested that the problems experienced with recreational facilities revolved around funding and the lack of land and space for these facilities. 5.4 Headline Statistics – Youth Groups
Beavers/ Rainbows /Cubs / Brownies/ Guides/ Rangers/ Explorer Scouts / Network – two thirds of communities did not have these groups.
Youth social clubs – 63 per cent of communities did not have these clubs.
Urdd - 76 per cent of communities did not have these social groups.
Young Farmers Club – 63 per cent of communities did not have these clubs.
Between 26 per cent and 39 per cent of communities had at least one youth group and Table 5.3 shows the proportion of communities with the varying types of youth groups or clubs. Provision of scouts or guide groups showed a relationship with population size, while groups like Urdd or the Young Farmers were more equally distributed in the communities with lower populations.
Table 5.3: Proportion of communities with various youth groups and clubs
Community Population Size
0-399
400-499
500-599
600-699
700-999
1,000-1,999
2,000-3,999
4,000 +
Total
% % % % % % % % %
Beavers/ Rainbows /Cubs / Brownies/ Guides/ Rangers/ Explorer Scouts / Network 11 14 7 19 15 39 79 76 34
Youth Social Clubs 28 18 7 22 23 51 58 73 37
Urdd 14 11 17 37 21 26 35 32 24
Young Farmers Club 28 32 34 48 35 44 30 35 37
5.5 Headline Statistics – Clubs for the over 60s and retired:
Clubs for the over 60s and retired – 48 per cent did not have this service facility in their community.
In terms of the frequency of club meetings, only two per cent met daily. The majority of clubs met on
a weekly or monthly basis (50 per cent and 37 per cent respectively).
There appeared to be more clubs available for the over 60s and retired in rural communities than for the younger age groups, perhaps a reflection of the age profile of most communities. Rural Wales has a larger share of residents in

32
the retirement age category (65 and over) compared to the rest of Wales – just over a fifth (21.7 per cent) of the rural population in Wales are aged 65 and over compared to 18.4 per cent of the Welsh population. While the proportion of the rural population in the 15-24 age category (12.4 per cent) is slightly below the Welsh average of 13.4 per cent14.
Over a third of rural communities were likely to have a club for the over 60s and retired, even in the smallest population band (fewer than 400 people). These clubs commonly met on a weekly or monthly basis.
Activities that took place at these clubs
included: friendship groups, tea and
biscuit/coffee mornings, bingo, card
games, indoor bowls, snooker, exercise
classes, dancing, cookery/baking, crafts,
music, luncheon clubs, reading clubs,
walking clubs, quizzes, age concern and
guest speaker / demonstrators. On
occasions day visits or excursions also
took place.
5.6 Perceptions of community activities
Most respondents rated community activities as adequate (44 per cent). The remaining respondents were split between those that perceived community activities negatively (29 per cent rated activities as ‘bad’) and those who rated the level of activity as good (27 per cent). While some respondents highlighted the positive aspects of community involvement, others were concerned about a perceived lack of social cohesion in their community.
14
Source, Census 2011. See also the Wales Rural Observatory report, ‘The Experiences and Aspirations of Young People in Rural Wales’, for further details

33
Public transport is a key service in rural communities. The following section outlines data on access to and availability of buses, the rail network, and various community transport services. 6.1 Headline Statistics – Bus and train services
A bus service operated every day in 39 per cent of communities; 29 per cent operated six days a week; and 15 per cent operated on fewer days
Respondents indicated that 17 per cent of communities did not have a bus service in operation on any day of the week.
Peak Bus Service (0700-0900 and 1500-1800) – Less than half of respondents (47 per cent) had a bus service operating during these hours.
Off-peak Bus Service (Between 0900 and 1500) - this type of service was much more common in rural Wales with 73 per cent of respondents indicating that a bus service operated during these hours.
Evening Bus Service (After 1800) –this service was in operation in just over one-in-three communities (34 per cent).
Train service and station – 88 per cent did not have this service facility in their community.
Respondents observed that for rural communities the provision of public transport was inconsistent. While transport services operated in most communities, one-in-three smaller communities (i.e. those with a population fewer than 400) did not have a bus service. Bus services varied, not only in the number of days they operated but also in the times of day they passed through the community. The least populated communities tended to be serviced on fewer days and were least likely to have a service operating during peak hours. Train services, however, were only available to a small proportion of communities. Table 6.1 indicates that bus services that operated at peak hours were fairly limited for large parts of rural Wales. In population bands below 1,000 people, less than half of communities had such services, together with only 76 per cent of communities in the highest population band. The proportion of communities with off-peak bus service provision was higher and ranged between 53 per cent and 76 per cent. However, this service level declined during the evening period.
Table 6.1: Proportion of communities with bus services
Community Population Size
0-399
400-499
500-599
600-699
700-999
1,000-1,999
2,000-3,999
4,000 +
Total
% % % % % % % % %
Bus Service (peak) 22 27 31 41 44 56 63 76 47
Bus Service (off -peak) 53 70 62 67 61 72 58 76 66
Bus Service (evenings) 14 16 14 22 26 41 37 54 30
6.2 Perceptions of Public Transport
Respondents’ ratings of public transport provision in their community were practically evenly split between adequate,
at 42 per cent, and bad at 43 per cent. Only 15 per cent of respondents rated public transport provision as good.
SECTION 6 Public Transport

34
Communities with lower populations were most likely to rate public transport provision as bad: e.g. 64 per cent of communities with fewer than 400 residents awarded a bad rating.
Many community clerks pointed to the unreliability, poor frequency, expense and inconvenience of public transport. Additionally, some respondents suggested that where public transport did exist, the system was not integrated: e.g. bus timetable did not align with train timetables.
The vicious circle identified in the 2004, 2007 and 2010 reports still pertained. That is, when public transport does not meet specific needs, demand and use decrease. Service providers respond by reducing levels of public transport provision, which leads to a further decline in demand, to which service providers respond with even more reductions in provision.
6.3 Change in provision since 2010 –
Public Transport
In response to questions that explored perceptions of change in public transport between 2010 and 2013, only four per cent of respondents observed that public transport provision had increased, while 35 per cent perceived that it had decreased.
Half of respondents indicated that provision of public transport had remained the same in their community. As the perceived levels of public transport provision in the 2010 report were similar to 2013, ‘no change’ was most likely to mean that public service provision continued to be ‘bad’ or non-existent.
In some cases other modes of community transport were attempting fill the gaps in public transport provision.
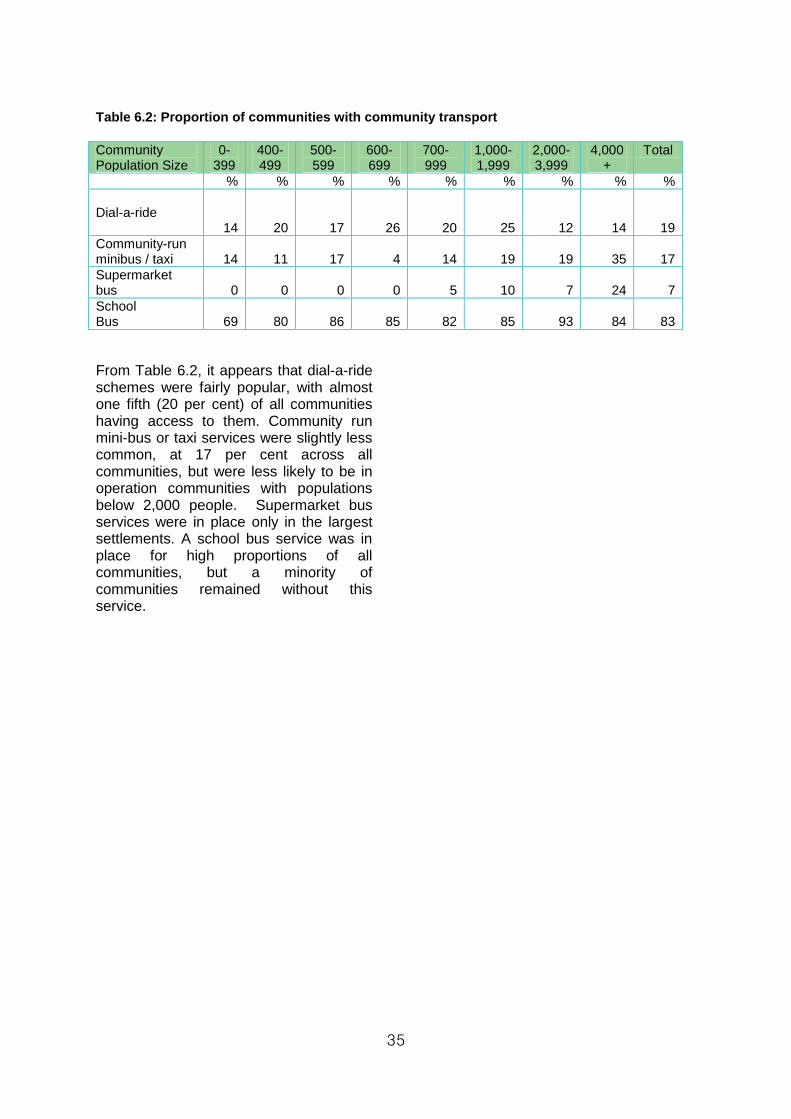
6.4 Headline Statistics – Community transport
Dial-a-ride – 81 per cent did not have this service facility in their community
Community minibus/taxi – 83 per cent did not have this service facility in their community
Supermarket bus – 93 per cent did not have this service facility in their community
School bus -17 per cent did not have this service facility in their community
Other forms of transport were explored by the survey. Specifically, these were: community transport provision i.e. dial-a-ride; community run minibus/taxi; and supermarket and school bus services. At 19 per cent and 17 per cent respectively, fewer than one-in-five of responding councils had a dial-a-ride scheme15 or community-run minibus/taxi services. School buses served 83 per cent of communities, while relatively small proportion (seven per cent) had a supermarket bus. Table 6.2 shows these data in relation to the population size of responding Town and Community Councils.
15
Dial-a-Ride is a door-to-door multi-occupancy transport scheme for people who cannot or have difficulty using existing public transport.
35
Table 6.2: Proportion of communities with community transport
Community Population Size
0-399
400-499
500-599
600-699
700-999
1,000-1,999
2,000-3,999
4,000 +
Total
% % % % % % % % %
Dial-a-ride 14 20 17 26 20 25 12 14 19
Community-run minibus / taxi 14 11 17 4 14 19 19 35 17
Supermarket bus 0 0 0 0 5 10 7 24 7
School Bus 69 80 86 85 82 85 93 84 83
From Table 6.2, it appears that dial-a-ride schemes were fairly popular, with almost one fifth (20 per cent) of all communities having access to them. Community run mini-bus or taxi services were slightly less common, at 17 per cent across all communities, but were less likely to be in operation communities with populations below 2,000 people. Supermarket bus services were in place only in the largest settlements. A school bus service was in place for high proportions of all communities, but a minority of communities remained without this service.

36
Community recycling is a duty bestowed upon local authorities under the Environmental Protection Act 1990. This is an Act of the Parliament of the United Kingdom that as of 2008 defines, within England and Wales and Scotland, the fundamental structure and authority for waste management and control of emissions into the environment. Section 45 requires waste collection authorities, usually local authorities, to collect household waste unless it is in an isolated location or arrangements can reasonably be expected to be made by the person who controls the waste. There is further discussion in the Concluding Remarks of this report. 7.1 Headline Statistics This section examines the findings from the questionnaire regarding recycling services, provided by the local authority, town or community council, or voluntary organisations. General services provided: 16
Bottle Bank – 32 per cent did not have this service facility in their community
Clothes Recycling – 51 per cent did not have this service facility in their community
Paper Recycling – 30 per cent did not have this service facility in their community
Cans and plastics – 32 per cent did not have this service facility in their community
Approximately half of communities surveyed did not report to have a regular door-to-door collection service for recyclable goods and materials.
16
Includes both council sites where items can be disposed and any door-to-door collection.
Across the survey, taking together all recycling facilities and mechanisms for provision (which also included provision by town and council and charities), 90 per cent of communities had access to at least one form of community recycling facility. The most common type of recycling provided by local authorities was paper, followed by cans/plastics and bottles, and the least common type of recycling was for clothes. The percentage of local authority municipal waste (excluding abandoned vehicles) that was reused, recycled or composted in rural Wales has seen a continued increase since 2000-01, with around 55 per cent of waste reused/recycled/composted between 2012-2013. [WG Statistics November 2013]. Therefore more municipal waste is being recycled now than in the past. However it does not necessarily follow that more recycling provision is being provided. Table 7.1 shows that the incidence of recycling facilities provided by the Local Authority was positively correlated with the higher population bands, with over three quarters of communities having most forms of recycling, where community population exceeded 4,000 people. These results were broadly in line with the previous survey conducted in 2010. However the proportion of authorities providing regular door-to-door recycling has noticeably decreased. Regular door-to-door collection, of some form of recyclable material, by the local authority was available to 49 per cent of communities in 2013. This is odd as in previous services surveys regular door-to-door provision appeared to have been increasing (e.g. the service was available in 61% of rural communities in 2007 and 70% in 2010). Looking more closely at this issue revealed that many of these communities
SECTION 7 Community Recycling

37
were without any form of recycling. The qualitative responses in communities without this service provided further insight,
“No facilities within the parish to recycle” “Available in adjacent area”
“Had three years of Cwm Harry Project; now suspended by local authority collectors from March 2013”
“Fly tipping is an increasing problem”
“Bins are not emptied often enough. Regular door-to-door collection by LA in some areas”
“The recycling provisions are reasonable. In regards to the door to door collection, the people who do not live on the main road have to take their recycling down to the main road”
“Have issues with holiday homes not recycling correctly”
Those with provision often reported how well the service worked. Clearly there is a need for additional research projects on this subject. To further investigate this issue existing evidence collected by the Wales Rural Observatory has been used. The recycling results from the services survey were compared to the Wales Rural Observatory Survey of Rural Households 2013. This was possible as both surveys contained similar questions on recycling. In the household survey almost ninety five per cent of respondents had recycling collection from their home. However this survey did not question if the door-to-door recycling service provided was regular and had a different basic unit of analysis, the household not the community in general. Nevertheless the results from the household survey indicate that the result in the services survey is somewhat lower than would be expected. Given that, local authorities have a duty to provide regular door-to-door recycling services this appears to be an anomaly. There is further comment in the Concluding Remarks of this report.
Table 7.1: Proportion of communities with recycling facilities provided by the local authority
Community Population Size
0-399
400-499
500-599
600-699
700-999
1,000-1,999
2,000-3,999
4,000 +
Total
% % % % % % % % %
Bottle Bank 42 48 41 44 52 71 74 84 60
Clothes Recycling 22 20 24 30 38 38 49 76 38
Paper recycling 39 43 55 67 61 72 74 89 64
Cans and plastics 44 41 52 48 55 71 79 86 61
Regular door-to-door collection of any of these 50 52 48 67 50 45 49 43 49
Table 7.2 shows that local authorities were the main providers of recycling facilities. Local authorities provided bottle bank services for 60 per cent of communities;
paper recycling for 64 per cent; recycling of cans and plastics for 61 per cent; while recycling of clothes was provided to a relatively small proportion of 38 per cent of

38
communities. Community council facilities and those provided by voluntary organisations accounted for a small proportion of provision in all communities.
Note the low proportion of communities with regular door-to-door collection service for recyclable goods and materials in the higher population bands.
Table 7.2: Proportion of communities with recycling facilities provided by the Local Authority, Community council, and voluntary organisations
LA Community Council Voluntary Organisation
% % %
Bottle Bank 60 11 4
Clothes Recycling 38 6 15
Paper recycling 64 9 5
Cans and plastics 61 10 3
Regular door –to-door collection 49 6 4
7.2 Perceptions of Community Recycling
With regard to how communities rated their recycling services, 53 per cent of respondents rated community recycling as
good and a further 36 per cent suggested that provision was adequate. Only 10 per cent rated recycling services as bad.
39
This concluding section focuses on issues
arising from the preceding analysis which
appear as important issues in the
development of service provision.
A first, general, point is the importance of
population size. Earlier in the report,
attention is drawn to the need to consider
the caveat that many of the services
tended to be concentrated in the larger
rural communities. Consequently, the
responses from larger communities might
skew the results and what appears to be a
‘good’ or ‘adequate’ overall result might
obscure a poor or bad level of service
provision in less populated communities.
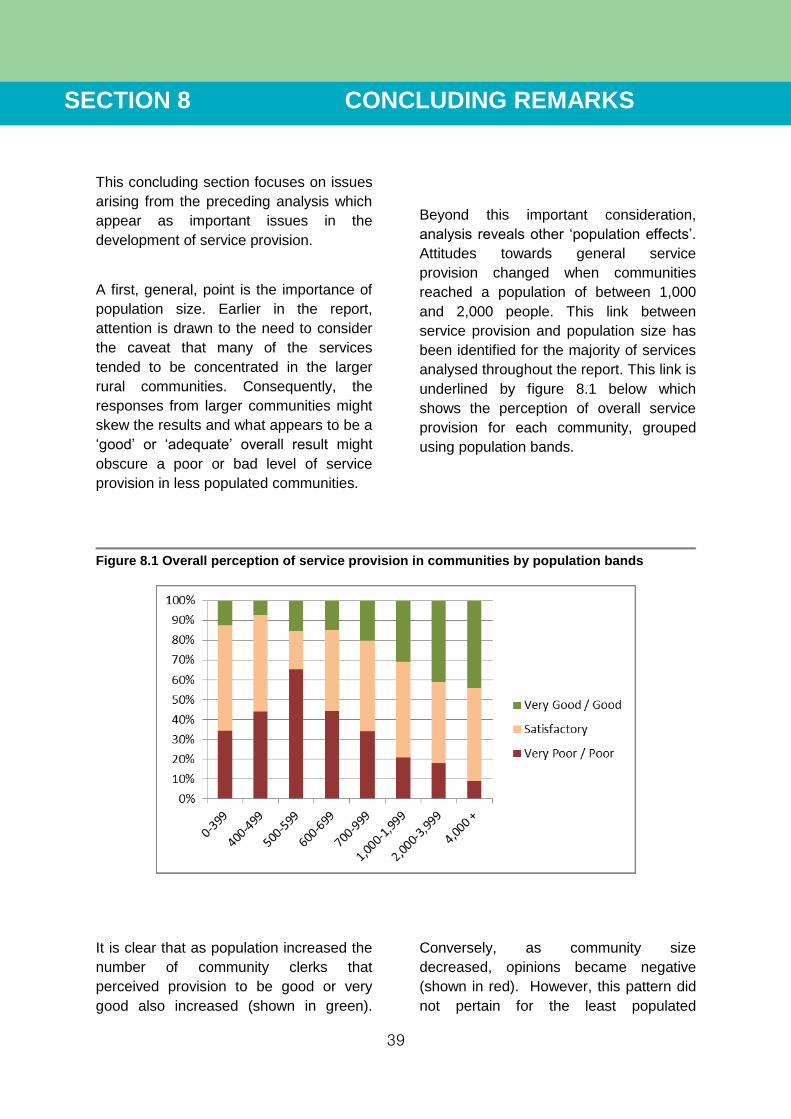
Beyond this important consideration,
analysis reveals other ‘population effects’.
Attitudes towards general service
provision changed when communities
reached a population of between 1,000
and 2,000 people. This link between
service provision and population size has
been identified for the majority of services
analysed throughout the report. This link is
underlined by figure 8.1 below which
shows the perception of overall service
provision for each community, grouped
using population bands.
Figure 8.1 Overall perception of service provision in communities by population bands
It is clear that as population increased the
number of community clerks that
perceived provision to be good or very
good also increased (shown in green).
Conversely, as community size
decreased, opinions became negative
(shown in red). However, this pattern did
not pertain for the least populated
SECTION 8 CONCLUDING REMARKS

40
communities (fewer than 500 people).
This is interesting, because throughout the
report it has been shown that these
population bands contained higher
proportions of communities without key
services. It suggests that respondents in
these smaller communities might have
become habituated to lower levels of
service; consequently, they might have
had lower expectations.
Notwithstanding this apparent anomaly, it
remained the case that a greater
proportion of respondents thought
negatively about general service provision
in communities with population thresholds
under 1000 people. Perceptions of service
provision across all population bands
tended towards the negative. A quarter of
community clerks in rural Wales felt that
service provision was good or very good,
45 per cent considered it satisfactory, and
31 per cent considered it poor or very
poor. That is, more thought it was poor
than thought it was good.
The second point was the decline in the
provision of services seen to act as a ‘hub’
in a community. Post offices were the
prime example and they had suffered a
steep decline in provision; a decline that
had been state and institutionally driven.
Other examples included public houses,
schools and school halls, church halls and
community centres. One might also
include sports and recreational facilities.
The locations for these community ‘hub’
services often have the potential to act as
multiple-purpose venues, meaning that
their demise might trigger the loss of more
than one service. Arguably, their decline
threatens the sustainability of rural
communities.
There must also be concerns about
welfare service provision in rural Wales.
The survey showed that welfare services
provision, upon which many older and
younger people, people with mental health
problems; people with disabilities, and
people with a range of other issues rely,
was in long-term decline over the period
since 2004.
An interesting point here was the
prevalence of ‘low-level interventions’,
which, as discussed earlier, often act as a
proxy for formal welfare services. While
the question concerning ‘low-level
interventions’ was posed for the first time
in 2013 and thus longitudinal analysis was
not possible, in a high proportion of
communities (58 per cent) ‘low-level
interventions’ were in place. Research is
needed to explore whether these ‘low-
level interventions were a response to cut-
backs in social services or an example of
the UK Government’s Big Society.
An enduring theme throughout the four
WRO services surveys of 2004, 2007,
2010 and 2013, and in other WRO work
such as the Deep Rural Localities survey
(WRO 2009), has been the reliance on
private transport for most members of
rural communities. The iteration between
low supply and low usage, leading to even
lower supply, is discussed earlier in this
report. Whatever the rationale for low
levels of public transport provision – and
there must be questions about whether or
not the apparent reliance on private
transport is due to necessity or choice –
the low levels of public transport provision
must result in additional challenges for
those not able to drive and those who live
in service-deprived communities.
Particular groups, such as the young,
elderly, less affluent, and those with

41
certain disabilities, are therefore more
susceptible to changes in service
provision.
In contrast to the general decline in
service provision, a service that had
improved its rate of provision over the
period since 2004 was broadband access
to the internet. Broadband is seen to be
essential for successful businesses more
generally and for successful rural
businesses in particular; it provides ways
to overcome the tyrannies of distance and
remoteness. As such, it is also seen as
powerful tool to enhance the sustainability
of rural communities. The survey results
showed that broadband access was high;
at 93 per cent it was approaching
saturation. However, the ratings for quality
and satisfaction were not that good. As
discussed earlier, they resonated with
similar findings in other reports. This
indicates that the broadband project17 in
rural Wales still requires careful attention,
supported by research.
Another finding that points to the need for
research is the anomaly noted in Section 7
on Community Recycling. That is, only 49
per cent of community clerks reported the
provision, by the local authority, of regular
door to door recycling collections.
There may be several reasons for this
anomaly. One possible explanation is
based on the confusion arising from the
conflicting duties placed on local
authorities by the Refuse Disposal Act
(RDA) 1978 on the one hand, and the
Environmental Protection Act (EPA) 1990,
17
Further details can be found at
http://www.wlga.gov.uk/broadband-in-rural-wales
on the other. 18 While the UK government
has sought to clarify the relevant
legislation by repealing the relevant duties
under the RDA, there was, nevertheless,
two contradictory statutes in force, which
may have led to confusion on the part of
local authorities and may have caused this
anomaly. In any case, further research is
needed in order to become clear on the
provision of door to door recycling
collections in Wales.
Finally, we must consider the context for
this 2013 survey of service provision in
rural Wales. Arguably, the 2004 and 2007
surveys took place in relatively neutral or
even benign economic conditions.
However, since 2008 the UK has been in
the grip of a recession. Whether or not the
recession continues is a matter for
technical debate; evidence from the WRO
Rural Business report indicates that it is
perceived that the recession remains in
place. 19 Moreover, since the 2010
Services report, to counter the recession
the UK Coalition Government introduced a
programme of ‘austerity’ and cut-backs to
public services. Thus, the final observation
is that service providers in rural Wales
have been operating under difficult
conditions. Moreover, these difficult
conditions are likely to continue for a
considerable period. Arguably, it is the
18
Both acts assigned a duty to provide civic
amenity sites, but RDA assigned the duty to waste collection authorities, while EPA assigned it to waste disposal authorities. With the repeal of RDA, the duty is assigned to waste disposal authorities. Further details can be found using the following link - http://wales.gov.uk/topics/environmentcountryside/epq/waste_recycling/legislation/refusedisposalrepeal/?lang=en
19
Recession is usually defined as a
contraction in GDP for six months (two
consecutive quarters) or longer.

42
task of government to assist service
providers in this difficult task.
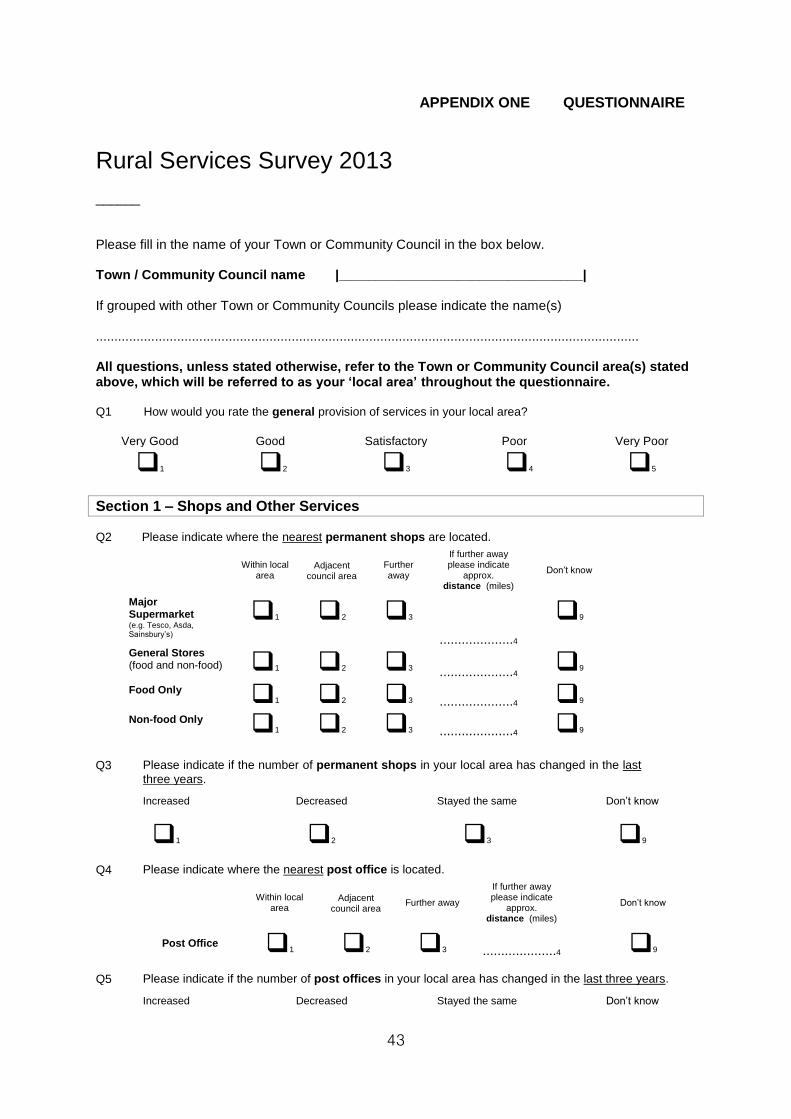
43
APPENDIX ONE QUESTIONNAIRE
Rural Services Survey 2013 ______ Please fill in the name of your Town or Community Council in the box below. Town / Community Council name |_________________________________| If grouped with other Town or Community Councils please indicate the name(s) ................................................................................................................................................... All questions, unless stated otherwise, refer to the Town or Community Council area(s) stated above, which will be referred to as your ‘local area’ throughout the questionnaire. Q1 How would you rate the general provision of services in your local area?
Very Good Good Satisfactory Poor Very Poor
1 2 3 4 5
Section 1 – Shops and Other Services
Q2 Please indicate where the nearest permanent shops are located.
Within local area
Adjacent council area
Further away
If further away please indicate
approx. distance (miles)
Don’t know
Major Supermarket (e.g. Tesco, Asda, Sainsbury’s)
1 2 3 ....................4
9
General Stores (food and non-food) 1 2 3 ....................4 9
Food Only 1 2 3 ....................4 9
Non-food Only 1 2 3 ....................4 9
Q3 Please indicate if the number of permanent shops in your local area has changed in the last
three years.
Increased Decreased
Stayed the same Don’t know
1 2 3 9
Q4
Please indicate where the nearest post office is located.
Within local area
Adjacent council area
Further away
If further away please indicate
approx. distance (miles)
Don’t know
Post Office 1 2 3 ....................4 9 Q5
Please indicate if the number of post offices in your local area has changed in the last three years.
Increased Decreased
Stayed the same Don’t know

44
1 2 3 9
Q6 Please indicate where the nearest petrol station with a shop is located.
Within local area
Adjacent council area
Further away If further away please indicate
approx. distance (miles)
Don’t know
Petrol station with a shop 1 2 3 ....................4 9
Q7 Does your local area hold a farmers’ market? If so, how regularly is it held?
Yes No Don’t Know More than
once a week Weekly Fortnightly
Monthly
Less than Monthly
1 2 3 4 5 6 7 8
Q8 For your local area, please write in the number of restaurants, cafés and take-away / fast food outlets which are open
all year and the number which are seasonal. These should be recorded according to their main business activity.
Numbers of Restaurants (not including pub serving meals)
Number of Cafés (tea/coffee shops)
Number of Takeaways (include vans)
Open all year
Seasonal
Open all year
Seasonal
Open all year
Seasonal
……….1 ……….2 ……….3 .…….4 ……….5 …...…..6 Q9 Please write in the number of the pubs in your local area, which fit the following descriptions.
Numbers of pubs serving meals
Numbers of pubs not serving meals
…………..……1
………….…….2
Q10
Please indicate if the number of restaurants, cafés and take-away / fast food outlets in your local
area has changed in the last three years.
Increased Decreased
Stayed the same Don’t know
1 2 3 9
Q11 Please indicate where the nearest bank / building society is located.
Within local area
Adjacent council area
Further away
If further away please indicate
approx. distance (miles)
Don’t know
Bank / Building Society (Full time) 1 2 3 ....................4 9 Bank / Building Society (Part Time) 1 2 3 ....................4 9
Q12 Please indicate if the number of banks / building societies in your local area has
changed in the last three years.
Increased Decreased
Stayed the same Don’t know
1 2 3 9
Q13 How do you rate the level of general retail provision in your local area?
Good
Bad Adequate Please use the space below to provide any additional comments.
………………………………………………………………………….........................................................................................................................................................................................................................
1 2 3

45
..........................................................................................................
..........................................................................................................
Section 2 – Medical Services
Q14 Please indicate where the nearest medical services are located
Within local area
Adjacent council area
Further away
If further away please indicate approx. distance (miles)
Don’t know
Main GP Surgery 1 2 3 ....................4 9 Community Health Centre 1 2 3 ....................4 9 Private Dental Surgery 1 2 3 ....................4 9 NHS Dental Surgery 1 2 3 ....................4 9 Pharmacy 1 2 3 ....................4 9 Hospital (A&E) 1 2 3 ....................4 9 General Hospital (large / acute) 1 2 3 ....................4 9 Community Hospital 1 2 3 ....................4 9
Q15 Please indicate if the number of medical services in your local area has changed in the last
three years.
Increased Decreased
Stayed the same
Don’t know Comment
Main GP Surgery 1 2 3 4 .....................................................................5
Community Health Centre 1 2 3 4 .....................................................................5
Private Dental Surgery 1 2 3 4 .....................................................................5
NHS Dental Surgery 1 2 3 4 .....................................................................5
Pharmacy 1 2 3 4 .....................................................................5
Hospital (A&E) 1 2 3 4 .....................................................................5
General Hospital (large/acute) 1 2 3 4 .....................................................................5
Community Hospital 1 2 3 4 .....................................................................5
Q16 How do you rate the level of medical services provision in your local area?
Good
Bad Adequate Please use the space below to provide any additional comments.
………………………………………………………………………….............................................................................................................................................................................................................................................................................................................................................................................................................................................
1 2 3
Section 3 – Education and Day-care
Q17 Please indicate where the nearest groups for children are located
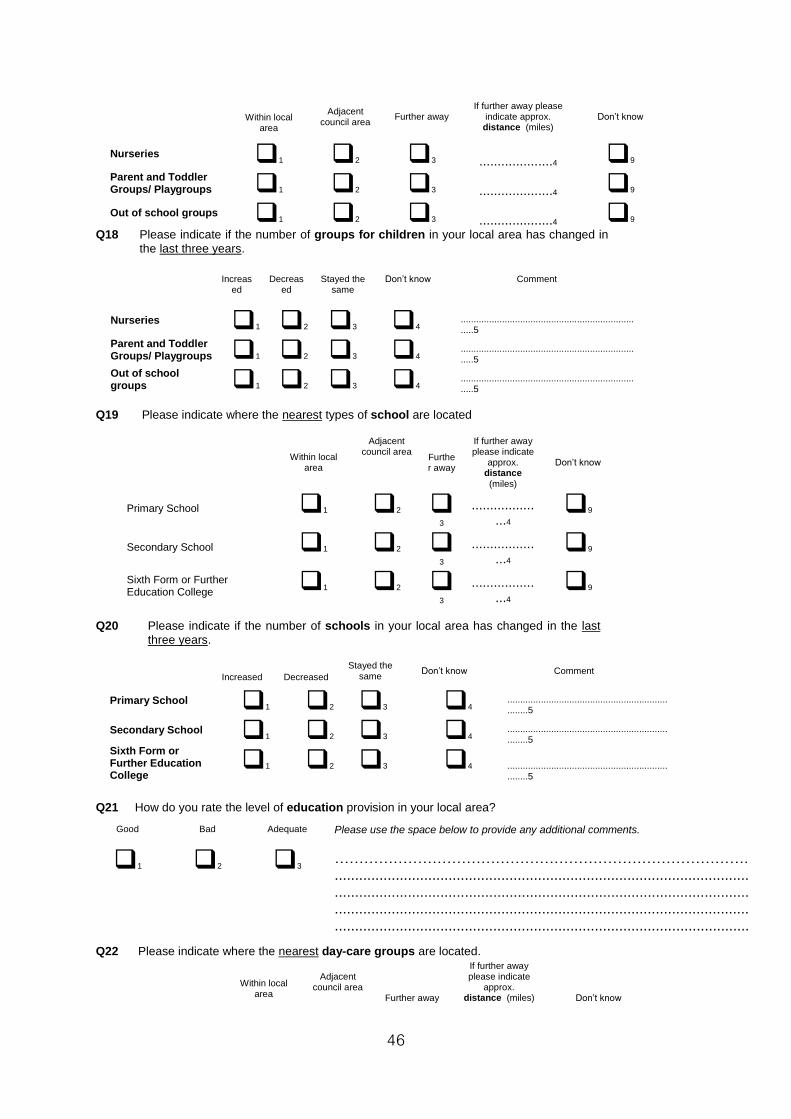
46
Within local area
Adjacent council area
Further away If further away please
indicate approx. distance (miles)
Don’t know
Nurseries 1 2 3 ....................4 9
Parent and Toddler Groups/ Playgroups 1 2 3 ....................4 9 Out of school groups 1 2 3 ....................4 9
Q18 Please indicate if the number of groups for children in your local area has changed in
the last three years.
Increased
Decreased
Stayed the same
Don’t know Comment
Nurseries 1 2 3 4 ........................................................................5
Parent and Toddler Groups/ Playgroups 1 2 3 4
...................................................................
.....5
Out of school groups 1 2 3 4
...................................................................
.....5
Q19 Please indicate where the nearest types of school are located
Within local area
Adjacent council area
Further away
If further away please indicate
approx. distance (miles)
Don’t know
Primary School 1 2 3
....................4
9
Secondary School 1 2 3
....................4
9
Sixth Form or Further Education College
1 2 3
....................4
9 Q20
Please indicate if the number of schools in your local area has changed in the last
three years.
Increased Decreased
Stayed the same
Don’t know Comment
Primary School 1 2 3 4 ......................................................................5
Secondary School 1 2 3 4 ......................................................................5
Sixth Form or Further Education College
1 2 3 4 ......................................................................5
Q21 How do you rate the level of education provision in your local area?
Good
Bad Adequate Please use the space below to provide any additional comments.
………………………………………………………………………….........................................................................................................................................................................................................................................................................................................................................................................................................................
1 2 3
Q22 Please indicate where the nearest day-care groups are located.
Within local area
Adjacent council area
Further away
If further away please indicate
approx. distance (miles) Don’t know

47
Group for the elderly 1 2 3 ....................4 9 Group for people with disabilities 1 2 3 ....................4 9
Q23
Please indicate if the number of day-care groups in your local area has changed in
the last three years.
Increased Decreased
Stayed the same
Don’t know Comment
Group for the elderly 1 2 3 4 ........................................................................5
Group for people with disabilities 1 2 3 4 ........................................................................5
Q24 How do you rate the level of day care provision in your local area?
Good
Bad Adequate Please use the space below to provide any additional comments.
…………………………………………………………………………............................................................................................................................................................................................................................................................................................................
1 2 3
Q25 How has the quality of day care provision changed in your local area in the last ten years?
For the Better
Stayed the
Same
Got Worse
Please use the space below to provide any additional comments.
…………………………………………………………………………............................................................................................................................................................................................................................................................................................................
1 2 3
Section 4 – Places of Worship
Q26 For your local area, please write in the number of places of worship that are in use.
Places of worship
…………1
Q27 Please indicate if the number of places of worship in use in your local area has changed in the last three years.
Increased Decreased
Stayed the
same Don’t know Comment
Places of worship 1 2 3 4 ........................................................................5
Q28 Please tick the appropriate boxes to indicate whether places of worship in your local area are used
for any other purposes.
Arts/music Public meetings
School assemblies
Other Uses (please specify)
No other uses
Don’t know
1 2 3
………....…...................................4
5
6
Section 5 – Information and Welfare

48
Q29 For your local area, please indicate which of the following facilities are available.
Permanent Library
Mobile Library Public / Council Noticeboard
Newsletter / Papur Bro
Community council
website/page
None of these
1 2 3 4 5 9 Q30 For your local area please indicate the number of community internet
facilities available for public use. If possible, write in the location for
each (e.g. pub, shop, school, village hall, community centre).
Community Internet Facility
Location of Internet facility (write in)
……………1
_____________________________________________________________________
_____________________________________________________________________
Q31a For your local area please indicate if broadband is available.
Yes
No
Comments
1
2
.............................................................................................................................................................................
.............................................................................................................................................................................
.............................................................................................................................................................................
.............................................................................................................................................................................................................................................................................................
Q31b
If broadband is available, please could you rate the general quality of the service for
the local area.
Very Good
Good Satisfactory Poor Very Poor
1 2 3 4 5
Q32 For your local area please tick the appropriate boxes to tell us about ‘low-level
services’ operating in your area.
Handyperson/ repairs scheme
Luncheon club
Befriending
Meals service
Mobile care service
Community warden scheme
Other (write in)
None
1 2 3 4 5 6
…………........6 7
Q33 Please indicate where the nearest support and advice services are available for the following types of people or social groups.
Within local area
Adjacent council area
Further away
If further away please indicate approx. distance (miles) Don’t know
Elderly People 1 2 3 ....................4 9
Young People 1 2 3 ....................4 9 Those with Mental Health or
Physical Disabilities
1 2 3 ....................4 9 Unemployed 1 2 3 ....................4 9
Homeless 1 2 3 ....................4 9
People with Drugs/Alcohol Problems 1 2 3 ....................4 9
Those experiencing Domestic Violence
1 2 3 ....................4 9
Other (please specify) ____________________________ ________________________________________________________
1 2 3 ....................4 9

49
Q34 Please indicate where the nearest support and advice services are located.
Within local area
Adjacent council area
Further away
If further away please indicate approx. distance (miles) Don’t know
Community Legal Service 1 2 3 ....................4 9 Counselling Service 1 2 3 ....................4 9
Citizens’ Advice Bureau 1 2 3 ....................4 9 Job Centre 1 2 3 ....................4 9
Other (please specify) ____________________________ ________________________________________________________
1 2 3 ....................4 9
Q35
Please indicate if the number of support and advice services in your local area has
changed in the last three years.
Increased Decreased
Stayed the same Don’t know
1 2 3 9
Q36 How do you rate the level of welfare provision in your local area?
Good
Bad Adequate Please use the space below to provide any additional comments.
………………………………………………………………………...…........................................................................................................................................................................................................................................................................................................
1 2 3
Q37 How has access to welfare provision changed in your local area over the last ten years?
For the Better
Stayed the Same
Got Worse
Please use the space below to provide any additional comments.
…………………………………………………………………………............................................................................................................................................................................................................................................................................................................
1 2 3
Section 6 – Recreation Facilities and Community Activities
Q38 For your local area, please write in the number of local meeting rooms / halls available for public use.
Village Hall Church / Chapel Hall
Community Centre School Hall
Other
……….….1 ……….…..2 ……….…..3 ……….….4 ……….…5
Q39
For your local area, write in the number of formal play areas with equipment for children.
Number of formal play areas with equipment
……….………………………..1
Q40 Please indicate where the nearest recreational facilities are located
Within local area Adjacent council area Further away If further away please indicate approx. distance (miles)
Don’t know

50
Swimming Pool 1 2 3
....................4 9 Sports Hall 1 2 3 ....................4
9 Playing Field 1 2 3 ....................4
9 Q41 Are any of the following sports events, tournaments or other community activities
held in your local area? (tick as appropriate)
Sports club
Sports Event
Pub Games
Art or Music Events
Eisteddfodau
Shows (agricultural / horticultural)
Others (please specify)
None Don’t know
1 2 3 4 5 6
..............…………
............….……….
............………….7
8 9
Q42
Do any of the following youth groups/clubs operate within your local area?
(tick as appropriate)
Beavers/ Rainbows /Cubs / Brownies/ Guides/ Rangers/ Explorer Scouts / Network
Youth Social Clubs
Urdd Young Farmers Club
Others (please specify)
None Don’t know
1 2 3 4
..……….. ………… ………...5
6 7
Q43a Do recreational clubs for the retired or over 60s operate in your local area, and how
frequently do they meet?
Yes No Don’t Know
Daily
Weekly Fortnightly Monthly
Less than monthly
1 2 3 4 5 6 7 8
Q43b What type of activity takes place at these clubs?
.............................................................................................................................................................................. Q44
How do you rate the level of recreational facility provision in your local area?
Good
Bad Adequate Please use the space below to provide any additional comments.
…………………………………………………………………………...........................................................................................................................................................................................................................................................................................................
1 2 3
Q45 How do you rate the level of community activity provision in your local area?
Good
Bad Adequate Please use the space below to provide any additional comments.
…………………………………………………………………………...........................................................................................................................................................................................................................................................................................................
1 2 3
Section 7 – Transport
Q46 Please provide information about local bus services operating in your local area.
a) How many days each week do local buses operate? (enter number 0-7)
............................1
Between 0900 and After 1800 hours

51
b) At what times of day do local buses operate? At peak times* (tick box)
1500 hours (tick box) (tick box)
2 3 4 * Peak times are defined as 0700-0900 and 1500-1800 Monday to Friday
Q47 For your local area please tick the appropriate boxes to tell us about other transport services operating in your area
Dial-a-ride
Community-run minibus / taxi
Supermarket bus
School bus Train service and station
Other (write in)
None
1 2 3 4 5
…………........6 7
Q48 Please indicate if the provision of public transport in your local area has changed in the last three years.
Increased Decreased
Stayed the same
Don’t know Comment
Public Transport 1 2 3 4 ........................................................................5
Q49 How do you rate the level of public transport provision in your local area?
Good
Bad Adequate Please use the space below to provide any additional comments.
…………………………………………………………………………............................................................................................................................................................................................................................................................................................................
1 2 3
Section 8 – Emergency Services Q50
How do you rate the provision of the following emergency services in your local area?
Very Good
Good Satisfactory Poor Very Poor
Comments
Police 1 2 3 4 5
............................................
............................................
...................................................................
Fire and Rescue 1 2 3 4 5
............................................
............................................
...................................................................
Ambulance
1 2 3 4 5
............................................
............................................
...................................................................
Section 9 – Community Recycling
Q51 Please indicate if your local area has any of the following recycling services provided
by the Local Authority, Town or Community Council, or voluntary organisation. Tick all that apply.
Bottle Bank Clothes Recycling
Paper recycling
Cans and plastics
None Regular door-to-door
collection of any of these
Local Authority
1 2 3 4 5 7
Town or Community Council
1 2 3 4 5 7
Voluntary Organisation 1 2 3 4 5 7

52
Q52 How do you rate the level of community recycling provision in your local area?
Good
Bad Adequate Please use the space below to provide any additional comments.
…………………………………………………………………………............................................................................................................................................................................................................................................................................................................
1 2 3
Section 10 – Additional Information
Q53 Please list the major item(s) paid for by the local precept during the financial year 2012/2013
(please rank in order of highest expenditure).
1.....................................................
2.....................................................
3.....................................................
4.....................................................
Q54 Please use the space provided below to make any additional comments regarding the quality and
accessibility of services in your local area.
……………………………………………………………………………………………………………………………………………………………………………………………………………………………………………………………………………………………………………………………………………………………………………………………………………………………………………………………………………………………………………………………………………………………………………………………………………………………………………………………………………………………………………………………………………………...................................………………………………………………………………………………………………….................................………………………………………………………………………………………………….................................………………………………………………………………………………………………….................................………………………………………………………………………………………………….................................………………………………………………………………………………………………….................................................. Q55 Please use the space provided below to make any additional comments about the types of problems
experienced by particular groups in terms of accessing services in your local area.
……………………………………………………………………………………………………………………………………………………………………………………………………………………………………………………………………………………………………………………………………………………………………………………………………………………………………………………………………………………………………………………………………………………………………………………………………………………………………………………………………………………………………………………………………………………...................................………………………………………………………………………………………………….................................………………………………………………………………………………………………….................................………………………………………………………………………………………………….................................………………………………………………………………………………………………….................................………………………………………………………………………………………………….................................................. Q56 Please use the space provided below to make any additional comments about the ways in which service
provision in your local area has been affected by the recent economic downturn.
……………………………………………………………………………………………………………………………………………………………………………………………………………………………………………………………………………………………………………………………………………………………………………………………………………………………………………………

53
………………………………………………………………………………………………………………………………………………………………………………………………………………………………………………………………………………………………...................................………………………………………………………………………………………………….................................………………………………………………………………………………………………….................................………………………………………………………………………………………………….................................………………………………………………………………………………………………….................................………………………………………………………………………………………………….................................................. Q57 Please use the space provided below to make any additional comments about changes to the way
services function in the local area (e.g. facilities with multiple functions, community run services, mobile
services or outreach facilities)
……………………………………………………………………………………………………………………………………………………………………………………………………………………………………………………………………………………………………………………………………………………………………………………………………………………………………………………………………………………………………………………………………………………………………………………………………………………………………………………………………………………………………………………………………………………...................................………………………………………………………………………………………………….................................………………………………………………………………………………………………….................................………………………………………………………………………………………………….................................………………………………………………………………………………………………….................................………………………………………………………………………………………………….................................................. Thank you for taking the time to complete this questionnaire. Would you be willing to take part in further
research concerning some of the issues raised in this survey?
If YES, please provide your contact details below. Name ___________________________________________ Contact Telephone No ___________________________________________ e-mail address ___________________________________________ If you have any queries when completing this form please contact the Wales Rural Observatory on 029 208 74970 or email [email protected]

54
APPENDIX TWO
LETTERS TO COMMUNITY COUNCILS
Ysgol Cynllunio a Daearyddiaeth Caerdydd Cardiff School of Planning and Geography Prifysgol Caerdydd, Rhodfa Brenin Edward VII Cardiff University, King Edward VII Avenue Caerdydd, CF10 3WA Cardiff, CF10 3WA
Ffôn: 029 20 874 970 Tel: 029 20 874 970 www.arsyllfawledigcymru.org.uk www.walesruralobservatory.org.uk
INSERT DATE Dear Sir / Madam,
Wales Rural Observatory – Services Survey 2013 Please find enclosed a copy of the questionnaire for the Wales Rural Observatory Services survey for 2013, for completion by yourself or the chair of your council. The Wales Rural Observatory is a research centre at Cardiff and Aberystwyth universities and is funded by the Welsh Government to undertake economic, social and environmental research in rural Wales. For information on the Wales Rural Observatory, including a range of research reports, please visit our website: www.walesruralobservatory.org.uk. This survey is supported by One Voice Wales, the representative organisation for community and town councils throughout Wales. All of the questions relate to your community or town council area and the information will be used by the Wales Rural Observatory to develop a broader understanding of service provision across Wales; to assist One Voice Wales; and to inform the policies of the Welsh Government. Please note that completion of the questionnaire is voluntary and the information that you provide will be treated as confidential. Completion of the questionnaire should take approximately 20 minutes. The preferred method for completion is online. To access this questionnaire, please visit our website: http://www.walesruralobservatory.org.uk. The questionnaire can be completed in either English or Welsh. Alternatively, if you prefer to complete the enclosed paper copy, please return it in the Freepost envelope provided. Please reply by the XXXX. If you have any queries, please contact the Wales Rural Observatory: Telephone: 029 20 874 970; e-mail: [email protected]. Thank you for taking the time to complete this questionnaire. Yours faithfully, Jonathan Radcliffe

55
APPENDIX THREE
The distribution of communities in Wales with reference to the 1,000 person threshold