running a cx journey mapping design session
TRANSCRIPT
Journey Mapping – Designing your experience
Everything you need to take the 2nd step in Journey Mapping
This presentation is designed for a Journey Mapping Facilitator and/or event
sponsor that have already experienced a Journey Mapping “Learn” event and
want to move to the next step by implementing a “Design” session.
We seek to provide you with tools and techniques you might need to keep
moving forward with your customer centered transformation.
If you have any questions, the team at Oracle is eager to help. designingcx.com
What’s in this presentation?
Goals & overview of a Journey Mapping “Design” session
Preparing for your session
Running your session
Sample materials: Personas, Metrics, etc.
1
2
3
4
GOALS & OVERVIEW1
What are the Goals?
• Primary Goal: Experience how Journey Mapping will work
for your customers & your business
• Expand the reach & prepare internal teams to apply CXJM
in your day to day business
• Identify projects that are worth pursuing
1
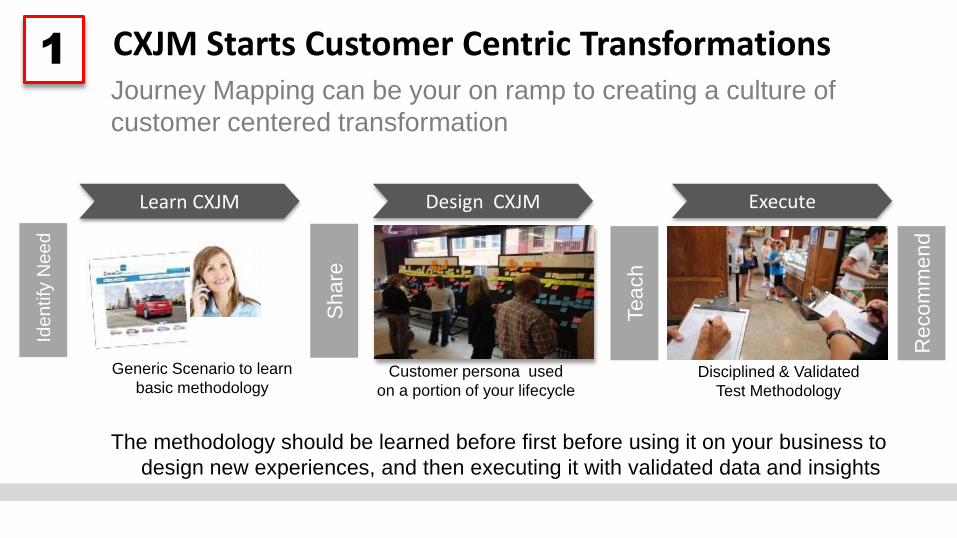
Customer persona used
on a portion of your lifecycle
Disciplined & Validated
Test Methodology
Generic Scenario to learn
basic methodology
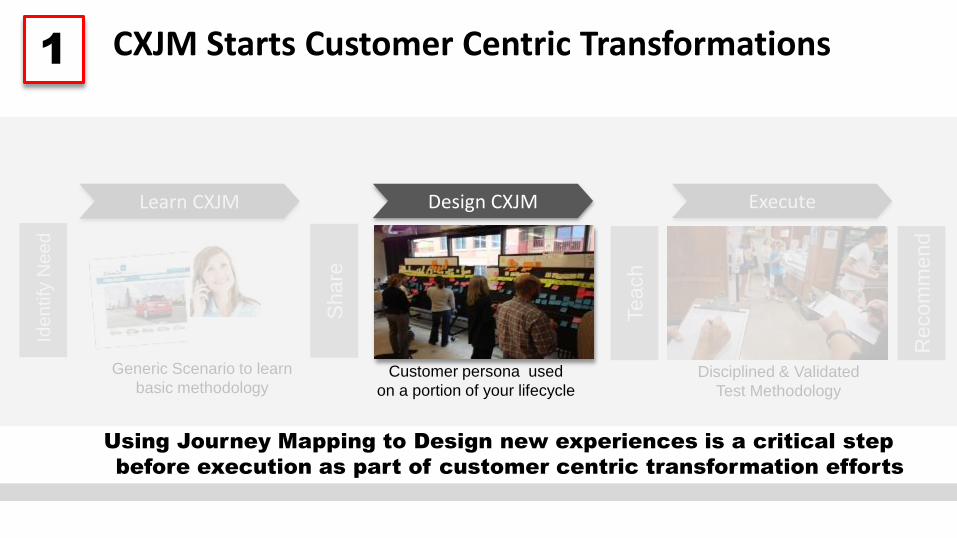
CXJM Starts Customer Centric Transformations
Learn CXJM
Share
Teach
Execute
Identify
Need
Re
co
mm
en
d
Design CXJM
1
The methodology should be learned before first before using it on your business to
design new experiences, and then executing it with validated data and insights
Journey Mapping can be your on ramp to creating a culture of
customer centered transformation
Disciplined & Validated
Test Methodology
Generic Scenario to learn
basic methodology
Learn CXJM
Share
Teach
Execute
Identify
Need
Re
co
mm
en
d
Customer persona used
on a portion of your lifecycle
CXJM Starts Customer Centric Transformations
Design CXJM
1
Using Journey Mapping to Design new experiences is a critical step
before execution as part of customer centric transformation efforts
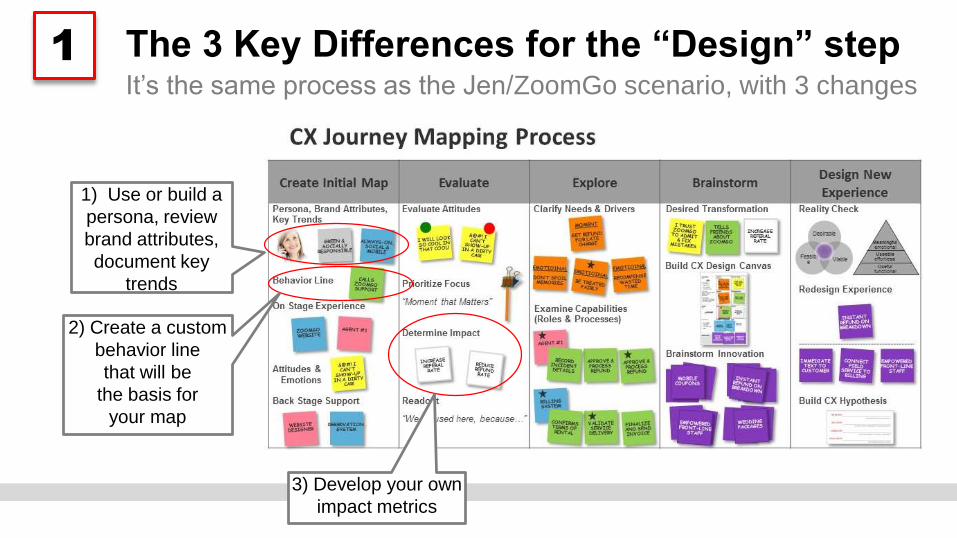
The 3 Key Differences for the “Design” stepIt’s the same process as the Jen/ZoomGo scenario, with 3 changes
1) Use or build a
persona, review
brand attributes,
document key
trends
2) Create a custom
behavior line
that will be
the basis for
your map
3) Develop your own
impact metrics
1
Goals & overview1
3
4
PREPARING FOR YOUR SESSION2
Running your session
Sample materials
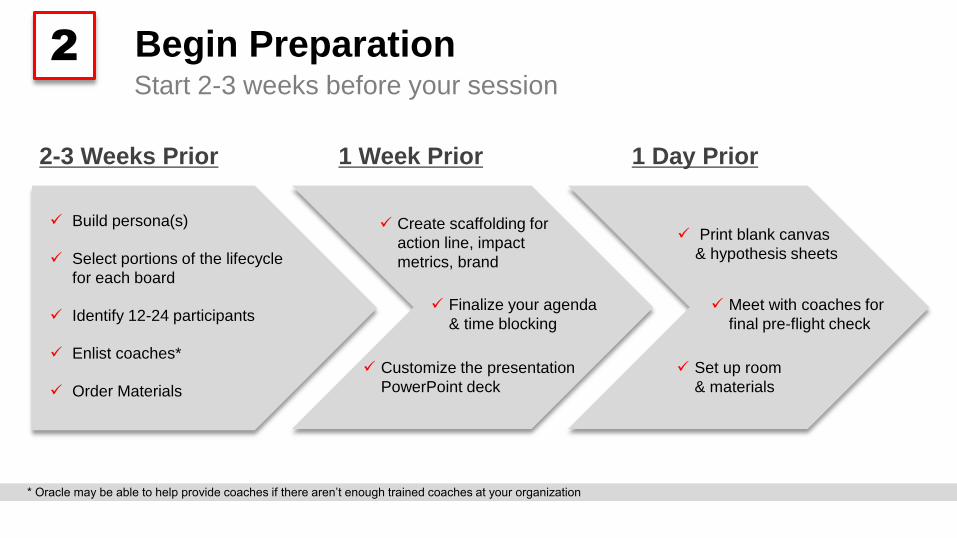
Begin PreparationStart 2-3 weeks before your session
2
Build persona(s)
Select portions of the lifecycle
for each board
Identify 12-24 participants
Enlist coaches*
Order Materials
Set up room
& materials
Finalize your agenda
& time blocking
Customize the presentation
PowerPoint deck
2-3 Weeks Prior 1 Week Prior 1 Day Prior
Meet with coaches for
final pre-flight check
Create scaffolding for
action line, impact
metrics, brand
Print blank canvas
& hypothesis sheets
* Oracle may be able to help provide coaches if there aren’t enough trained coaches at your organization
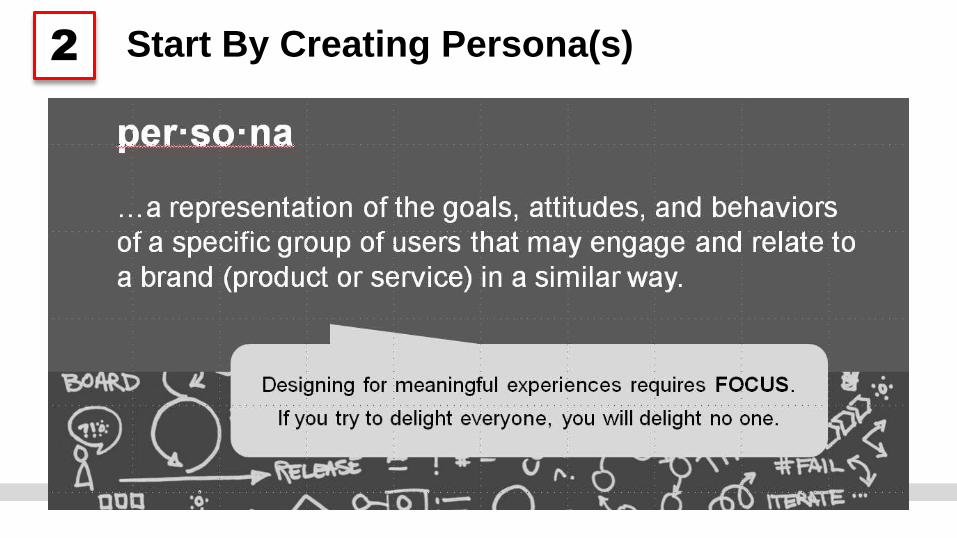
Start By Creating Persona(s)2
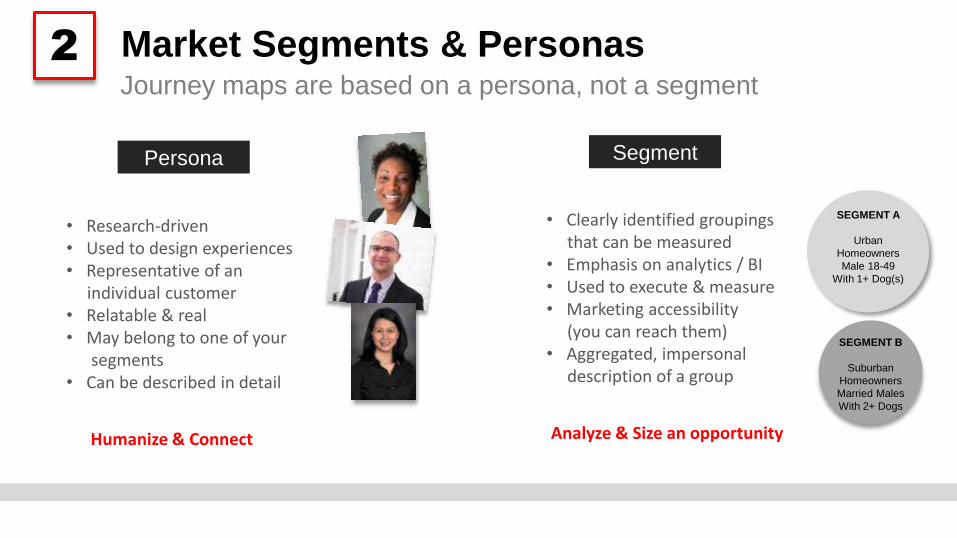
Market Segments & PersonasJourney maps are based on a persona, not a segment
• Clearly identified groupings that can be measured
• Emphasis on analytics / BI• Used to execute & measure• Marketing accessibility
(you can reach them)• Aggregated, impersonal
description of a group
Analyze & Size an opportunity
2
Segment
SEGMENT A
Urban
Homeowners
Male 18-49
With 1+ Dog(s)
SEGMENT B
Suburban
Homeowners
Married Males
With 2+ Dogs
Persona
• Research-driven• Used to design experiences• Representative of an
individual customer• Relatable & real• May belong to one of your
segments• Can be described in detail
Humanize & Connect
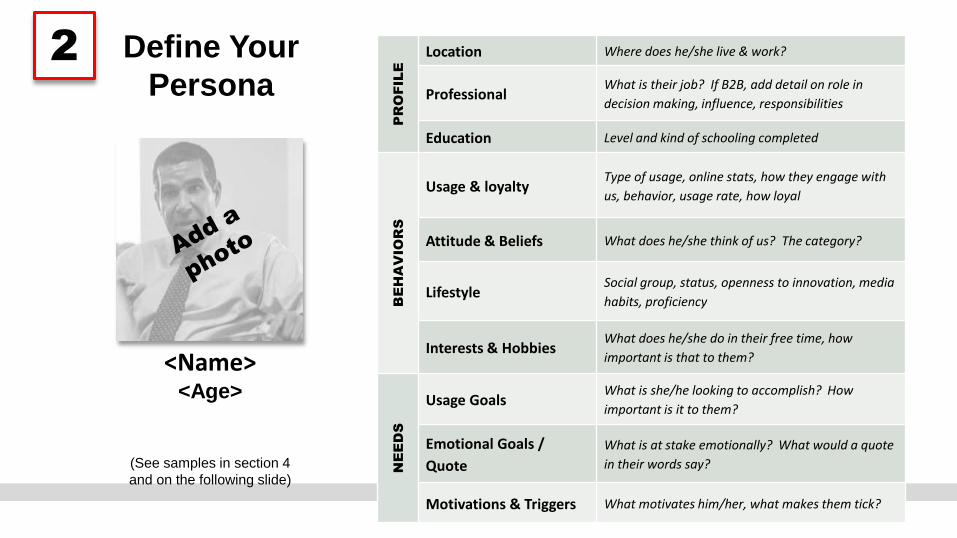
Define Your
Persona
PR
OFILE
Location Where does he/she live & work?
Professional What is their job? If B2B, add detail on role in
decision making, influence, responsibilities
Education Level and kind of schooling completed
BE
HA
VIO
RS
Usage & loyaltyType of usage, online stats, how they engage with
us, behavior, usage rate, how loyal
Attitude & Beliefs What does he/she think of us? The category?
LifestyleSocial group, status, openness to innovation, media
habits, proficiency
Interests & HobbiesWhat does he/she do in their free time, how
important is that to them?
NE
ED
SUsage Goals
What is she/he looking to accomplish? How
important is it to them?
Emotional Goals /
Quote
What is at stake emotionally? What would a quote
in their words say?
Motivations & Triggers What motivates him/her, what makes them tick?
<Name><Age>
(See samples in section 4
and on the following slide)
2
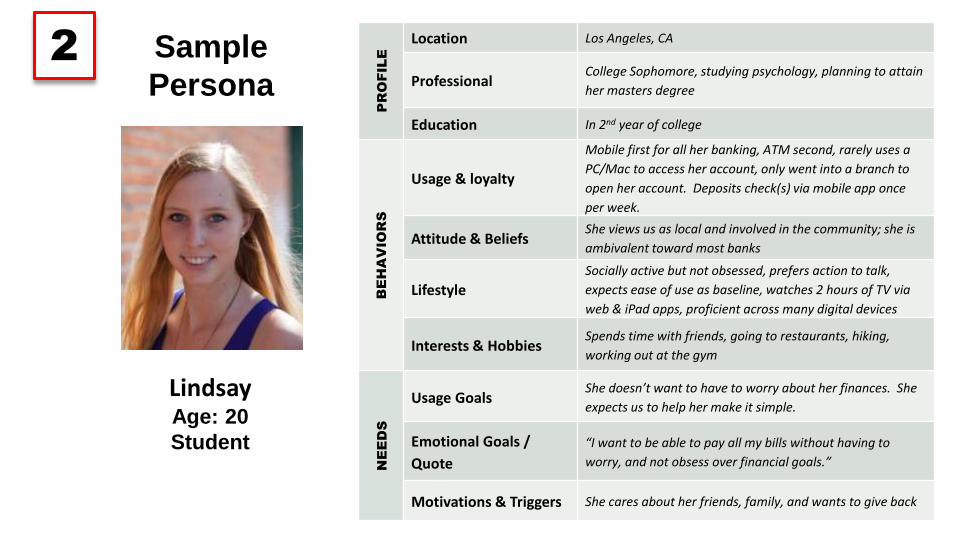
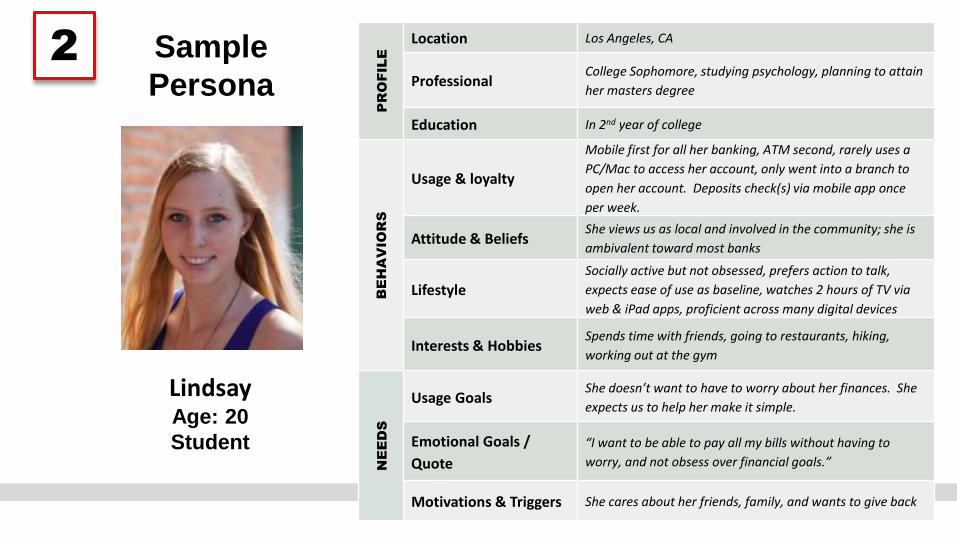
Sample
Persona
PR
OFILE
Location Los Angeles, CA
Professional College Sophomore, studying psychology, planning to attain
her masters degree
Education In 2nd year of college
BE
HA
VIO
RS
Usage & loyalty
Mobile first for all her banking, ATM second, rarely uses a
PC/Mac to access her account, only went into a branch to
open her account. Deposits check(s) via mobile app once
per week.
Attitude & BeliefsShe views us as local and involved in the community; she is
ambivalent toward most banks
Lifestyle
Socially active but not obsessed, prefers action to talk,
expects ease of use as baseline, watches 2 hours of TV via
web & iPad apps, proficient across many digital devices
Interests & HobbiesSpends time with friends, going to restaurants, hiking,
working out at the gym
NE
ED
S
Usage GoalsShe doesn’t want to have to worry about her finances. She
expects us to help her make it simple.
Emotional Goals /
Quote
“I want to be able to pay all my bills without having to
worry, and not obsess over financial goals.”
Motivations & Triggers She cares about her friends, family, and wants to give back
LindsayAge: 20
Student
2
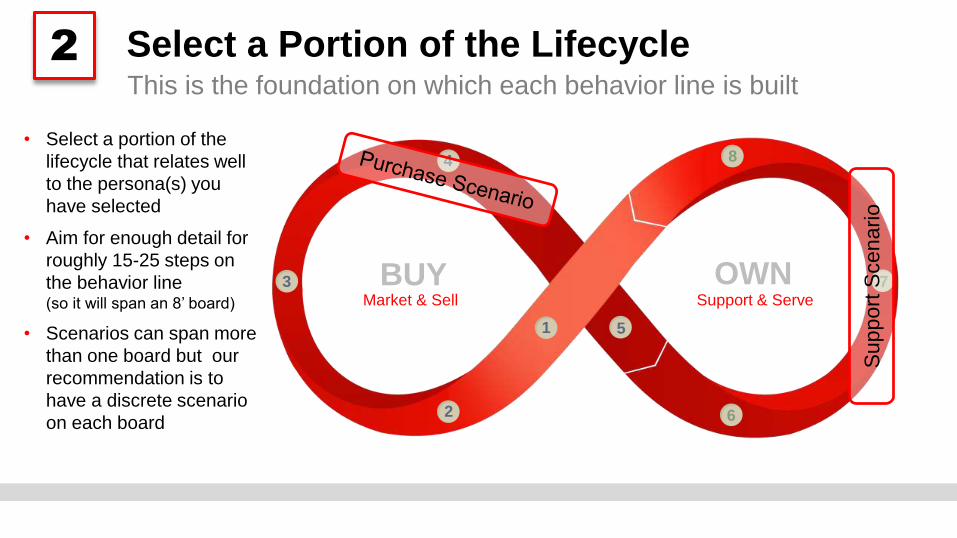
Select a Portion of the Lifecycle
• Select a portion of the
lifecycle that relates well
to the persona(s) you
have selected
• Aim for enough detail for
roughly 15-25 steps on
the behavior line (so it will span an 8’ board)
• Scenarios can span more
than one board but our
recommendation is to
have a discrete scenario
on each board
This is the foundation on which each behavior line is built
1
2
3
4
5
6
7
8
BUY OWNSupport & ServeMarket & Sell
Supp
ort
Scenario
2
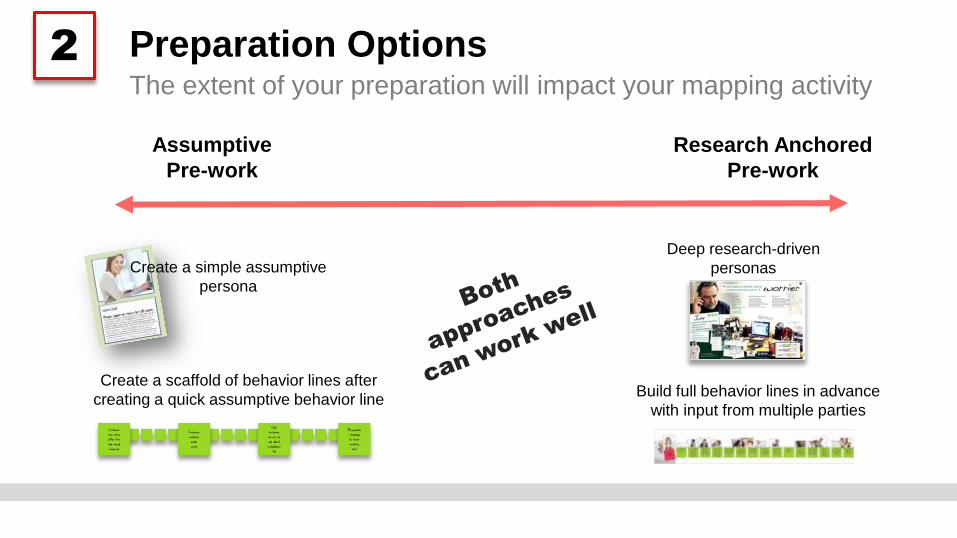
Preparation OptionsThe extent of your preparation will impact your mapping activity
Create a scaffold of behavior lines after
creating a quick assumptive behavior lineBuild full behavior lines in advance
with input from multiple parties
Create a simple assumptive
persona
Deep research-driven
personas
Assumptive
Pre-work
Research Anchored
Pre-work
2
Calls customer service to ask about installation
fee
Customer sees online offer for high speed Internet
Downgrades package to lower monthly cost
Customer initiates order online
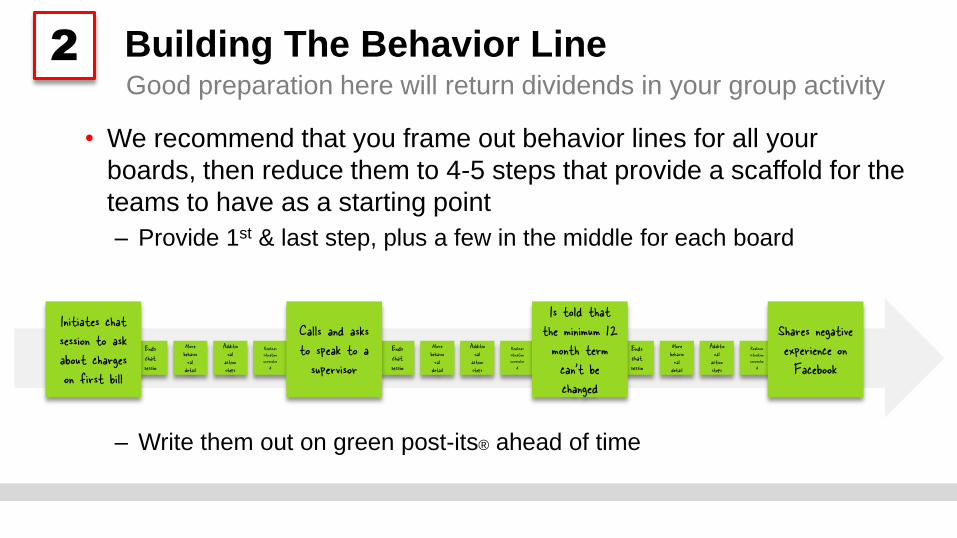
Building The Behavior Line
• We recommend that you frame out behavior lines for all your
boards, then reduce them to 4-5 steps that provide a scaffold for the
teams to have as a starting point
– Provide 1st & last step, plus a few in the middle for each board
– Write them out on green post-its® ahead of time
Good preparation here will return dividends in your group activity
2
Ends chat sessio
More behavioral
detail
Additional
action steps
Realizes situation unresolve
d
Ends chat sessio
More behavioral
detail
Additional
action steps
Realizes situation unresolve
d
Ends chat sessio
More behavioral
detail
Additional
action steps
Realizes situation unresolve
d
Calls and asks to speak to a supervisor
Shares negative experience on Facebook
Initiates chat session to ask about charges on first bill
Is told that the minimum 12 month term can’t be changed
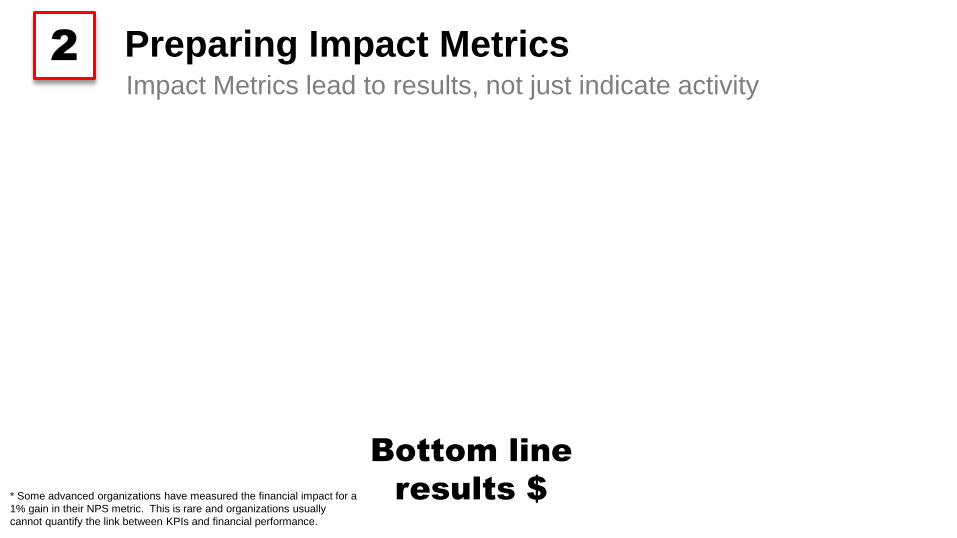
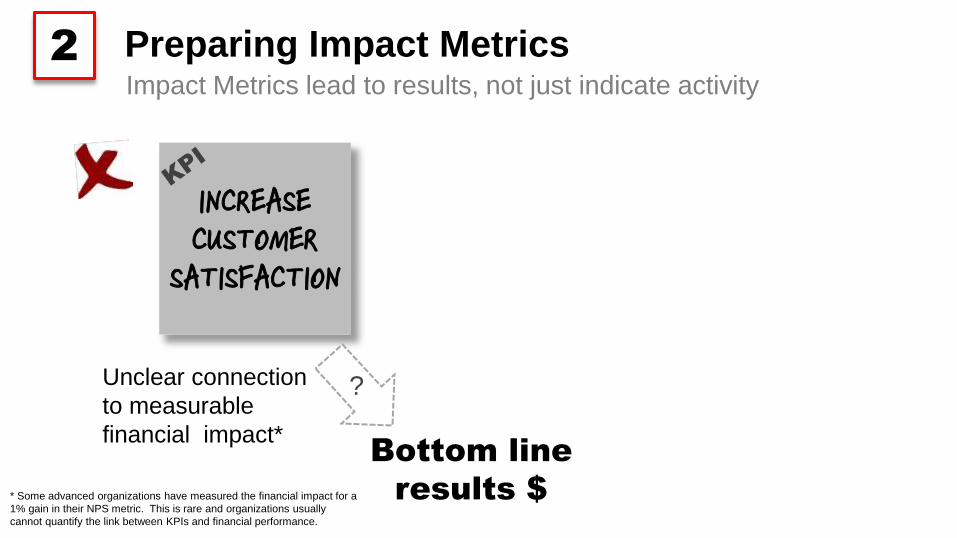
Preparing Impact MetricsImpact Metrics lead to results, not just indicate activity
2
Bottom line
results $* Some advanced organizations have measured the financial impact for a
1% gain in their NPS metric. This is rare and organizations usually
cannot quantify the link between KPIs and financial performance.
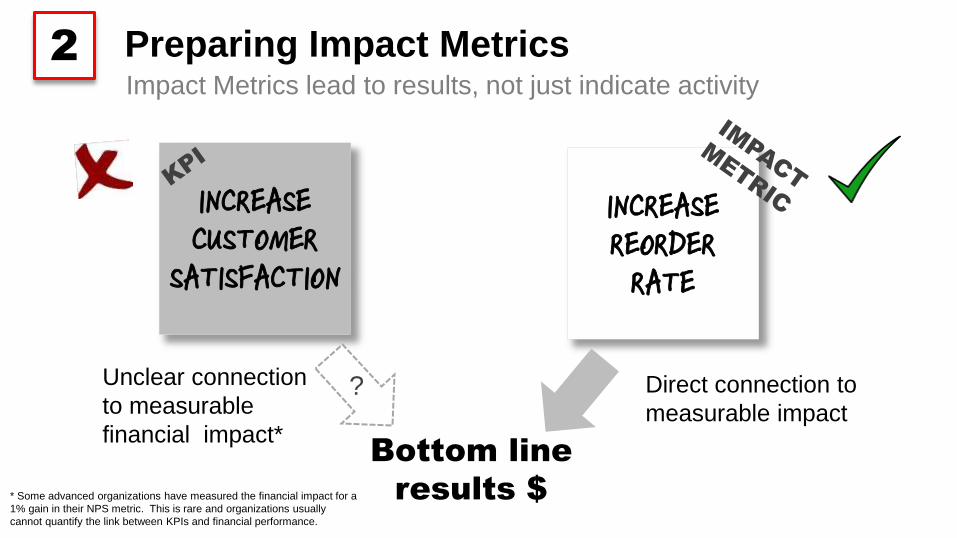
Preparing Impact MetricsImpact Metrics lead to results, not just indicate activity
2
INCREASE CUSTOMER
SATISFACTION
Bottom line
results $
Unclear connection
to measurable
financial impact*
?
* Some advanced organizations have measured the financial impact for a
1% gain in their NPS metric. This is rare and organizations usually
cannot quantify the link between KPIs and financial performance.
Preparing Impact MetricsImpact Metrics lead to results, not just indicate activity
2
INCREASE REORDERRATE
INCREASE CUSTOMER
SATISFACTION
Bottom line
results $
Direct connection to
measurable impact
Unclear connection
to measurable
financial impact*
?
* Some advanced organizations have measured the financial impact for a
1% gain in their NPS metric. This is rare and organizations usually
cannot quantify the link between KPIs and financial performance.
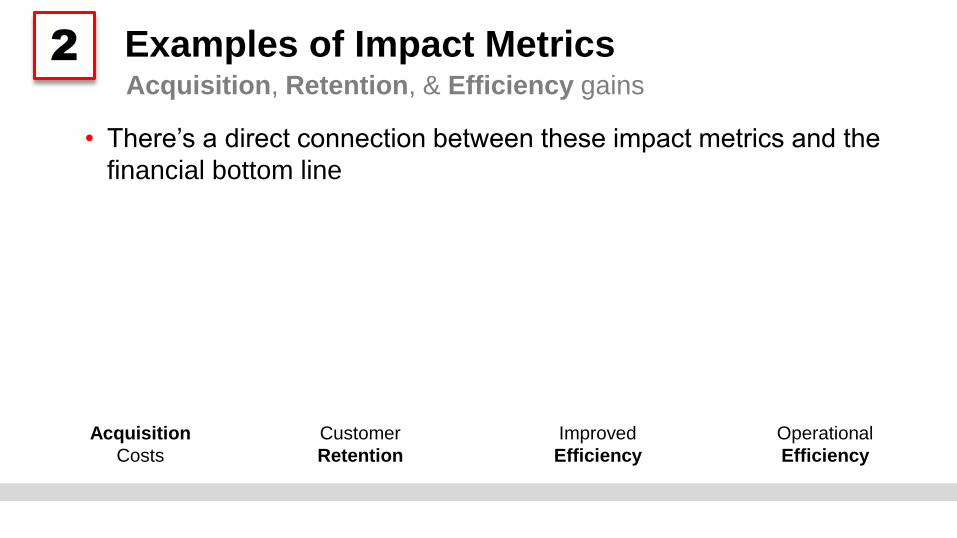
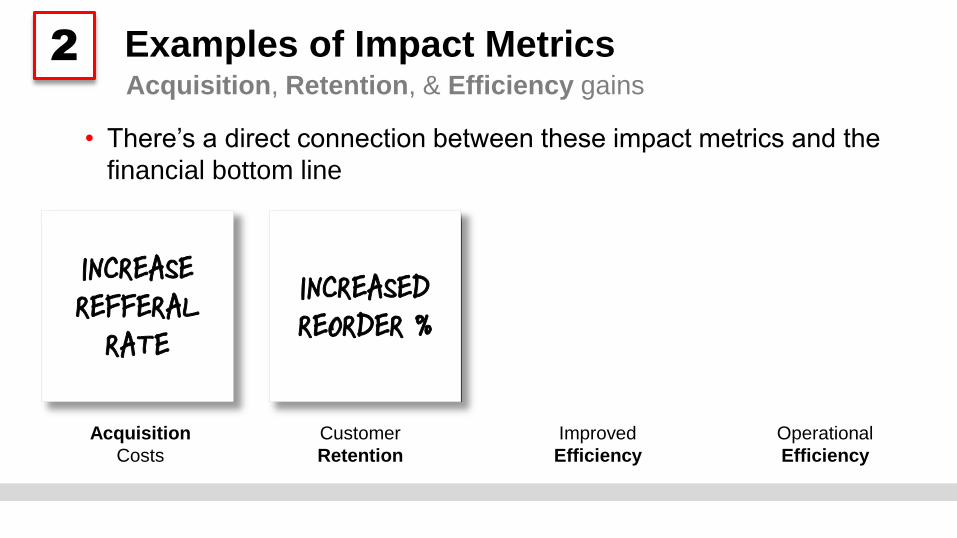
Examples of Impact Metrics
• There’s a direct connection between these impact metrics and the
financial bottom line
Acquisition, Retention, & Efficiency gains
2
Acquisition
Costs
Customer
Retention
Operational
Efficiency
Improved
Efficiency
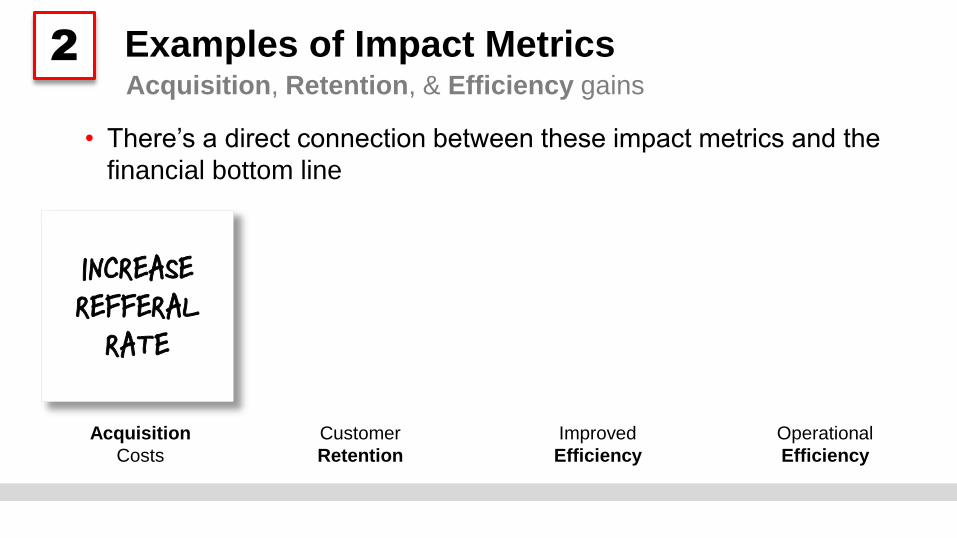
Examples of Impact Metrics
• There’s a direct connection between these impact metrics and the
financial bottom line
Acquisition, Retention, & Efficiency gains
2
INCREASE REFFERAL
RATE
Acquisition
Costs
Customer
Retention
Operational
Efficiency
Improved
Efficiency
Examples of Impact Metrics
• There’s a direct connection between these impact metrics and the
financial bottom line
Acquisition, Retention, & Efficiency gains
2
INCREASE REFFERAL
RATE
INCREASED REORDER %
Acquisition
Costs
Customer
Retention
Operational
Efficiency
Improved
Efficiency
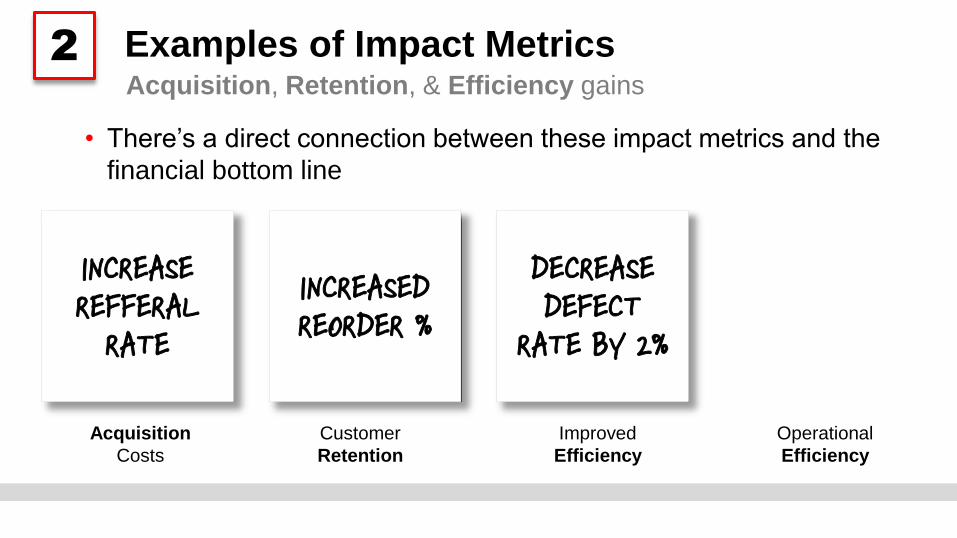
Examples of Impact Metrics
• There’s a direct connection between these impact metrics and the
financial bottom line
Acquisition, Retention, & Efficiency gains
2
INCREASE REFFERAL
RATE
DECREASEDEFECT
RATE BY 2%
INCREASED REORDER %
Acquisition
Costs
Customer
Retention
Operational
Efficiency
Improved
Efficiency
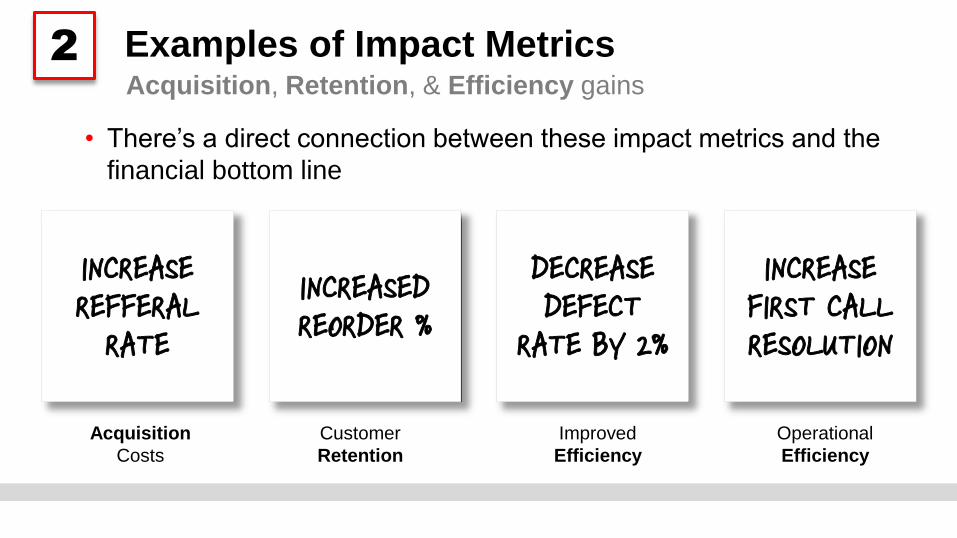
Examples of Impact Metrics
• There’s a direct connection between these impact metrics and the
financial bottom line
Acquisition, Retention, & Efficiency gains
2
INCREASE REFFERAL
RATE
DECREASEDEFECT
RATE BY 2%
INCREASEFIRST CALL RESOLUTION
INCREASED REORDER %
Acquisition
Costs
Customer
Retention
Operational
Efficiency
Improved
Efficiency
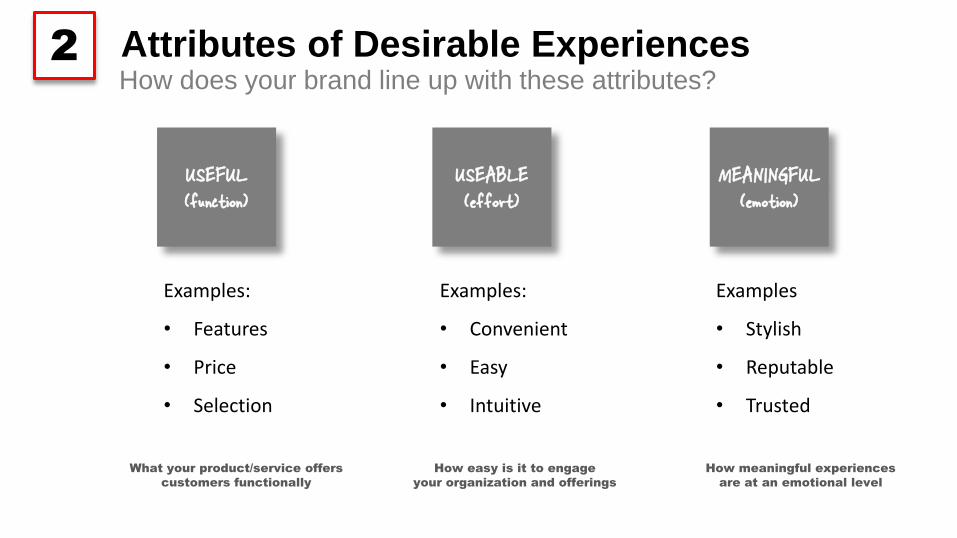
Attributes of Desirable Experiences
Examples:
• Features
• Price
• Selection
Examples:
• Convenient
• Easy
• Intuitive
Examples
• Stylish
• Reputable
• Trusted
USEFUL(function)
USEABLE(effort)
MEANINGFUL(emotion)
How does your brand line up with these attributes?
What your product/service offers
customers functionally
How easy is it to engage
your organization and offerings
How meaningful experiences
are at an emotional level
2
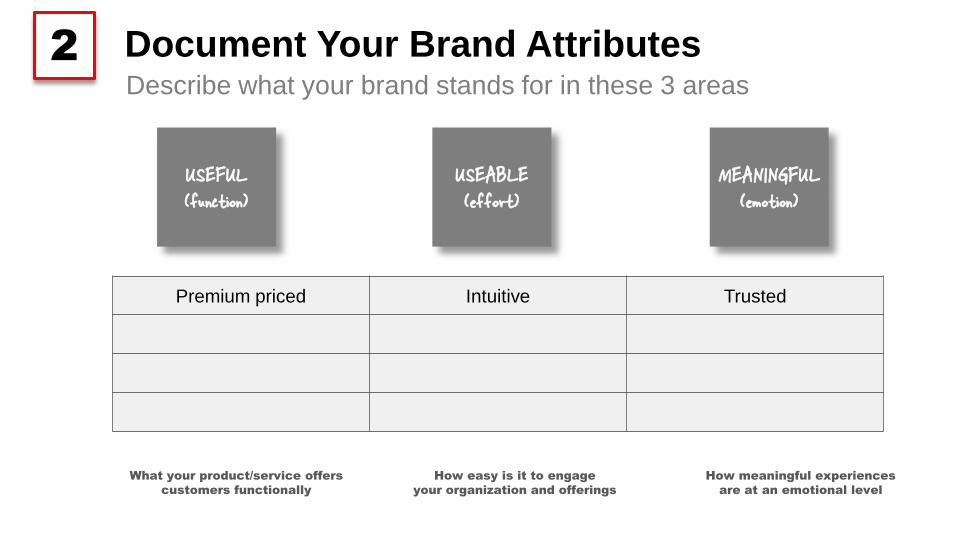
Document Your Brand AttributesDescribe what your brand stands for in these 3 areas
2
USEFUL(function)
USEABLE(effort)
MEANINGFUL(emotion)
Premium priced Intuitive Trusted
What your product/service offers
customers functionally
How easy is it to engage
your organization and offerings
How meaningful experiences
are at an emotional level
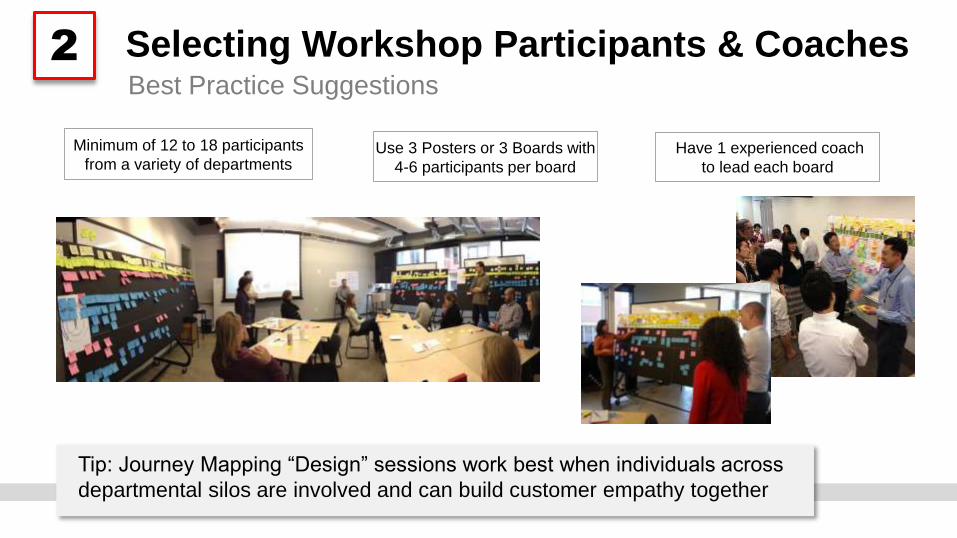
Selecting Workshop Participants & Coaches
Tip: Journey Mapping “Design” sessions work best when individuals across
departmental silos are involved and can build customer empathy together
Best Practice Suggestions
2
Have 1 experienced coach
to lead each board
Use 3 Posters or 3 Boards with
4-6 participants per board
Minimum of 12 to 18 participants
from a variety of departments
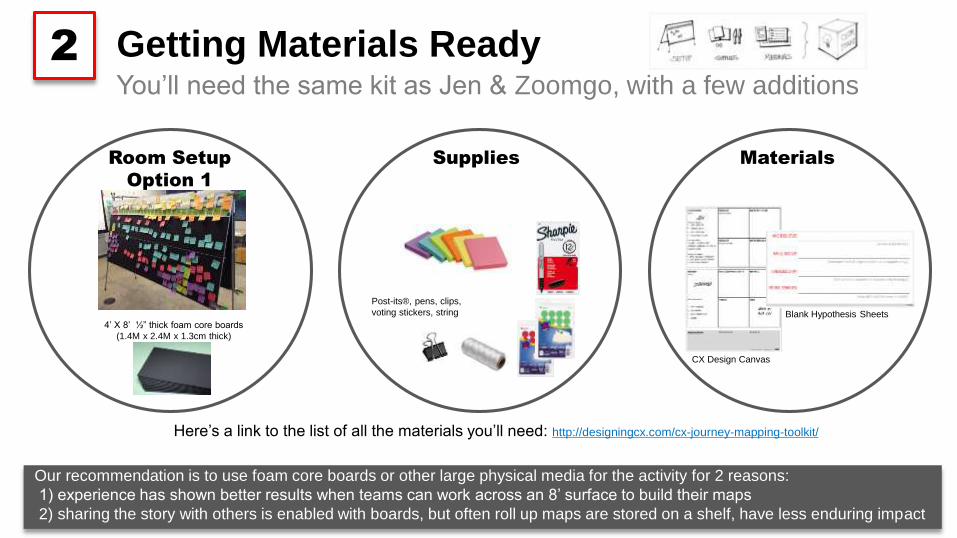
Getting Materials Ready
Here’s a link to the list of all the materials you’ll need: http://designingcx.com/cx-journey-mapping-toolkit/
You’ll need the same kit as Jen & Zoomgo, with a few additions
2
Room Setup
Option 1
Supplies Materials
Blank Hypothesis Sheets
CX Design Canvas
Post-its®, pens, clips,
voting stickers, string
4’ X 8’ ½” thick foam core boards
(1.4M x 2.4M x 1.3cm thick)
Our recommendation is to use foam core boards or other large physical media for the activity for 2 reasons:
1) experience has shown better results when teams can work across an 8’ surface to build their maps
2) sharing the story with others is enabled with boards, but often roll up maps are stored on a shelf, have less enduring impact
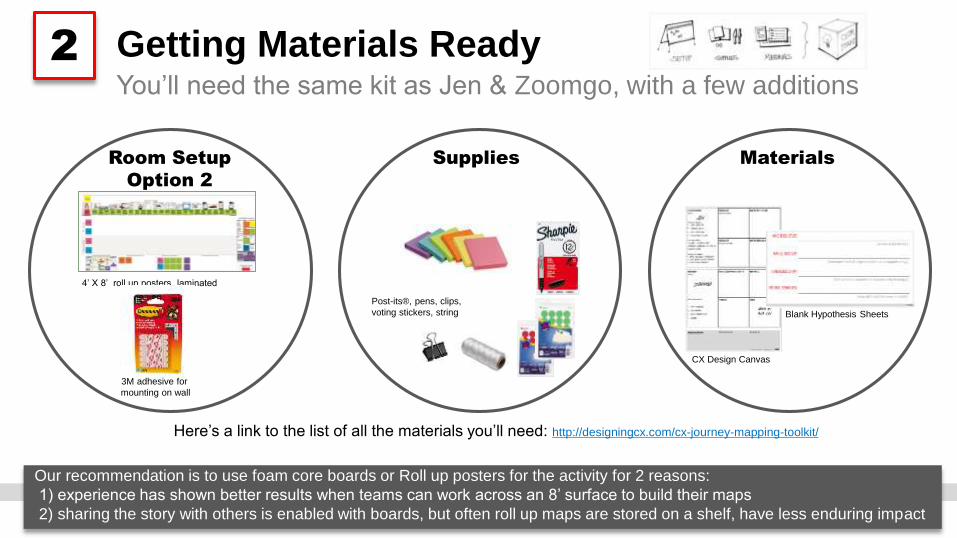
Getting Materials Ready
Here’s a link to the list of all the materials you’ll need: http://designingcx.com/cx-journey-mapping-toolkit/
You’ll need the same kit as Jen & Zoomgo, with a few additions
2
Room Setup
Option 2
Supplies Materials
Blank Hypothesis Sheets
CX Design Canvas
Post-its®, pens, clips,
voting stickers, string
4’ X 8’ roll up posters, laminated
Our recommendation is to use foam core boards or Roll up posters for the activity for 2 reasons:
1) experience has shown better results when teams can work across an 8’ surface to build their maps
2) sharing the story with others is enabled with boards, but often roll up maps are stored on a shelf, have less enduring impact
3M adhesive for
mounting on wall
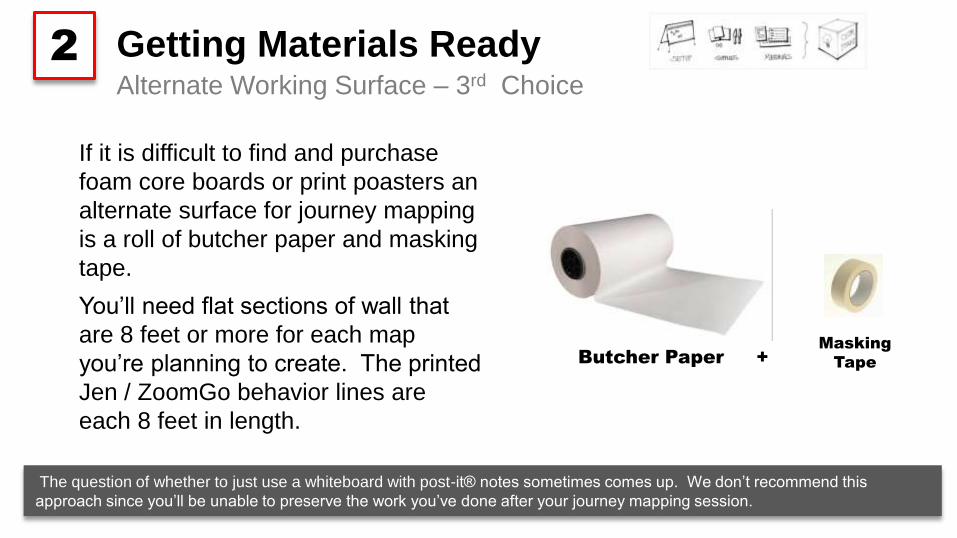
Getting Materials ReadyAlternate Working Surface – 3rd Choice
2
Butcher Paper +
Masking
Tape
The question of whether to just use a whiteboard with post-it® notes sometimes comes up. We don’t recommend this
approach since you’ll be unable to preserve the work you’ve done after your journey mapping session.
If it is difficult to find and purchase
foam core boards or print poasters an
alternate surface for journey mapping
is a roll of butcher paper and masking
tape.
You’ll need flat sections of wall that
are 8 feet or more for each map
you’re planning to create. The printed
Jen / ZoomGo behavior lines are
each 8 feet in length.
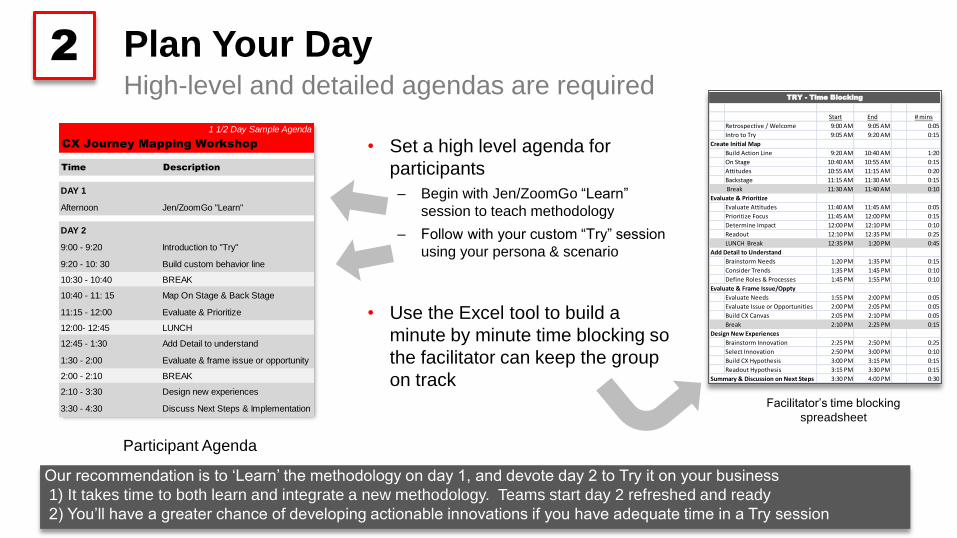
Plan Your Day
• Set a high level agenda for
participants
– Begin with Jen/ZoomGo “Learn”
session to teach methodology
– Follow with your custom “Try” session
using your persona & scenario
• Use the Excel tool to build a
minute by minute time blocking so
the facilitator can keep the group
on track
High-level and detailed agendas are required
2
Facilitator’s time blocking
spreadsheet
Participant Agenda
Our recommendation is to ‘Learn’ the methodology on day 1, and devote day 2 to Try it on your business
1) It takes time to both learn and integrate a new methodology. Teams start day 2 refreshed and ready
2) You’ll have a greater chance of developing actionable innovations if you have adequate time in a Try session
Start End # mins
Retrospective / Welcome 9:00 AM 9:05 AM 0:05
Intro to Try 9:05 AM 9:20 AM 0:15
Create Initial Map
Build Action Line 9:20 AM 10:40 AM 1:20
On Stage 10:40 AM 10:55 AM 0:15
Attitudes 10:55 AM 11:15 AM 0:20
Backstage 11:15 AM 11:30 AM 0:15
Break 11:30 AM 11:40 AM 0:10
Evaluate & Prioritize
Evaluate Attitudes 11:40 AM 11:45 AM 0:05
Prioritize Focus 11:45 AM 12:00 PM 0:15
Determine Impact 12:00 PM 12:10 PM 0:10
Readout 12:10 PM 12:35 PM 0:25
LUNCH Break 12:35 PM 1:20 PM 0:45
Add Detail to Understand
Brainstorm Needs 1:20 PM 1:35 PM 0:15
Consider Trends 1:35 PM 1:45 PM 0:10
Define Roles & Processes 1:45 PM 1:55 PM 0:10
Evaluate & Frame Issue/Oppty
Evaluate Needs 1:55 PM 2:00 PM 0:05
Evaluate Issue or Opportunities 2:00 PM 2:05 PM 0:05
Build CX Canvas 2:05 PM 2:10 PM 0:05
Break 2:10 PM 2:25 PM 0:15
Design New Experiences
Brainstorm Innovation 2:25 PM 2:50 PM 0:25
Select Innovation 2:50 PM 3:00 PM 0:10
Build CX Hypothesis 3:00 PM 3:15 PM 0:15
Readout Hypothesis 3:15 PM 3:30 PM 0:15
Summary & Discussion on Next Steps 3:30 PM 4:00 PM 0:30
TRY - Time Blocking
1 1/2 Day Sample Agenda
CX Journey Mapping Workshop
Time Description
DAY 1
Afternoon Jen/ZoomGo "Learn"
DAY 2
9:00 - 9:20 Introduction to "Try"
9:20 - 10: 30 Build custom behavior line
10:30 - 10:40 BREAK
10:40 - 11: 15 Map On Stage & Back Stage
11:15 - 12:00 Evaluate & Prioritize
12:00- 12:45 LUNCH
12:45 - 1:30 Add Detail to understand
1:30 - 2:00 Evaluate & frame issue or opportunity
2:00 - 2:10 BREAK
2:10 - 3:30 Design new experiences
3:30 - 4:30 Discuss Next Steps & Implementation
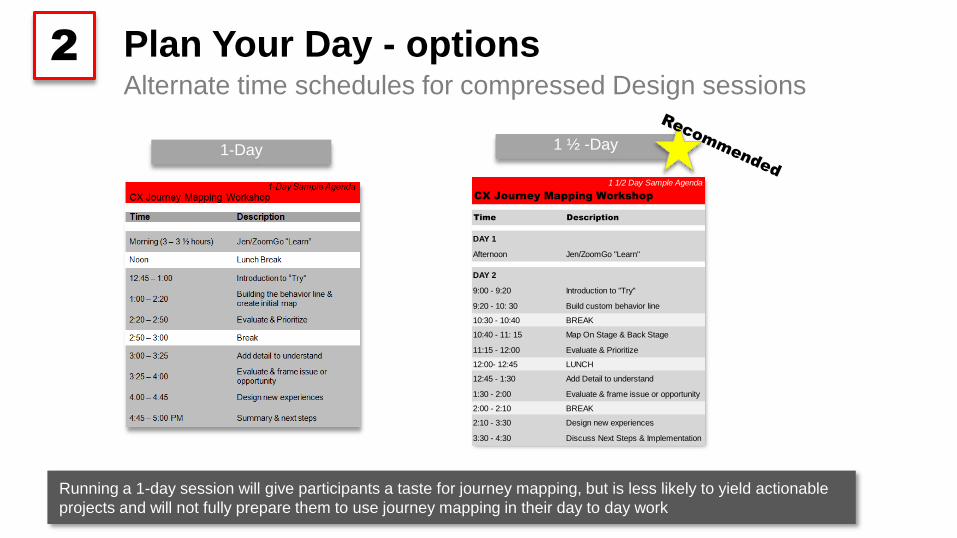
Plan Your Day - options
Running a 1-day session will give participants a taste for journey mapping, but is less likely to yield actionable
projects and will not fully prepare them to use journey mapping in their day to day work
Alternate time schedules for compressed Design sessions
2
1 ½ -Day1-Day
1 1/2 Day Sample Agenda
CX Journey Mapping Workshop
Time Description
DAY 1
Afternoon Jen/ZoomGo "Learn"
DAY 2
9:00 - 9:20 Introduction to "Try"
9:20 - 10: 30 Build custom behavior line
10:30 - 10:40 BREAK
10:40 - 11: 15 Map On Stage & Back Stage
11:15 - 12:00 Evaluate & Prioritize
12:00- 12:45 LUNCH
12:45 - 1:30 Add Detail to understand
1:30 - 2:00 Evaluate & frame issue or opportunity
2:00 - 2:10 BREAK
2:10 - 3:30 Design new experiences
3:30 - 4:30 Discuss Next Steps & Implementation
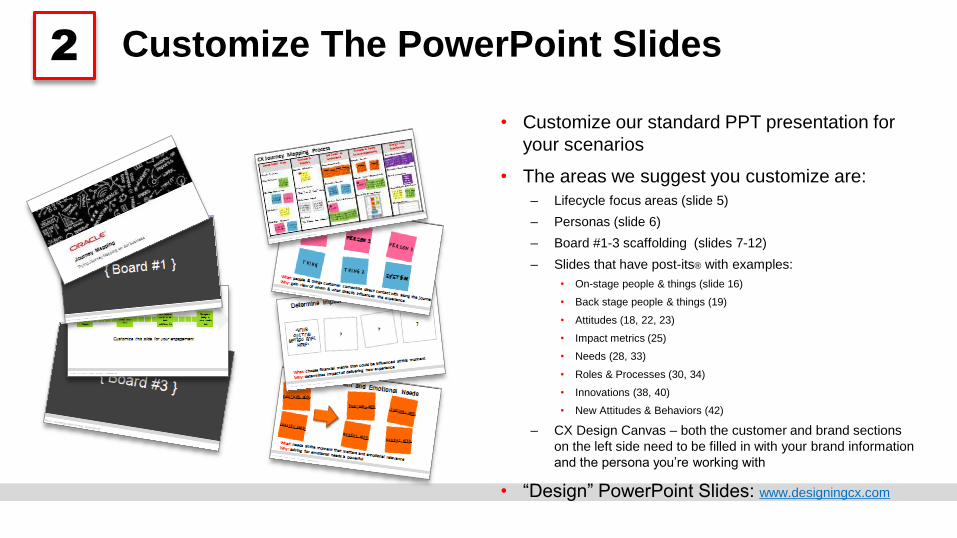
Customize The PowerPoint Slides
• Customize our standard PPT presentation for
your scenarios
• The areas we suggest you customize are:
– Lifecycle focus areas (slide 5)
– Personas (slide 6)
– Board #1-3 scaffolding (slides 7-12)
– Slides that have post-its® with examples:
• On-stage people & things (slide 16)
• Back stage people & things (19)
• Attitudes (18, 22, 23)
• Impact metrics (25)
• Needs (28, 33)
• Roles & Processes (30, 34)
• Innovations (38, 40)
• New Attitudes & Behaviors (42)
– CX Design Canvas – both the customer and brand sections
on the left side need to be filled in with your brand information
and the persona you’re working with
• “Design” PowerPoint Slides: www.designingcx.com
2
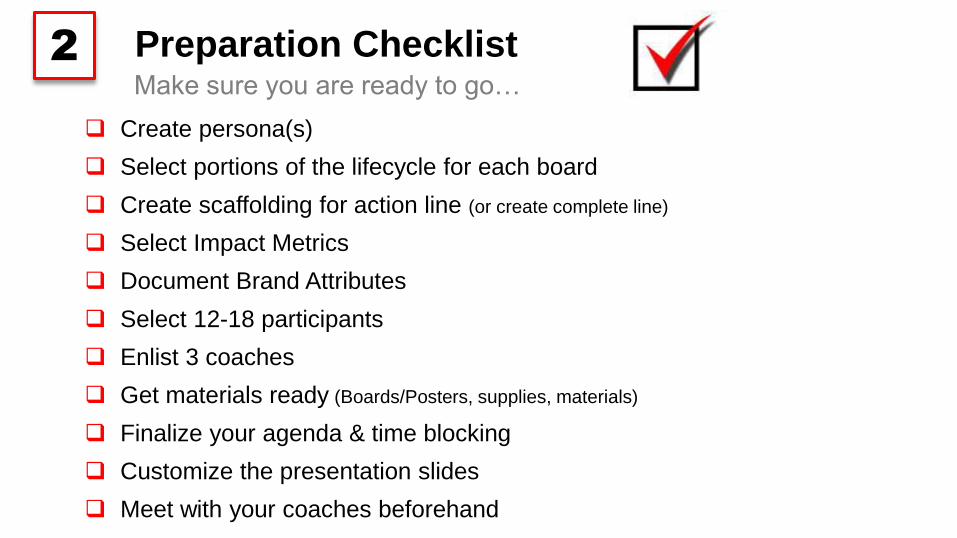
Preparation Checklist
Create persona(s)
Select portions of the lifecycle for each board
Create scaffolding for action line (or create complete line)
Select Impact Metrics
Document Brand Attributes
Select 12-18 participants
Enlist 3 coaches
Get materials ready (Boards/Posters, supplies, materials)
Finalize your agenda & time blocking
Customize the presentation slides
Meet with your coaches beforehand
Make sure you are ready to go…
2
Goals & overview1
4
2
RUNNING YOUR SESSION3
Sample Materials
Preparing for your session
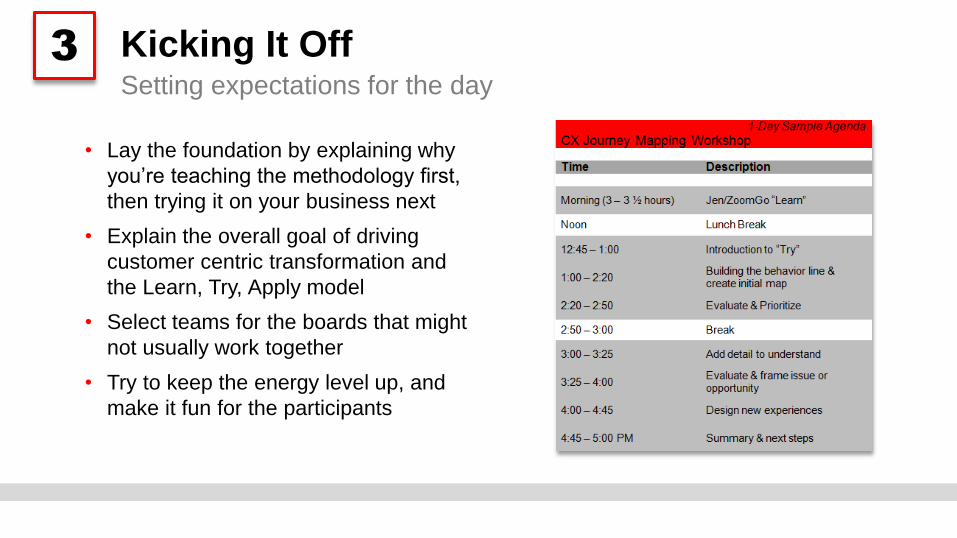
Kicking It Off
• Lay the foundation by explaining why
you’re teaching the methodology first,
then trying it on your business next
• Explain the overall goal of driving
customer centric transformation and
the Learn, Try, Apply model
• Select teams for the boards that might
not usually work together
• Try to keep the energy level up, and
make it fun for the participants
Setting expectations for the day
3
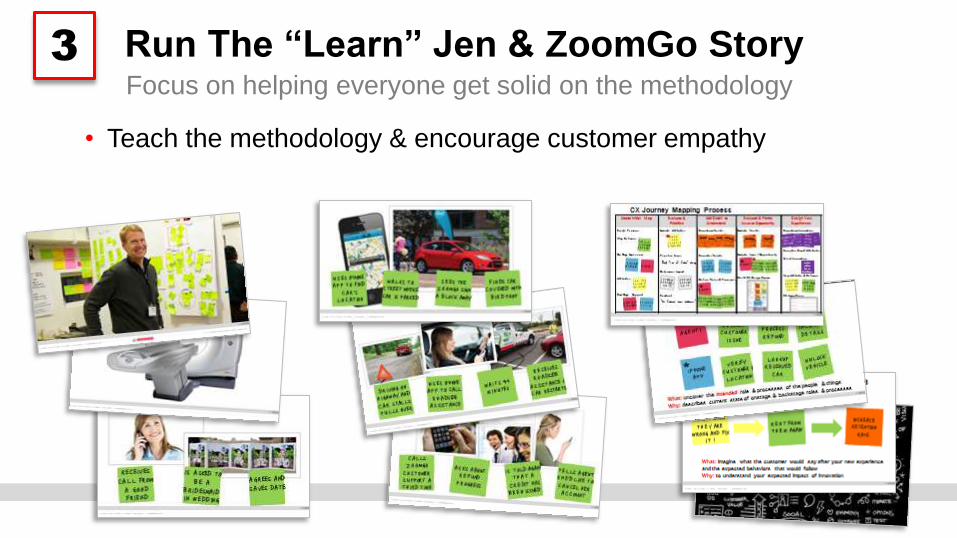
Run The “Learn” Jen & ZoomGo Story
• Teach the methodology & encourage customer empathy
Focus on helping everyone get solid on the methodology
3
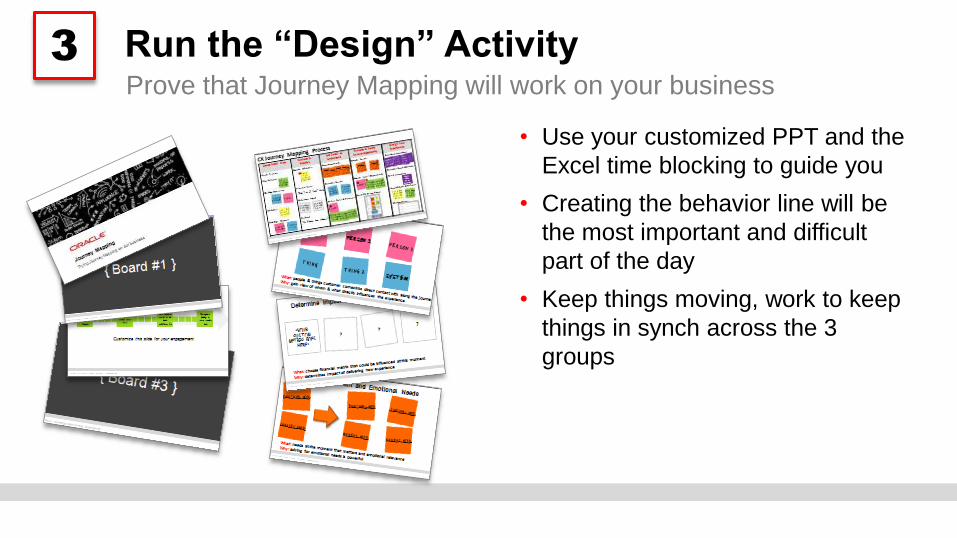
Run the “Design” Activity
• Use your customized PPT and the
Excel time blocking to guide you
• Creating the behavior line will be
the most important and difficult
part of the day
• Keep things moving, work to keep
things in synch across the 3
groups
Prove that Journey Mapping will work on your business
3
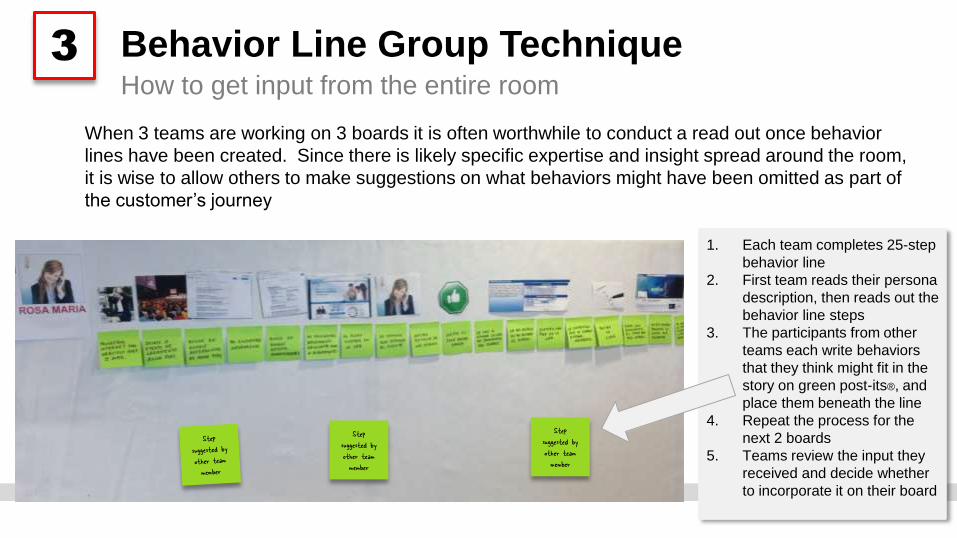
Behavior Line Group Technique
When 3 teams are working on 3 boards it is often worthwhile to conduct a read out once behavior
lines have been created. Since there is likely specific expertise and insight spread around the room,
it is wise to allow others to make suggestions on what behaviors might have been omitted as part of
the customer’s journey
How to get input from the entire room
3
Step suggested by other team member
Step suggested by other team member
1. Each team completes 25-step
behavior line
2. First team reads their persona
description, then reads out the
behavior line steps
3. The participants from other
teams each write behaviors
that they think might fit in the
story on green post-its®, and
place them beneath the line
4. Repeat the process for the
next 2 boards
5. Teams review the input they
received and decide whether
to incorporate it on their board
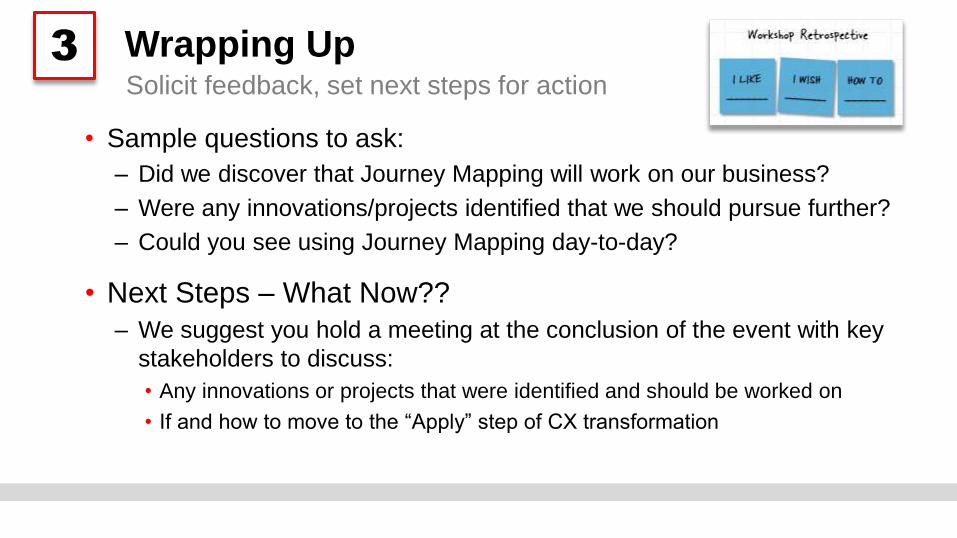
Wrapping Up
• Sample questions to ask:
– Did we discover that Journey Mapping will work on our business?
– Were any innovations/projects identified that we should pursue further?
– Could you see using Journey Mapping day-to-day?
• Next Steps – What Now??
– We suggest you hold a meeting at the conclusion of the event with key
stakeholders to discuss:
• Any innovations or projects that were identified and should be worked on
• If and how to move to the “Apply” step of CX transformation
Solicit feedback, set next steps for action
3
Goals & overview1
3
2
SAMPLE MATERIALS4
Running your session
Preparing for your session
Sample
Persona
PR
OFILE
Location Los Angeles, CA
Professional College Sophomore, studying psychology, planning to attain
her masters degree
Education In 2nd year of college
BE
HA
VIO
RS
Usage & loyalty
Mobile first for all her banking, ATM second, rarely uses a
PC/Mac to access her account, only went into a branch to
open her account. Deposits check(s) via mobile app once
per week.
Attitude & BeliefsShe views us as local and involved in the community; she is
ambivalent toward most banks
Lifestyle
Socially active but not obsessed, prefers action to talk,
expects ease of use as baseline, watches 2 hours of TV via
web & iPad apps, proficient across many digital devices
Interests & HobbiesSpends time with friends, going to restaurants, hiking,
working out at the gym
NE
ED
S
Usage GoalsShe doesn’t want to have to worry about her finances. She
expects us to help her make it simple.
Emotional Goals /
Quote
“I want to be able to pay all my bills without having to
worry, and not obsess over financial goals.”
Motivations & Triggers She cares about her friends, family, and wants to give back
LindsayAge: 20
Student
2
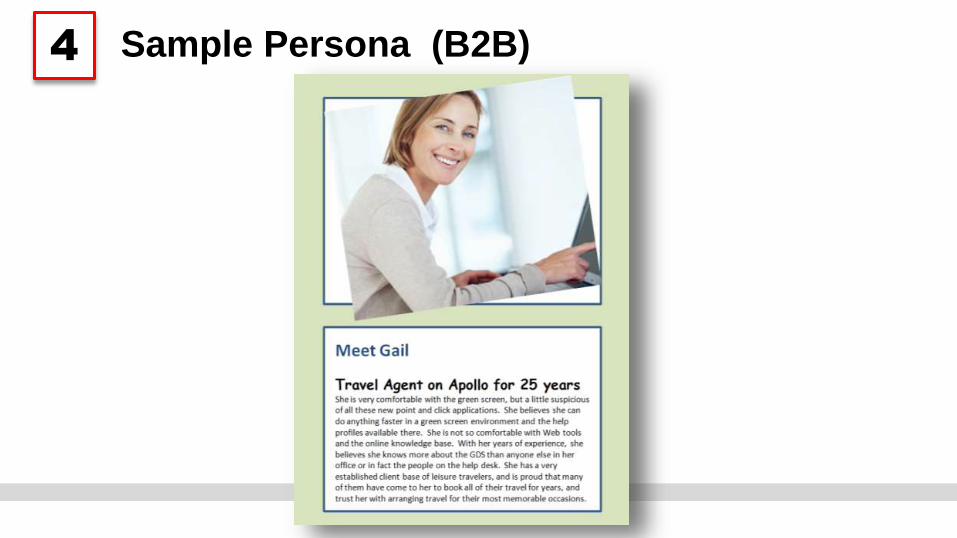
Sample Persona (B2B)4
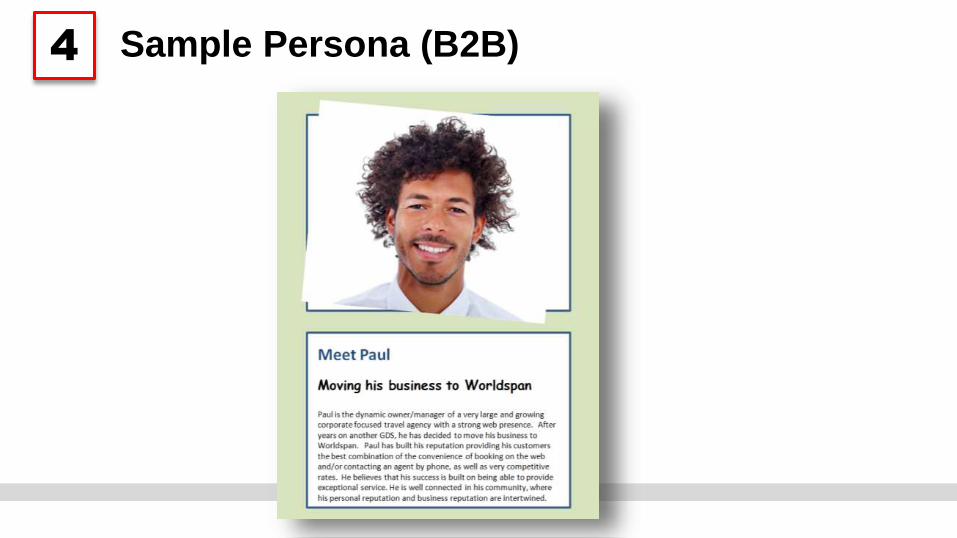
Sample Persona (B2B)4
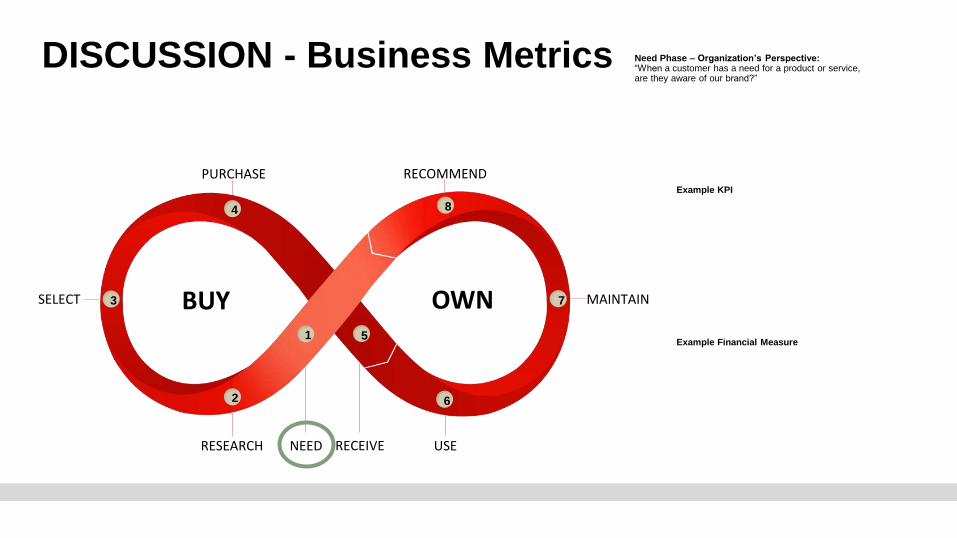
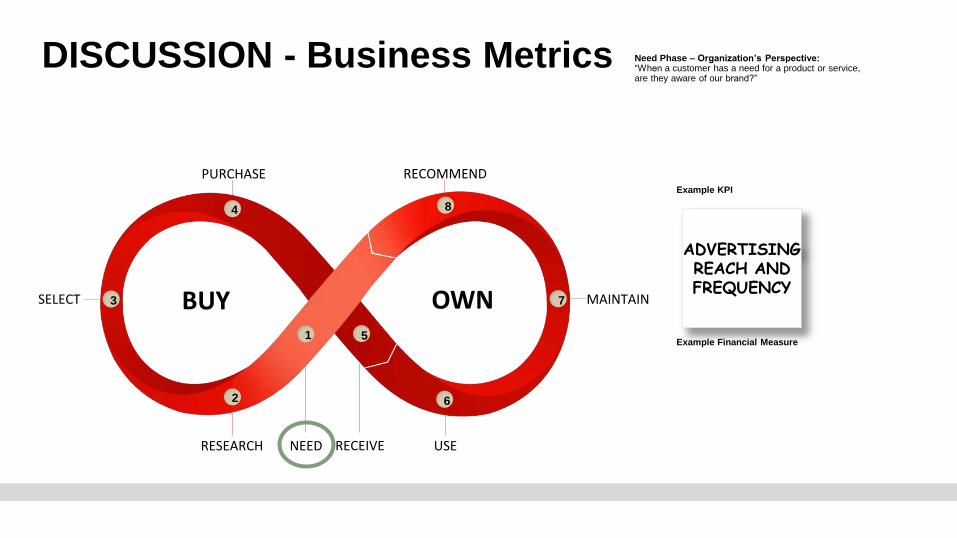
DISCUSSION - Business Metrics
RECEIVE
PURCHASE RECOMMEND
RESEARCH NEED USE
1
2
3
4
5
6
7
8
BUY OWNSELECT MAINTAIN
Need Phase – Organization’s Perspective:“When a customer has a need for a product or service, are they aware of our brand?”
Example KPI
Example Financial Measure
DISCUSSION - Business Metrics
RECEIVE
PURCHASE RECOMMEND
RESEARCH NEED USE
1
2
3
4
5
6
7
8
BUY OWNSELECT MAINTAIN
Need Phase – Organization’s Perspective:“When a customer has a need for a product or service, are they aware of our brand?”
ADVERTISING REACH AND FREQUENCY
Example KPI
Example Financial Measure
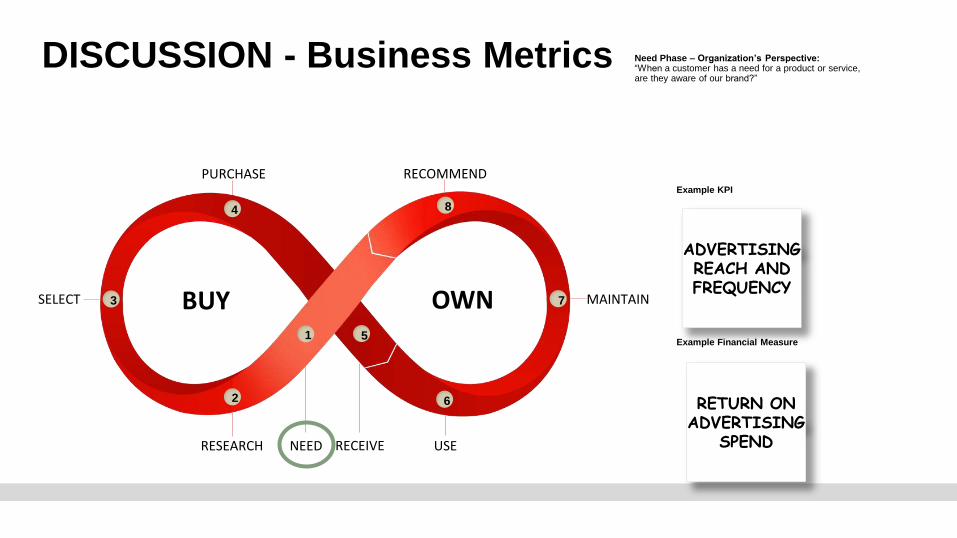
DISCUSSION - Business Metrics
RECEIVE
PURCHASE RECOMMEND
RESEARCH NEED USE
1
2
3
4
5
6
7
8
BUY OWNSELECT MAINTAIN
Need Phase – Organization’s Perspective:“When a customer has a need for a product or service, are they aware of our brand?”
ADVERTISING REACH AND FREQUENCY
RETURN ON ADVERTISING
SPEND
Example KPI
Example Financial Measure
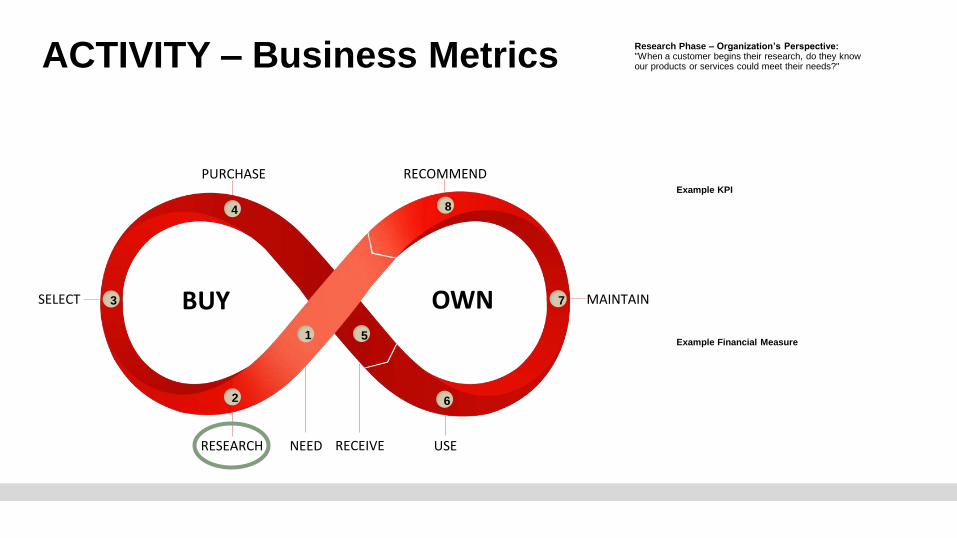
ACTIVITY – Business Metrics
RECEIVE
PURCHASE RECOMMEND
RESEARCH NEED USE
1
2
3
4
5
6
7
8
BUY OWNSELECT MAINTAIN
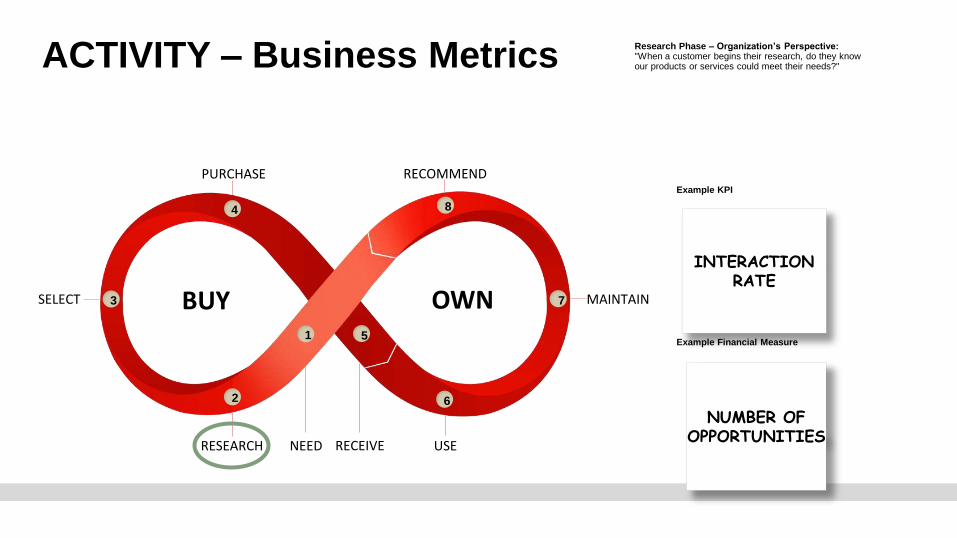
Research Phase – Organization’s Perspective:"When a customer begins their research, do they know our products or services could meet their needs?"
Example KPI
Example Financial Measure
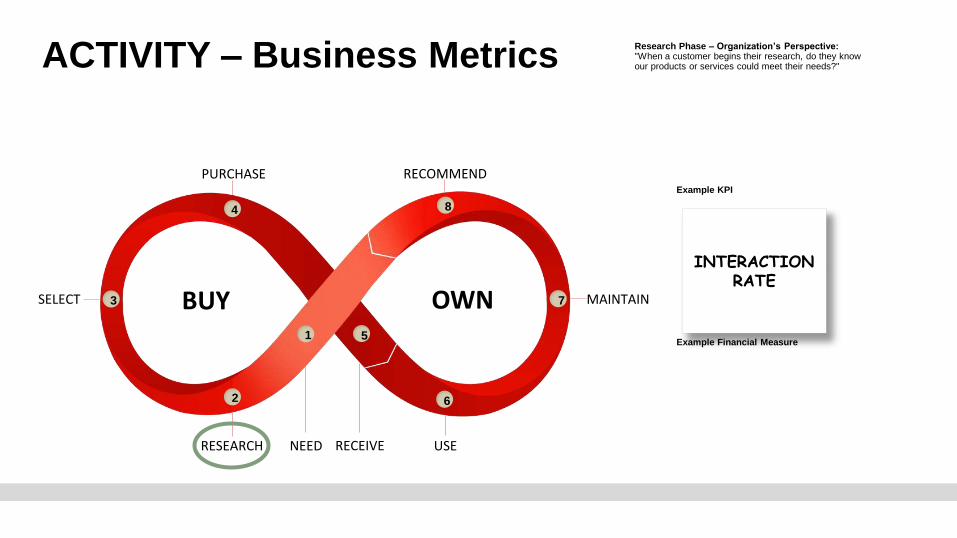
ACTIVITY – Business Metrics
RECEIVE
PURCHASE RECOMMEND
RESEARCH NEED USE
1
2
3
4
5
6
7
8
BUY OWNSELECT MAINTAIN
Research Phase – Organization’s Perspective:"When a customer begins their research, do they know our products or services could meet their needs?"
INTERACTION RATE
Example KPI
Example Financial Measure
ACTIVITY – Business Metrics
RECEIVE
PURCHASE RECOMMEND
RESEARCH NEED USE
1
2
3
4
5
6
7
8
BUY OWNSELECT MAINTAIN
Research Phase – Organization’s Perspective:"When a customer begins their research, do they know our products or services could meet their needs?"
INTERACTION RATE
NUMBER OF OPPORTUNITIES
Example KPI
Example Financial Measure
ACTIVITY – Business Metrics
RECEIVE
PURCHASE RECOMMEND
RESEARCH NEED USE
1
2
3
4
5
6
7
8
BUY OWNSELECT MAINTAIN
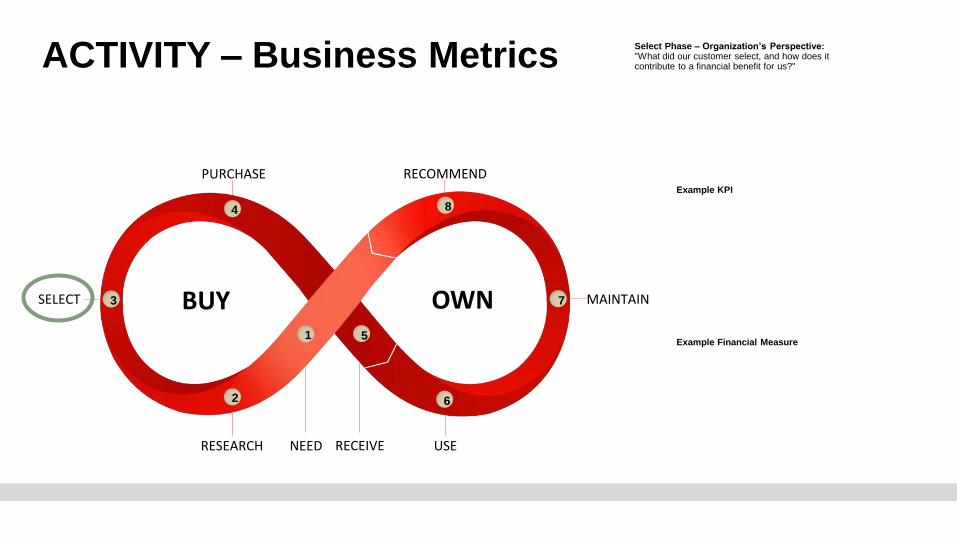
Select Phase – Organization’s Perspective:"What did our customer select, and how does it contribute to a financial benefit for us?"
Example KPI
Example Financial Measure
ACTIVITY – Business Metrics
RECEIVE
PURCHASE RECOMMEND
RESEARCH NEED USE
1
2
3
4
5
6
7
8
BUY OWNSELECT MAINTAIN
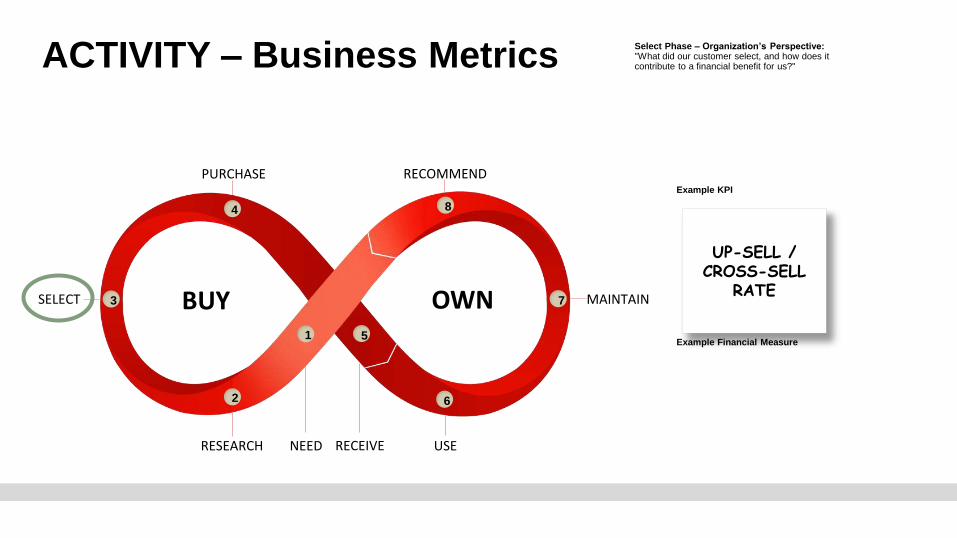
Select Phase – Organization’s Perspective:"What did our customer select, and how does it contribute to a financial benefit for us?"
UP-SELL / CROSS-SELL
RATE
Example KPI
Example Financial Measure
ACTIVITY – Business Metrics
RECEIVE
PURCHASE RECOMMEND
RESEARCH NEED USE
1
2
3
4
5
6
7
8
BUY OWNSELECT MAINTAIN
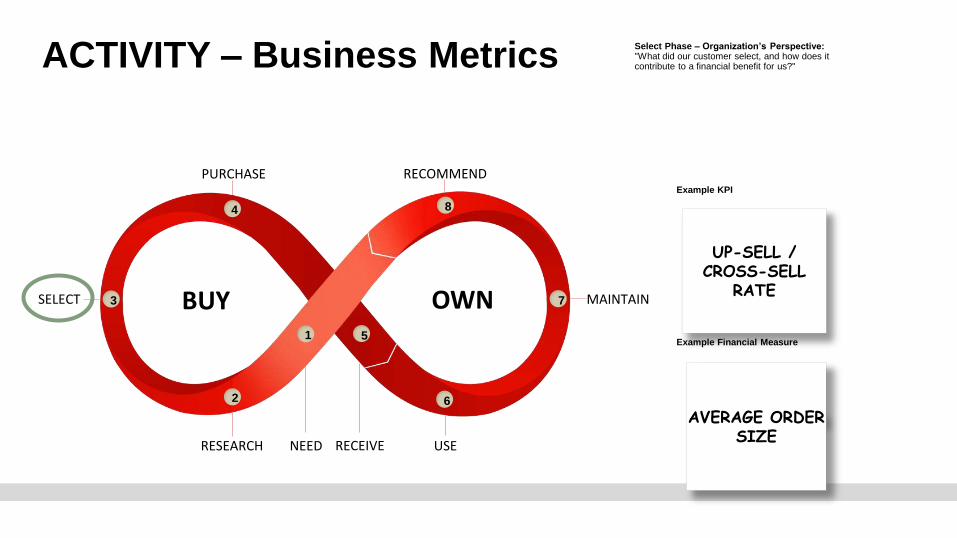
Select Phase – Organization’s Perspective:"What did our customer select, and how does it contribute to a financial benefit for us?"
UP-SELL / CROSS-SELL
RATE
AVERAGE ORDER SIZE
Example KPI
Example Financial Measure

ACTIVITY – Business Metrics
RECEIVE
PURCHASE RECOMMEND
RESEARCH NEED USE
1
2
3
4
5
6
7
8
BUY OWNSELECT MAINTAIN
Purchase Phase – Organization’s Perspective:“How effective were we at getting our customers to convert?"
Example KPI
Example Financial Measure
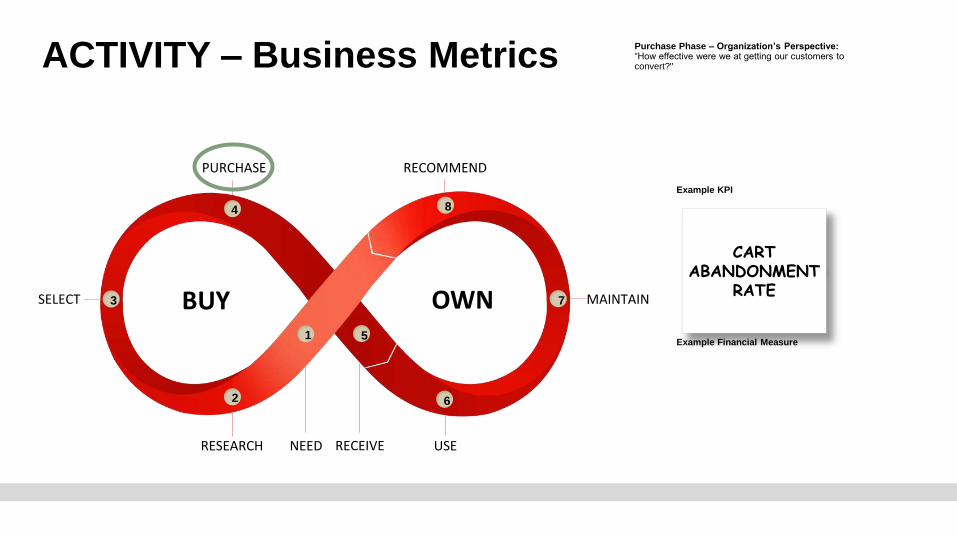
ACTIVITY – Business Metrics
RECEIVE
PURCHASE RECOMMEND
RESEARCH NEED USE
1
2
3
4
5
6
7
8
BUY OWNSELECT MAINTAIN
Purchase Phase – Organization’s Perspective:“How effective were we at getting our customers to convert?"
CART ABANDONMENT
RATE
Example KPI
Example Financial Measure

ACTIVITY – Business Metrics
RECEIVE
PURCHASE RECOMMEND
RESEARCH NEED USE
1
2
3
4
5
6
7
8
BUY OWNSELECT MAINTAIN
Purchase Phase – Organization’s Perspective:“How effective were we at getting our customers to convert?"
CART ABANDONMENT
RATE
REVENUE PER TRANSACTION
Example KPI
Example Financial Measure
ACTIVITY – Business Metrics
RECEIVE
PURCHASE RECOMMEND
RESEARCH NEED USE
1
2
3
4
5
6
7
8
BUY OWNSELECT MAINTAIN
Receive Phase – Organization’s Perspective:“How efficiently and effectively did we deliver our product or service?"
Example KPI
Example Financial Measure
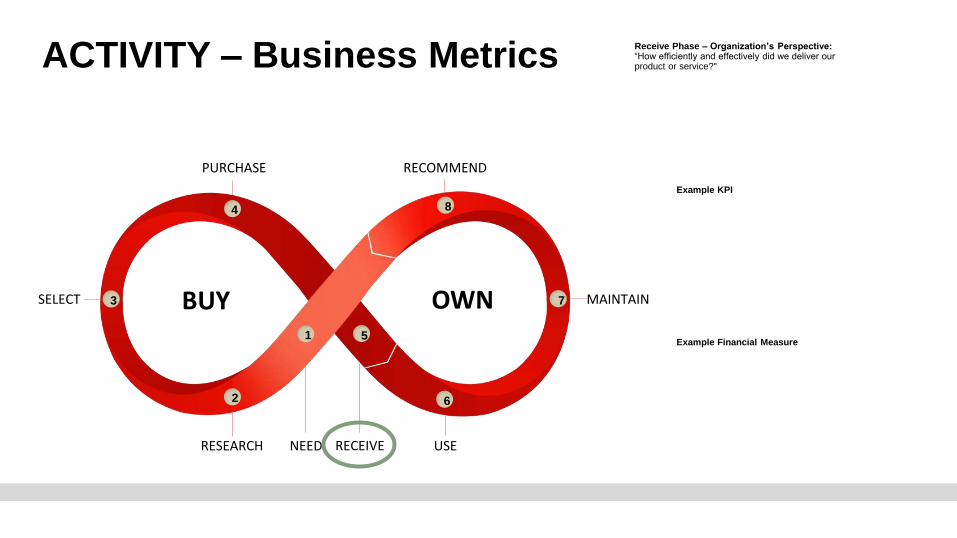
ACTIVITY – Business Metrics
RECEIVE
PURCHASE RECOMMEND
RESEARCH NEED USE
1
2
3
4
5
6
7
8
BUY OWNSELECT MAINTAIN
Receive Phase – Organization’s Perspective:“How efficiently and effectively did we deliver our product or service?"
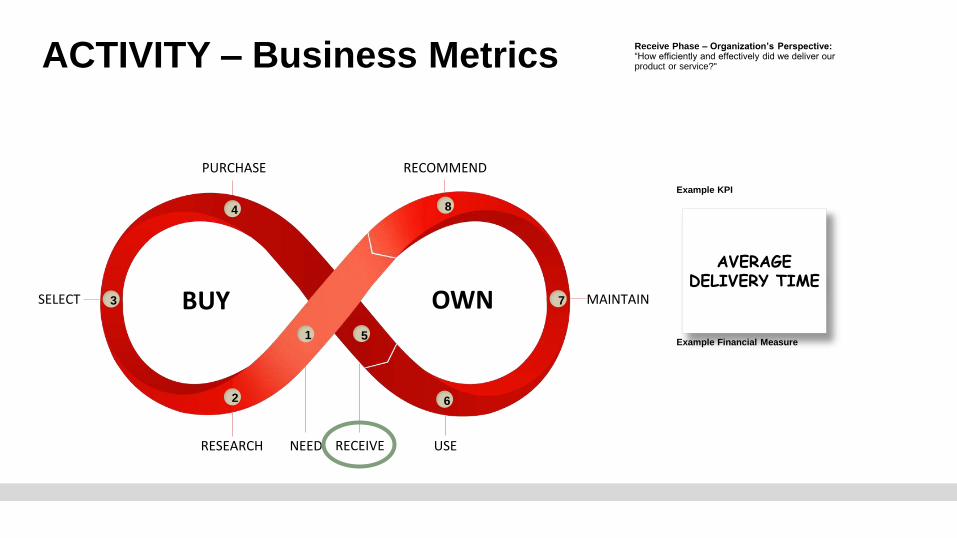
AVERAGE DELIVERY TIME
Example KPI
Example Financial Measure

ACTIVITY – Business Metrics
RECEIVE
PURCHASE RECOMMEND
RESEARCH NEED USE
1
2
3
4
5
6
7
8
BUY OWNSELECT MAINTAIN
Receive Phase – Organization’s Perspective:“How efficiently and effectively did we deliver our product or service?"
AVERAGE DELIVERY TIME
DELIVERY COST PER
TRANSACTION
Example KPI
Example Financial Measure
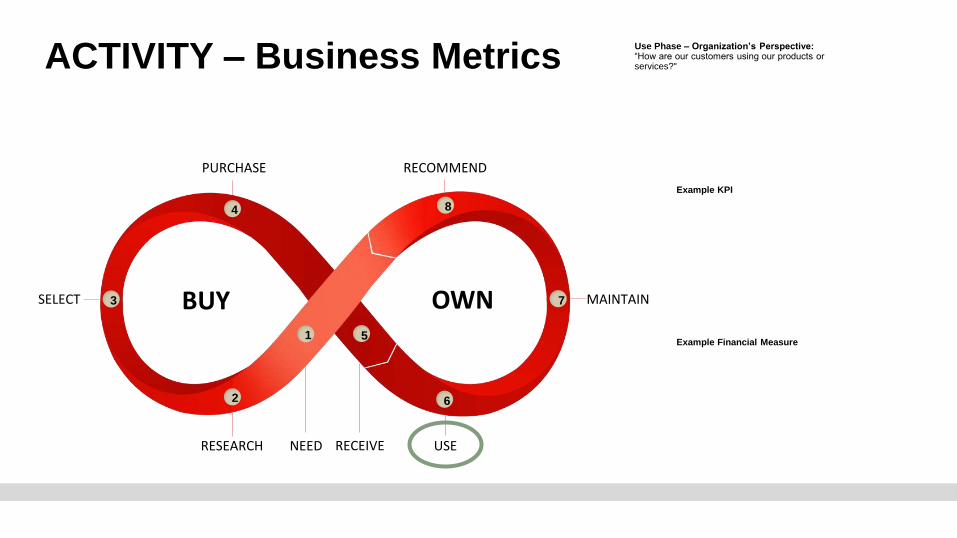
ACTIVITY – Business Metrics
RECEIVE
PURCHASE RECOMMEND
RESEARCH NEED USE
1
2
3
4
5
6
7
8
BUY OWNSELECT MAINTAIN
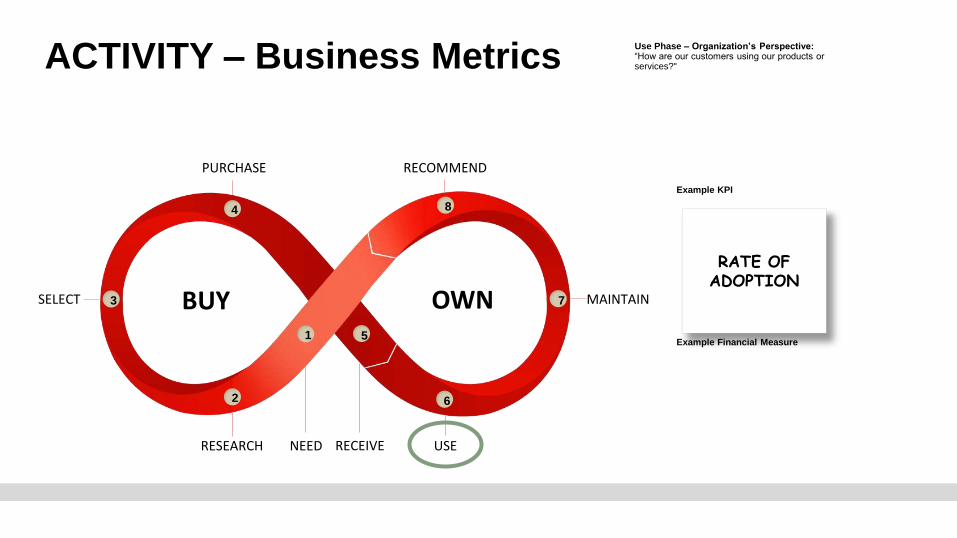
Use Phase – Organization’s Perspective:“How are our customers using our products or services?"
Example KPI
Example Financial Measure
ACTIVITY – Business Metrics
RECEIVE
PURCHASE RECOMMEND
RESEARCH NEED USE
1
2
3
4
5
6
7
8
BUY OWNSELECT MAINTAIN
Use Phase – Organization’s Perspective:“How are our customers using our products or services?"
RATE OF ADOPTION
Example KPI
Example Financial Measure
ACTIVITY – Business Metrics
RECEIVE
PURCHASE RECOMMEND
RESEARCH NEED USE
1
2
3
4
5
6
7
8
BUY OWNSELECT MAINTAIN
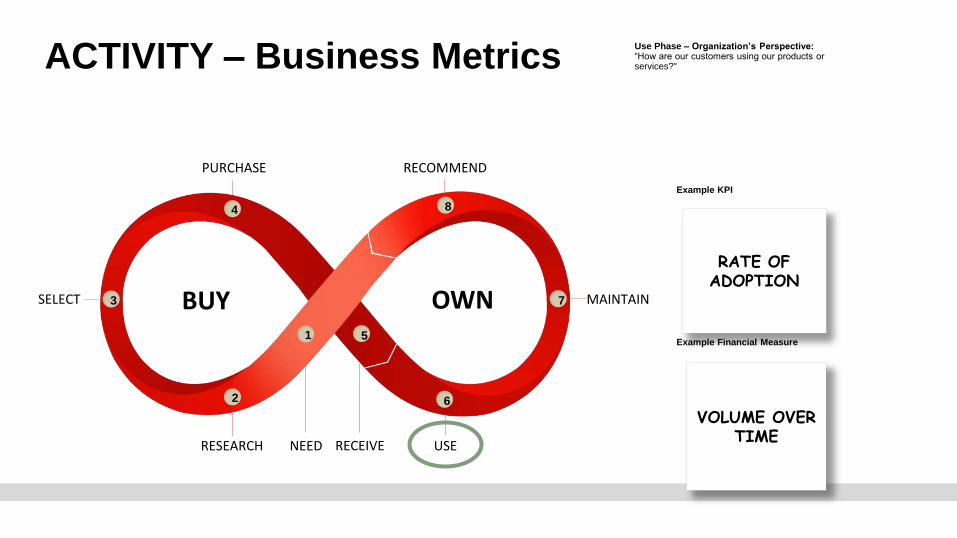
Use Phase – Organization’s Perspective:“How are our customers using our products or services?"
RATE OF ADOPTION
VOLUME OVER TIME
Example KPI
Example Financial Measure
ACTIVITY – Business Metrics
RECEIVE
PURCHASE RECOMMEND
RESEARCH NEED USE
1
2
3
4
5
6
7
8
BUY OWNSELECT MAINTAIN
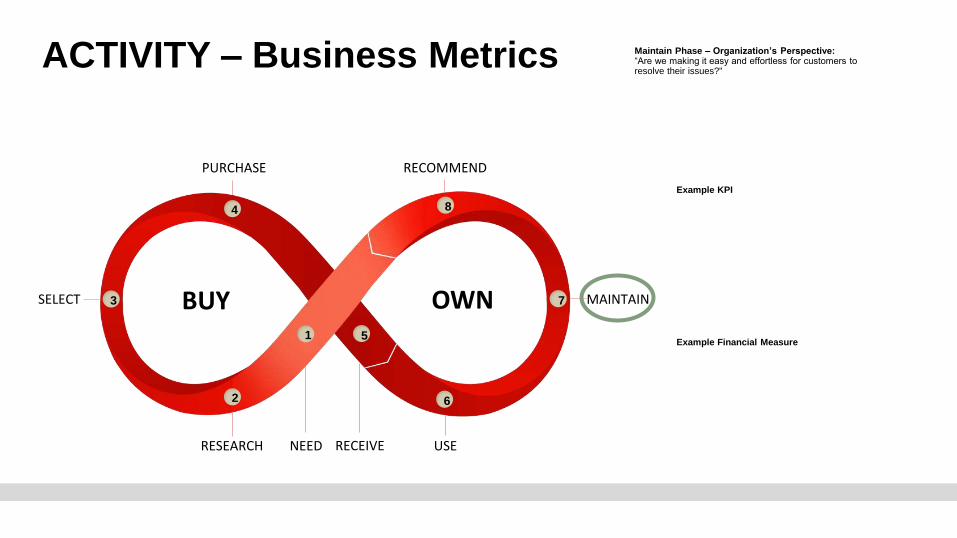
Maintain Phase – Organization’s Perspective:“Are we making it easy and effortless for customers to resolve their issues?"
Example KPI
Example Financial Measure
ACTIVITY – Business Metrics
RECEIVE
PURCHASE RECOMMEND
RESEARCH NEED USE
1
2
3
4
5
6
7
8
BUY OWNSELECT MAINTAIN
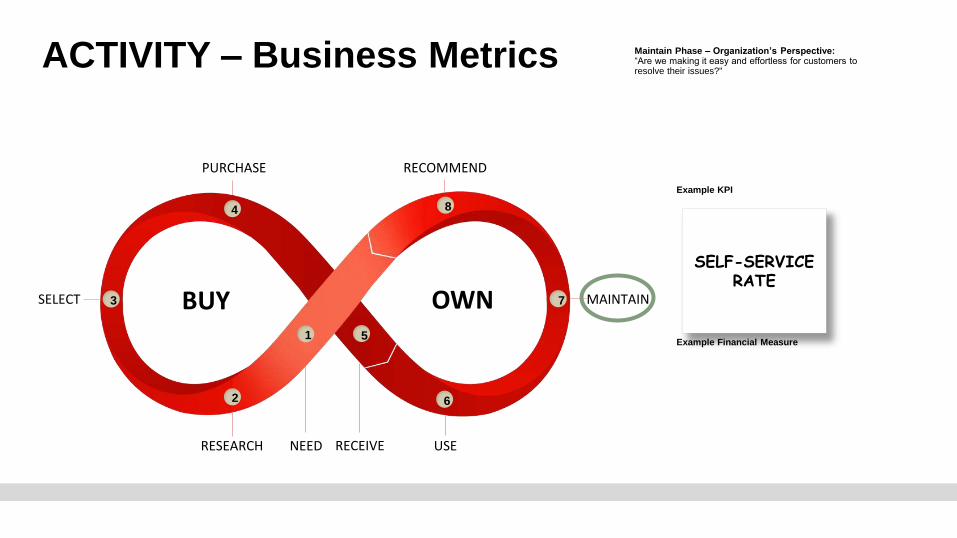
Maintain Phase – Organization’s Perspective:“Are we making it easy and effortless for customers to resolve their issues?"
SELF-SERVICE RATE
Example KPI
Example Financial Measure
ACTIVITY – Business Metrics
RECEIVE
PURCHASE RECOMMEND
RESEARCH NEED USE
1
2
3
4
5
6
7
8
BUY OWNSELECT MAINTAIN
Maintain Phase – Organization’s Perspective:“Are we making it easy and effortless for customers to resolve their issues?"
SELF-SERVICE RATE
COST PER CHANNEL
Example KPI
Example Financial Measure
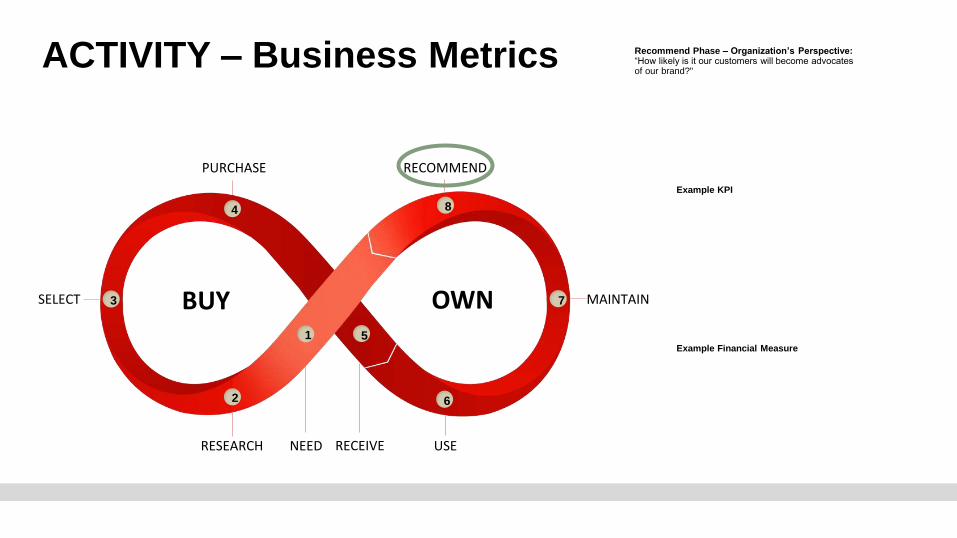
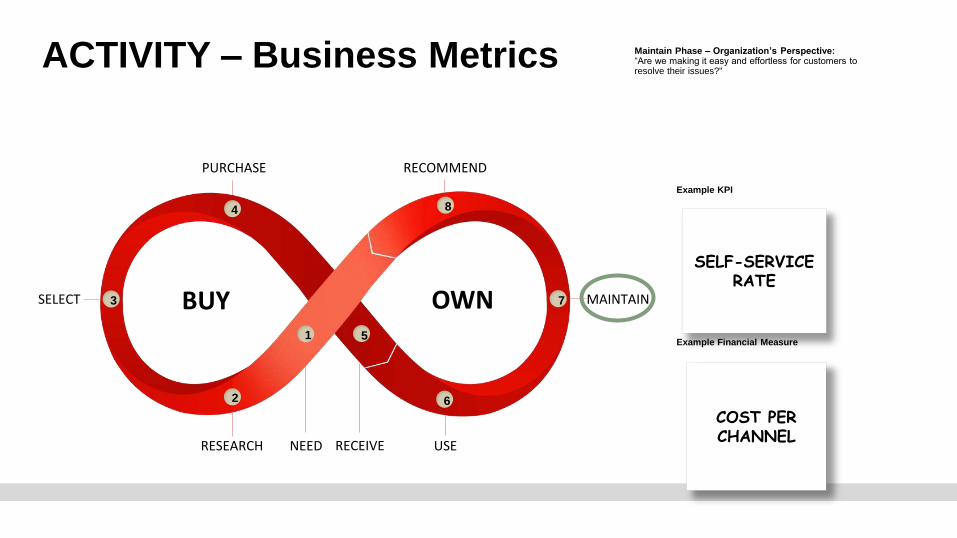
ACTIVITY – Business Metrics
RECEIVE
PURCHASE RECOMMEND
RESEARCH NEED USE
1
2
3
4
5
6
7
8
BUY OWNSELECT MAINTAIN
Recommend Phase – Organization’s Perspective:“How likely is it our customers will become advocates of our brand?"
Example KPI
Example Financial Measure
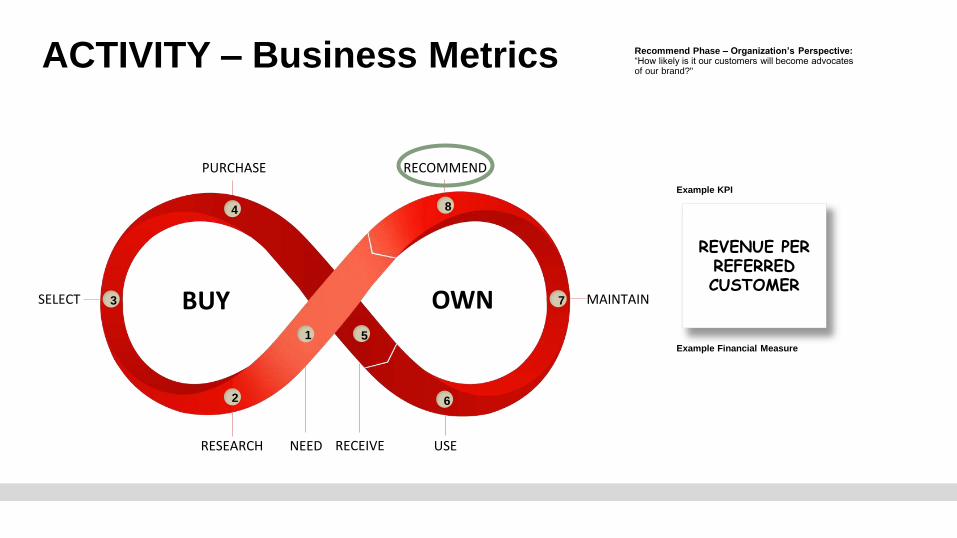
ACTIVITY – Business Metrics
RECEIVE
PURCHASE RECOMMEND
RESEARCH NEED USE
1
2
3
4
5
6
7
8
BUY OWNSELECT MAINTAIN
Recommend Phase – Organization’s Perspective:“How likely is it our customers will become advocates of our brand?"
REVENUE PER REFERRED CUSTOMER
Example KPI
Example Financial Measure
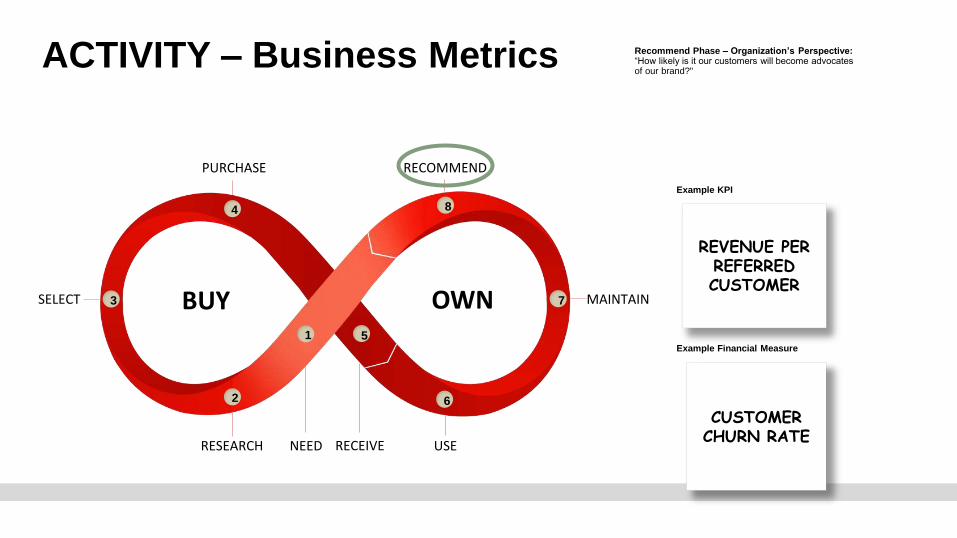
ACTIVITY – Business Metrics
RECEIVE
PURCHASE RECOMMEND
RESEARCH NEED USE
1
2
3
4
5
6
7
8
BUY OWNSELECT MAINTAIN
Recommend Phase – Organization’s Perspective:“How likely is it our customers will become advocates of our brand?"
REVENUE PER REFERRED CUSTOMER
CUSTOMER CHURN RATE
Example KPI
Example Financial Measure