rumination about stressful life events: … · rumination about stressful life events: ......
TRANSCRIPT

RUMINATION ABOUT STRESSFUL LIFE EVENTS:
MEASURING POST-EVENT RUMINATION
By
ZACKARY DONALD TOLLMAN
A thesis submitted in partial fulfillment of
the requirements for the degree of
MASTER OF SCIENCE IN PSYCHOLOGY
WASHINGTON STATE UNIVERSITY Department of Psychology
December 2008

To the Faculty of Washington State University The members of the Committee appointed to examine the thesis of ZACKARY DONALD TOLLMAN find it satisfactory and recommend that it be accepted. ______________________________ Paul H. Kwon, Chair ______________________________ Brett Parmenter ______________________________ Michiyo Hirai
ii

iii
ACKNOWLEDGMENT
I would like to thank Dr. Paul Kwon for his guidance and assistance with this
project. His suggestions, insight and support throughout the process were essential to the
completion of this study. Additionally, I would like to recognize Dr. Brett Parmenter and
Dr. Michiyo Hirai for their helpful guidance and suggestions during this research. I
would also like to thank Andrea Mendoza, Samantha Wood, Jesse Wynn and Ashley
Rockwell for their outstanding efforts collecting data. Finally, I would like to thank Laura
Milewski for her support and understanding.

iv
RUMINATION ABOUT STRESSFUL LIFE EVENTS:
MEASURING POST-EVENT RUMINATION
Abstract
by Zackary Donald Tollman, MS
Washington State University December 2008
Chair: Paul Kwon The present paper explores several prominent theories of rumination that have
been linked to depressive outcomes. The measures associated with these theories are also
examined. A new construct called rumination about stressful life events (RASLE) is
proposed to describe post-event rumination. While studies have examined rumination
about depression and depressogenic attributions, previous research has not examined the
influence of ruminating about stressful events themselves. As such, the present paper
outlines the developmental process of a new measure, the Rumination About Stressful
Life Events Scale (RASLES), which assesses the degree to which one engages in post-
event rumination. A three-phase study that refined the measure from a 17-item to a 7-
item scale is described. During the three phases, the RASLES was found to display strong
reliability and validity. Implications of the new measure are explored and directions for
future research are suggested.

v
TABLE OF CONTENTS Page ACKNOWLEDGEMENTS.................................................................................................iii ABSTRACT.........................................................................................................................iv LIST OF TABLES...............................................................................................................vi CHAPTER 1. INTRODUCTION .................................................................................................1 2. METHOD ..............................................................................................................9 3. RESULTS ............................................................................................................14 4. DISCUSSION......................................................................................................24 REFERENCES ...................................................................................................................31 FOOTNOTES .....................................................................................................................34 TABLES ............................................................................................................................. 35 APPENDIX A. APPENDIX A: PHASE I RASLES.....................................................................56 B. APPENDIX B: PHASE II RASLES....................................................................62 C. APPENDIX C: PHASE III RASLES ..................................................................65

vi
LIST OF TABLES
1. Participant Demographic By Phase ................................................................................35
2. Phase I Questionnaire Means and Standard Deviations .................................................36
3. Phase I Deleted Items and Skewness Z-Scores ..............................................................37
4. Phase I RASLES, RSQ, SRRS, BDI-II, and OCI-R Correlation Matrix........................38
5. Phase I Significance Tests of Differences Between RASLES/OCI-R and
RASLES/BDI-II Correlations Using the 17-item RASLES ......................................39
6. Phase I Significance Tests of Differences Between RASLES/OCI-R and
RASLES/BDI-II Correlations Using the 8-item RASLES ........................................40
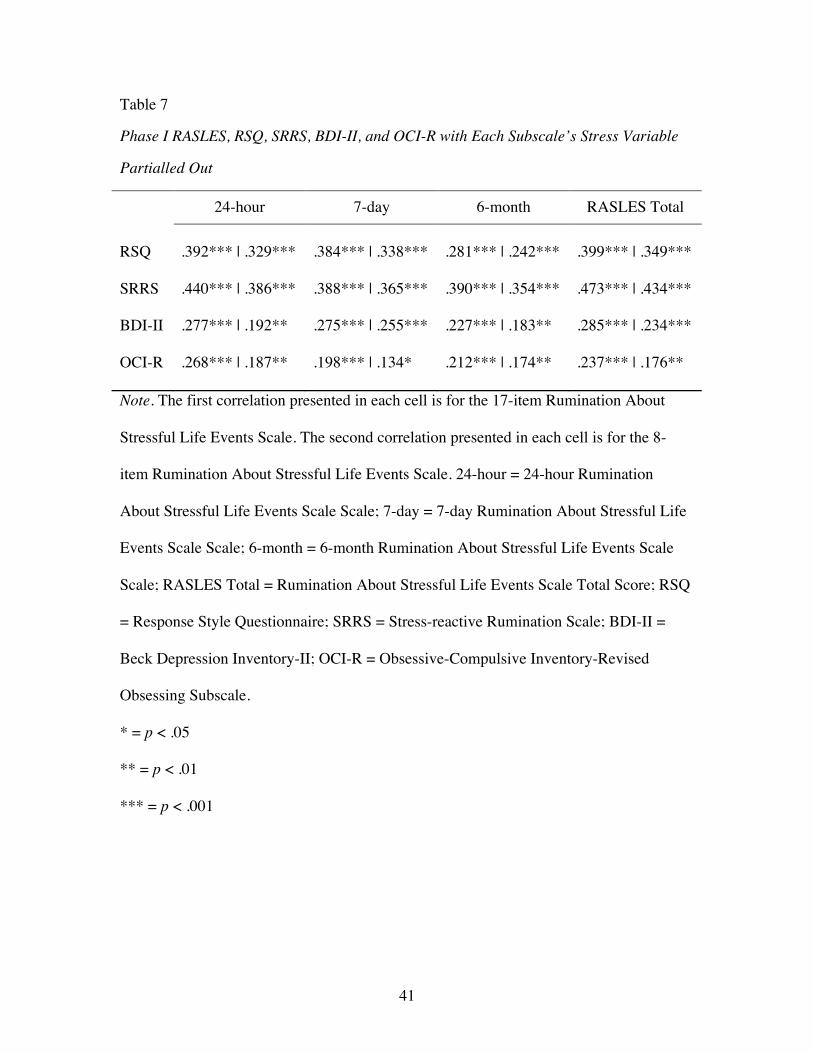
7. Phase I RASLES, RSQ, SRRS, BDI-II, and OCI-R with Each Subscale’s Stress
Variable Partialled Out ..............................................................................................41
8. Phase I T-tests Comparing Differences Between RASLES Subscales...........................42
9. Phase II Questionnaire Means and Standard Deviations ................................................43
10. Phase II RASLES, RSQ, SRRS, BDI-II, and OCI Correlation Matrix ........................44
11. Phase II Significance Tests of Differences Between RASLES/OCI-R and
RASLES/BDI-II Correlations Using the 8-item RASLES ........................................45
12. Phase II Significance Tests of Differences Between RASLES/OCI-R and
RASLES/BDI-II Correlations Using the 7-item RASLES ........................................46
13. Phase II RASLES, RSQ, SRRS, BDI-II, and OCI-R with Each Subscale’s Stress
Variable Partialled Out ..............................................................................................47
14. Phase II T-tests Comparing Differences Between RASLES Scales.............................48
15. Phase III Questionnaire Means and Standard Deviations.............................................49
16. Phase III RASLES Internal Consistency Reliability ....................................................50
17. Test-rest Reliability Correlations..................................................................................50
18. Phase III RASLES, RSQ, SRRS, T1-BDI-II, T2-BDI-II, and OCI Correlation
Matrix .......................................................................................................................51

vii
19. Phase III Significance Tests of Differences Between RASLES/OCI-R and
RASLES/BDI-II Correlations....................................................................................52
20. Phase III RASLES, RSQ, SRRS, T1 BDI-II, T2 BDI-II, and OCI-R with Each
Subscale’s Stress Variable Partialled Out..................................................................53
21. Phase III T-tests Comparing Differences Between RASLES Scales for T1 and T2 ....54

1
CHAPTER ONE
INTRODUCTION
In attempting to understand the deleterious effects of rumination, researchers have
devoted considerable effort toward defining (e.g., Martin & Tesser, 1996; Nolen-
Hoeksema, 1987; Robinson & Alloy, 2003) and measuring (e.g., Nolen-Hoeksema &
Morrow, 1991; Robinson, 1997; Trapnell & Campbell, 1999) rumination. Rumination is
generally considered to be a type of thinking that is repetitive and cyclical and focused on
a single thought or group of related thoughts. While the initial thought or focus is
considered to be spurred by an individual event or mood, the thoughts are maintained
without further environmental cues (Martin & Tesser).
The following paper briefly reviews current definitions and theories of rumination
and offers a new definition of rumination about stressful life events. Additionally, a new
instrument for measuring rumination is described and developed.
Definition and Theory of Rumination
Early research on rumination was conducted in order to explain the apparent sex
differences in rates of depression (Nolen-Hoeksema, 1987). In her response styles theory
of depression, Nolen-Hoeksema proposed that women were more depressed than men
because of their tendency to ruminate about negative mood. Later studies, however,
suggested that an individual’s sex is not the more important factor in predicting depressed
mood; rather, it is the individual’s tendency to ruminate about depressed mood that better
predicts onset and duration of depressed mood (Morrow & Nolen-Hoeksema, 1990;
Nolen-Hoeksema & Morrow, 1991; Nolen-Hoeksema, Morrow, & Fredrickson, 1993). In
an experimental study manipulating level of rumination, Needles and Abramson (1992)

2
found that those who experienced a rumination induction were more likely to experience
greater levels of depressed mood that those who experienced a distraction induction,
regardless of sex.
While earlier research suggests a strong link between rumination and depression,
more recent research has attempted to delineate the causal mechanism between
rumination and depression. Nolen-Hoeksema, Morrow, and Fredrickson (1993) further
articulated the response styles theory and provided experimental evidence to suggest that
this model of rumination is most important in predicting duration and severity of
depressed mood. Moreover, response style rumination was further described as a self-
perpetuating process whereby individuals believe that by engaging in rumination they are
able to better understand themselves, which would presumably make a negative response
seem more positive (Lyubomirsky & Nolen-Hoeksema, 1993). Similarly, Papageorgiou
and Wells (1999) propose that metacognition about rumination serves to perpetuate the
ruminative process. As such, ruminators tend to think that rumination is an adaptive
process following the experience of problems. This view of rumination leads the
individual to engage in future rumination, thereby increasing the experience of depressed
mood. While these theories provide elegant explanations for the maintenance of
depressed mood, they are less able to account for the initial onset of depressed mood.
A self-focus theory of depression developed by Pyszcynski and Greenberg (1987)
suggests a causal link between rumination and the onset of depressed mood. They suggest
that following an event that signals the loss of an object of self-worth (e.g.,
discontinuation of a desired romantic relationship), one attempts to reconcile a desired
state (e.g., continuing the relationship) with an actual state (e.g., the relationship has

3
ended). The process results in a cycle centering on self-focus, akin to rumination. In this
cycle, the individual tends to focus on his/her emotional or cognitive state and not on
effective methods to resolve the discrepancy. The outcome of this cycle is manifested as
an increase in negative affect and helpless thinking. The authors ultimately suggest that
this process leads to a negative self view that is used to explain the individual’s current
difficulties. This view serves to maintain the depressive outcome.
Using a different approach, Martin & Tesser (1996) discuss rumination as a result
of goal blockage. Following the disruption of goal attainment, an individual may repeat
the same behavior that initially led to the goal blockage. This stage is followed by
attempts at problem solving. If problem solving is unsuccessful, the individual may begin
to engage in end-state thinking. At this stage, the individual is no longer trying to solve
the problem; instead, the individual is ruminating about the problem and the negative
impact of the problem. They theorize that this type of thinking can ultimately lead to
negative affect if the goal is never attained.
More recently, Robinson and Alloy (2003) have proposed the theory of stress-
reactive rumination (SRR). They posit that, following a negative life event, those who
ruminate about the event and the negative inferences about the event are more likely to
experience the onset of depression than those who do not ruminate about the event. While
they acknowledge that depressogenic inferences made about the event may be a sufficient
cause of depressed mood, they assert that ruminating about these inferences should
strengthen this effect. Interestingly, the results of their study actually suggest that this
type of rumination better predicts onset and duration of episodes of depression than
response style rumination.

4
Measuring Rumination
As with definitions and theories of rumination, many different measures of
rumination exist. Evidence suggests that if taken as a whole, existing measures of
rumination indeed represent one central construct; however, individually, each measure
construes a specific aspect of rumination that relates differently to depression and general
negative mental health (Siegle, Moore, & Thase, 2004). In the following section, I will
outline several measures of rumination and discuss their overall validity and applicability
to measuring rumination in the context of theories of depression. Specifically, I will
address the Response Style Questionnaire, the most commonly used measure of
rumination, and the Stress-Reactive Rumination Scale, the measure of rumination most
closely related to the measure outlined in the present paper. Additionally, the utility of the
measures will be discussed.
Response Styles Questionnaire (RSQ; Nolen-Hoeksema & Morrow, 1991). The
RSQ is a 71-item measure of response styles to depression. It includes a 22-item
rumination subscale (RSQ-R). Participants are asked to indicate to what extent they
engage in certain activities when they feel depressed. The rumination items reflect one’s
focus on his/herself, symptoms of depression, and the consequences of the depression.
Items are rated on a 0 (“Almost Never”) to 3 (“Almost Always”) scale. The RSQ-R is
scored by summing the 22 rumination items. Internal consistency has been reported as
strong (e.g., α = .89; Nolen-Hoeksema & Morrow).
The RSQ-R has shown strong validity in terms of predicting depression (e.g., Just
& Alloy, 1997; Nolen-Hoeksema & Morrow, 1991), and in mediating the relationship

5
between risk factors and depression (Spasojevic & Alloy, 2001). The RSQ-R may be
problematic, however, because when it is used to predict future depressed mood, it makes
broad generalizations regarding the nature of rumination. First, the questionnaire asks
participants to, “Please read each of the items below and indicate whether you never,
sometimes, often, or always think or do each one when you feel down, sad, or depressed”
(Nolen-Hoeksema & Morrow). Although the instrument directs participants to consider
the items through the perspective of being in a depressed state, this questionnaire appears
to only be capable of assessing rumination after the initial onset of depressed mood.
Second, although this scale can only measure post-depression rumination, it becomes
difficult to interpret prospective studies that assess rumination with the RSQ-R with a
predicted negative affect variable. If one hypothesizes that rumination will lead to
depression, yet measures it with an instrument that seems capable of validly measuring
only post-depression rumination, how should findings from such a study be interpreted?
It would be difficult to understand if the rumination causes the depression or the
depression leads to rumination. Finally, this scale assumes that rumination is a stable trait
when used in research that suggests that rumination leads to depression. Since the RSQ-R
only seems appropriate for measuring post-depression rumination, studies assessing pre-
depression rumination assume that rumination is stable across situations. In fact, at least
one study has suggested that the stability of rumination as measured by the RSQ-R is
different for depressed and non-depressed individuals (Bagby, Rector, Bacchiochi &
McBride, 2004). Given such information, the results of a prospective study utilizing the
RSQ-R may be difficult to interpret.

6
Stress-Reactive Rumination Scale (SRRS; Robinson, 1997). The 25-item SRRS is
a scale that measures rumination about negative life events, inferences about those
negative life events, hopeless cognitions, and coping strategies. Each item represents a
possible reactive thought to an event. Participants are asked to rate, on a 0 (“never think
or do this”) to 100 (“always think or do this”) scale, how likely they are to react in the
manner described. The scale is scored by summing all of the rumination items. The SRRS
has been reported to have adequate reliability, α = .71 (Robinson & Alloy, 2003).
Additionally, tests correlating the SRRS with negative inferential style, depressive
rumination (the RSQ-R) and private self-consciousness suggest that the scale represents a
unique and valid construct (Robinson & Alloy).
The SRRS serves an excellent purpose in terms of examining hypotheses
involving a causal pathway from negative life events to depression, which incorporates
associated effects of negative inferences and/or hopelessness. This scale, however, seems
inadequate in experimental designs that do not incorporate either negative inferences or
hopelessness. For this type of rumination to successfully be integrated into a theory, it
first needs to assume that individuals are making negative inferences or experiencing
hopelessness and subsequently ruminating about these cognitions. Without such
prerequisite inferences or hopeless cognitions, SRR should not be assessed in the model.
Assuming that a researcher integrates negative inferences and hopeless cognitions
into an experimental design, the SRRS does not specify exactly what the ruminator is
ruminating about. The scale combines both ruminations about negative inferences with
ruminations about hopeless cognitions. Treating negative inferences and hopeless
cognitions as the same phenomenon may lead the researcher to overlook important

7
unique aspects of either type of thought. The hopelessness theory of depression
(Abramson, Metalsky, & Alloy, 1989) suggests that negative inferences actually preceed
hopeless cognitions in a causal chain from negative life events to depression. This
suggests that negative inferences and hopeless cognitions have very different properties
and characteristics and should not be treated as one in the same in the SRRS. Breaking
the SRRS into two separate subscales would have provided researchers with the ability to
more precisely hypothesize how this type of rumination would factor into specific
theories.
Rumination About Stressful Life Events
Given the complex nature of the definitions and theories of rumination, it is
essential to develop a definition of rumination that is free of unnecessary entanglements
with other contributing factors. While it may be important to consider an interaction
between rumination and another factor in some situations, this interaction should not be
built into the definition or measure of rumination. Such a definition limits the power of
the definition to a small number of cases. It can only explain rumination when it is
working in concert with these other integrated factors. In this section, I will propose a
new definition of rumination that will attempt to define rumination as a reaction to a
negative life event. This definition will not integrate other factors in order to define a
more “pure” form of rumination that is not contaminated by other variables.
Rumination about stressful life events (RASLE) occurs following a negative life
event. The focus of the rumination is on the event itself and not on conclusions or
thoughts that result from the event. Specifically, this type of rumination is defined by the
frequency of thoughts about the negative life event. Although other definitions of

8
rumination include thoughts generated as a result of the negative life event (e.g.,
“Because I failed the test, I will never succeed in life.”), these thoughts will not be
considered in the present definition. Considering these thoughts as rumination requires
the assumption that one makes negative inferences or experiences hopelessness as a result
of the event. If these thoughts were incorporated into the model, it would be necessary to
assume that the individual not only thought about the event, but also drew conclusions
about the event and ruminated about those conclusions. In contrast, RASLE consists only
of thoughts about the negative life event itself and does not incorporated thoughts about
inferences. As such, a purer measure of rumination can be developed, allowing
researchers to see a clearer picture of the causal pathway between rumination and
depression that is not unnecessarily confounded by other variables.
Stated more concisely, following a specific life event, RASLE is the tendency to
focus attention and engage in thinking about the specific life event. RASLE is
characterized by an inability to disengage from thinking about the specific life event.
Although the event occurs only once, the thoughts about the event keep the event in an
individual’s consciousness and serves to exacerbate the stress caused by the temporal
event.
The Rumination About Stressful Life Events Scale
In order to successfully measure RASLE, it is necessary to develop a new scale
that can account for the issues in other measures of rumination that were previously
discussed. Consequently, the development of the Rumination About Stressful Life Events
Scale (RASLES) is needed in order to examine rumination following a negative life
event. The RASLES is also essential to be able to better understand the complex

9
relationship between stress, rumination and depression. While there have been significant
findings regarding the relationship between these variables, information about the
causality of the variables is still unclear. This scale can be instrumental in determining
how and if rumination is involved in the development of depression, as opposed to
simply being associated with depression. Additionally, this measure will enable the study
of a true stress x rumination interaction. Finally, by parsing out the intensity of
ruminative thoughts from the frequency of the thoughts, we can better understand if it is
the frequency or intensity of ruminative thought that is most important in the
development of depressed mood.
The present study documents the development of the RASLES. Development of
the scale involved the construction and refinement of an item pool, as well as testing of
the reliability and the validity of the scale. The development cycle included three distinct
phases. Between each phase, the data culled from the questionnaire was analyzed and the
questionnaire was altered.
CHAPTER TWO
METHOD
Participants
Participants were students from psychology courses at a large university in the
Pacific Northwest. Across all three phases, 958 participants (595 female, 354 male, 9
unidentified) completed the study. Ten participants from the third phase were excluded
because they completed the second part of the study outside of the 14-21 day window of
participation. Participants ranged in age from 18 – 45 (M = 21.05; Mdn = 19.86, SD =
3.64). See Table 1 for more participant demographics.

10
Procedure
The study was broken into three phases: Phase I (PI), Phase II (PII), and Phase III
(PIII). The procedure used in PI and PII was identical. When participants arrived at the
experiment, they were informed that the present study is part of a series of studies
intended to develop a new measure of rumination. Participants were asked to read an
informed consent form and indicate their consent to participate by signing the form.
Participants completed a questionnaire packet containing the RASLES, the RSQ, the
SRRS, the Obsessive-Compulsive Inventory-Revised (OCI-R; Foa et al., 2002) and the
Beck Depression Inventory-II (BDI-II; Beck, Steer, Ball & Ranieri, 1996). Participants
were instructed to complete the questionnaire in order. Following the completion of the
study, participants were debriefed.
PIII of the study included two separate assessment periods, TI and TII. At TI,
participants completed the five questionnaires listed above. At TII, participants
completed the RASLES and BDI-II. The purpose of TII in PIII was to gain information
about the test-retest reliability of the RASLES. Participants completed TII 14-21 days
after completing TI. Consent forms were signed for TI and TII and a debriefing form was
given at the end of TII.
At the end of each phase, data analyses were conducted to determine if changes in
the RASLES were needed. During both PI and PII, the primary goal was to collect initial
data in order to examine item distributions, reliability and validity. Items that showed
significant skewness were considered for removal from the questionnaire. Reliability
analyses were conducted in order to understand how reliable the current form of the
questionnaire was. Comparisons between the scale as administered and the proposed

11
altered scale were made to determine the impact that such alterations would have on the
scale. Correlations between the RASLES and the other measures were computed to test
the validity of the measure. At the conclusion of PIII, final tests of item distributions,
reliability and validity analyses were conducted. The instrument presented in PIII of the
study represents the RASLES in its final form. The second assessment period in PIII was
used to ascertain information about test-retest reliability of the RASLES.
Measures
Rumination About Negative Life Events Scale (RASLES). Initially, the RASLES
was a 30-item questionnaire assessing the frequency and intensity of rumination
following a negative life event. Through the development process, the number of items
was reduced from 30 to 10. The original RASLES included 17 rumination and 13 filler
items. The final RASLES contains 7 rumination and 3 filler items.
Participants complete the RASLES by responding to the same items for three
different time periods: 24 hours, 7 days and 6 months. Participants are asked to think of a
stressful life event that they experienced within each time frame specified. They are then
asked how many times the event occurred within the timeframe. Participants indicate that
the event happened either “1 Time,” “2-4 Times,” “5-8 Times,” or “9 or More Times.”
Next, participants are asked to indicate to what extent the event was stressful. They
respond on a 1 (Not Stressful) to 5 (Extremely Stressful) scale. These previous two
questions are useful in determining factors that may influence a participant’s responses
on the subsequent items.
Finally, the participants are presented with a number of items that represent
thoughts that they may have following the stressful life event that they indicated.

12
Participants rate the frequency of each item on a 1 (almost never) to 5 (almost always)
scale. Similarly, participants rate the intensity of each item on a 1 (not intense) to 5
(extremely) scale. These items are used to score the measure.
Upon the completion of the RASLES, three subscales and one total scale are
available to the researcher: 24-hour scale, 7-day scale, 6-month scale and RASLES Total
scale. The subscales are derived by averaging the rumination item scores within each
time interval. The RASLES Total scale is derived by averaging the three subscale scores.
These scales can be obtained for either frequency or intensity scores. Only frequency
scores were analyzed in the present paper.
Response Styles Questionnaire (RSQ; Nolen-Hoeksema & Morrow, 1991). The
RSQ is a 71-item self-response scale gauging the extent to which individuals ruminate
about symptoms of depression and the consequences of those symptoms. Participants are
presented with a series of potential thoughts and are instructed to indicate how often they
engage in each thought when they have feelings of sadness or depression. They indicate
the frequency of thought on a 0 (Almost Always) to 3 (Almost Never) scale. The RSQ
consists of a 22-item rumination subscale, the RSQ-R. The total rumination score is
derived by adding all 22 items. Internal consistency has been reported as strong (e.g., α =
.89; Nolen-Hoeksema & Morrow).
Stress-Reactive Rumination Scale (SRRS; Robinson, 1997). The 25-item SRRS
measures rumination about negative life events, inferences about those negative life
events, hopeless cognitions, and coping strategies. Each item represents a possible
reactive thought to the event. Participants are asked to rate, on a 0 (“never think or do
this”) to 100 (“always think or do this”) scale, how likely they are to react in the manner

13
described. The scale is scored by adding all of the rumination items. The SRRS has
adequate reliability, α = .71 (Robinson & Alloy, 2003). Additionally, tests correlating the
SRRS with negative inferential style, depressive rumination (the RSQ-R), and private
self-consciousness suggest that the scale represents a unique and valid construct
(Robinson & Alloy).
The Obsessive-Compulsive Inventory-Revised (OCI-R; Foa et al., 2002). The
OCI-R is an 18-item scale that assesses obsessions and compulsions. The scale is broken
into six subscales: washing, checking, ordering, obsessing, hoarding, and neutralizing.
For the present study, only the obsessing subscale was of interest. This subscale consists
of the following three items: “I find it difficult to control my own thoughts,” “I am upset
by unpleasant thoughts that come into my mind against my will,” and “I frequently get
nasty thoughts and have difficulty in getting rid of them.” The items are rated on a 0 (Not
at all) to 4 (Extremely) scale, which describes how much distress the item has caused
over the past month. The total and subscale scores are determined by adding all of the
items that compose the respective scales, resulting in a total score range of 0 to 72 and a
subscale score range of 0 to 12. The OCI-R has shown strong internal reliability for both
the total scale (α = .90) and for the individual subscales (α’s from .83 to .90; obsessing
subscale α = .88; Foa et al.). Additionally, strong validity evidence has been presented,
suggesting that the measure is an efficient and effective measure of obsessions and
compulsions (Foa et al.; Hajcak, Huppert, Simons & Foa, 2004).
Beck Depression Inventory-II (BDI-II; Beck et al. 1996). The BDI is a 21-item
instrument that measures an individual’s depressive symptoms. Each item asks the
participants about a different symptom of depression. The items include four levels of

14
any given symptom ranging from an absence of the symptom to a severe form of the
symptom. For instance, one item asks the participant to choose between the following
four statements: “(0) I do not feel like a failure,” “(1) I have failed more than the average
person,” “(2) As I look back, I see a lot of failures,” “(3) I feel I am a total failure as a
person.” The item responses are arranged such that higher numbers represent more severe
symptoms. The scale is scored by adding all 21 items. The higher the total score, the
more depressive symptoms the individual is experiencing. Scores range from 0 (no
symptoms of depression) to 63 (severe symptoms of depression). The BDI has shown
strong reliability in previous studies, α = .91 (Beck et al.) and has been well validated
(Steer, Ball, Ranieri, & Beck, 1997).
CHAPTER THREE
RESULTS
Phase I
During PI, the initial 30-item RASLES was administered to participants. This
version of the RASLES included 17 rumination and 13 filler items (see Appendix A).
Means and standard deviations are for measures used in this phase are reported in Table
2.
Item Data. To reduce the number of items in the questionnaire from the original
17 items, the skewness of each item in the RASLES was examined. Items that had a
highly negative or positive skew suggest that the item provides little information for the
researcher because the majority of participants are responding to the item in a similar
fashion. In other words, the highly skewed items do little to differentiate one participant
from any other participant. Consequently, items that were highly skewed (|z| > 2) were

15
considered for deletion from the item pool. Each item’s performance was examined on
the 24 hour, 7 day, and 6 month scales. Items were considered for deletion if they were
skewed on two of the three scales.
Using this strategy, nine items were suggested for deletion from the initial item
pool (see Table 3). As is indicated, each of these items had two skewness z-scores, in
which the absolute values were above 2. At this point, I examined the impact that
removing these items would have on the scale’s reliability and validity.
Reliability. Reliability analyses were conducted on the original 17-item scale, as
well as the 8-item scale that was suggested after doing analyses on the individual items.
For this analysis, a Cronbach’s alpha was derived in order to determine the internal
consistency of the scale. The data revealed a highly reliable 17-item version of the
RASLES for the 24-hour scale (α = .93), the 7-day scale (α = .93), the 6-month scale (α
= .93), and the RASLES Total scale (α = .96). Additionally, the 8-item version of the
RASLES was highly reliable for the 24-hour scale (α = .87), the 7-day scale (α = .88),
the 6-month scale (α = .89), and the RASLES Total scale (α = .92). These results show
that the deletion of the nine items lowers the reliability of the scale, but the reliability of
the 8-item remained high.
Validity. Construct validity was examined by evaluating the convergent and
divergent validity of the scale. Convergent validity was examined by computing the
correlation between the 17-item RASLES subscales and the RSQ, SRRS, and BDI-II (see
Table 4). The moderate correlations (range = .35 - .58) between the 17-item RASLES
subscales and the RSQ and SRRS suggest that the RASLES is measuring rumination, but
it is not measuring the same type of rumination that is captured by either the RSQ or

16
SRRS. It captures features of rumination that are not assessed in the other scales.
Additionally, the 17-item RASLES subscales moderately correlated with the BDI-II
(range = .28 - .40). The strongest of these correlations (i.e., the correlation between
RASLES Total and BDI-II) was weaker than the correlation between the RSQ and the
BDI-II (r = .60; z = -3.41, p < .001) and the correlation between the SRRS and BDI-II (r
= .54; z = -2.30, p = .02); however, these moderate correlations were still strong enough
to suggest that the 17-item RASLES sufficiently varies with the BDI-II.
These validity analyses were completed with the 8-item RASLES subscales to
determine the effect that the deletion of the nine items would have on validity (see Table
4). Overall, the correlations between the RASLES and the other measures were reduced.
None of these reductions were significantly different. This information suggests that the
deletion of the nine items does not significantly affect scale validity.
Divergent validity was explored by examining the correlation between the
RASLES and the OCI-R, which measures obsessive thinking. Evidence from these
analyses was mixed. As can be seen in Table 4, the correlations between the RASLES
subscales and OCI-R were weaker than the correlations between the RASLES subscales
and the other measures. In order to understand if these differences were significant, the
RASLES/OCI-R correlations were compared to the RASLES/BDI-II correlations using
Cohen and Cohen’s (1983) test of the significance between dependent correlations (see
Table 5 and Table 6). For the 17-item scale, this difference was significant only for the 7-
day subscale, t(310) = -2.40, p = 0.02. For the 8-item subscale, this difference was
significant for the 7-day, t(310) = -2.99, p = .003, and RASLES Total scales, t(310) = -
1.93, p = .05. This data suggests that the correlation between the RASLES and OCI-R is

17
divergent in some cases, but not in others. Overall, the divergent validity data was
inconclusive in this phase of the study. Interestingly, the 8-item RASLES subscales
improved the divergent validity of the scale, further supporting the removal of the
previously discussed nine items.
Partial Correlations. All of the validity analyses were repeated using partial
correlations to control for the effect of the RASLES stress variable on the correlation
between the RASLES subscales and the other measures administered (Table 7). These
partial correlations were computed for both the 17-item and 8-item RASLES scales. For
each partial correlation, the RASLES subscale’s stress variable was partialled out of the
correlation. For the RASLES Total, a composite stress variable was computed by
averaging the stress levels for all three events that the participants reported. As can be
seen by comparing Table 4 and Table 7, the correlations between the RASLES subscales
and all other measures was reduced when stress was controlled for, but none of these
differences were statistically significant. Even though the reductions were not statistically
different, this data suggests that the strength of the relationship between RASLE and the
other constructs measured is affected by the level of the stress that each event causes.
Time Interval Analysis. Exploratory analyses were conducted to test the
differences among the four different scales within the RASLES. T-tests were conducted
on data using both the 17-item and the 8-item RASLES. For both versions, there were
significant differences among all of the subscales, except for when contrasting the 24-
hour and 7-day scales (see Table 8). These two scales showed only a marginally
significant difference (17-item version, t[326] = 1.80, p =.07; 8-item version, t[329] =
1.92, p = .06). Interestingly, these results suggest that each time period is capturing a

18
unique feature of the overall rumination construct that the RASLES is attempting to
measure.
Scale Changes. Using the analysis of item skewness as a guide, nine items were
initially suggested for deletion from the scale. After exploring the effect that the deletion
of these items would have on the scale, it is clear that they have a negligible effect on the
reliability and the validity of the scale. While there was a slight change in both reliability
and validity, this reduction can be explained by the fact that the inclusion of extra items
in a scale will artificially increase the scale reliability and its correlation with other
measures (Nunnally, 1967). As such, the nine items were deleted from the scale at the
end of this phase. Additionally, since the exploratory analyses of the different time
periods suggested that participants were responding differently to the same items
depending on the time period involved, it was important that the three different times
periods remain in the scale.
Phase II
During PII, the 12-item RASLES derived from PI was administered to
participants. This version of the RASLES included 8 rumination and 4 filler items (see
Appendix B). Means and standard deviations are for measures used in this phase are
reported in Table 9.
Item Analysis. To determine how well the 8-items on the RASLES were
performing, the skewness for each item was examined. As with Phase I, each item’s
performance was examined on the 24-hour, 7-day, and 6-month scales. Items were
considered for deletion if they were skewed on two of the three scales and were
ultimately considered for deletion if the absolute value of z was greater than 3. Using this

19
criterion, only one item was considered for deletion (“thought about the circumstances
surrounding the event”; 24-hours skewness z-score = -3.05; 7-days skewness z-score = -
3.95; 6-months skewness z-score = -4.77). Consistent with the first phase, final judgment
regarding the deletion of this item was reserved until further analyses were conducted.
Reliability. Reliability analyses were conducted on both the 8-item and 7-item
RASLES. A Cronbach’s alpha was derived for all of the scales in each version to allow
for exploration of the proposed change to the scale. The internal consistency of the 8-item
RASLES mirrored the results derived in Phase I: 24-hour scale α = .85, 7-hour scale α =
.86, 6-month scale α = .86, RASLES Total scale α = .89. Also similar to the previous
phase, there was a slight decline in the reliability for the newly suggested scale: 24-hour
scale α = .83, 7-day scale α = .84, 6-month scale α = .86, RASLES Total scale α = .87.
These analyses suggest that there was negligible change in the reliability after removing
one item.
Validity. Construct validity was assessed again in this phase. The purpose of this
analysis was to determine the validity of the RASLES and to determine how such
deletion would affect the scale validity. As such, validity analyses were conducted on
both the 8-item and 7-item RASLES. The 8-item version of the RASLES displayed weak
to moderate correlations with the RSQ, SRRS and BDI-II than in Phase I (range = .24 -
.43; see Table 10).
When conducting these same analyses on the 7-item RASLES (see Table 5),
correlations with the RSQ and BDI-II were reduced; however, there was an increase in
the correlation between the SRRS and both the 6-month scale (change in r = +.013) and
the Total scale (change in r = +.002). None of the changes in validity were statistically

20
significant. This analysis suggests that the proposed alteration of the RASLES does not
adversely affect validity.
In examining divergent validity, the correlations between the RASLES subscales
and the OCI-R were weaker than the correlations between the RASLES subscales and the
other measures for both the 8-item and 7-item RASLES (see Table 10). While these
correlations were weaker, they were not significantly different from the correlations
between the RASLES subscales and the BDI-II (see Table 11 and Table 12). With this
information, it is hard to claim that the RASLES appropriately diverges from the OCI-R.
That is, to say that the RASLES diverges from the OCI-R would also be claiming that it
diverges from the BDI-II. As with the previous phase, the correlations between the
RASLES and the OCI-R became weaker when removing the one item suggested for
deletion.
Partial Correlations. Similar to the previous phase, validity analyses were
repeated using partial correlations to control for the effect of the RASLES stress variable
on the correlation between the RASLES subscales and the other measures administered
(Table 13). These partial correlations were computed for both the 8-item and 7-item
RASLES scales. Partial correlations were computed using the same method reported
above. As with the previous phase, controlling for stress reduced the strength of the
relationships between the RASLES subscales and all other measures, although these
differences were not statistically significant.
Time Interval Analysis. Analyses were conducted to determine if there were any
significant differences among the RASLES subscales. Consistent with other analyses in
this phase, these analyses were conducted with both the 8-item and 7-item RASLES. T-

21
tests were used to explore the differences between each pair of subscales. These analyses
revealed a trend similar to that found in the previous phase. Each t-test revealed
significant differences, except for the 24-hour and 7-day scale pairing (see Table 14).
Whereas in PI the difference between these two scales was marginally significant, results
in this phase were non-significant (8-item version, t[317] = -1.02, p =.31; 7-item version,
t[317] = -0.87, p = .38). Although there was no significant difference between the 24-
hour and 7-day scales, these results suggest that the scales are continuing to capture
unique features of rumination.
Scale Changes. Initial analyses of the 8-item RASLES suggested that one item be
deleted from the scale. Exploration of the shortened, 7-item RASLES suggested that
deleting the one item did not have a strong impact on the reliability or validity of the
scale. As seen in the PI analyses, there was a slight reduction in both reliability and
validity after removing the one item; however, this reduction was negligible. One
possible explanation for this reduction is that reliability and validity tends to be higher
when more items are included in a scale. Perhaps, the 8-item version is no more reliable
or valid than the 7-item version; rather there are more items and it therefore produces
higher reliability and validity scores. As in PI, this phase also suggested that there are
important differences among each of the time scales. Consequently, the individual time
scales were maintained in PIII.
Phase III
The purpose of PIII was to test the RASLES in its proposed final state. While the
previous phases were intended to refine the measure, this stage was meant to provide the
final reliability and validity data. Additionally, this phase included two time periods in

22
which participants were assessed in order to evaluate the test-retest validity of the
RASLES.
During PIII, the 10-item RASLES derived from PII was administered to
participants. This version of the RASLES included 7 rumination and 3 filler items (see
Appendix C). Means and standard deviations are for measures used in this phase are
reported in Table 15.
In total, 292 participants began this phase of the study. Of these 292 participants,
223 participants returned and completed T2. Analyses comparing participants who
completed both parts of the study to participants who completed only the first part of the
study revealed significant differences only for their OCI-R scores, t(290) = -2.52, p =
.003, such that those who completed only the first part of the study had higher OCI-R
scores (M = 3.65, SD = 3.28) than those who completed both parts of the study (M = 2.68,
SD = 2.63). They are considered similar on all other measures administered at T1.
Finally, data from 10 participants was excluded from T2 analyses as these 10 participants
completed the second phase of the study either less than 14 days after T1 or more than 21
days after T1. Their data was used in T1 analyses.
Item Data. Item distributions were once again examined. None of the items were
skewed badly enough to suggest deletion. All items were retained in the final phase of the
study.
Reliability. The final reliability analyses were conducted, using Cronbach’s alpha.
All subscales of the RASLES again proved to be reliable for both T1 and T2 (see Table
16). Notably, the reliability for the Total RASLES scale reached .90 for the first time
since the 17-item and 8-item versions of the scale tested in PI. With fewer items used in

23
the current version of the scale, the reliability score of .90 is much more impressive and
suggests that the previous phases have successfully generated a parsimonious scale that
has retained acceptable reliability.
The implementation of two assessment periods in PIII allowed for the
examination of the test-retest reliability of the RASLES. The RASLES appears to have
acceptable test-retest reliability, (see Table 17) such that greater time intervals indicated
better test-retest reliability. Additionally, the TI RASLES Total scale correlated highly
with the TII RASLES Total scale (r = .65).
Validity. Convergent validity in the final RASLES was better than the 8-item and
7-item versions tested in the previous phase for most time periods. The RASLES
moderately correlated with the RSQ, SRRS, T1 BDI-II and T2 BDI-II (range = .19 - .45;
see Table 18). None of the correlations were significantly different from T1 to T2. These
results suggest that the RASLES is a valid measure of rumination. Regarding divergent
validity, the RASLES/OCI-R correlations followed the same trend as reported in the
previous phase: these correlations were weaker than any other measures correlating with
the RASLES, although they were not significantly different from the RASLES/BDI-II
correlations, which were the next weakest correlations (see Table 19).
Partial Correlations. Validity analyses were repeated using partial correlations to
control for the amount of stress caused by each event (see Table 20). These partial
correlations were computed for both the T1 and T2. The same method as reported above
was used to derive the partial correlations. All of the correlations, except two, were
reduced when controlling for stress, but these changes were not statistically significant.
The correlation between the 24-hour scale and both T1 and T2 BDI-II increased when

24
controlling for stress (.295 to .297, z = -0.02, p = .49, and .364 to .369, z = -0.06, p = .48,
respectively).
Time Interval Analysis. T-tests were conducted to explore the differences between
the RASLES subscales. These tests were conducted for the RASLES administered for
both T1 and T2. These analyses largely conformed to the pattern seen in the previous two
phases, with one new finding. For the first time, there was a significant difference
between the 24-hour and 7-day scales. On the T2 questionnaire, the 6-month scale
revealed significantly higher scores than the 24-hour scale, t(219) = -2.12, p = .04. Prior
to this analysis, there was only a marginally significant difference between these two
scales. All other comparisons were significantly different (see Table 22). These results
again suggest that the subscales are assessing slightly different aspects of rumination and
should remain part of the RASLES.
Scale Changes. No changes were suggested by any of the analyses conducted in
this phase of the study. As such, no changes were made. The version of the RASLES
used in PIII is considered the final version of the scale.
CHAPTER FOUR
DISCUSSION
The present study developed a valid and reliable scale to assess rumination about
stressful life events. Throughout the study, the measure was refined in order to create a
parsimonious questionnaire that maintained adequate validity and reliability. The
resulting measure is a 7-item scale that assesses rumination at three different time
periods.

25
The reliability of the scale was initially strong and remained strong throughout the
study. Interestingly, refining the scale after PI created a slight decrease in internal
consistency, but refining the scale after PII ultimately increased scale internal consistency
(α = .90). From PI to PII, Cronbach’s alpha was reduced by only .06 (from .96 to .90),
which suggests that the scale maintained adequate and strong reliability, which was not
artificially increased through the inclusion of extra or redundant items. Overall, the final
scale is parsimonious and performs adequately.
The final scale appears to successfully assess a type of rumination that is related
to commonly used measures of rumination (Nolen-Hoeksema & Morrow, 1991;
Robinson, 1997), yet still captures unique features of rumination. In further exploring the
relationship between the RASLES and both the RSQ and the SRRS, evidence has
emerged to suggest that the RASLES is assessing the theoretically proposed type of
rumination. In all three phases of the study, the RASLES correlated more strongly with
the SRRS than the RSQ. Theoretically, the RASLES is more closely related to the SRRS
because both forms of rumination are proposed to occur before an increase in depressed
mood. The RSQ, on the other hand, assesses rumination that occurs during or after the
onset of depressed mood. Therefore, the RASLES should correlate less strongly with the
RSQ than with the SRRS. These results indicate such a pattern and provide support for
the notion that the RASLES measures a type of rumination that precedes an increase in
depressed mood. Previous research has shown that the SRRS, in interaction with risk
status, can predict the number and duration of major depressive episodes (Robinson &
Alloy, 2003). With this relationship between the RASLES and the SRRS, it is possible
that the RASLES can be a valuable tool in identifying those who are at risk for
26
developing depressive episodes. Regarding divergent validity, the RASLES consistently
showed the weakest correlations with the OCI-R. Ideally, the RASLES/OCI-R
correlations would have been significantly different from other correlations, especially
the next weakest correlation, the RASLES/BDI-II correlation. This lack of difference,
however, can perhaps be explained by similarities between the rumination and obsessing
constructs.
Partialling out event stress from the correlations used to determine the scale
validity yielded interesting results. These analyses consistently suggested that the
strength of the relationship between RASLE and other constructs assessed was strongly
influenced by the stress of the events that participants reported on the RASLES. These
conclusions are not surprising as the stress of an event is likely to influence the amount of
rumination that an individual engages in following the experience of a stressful life event.
Likewise, rumination may influence the stressfulness of an event. Future research that
examines the diathesis-stress relationships involving rumination and stress is warranted.
Further study of the influence of the stress variable on other psychometric
properties is also needed. It was observed that the stressfulness of an event that one
ruminates about may play an important role on the amount of rumination that the event
generates; however, this was only tested in the validity analyses in the present study.
Given this possibility, other psychometric properties may be influenced by the
stressfulness of an event. For instance, test-retest reliability may be affected by the
stressfulness of the events an individual is ruminating about. If an individual picks less
stressful events when initially completing the RASLES and picks more stressful events
when completing the RASLES the second time, the resulting RASLES scores may be

27
different due only to the difference in stressfulness of each of the events. Without
understanding the influence of the stress variable in such a situation, it is hard to interpret
the test-retest reliability of the scale. Overall, it is likely that the more stressful an event
is, the more likely one is to respond in a negative, ruminative manner. As such, responses
to more stressful events could artificially increase the amount of rumination detected by
the RASLES. If this effect is seen in the data, it will likely have an impact on the
psychometric properties of the scale.
One of the most surprising results in the present study were the differences in
rumination for the different subscales of the RASLES. Other than the comparison of the
24-hour and 7-day scales, all other scales were significantly different from one another1.
The meaning of these differences presents some interpretative difficulty. It is clear that
participants are responding to the different scales in distinct ways. What each individual
scale means, however, is harder to discern. One explanation is that the events chosen for
each scale are different in nature and can account for the differences observed. When
asked to choose an event in the past 24 hours, participants are constrained to pick a more
recent event, perhaps one that is not very stressful. While the advantage of the 24-hour
time period is that the event will be more salient to the participant, the disadvantage is
that the participant may pick an insignificant event that by nature does not elicit much
rumination, thereby artificially deflating the rumination score. On the other hand, when a
participant is asked to pick an event in the past 6 months, the pool of events from which
to choose is significantly greater. Additionally, the possibility of picking a more stressful
event is increased. Therefore, it is more likely in the 6-month than the 24-hour period that
the participant will chose an event that elicits more rumination. Perhaps participants

28
chose more stressful events for the longer time periods than for the shorter time periods,
thereby causing the differences in the amount they ruminated about those events. Another
explanation for these differences involves the participants’ memories of the events. It is
possible that the participants chose the events that were most accessible in their memories
at the time of their participation. Research suggests that the more an individual thinks
about an event, the more available the event becomes in memory (Teasdale & Green,
2004). Following the event, the participant would have ruminated about the event,
causing it to be more concretely encoded into memory, which would make it more easy
to recall at a future date. The participant would therefore be recalling events that they
have historically ruminated about, which suggests that the recalled events are ones that
are likely to ruminated about. The 6-month scale would likely pick up on events that are
more likely to have been ruminated about than the 24-hour scale. Again, this theory can
help account for the discrepancy in rumination between the scales.
It is important to note that this study utilized multiple comparisons, which inflates
the overall risk of committing a Type 1 error. One approach to minimize Type 1 error is
to reduce the alpha level, using the Bonferroni correction, for instance; however, Cohen
(1998), in a well-known edited volume published by the American Psychological
Association on methodological issues in clinical research, has noted that the use of the
Bonferroni correction inflates the likelihood of a Type 2 error; lowering alpha based on
such a correction renders only the findings with a high amount of power as statistically
significant. He further noted that such corrections are especially unwarranted in
exploratory investigations, such as the current study.

29
Simply understanding these differences between the subscales does not help
explain the utility of the format of the RASLES. Rather than viewing the RASLES as a
measure that assesses the tendency of an individual to ruminate during three separate
time periods, it best to view it as a measure that samples ruminative habits at three
separate time periods, all of which appear to evoke different ruminative responses to
stress. In other words, the questionnaire samples light, medium and heavy rumination. As
such, it would be misleading to look at only one of the three scales to determine a
person’s ruminative habits. By examining the total rumination score, which takes into
account all three subscales, the average tendency of an individual toward rumination
across situation is brought to light. Following this logic, it is recommended that the
RASLES, in its current state, be administered using all three scales and be scored by
taking the average of the three scales. This RASLES Total score represents an
individual’s overall tendency to ruminate about stressful events. This recommendation is
supported by the reliability and validity data from the present study, which suggests that
the total RASLES score is more reliable and valid than the any of the three subscales
alone.
It is important to note that this is only a preliminary assessment of the RASLES
scale. While the data obtained in this study was collected using a large sample, the
sample was from undergraduates at the same university. Future research should aim to
collect data on the RASLES from more diverse populations. Furthermore, data should be
collected from a clinical population to evaluate its utility in a clinical setting. Because the
RASLES was proposed to be a single factor scale measuring the amount that one
ruminates about stressful events, a study that evaluates the factor structure of the scale
30
would allow for the confirmation of the proposed single factor structure of the measure
should be conducted. As with every scale constructed, research can only provide
evidence for or against the validity of a scale, but can never fully prove that the scale is
measuring what it intends to measures. Further research exploring the construct validity
of the scale would help to determine more concrete validity of the RASLES. Even with
these suggested improvements, initial studies using the RASLES should aim to evaluate
the relationship between rumination, stress and depression. The RASLES may be an
important tool in determining how those who ruminate prior to being depressed may be
more likely to become depressed in the future.
Overall, the present study developed a new measure of rumination that may be
able to further illuminate the role of rumination in the development of depression. This
tool can be instrumental in understanding how pre-depressive rumination factors into
current and future depressive episodes.

31
REFERENCES
Abramson, L. Y., Metalsky, G. I., & Alloy, L. B. (1989). Hopelessness depression: A theory-based subtype of depression. Psychological Review, 96, 358-372. Bagby, R. M., Rector, N. A., Bacchiochi, J. R., & McBride, C. (2004). The stability of
the response styles questionnaire rumination scale in a sample of patients with major depression. Cognitive Therapy and Research, 28, 527-538.
Beck, A.T., Steer, R.A., Ball, R., & Ranieri, W.F. (1996). Comparison of Beck Depression Inventories-IA and -II in psychiatric outpatients. Journal of Personality Assessment, 67, 588-597.
Cohen, J. (1998). Things I have learned (so far). In A. E. Kazdin (Ed.), Methodological
issues in clinical research (pp. 319-336). Washington, DC: American Psychological Association.
Cohen, J., & Cohen, P. (1983). Applied multiple regression/correlation analysis for the
behavioral sciences (2nd ed.). Hillsdale, New Jersey: Lawrence Erlbaum Associates, Publishers.
Foa, E. B., Huppert, J. D., Leiberg, S., Langner, R., Kichic, R., Hajcak, G., & Salkovskis, P. M. (2002). The Obsessive-Compulsive Inventory: Development and validation of a short version. Psychological Assessment, 14, 485-496.
Hajcak, G., Huppert, J. D., Simons, R. F., & Foa, E. B. (2004). Psychometric properties of the OCI-R in a college sample. Behaviour Research and Therapy, 42, 115-123.
Just, N., & Alloy, L. B. (1997). The response style theory of depression: Tests and an extension of the theory. Journal of Abnormal Psychology, 106, 221-229.
Lyubomirsky, S., & Nolen-Hoeksema, S. (1993). Self-perpetuating properties of dysphoric rumination. Journal of Personality and Social Psychology, 65, 339-349.
Martin, L. L., Tesser, A. (1996). Clarifying our thoughts. In R. S. Wyer (Ed). Ruminative thoughts (pp. 1-47). Hillsdale, NJ: Erlbaum.
Morrow, J., & Nolen-Hoeksema, S. (1990). Effects of responses to depression in the
remediation of depressive affect. Journal of Personality and Social Psychology, 58, 519-527.
Needles, D. J., & Abramson, L. Y. (1992). Responses to depressed mood: Cognitive and affective consequences of rumination and distraction. Unpublished manuscript, University of Wisconsin–Madison.

32
Nolen-Hoeksema, S. (1987). Sex differences in unipolar depression: Evidence and theory. Psychological Bulletin, 101, 259-282.
Nolen-Hoeksema, S., & Morrow, J. (1991). A prospective study of depression and
posttraumatic stress symptoms after a natural disaster: The 1989 Loma Prieta Earthquake. Journal of Personality and Social Psychology, 61, 115-121.
Nolen-Hoeksema, S., Morrow, J., & Fredrickson, B. L. (1993). Response style and the duration of episodes of depressed mood. Journal of Abnormal Psychology, 102, 20-28.
Nunnally, J. (1967). Psychometric methods. New York: McGraw Hill Book Co. Papageorgiou, C., & Wells, A. (1999). Process and meta-cognitive dimensions of
depressive and anxious thoughts and relationships with emotional intensity. Clinical Psychology and Psychotherapy, 6, 156-162.
Pyszcynski, T., & Greenberg, J. (1987). Self-regulatory perseveration and the depressive self-focusing style: A self-awareness theory of reactive depression. Psychological Bulletin, 102, 122-138.
Robinson, M. S. (1997). The role of negative inferential style and stress-reactive rumination on negative inferences in the etiology of depression: Empirical investigation and clinical implications. Unpublished doctoral dissertation, Temple University.
Robinson, M. S., & Alloy, L. B. (2003). Negative cognitive styles and stress-reactive rumination interact to predict depression: A prospective study. Cognitive Therapy and Research, 27, 275-291.
Siegle, G. J., Moore, P. M., & Thase, M. E. (2004). Rumination: One construct, many features in healthy individuals, depressed individuals, and individuals with Lupus. Cognitive Therapy and Research, 28, 645-668.
Spasojevic, J., & Alloy, L. B. (2001). Rumination as a common mechanism relating depressive risk factors to depression. Emotion, 1, 25-37.
Steer, R. A., Ball, R., Ranieri, W. F., & Beck, A. T. (1997). Further evidence for the construct validity of the Beck Depression Inventory-II with psychiatric outpatients. Psychological Reports, 80, 693-702.
Teasdale, J. D., & Green, H. A. C. (2004). Ruminative self-focus and autobiographical memories. Personality and Individual Differences, 36, 1933-1943.

33
Trapnell, P. D., & Campbell, J. D. (1999). Private self-consciousness and the five-factor model of personality distinguishing rumination from reflection. Journal of Personality and Social Psychology, 76, 284-304.

34
FOOTNOTES
1 There were a few occasions in which there was a significant difference between
the 24-hour and 7-day scales, but the majority of analyses suggested that there were no
significant differences between these two scales.

35
Table 1
Participant Demographics by Phase
Phase I Phase II Phase III
Participants
338
328
292
Female 220 (65.1%) 178 (54.3%) 197 (67.5%)
Male 113 (33.4%) 146 (44.5%) 95 (32.5%)
Year in School
Freshmen 90 (26.6%) 171 (52.1%) 139 (47.6%)
Sophomore 50 (14.8%) 59 (18.0%) 48 (16.4%)
Junior 76 (22.5%) 61 (18.1%) 44 (15.1%)
Senior 97 (28.7%) 31 (9.5%) 50 (17.1%)
5th Year or Greater 25 (7.4%) 5 (1.5%) 11 (3.8%)
Ethnicity
Caucasian 249 (73.9%) 258 (79.1%) 222 (76.6%)
African American 6 (1.8%) 7 (2.1%) 6 (2.1%)
Asian American/
Pacific Islander
34 (10.1%)
32 (9.8%)
18 (6.2%)
Latino(a) 11 (3.3%) 12 (3.7%) 13 (4.5%)
Native American 2 (0.6%) 2 (.9%) 5 (1.7%)
Biracial/
Multicultural
15 (4.4%)
9 (2.8%)
11 (3.8%)
Other 20 (5.9%) 5 (1.5%) 15 (5.2%)

36
Table 2
Phase I Questionnaire Means and Standard Deviations
Measure Mean Standard Deviation
RSQ
21.68
12.14
SRRS 423.76 182.68
24-hour 2.75 .95
7-day 2.65 1.00
6-month 3.05 1.00
RASLES Total
2.82
.80
OCI-R 2.32 2.59
BDI-II 10.36 8.68
Note. RSQ = Response Style Questionnaire; SRRS = Stress-reactive Rumination Scale;
BDI-II = Beck Depression Inventory-II; 24-hour = 24-hour Rumination About Stressful
Life Events Scale Scale; 7-day = 7-day Rumination About Stressful Life Events Scale
Scale; 6-month = 6-month Rumination About Stressful Life Events Scale Scale; RASLES
Total = Rumination About Stressful Life Events Scale Total Score; OCI-R = Obsessive-
Compulsive Inventory-Revised Obsessing Subscale.

37
Table 3
Phase I Deleted Items and Skewness Z-Scores
Skewness Z-Scores
Item 24-hour 7-day 6-month
analyzed the event
-2.56
-1.24
-4.33
visualized the event 2.68 4.07 0.06
recounted facts about the event 2.08 2.89 -0.49
thought about the feelings you had
during the event
2.13
2.44
-1.95
recalled sounds from the event 12.29 15.19 10.51
relived the event in your mind 3.66 5.00 1.51
wondered about the event 3.31 3.60 1.07
questioned yourself about the event 2.82 2.34 1.00
contemplated why the event was
problematic
3.50
3.86
3.30
Note. 24-hour = 24-hour Rumination About Stressful Life Events Scale; 7-day = 7-day
Rumination About Stressful Life Events Scale; 6-month = 6-month Rumination About
Stressful Life Events Scale.

38
Table 4
Phase I RASLES, RSQ, SRRS, BDI-II, and OCI-R Correlation Matrix
24-hour 7-day 6-month RASLES Total RSQ
.422* | .365* .475* | .435* .347* | .315* .498* | .458*
SRRS .493* | .444* .491* | .471* .446* | .414* .576* | .546*
BDI-II .350* | .275* .396* | .377* .277* | .238* .403* | .358*
OCI-R .285* | .217* .255* | .199* .241* | .201* .307* | .248*
Note. The first correlation presented in each cell is for the 17-item Rumination About
Stressful Life Events Scale. The second correlation presented in each cell is for the 8-
item Rumination About Stressful Life Events Scale. 24-hour = 24-hour Rumination
About Stressful Life Events Scale Scale; 7-day = 7-day Rumination About Stressful Life
Events Scale Scale; 6-month = 6-month Rumination About Stressful Life Events Scale
Scale; RASLES Total = Rumination About Stressful Life Events Scale Total Score; RSQ
= Response Style Questionnaire; SRRS = Stress-reactive Rumination Scale; BDI-II =
Beck Depression Inventory-II; OCI-R = Obsessive-Compulsive Inventory-Revised
Obsessing Subscale.
* = p < .001

39
Table 5
Phase I Significance Tests of Differences Between RASLES/OCI-R and RASLES/BDI-II
Correlations Using the 17-item RASLES
24-hour 7-day 6-month RASLES Total
t(310) = -1.09,
p = 0.28
t(310) = -2.40,
p = 0.02
t(310) = -0.45,
p = 0.66
t(310) = -1.68,
p = 0.09
Note. Each cell represents the t-test comparing the RASLES/OCI correlation to the
RASLES/BDI-II correlation using the specified RASLES subscale. 24-hour = 24-hour
Rumination About Stressful Life Events Scale Scale; 7-day = 7-day Rumination About
Stressful Life Events Scale Scale; 6-month = 6-month Rumination About Stressful Life
Events Scale Scale; RASLES Total = Rumination About Stressful Life Events Scale
Total Score; BDI-II = Beck Depression Inventory-II; OCI-R = Obsessive-Compulsive
Inventory-Revised Obsessing Subscale.

40
Table 6
Phase I Significance Tests of Differences Between RASLES/OCI-R and RASLES/BDI-II
Correlations Using the 8-item RASLES
24-hour 7-day 6-month RASLES Total
t(310) = -0.99,
p = 0.32
t(310) = -2.99,
p = 0.003
t(310) = -0.46,
p = 0.64
t(310) = -1.93,
p = 0.05
Note. Each cell represents the t-test comparing the RASLES/OCI correlation to the
RASLES/BDI-II correlation using the specified RASLES subscale. 24-hour = 24-hour
Rumination About Stressful Life Events Scale Scale; 7-day = 7-day Rumination About
Stressful Life Events Scale Scale; 6-month = 6-month Rumination About Stressful Life
Events Scale Scale; RASLES Total = Rumination About Stressful Life Events Scale
Total Score; BDI-II = Beck Depression Inventory-II; OCI-R = Obsessive-Compulsive
Inventory-Revised Obsessing Subscale.
41
Table 7
Phase I RASLES, RSQ, SRRS, BDI-II, and OCI-R with Each Subscale’s Stress Variable
Partialled Out
24-hour 7-day 6-month RASLES Total RSQ
.392*** | .329*** .384*** | .338*** .281*** | .242*** .399*** | .349***
SRRS .440*** | .386*** .388*** | .365*** .390*** | .354*** .473*** | .434***
BDI-II .277*** | .192** .275*** | .255*** .227*** | .183** .285*** | .234***
OCI-R .268*** | .187** .198*** | .134* .212*** | .174** .237*** | .176**
Note. The first correlation presented in each cell is for the 17-item Rumination About
Stressful Life Events Scale. The second correlation presented in each cell is for the 8-
item Rumination About Stressful Life Events Scale. 24-hour = 24-hour Rumination
About Stressful Life Events Scale Scale; 7-day = 7-day Rumination About Stressful Life
Events Scale Scale; 6-month = 6-month Rumination About Stressful Life Events Scale
Scale; RASLES Total = Rumination About Stressful Life Events Scale Total Score; RSQ
= Response Style Questionnaire; SRRS = Stress-reactive Rumination Scale; BDI-II =
Beck Depression Inventory-II; OCI-R = Obsessive-Compulsive Inventory-Revised
Obsessing Subscale.
* = p < .05
** = p < .01
*** = p < .001

42
Table 8
Phase I T-tests Comparing Differences Between RASLES Subscales
17-item RASLES
24-hour 7-day 6-month
7-day
t(326) = 1.79, p = .07
6-month t(326) = -5.67,
p < .001
t(323) = -7.39,
p < .001
RASLES Total t(321) = -2.18,
p = .03
t(321) = -5.29,
p < .001
t(321) = 7.42,
p < .001
8-item RASLES
24-hour 7-day 6-month
7-day
t(329) = 1.92, p = .06
6-month t(329) = -6.05,
p < .001
t(325) = -7.54,
p < .001
RASLES Total t(325) = -2.25,
p = .03
t(325) = -5.45,
p < .001
t(325) = 7.83,
p < .001
Note. 24-hour = 24-hour Rumination About Stressful Life Events Scale; 7-day = 7-day
Rumination About Stressful Life Events Scale; 6-month = 6-month Rumination About
Stressful Life Events Scale; RASLES Total = Rumination About Stressful Life Events
Scale Total Score.

43
Table 9
Phase II Questionnaire Means and Standard Deviations
Measure Mean Standard Deviation
RSQ
21.47
11.53
SRRS 435.98 162.16
24-hour 3.08 .91
7-day 3.13 .97
6-month 3.47 .98
RASLES Total
3.23 .71
OCI-R 2.99 2.80
BDI-II 10.39 8.22
Note. RSQ = Response Style Questionnaire; SRRS = Stress-reactive Rumination Scale;
BDI-II = Beck Depression Inventory-II; 24-hour = 24-hour Rumination About Stressful
Life Events Scale Scale; 7-day = 7-day Rumination About Stressful Life Events Scale
Scale; 6-month = 6-month Rumination About Stressful Life Events Scale Scale; RASLES
Total = Rumination About Stressful Life Events Scale Total Score; OCI-R = Obsessive-
Compulsive Inventory-Revised Obsessing Subscale.

44
Table 10
Phase II RASLES, RSQ, SRRS, BDI-II, and OCI Correlation Matrix
24-hour 7-day 6-month RASLES Total RSQ
.242** | .226** .235** | .226** .305** | .306** .344** | .337**
SRRS .371** | .351** .288** | .287** .343** | .356** .426** | .428**
BDI-II .275** | .254** .243** | .231** .270** | .271** .340** | .331**
OCI-R .229** | .220** .187* | .180** .248** | .248** .286** | .282**
Note. The first correlation presented in each cell is for the 8-item Rumination About
Stressful Life Events Scale. The second correlation presented in each cell is for the 7-
item Rumination About Stressful Life Events Scale. 24-hour = 24-hour Rumination
About Stressful Life Events Scale Scale; 7-day = 7-day Rumination About Stressful Life
Events Scale Scale; 6-month = 6-month Rumination About Stressful Life Events Scale
Scale; RASLES Total = Rumination About Stressful Life Events Scale Total Score; RSQ
= Response Style Questionnaire; SRRS = Stress-reactive Rumination Scale; BDI-II =
Beck Depression Inventory-II; OCI-R = Obsessive-Compulsive Inventory-Revised
Obsessing Subscale.
* = p < .01
** = p < .001

45
Table 11
Phase II Significance Tests of Differences Between RASLES/OCI-R and RASLES/BDI-II
Correlations Using the 8-item RASLES
24-hour 7-day 6-month RASLES Total
t(300) = -0.44,
p = 0.66
t(300) = -0.90,
p = 0.37
t(300) = -0.50,
p = 0.62
t(300) = -0.85,
p = 0.40
Note. Each cell represents the t-test comparing the RASLES/OCI correlation to the
RASLES/BDI-II correlation using the specified RASLES subscale. 24-hour = 24-hour
Rumination About Stressful Life Events Scale Scale; 7-day = 7-day Rumination About
Stressful Life Events Scale Scale; 6-month = 6-month Rumination About Stressful Life
Events Scale Scale; RASLES Total = Rumination About Stressful Life Events Scale
Total Score; BDI-II = Beck Depression Inventory-II; OCI-R = Obsessive-Compulsive
Inventory-Revised Obsessing Subscale.

46
Table 12
Phase II Significance Tests of Differences Between RASLES/OCI-R and RASLES/BDI-II
Correlations Using the 7-item RASLES
24-hour 7-day 6-month RASLES Total
t(300) = -0.28,
p = 0.78
t(300) = -0.81,
p = 0.42
t(300) = -0.50,
p = 0.62
t(300) = -0.77,
p = 0.44
Note. Each cell represents the t-test comparing the RASLES/OCI correlation to the
RASLES/BDI-II correlation using the specified RASLES subscale. 24-hour = 24-hour
Rumination About Stressful Life Events Scale Scale; 7-day = 7-day Rumination About
Stressful Life Events Scale Scale; 6-month = 6-month Rumination About Stressful Life
Events Scale Scale; RASLES Total = Rumination About Stressful Life Events Scale
Total Score; BDI-II = Beck Depression Inventory-II; OCI-R = Obsessive-Compulsive
Inventory-Revised Obsessing Subscale.

47
Table 13
Phase II RASLES, RSQ, SRRS, BDI-II, and OCI-R with Each Subscale’s Stress Variable
Partialled Out
24-hour 7-day 6-month RASLES Total RSQ
.202*** | .185** .192** | .181** .223*** | .223*** .250*** | .241***
SRRS .318*** | .295*** .253*** | .250*** .300*** | .314*** .351*** | .352***
BDI-II .171* | .155** .150** | .140* .205*** | .201*** .195** | .186**
OCI-R .205** | .196** .089 | .086 .227*** | .224*** .203*** | .199**
Note. The first correlation presented in each cell is for the 8-item Rumination About
Stressful Life Events Scale. The second correlation presented in each cell is for the 7-
item Rumination About Stressful Life Events Scale. 24-hour = 24-hour Rumination
About Stressful Life Events Scale Scale; 7-day = 7-day Rumination About Stressful Life
Events Scale Scale; 6-month = 6-month Rumination About Stressful Life Events Scale
Scale; RASLES Total = Rumination About Stressful Life Events Scale Total Score; RSQ
= Response Style Questionnaire; SRRS = Stress-reactive Rumination Scale; BDI-II =
Beck Depression Inventory-II; OCI-R = Obsessive-Compulsive Inventory-Revised
Obsessing Subscale.
* = p < .05
** = p < .01
*** = p < .001

48
Table 14
Phase II T-tests Comparing Differences Between RASLES Scales
8-item RASLES
24-hour 7-day 6-month
7-day
t(317) = -1.02, p = .31
6-month t(316) = -6.71,
p < .001
t(314) = -5.14,
p < .001
RASLES Total t(312) = -4.69,
p < .001
t(312) = -2.41,
p = .02
t(312) = 6.82,
p < .001
7-item RASLES
24-hour 7-day 6-month
7-day
t(317) = -0.87, p = .38
6-month t(316) = -6.67,
p < .001
t(314) = -5.40,
p < .001
RASLES Total t(312) = -4.59,
p < .001
t(312) = -2.65,
p < .01
t(312) = 6.98,
p < .001
Note. 24-hour = 24-hour Rumination About Stressful Life Events Scale; 7-day = 7-day
Rumination About Stressful Life Events Scale; 6-month = 6-month Rumination About
Stressful Life Events Scale; RASLES Total = Rumination About Stressful Life Events
Scale Total Score.

49
Table 15
Phase III Questionnaire Means and Standard Deviations
Measure Mean Standard Deviation
RSQ
23.75
12.58
SRRS 453.83 12.02
T1 24-hour 3.07 1.00
T1 7-day 3.11 .99
T1 6-month 3.52 1.02
T1 RASLES Total 3.23 .78
OCI-R 2.91 2.81
T1 BDI-II 11.34 8.77
T2 24-hour 2.73 .99
T2 7-day 2.89 1.00
T2 6-month 3.32 .97
T2 RASLES Total
2.98 .75
T2 BDI-II 10.25 9.24
Note. RSQ = Response Style Questionnaire; SRRS = Stress-reactive Rumination Scale;
BDI-II = Beck Depression Inventory-II; 24-hour = 24-hour Rumination About Stressful
Life Events Scale Scale; 7-day = 7-day Rumination About Stressful Life Events Scale
Scale; 6-month = 6-month Rumination About Stressful Life Events Scale Scale; RASLES
Total = Rumination About Stressful Life Events Scale Total Score; OCI-R = Obsessive-
Compulsive Inventory-Revised Obsessing Subscale. T1 = Time 1; T2 = Time 2.

50
Table 16
Phase III RASLES Internal Consistency Reliability
24-hour 7-day 6-month RASLES Total
T1
.849 .849 .882 .899
T2 .878 .870 .880 .902
Note. 24-hour = 24-hour Rumination About Stressful Life Events Scale; 7-day = 7-day
Rumination About Stressful Life Events Scale; 6-month = 6-month Rumination About
Stressful Life Events Scale; RASLES Total = Rumination About Stressful Life Events
Scale Total Score; T1 = Phase III, Time 1; T2 = Phase III, Time 2.
Table 17
Test-rest Reliability Correlations
24-hour 7-day 6-month RASLES Total
.333
.402 .551 .650
Note. 24-hour = 24-hour Rumination About Stressful Life Events Scale; 7-day = 7-day
Rumination About Stressful Life Events Scale; 6-month = 6-month Rumination About
Stressful Life Events Scale; RASLES Total = Rumination About Stressful Life Events
Scale Total Score.

51
Table 18
Phase III RASLES, RSQ, SRRS, T1 BDI-II, T2 BDI-II, and OCI Correlation Matrix
24-hour 7-day 6-month RASLES Total
RSQ
.332*** | .282*** .287*** | .243*** .340*** | .322*** .411*** | .375***
SRRS .414*** | .333*** .312*** | .289*** .338*** | .309*** .449*** | .407***
T1 BDI-II .296*** | .295*** .237*** | .302*** .294*** | .264*** .348*** | .374***
T2 BDI-II .280*** | .364*** .189** | .236*** .309*** | .328*** .328*** | .400***
OCI-R .170** | .228** .128* | .240*** .235*** | .241*** .231*** | .310***
Note. The first correlation presented in each cell is for the T1 Rumination About Stressful
Life Events Subscales. The second correlation presented in each cell is for the T2
Rumination About Stressful Life Events Subscales. 24-hour = 24-hour Rumination About
Stressful Life Events Scale Scale; 7-day = 7-day Rumination About Stressful Life Events
Scale Scale; 6-month = 6-month Rumination About Stressful Life Events Scale Scale;
RASLES Total = Rumination About Stressful Life Events Scale Total Score; RSQ =
Response Style Questionnaire; SRRS = Stress-reactive Rumination Scale; T1 BDI-II =
Time 1 Beck Depression Inventory-II; T2 BDI-II = Time 2 Beck Depression Inventory-
II; OCI-R = Obsessive-Compulsive Inventory-Revised Obsessing Subscale.
* = p < .05
** = p < .01
*** = p < .001

52
Table 19
Phase III Significance Tests of Differences Between RASLES/OCI-R and RASLES/BDI-II
Correlations
24-hour 7-day 6-month RASLES Total
t(285) = -1.70, p = 0.09
t(285) = -1.19, p = 0.24
t(285) = -0.89, p = 0.37
t(285) = -1.70,
p = 0.09
Note. Each cell represents the t-test comparing the RASLES/OCI correlation to the
RASLES/BDI-II correlation using the specified RASLES subscale. 24-hour = 24-hour
Rumination About Stressful Life Events Scale Scale; 7-day = 7-day Rumination About
Stressful Life Events Scale Scale; 6-month = 6-month Rumination About Stressful Life
Events Scale Scale; RASLES Total = Rumination About Stressful Life Events Scale
Total Score; BDI-II = Beck Depression Inventory-II; OCI-R = Obsessive-Compulsive
Inventory-Revised Obsessing Subscale.

53
Table 20
Phase III RASLES, RSQ, SRRS, T1 BDI-II, T2 BDI-II, and OCI-R with Each Subscale’s
Stress Variable Partialled Out
24-hour 7-day 6-month RASLES Total
RSQ
.336*** | .255*** .212** | .193** .229** | .242*** .305*** | .297***
SRRS .396*** | .290*** .200** | .211** .257*** | .215** .333*** | .310***
T1 BDI-II .287*** | .297*** .084 | .244*** .208** | .204** .226** | .272***
T2 BDI-II .240*** | .369*** .026 | .180** .185** | .275*** .164** | .265***
OCI-R .170** | .219** .102 | .209** .126 | .172* .136* | .215**
Note. The first correlation presented in each cell is for the T1 Rumination About Stressful
Life Events Subscales. The second correlation presented in each cell is for the T2
Rumination About Stressful Life Events Subscales. 24-hour = 24-hour Rumination About
Stressful Life Events Scale Scale; 7-day = 7-day Rumination About Stressful Life Events
Scale Scale; 6-month = 6-month Rumination About Stressful Life Events Scale Scale;
RASLES Total = Rumination About Stressful Life Events Scale Total Score; RSQ =
Response Style Questionnaire; SRRS = Stress-reactive Rumination Scale; T1 BDI-II =
Time 1 Beck Depression Inventory-II; T2 BDI-II = Time 2 Beck Depression Inventory-
II; OCI-R = Obsessive-Compulsive Inventory-Revised Obsessing Subscale.
* = p < .05
** = p < .01
*** = p < .001

54
Table 21
Phase III T-tests Comparing Differences Between RASLES Scales for T1 and T2
T1
24-hour 7-day 6-month
7-day
t(281) = -0.52, p = .61
6-month t(285) = -6.85,
p < .001
t(284) = -6.30,
p < .001
RASLES Total t(281) = -4.44,
p < .001
t(281) = -3.57,
p < .001
t(281) = 7.38,
p < .001
T2
24-hour 7-day 6-month
7-day
t(219) = -2.12, p = .035
6-month t(220) = -8.03,
p < .001
t(220) = -6.21,
p < .001
RASLES Total t(219) = -5.58,
p < .001
t(219) = -2.09,
p = .04
t(219) = 8.42,
p < .001
Note. 24-hour = 24-hour Rumination About Stressful Life Events Scale; 7-day = 7-day
Rumination About Stressful Life Events Scale; 6-month = 6-month Rumination About
Stressful Life Events Scale; RASLES Total = Rumination About Stressful Life Events
Scale Total Score; T1 = Phase III, Time 1; T2 = Phase III, Time 2.

APPENDIX

56
APPENDIX A
PHASE I RASLES Event #1 In the following blank space, please write down one stressful life event that you experienced in the last 24 hours. If you have not experienced a particularly stressful life event in the timeframe specified, please write down an event that was relatively more stressful than other events you have experienced in the indicated timeframe. _______________________________________________________________________ _______________________________________________________________________ How often have you experienced the stressful event, or something similar in the last 24 hours? PLEASE CIRCLE ONLY ONE ANSWER.
1 Time 2-4 Times 5-8 Times 9 or More Times How stressful was the event? PLEASE CIRCLE ONLY ONE ANSWER
Not Somewhat Moderately Very Extremely Stressful Stressful Stressful Stressful Stressful For items 1 - 30, please indicate how often you had each thought after experiencing the event specified above as “Event #1.” Use the “FREQUENCY” key to determine your response. Write the number of your response in the column labeled “Frequency” located to the right of the item. Then, please indicate the intensity of this thought. Use the “INTENSITY” key to determine your response. Write the number that corresponds to your response in the column labeled “Intensity” located to the right of the current thought. FREQUENCY INTENSITY 1 = almost never 1 = not intense
2 = sometimes 2 = somewhat 3 = moderately often 3 = moderately
4 = often 4 = very 5 = almost always 5 = extremely
Frequency Intensity 1. thought about other people involved in the event _______ _______ 2. considered things related to the event _______ _______ 3. focused on your emotions _______ _______ 4. thought about your feelings that resulted from the event _______ _______ 5. analyzed the event _______ _______

57
FREQUENCY INTENSITY 1 = almost never 1 = not intense
2 = sometimes 2 = somewhat 3 = moderately often 3 = moderately
4 = often 4 = very 5 = almost always 5 = extremely
Frequency Intensity 6. thought about the situation that caused the event _______ _______ 7. remembered the peculiarities of the event _______ _______ 8. thought about the repercussions of the event _______ _______ 9. thought how to fix the situation _______ _______ 10. recalled information about the event _______ _______ 11. thought about how the event impacts your future _______ _______ 12. replayed the event in your mind _______ _______ 13. visualized the event _______ _______ 14. thought about how sad you were _______ _______ 15. recounted facts about the event _______ _______ 16. thought “I should not be stressed by this” _______ _______ 17. thought about details of the event _______ _______ 18. thought about causes of the event _______ _______ 19. thought about the feelings you had during the event _______ _______ 20. recalled sounds from the event _______ _______ 21. thought how to prevent the event from happening again _______ _______ 22. relived the event in your mind _______ _______ 23. thought about the circumstances surrounding the event _______ _______ 24. considered the consequences of the event _______ _______ 25. dreamed about the event _______ _______ 26. wondered about the event _______ _______ 27. reflected on the event _______ _______ 28. thought “Why is this happening to me?” _______ _______ 29. questioned yourself about the event _______ _______ 30. contemplated why the event was problematic _______ _______

58
Event #2 In the following blank space, please write down one stressful life event that you experienced in the last 7 days. If you have not experienced a particularly stressful life event in the timeframe specified, please write down an event that was relatively more stressful than other events you have experienced in the indicated timeframe. _______________________________________________________________________ _______________________________________________________________________ How often have you experienced the stressful event, or something similar in the 7 days? PLEASE CIRCLE ONLY ONE ANSWER.
1 Time 2-4 Times 5-8 Times 9 or More Times How stressful was the event? PLEASE CIRCLE ONLY ONE ANSWER
Not Somewhat Moderately Very Extremely Stressful Stressful Stressful Stressful Stressful For items 1 - 30, please indicate how often you had each thought after experiencing the event specified above as “Event #2.” Use the “FREQUENCY” key to determine your response. Write the number of your response in the column labeled “Frequency” located to the right of the item. Then, please indicate the intensity of this thought. Use the “INTENSITY” key to determine your response. Write the number that corresponds to your response in the column labeled “Intensity” located to the right of the current thought. FREQUENCY INTENSITY 1 = almost never 1 = not intense
2 = sometimes 2 = somewhat 3 = moderately often 3 = moderately
4 = often 4 = very 5 = almost always 5 = extremely
Frequency Intensity 1. thought about other people involved in the event _______ _______ 2. considered things related to the event _______ _______ 3. focused on your emotions _______ _______ 4. thought about your feelings that resulted from the event _______ _______ 5. analyzed the event _______ _______ 6. thought about the situation that caused the event _______ _______ 7. remembered the peculiarities of the event _______ _______ 8. thought about the repercussions of the event _______ _______ 9. thought how to fix the situation _______ _______

59
FREQUENCY INTENSITY 1 = almost never 1 = not intense
2 = sometimes 2 = somewhat 3 = moderately often 3 = moderately
4 = often 4 = very 5 = almost always 5 = extremely
Frequency Intensity 10. recalled information about the event _______ _______ 11. thought about how the event impacts your future _______ _______ 12. replayed the event in your mind _______ _______ 13. visualized the event _______ _______ 14. thought about how sad you were _______ _______ 15. recounted facts about the event _______ _______ 16. thought “I should not be stressed by this” _______ _______ 17. thought about details of the event _______ _______ 18. thought about causes of the event _______ _______ 19. thought about the feelings you had during the event _______ _______ 20. recalled sounds from the event _______ _______ 21. thought how to prevent the event from happening again _______ _______ 22. relived the event in your mind _______ _______ 23. thought about the circumstances surrounding the event _______ _______ 24. considered the consequences of the event _______ _______ 25. dreamed about the event _______ _______ 26. wondered about the event _______ _______ 27. reflected on the event _______ _______ 28. thought “Why is this happening to me?” _______ _______ 29. questioned yourself about the event _______ _______ 30. contemplated why the event was problematic _______ _______

60
Event #3 In the following blank space, please write down one stressful life event that you experienced in the last 6 months. If you have not experienced a particularly stressful life event in the timeframe specified, please write down an event that was relatively more stressful than other events you have experienced in the indicated timeframe. _______________________________________________________________________ _______________________________________________________________________ How often have you experienced the stressful event, or something similar in the last 6 months? PLEASE CIRCLE ONLY ONE ANSWER.
1 Time 2-4 Times 5-8 Times 9 or More Times How stressful was the event? PLEASE CIRCLE ONLY ONE ANSWER
Not Somewhat Moderately Very Extremely Stressful Stressful Stressful Stressful Stressful For items 1 - 30, please indicate how often you had each thought after experiencing the event specified above as “Event #3.” Use the “FREQUENCY” key to determine your response. Write the number of your response in the column labeled “Frequency” located to the right of the item. Then, please indicate the intensity of this thought. Use the “INTENSITY” key to determine your response. Write the number that corresponds to your response in the column labeled “Intensity” located to the right of the current thought. FREQUENCY INTENSITY 1 = almost never 1 = not intense
2 = sometimes 2 = somewhat 3 = moderately often 3 = moderately
4 = often 4 = very 5 = almost always 5 = extremely
Frequency Intensity 1. thought about other people involved in the event _______ _______ 2. considered things related to the event _______ _______ 3. focused on your emotions _______ _______ 4. thought about your feelings that resulted from the event _______ _______ 5. analyzed the event _______ _______ 6. thought about the situation that caused the event _______ _______ 7. remembered the peculiarities of the event _______ _______ 8. thought about the repercussions of the event _______ _______ 9. thought how to fix the situation _______ _______

61
FREQUENCY INTENSITY 1 = almost never 1 = not intense
2 = sometimes 2 = somewhat 3 = moderately often 3 = moderately
4 = often 4 = very 5 = almost always 5 = extremely
Frequency Intensity 10. recalled information about the event _______ _______ 11. thought about how the event impacts your future _______ _______ 12. replayed the event in your mind _______ _______ 13. visualized the event _______ _______ 14. thought about how sad you were _______ _______ 15. recounted facts about the event _______ _______ 16. thought “I should not be stressed by this” _______ _______ 17. thought about details of the event _______ _______ 18. thought about causes of the event _______ _______ 19. thought about the feelings you had during the event _______ _______ 20. recalled sounds from the event _______ _______ 21. thought how to prevent the event from happening again _______ _______ 22. relived the event in your mind _______ _______ 23. thought about the circumstances surrounding the event _______ _______ 24. considered the consequences of the event _______ _______ 25. dreamed about the event _______ _______ 26. wondered about the event _______ _______ 27. reflected on the event _______ _______ 28. thought “Why is this happening to me?” _______ _______ 29. questioned yourself about the event _______ _______ 30. contemplated why the event was problematic _______ _______

62
APPENDIX B
PHASE II RASLES Event #1 In the following blank space, please write down one stressful life event that you experienced in the last 24 hours. If you have not experienced a particularly stressful life event in the timeframe specified, please write down an event that was relatively more stressful than other events you have experienced in the indicated timeframe. ________________________________________________________________________ ________________________________________________________________________ How often have you experienced the stressful event, or something similar in the last 24 hours? PLEASE CIRCLE ONLY ONE ANSWER.
1 Time 2-4 Times 5-8 Times 9 or More Times How stressful was the event? PLEASE CIRCLE ONLY ONE ANSWER
Not Somewhat Moderately Very Extremely Stressful Stressful Stressful Stressful Stressful For items 1 - 30, please indicate how often you had each thought after experiencing the event specified above as “Event #1.” Use the “FREQUENCY” key to determine your response. Write the number of your response in the column labeled “Frequency” located to the right of the item. Then, please indicate the intensity of this thought. Use the “INTENSITY” key to determine your response. Write the number that corresponds to your response in the column labeled “Intensity” located to the right of the current thought. FREQUENCY INTENSITY 1 = almost never 1 = not intense
2 = sometimes 2 = somewhat 3 = moderately often 3 = moderately
4 = often 4 = very 5 = almost always 5 = extremely
Frequency Intensity 1. thought about other people involved in the event _______ _______ 2. considered things related to the event _______ _______ 3. focused on your emotions _______ _______ 4. remembered the peculiarities of the event _______ _______ 5. recalled information about the event _______ _______ 6. replayed the event in your mind _______ _______ 7. thought “I should not be stressed by this” _______ _______ 8. thought about details of the event _______ _______ 9. thought about causes of the event _______ _______ 10. thought about the circumstances surrounding the event _______ _______ 11. considered the consequences of the event _______ _______ 12. reflected on the event _______ _______
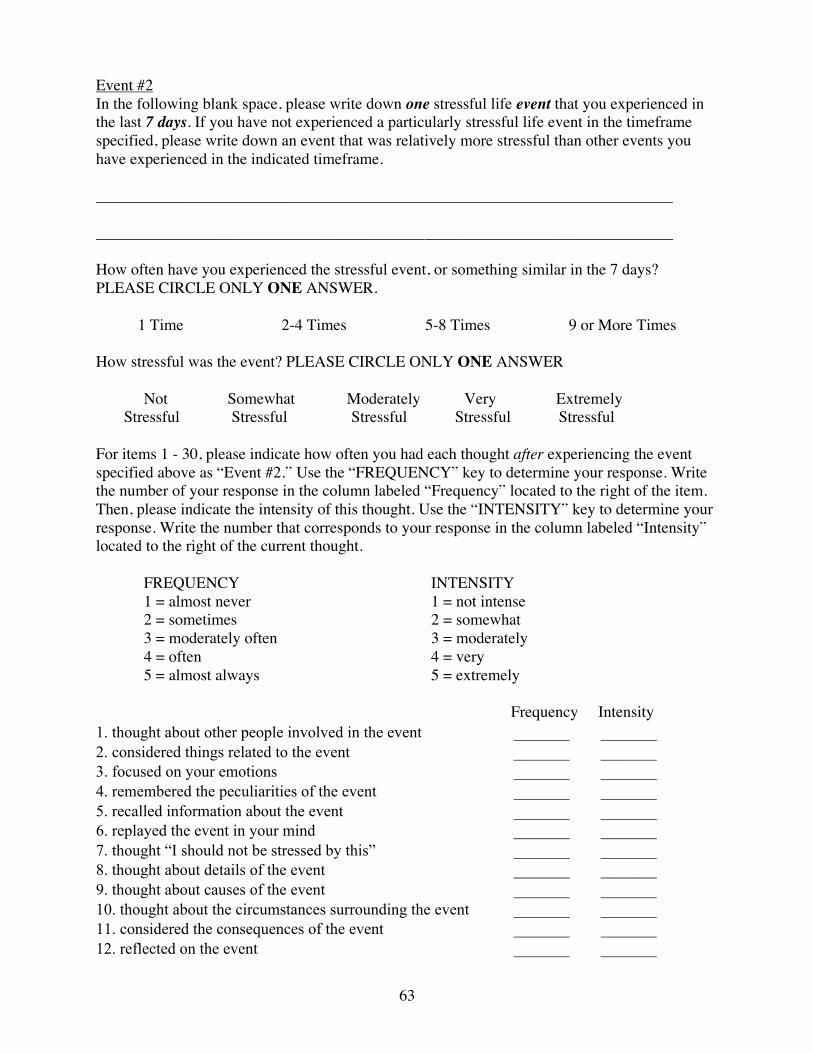
63
Event #2 In the following blank space, please write down one stressful life event that you experienced in the last 7 days. If you have not experienced a particularly stressful life event in the timeframe specified, please write down an event that was relatively more stressful than other events you have experienced in the indicated timeframe. ________________________________________________________________________ ________________________________________________________________________ How often have you experienced the stressful event, or something similar in the 7 days? PLEASE CIRCLE ONLY ONE ANSWER.
1 Time 2-4 Times 5-8 Times 9 or More Times How stressful was the event? PLEASE CIRCLE ONLY ONE ANSWER
Not Somewhat Moderately Very Extremely Stressful Stressful Stressful Stressful Stressful For items 1 - 30, please indicate how often you had each thought after experiencing the event specified above as “Event #2.” Use the “FREQUENCY” key to determine your response. Write the number of your response in the column labeled “Frequency” located to the right of the item. Then, please indicate the intensity of this thought. Use the “INTENSITY” key to determine your response. Write the number that corresponds to your response in the column labeled “Intensity” located to the right of the current thought. FREQUENCY INTENSITY 1 = almost never 1 = not intense
2 = sometimes 2 = somewhat 3 = moderately often 3 = moderately
4 = often 4 = very 5 = almost always 5 = extremely
Frequency Intensity 1. thought about other people involved in the event _______ _______ 2. considered things related to the event _______ _______ 3. focused on your emotions _______ _______ 4. remembered the peculiarities of the event _______ _______ 5. recalled information about the event _______ _______ 6. replayed the event in your mind _______ _______ 7. thought “I should not be stressed by this” _______ _______ 8. thought about details of the event _______ _______ 9. thought about causes of the event _______ _______ 10. thought about the circumstances surrounding the event _______ _______ 11. considered the consequences of the event _______ _______ 12. reflected on the event _______ _______

64
Event #3 In the following blank space, please write down one stressful life event that you experienced in the last 6 months. If you have not experienced a particularly stressful life event in the timeframe specified, please write down an event that was relatively more stressful than other events you have experienced in the indicated timeframe. ________________________________________________________________________ ________________________________________________________________________ How often have you experienced the stressful event, or something similar in the last 6 months? PLEASE CIRCLE ONLY ONE ANSWER.
1 Time 2-4 Times 5-8 Times 9 or More Times How stressful was the event? PLEASE CIRCLE ONLY ONE ANSWER
Not Somewhat Moderately Very Extremely Stressful Stressful Stressful Stressful Stressful For items 1 - 30, please indicate how often you had each thought after experiencing the event specified above as “Event #3.” Use the “FREQUENCY” key to determine your response. Write the number of your response in the column labeled “Frequency” located to the right of the item. Then, please indicate the intensity of this thought. Use the “INTENSITY” key to determine your response. Write the number that corresponds to your response in the column labeled “Intensity” located to the right of the current thought. FREQUENCY INTENSITY 1 = almost never 1 = not intense
2 = sometimes 2 = somewhat 3 = moderately often 3 = moderately
4 = often 4 = very 5 = almost always 5 = extremely
Frequency Intensity 1. thought about other people involved in the event _______ _______ 2. considered things related to the event _______ _______ 3. focused on your emotions _______ _______ 4. remembered the peculiarities of the event _______ _______ 5. recalled information about the event _______ _______ 6. replayed the event in your mind _______ _______ 7. thought “I should not be stressed by this” _______ _______ 8. thought about details of the event _______ _______ 9. thought about causes of the event _______ _______ 10. thought about the circumstances surrounding the event _______ _______ 11. considered the consequences of the event _______ _______ 12. reflected on the event _______ _______

65
APPENDIX C
PHASE III RASLES Event #1 In the following blank space, please write down one stressful life event that you experienced in the last 24 hours. If you have not experienced a particularly stressful life event in the timeframe specified, please write down an event that was relatively more stressful than other events you have experienced in the indicated timeframe. ________________________________________________________________________ ________________________________________________________________________ How often have you experienced the stressful event, or something similar in the last 24 hours? PLEASE CIRCLE ONLY ONE ANSWER.
1 Time 2-4 Times 5-8 Times 9 or More Times How stressful was the event? PLEASE CIRCLE ONLY ONE ANSWER
Not Somewhat Moderately Very Extremely Stressful Stressful Stressful Stressful Stressful For items 1 - 30, please indicate how often you had each thought after experiencing the event specified above as “Event #1.” Use the “FREQUENCY” key to determine your response. Write the number of your response in the column labeled “Frequency” located to the right of the item. Then, please indicate the intensity of this thought. Use the “INTENSITY” key to determine your response. Write the number that corresponds to your response in the column labeled “Intensity” located to the right of the current thought. FREQUENCY INTENSITY 1 = almost never 1 = not intense
2 = sometimes 2 = somewhat 3 = moderately often 3 = moderately
4 = often 4 = very 5 = almost always 5 = extremely
Frequency Intensity 1. thought about other people involved in the event _______ _______ 2. considered things related to the event _______ _______ 3. focused on your emotions _______ _______ 4. remembered the peculiarities of the event _______ _______ 5. recalled information about the event _______ _______ 6. replayed the event in your mind _______ _______ 7. thought about details of the event _______ _______ 8. thought about causes of the event _______ _______ 9. considered the consequences of the event _______ _______ 10. reflected on the event _______ _______

66
Event #2 In the following blank space, please write down one stressful life event that you experienced in the last 7 days. If you have not experienced a particularly stressful life event in the timeframe specified, please write down an event that was relatively more stressful than other events you have experienced in the indicated timeframe. ________________________________________________________________________ ________________________________________________________________________ How often have you experienced the stressful event, or something similar in the 7 days? PLEASE CIRCLE ONLY ONE ANSWER.
1 Time 2-4 Times 5-8 Times 9 or More Times How stressful was the event? PLEASE CIRCLE ONLY ONE ANSWER
Not Somewhat Moderately Very Extremely Stressful Stressful Stressful Stressful Stressful For items 1 - 30, please indicate how often you had each thought after experiencing the event specified above as “Event #2.” Use the “FREQUENCY” key to determine your response. Write the number of your response in the column labeled “Frequency” located to the right of the item. Then, please indicate the intensity of this thought. Use the “INTENSITY” key to determine your response. Write the number that corresponds to your response in the column labeled “Intensity” located to the right of the current thought. FREQUENCY INTENSITY 1 = almost never 1 = not intense
2 = sometimes 2 = somewhat 3 = moderately often 3 = moderately
4 = often 4 = very 5 = almost always 5 = extremely
Frequency Intensity 1. thought about other people involved in the event _______ _______ 2. considered things related to the event _______ _______ 3. focused on your emotions _______ _______ 4. remembered the peculiarities of the event _______ _______ 5. recalled information about the event _______ _______ 6. replayed the event in your mind _______ _______ 7. thought about details of the event _______ _______ 8. thought about causes of the event _______ _______ 9. considered the consequences of the event _______ _______ 10. reflected on the event _______ _______

67
Event #3 In the following blank space, please write down one stressful life event that you experienced in the last 6 months. If you have not experienced a particularly stressful life event in the timeframe specified, please write down an event that was relatively more stressful than other events you have experienced in the indicated timeframe. ________________________________________________________________________ ________________________________________________________________________ How often have you experienced the stressful event, or something similar in the last 6 months? PLEASE CIRCLE ONLY ONE ANSWER.
1 Time 2-4 Times 5-8 Times 9 or More Times How stressful was the event? PLEASE CIRCLE ONLY ONE ANSWER
Not Somewhat Moderately Very Extremely Stressful Stressful Stressful Stressful Stressful For items 1 - 30, please indicate how often you had each thought after experiencing the event specified above as “Event #3.” Use the “FREQUENCY” key to determine your response. Write the number of your response in the column labeled “Frequency” located to the right of the item. Then, please indicate the intensity of this thought. Use the “INTENSITY” key to determine your response. Write the number that corresponds to your response in the column labeled “Intensity” located to the right of the current thought. FREQUENCY INTENSITY 1 = almost never 1 = not intense
2 = sometimes 2 = somewhat 3 = moderately often 3 = moderately
4 = often 4 = very 5 = almost always 5 = extremely
Frequency Intensity 1. thought about other people involved in the event _______ _______ 2. considered things related to the event _______ _______ 3. focused on your emotions _______ _______ 4. remembered the peculiarities of the event _______ _______ 5. recalled information about the event _______ _______ 6. replayed the event in your mind _______ _______ 7. thought about details of the event _______ _______ 8. thought about causes of the event _______ _______ 9. considered the consequences of the event _______ _______ 10. reflected on the event _______ _______