rs. 350 rs. 425 pantaloon retail india...
TRANSCRIPT
1 | P a g e
Analysts’ Name
Bharat Chhoda [email protected] Prerna Jhunjhunwala [email protected] Jehangir Master [email protected]
Sales & EPS trend
02000400060008000
100001200014000
FY08 FY09 FY10E FY11E FY12E
0
5
10
15
20
25
Sales (Rs. Crore) (LHS) Diluted EPS (Rs.)
Stock Metrics
Bloomberg Code PF INReuters Code PART.BOFace Value (Rs) 2Promoter's Holding 49%Market Cap (Rs Cr) 665852 week H/L 371/105Sensex 16983
Average Volumes 182358 Comparative return metrics
3M 6M 12MPantaloon Retail 13.2 13.4 69.4Shoppers Stop 33.6 78.2 90Trent 52.8 61.5 223.6Titan 9.1 14.0 62.6Vishal Retail 3.4 -29.4 -22.9 Price Trend (Rs)
Target Price
Absolute Buy
0
100
200
300
400
Nov
-08
Jan-
09
Mar
-09
May
-09
Jul-0
9
Aug-
09
Oct-0
9
December 8, 2009 | Retail
Initiating Coverage
Pantaloon Retail India (PANRET)
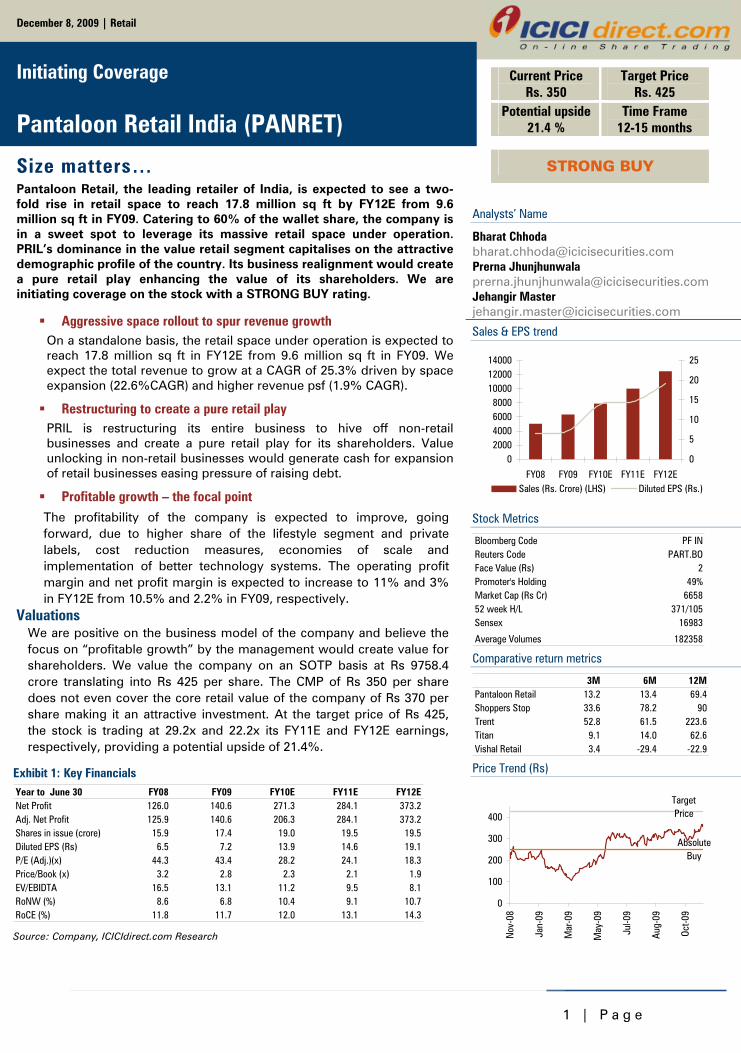
Size matters… Pantaloon Retail, the leading retailer of India, is expected to see a two-fold rise in retail space to reach 17.8 million sq ft by FY12E from 9.6 million sq ft in FY09. Catering to 60% of the wallet share, the company is in a sweet spot to leverage its massive retail space under operation. PRIL’s dominance in the value retail segment capitalises on the attractive demographic profile of the country. Its business realignment would create a pure retail play enhancing the value of its shareholders. We are initiating coverage on the stock with a STRONG BUY rating.
Aggressive space rollout to spur revenue growth On a standalone basis, the retail space under operation is expected to reach 17.8 million sq ft in FY12E from 9.6 million sq ft in FY09. We expect the total revenue to grow at a CAGR of 25.3% driven by space expansion (22.6%CAGR) and higher revenue psf (1.9% CAGR).
Restructuring to create a pure retail play PRIL is restructuring its entire business to hive off non-retail businesses and create a pure retail play for its shareholders. Value unlocking in non-retail businesses would generate cash for expansion of retail businesses easing pressure of raising debt.
Profitable growth – the focal point The profitability of the company is expected to improve, going forward, due to higher share of the lifestyle segment and private labels, cost reduction measures, economies of scale and implementation of better technology systems. The operating profit margin and net profit margin is expected to increase to 11% and 3% in FY12E from 10.5% and 2.2% in FY09, respectively.
Valuations We are positive on the business model of the company and believe the focus on “profitable growth” by the management would create value for shareholders. We value the company on an SOTP basis at Rs 9758.4 crore translating into Rs 425 per share. The CMP of Rs 350 per share does not even cover the core retail value of the company of Rs 370 per share making it an attractive investment. At the target price of Rs 425, the stock is trading at 29.2x and 22.2x its FY11E and FY12E earnings, respectively, providing a potential upside of 21.4%.
Current Price Rs. 350
Target Price Rs. 425
Potential upside 21.4 %
Time Frame 12-15 months
STRONG BUY
Exhibit 1: Key Financials Year to June 30 FY08 FY09 FY10E FY11E FY12ENet Profit 126.0 140.6 271.3 284.1 373.2Adj. Net Profit 125.9 140.6 206.3 284.1 373.2Shares in issue (crore) 15.9 17.4 19.0 19.5 19.5Diluted EPS (Rs) 6.5 7.2 13.9 14.6 19.1P/E (Adj.)(x) 44.3 43.4 28.2 24.1 18.3Price/Book (x) 3.2 2.8 2.3 2.1 1.9EV/EBIDTA 16.5 13.1 11.2 9.5 8.1RoNW (%) 8.6 6.8 10.4 9.1 10.7RoCE (%) 11.8 11.7 12.0 13.1 14.3 Source: Company, ICICIdirect.com Research
2 | P a g e
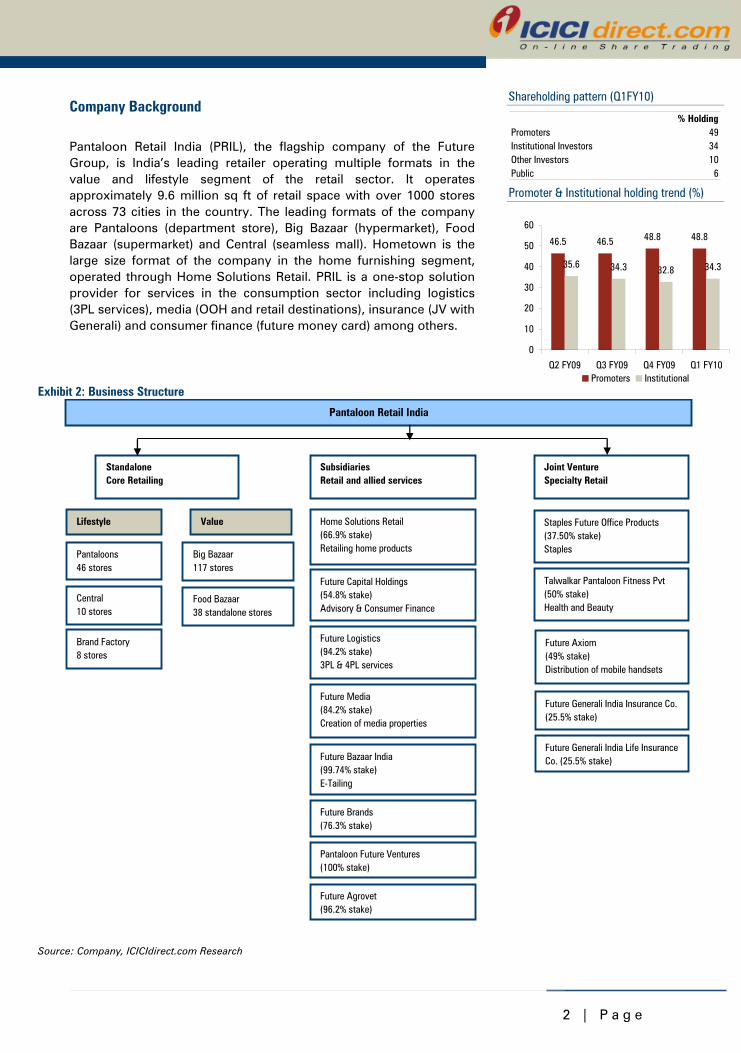
Company Background
Pantaloon Retail India (PRIL), the flagship company of the Future Group, is India’s leading retailer operating multiple formats in the value and lifestyle segment of the retail sector. It operates approximately 9.6 million sq ft of retail space with over 1000 stores across 73 cities in the country. The leading formats of the company are Pantaloons (department store), Big Bazaar (hypermarket), Food Bazaar (supermarket) and Central (seamless mall). Hometown is the large size format of the company in the home furnishing segment, operated through Home Solutions Retail. PRIL is a one-stop solution provider for services in the consumption sector including logistics (3PL services), media (OOH and retail destinations), insurance (JV with Generali) and consumer finance (future money card) among others.
Exhibit 2: Business Structure
Pantaloon Retail India
SubsidiariesRetail and allied services
StandaloneCore Retailing
Joint VentureSpecialty Retail
Lifestyle Value
Pantaloons46 stores
Central10 stores
Big Bazaar117 stores
Food Bazaar38 standalone stores
Brand Factory8 stores
Home Solutions Retail (66.9% stake)Retailing home products
Future Capital Holdings(54.8% stake)Advisory & Consumer Finance
Future Logistics(94.2% stake)3PL & 4PL services
Future Media(84.2% stake)Creation of media properties
Future Bazaar India(99.74% stake)E-Tailing
Future Generali India Insurance Co. (25.5% stake)
Staples Future Office Products(37.50% stake)Staples
Talwalkar Pantaloon Fitness Pvt(50% stake)Health and Beauty
Future Axiom(49% stake)Distribution of mobile handsets
Future Generali India Life Insurance Co. (25.5% stake)
Pantaloon Future Ventures(100% stake)
Future Agrovet(96.2% stake)
Future Brands(76.3% stake)
Source: Company, ICICIdirect.com Research
Shareholding pattern (Q1FY10)
% HoldingPromoters 49Institutional Investors 34Other Investors 10Public 6 Promoter & Institutional holding trend (%)
46.5 46.5 48.8 48.8
35.6 34.3 32.8 34.3
0
10
20
30
40
50
60
Q2 FY09 Q3 FY09 Q4 FY09 Q1 FY10Promoters Institutional
3 | P a g e
Investment Rationale
Aggressive expansion to fuel growth
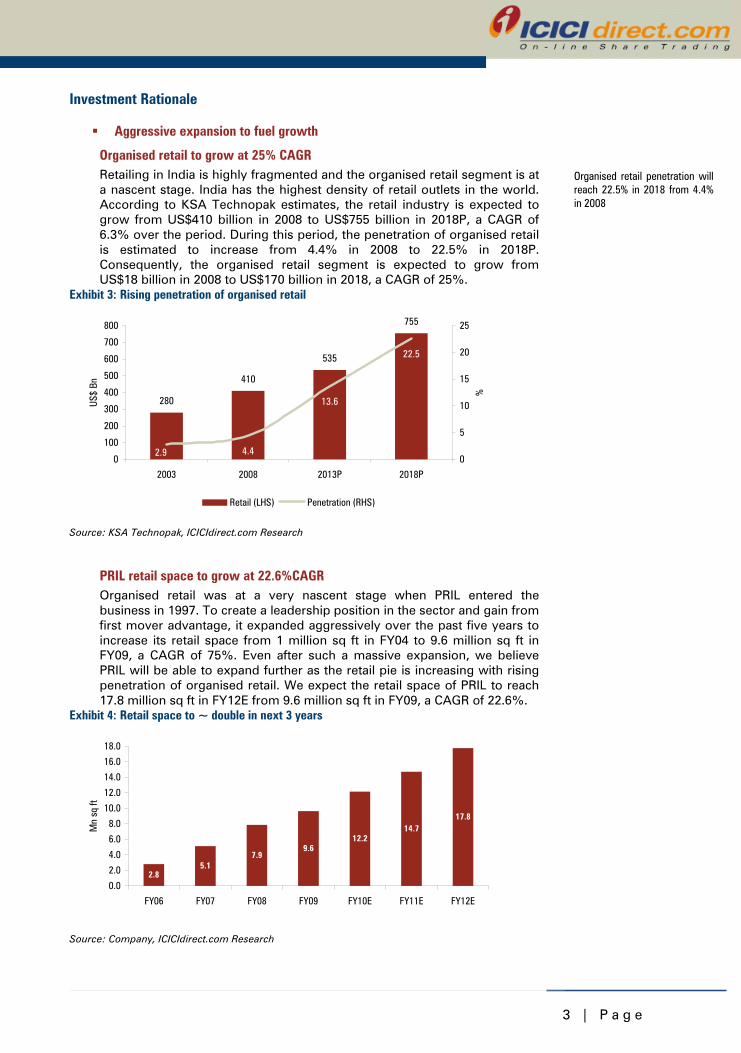
Organised retail to grow at 25% CAGR Retailing in India is highly fragmented and the organised retail segment is at a nascent stage. India has the highest density of retail outlets in the world. According to KSA Technopak estimates, the retail industry is expected to grow from US$410 billion in 2008 to US$755 billion in 2018P, a CAGR of 6.3% over the period. During this period, the penetration of organised retail is estimated to increase from 4.4% in 2008 to 22.5% in 2018P. Consequently, the organised retail segment is expected to grow from US$18 billion in 2008 to US$170 billion in 2018, a CAGR of 25%.
Exhibit 3: Rising penetration of organised retail
280
410
535
755
4.4
13.6
22.5
2.90
100
200
300
400
500
600
700
800
2003 2008 2013P 2018P
US$
Bn
0
5
10
15
20
25
%
Retail (LHS) Penetration (RHS)
Source: KSA Technopak, ICICIdirect.com Research
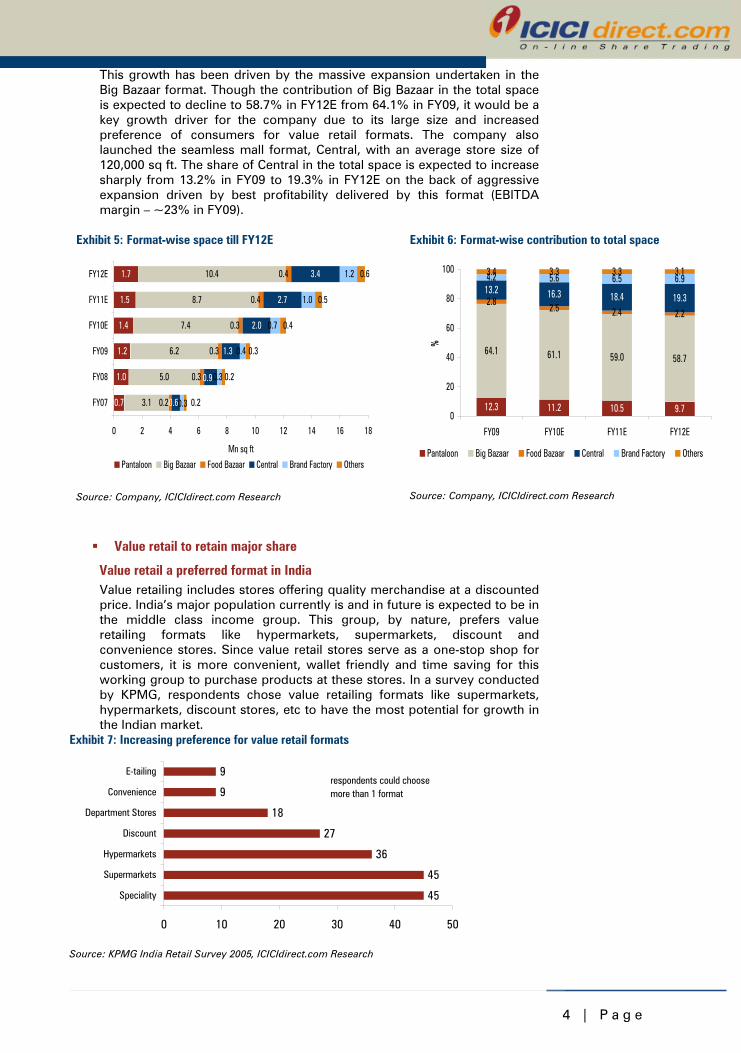
PRIL retail space to grow at 22.6%CAGR Organised retail was at a very nascent stage when PRIL entered the business in 1997. To create a leadership position in the sector and gain from first mover advantage, it expanded aggressively over the past five years to increase its retail space from 1 million sq ft in FY04 to 9.6 million sq ft in FY09, a CAGR of 75%. Even after such a massive expansion, we believe PRIL will be able to expand further as the retail pie is increasing with rising penetration of organised retail. We expect the retail space of PRIL to reach 17.8 million sq ft in FY12E from 9.6 million sq ft in FY09, a CAGR of 22.6%.
Exhibit 4: Retail space to ~ double in next 3 years
2.85.1
7.99.6
12.214.7
17.8
0.0
2.0
4.0
6.0
8.0
10.0
12.0
14.0
16.0
18.0
FY06 FY07 FY08 FY09 FY10E FY11E FY12E
Mn
sq ft
Source: Company, ICICIdirect.com Research
Organised retail penetration will reach 22.5% in 2018 from 4.4% in 2008
4 | P a g e
This growth has been driven by the massive expansion undertaken in the Big Bazaar format. Though the contribution of Big Bazaar in the total space is expected to decline to 58.7% in FY12E from 64.1% in FY09, it would be a key growth driver for the company due to its large size and increased preference of consumers for value retail formats. The company also launched the seamless mall format, Central, with an average store size of 120,000 sq ft. The share of Central in the total space is expected to increase sharply from 13.2% in FY09 to 19.3% in FY12E on the back of aggressive expansion driven by best profitability delivered by this format (EBITDA margin – ~23% in FY09).
Exhibit 5: Format-wise space till FY12E
0.7
1.0
1.2
1.4
1.5
1.7
3.1
5.0
6.2
7.4
8.7
10.4
0.2
0.3
0.3
0.3
0.4
0.4
2.0
2.7
3.4
0.7
1.0
1.2
0.2
0.3
0.4
0.5
0.6
1.3
0.9
0.6
0.4
0.3
0.3 0.2
0 2 4 6 8 10 12 14 16 18
FY07
FY08
FY09
FY10E
FY11E
FY12E
Mn sq ft
Pantaloon Big Bazaar Food Bazaar Central Brand Factory Others
Source: Company, ICICIdirect.com Research
Exhibit 6: Format-wise contribution to total space
12.3 11.2 10.5 9.7
64.1 61.1 59.0 58.7
2.82.5 2.4 2.2
13.2 16.3 18.4 19.3
4.2 5.6 6.5 6.93.4 3.3 3.3 3.1
0
20
40
60
80
100
FY09 FY10E FY11E FY12E%
Pantaloon Big Bazaar Food Bazaar Central Brand Factory Others
Source: Company, ICICIdirect.com Research
Value retail to retain major share
Value retail a preferred format in India Value retailing includes stores offering quality merchandise at a discounted price. India’s major population currently is and in future is expected to be in the middle class income group. This group, by nature, prefers value retailing formats like hypermarkets, supermarkets, discount and convenience stores. Since value retail stores serve as a one-stop shop for customers, it is more convenient, wallet friendly and time saving for this working group to purchase products at these stores. In a survey conducted by KPMG, respondents chose value retailing formats like supermarkets, hypermarkets, discount stores, etc to have the most potential for growth in the Indian market.
Exhibit 7: Increasing preference for value retail formats
45
45
36
27
18
9
9
0 10 20 30 40 50
Speciality
Supermarkets
Hypermarkets
Discount
Department Stores
Convenience
E-tailingrespondents could choose more than 1 format
Source: KPMG India Retail Survey 2005, ICICIdirect.com Research
5 | P a g e
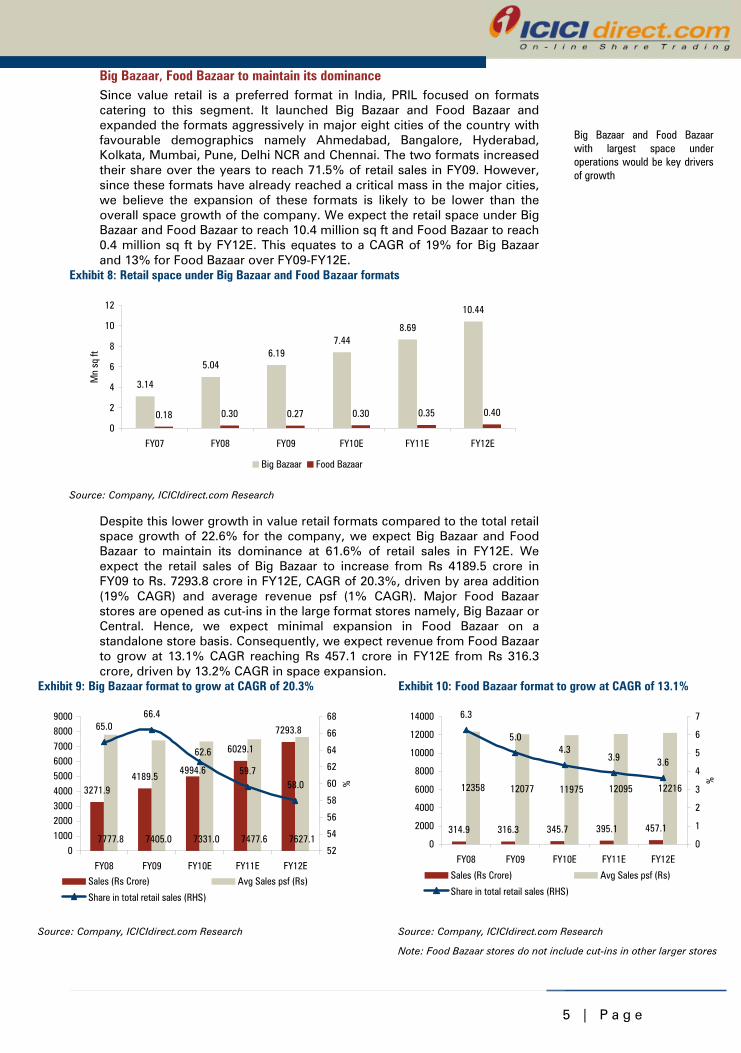
Big Bazaar, Food Bazaar to maintain its dominance Since value retail is a preferred format in India, PRIL focused on formats catering to this segment. It launched Big Bazaar and Food Bazaar and expanded the formats aggressively in major eight cities of the country with favourable demographics namely Ahmedabad, Bangalore, Hyderabad, Kolkata, Mumbai, Pune, Delhi NCR and Chennai. The two formats increased their share over the years to reach 71.5% of retail sales in FY09. However, since these formats have already reached a critical mass in the major cities, we believe the expansion of these formats is likely to be lower than the overall space growth of the company. We expect the retail space under Big Bazaar and Food Bazaar to reach 10.4 million sq ft and Food Bazaar to reach 0.4 million sq ft by FY12E. This equates to a CAGR of 19% for Big Bazaar and 13% for Food Bazaar over FY09-FY12E.
Exhibit 8: Retail space under Big Bazaar and Food Bazaar formats
3.14
5.046.19
7.448.69
10.44
0.18 0.30 0.27 0.30 0.35 0.40
0
2
4
6
8
10
12
FY07 FY08 FY09 FY10E FY11E FY12E
Mn
sq ft
Big Bazaar Food Bazaar
Source: Company, ICICIdirect.com Research
Despite this lower growth in value retail formats compared to the total retail space growth of 22.6% for the company, we expect Big Bazaar and Food Bazaar to maintain its dominance at 61.6% of retail sales in FY12E. We expect the retail sales of Big Bazaar to increase from Rs 4189.5 crore in FY09 to Rs. 7293.8 crore in FY12E, CAGR of 20.3%, driven by area addition (19% CAGR) and average revenue psf (1% CAGR). Major Food Bazaar stores are opened as cut-ins in the large format stores namely, Big Bazaar or Central. Hence, we expect minimal expansion in Food Bazaar on a standalone store basis. Consequently, we expect revenue from Food Bazaar to grow at 13.1% CAGR reaching Rs 457.1 crore in FY12E from Rs 316.3 crore, driven by 13.2% CAGR in space expansion.
Exhibit 9: Big Bazaar format to grow at CAGR of 20.3%
3271.94189.5
6029.1
7777.8 7405.0 7331.0 7477.6 7627.1
4994.6
7293.865.066.4
59.758.0
62.6
0100020003000400050006000700080009000
FY08 FY09 FY10E FY11E FY12E
52
54
56
58
60
62
64
66
68
%
Sales (Rs Crore) Avg Sales psf (Rs)
Share in total retail sales (RHS)
Source: Company, ICICIdirect.com Research
Exhibit 10: Food Bazaar format to grow at CAGR of 13.1%
314.9 316.3 345.7 395.1 457.1
12358 12077 11975 12095 12216
6.3
5.04.3
3.9 3.6
0
2000
4000
6000
8000
10000
12000
14000
FY08 FY09 FY10E FY11E FY12E
0
1
2
3
4
5
6
7%
Sales (Rs Crore) Avg Sales psf (Rs)
Share in total retail sales (RHS)
Source: Company, ICICIdirect.com Research
Note: Food Bazaar stores do not include cut-ins in other larger stores
Big Bazaar and Food Bazaar with largest space under operations would be key drivers of growth
6 | P a g e
Increasing focus on lifestyle stores
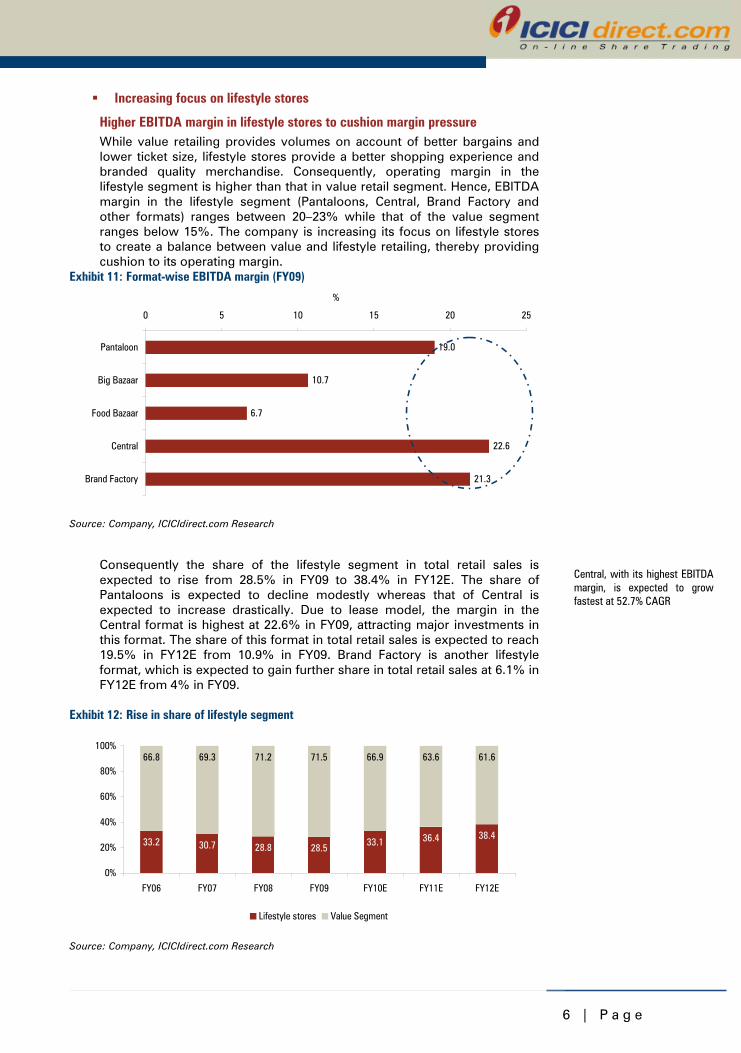
Higher EBITDA margin in lifestyle stores to cushion margin pressure While value retailing provides volumes on account of better bargains and lower ticket size, lifestyle stores provide a better shopping experience and branded quality merchandise. Consequently, operating margin in the lifestyle segment is higher than that in value retail segment. Hence, EBITDA margin in the lifestyle segment (Pantaloons, Central, Brand Factory and other formats) ranges between 20–23% while that of the value segment ranges below 15%. The company is increasing its focus on lifestyle stores to create a balance between value and lifestyle retailing, thereby providing cushion to its operating margin.
Exhibit 11: Format-wise EBITDA margin (FY09)
19.0
10.7
6.7
22.6
21.3
0 5 10 15 20 25
Pantaloon
Big Bazaar
Food Bazaar
Central
Brand Factory
%
Source: Company, ICICIdirect.com Research
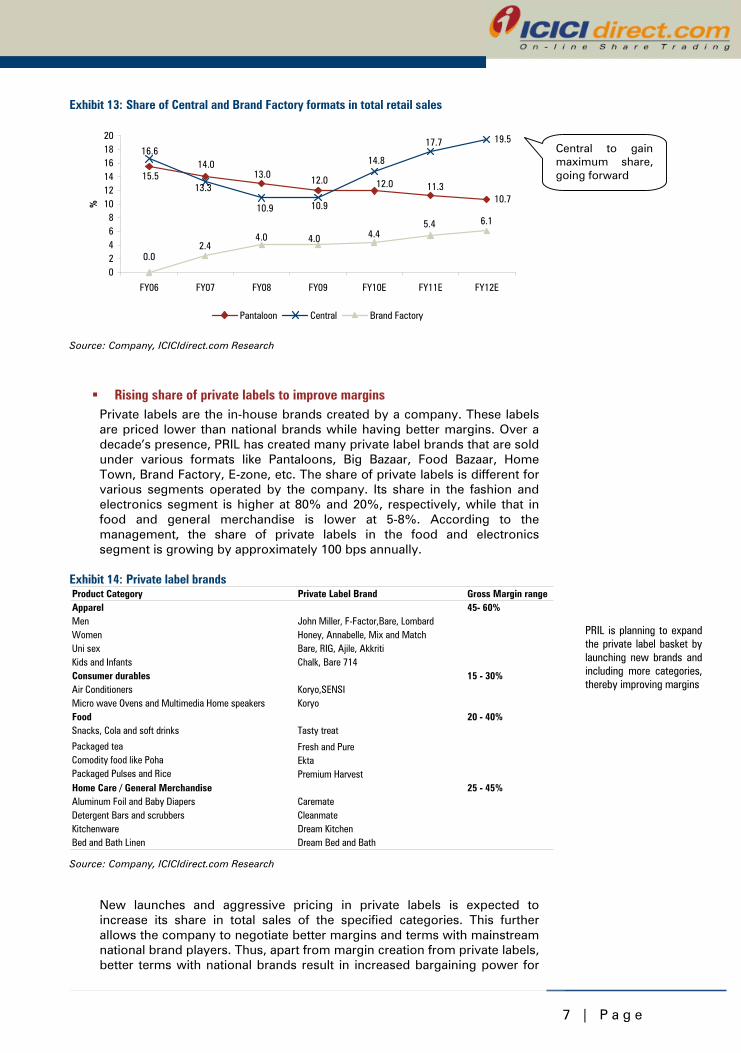
Consequently the share of the lifestyle segment in total retail sales is expected to rise from 28.5% in FY09 to 38.4% in FY12E. The share of Pantaloons is expected to decline modestly whereas that of Central is expected to increase drastically. Due to lease model, the margin in the Central format is highest at 22.6% in FY09, attracting major investments in this format. The share of this format in total retail sales is expected to reach 19.5% in FY12E from 10.9% in FY09. Brand Factory is another lifestyle format, which is expected to gain further share in total retail sales at 6.1% in FY12E from 4% in FY09.
Exhibit 12: Rise in share of lifestyle segment
33.2 30.7 28.8 28.5 33.1 36.4 38.4
66.8 69.3 71.2 71.5 66.9 63.6 61.6
0%
20%
40%
60%
80%
100%
FY06 FY07 FY08 FY09 FY10E FY11E FY12E
Lifestyle stores Value Segment
Source: Company, ICICIdirect.com Research
Central, with its highest EBITDA margin, is expected to grow fastest at 52.7% CAGR
7 | P a g e
Exhibit 13: Share of Central and Brand Factory formats in total retail sales
10.7
19.5
0.0
11.312.012.013.015.514.0
17.7
10.9
13.3
10.9
14.816.6
2.44.0 4.0 4.4
5.4 6.1
02468
101214161820
FY06 FY07 FY08 FY09 FY10E FY11E FY12E
%
Pantaloon Central Brand Factory
Source: Company, ICICIdirect.com Research
Rising share of private labels to improve margins Private labels are the in-house brands created by a company. These labels are priced lower than national brands while having better margins. Over a decade’s presence, PRIL has created many private label brands that are sold under various formats like Pantaloons, Big Bazaar, Food Bazaar, Home Town, Brand Factory, E-zone, etc. The share of private labels is different for various segments operated by the company. Its share in the fashion and electronics segment is higher at 80% and 20%, respectively, while that in food and general merchandise is lower at 5-8%. According to the management, the share of private labels in the food and electronics segment is growing by approximately 100 bps annually.
Exhibit 14: Private label brands Product Category Private Label Brand Gross Margin rangeApparel 45- 60%Men John Miller, F-Factor,Bare, Lombard Women Honey, Annabelle, Mix and MatchUni sex Bare, RIG, Ajile, Akkriti Kids and Infants Chalk, Bare 714Consumer durables 15 - 30%Air Conditioners Koryo,SENSIMicro wave Ovens and Multimedia Home speakers KoryoFood 20 - 40%Snacks, Cola and soft drinks Tasty treat g gPackaged tea Fresh and Pure Comodity food like Poha EktaPackaged Pulses and Rice Premium HarvestHome Care / General Merchandise 25 - 45%Aluminum Foil and Baby Diapers Caremate Detergent Bars and scrubbers Cleanmate Kitchenware Dream Kitchen Bed and Bath Linen Dream Bed and Bath Source: Company, ICICIdirect.com Research
New launches and aggressive pricing in private labels is expected to increase its share in total sales of the specified categories. This further allows the company to negotiate better margins and terms with mainstream national brand players. Thus, apart from margin creation from private labels, better terms with national brands result in increased bargaining power for
Central to gain maximum share, going forward
PRIL is planning to expand the private label basket by launching new brands and including more categories, thereby improving margins
8 | P a g e
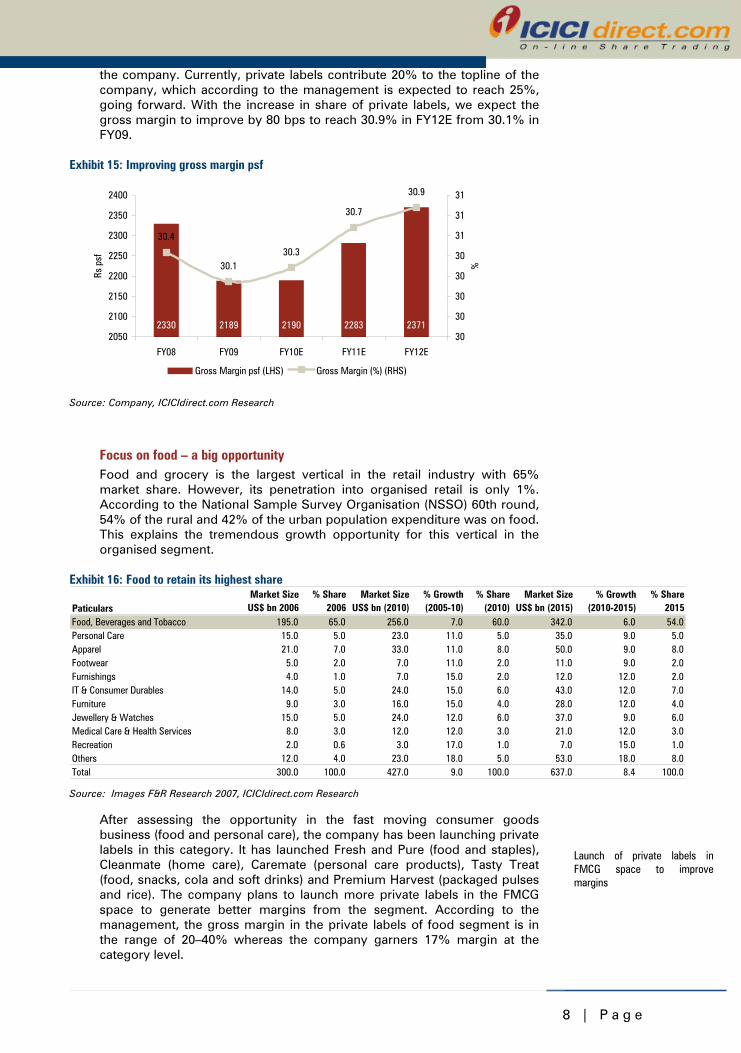
the company. Currently, private labels contribute 20% to the topline of the company, which according to the management is expected to reach 25%, going forward. With the increase in share of private labels, we expect the gross margin to improve by 80 bps to reach 30.9% in FY12E from 30.1% in FY09.
Exhibit 15: Improving gross margin psf
2330 2189 2190 2283 2371
30.130.3
30.7
30.9
30.4
2050
2100
2150
2200
2250
2300
2350
2400
FY08 FY09 FY10E FY11E FY12E
Rs p
sf
30
30
30
30
30
31
31
31
%
Gross Margin psf (LHS) Gross Margin (%) (RHS)
Source: Company, ICICIdirect.com Research
Focus on food – a big opportunity Food and grocery is the largest vertical in the retail industry with 65% market share. However, its penetration into organised retail is only 1%. According to the National Sample Survey Organisation (NSSO) 60th round, 54% of the rural and 42% of the urban population expenditure was on food. This explains the tremendous growth opportunity for this vertical in the organised segment.
Exhibit 16: Food to retain its highest share
PaticularsMarket Size
US$ bn 2006% Share
2006Market Size
US$ bn (2010)% Growth(2005-10)
% Share(2010)
Market SizeUS$ bn (2015)
% Growth(2010-2015)
% Share2015
Food, Beverages and Tobacco 195.0 65.0 256.0 7.0 60.0 342.0 6.0 54.0Personal Care 15.0 5.0 23.0 11.0 5.0 35.0 9.0 5.0Apparel 21.0 7.0 33.0 11.0 8.0 50.0 9.0 8.0Footwear 5.0 2.0 7.0 11.0 2.0 11.0 9.0 2.0Furnishings 4.0 1.0 7.0 15.0 2.0 12.0 12.0 2.0IT & Consumer Durables 14.0 5.0 24.0 15.0 6.0 43.0 12.0 7.0Furniture 9.0 3.0 16.0 15.0 4.0 28.0 12.0 4.0Jewellery & Watches 15.0 5.0 24.0 12.0 6.0 37.0 9.0 6.0Medical Care & Health Services 8.0 3.0 12.0 12.0 3.0 21.0 12.0 3.0Recreation 2.0 0.6 3.0 17.0 1.0 7.0 15.0 1.0Others 12.0 4.0 23.0 18.0 5.0 53.0 18.0 8.0Total 300.0 100.0 427.0 9.0 100.0 637.0 8.4 100.0 Source: Images F&R Research 2007, ICICIdirect.com Research
After assessing the opportunity in the fast moving consumer goods business (food and personal care), the company has been launching private labels in this category. It has launched Fresh and Pure (food and staples), Cleanmate (home care), Caremate (personal care products), Tasty Treat (food, snacks, cola and soft drinks) and Premium Harvest (packaged pulses and rice). The company plans to launch more private labels in the FMCG space to generate better margins from the segment. According to the management, the gross margin in the private labels of food segment is in the range of 20–40% whereas the company garners 17% margin at the category level.
Launch of private labels in FMCG space to improve margins
9 | P a g e
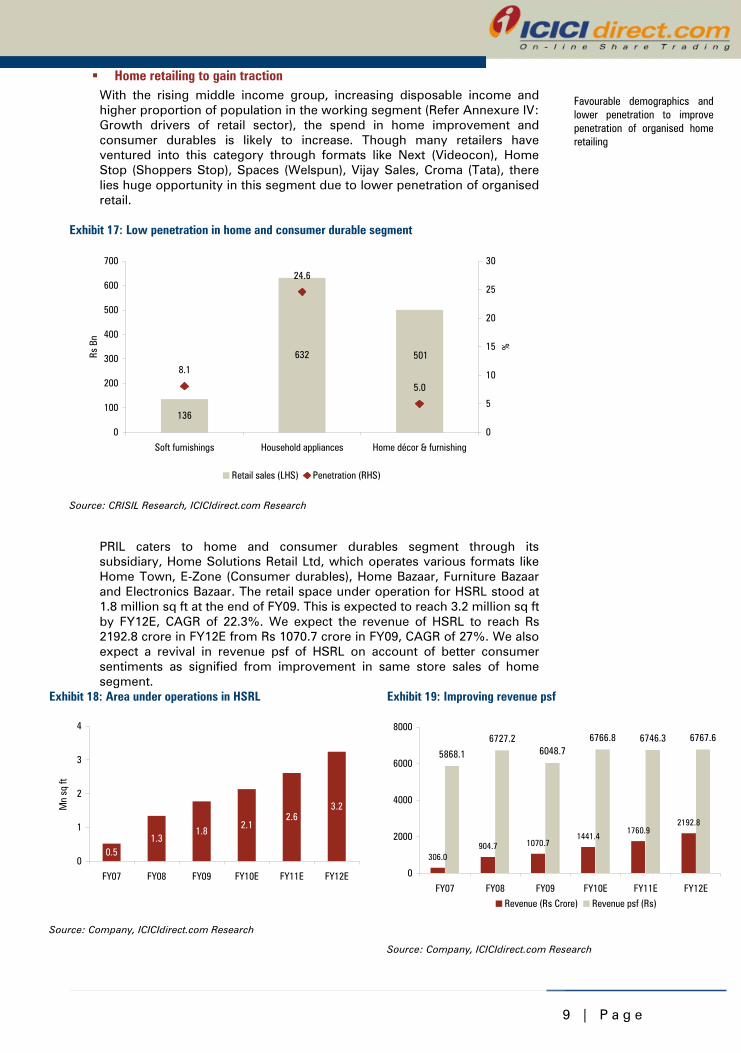
Home retailing to gain traction With the rising middle income group, increasing disposable income and higher proportion of population in the working segment (Refer Annexure IV: Growth drivers of retail sector), the spend in home improvement and consumer durables is likely to increase. Though many retailers have ventured into this category through formats like Next (Videocon), Home Stop (Shoppers Stop), Spaces (Welspun), Vijay Sales, Croma (Tata), there lies huge opportunity in this segment due to lower penetration of organised retail.
Exhibit 17: Low penetration in home and consumer durable segment
632
136
5018.1
24.6
5.0
0
100
200
300
400
500
600
700
Soft furnishings Household appliances Home décor & furnishing
Rs B
n
0
5
10
15
20
25
30
%
Retail sales (LHS) Penetration (RHS)
Source: CRISIL Research, ICICIdirect.com Research
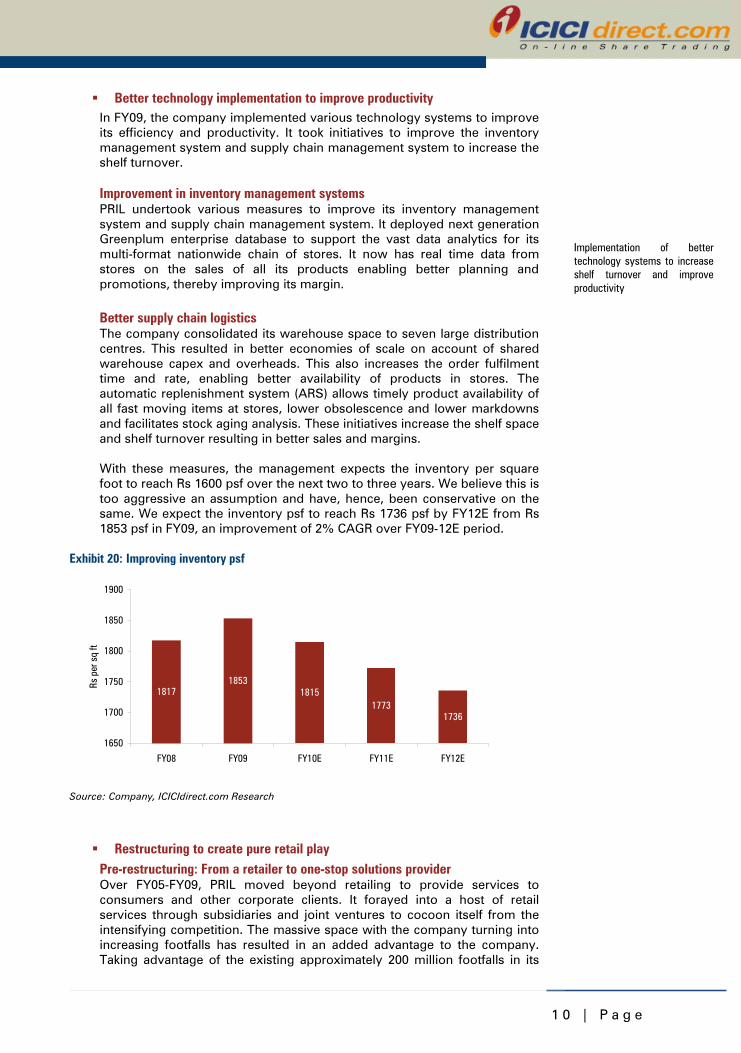
PRIL caters to home and consumer durables segment through its subsidiary, Home Solutions Retail Ltd, which operates various formats like Home Town, E-Zone (Consumer durables), Home Bazaar, Furniture Bazaar and Electronics Bazaar. The retail space under operation for HSRL stood at 1.8 million sq ft at the end of FY09. This is expected to reach 3.2 million sq ft by FY12E, CAGR of 22.3%. We expect the revenue of HSRL to reach Rs 2192.8 crore in FY12E from Rs 1070.7 crore in FY09, CAGR of 27%. We also expect a revival in revenue psf of HSRL on account of better consumer sentiments as signified from improvement in same store sales of home segment.
Exhibit 18: Area under operations in HSRL
0.51.3
1.82.1
2.63.2
0
1
2
3
4
FY07 FY08 FY09 FY10E FY11E FY12E
Mn
sq ft
Source: Company, ICICIdirect.com Research
Exhibit 19: Improving revenue psf
306.0904.7 1070.7
1441.41760.9
2192.8
5868.1
6727.26048.7
6766.8 6746.3 6767.6
0
2000
4000
6000
8000
FY07 FY08 FY09 FY10E FY11E FY12E
Revenue (Rs Crore) Revenue psf (Rs)
Source: Company, ICICIdirect.com Research
Favourable demographics and lower penetration to improve penetration of organised home retailing
1 0 | P a g e
Better technology implementation to improve productivity In FY09, the company implemented various technology systems to improve its efficiency and productivity. It took initiatives to improve the inventory management system and supply chain management system to increase the shelf turnover. Improvement in inventory management systems PRIL undertook various measures to improve its inventory management system and supply chain management system. It deployed next generation Greenplum enterprise database to support the vast data analytics for its multi-format nationwide chain of stores. It now has real time data from stores on the sales of all its products enabling better planning and promotions, thereby improving its margin.
Better supply chain logistics The company consolidated its warehouse space to seven large distribution centres. This resulted in better economies of scale on account of shared warehouse capex and overheads. This also increases the order fulfilment time and rate, enabling better availability of products in stores. The automatic replenishment system (ARS) allows timely product availability of all fast moving items at stores, lower obsolescence and lower markdowns and facilitates stock aging analysis. These initiatives increase the shelf space and shelf turnover resulting in better sales and margins. With these measures, the management expects the inventory per square foot to reach Rs 1600 psf over the next two to three years. We believe this is too aggressive an assumption and have, hence, been conservative on the same. We expect the inventory psf to reach Rs 1736 psf by FY12E from Rs 1853 psf in FY09, an improvement of 2% CAGR over FY09-12E period.
Exhibit 20: Improving inventory psf
18171853
18151773
1736
1650
1700
1750
1800
1850
1900
FY08 FY09 FY10E FY11E FY12E
Rs p
er s
q ft
Source: Company, ICICIdirect.com Research
Restructuring to create pure retail play Pre-restructuring: From a retailer to one-stop solutions provider Over FY05-FY09, PRIL moved beyond retailing to provide services to consumers and other corporate clients. It forayed into a host of retail services through subsidiaries and joint ventures to cocoon itself from the intensifying competition. The massive space with the company turning into increasing footfalls has resulted in an added advantage to the company. Taking advantage of the existing approximately 200 million footfalls in its
Implementation of better technology systems to increase shelf turnover and improve productivity
1 1 | P a g e
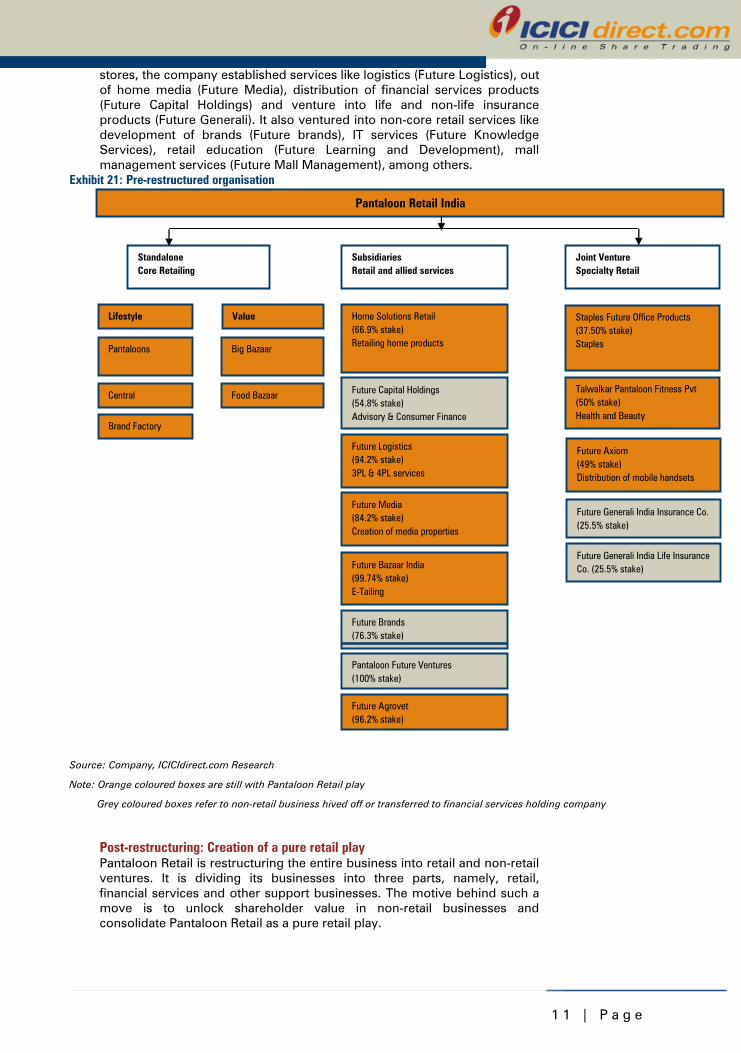
stores, the company established services like logistics (Future Logistics), out of home media (Future Media), distribution of financial services products (Future Capital Holdings) and venture into life and non-life insurance products (Future Generali). It also ventured into non-core retail services like development of brands (Future brands), IT services (Future Knowledge Services), retail education (Future Learning and Development), mall management services (Future Mall Management), among others.
Exhibit 21: Pre-restructured organisation
Pantaloon Retail India
SubsidiariesRetail and allied services
StandaloneCore Retailing
Joint VentureSpecialty Retail
Lifestyle Value
Pantaloons
Central
Big Bazaar
Food Bazaar
Brand Factory
Home Solutions Retail (66.9% stake)Retailing home products
Future Capital Holdings(54.8% stake)Advisory & Consumer Finance
Future Logistics(94.2% stake)3PL & 4PL services
Future Media(84.2% stake)Creation of media properties
Future Bazaar India(99.74% stake)E-Tailing
Future Brands(76.3% stake)
Future Generali India Insurance Co. (25.5% stake)
Staples Future Office Products(37.50% stake)Staples
Talwalkar Pantaloon Fitness Pvt(50% stake)Health and Beauty
Future Axiom(49% stake)Distribution of mobile handsets
Future Generali India Life Insurance Co. (25.5% stake)
Pantaloon Future Ventures(100% stake)
Future Agrovet(96.2% stake)
Source: Company, ICICIdirect.com Research
Note: Orange coloured boxes are still with Pantaloon Retail play
Grey coloured boxes refer to non-retail business hived off or transferred to financial services holding company
Post-restructuring: Creation of a pure retail play Pantaloon Retail is restructuring the entire business into retail and non-retail ventures. It is dividing its businesses into three parts, namely, retail, financial services and other support businesses. The motive behind such a move is to unlock shareholder value in non-retail businesses and consolidate Pantaloon Retail as a pure retail play.

1 2 | P a g e
Exhibit 22: Post restructured organisation
PANTALOON RETAIL INDIA
Pure Retail Play moicnjiohjinnnnnnnnnnnnnn
mmmmmmmmmmmmmmmmNon Retail Business
Financial Services
Hived off
Direct participation by PRILshareholders
Listing
Already Sold - Future Brands - Future Knowledge Services - Futre Learning and Development
Potential to hive off - Future Mall Management - CIG Infrastructure
-Future Capital Holdings-Future Generali India Insurance-Future Generali India Life Insurance-Pantaloon Future Ventures
Brick and Mortar formats like Central, Pantaloons, Brand Factory, other smaller formats (incl. JV)
………Standalone
Subsidiaries
-Home Solutions Retail-Future Logistics-Future Media-Futurebazaar India
Big Bazaar and Food Bazaar to be hived off as a wholly owned subsidiary
Source: Company, ICICIdirect.com Research
Consequently, the company is planning to undergo the following restructuring process:
• It is planning to unlock value and consolidate its investments in the financial services business of the company, which includes holdings in Future Capital Holdings Ltd and in the insurance joint venture companies. Pantaloon Future Ventures is also expected to be classified under financial services by the company. PRIL plans to create a holding company for the financial services business and would hold a 26% stake in the holding company. The remaining 74% stake is expected to be distributed in the proportion of current shareholding pattern
• It plans to transfer its investments in Future Brands and its assets held by non-retail businesses held through its wholly-owned subsidiaries, namely, Future Knowledge Services and Future Learning and Development to PFH Entertainment Ltd (a promoter company) for a total value of Rs 190 crore. We have taken the profit of Rs 100 crore resulting from this transaction in our estimates as extraordinary income. The company has a few other subsidiaries like Future Mall Management and CIG Infrastructure, where the potential for further value unlocking lies.
• It also plans to hive-off its value retail business, which includes Big Bazaar, Food Bazaar and other related formats, into a wholly-owned subsidiary.
1 3 | P a g e
Pantaloon Retail holds a number of subsidiaries (Refer Annexure for subsidiary details). The restructuring process is progressing in full swing and, as a result, there is little clarity on the movement of various subsidiaries within the group. We await further clarity from the management on the detailed restructuring process and the restructured organisation. However, as the restructuring process is on a step by step basis, things will be captured in our estimates on formal announcements by the company.
Capex funding requirement eases We expect a space addition of 8.1 million sq ft over FY10-12E. This addition would entail an additional capex requirement of Rs 4052 crore including store capex and working capital requirement. We assume store capex requirement at Rs 2800 per sq ft and working capital requirement of Rs 2250 per sq ft for the expected expansion. For part-funding the capex, the company expanded its equity by 9.1% to raise Rs 500 crore via qualified institutional placement (QIP). With the sale of non-retail businesses, it harvested another Rs 190 crore for capex requirements. Hence, a total amount of Rs 690 crore has been raised for capex funding. Consequently, the additional debt funding requirement would reduce to some extent. We expect the company to raise additional Rs 1600 crore via debt and the remaining requirement to be fulfilled by the balance amount of warrant payment and internal accruals.
QIP placement of Rs 500 crore and sale of subsidiaries for Rs 190 crore have eased the funding requirement of the company
1 4 | P a g e
Risks and Concerns
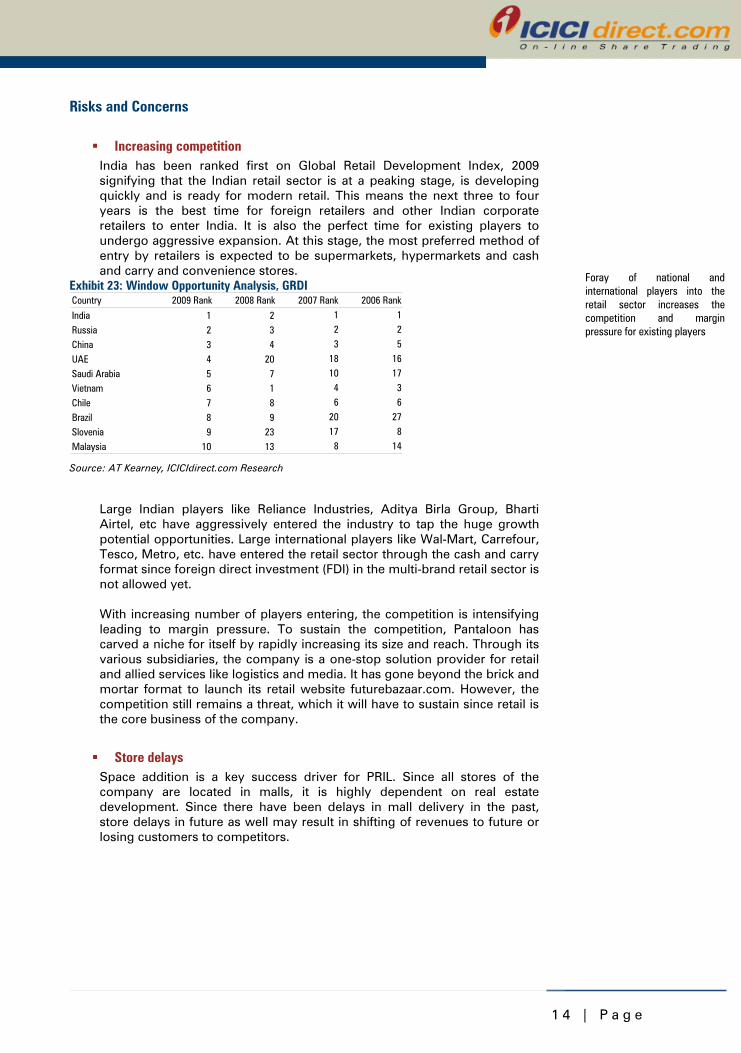
Increasing competition India has been ranked first on Global Retail Development Index, 2009 signifying that the Indian retail sector is at a peaking stage, is developing quickly and is ready for modern retail. This means the next three to four years is the best time for foreign retailers and other Indian corporate retailers to enter India. It is also the perfect time for existing players to undergo aggressive expansion. At this stage, the most preferred method of entry by retailers is expected to be supermarkets, hypermarkets and cash and carry and convenience stores.
Exhibit 23: Window Opportunity Analysis, GRDI Country 2009 Rank 2008 Rank 2007 Rank 2006 Rank
India 1 2 1 1
Russia 2 3 2 2
China 3 4 3 5
UAE 4 20 18 16
Saudi Arabia 5 7 10 17
Vietnam 6 1 4 3
Chile 7 8 6 6
Brazil 8 9 20 27
Slovenia 9 23 17 8
Malaysia 10 13 8 14 Source: AT Kearney, ICICIdirect.com Research
Large Indian players like Reliance Industries, Aditya Birla Group, Bharti Airtel, etc have aggressively entered the industry to tap the huge growth potential opportunities. Large international players like Wal-Mart, Carrefour, Tesco, Metro, etc. have entered the retail sector through the cash and carry format since foreign direct investment (FDI) in the multi-brand retail sector is not allowed yet. With increasing number of players entering, the competition is intensifying leading to margin pressure. To sustain the competition, Pantaloon has carved a niche for itself by rapidly increasing its size and reach. Through its various subsidiaries, the company is a one-stop solution provider for retail and allied services like logistics and media. It has gone beyond the brick and mortar format to launch its retail website futurebazaar.com. However, the competition still remains a threat, which it will have to sustain since retail is the core business of the company.
Store delays Space addition is a key success driver for PRIL. Since all stores of the company are located in malls, it is highly dependent on real estate development. Since there have been delays in mall delivery in the past, store delays in future as well may result in shifting of revenues to future or losing customers to competitors.
Foray of national and international players into the retail sector increases the competition and margin pressure for existing players
1 5 | P a g e
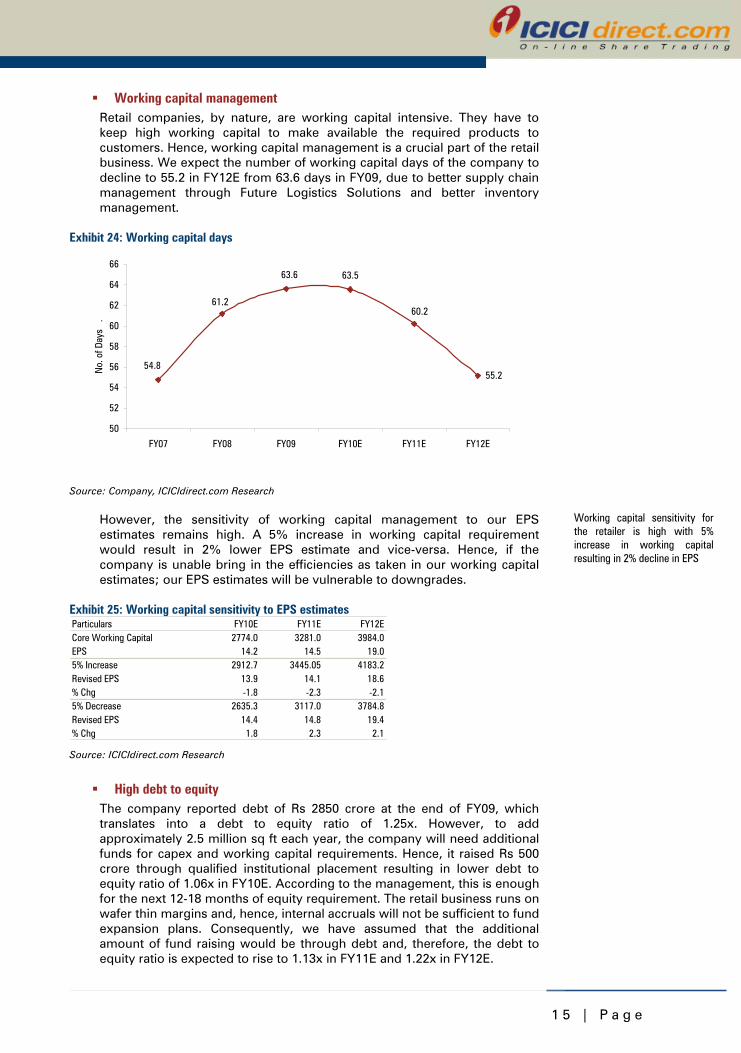
Working capital management Retail companies, by nature, are working capital intensive. They have to keep high working capital to make available the required products to customers. Hence, working capital management is a crucial part of the retail business. We expect the number of working capital days of the company to decline to 55.2 in FY12E from 63.6 days in FY09, due to better supply chain management through Future Logistics Solutions and better inventory management.
Exhibit 24: Working capital days
55.2
60.2
54.8
61.2
63.6 63.5
50
52
54
56
58
60
62
64
66
FY07 FY08 FY09 FY10E FY11E FY12E
No.
of D
ays
.
Source: Company, ICICIdirect.com Research However, the sensitivity of working capital management to our EPS estimates remains high. A 5% increase in working capital requirement would result in 2% lower EPS estimate and vice-versa. Hence, if the company is unable bring in the efficiencies as taken in our working capital estimates; our EPS estimates will be vulnerable to downgrades.
Exhibit 25: Working capital sensitivity to EPS estimates Particulars FY10E FY11E FY12ECore Working Capital 2774.0 3281.0 3984.0EPS 14.2 14.5 19.05% Increase 2912.7 3445.05 4183.2Revised EPS 13.9 14.1 18.6% Chg -1.8 -2.3 -2.15% Decrease 2635.3 3117.0 3784.8Revised EPS 14.4 14.8 19.4% Chg 1.8 2.3 2.1 Source: ICICIdirect.com Research
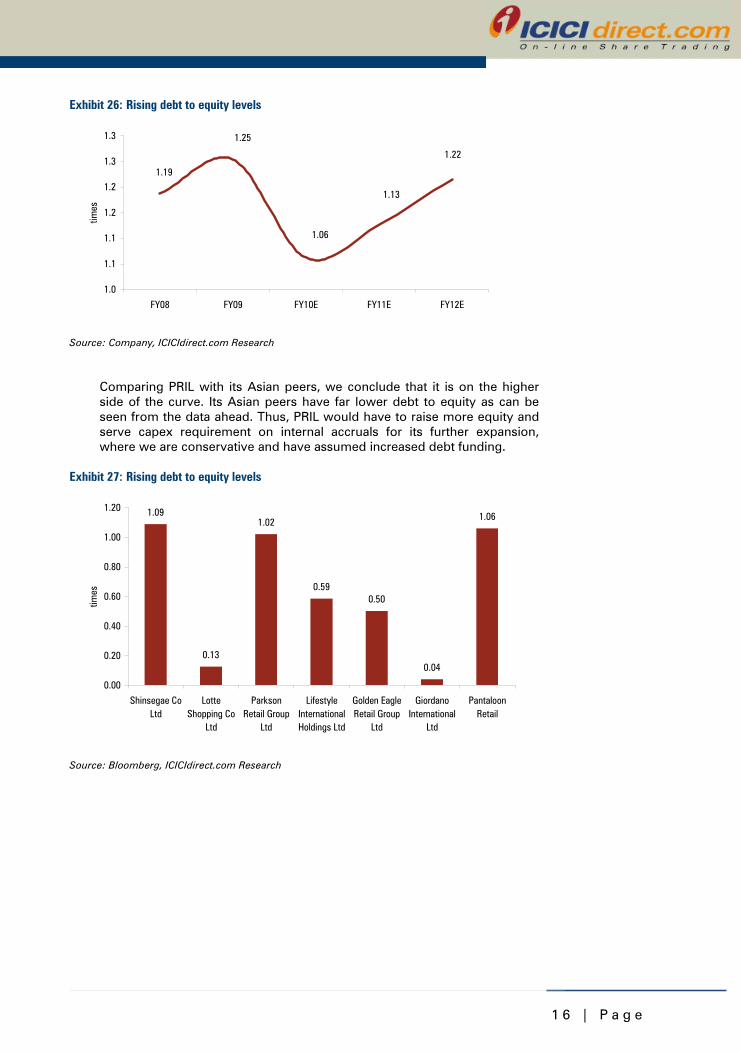
High debt to equity The company reported debt of Rs 2850 crore at the end of FY09, which translates into a debt to equity ratio of 1.25x. However, to add approximately 2.5 million sq ft each year, the company will need additional funds for capex and working capital requirements. Hence, it raised Rs 500 crore through qualified institutional placement resulting in lower debt to equity ratio of 1.06x in FY10E. According to the management, this is enough for the next 12-18 months of equity requirement. The retail business runs on wafer thin margins and, hence, internal accruals will not be sufficient to fund expansion plans. Consequently, we have assumed that the additional amount of fund raising would be through debt and, therefore, the debt to equity ratio is expected to rise to 1.13x in FY11E and 1.22x in FY12E.
Working capital sensitivity for the retailer is high with 5% increase in working capital resulting in 2% decline in EPS
1 6 | P a g e
Exhibit 26: Rising debt to equity levels
1.19
1.22
1.13
1.06
1.25
1.0
1.1
1.1
1.2
1.2
1.3
1.3
FY08 FY09 FY10E FY11E FY12E
times
Source: Company, ICICIdirect.com Research
Comparing PRIL with its Asian peers, we conclude that it is on the higher side of the curve. Its Asian peers have far lower debt to equity as can be seen from the data ahead. Thus, PRIL would have to raise more equity and serve capex requirement on internal accruals for its further expansion, where we are conservative and have assumed increased debt funding.
Exhibit 27: Rising debt to equity levels
1.09
0.13
1.02
0.590.50
0.04
1.06
0.00
0.20
0.40
0.60
0.80
1.00
1.20
Shinsegae CoLtd
LotteShopping Co
Ltd
ParksonRetail Group
Ltd
LifestyleInternationalHoldings Ltd
Golden EagleRetail Group
Ltd
GiordanoInternational
Ltd
PantaloonRetail
times
Source: Bloomberg, ICICIdirect.com Research
1 7 | P a g e
Financials
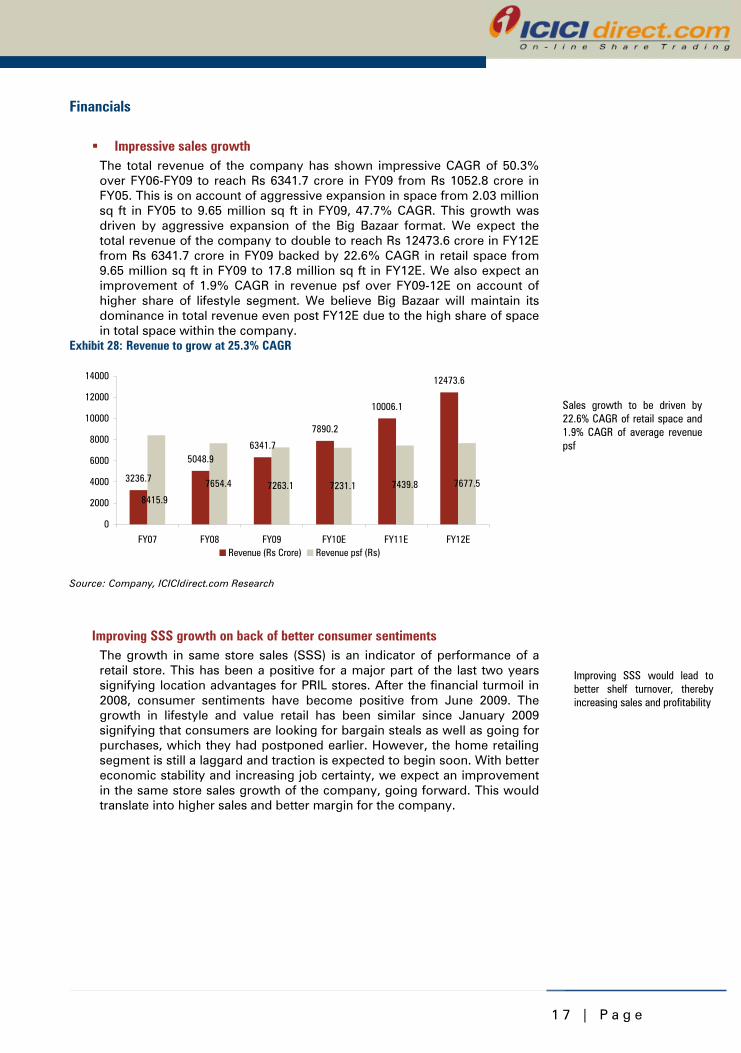
Impressive sales growth The total revenue of the company has shown impressive CAGR of 50.3% over FY06-FY09 to reach Rs 6341.7 crore in FY09 from Rs 1052.8 crore in FY05. This is on account of aggressive expansion in space from 2.03 million sq ft in FY05 to 9.65 million sq ft in FY09, 47.7% CAGR. This growth was driven by aggressive expansion of the Big Bazaar format. We expect the total revenue of the company to double to reach Rs 12473.6 crore in FY12E from Rs 6341.7 crore in FY09 backed by 22.6% CAGR in retail space from 9.65 million sq ft in FY09 to 17.8 million sq ft in FY12E. We also expect an improvement of 1.9% CAGR in revenue psf over FY09-12E on account of higher share of lifestyle segment. We believe Big Bazaar will maintain its dominance in total revenue even post FY12E due to the high share of space in total space within the company.
Exhibit 28: Revenue to grow at 25.3% CAGR
3236.7
5048.96341.7
7890.2
10006.1
12473.6
7654.4 7263.1 7231.1 7439.8 7677.5
8415.9
0
2000
4000
6000
8000
10000
12000
14000
FY07 FY08 FY09 FY10E FY11E FY12ERevenue (Rs Crore) Revenue psf (Rs)
Source: Company, ICICIdirect.com Research
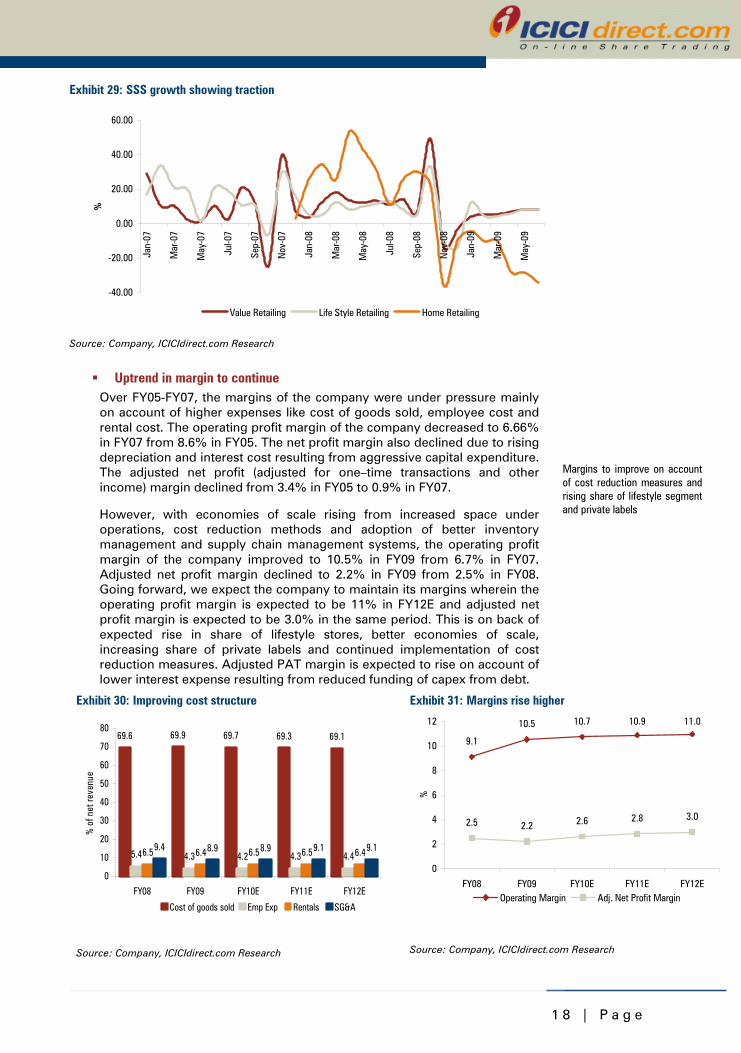
Improving SSS growth on back of better consumer sentiments The growth in same store sales (SSS) is an indicator of performance of a retail store. This has been a positive for a major part of the last two years signifying location advantages for PRIL stores. After the financial turmoil in 2008, consumer sentiments have become positive from June 2009. The growth in lifestyle and value retail has been similar since January 2009 signifying that consumers are looking for bargain steals as well as going for purchases, which they had postponed earlier. However, the home retailing segment is still a laggard and traction is expected to begin soon. With better economic stability and increasing job certainty, we expect an improvement in the same store sales growth of the company, going forward. This would translate into higher sales and better margin for the company.
Improving SSS would lead to better shelf turnover, thereby increasing sales and profitability
Sales growth to be driven by 22.6% CAGR of retail space and 1.9% CAGR of average revenue psf
1 8 | P a g e
Exhibit 29: SSS growth showing traction
-40.00
-20.00
0.00
20.00
40.00
60.00
Jan-
07
Mar
-07
May
-07
Jul-0
7
Sep-
07
Nov
-07
Jan-
08
Mar
-08
May
-08
Jul-0
8
Sep-
08
Nov
-08
Jan-
09
Mar
-09
May
-09
%
Value Retailing Life Style Retailing Home Retailing
Source: Company, ICICIdirect.com Research
Uptrend in margin to continue Over FY05-FY07, the margins of the company were under pressure mainly on account of higher expenses like cost of goods sold, employee cost and rental cost. The operating profit margin of the company decreased to 6.66% in FY07 from 8.6% in FY05. The net profit margin also declined due to rising depreciation and interest cost resulting from aggressive capital expenditure. The adjusted net profit (adjusted for one–time transactions and other income) margin declined from 3.4% in FY05 to 0.9% in FY07. However, with economies of scale rising from increased space under operations, cost reduction methods and adoption of better inventory management and supply chain management systems, the operating profit margin of the company improved to 10.5% in FY09 from 6.7% in FY07. Adjusted net profit margin declined to 2.2% in FY09 from 2.5% in FY08. Going forward, we expect the company to maintain its margins wherein the operating profit margin is expected to be 11% in FY12E and adjusted net profit margin is expected to be 3.0% in the same period. This is on back of expected rise in share of lifestyle stores, better economies of scale, increasing share of private labels and continued implementation of cost reduction measures. Adjusted PAT margin is expected to rise on account of lower interest expense resulting from reduced funding of capex from debt.
Exhibit 30: Improving cost structure
69.6 69.9 69.7 69.3 69.1
5.4 4.3 4.2 4.3 4.46.5 6.4 6.5 6.5 6.49.4 8.9 8.9 9.1 9.1
0
10
20
30
40
50
60
70
80
FY08 FY09 FY10E FY11E FY12E
% o
f net
reve
nue
Cost of goods sold Emp Exp Rentals SG&A
Source: Company, ICICIdirect.com Research
Exhibit 31: Margins rise higher
11.0
3.0
10.910.710.5
9.1
2.5 2.82.62.2
0
2
4
6
8
10
12
FY08 FY09 FY10E FY11E FY12E
%
Operating Margin Adj. Net Profit Margin
Source: Company, ICICIdirect.com Research
Margins to improve on account of cost reduction measures and rising share of lifestyle segment and private labels
1 9 | P a g e
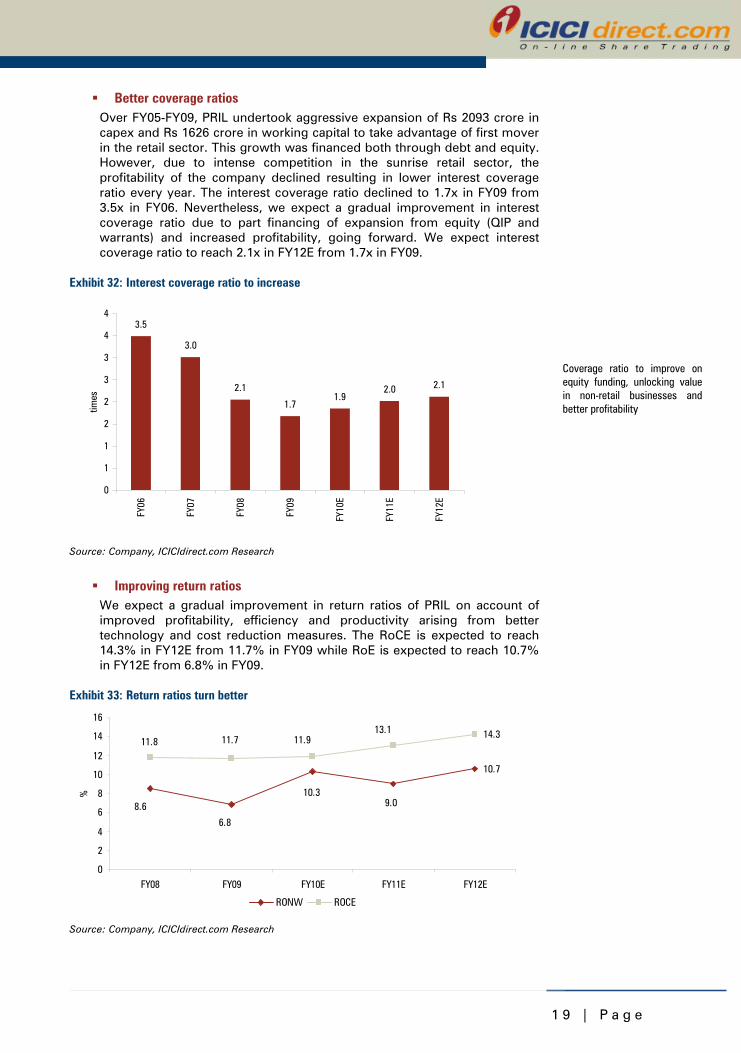
Better coverage ratios Over FY05-FY09, PRIL undertook aggressive expansion of Rs 2093 crore in capex and Rs 1626 crore in working capital to take advantage of first mover in the retail sector. This growth was financed both through debt and equity. However, due to intense competition in the sunrise retail sector, the profitability of the company declined resulting in lower interest coverage ratio every year. The interest coverage ratio declined to 1.7x in FY09 from 3.5x in FY06. Nevertheless, we expect a gradual improvement in interest coverage ratio due to part financing of expansion from equity (QIP and warrants) and increased profitability, going forward. We expect interest coverage ratio to reach 2.1x in FY12E from 1.7x in FY09.
Exhibit 32: Interest coverage ratio to increase
3.5
3.0
2.1
1.71.9
2.0 2.1
0
1
1
2
2
3
3
4
4
FY06
FY07
FY08
FY09
FY10
E
FY11
E
FY12
E
times
Source: Company, ICICIdirect.com Research
Improving return ratios We expect a gradual improvement in return ratios of PRIL on account of improved profitability, efficiency and productivity arising from better technology and cost reduction measures. The RoCE is expected to reach 14.3% in FY12E from 11.7% in FY09 while RoE is expected to reach 10.7% in FY12E from 6.8% in FY09.
Exhibit 33: Return ratios turn better
10.7
14.3
6.8
10.39.08.6
13.111.911.711.8
0
2
4
6
8
10
12
14
16
FY08 FY09 FY10E FY11E FY12E
%
RONW ROCE
Source: Company, ICICIdirect.com Research
Coverage ratio to improve on equity funding, unlocking value in non-retail businesses and better profitability
2 0 | P a g e
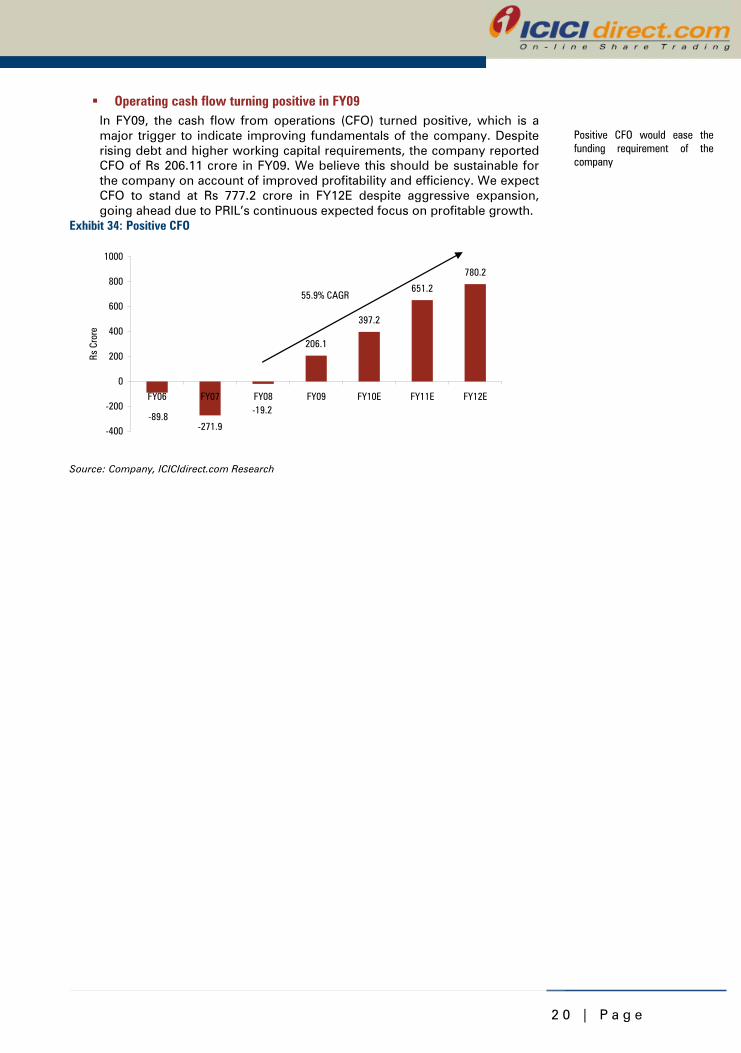
Operating cash flow turning positive in FY09 In FY09, the cash flow from operations (CFO) turned positive, which is a major trigger to indicate improving fundamentals of the company. Despite rising debt and higher working capital requirements, the company reported CFO of Rs 206.11 crore in FY09. We believe this should be sustainable for the company on account of improved profitability and efficiency. We expect CFO to stand at Rs 777.2 crore in FY12E despite aggressive expansion, going ahead due to PRIL’s continuous expected focus on profitable growth.
Exhibit 34: Positive CFO
-271.9
206.1
397.2
651.2
780.2
-89.8-19.2
-400
-200
0
200
400
600
800
1000
FY06 FY07 FY08 FY09 FY10E FY11E FY12E
Rs C
rore
55.9% CAGR
Source: Company, ICICIdirect.com Research
Positive CFO would ease the funding requirement of the company
2 1 | P a g e
Valuations
Pantaloon Retail is a one-stop retail services solution provider. It caters to approximately 60% of the wallet share of the consumer. It has ready consumers for its retail related services at present due to the massive retail space under operations providing access to above 200 million consumers and various corporate clients for allied services. We believe the company will be able to create synergies in various businesses and are positive on the business model of the company. We have valued the company on a sum-of-the-parts basis to reflect the value of various subsidiaries that the company owns. The core retail businesses of PRIL standalone have been valued through DCF to take into account the efficiencies arising out of better utilisation of resources. We have valued Home Solutions Retail on relative valuation multiple as the company is still not making profits at the EBITDA level. We value Future Capital Holdings on a 30% discount to market capitalisation, as it is a listed entity. We have not included the valuation of other subsidiaries in our target price as all of them are at nascent stage. We believe it is too early to value them and, hence, would wait for these subsidiaries to gain some traction before including them in our target price. Accordingly, we have arrived at a target price of Rs 425 per share giving a potential upside of 21.4%. We are initiating coverage with a STRONG BUY rating. Exhibit 35: Sum-of-the-parts of PRIL
Name of the company Basis of ValuationTotal Value (Rs Crore) PRIL share Per Share Value
Standalone Value DCF 7226.73 7226.73 370.2Subsidiaries Home Solutions Retail (66.9% stake) Market Cap / Sales 1096.40 733.49 26.3 Future Capital (54.8% stake) Market Capitalisation 1435.28 550.57 28.2Total 9758.40 8510.79 424.7
Source: ICICIdirect.com Research
Note: Per Share value has been calculated on fully diluted equity of PRIL
PRIL standalone valued at Rs 370 per share PRIL, on a standalone basis, includes Pantaloons, Big Bazaar, Food Bazaar, Central, Brand Factory, Fashion Station, aLL, Depot and other small formats. We value it on a DCF basis to take into account the store roll out assumptions and improving profitability, going forward, resulting from better sales mix, improving efficiency and productivity, easing rental and other costs. We have valued the company on a three stage DCF basis, wherein explicit assumptions have been made till FY19. Thereafter, we have assumed a terminal growth of 5% for the company. With these assumptions, we have arrived at a value of Rs 7226.7 crore translating into per share value of Rs 370 on a fully diluted equity. We expect the fully diluted equity of the company to reach Rs 39 crore after adjusting for QIP issue and warrants issued to promoters.
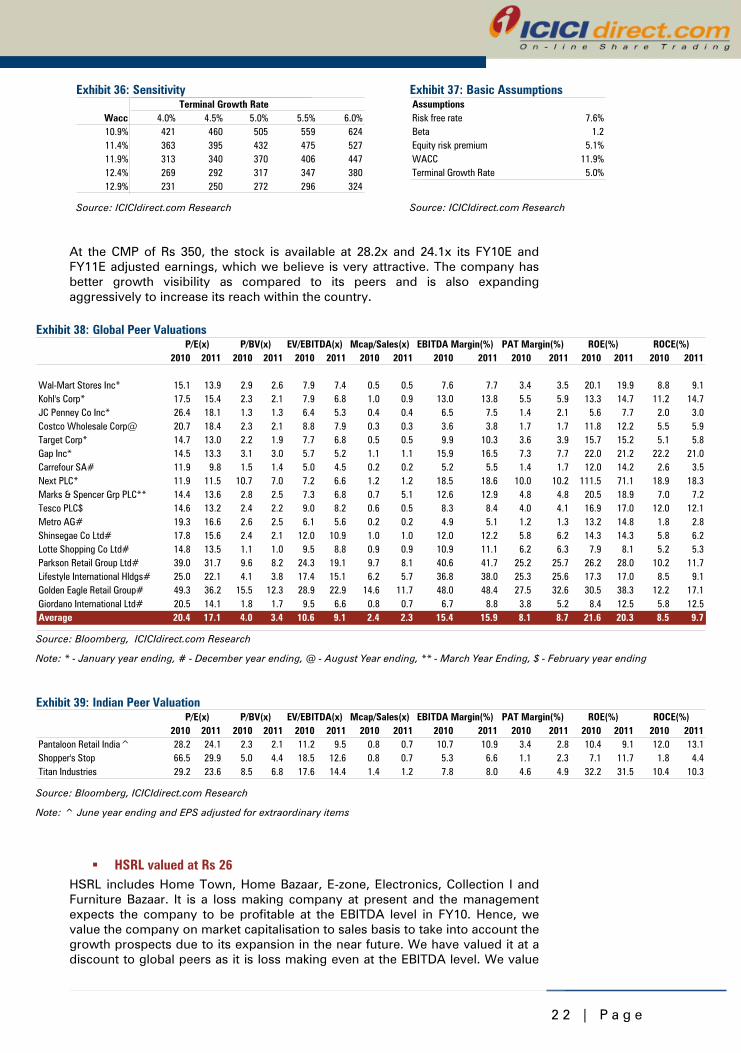
2 2 | P a g e
Exhibit 36: Sensitivity
Terminal Growth RateWacc 4.0% 4.5% 5.0% 5.5% 6.0%10.9% 421 460 505 559 62411.4% 363 395 432 475 52711.9% 313 340 370 406 44712.4% 269 292 317 347 38012.9% 231 250 272 296 324
Source: ICICIdirect.com Research
Exhibit 37: Basic Assumptions AssumptionsRisk free rate 7.6%Beta 1.2Equity risk premium 5.1%WACC 11.9%Terminal Growth Rate 5.0%
Source: ICICIdirect.com Research
At the CMP of Rs 350, the stock is available at 28.2x and 24.1x its FY10E and FY11E adjusted earnings, which we believe is very attractive. The company has better growth visibility as compared to its peers and is also expanding aggressively to increase its reach within the country.
Exhibit 38: Global Peer Valuations P/BV(x) EV/EBITDA(x) Mcap/Sales(x) EBITDA Margin(%) PAT Margin(%) ROE(%) ROCE(%)
2010 2011 2010 2011 2010 2011 2010 2011 2010 2011 2010 2011 2010 2011 2010 2011
Wal-Mart Stores Inc* 15.1 13.9 2.9 2.6 7.9 7.4 0.5 0.5 7.6 7.7 3.4 3.5 20.1 19.9 8.8 9.1Kohl's Corp* 17.5 15.4 2.3 2.1 7.9 6.8 1.0 0.9 13.0 13.8 5.5 5.9 13.3 14.7 11.2 14.7JC Penney Co Inc* 26.4 18.1 1.3 1.3 6.4 5.3 0.4 0.4 6.5 7.5 1.4 2.1 5.6 7.7 2.0 3.0Costco Wholesale Corp@ 20.7 18.4 2.3 2.1 8.8 7.9 0.3 0.3 3.6 3.8 1.7 1.7 11.8 12.2 5.5 5.9Target Corp* 14.7 13.0 2.2 1.9 7.7 6.8 0.5 0.5 9.9 10.3 3.6 3.9 15.7 15.2 5.1 5.8Gap Inc* 14.5 13.3 3.1 3.0 5.7 5.2 1.1 1.1 15.9 16.5 7.3 7.7 22.0 21.2 22.2 21.0Carrefour SA# 11.9 9.8 1.5 1.4 5.0 4.5 0.2 0.2 5.2 5.5 1.4 1.7 12.0 14.2 2.6 3.5Next PLC* 11.9 11.5 10.7 7.0 7.2 6.6 1.2 1.2 18.5 18.6 10.0 10.2 111.5 71.1 18.9 18.3Marks & Spencer Grp PLC** 14.4 13.6 2.8 2.5 7.3 6.8 0.7 5.1 12.6 12.9 4.8 4.8 20.5 18.9 7.0 7.2Tesco PLC$ 14.6 13.2 2.4 2.2 9.0 8.2 0.6 0.5 8.3 8.4 4.0 4.1 16.9 17.0 12.0 12.1Metro AG# 19.3 16.6 2.6 2.5 6.1 5.6 0.2 0.2 4.9 5.1 1.2 1.3 13.2 14.8 1.8 2.8Shinsegae Co Ltd# 17.8 15.6 2.4 2.1 12.0 10.9 1.0 1.0 12.0 12.2 5.8 6.2 14.3 14.3 5.8 6.2Lotte Shopping Co Ltd# 14.8 13.5 1.1 1.0 9.5 8.8 0.9 0.9 10.9 11.1 6.2 6.3 7.9 8.1 5.2 5.3Parkson Retail Group Ltd# 39.0 31.7 9.6 8.2 24.3 19.1 9.7 8.1 40.6 41.7 25.2 25.7 26.2 28.0 10.2 11.7Lifestyle International Hldgs# 25.0 22.1 4.1 3.8 17.4 15.1 6.2 5.7 36.8 38.0 25.3 25.6 17.3 17.0 8.5 9.1Golden Eagle Retail Group# 49.3 36.2 15.5 12.3 28.9 22.9 14.6 11.7 48.0 48.4 27.5 32.6 30.5 38.3 12.2 17.1Giordano International Ltd# 20.5 14.1 1.8 1.7 9.5 6.6 0.8 0.7 6.7 8.8 3.8 5.2 8.4 12.5 5.8 12.5Average 20.4 17.1 4.0 3.4 10.6 9.1 2.4 2.3 15.4 15.9 8.1 8.7 21.6 20.3 8.5 9.7
P/E(x)
Source: Bloomberg, ICICIdirect.com Research
Note: * - January year ending, # - December year ending, @ - August Year ending, ** - March Year Ending, $ - February year ending
Exhibit 39: Indian Peer Valuation
P/BV(x) EV/EBITDA(x) Mcap/Sales(x) EBITDA Margin(%) PAT Margin(%) ROE(%) ROCE(%)2010 2011 2010 2011 2010 2011 2010 2011 2010 2011 2010 2011 2010 2011 2010 2011
Pantaloon Retail India^ 28.2 24.1 2.3 2.1 11.2 9.5 0.8 0.7 10.7 10.9 3.4 2.8 10.4 9.1 12.0 13.1Shopper's Stop 66.5 29.9 5.0 4.4 18.5 12.6 0.8 0.7 5.3 6.6 1.1 2.3 7.1 11.7 1.8 4.4Titan Industries 29.2 23.6 8.5 6.8 17.6 14.4 1.4 1.2 7.8 8.0 4.6 4.9 32.2 31.5 10.4 10.3
P/E(x)
Source: Bloomberg, ICICIdirect.com Research
Note: ^ June year ending and EPS adjusted for extraordinary items
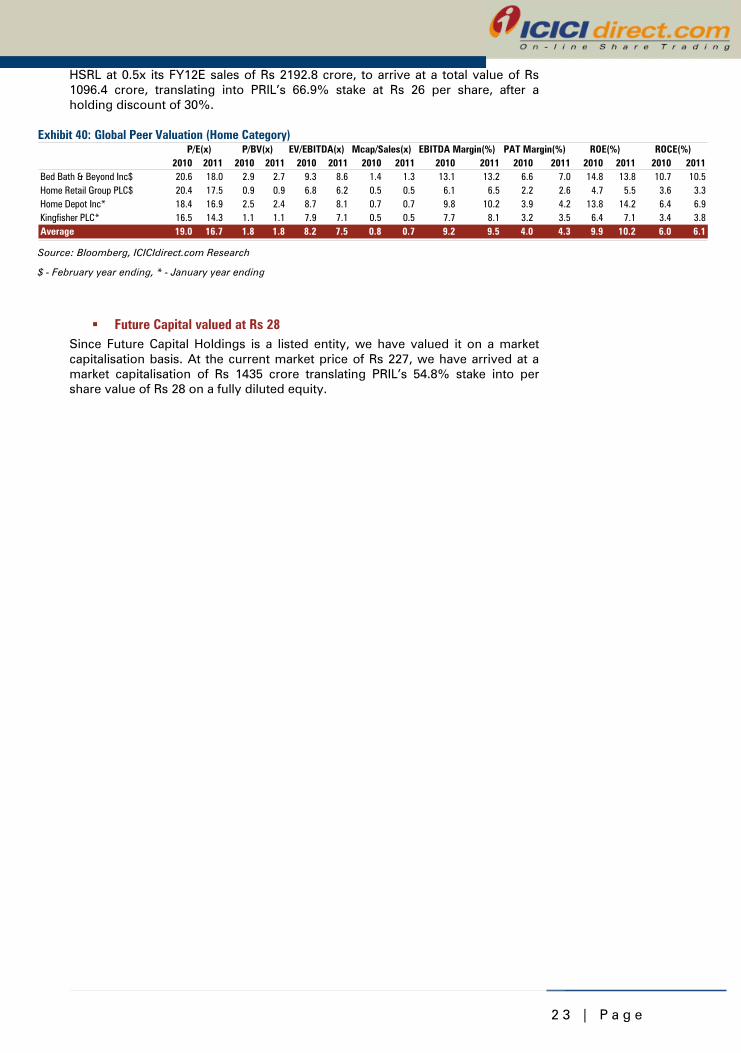
HSRL valued at Rs 26 HSRL includes Home Town, Home Bazaar, E-zone, Electronics, Collection I and Furniture Bazaar. It is a loss making company at present and the management expects the company to be profitable at the EBITDA level in FY10. Hence, we value the company on market capitalisation to sales basis to take into account the growth prospects due to its expansion in the near future. We have valued it at a discount to global peers as it is loss making even at the EBITDA level. We value
2 3 | P a g e
HSRL at 0.5x its FY12E sales of Rs 2192.8 crore, to arrive at a total value of Rs 1096.4 crore, translating into PRIL’s 66.9% stake at Rs 26 per share, after a holding discount of 30%.
Exhibit 40: Global Peer Valuation (Home Category) P/BV(x) EV/EBITDA(x) Mcap/Sales(x) EBITDA Margin(%) PAT Margin(%) ROE(%) ROCE(%)
2010 2011 2010 2011 2010 2011 2010 2011 2010 2011 2010 2011 2010 2011 2010 2011Bed Bath & Beyond Inc$ 20.6 18.0 2.9 2.7 9.3 8.6 1.4 1.3 13.1 13.2 6.6 7.0 14.8 13.8 10.7 10.5Home Retail Group PLC$ 20.4 17.5 0.9 0.9 6.8 6.2 0.5 0.5 6.1 6.5 2.2 2.6 4.7 5.5 3.6 3.3Home Depot Inc* 18.4 16.9 2.5 2.4 8.7 8.1 0.7 0.7 9.8 10.2 3.9 4.2 13.8 14.2 6.4 6.9Kingfisher PLC* 16.5 14.3 1.1 1.1 7.9 7.1 0.5 0.5 7.7 8.1 3.2 3.5 6.4 7.1 3.4 3.8Average 19.0 16.7 1.8 1.8 8.2 7.5 0.8 0.7 9.2 9.5 4.0 4.3 9.9 10.2 6.0 6.1
P/E(x)
Source: Bloomberg, ICICIdirect.com Research
$ - February year ending, * - January year ending
Future Capital valued at Rs 28 Since Future Capital Holdings is a listed entity, we have valued it on a market capitalisation basis. At the current market price of Rs 227, we have arrived at a market capitalisation of Rs 1435 crore translating PRIL’s 54.8% stake into per share value of Rs 28 on a fully diluted equity.
2 4 | P a g e
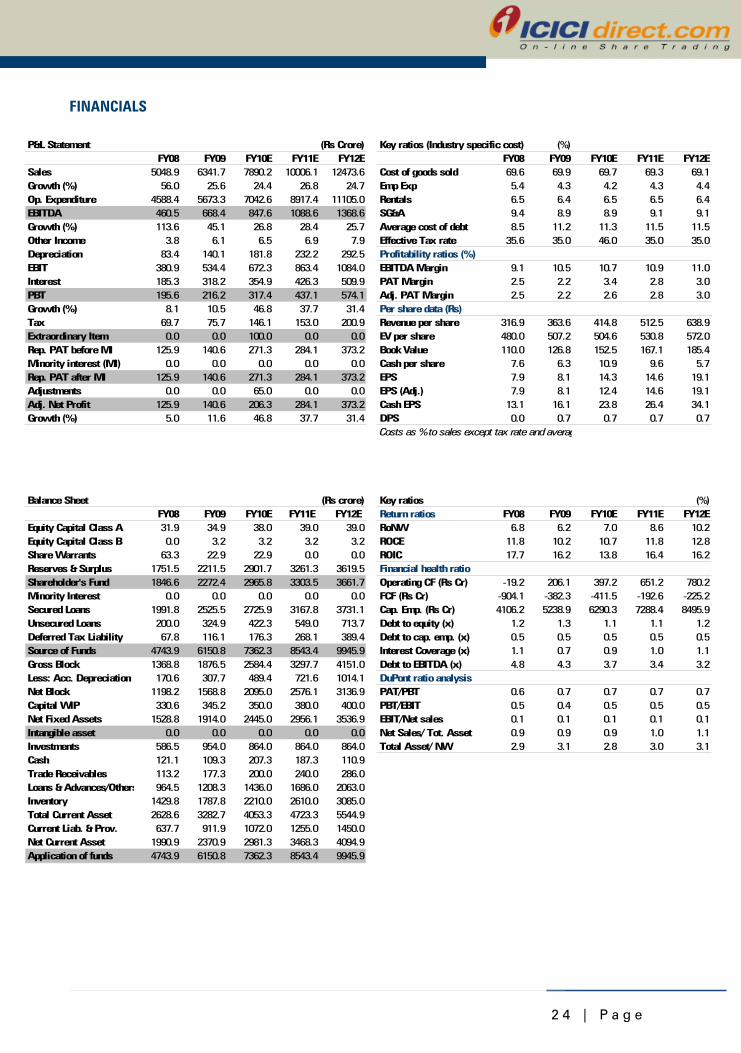
FINANCIALS
P&L Statement (Rs Crore) Key ratios (Industry specific cost) (%)FY08 FY09 FY10E FY11E FY12E FY08 FY09 FY10E FY11E FY12E
Sales 5048.9 6341.7 7890.2 10006.1 12473.6 Cost of goods sold 69.6 69.9 69.7 69.3 69.1Growth (%) 56.0 25.6 24.4 26.8 24.7 Emp Exp 5.4 4.3 4.2 4.3 4.4Op. Expenditure 4588.4 5673.3 7042.6 8917.4 11105.0 Rentals 6.5 6.4 6.5 6.5 6.4EBITDA 460.5 668.4 847.6 1088.6 1368.6 SG&A 9.4 8.9 8.9 9.1 9.1Growth (%) 113.6 45.1 26.8 28.4 25.7 Average cost of debt 8.5 11.2 11.3 11.5 11.5Other Income 3.8 6.1 6.5 6.9 7.9 Effective Tax rate 35.6 35.0 46.0 35.0 35.0Depreciation 83.4 140.1 181.8 232.2 292.5 Profitability ratios (%)EBIT 380.9 534.4 672.3 863.4 1084.0 EBITDA Margin 9.1 10.5 10.7 10.9 11.0Interest 185.3 318.2 354.9 426.3 509.9 PAT Margin 2.5 2.2 3.4 2.8 3.0PBT 195.6 216.2 317.4 437.1 574.1 Adj. PAT Margin 2.5 2.2 2.6 2.8 3.0Growth (%) 8.1 10.5 46.8 37.7 31.4 Per share data (Rs)Tax 69.7 75.7 146.1 153.0 200.9 Revenue per share 316.9 363.6 414.8 512.5 638.9Extraordinary Item 0.0 0.0 100.0 0.0 0.0 EV per share 480.0 507.2 504.6 530.8 572.0Rep. PAT before MI 125.9 140.6 271.3 284.1 373.2 Book Value 110.0 126.8 152.5 167.1 185.4Minority interest (MI) 0.0 0.0 0.0 0.0 0.0 Cash per share 7.6 6.3 10.9 9.6 5.7Rep. PAT after MI 125.9 140.6 271.3 284.1 373.2 EPS 7.9 8.1 14.3 14.6 19.1Adjustments 0.0 0.0 65.0 0.0 0.0 EPS (Adj.) 7.9 8.1 12.4 14.6 19.1Adj. Net Profit 125.9 140.6 206.3 284.1 373.2 Cash EPS 13.1 16.1 23.8 26.4 34.1Growth (%) 5.0 11.6 46.8 37.7 31.4 DPS 0.0 0.7 0.7 0.7 0.7
Balance Sheet (Rs crore) Key ratios (%)FY08 FY09 FY10E FY11E FY12E Return ratios FY08 FY09 FY10E FY11E FY12E
Equity Capital Class A 31.9 34.9 38.0 39.0 39.0 RoNW 6.8 6.2 7.0 8.6 10.2Equity Capital Class B 0.0 3.2 3.2 3.2 3.2 ROCE 11.8 10.2 10.7 11.8 12.8Share Warrants 63.3 22.9 22.9 0.0 0.0 ROIC 17.7 16.2 13.8 16.4 16.2Reserves & Surplus 1751.5 2211.5 2901.7 3261.3 3619.5 Financial health ratioShareholder's Fund 1846.6 2272.4 2965.8 3303.5 3661.7 Operating CF (Rs Cr) -19.2 206.1 397.2 651.2 780.2Minority Interest 0.0 0.0 0.0 0.0 0.0 FCF (Rs Cr) -904.1 -382.3 -411.5 -192.6 -225.2Secured Loans 1991.8 2525.5 2725.9 3167.8 3731.1 Cap. Emp. (Rs Cr) 4106.2 5238.9 6290.3 7288.4 8495.9Unsecured Loans 200.0 324.9 422.3 549.0 713.7 Debt to equity (x) 1.2 1.3 1.1 1.1 1.2Deferred Tax Liability 67.8 116.1 176.3 268.1 389.4 Debt to cap. emp. (x) 0.5 0.5 0.5 0.5 0.5Source of Funds 4743.9 6150.8 7362.3 8543.4 9945.9 Interest Coverage (x) 1.1 0.7 0.9 1.0 1.1Gross Block 1368.8 1876.5 2584.4 3297.7 4151.0 Debt to EBITDA (x) 4.8 4.3 3.7 3.4 3.2Less: Acc. Depreciation 170.6 307.7 489.4 721.6 1014.1 DuPont ratio analysisNet Block 1198.2 1568.8 2095.0 2576.1 3136.9 PAT/PBT 0.6 0.7 0.7 0.7 0.7Capital WIP 330.6 345.2 350.0 380.0 400.0 PBT/EBIT 0.5 0.4 0.5 0.5 0.5Net Fixed Assets 1528.8 1914.0 2445.0 2956.1 3536.9 EBIT/Net sales 0.1 0.1 0.1 0.1 0.1Intangible asset 0.0 0.0 0.0 0.0 0.0 Net Sales/ Tot. Asset 0.9 0.9 0.9 1.0 1.1Investments 586.5 954.0 864.0 864.0 864.0 Total Asset/ NW 2.9 3.1 2.8 3.0 3.1Cash 121.1 109.3 207.3 187.3 110.9Trade Receivables 113.2 177.3 200.0 240.0 286.0Loans & Advances/Others 964.5 1208.3 1436.0 1686.0 2063.0Inventory 1429.8 1787.8 2210.0 2610.0 3085.0Total Current Asset 2628.6 3282.7 4053.3 4723.3 5544.9Current Liab. & Prov. 637.7 911.9 1072.0 1255.0 1450.0Net Current Asset 1990.9 2370.9 2981.3 3468.3 4094.9Application of funds 4743.9 6150.8 7362.3 8543.4 9945.9
Costs as % to sales except tax rate and averag
2 5 | P a g e
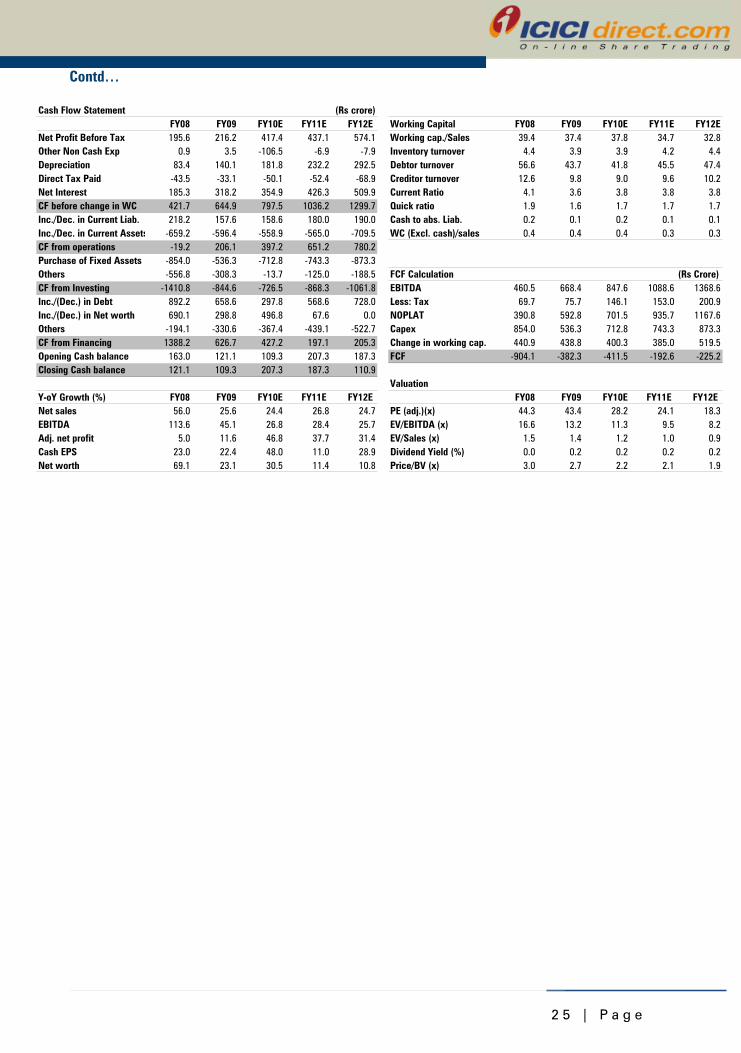
Contd…
Cash Flow Statement (Rs crore)FY08 FY09 FY10E FY11E FY12E Working Capital FY08 FY09 FY10E FY11E FY12E
Net Profit Before Tax 195.6 216.2 417.4 437.1 574.1 Working cap./Sales 39.4 37.4 37.8 34.7 32.8Other Non Cash Exp 0.9 3.5 -106.5 -6.9 -7.9 Inventory turnover 4.4 3.9 3.9 4.2 4.4Depreciation 83.4 140.1 181.8 232.2 292.5 Debtor turnover 56.6 43.7 41.8 45.5 47.4Direct Tax Paid -43.5 -33.1 -50.1 -52.4 -68.9 Creditor turnover 12.6 9.8 9.0 9.6 10.2Net Interest 185.3 318.2 354.9 426.3 509.9 Current Ratio 4.1 3.6 3.8 3.8 3.8CF before change in WC 421.7 644.9 797.5 1036.2 1299.7 Quick ratio 1.9 1.6 1.7 1.7 1.7Inc./Dec. in Current Liab. 218.2 157.6 158.6 180.0 190.0 Cash to abs. Liab. 0.2 0.1 0.2 0.1 0.1Inc./Dec. in Current Assets -659.2 -596.4 -558.9 -565.0 -709.5 WC (Excl. cash)/sales 0.4 0.4 0.4 0.3 0.3CF from operations -19.2 206.1 397.2 651.2 780.2Purchase of Fixed Assets -854.0 -536.3 -712.8 -743.3 -873.3Others -556.8 -308.3 -13.7 -125.0 -188.5 FCF Calculation (Rs Crore)CF from Investing -1410.8 -844.6 -726.5 -868.3 -1061.8 EBITDA 460.5 668.4 847.6 1088.6 1368.6Inc./(Dec.) in Debt 892.2 658.6 297.8 568.6 728.0 Less: Tax 69.7 75.7 146.1 153.0 200.9Inc./(Dec.) in Net worth 690.1 298.8 496.8 67.6 0.0 NOPLAT 390.8 592.8 701.5 935.7 1167.6Others -194.1 -330.6 -367.4 -439.1 -522.7 Capex 854.0 536.3 712.8 743.3 873.3CF from Financing 1388.2 626.7 427.2 197.1 205.3 Change in working cap. 440.9 438.8 400.3 385.0 519.5Opening Cash balance 163.0 121.1 109.3 207.3 187.3 FCF -904.1 -382.3 -411.5 -192.6 -225.2Closing Cash balance 121.1 109.3 207.3 187.3 110.9
ValuationY-oY Growth (%) FY08 FY09 FY10E FY11E FY12E FY08 FY09 FY10E FY11E FY12E Net sales 56.0 25.6 24.4 26.8 24.7 PE (adj.)(x) 44.3 43.4 28.2 24.1 18.3EBITDA 113.6 45.1 26.8 28.4 25.7 EV/EBITDA (x) 16.6 13.2 11.3 9.5 8.2Adj. net profit 5.0 11.6 46.8 37.7 31.4 EV/Sales (x) 1.5 1.4 1.2 1.0 0.9Cash EPS 23.0 22.4 48.0 11.0 28.9 Dividend Yield (%) 0.0 0.2 0.2 0.2 0.2Net worth 69.1 23.1 30.5 11.4 10.8 Price/BV (x) 3.0 2.7 2.2 2.1 1.9
2 6 | P a g e
ANNEXURE I: SUBSIDIARIES
Exhibit 41: Key Subsidiaries Performance Name % Stake Turnover EBITDA(%) PAT Capital EmployedCIG Infrastructure 51.0 0.0 NA 0.0 NAFuture Capital Holdings Limited 54.8 136.0 31.5 9.3 1,217.0Home Solutions Retail (India) Limited 66.9 1071.0 -3.4 -5.7 674.0Future Agrovet Limited 96.2 391.0 0.4 -3.1 61.0Future Logistic Solutions Limited 94.2 194.0 5.3 0.2 35.0Future Brands Ltd 76.3 19.0 1.7 6.2 15.0Future Mall Management Ltd 100.0 0.0 NA 0.0 NAFuture Media (India) Limited 84.2 46.0 -13.0 -7.7 42.0Future Mobile and Accessories Ltd 100.0 43.1 NA -2.8 NAFuture Knowledge Services Limited. 100.0 47.0 3.0 0.1 45.0Future Learning and Development Limited 100.0 5.0 21.9 -0.2 33.0Future E-Commerce Infrastructure Limited 72.0 118.0 -20.5 -18.7 54.0Futurebazaar India 99.7 71.9 NA -0.1 NAWinner Sports Private Ltd. 100.0 33.0 5.9 -0.4 43.0 Source: Company, ICICIdirect.com Research
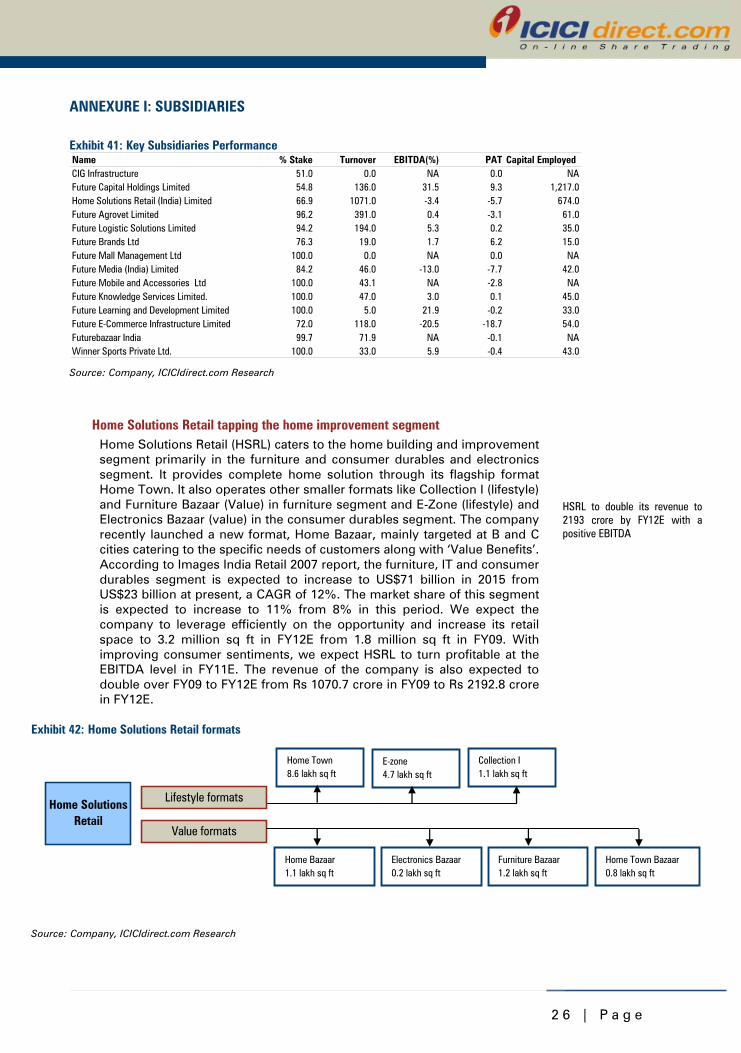
Home Solutions Retail tapping the home improvement segment Home Solutions Retail (HSRL) caters to the home building and improvement segment primarily in the furniture and consumer durables and electronics segment. It provides complete home solution through its flagship format Home Town. It also operates other smaller formats like Collection I (lifestyle) and Furniture Bazaar (Value) in furniture segment and E-Zone (lifestyle) and Electronics Bazaar (value) in the consumer durables segment. The company recently launched a new format, Home Bazaar, mainly targeted at B and C cities catering to the specific needs of customers along with ‘Value Benefits’. According to Images India Retail 2007 report, the furniture, IT and consumer durables segment is expected to increase to US$71 billion in 2015 from US$23 billion at present, a CAGR of 12%. The market share of this segment is expected to increase to 11% from 8% in this period. We expect the company to leverage efficiently on the opportunity and increase its retail space to 3.2 million sq ft in FY12E from 1.8 million sq ft in FY09. With improving consumer sentiments, we expect HSRL to turn profitable at the EBITDA level in FY11E. The revenue of the company is also expected to double over FY09 to FY12E from Rs 1070.7 crore in FY09 to Rs 2192.8 crore in FY12E.
Exhibit 42: Home Solutions Retail formats
Home SolutionsRetail
Value formats
Lifestyle formats
Home Town8.6 lakh sq ft
E-zone4.7 lakh sq ft
Collection I1.1 lakh sq ft
Home Bazaar1.1 lakh sq ft
Electronics Bazaar0.2 lakh sq ft
Furniture Bazaar1.2 lakh sq ft
Home Town Bazaar0.8 lakh sq ft
Source: Company, ICICIdirect.com Research
HSRL to double its revenue to 2193 crore by FY12E with a positive EBITDA
2 7 | P a g e
Futurebazaar.com to capture online customers With the launch of futurebazaar.com through Futurebazaar India Ltd (FBIL), PRIL entered into online retailing a.k.a. e-tailing. E-tailing reduces the capex and increases the reach of the company at minimal extra cost. It reduces costs like rental, employee cost, inventory carrying costs, etc. which would have to be incurred in a brick and mortar format. It creates time utility by saving travelling cost for the customer and transportation cost for the company. PRIL is creating synergy in both the brick and mortar format and e-tailing by providing similar deals on both platforms. The online customers were offered the same deals like that available at Big Bazaar between January 26 and 28, the ‘Sabse Saste 3 Din’ phenomenon. Combining the online portal with catalogue retailing through kiosks located in malls and shopping centres, the format attracted a new set of customers. According to industry estimates, the Indian online shopping business is likely to grow by 150% to touch Rs 5,500 crore in 2007-08 from Rs 2,300 crore in 2006-07. The company turned profitable in FY08 with net profit of Rs 3.95 crore and revenue of Rs 15.64 crore. In FY09, FBIL reported total income of Rs 71.88 crore with a marginal net loss of Rs 0.14 crore.
Strong logistics network through Future Logistics Solutions PRIL forayed into the logistics business through Future Logistics Solutions Ltd (FLSL). Initially set up for captive supply chain management (SCM), the company will also be providing logistics services to Future group’s subsidiaries, associations, alliances and vendors. It will cater to logistics, transportation and warehousing requirements of customers. Its operations focus on five major verticals, namely warehousing, transportation, international logistics, brand distribution and reverse logistics. The company now has a current warehouse space of over 3.5 million sq ft with 67 warehouses across 32 locations. It overseas operations of existing fleet of over 600 trucks, contracted from established regional and national carrier. The total consolidated warehouse space that the company plans to have operational by 2010-1011 is nearly 7.50 million square feet. In FY09, FLSL reported total income of Rs 194 crore with an EBITDA margin of 5.3%.
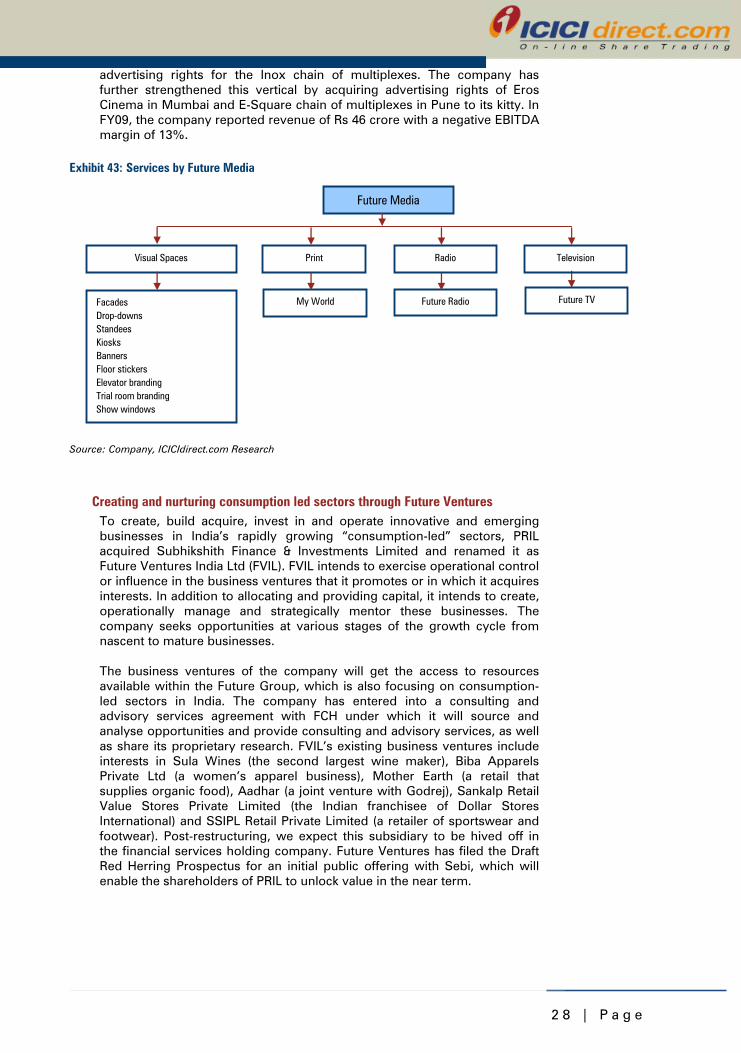
Capitalising on store space through Future Media To leverage on the existing customer base in the PRIL stores, the company created Future Media to build and sell media properties in the consumption space. Future Media operates in the out of home (OOH) segment through its media properties like Visual Spaces, Print, Radio, Television and Activation entirely focused on integrated retail space. Visual spaces includes offering brands an opportunity to showcase their identities inside the shopping environment, such as shopping trolleys, carry-bags, elevator doors, standees, danglers, trial rooms, counters, in-store signage, product displays and facades. FMCG brands, industrial application companies and leading auto companies are already heavy advertisers on the Future Media network. Among print properties, Future Media offers My World, a monthly magazine targeted at women, to select customers of Big Bazaar and now has also started issuing it on subscription. It launched Future TV, the television network across India’s largest retailscape. It is the first retailer-owned channel in India, and aims at converting footfalls into eyeballs by engaging the consumer while in the mode of consumption. At present, there are over 1500 screens across 44 cities in India. Future Theatre is the media vehicle that caters to the ever-increasing cinema-going audiences, which includes the on-screen
Future Bazaar profitable at the EBITDA level with a turnover of 71.88 crore in FY09
Future Logistics plans to operate 7.5 million sq ft of warehouse space by 2010-11
2 8 | P a g e
advertising rights for the Inox chain of multiplexes. The company has further strengthened this vertical by acquiring advertising rights of Eros Cinema in Mumbai and E-Square chain of multiplexes in Pune to its kitty. In FY09, the company reported revenue of Rs 46 crore with a negative EBITDA margin of 13%.
Exhibit 43: Services by Future Media
Future Media
Visual Spaces
FacadesDrop-downsStandeesKiosksBannersFloor stickersElevator brandingTrial room brandingShow windows
My World
TelevisionRadio
Future Radio Future TV
Source: Company, ICICIdirect.com Research
Creating and nurturing consumption led sectors through Future Ventures To create, build acquire, invest in and operate innovative and emerging businesses in India’s rapidly growing “consumption-led” sectors, PRIL acquired Subhikshith Finance & Investments Limited and renamed it as Future Ventures India Ltd (FVIL). FVIL intends to exercise operational control or influence in the business ventures that it promotes or in which it acquires interests. In addition to allocating and providing capital, it intends to create, operationally manage and strategically mentor these businesses. The company seeks opportunities at various stages of the growth cycle from nascent to mature businesses. The business ventures of the company will get the access to resources available within the Future Group, which is also focusing on consumption-led sectors in India. The company has entered into a consulting and advisory services agreement with FCH under which it will source and analyse opportunities and provide consulting and advisory services, as well as share its proprietary research. FVIL’s existing business ventures include interests in Sula Wines (the second largest wine maker), Biba Apparels Private Ltd (a women’s apparel business), Mother Earth (a retail that supplies organic food), Aadhar (a joint venture with Godrej), Sankalp Retail Value Stores Private Limited (the Indian franchisee of Dollar Stores International) and SSIPL Retail Private Limited (a retailer of sportswear and footwear). Post-restructuring, we expect this subsidiary to be hived off in the financial services holding company. Future Ventures has filed the Draft Red Herring Prospectus for an initial public offering with Sebi, which will enable the shareholders of PRIL to unlock value in the near term.
2 9 | P a g e
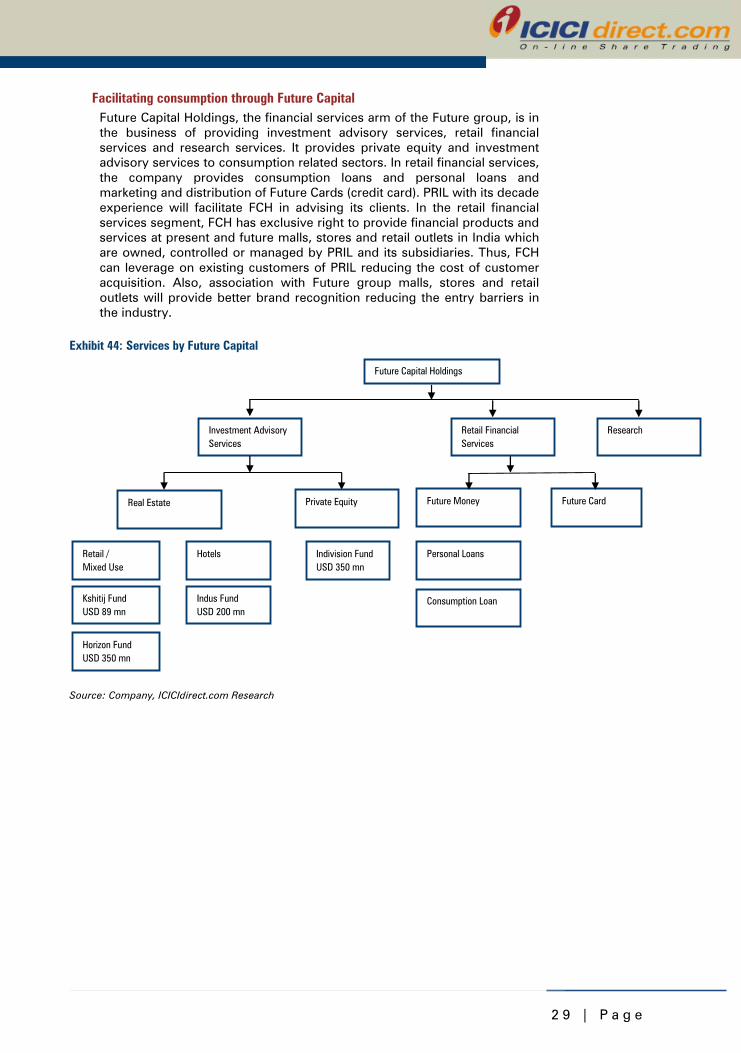
Facilitating consumption through Future Capital Future Capital Holdings, the financial services arm of the Future group, is in the business of providing investment advisory services, retail financial services and research services. It provides private equity and investment advisory services to consumption related sectors. In retail financial services, the company provides consumption loans and personal loans and marketing and distribution of Future Cards (credit card). PRIL with its decade experience will facilitate FCH in advising its clients. In the retail financial services segment, FCH has exclusive right to provide financial products and services at present and future malls, stores and retail outlets in India which are owned, controlled or managed by PRIL and its subsidiaries. Thus, FCH can leverage on existing customers of PRIL reducing the cost of customer acquisition. Also, association with Future group malls, stores and retail outlets will provide better brand recognition reducing the entry barriers in the industry.
Exhibit 44: Services by Future Capital
Future Capital Holdings
Investment Advisory Services
ResearchRetail Financial Services
Future Money Future CardReal Estate
Hotels
Kshitij Fund USD 89 mn
Horizon Fund USD 350 mn
Indus FundUSD 200 mn
Retail / Mixed Use
Personal Loans
Consumption Loan
Private Equity
Indivision FundUSD 350 mn
Source: Company, ICICIdirect.com Research
3 0 | P a g e
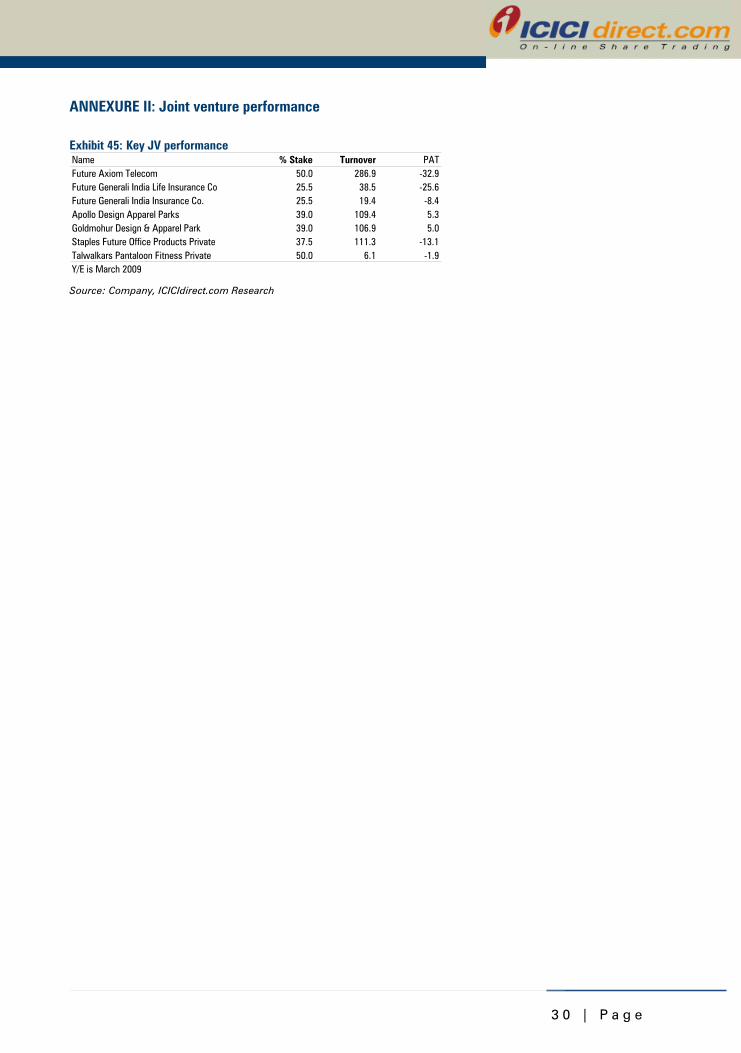
ANNEXURE II: Joint venture performance
Exhibit 45: Key JV performance Name % Stake Turnover PATFuture Axiom Telecom 50.0 286.9 -32.9Future Generali India Life Insurance Co 25.5 38.5 -25.6Future Generali India Insurance Co. 25.5 19.4 -8.4Apollo Design Apparel Parks 39.0 109.4 5.3Goldmohur Design & Apparel Park 39.0 106.9 5.0Staples Future Office Products Private 37.5 111.3 -13.1Talwalkars Pantaloon Fitness Private 50.0 6.1 -1.9Y/E is March 2009 Source: Company, ICICIdirect.com Research
3 1 | P a g e
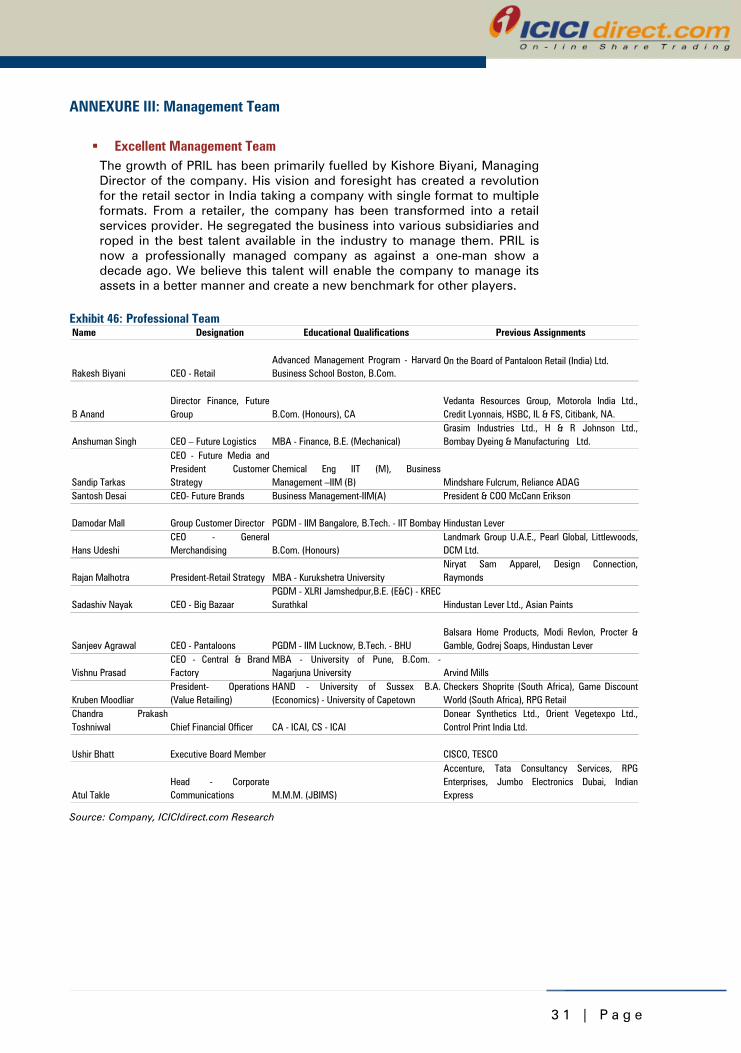
ANNEXURE III: Management Team
Excellent Management Team The growth of PRIL has been primarily fuelled by Kishore Biyani, Managing Director of the company. His vision and foresight has created a revolution for the retail sector in India taking a company with single format to multiple formats. From a retailer, the company has been transformed into a retail services provider. He segregated the business into various subsidiaries and roped in the best talent available in the industry to manage them. PRIL is now a professionally managed company as against a one-man show a decade ago. We believe this talent will enable the company to manage its assets in a better manner and create a new benchmark for other players.
Exhibit 46: Professional Team Name Designation Educational Qualifications Previous Assignments
Rakesh Biyani CEO - RetailAdvanced Management Program - HarvardBusiness School Boston, B.Com.
On the Board of Pantaloon Retail (India) Ltd.
B AnandDirector Finance, FutureGroup B.Com. (Honours), CA
Vedanta Resources Group, Motorola India Ltd.,Credit Lyonnais, HSBC, IL & FS, Citibank, NA.
Anshuman Singh CEO – Future Logistics MBA - Finance, B.E. (Mechanical)Grasim Industries Ltd., H & R Johnson Ltd.,Bombay Dyeing & Manufacturing Ltd.
Sandip Tarkas
CEO - Future Media andPresident CustomerStrategy
Chemical Eng IIT (M), BusinessManagement –IIM (B) Mindshare Fulcrum, Reliance ADAG
Santosh Desai CEO- Future Brands Business Management-IIM(A) President & COO McCann Erikson
Damodar Mall Group Customer Director PGDM - IIM Bangalore, B.Tech. - IIT Bombay Hindustan Lever
Hans UdeshiCEO - GeneralMerchandising B.Com. (Honours)
Landmark Group U.A.E., Pearl Global, Littlewoods,DCM Ltd.
Rajan Malhotra President-Retail Strategy MBA - Kurukshetra UniversityNiryat Sam Apparel, Design Connection,Raymonds
Sadashiv Nayak CEO - Big BazaarPGDM - XLRI Jamshedpur,B.E. (E&C) - KRECSurathkal Hindustan Lever Ltd., Asian Paints
Sanjeev Agrawal CEO - Pantaloons PGDM - IIM Lucknow, B.Tech. - BHUBalsara Home Products, Modi Revlon, Procter &Gamble, Godrej Soaps, Hindustan Lever
Vishnu PrasadCEO - Central & BrandFactory
MBA - University of Pune, B.Com. -Nagarjuna University Arvind Mills
Kruben MoodliarPresident- Operations(Value Retailing)
HAND - University of Sussex B.A.(Economics) - University of Capetown
Checkers Shoprite (South Africa), Game DiscountWorld (South Africa), RPG Retail
Chandra PrakashToshniwal Chief Financial Officer CA - ICAI, CS - ICAI
Donear Synthetics Ltd., Orient Vegetexpo Ltd.,Control Print India Ltd.
Ushir Bhatt Executive Board Member CISCO, TESCO
Atul TakleHead - CorporateCommunications M.M.M. (JBIMS)
Accenture, Tata Consultancy Services, RPGEnterprises, Jumbo Electronics Dubai, IndianExpress
Source: Company, ICICIdirect.com Research
3 2 | P a g e
ANNEXURE IV: Retail Sector – Growth Drivers
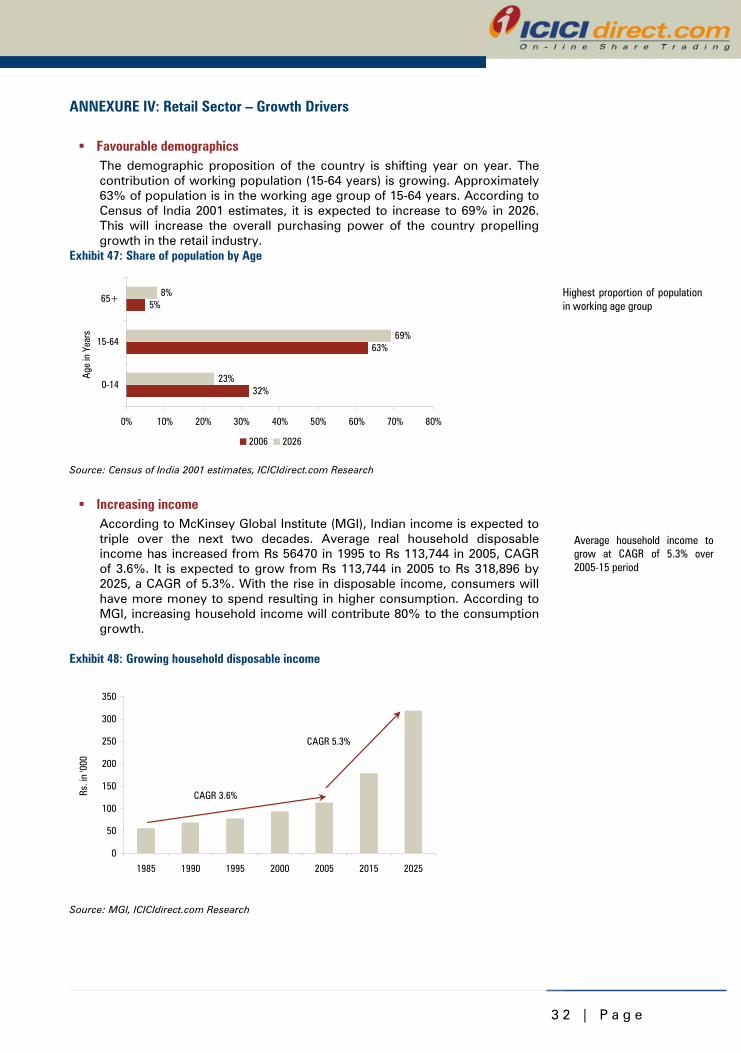
Favourable demographics The demographic proposition of the country is shifting year on year. The contribution of working population (15-64 years) is growing. Approximately 63% of population is in the working age group of 15-64 years. According to Census of India 2001 estimates, it is expected to increase to 69% in 2026. This will increase the overall purchasing power of the country propelling growth in the retail industry.
Exhibit 47: Share of population by Age
32%
63%
5%
23%
69%
8%
0% 10% 20% 30% 40% 50% 60% 70% 80%
0-14
15-64
65+
Age
in Y
ears
2006 2026
Source: Census of India 2001 estimates, ICICIdirect.com Research
Increasing income According to McKinsey Global Institute (MGI), Indian income is expected to triple over the next two decades. Average real household disposable income has increased from Rs 56470 in 1995 to Rs 113,744 in 2005, CAGR of 3.6%. It is expected to grow from Rs 113,744 in 2005 to Rs 318,896 by 2025, a CAGR of 5.3%. With the rise in disposable income, consumers will have more money to spend resulting in higher consumption. According to MGI, increasing household income will contribute 80% to the consumption growth.
Exhibit 48: Growing household disposable income
0
50
100
150
200
250
300
350
1985 1990 1995 2000 2005 2015 2025
Rs. i
n '0
00
CAGR 3.6%
CAGR 5.3%
Source: MGI, ICICIdirect.com Research
Average household income to grow at CAGR of 5.3% over 2005-15 period
Highest proportion of population in working age group
Average household income to grow at CAGR of 5.3% over 2005-15 period
3 3 | P a g e
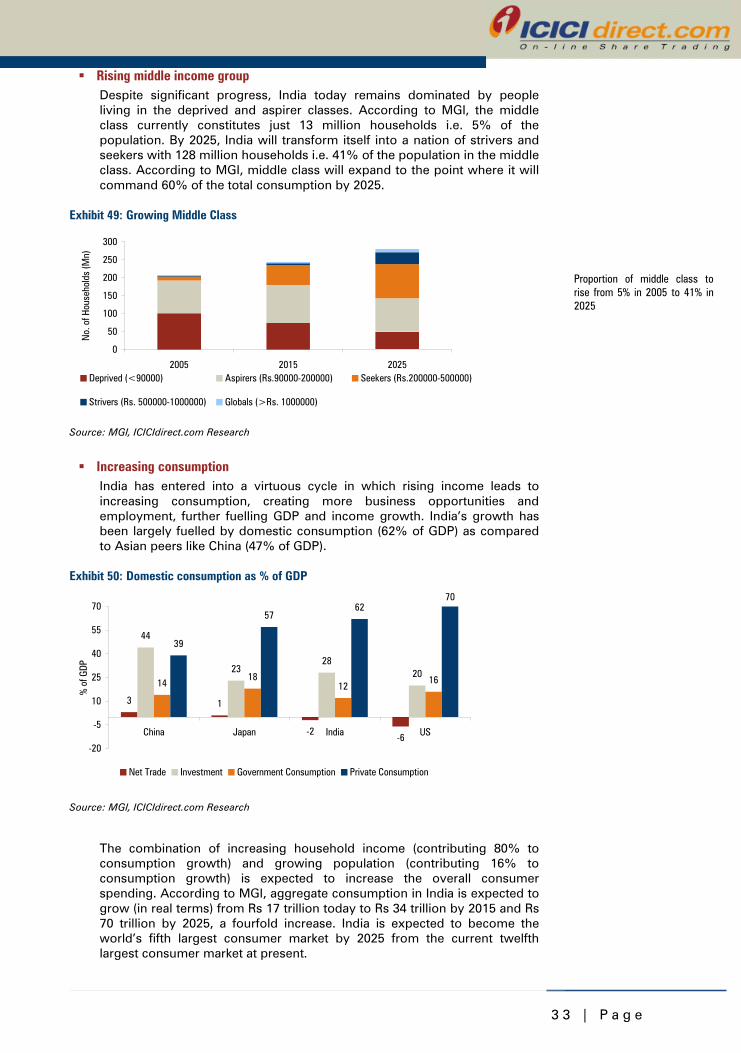
Rising middle income group Despite significant progress, India today remains dominated by people living in the deprived and aspirer classes. According to MGI, the middle class currently constitutes just 13 million households i.e. 5% of the population. By 2025, India will transform itself into a nation of strivers and seekers with 128 million households i.e. 41% of the population in the middle class. According to MGI, middle class will expand to the point where it will command 60% of the total consumption by 2025.
Exhibit 49: Growing Middle Class
0
50
100
150
200
250
300
2005 2015 2025
No.
of H
ouse
hold
s (M
n)
Deprived (<90000) Aspirers (Rs.90000-200000) Seekers (Rs.200000-500000)
Strivers (Rs. 500000-1000000) Globals (>Rs. 1000000)
Source: MGI, ICICIdirect.com Research
Increasing consumption India has entered into a virtuous cycle in which rising income leads to increasing consumption, creating more business opportunities and employment, further fuelling GDP and income growth. India’s growth has been largely fuelled by domestic consumption (62% of GDP) as compared to Asian peers like China (47% of GDP).
Exhibit 50: Domestic consumption as % of GDP
3 1
-2-6
44
2328
2014
1812
16
39
5762
70
-20
-5
10
25
40
55
70
China Japan India US
% o
f GDP
Net Trade Investment Government Consumption Private Consumption
Source: MGI, ICICIdirect.com Research
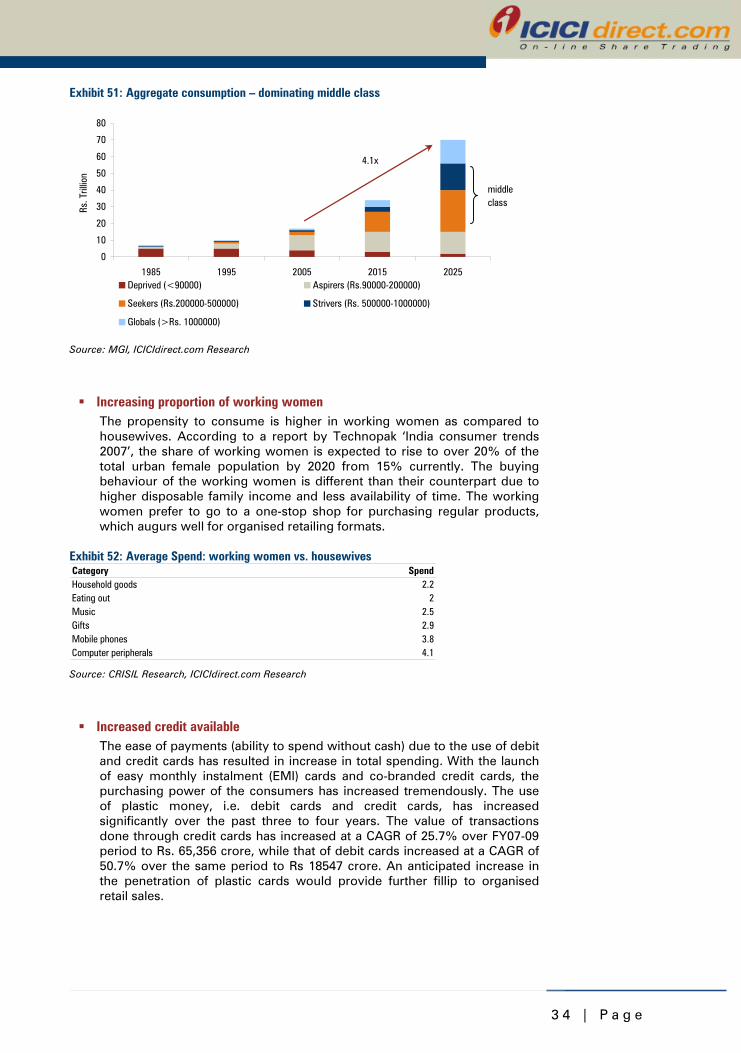
The combination of increasing household income (contributing 80% to consumption growth) and growing population (contributing 16% to consumption growth) is expected to increase the overall consumer spending. According to MGI, aggregate consumption in India is expected to grow (in real terms) from Rs 17 trillion today to Rs 34 trillion by 2015 and Rs 70 trillion by 2025, a fourfold increase. India is expected to become the world’s fifth largest consumer market by 2025 from the current twelfth largest consumer market at present.
Proportion of middle class to rise from 5% in 2005 to 41% in 2025
3 4 | P a g e
Exhibit 51: Aggregate consumption – dominating middle class
0
10
20
30
40
50
60
70
80
1985 1995 2005 2015 2025
Rs. T
rillio
n
Deprived (<90000) Aspirers (Rs.90000-200000)
Seekers (Rs.200000-500000) Strivers (Rs. 500000-1000000)
Globals (>Rs. 1000000)
middle class
4.1x
Source: MGI, ICICIdirect.com Research
Increasing proportion of working women The propensity to consume is higher in working women as compared to housewives. According to a report by Technopak ‘India consumer trends 2007’, the share of working women is expected to rise to over 20% of the total urban female population by 2020 from 15% currently. The buying behaviour of the working women is different than their counterpart due to higher disposable family income and less availability of time. The working women prefer to go to a one-stop shop for purchasing regular products, which augurs well for organised retailing formats.
Exhibit 52: Average Spend: working women vs. housewives Category SpendHousehold goods 2.2Eating out 2Music 2.5Gifts 2.9Mobile phones 3.8Computer peripherals 4.1 Source: CRISIL Research, ICICIdirect.com Research
Increased credit available The ease of payments (ability to spend without cash) due to the use of debit and credit cards has resulted in increase in total spending. With the launch of easy monthly instalment (EMI) cards and co-branded credit cards, the purchasing power of the consumers has increased tremendously. The use of plastic money, i.e. debit cards and credit cards, has increased significantly over the past three to four years. The value of transactions done through credit cards has increased at a CAGR of 25.7% over FY07-09 period to Rs. 65,356 crore, while that of debit cards increased at a CAGR of 50.7% over the same period to Rs 18547 crore. An anticipated increase in the penetration of plastic cards would provide further fillip to organised retail sales.
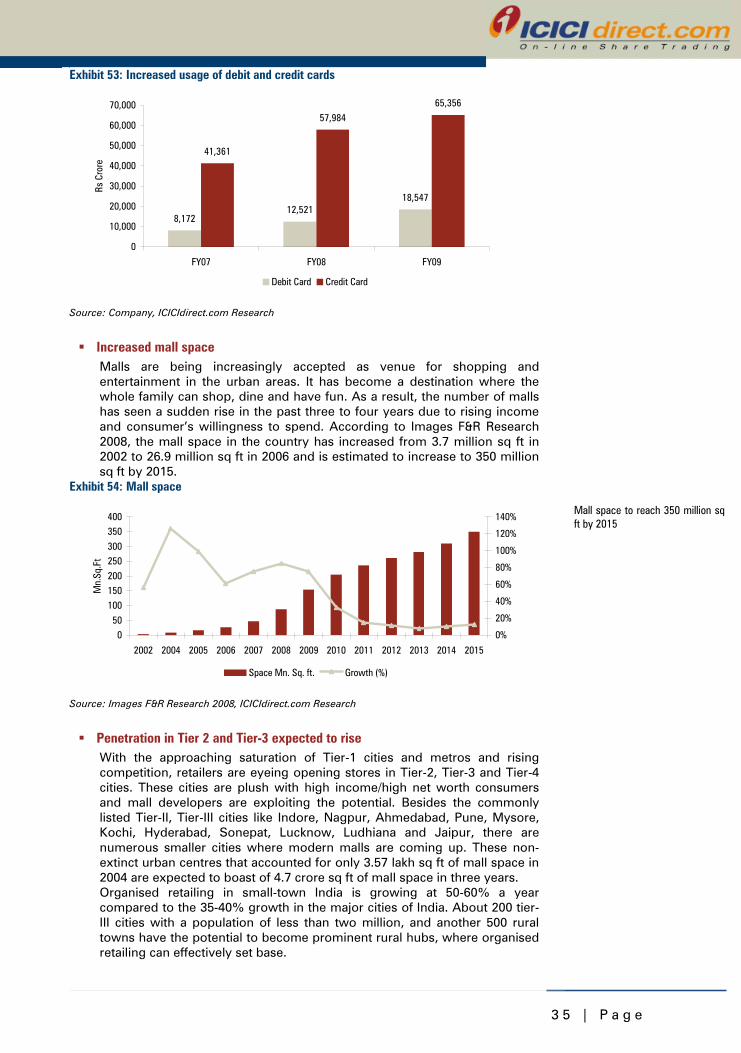
3 5 | P a g e
Exhibit 53: Increased usage of debit and credit cards
8,17212,521
18,547
41,361
57,98465,356
0
10,000
20,000
30,000
40,000
50,000
60,000
70,000
FY07 FY08 FY09
Rs C
rore
Debit Card Credit Card
Source: Company, ICICIdirect.com Research
Increased mall space Malls are being increasingly accepted as venue for shopping and entertainment in the urban areas. It has become a destination where the whole family can shop, dine and have fun. As a result, the number of malls has seen a sudden rise in the past three to four years due to rising income and consumer’s willingness to spend. According to Images F&R Research 2008, the mall space in the country has increased from 3.7 million sq ft in 2002 to 26.9 million sq ft in 2006 and is estimated to increase to 350 million sq ft by 2015.
Exhibit 54: Mall space
050
100150200250300350400
2002 2004 2005 2006 2007 2008 2009 2010 2011 2012 2013 2014 2015
Mn.
Sq.F
t
0%
20%
40%
60%
80%
100%
120%
140%
Space Mn. Sq. ft. Growth (%)
Source: Images F&R Research 2008, ICICIdirect.com Research
Penetration in Tier 2 and Tier-3 expected to rise With the approaching saturation of Tier-1 cities and metros and rising competition, retailers are eyeing opening stores in Tier-2, Tier-3 and Tier-4 cities. These cities are plush with high income/high net worth consumers and mall developers are exploiting the potential. Besides the commonly listed Tier-II, Tier-III cities like Indore, Nagpur, Ahmedabad, Pune, Mysore, Kochi, Hyderabad, Sonepat, Lucknow, Ludhiana and Jaipur, there are numerous smaller cities where modern malls are coming up. These non-extinct urban centres that accounted for only 3.57 lakh sq ft of mall space in 2004 are expected to boast of 4.7 crore sq ft of mall space in three years. Organised retailing in small-town India is growing at 50-60% a year compared to the 35-40% growth in the major cities of India. About 200 tier-III cities with a population of less than two million, and another 500 rural towns have the potential to become prominent rural hubs, where organised retailing can effectively set base.
Mall space to reach 350 million sq ft by 2015
3 6 | P a g e
RATING RATIONALE ICICIdirect.com endeavours to provide objective opinions and recommendations. ICICIdirect.com assigns ratings to its stocks according to their notional target price vs. current market price and then categorises them as Outperformer, Performer, Hold, and Underperformer. The performance horizon is two years unless specified and the notional target price is defined as the analysts' valuation for a stock. Strong Buy: 20% or more; Buy: Between 10% and 20%; Add: Up to 10%; Reduce: Up to -10% Sell: -10% or more;
Pankaj Pandey Head – Research [email protected]
ICICIdirect.com Research Desk, ICICI Securities Limited, 7th Floor, Akruti Centre Point, MIDC Main Road, Marol Naka Andheri (East) Mumbai – 400 093
[email protected] ANALYST CERTIFICATION We /I, Bharat Chhoda MBA (Finance) Prerna Jhunjhunwala MBA (Finance) Jehangir Master ACA research analysts, authors and the names subscribed to this report, hereby certify that all of the views expressed in this research report accurately reflect our personal views about any and all of the subject issuer(s) or securities. We also certify that no part of our compensation was, is, or will be directly or indirectly related to the specific recommendation(s) or view(s) in this report. Analysts aren't registered as research analysts by FINRA and might not be an associated person of the ICICI Securities Inc.
Disclosures: ICICI Securities Limited (ICICI Securities) and its affiliates are a full-service, integrated investment banking, investment management and brokerage and financing group. We along with affiliates are leading underwriter of securities and participate in virtually all securities trading markets in India. We and our affiliates have investment banking and other business relationship with a significant percentage of companies covered by our Investment Research Department. Our research professionals provide important input into our investment banking and other business selection processes. ICICI Securities generally prohibits its analysts, persons reporting to analysts and their dependent family members from maintaining a financial interest in the securities or derivatives of any companies that the analysts cover.
The information and opinions in this report have been prepared by ICICI Securities and are subject to change without any notice. The report and information contained herein is strictly confidential and meant solely for the selected recipient and may not be altered in any way, transmitted to, copied or distributed, in part or in whole, to any other person or to the media or reproduced in any form, without prior written consent of ICICI Securities. While we would endeavour to update the information herein on reasonable basis, ICICI Securities, its subsidiaries and associated companies, their directors and employees (“ICICI Securities and affiliates”) are under no obligation to update or keep the information current. Also, there may be regulatory, compliance or other reasons that may prevent ICICI Securities from doing so. Non-rated securities indicate that rating on a particular security has been suspended temporarily and such suspension is in compliance with applicable regulations and/or ICICI Securities policies, in circumstances where ICICI Securities is acting in an advisory capacity to this company, or in certain other circumstances.
This report is based on information obtained from public sources and sources believed to be reliable, but no independent verification has been made nor is its accuracy or completeness guaranteed. This report and information herein is solely for informational purpose and may not be used or considered as an offer document or solicitation of offer to buy or sell or subscribe for securities or other financial instruments. Though disseminated to all the customers simultaneously, not all customers may receive this report at the same time. ICICI Securities will not treat recipients as customers by virtue of their receiving this report. Nothing in this report constitutes investment, legal, accounting and tax advice or a representation that any investment or strategy is suitable or appropriate to your specific circumstances. The securities discussed and opinions expressed in this report may not be suitable for all investors, who must make their own investment decisions, based on their own investment objectives, financial positions and needs of specific recipient. This may not be taken in substitution for the exercise of independent judgement by any recipient. The recipient should independently evaluate the investment risks. The value and return of investment may vary because of changes in interest rates, foreign exchange rates or any other reason. ICICI Securities and affiliates accept no liabilities for any loss or damage of any kind arising out of the use of this report. Past performance is not necessarily a guide to future performance. Investors are advised to see Risk Disclosure Document to understand the risks associated before investing in the securities markets. Actual results may differ materially from those set forth in projections. Forward-looking statements are not predictions and may be subject to change without notice.
ICICI Securities and its affiliates might have managed or co-managed a public offering for the subject company in the preceding twelve months. ICICI Securities and affiliates might have received compensation from the companies mentioned in the report during the period preceding twelve months from the date of this report for services in respect of public offerings, corporate finance, investment banking or other advisory services in a merger or specific transaction. ICICI Securities and affiliates expect to receive compensation from the companies mentioned in the report within a period of three months following the date of publication of the research report for services in respect of public offerings, corporate finance, investment banking or other advisory services in a merger or specific transaction. It is confirmed that Bharat Chhoda MBA (Finance) Prerna Jhunjhunwala MBA (Finance) Jehangir Master ACAresearch analysts and the authors of this report have not received any compensation from the companies mentioned in the report in the preceding twelve months. Our research professionals are paid in part based on the profitability of ICICI Securities, which include earnings from Investment Banking and other business.
ICICI Securities or its subsidiaries collectively do not own 1% or more of the equity securities of the Company mentioned in the report as of the last day of the month preceding the publication of the research report.
It is confirmed that Bharat Chhoda MBA (Finance) Prerna Jhunjhunwala MBA (Finance) Jehangir Master ACAresearch analysts and the authors of this report or any of their family members does not serve as an officer, director or advisory board member of the companies mentioned in the report.
ICICI Securities may have issued other reports that are inconsistent with and reach different conclusion from the information presented in this report. ICICI Securities and affiliates may act upon or make use of information contained in the report prior to the publication thereof.
This report is not directed or intended for distribution to, or use by, any person or entity who is a citizen or resident of or located in any locality, state, country or other jurisdiction, where such distribution, publication, availability or use would be contrary to law, regulation or which would subject ICICI Securities and affiliates to any registration or licensing requirement within such jurisdiction. The securities described herein may or may not be eligible for sale in all jurisdictions or to certain category of investors. Persons in whose possession this document may come are required to inform themselves of and to observe such restriction. This report has not been prepared by ICICI Securities, Inc. However, ICICI Securities, Inc. has reviewed the report and, in so far as it includes current or historical information, it is believed to be reliable, although its accuracy and completeness cannot be guaranteed.