royal orchid hotels ltd · royal orchid hotels ltd investor presentation ... marriott renaissance,...
TRANSCRIPT


Royal Orchid Hotels Ltd Q4FY17 & FY17
Results Presentation
Expect more from Royal Orchid Hotels
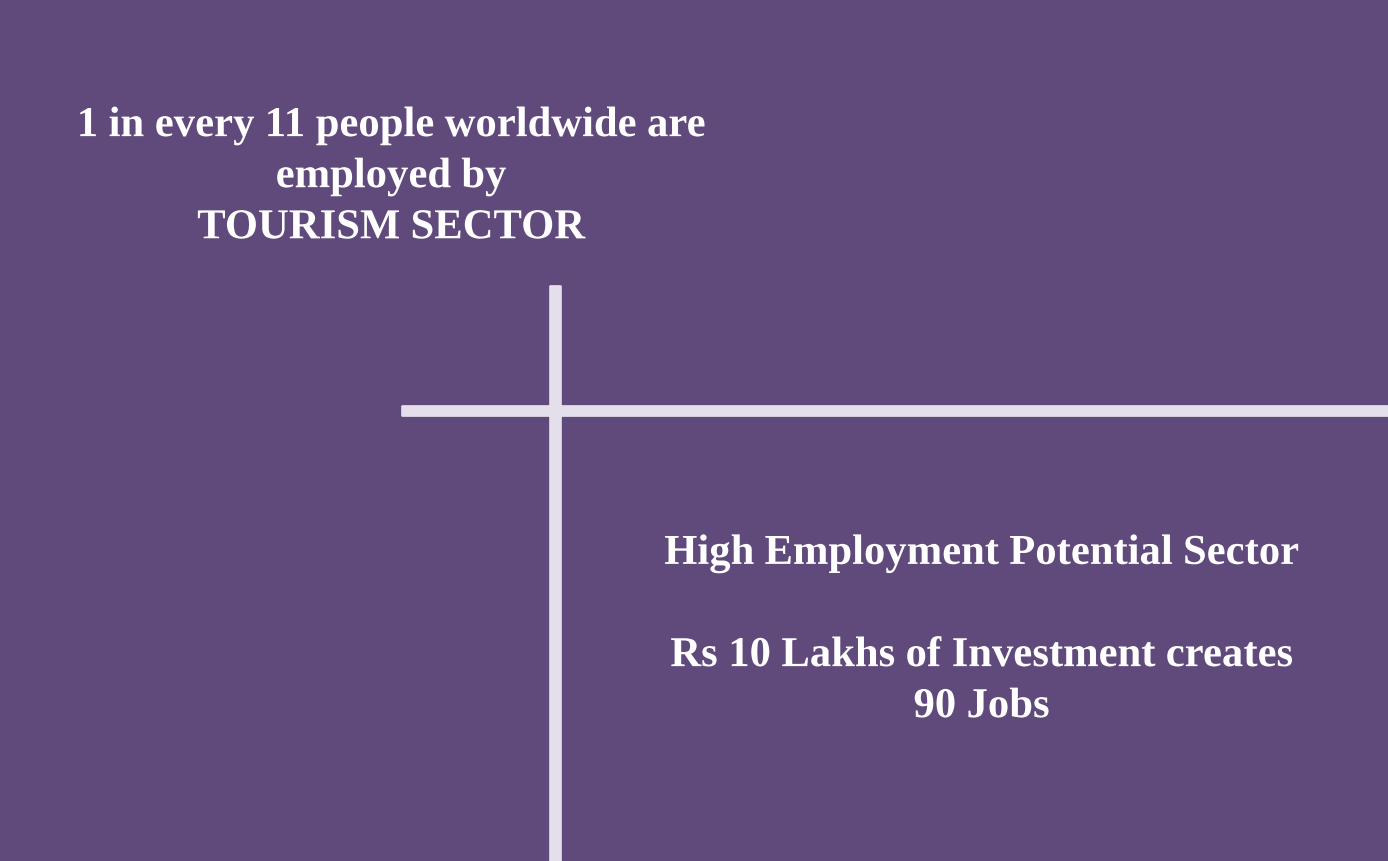
1 in every 11 people worldwide are
employed by
TOURISM SECTOR
High Employment Potential Sector
Rs 10 Lakhs of Investment creates
90 Jobs

HOSPITALITY & TOURISM
is the largest contributor to GDP in
service sector

ROYAL ORCHID HOTELS LTD Investor Presentation
FY17 Results

Discussion Outline
• Background, Management
• Competitive Advantages
ROHL BUSINESS CARD
• Asset Light Model,
• Generate FCF, High Growth
BUSINESS MODEL
• Q4 FY17 Results
• Performance Highlights
• FY17 Balance sheet and P & L
statements
FINANCIAL NUMBERS
1
2
3
4
• Size, Opportunity,
• Challenges
THE TOURISM & HOSPITALITY
INDUSTRY

Indian Tourism Sector
According to the World Travel & Tourism Council’s Economic Impact 2016 – India report, the total
contribution of Travel and tourism to the GDP was Rs 8,309 billion (6.3% of the GDP) in 2015. This is
expected to grow by 7.3% to Rs 8,913.6 billion in 2016 and eventually reach Rs 18,362.2 billion (7.2%
of the GDP) by 2026.
Domestic
Travelers
99%
Foreign
Travelers
1%
Leisure
Spending
83%
Business
Spending
17%
Government to facilitate 36 more countries for E-Tourist Visa in India
Source: Company

Huge Opportunity for Branded Hotels
Current Inventory – 1,13,622 rooms
Expected Inventory – 56,912 new rooms (Branded Hotels)
2036 3154
11799
7787
14035
5323
1322
5596 6262 5040 2701
13054
6287
29226
2658 4392
17008
10099
16827
7282 3883
7658 8726 6000 5910
17220
8252
54619
0
10000
20000
30000
40000
50000
60000
Agra Ahmedabad Bengaluru Chennai New Delhi Gurgaon Noida Goa Hyderabad Jaipur Kolkota Mumbai Pune Others
2015/16 2020/21
Factors Driving Growth
Government Spending on Infra
E- VISA facility
Raising Middle Class Income
Growth in Business Travelers
Booking convenience by Aggregators
Growth in Low cost Airlines
Government allocation of Rs 159 crs to develop Infrastructure,
attracts tourism
E- Tourist Visa facility for 150 countries
International Tourist Arrivals (ITA) grew by 4.2% in 2015 with
CAGR of 6.2% in last 5 years
Government cap of Rs 2,500 fare for one hour flights since June
2016
Source: Company

Supply Exceeded Demand
Supply
Demand
Occupancy
ARR
407 462 551 717 814 872 887
60%
61%
59%
58% 58%
60%
63%
54%
56%
58%
60%
62%
64%
0
200
400
600
800
1000
2010 2011 2012 2013 2014 2015 2016
No of Hotels Occupancy Rate
Supply exceeded
demand leading to
drop in occupancy
and lower room
rates
Branded Hotels
Source: HVS research

Hotel Industry – Scalability Issues
Brand drives Loyal customers membership which is key to profits
Strong brand spends, need scale to justify. Scale needs a strong brand
Quality of management at the hotel also a brand differentiator BRAND
CAPITAL
INTENSIVE
ARR
&
OCCUPANCY
High Capital intensive business
A typical 70 rooms hotel requires min cap-ex of Rs 675 mn– Rs 950 mn for
refurbishment/interiors
Op-ex includes establishment, employee and food & beverages, all upfront
costs
Given the nature of business, it is still price sensitive
Pricing and Quality of service a key driver for loyal customers
All the other hotels give similar look and feel and service quality. This is where
brand plays an important role
Strong brand along with competitive room rates leads to higher occupancy

Discussion Outline
• Background, Management
• Competitive Advantages
ROHL BUSINESS CARD
• Asset Light Model,
• Generate FCF, High Growth
BUSINESS MODEL
• Q4 FY17 Results
• Performance Highlights
• FY17 Balance sheet and P & L
statements
FINANCIAL NUMBERS
1
2
3
4
• Size, Opportunity,
• Challenges
THE TOURISM & HOSPITALITY
INDUSTRY

ROHL – Business Card
• Royal Orchid Hotel Ltd was incorporated in 1986 under the
name of Universal Resorts Ltd.
• Promoted by Mr. Chander Baljee, Managing Director
• Engaged in business of Managing Hotels with turnover of
Rs 162 crs as on FY17.
• Operates under flagship brands – Royal Orchid, Royal
Orchid Central, Royal orchid Suites, Regenta Hotel &
Royal Orchid Inn
As on 31st May 2017 Units
CMP (Rs) 103.00
Market Cap (Rs cr) 280.51
MCap Free Float (Rs cr) 81.35
52 week high (Rs) 120.00
52 week low (Rs) 60.75
Face Value (Rs) 10
Promoter Holding 70.77%
5 Star
Hotel Royal Orchid
4 Star
• Royal Orchid Central
• Regenta Hotels
- Regenta Central
- Regenta Resorts
Service Apartment
Royal Orchid
Suites
Budget Hotel
Regenta Inn

Journey so far…
2001
Hotel Royal
Orchid Bangalore
2003
Royal Orchid Central
Bangalore
2004
Royal Orchid
Metropole, Mysore
2006
Listed on 6th February
Royal Orchid Resort &
Convention Centre, Bangalore
2007
Royal Orchid Golden Suites, Pune
Royal Orchid Central, Jaipur
Royal Orchid Brindavan, Mysore
Nationwide Sales Offices
2009
2010
Royal Orchid Suites, Bangalore
Royal Orchid Central, Ahmedabad
2011
Royal Orchid Central,
Grazia, Navi Mumbai
Royal Orchid Central
Kireeti, Hospet
2012
Royal Orchid Central, Shimoga &
Vadodara
Royal Orchid Resort, Mussorie
Royal Orchid, Jaipur
Central Blue stone, Gurgaon
2013
Regenta MPG Club,
Mahabaleshwar
Regenta Central Ashok,
Chandigarh
2008
Royal Orchid Central, Pune
Royal Orchid Beach Resort & Spa,
GOA
Regenta Central, Jaipur
Regenta Central
Harimangla, Bharuch
Malaika Beach resort,
Tanzania
2014
Regenta, Ahmedabad
Regenta Resort, Bhuj
Regenta Central, Rajkot
Regenta Orko’s Haridwar
Hotel Royal Orchid,
Nairobi
2015
Regenta Al-meida ,
Chandigarh
Regenta Orko’s Kolkata
Regenta Central Jhotwara,
Jaipur
Regenta Camellia Resort &
Spa, Shantinekhetan
2016
Regenta Central, Amritsar
Regenta Inn, Bangalore
Regenta Resort Century, Dandeli
Regenta Resort Varca Beach, Goa
Regenta Resort Vanyamahal,
Ranthambore
Regenta Central Deccan, Chennai
Regenta Resort Tarika, Jim
Corbett
2017
Regenta Central Larika
Kolkata
Regenta Central, Vadodara
Regenta Inn Embassy, Ajmer
Regenta Central Klassik,
Ludhiana
Regenta Central Antarim,
Ahmedabad
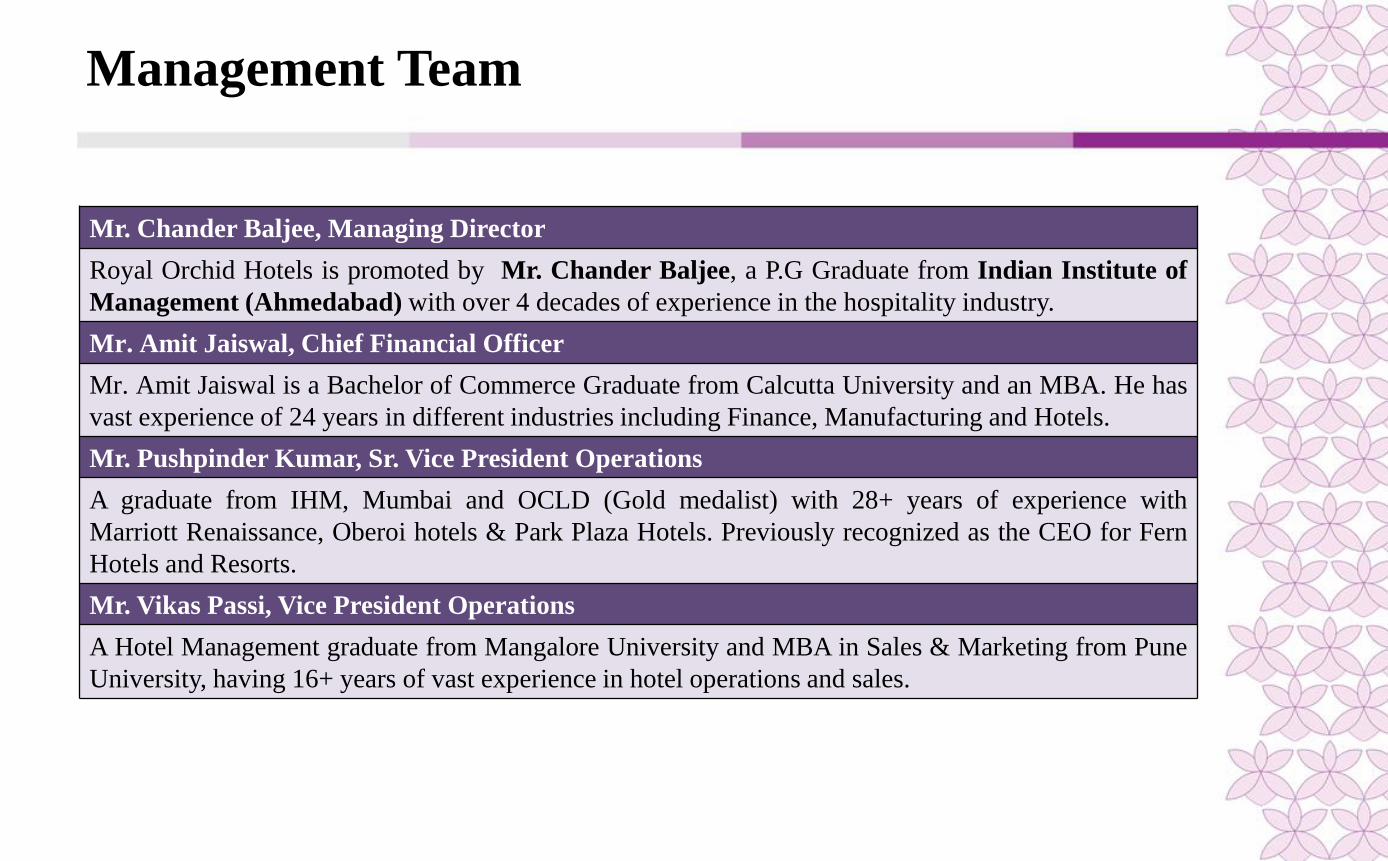
Management Team
Mr. Chander Baljee, Managing Director
Royal Orchid Hotels is promoted by Mr. Chander Baljee, a P.G Graduate from Indian Institute of
Management (Ahmedabad) with over 4 decades of experience in the hospitality industry.
Mr. Amit Jaiswal, Chief Financial Officer
Mr. Amit Jaiswal is a Bachelor of Commerce Graduate from Calcutta University and an MBA. He has
vast experience of 24 years in different industries including Finance, Manufacturing and Hotels.
Mr. Pushpinder Kumar, Sr. Vice President Operations
A graduate from IHM, Mumbai and OCLD (Gold medalist) with 28+ years of experience with
Marriott Renaissance, Oberoi hotels & Park Plaza Hotels. Previously recognized as the CEO for Fern
Hotels and Resorts.
Mr. Vikas Passi, Vice President Operations
A Hotel Management graduate from Mangalore University and MBA in Sales & Marketing from Pune
University, having 16+ years of vast experience in hotel operations and sales.

Discussion Outline
• Background, Management
• Competitive Advantages
ROHL BUSINESS CARD
• Size, Opportunity,
• Challenges
THE TOURISM & HOSPITALITY
INDUSTRY
• Asset Light Model,
• Generate FCF, High Growth
BUSINESS MODEL
• Q2 FY17 Results
• Performance Highlights
• Balance sheet and P & L
statements
FINANCIAL NUMBERS
1
2
3
4

Asset Light Model – Generate FCF
ROYAL ORCHID BUSINESS
MODEL VALIDATION
• Most of the other hotels are present in Metro
cities.
• ROHL has demonstrated the scalability of
keys by establishing its presence in Tier I &
Tier II cities.
• ROHL will continue to bring Luxury rooms
at lower rates across country.
Present in 28 cities
10 states with
3,159 no of Keys
1.33 Lakh Royal reward
members.
PAN INDIA PRESENCE
Business Model MC JV Owned Leased Total
5-Star Royal Orchid 129 139 195 - 463
4-Star Central 1,431 130 - 268 1,829
Resort/ Heritage 393 73 - 188 654
Convention /MICE - 54 - - 54
Serviced Apartments 159 - - - 159
Total Keys 2,112 396 195 456 3,159
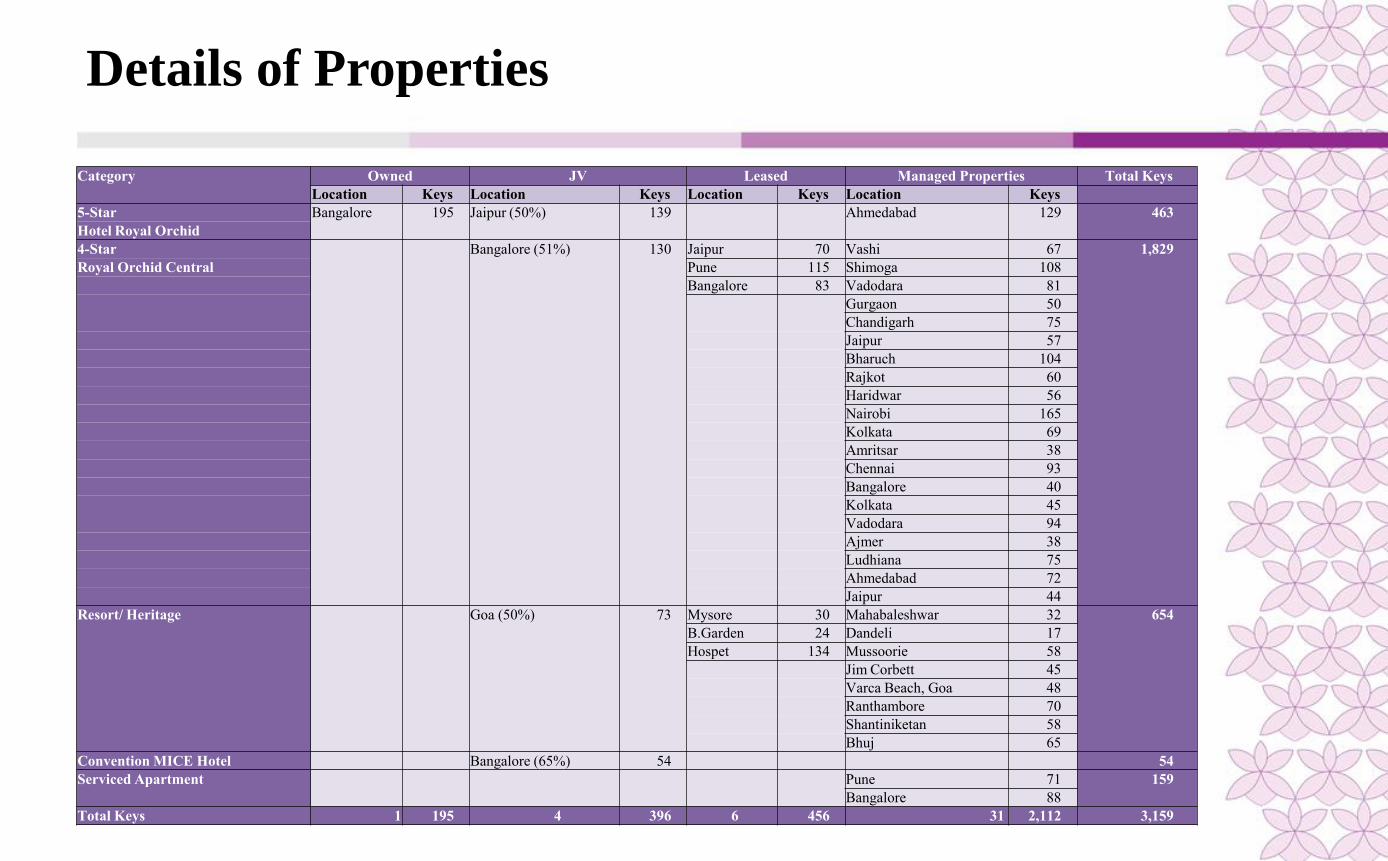
Details of Properties
Category Owned JV Leased Managed Properties Total Keys
Location Keys Location Keys Location Keys Location Keys
5-Star Bangalore 195 Jaipur (50%) 139 Ahmedabad 129 463
Hotel Royal Orchid
4-Star Bangalore (51%) 130 Jaipur 70 Vashi 67 1,829
Royal Orchid Central Pune 115 Shimoga 108
Bangalore 83 Vadodara 81
Gurgaon 50
Chandigarh 75
Jaipur 57
Bharuch 104
Rajkot 60
Haridwar 56
Nairobi 165
Kolkata 69
Amritsar 38
Chennai 93
Bangalore 40
Kolkata 45
Vadodara 94
Ajmer 38
Ludhiana 75
Ahmedabad 72
Jaipur 44
Resort/ Heritage Goa (50%) 73 Mysore 30 Mahabaleshwar 32 654
B.Garden 24 Dandeli 17
Hospet 134 Mussoorie 58
Jim Corbett 45
Varca Beach, Goa 48
Ranthambore 70
Shantiniketan 58
Bhuj 65
Convention MICE Hotel Bangalore (65%) 54 54
Serviced Apartment Pune 71 159
Bangalore 88
Total Keys 1 195 4 396 6 456 31 2,112 3,159
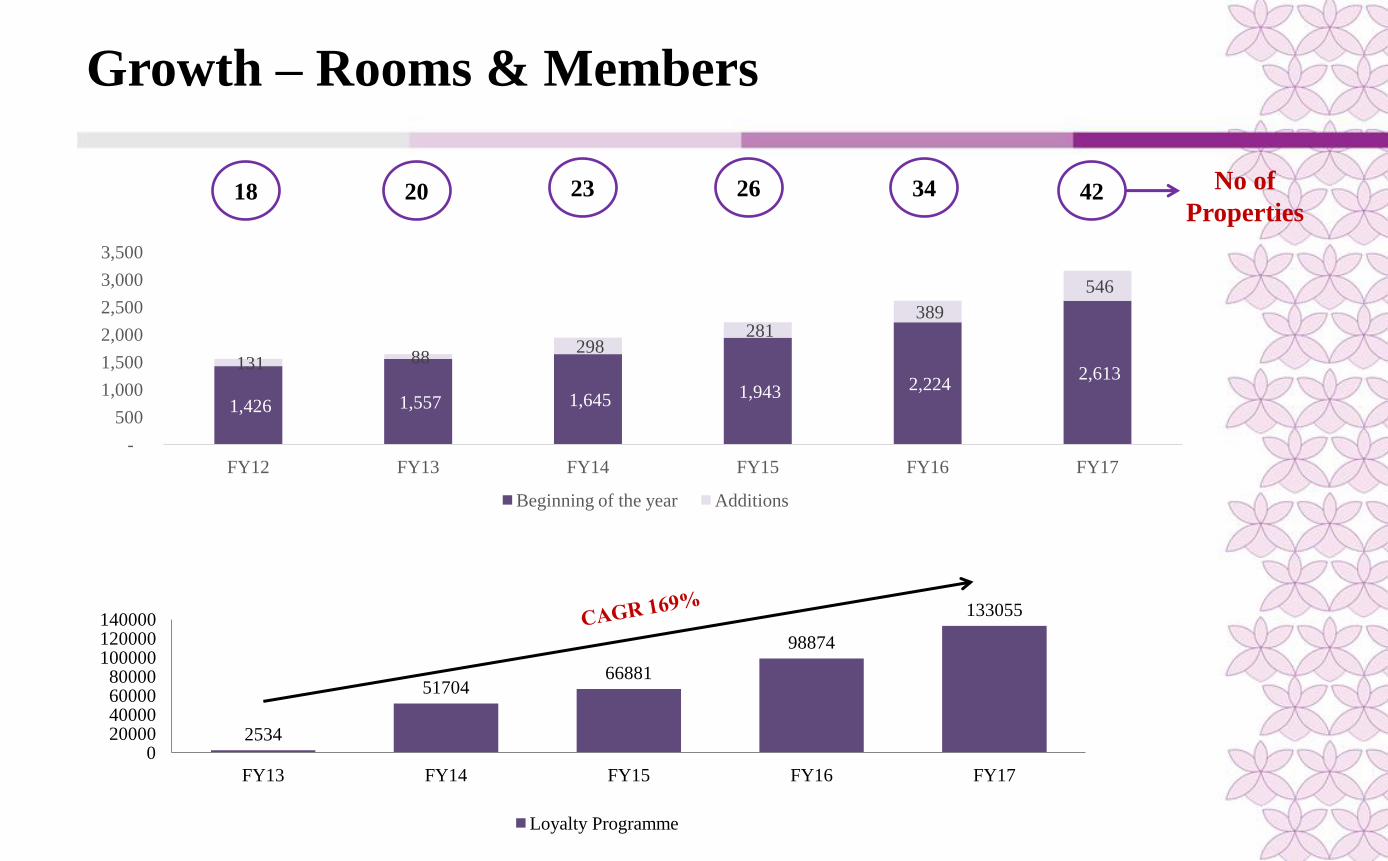
Growth – Rooms & Members
18 20 23 26 34 No of
Properties
2534
51704 66881
98874
133055
0 20000 40000 60000 80000
100000 120000 140000
FY13 FY14 FY15 FY16 FY17
Loyalty Programme
42
1,426 1,557 1,645 1,943 2,224 2,613
131 88 298
281 389
546
-
500
1,000
1,500
2,000
2,500
3,000
3,500
FY12 FY13 FY14 FY15 FY16 FY17
Beginning of the year Additions

High Growth – Focusing on Management Contracts
Adding No of Keys FY16 FY17
Management Contracts 1,738 2,112
JV 396 396
Owned (Domestic) 195 195
Owned (Overseas) - -
Leased 456 456
Total KEYS 2,785 3,159
Average Occupancy rate 65% 65%
Average Room Rate (Rs) 3200 3,219
No up front Capex required for Management Contracts model
Maintenance Capex required – Rs 1.5 to 2 crores
Break even of Operating profit in just 1 year

Discussion Outline
• Background, Management
• Competitive Advantages
ROHL BUSINESS CARD
• Size, Opportunity,
• Challenges
THE TOURISM & HOSPITALITY
INDUSTRY
• Asset Light Model,
• Generate FCF, High Growth
BUSINESS MODEL
• Q4 FY17 Results
• Performance Highlights
• FY17 Balance sheet and P & L
statements
FINANCIAL NUMBERS
1
2
3
4

Consolidated Results – Q4 FY17
Particulars (Rs in crs) Q4 FY17 Q3 FY17 Q-o-Q % Q4 FY16 Y-oY %
Income from Operations 44.23 42.33 4% 41.68 6%
Other Income 2.06 2.57 -25% 3.60 -43%
Total Income 46.29 44.90 3% 45.28 2%
Cost of Material Consumed 5.14 5.11 1% 5.37 -4%
Employee Benefits Expense 10.38 8.88 14% 7.47 39%
Rent Expense 3.12 3.45 -11% 3.87 -20%
Power & Fuel 3.87 3.41 12% 4.30 -10%
Other Expenses 15.40 12.32 20% 14.51 6%
Total Expense 37.91 33.17 13% 35.52 7%
EBITDA 8.38 11.73 -40% 9.76 -14%
EBITDA Margin (%) 18% 26% -44% 22% -16%
Depreciation 3.21 3.38 -5% 3.85 -16%
EBIT 5.17 8.35 -62% 5.91 -13%
Finance Cost 3.21 3.54 -10% 4.01 -20%
PBT 1.96 4.81 -145% 1.90 3%
Tax 0.06 0.48 -706% 0.30 -80%
Net Profit/Loss 1.90 4.33 -128% 1.60 19%
Minority Interest 0.05 0.01 79% 0.12 -61%
Net Profit/Loss After Minority Interest 1.85 4.32 -133% 1.48 25%

Standalone Results – Q4 FY17
Particulars (Rs in crs) Q4 FY17 Q3 FY17 Q-o-Q % Q4 FY16 Y-oY %
Income from Operations 24.80 22.13 12% 24.20 2%
Other Income 1.71 2.92 -41% 2.28 -25%
Total Income 26.51 25.05 6% 26.48 0%
Cost of Material Consumed 3.03 2.89 5% 3.14 -4%
Employee Benefits Expense 5.34 4.29 25% 3.76 42%
Rent Expense 1.87 2.21 -15% 2.63 -29%
Power & Fuel 2.44 1.94 26% 2.80 -13%
Other Expenses 7.90 6.80 16% 8.06 -2%
Total Expense 20.58 18.13 14% 20.39 1%
EBITDA 5.93 6.92 -14% 6.09 -3%
EBITDA Margin (%) 22% 28% -20% 23% -3%
Depreciation 0.96 1.14 -16% 1.44 -33%
EBIT 4.97 5.78 -14% 4.65 7%
Finance Cost 1.58 1.55 2% 1.61 -2%
PBT 3.39 4.23 -20% 3.04 12%
Tax 0.04 - - - -
Net Profit/(Loss ) 3.35 4.23 -21% 3.04 10%
NPM (%) 13% 17% -26% 11% 10%

Consolidated Results – FY17
Particulars (Rs in crs) FY17 FY16 % Change
Income from Operations 162.53 158.53 3%
Other Income 7.06 5.68 24%
Total Income 169.59 164.21 3%
Cost of Material Consumed 20.23 20.75 -2%
Employee Benefits Expense 38.66 36.77 5%
Rent Expense 14.59 15.15 -4%
Power & Fuel 15.99 15.38 4%
Other Expenses 52.66 50.14 5%
Total Expense 142.13 138.19 3%
EBITDA 27.46 26.02 6%
EBITDA Margin (%) 16% 16% 2%
Depreciation 13.11 13.90 -6%
EBIT 14.35 12.12 18%
Finance Cost 12.16 14.92 -19%
PBT 2.19 -2.80 -178%
Tax 0.78 0.84 -7%
Net Profit/Loss 1.41 -3.64 -139%
Minority Interest -1.05 -2.34 -55%
Net Profit/Loss After Minority Interest 2.46 -1.30 -289%

Consolidated Balance Sheet
Particulars (Rs in crs) FY17 FY16 FY15
Sources of Funds
Share Capital 27.23 27.23 27.23
Reserves & Surplus 136.35 132.59 135.44
Total Networth 163.58 159.82 162.67
Minority Interest 27.98 36.55 34.43
Secured Loan and other non current liabilities 89.61 69.73 74.48
Total Non-current liabilities 89.61 106.28 108.91
Current Liabilities 71.65 76.27 74.19
Total Sources of Funds 352.82 342.37 345.77
Application of Funds
Fixed Assets
Tangible Assets 213.49 220.33 230.41
Intangible Assets 0.88 0.05 0.09
CWIP 24.02 21.98 19.68
Goodwill (on consolidation) 17.74 17.75 17.75
Loans & Advances 47.89 45.47 38.68
Non Current Investments 2.25 0.02 0.02
Total Current Assets 49.66 36.77 39.14
Total Application of Funds 352.82 342.37 345.77

Standalone Results – FY17
Particulars (Rs in crs) FY17 FY16 % Change
Income from Operations 91.31 87.85 4%
Other Income 8.25 6.93 19%
Total Income 99.56 94.78 5%
Cost of Material Consumed 11.78 12.04 -2%
Employee Benefits Expense 19.28 18.35 5%
Rent Expense 9.65 10.31 -6%
Power & Fuel 9.97 9.59 4%
Other Expenses 28.65 26.90 7%
Total Expense 79.33 77.19 3%
EBITDA 20.23 17.59 15%
EBITDA Margin (%) 20% 19% 9%
Depreciation 4.25 4.00 6%
EBIT 15.98 13.59 18%
Finance Cost 6.02 6.11 -1%
PBT 9.96 7.48 33%
Tax 0.04 - -
Net Profit/Loss 9.92 7.48 33%

Standalone Balance Sheet
Particulars (Rs in crs) FY17 FY16 FY15
Sources of Funds
Share Capital 27.23 27.23 27.23
Reserves & Surplus 173.76 167.14 159.65
Total Networth 200.99 194.37 186.88
Secured Loan and other non current liabilities 47.47 37.19 37.80
Total Non-current liabilities 47.47 37.19 37.80
Current Liabilities 32.73 36.63 34.54
Total Sources of Funds 281.19 268.19 259.22
Application of Funds
Fixed Assets
Tangible Assets 37.29 33.77 32.90
CWIP - 1.69 1.81
Loans & Advances 47.29 48.55 44.33
Non Current Investments 168.17 162.92 154.70
Total Current Assets 28.44 21.26 25.48
Total Application of Funds 281.19 268.19 259.22

Thank You
For further information, please contact:
Company: Investor Relations Advisors:
Royal Orchid Hotels Ltd Adfactors PR
Mr. Amit Jaiswal Mr. Ricky Vora
[email protected] [email protected]
+919833097776