rosemary biodiversity
TRANSCRIPT
Role of topography in facilitating coexistence of trees
and grasses within savannas
Yeonjoo Kim and Elfatih A. B. Eltahir
Ralph M. Parsons Laboratory, Massachusetts Institute of Technology, Cambridge, Massachusetts, USA
Received 10 August 2003; revised 1 April 2004; accepted 8 April 2004; published 28 July 2004.
[1] The factors and processes that may explain the observed coexistence of trees andgrasses in savannas are not well understood. Here we propose a new hypothesis thataddresses this issue. We hypothesize that ‘‘variations in elevation at relatively shorthorizontal scales of �1 km force similar variations in soil moisture and thus createsignificantly different hydrologic niches within any large area. Under water-limitedconditions the relatively wet valleys favor trees, while the relatively dry hills favor grasses.This coexistence of trees and grasses is only possible for a window of climatic conditionsthat are characteristic of savannas.’’ To test this hypothesis, numerical simulations areperformed for the region of West Africa using a model that simulates vegetation dynamics,the Integrated Biosphere Simulator (IBIS), and a distributed hydrologic model, SystemeHydrologique Europeen (SHE). IBIS is modified to include the groundwater table(GWT) as a lower boundary. The spatial distribution of GWT is simulated by SHE. At 9�Nthe model simulates trees even when the GWT is assumed to be infinitely deep; at 13�Nthe model simulates grasses even when the capillary fringe of the GWT reaches thesurface. However, for the transitional climate, at 11�N, trees are simulated when the GWTis at �2.5 m from the surface, but grasses are simulated when the GWT is deeper than2.5 m. These results suggest that the variability of soil moisture forced by topography canbe a determinant factor of vegetation distribution within savannas. Furthermore, theyconfirm that this role of topography can be significant only in a certain climatic windowcharacteristic of savannas. INDEX TERMS: 1851 Hydrology: Plant ecology; 1719 History of
Geophysics: Hydrology; 1833 Hydrology: Hydroclimatology; KEYWORDS: coexistence, savannas,
topography, West Africa
Citation: Kim, Y., and E. A. B. Eltahir (2004), Role of topography in facilitating coexistence of trees and grasses within savannas,
Water Resour. Res., 40, W07505, doi:10.1029/2003WR002578.
1. Introduction
[2] Savanna ecosystems, a mixture of trees and grasses,constitute one of the world’s major biomes and occupy�20% of the land surface. They are defined as tropical ornear-tropical ecosystems with a continuous herbaceousgrass layer and a discontinuous layer of trees and/or shrubs[Skarpe, 1992]. Savannas often occupy the buffer zonebetween the equatorial forests and the midlatitude deserts.Their ecology is neither that of grassland nor that of a forest[Scholes and Walker, 1993]. The complex interaction oftrees and grasses shapes their ecological characteristics, andtheir coexistence still remains not fully understood.[3] In the classical description of how dominant vegeta-
tion types are selected, one plant type becomes dominantwhen it outcompetes the others over the same resources(light, water, and nutrients). In savannas, however, twocompetitors, trees and grasses, often coexist under the sameclimatic conditions. Here we are interested in defining whatconditions allow them to survive together. There are twogeneral theories on savannas, which are described here asequilibrium and disequilibrium theories.
[4] The equilibrium theory suggests that the coexistenceof different vegetation types is dynamically stable. Differentspecies compete for water, light, and nutrients, and then anequilibrium is achieved in savannas, as it is elsewhere. Thefocus is on the water-limited arid and semiarid savannas.Walter [1971] hypothesizes that water availability is thedeterminant factor for semiarid savannas. While grassesonly exploit the shallow soil moisture, trees and shrubscan access the soil water of the deep soil as well as that ofthe shallow soil. Hence the two plant types coexist byexploiting two different reservoirs of water. On the basisof Walter’s hypothesis, several models have been developedto describe savannas. Walker et al. [1981] developed ananalytical model that illustrates this hypothesis and shows astable equilibrium characterized by a mixture of trees andgrasses. Roots of grasses are restricted to shallow soillayers, so they have priority in exploiting soil water fromshallow soils. Trees extend their roots to shallow and deepsoil layers, but they are outcompeted by grasses in thesurface soil. Consequently, grasses utilize the soil waterfrom the surface soil, and trees utilize the water from thedeep soil. As a result, trees and grasses coexist in savannas.[5] Eagleson and Segarra [1985] bring a second dimen-
sion to this discussion. They emphasize the competition oftrees and grasses for light as well as water. They assume that
Copyright 2004 by the American Geophysical Union.0043-1397/04/2003WR002578$09.00
W07505
WATER RESOURCES RESEARCH, VOL. 40, W07505, doi:10.1029/2003WR002578, 2004
1 of 13
trees have an advantage in their access to light compared tograsses. Trees only use water from the deep soil that grassescannot use. However, trees limit the water use of grasses byshading them from the solar radiation. Their two-layermodel simulates three equilibrium states, according tospecified parameters, which are forests, grasslands, andsavannas. They show that savannas are only one ecosystem,stable to perturbations such as fires.[6] Most of the above discussion focused on competition
in the vertical dimension. Recently, Rodriguez-Iturbe et al.[1999] developed a new model to address the role ofhorizontal spatial dynamics in facilitating coexistence oftrees and grasses. Their model has been tested for thesavanna climate of Nylsvley in South Africa. They arguethat the spatial competition, in the horizontal direction, onwater must be included in order to explain the coexistenceof trees and grasses. The model allows horizontal compe-tition between trees and grasses and between trees them-selves or grasses themselves. In the model a grid cell isoccupied by a tree or grass. Then, species in neighboringcells can exploit the soil water from the next cell. The waterstress corresponding to the canopy densities of trees andgrasses is described explicitly while allowing their spatialcompetition for soil moisture. The results show that amixture of trees and grasses exists under a minimum waterstress, i.e., the optimal condition.[7] In a different approach to the study of savanna the
disequilibrium theory suggests that disturbance mechanismssuch as fires and climate fluctuations play a significant rolein facilitating the coexistence of trees and grasses. Distur-bance mechanisms prevent savannas from developing into asimpler ecosystem such as grassland or forest. Fires,droughts, and grazings are disturbances forced from outsidethe ecosystem [Skarpe, 1992; Scholes and Walker, 1993;Bourliere and Hadley, 1983]. For example, Skarpe [1992,p. 293] argues that ‘‘Most savannas, particularly Africanones, are believed to owe their existence more to the impactof fire and large herbivores than to climate, and these factorsseem largely to determine the boundary between savannaand forest.’’[8] Scholes and Walker [1993] performed a field exper-
iment at the savannas of Nylsvley in South Africa. Frommeasurements in the broad-leafed savanna they found thatthe grass roots use subsoil water as efficiently as tree rootsand that tree roots dried out the topsoil as much as grassroots alone. Therefore the competition for the availablewater is not important in shaping savannas. Instead, theyargue that savannas are shaped by fires, droughts, herbi-vores, frost, lightning, and wind.
2. Hypothesis
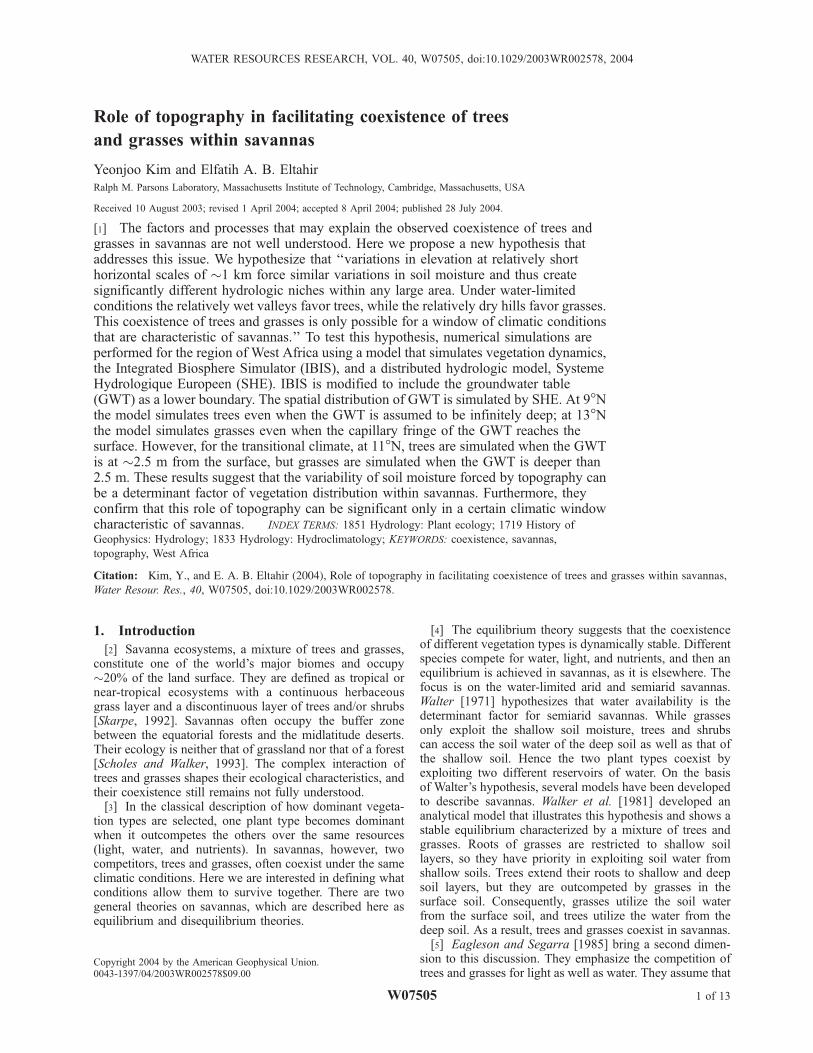
[9] To describe how trees and grasses coexist in savan-nas, we propose a different hypothesis. Our hypothesisstates that ‘‘variations in elevation at relatively short hori-zontal scales (�1 km) force similar variations in soilmoisture and thus create significantly different hydrologicniches within any large area. Under water-limited conditionsthe relatively wet valleys favor trees, while the relativelydry hills favor grasses. This coexistence of trees and grassesis only possible for a window of climatic conditions that arecharacteristic of savannas’’ (see Figure 1).
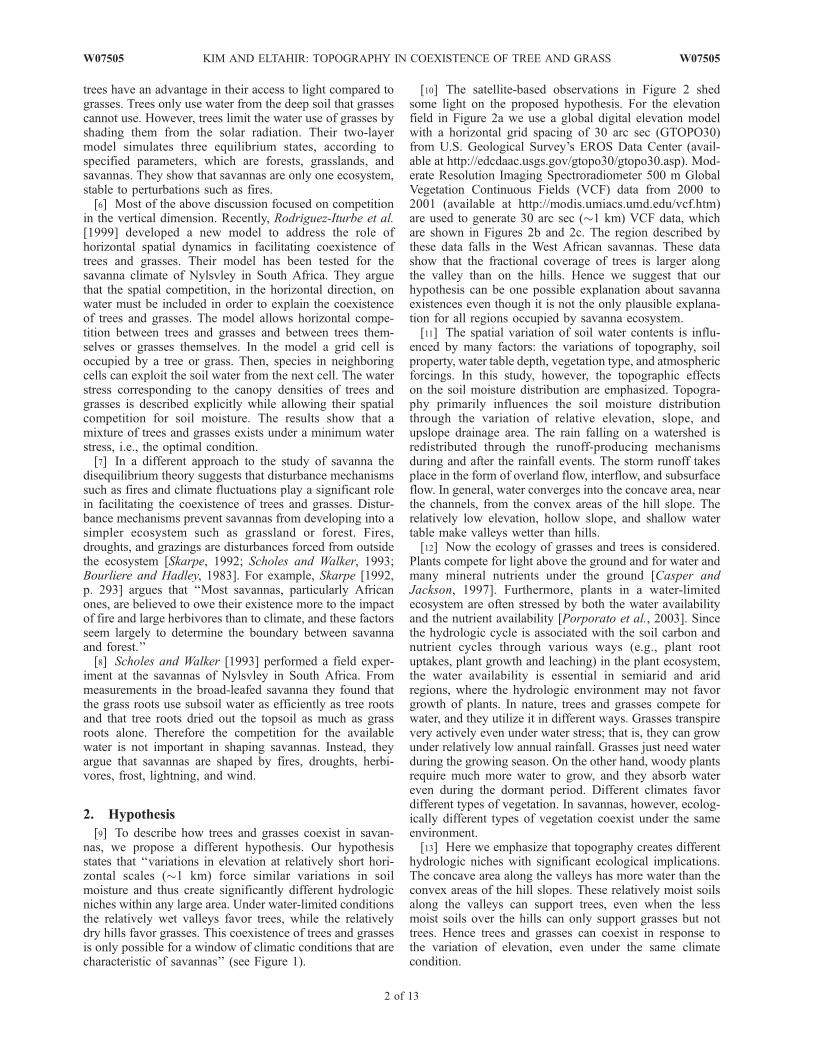
[10] The satellite-based observations in Figure 2 shedsome light on the proposed hypothesis. For the elevationfield in Figure 2a we use a global digital elevation modelwith a horizontal grid spacing of 30 arc sec (GTOPO30)from U.S. Geological Survey’s EROS Data Center (avail-able at http://edcdaac.usgs.gov/gtopo30/gtopo30.asp). Mod-erate Resolution Imaging Spectroradiometer 500 m GlobalVegetation Continuous Fields (VCF) data from 2000 to2001 (available at http://modis.umiacs.umd.edu/vcf.htm)are used to generate 30 arc sec (�1 km) VCF data, whichare shown in Figures 2b and 2c. The region described bythese data falls in the West African savannas. These datashow that the fractional coverage of trees is larger alongthe valley than on the hills. Hence we suggest that ourhypothesis can be one possible explanation about savannaexistences even though it is not the only plausible explana-tion for all regions occupied by savanna ecosystem.[11] The spatial variation of soil water contents is influ-
enced by many factors: the variations of topography, soilproperty, water table depth, vegetation type, and atmosphericforcings. In this study, however, the topographic effectson the soil moisture distribution are emphasized. Topogra-phy primarily influences the soil moisture distributionthrough the variation of relative elevation, slope, andupslope drainage area. The rain falling on a watershed isredistributed through the runoff-producing mechanismsduring and after the rainfall events. The storm runoff takesplace in the form of overland flow, interflow, and subsurfaceflow. In general, water converges into the concave area, nearthe channels, from the convex areas of the hill slope. Therelatively low elevation, hollow slope, and shallow watertable make valleys wetter than hills.[12] Now the ecology of grasses and trees is considered.
Plants compete for light above the ground and for water andmany mineral nutrients under the ground [Casper andJackson, 1997]. Furthermore, plants in a water-limitedecosystem are often stressed by both the water availabilityand the nutrient availability [Porporato et al., 2003]. Sincethe hydrologic cycle is associated with the soil carbon andnutrient cycles through various ways (e.g., plant rootuptakes, plant growth and leaching) in the plant ecosystem,the water availability is essential in semiarid and aridregions, where the hydrologic environment may not favorgrowth of plants. In nature, trees and grasses compete forwater, and they utilize it in different ways. Grasses transpirevery actively even under water stress; that is, they can growunder relatively low annual rainfall. Grasses just need waterduring the growing season. On the other hand, woody plantsrequire much more water to grow, and they absorb watereven during the dormant period. Different climates favordifferent types of vegetation. In savannas, however, ecolog-ically different types of vegetation coexist under the sameenvironment.[13] Here we emphasize that topography creates different
hydrologic niches with significant ecological implications.The concave area along the valleys has more water than theconvex areas of the hill slopes. These relatively moist soilsalong the valleys can support trees, even when the lessmoist soils over the hills can only support grasses but nottrees. Hence trees and grasses can coexist in response tothe variation of elevation, even under the same climatecondition.
2 of 13
W07505 KIM AND ELTAHIR: TOPOGRAPHY IN COEXISTENCE OF TREE AND GRASS W07505
[14] Jeltsch et al. [2000] proposed a unifying theory oflong-term tree-grass coexistence based on the concept ofecological buffering mechanisms. They focused on theboundaries of savanna and investigated the mechanisms
that allow savanna to persist in the critical situations wherethe system is driven to its boundaries, e.g., pure grasslandsor forests. Fire and browsers were suggested by Jeltsch etal. [2000] as the main mechanisms preventing savanna from
Figure 1. Schematic illustration of new hypothesis, presenting that variations in elevation can facilitatethe coexistence only for a window of climate conditions that are characteristic of savannas.
Figure 2. Geographic distribution of (a) topography, (b) tree fractional coverage, and (c) herbaceousfractional coverage in a region (4.0917�–3.7583�W and 8.3417�–8.5917�N) of West African savannas.
W07505 KIM AND ELTAHIR: TOPOGRAPHY IN COEXISTENCE OF TREE AND GRASS
3 of 13
W07505
developing into forests. This process has been illustrated byWang and Eltahir [2000a] using a modeling approach.Jeltsch et al. [2000] also discussed the concept of micrositesfavoring tree establishment and survival as a bufferingmechanism that prevents savanna from developing intograsslands. The hypothesis presented in this paper is con-sistent with this concept of microsites and emphasizes therole of topography in creating these microsites or niches.
3. Study Area
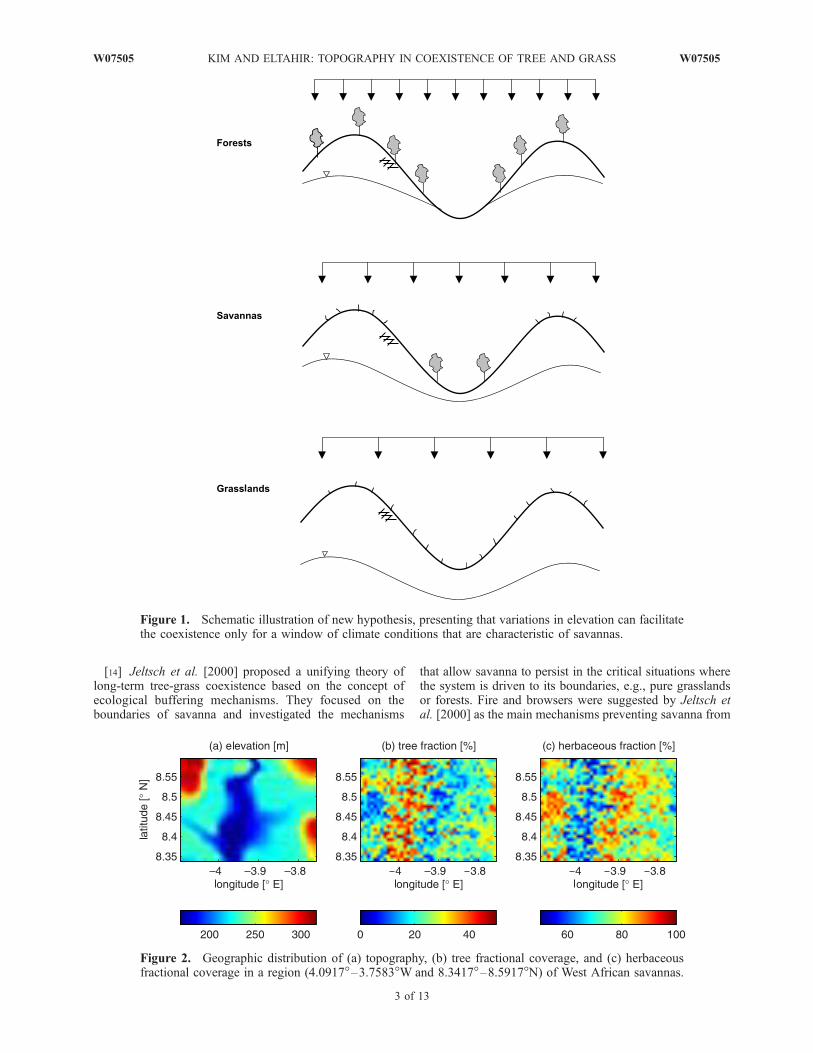
[15] In this paper, we focus on West African savannas.West Africa is defined here as the region between the Saharadesert to the north and the Atlantic coast to the south,between 15�W and 15�E. Savannas occupy wide areas ofWest Africa, as seen in Figure 3, roughly located between 7�and 12.5�N [Anderson et al., 1976; Foley et al., 1996].[16] West Africa is located in the tropical climate zone
and falls under the influence of a regional monsoon circu-lation. The annual rainfall exhibits a sharp meridionalgradient ranging from over 2000 mm near the coast to<200 mm at the border of Sahara desert. A weak zonalgradient is observed near the western coast but is absentelsewhere. Moreover, the climate of West Africa has astrong seasonality with a wet summer and a dry winter.Most of the rainfall events are limited to the wet season. Theduration of rainy season also has a meridional gradient,which ranges from �5 months in the coastal region to1 month at the desert margins. The zonal symmetry and theseasonal variability in West Africa are primarily shaped bythe West African monsoon circulation.[17] Climate is the primary factor that determines the
distribution of vegetation. The sharp meridional gradients ofthe important climate variables such as rainfall and temper-ature make the distribution of the dominant vegetation typeroughly parallel to the latitudinal lines. The coastal regionhas access to abundant water and solar radiation, which isenough to support trees, making humid forests the dominantvegetation type. The amount of rainfall decreases north-ward. The area around the desert border is under water
stress. Grasses can survive with relatively less water thantrees since grasses transpire efficiently with shallow roots.Consequently, grasses are the dominant vegetation type inthe north. In other words, the ecosystem changes fromforests at the coastal region to grasslands at the northernedges. Between forests and grasslands, savannas exist as atransitional zone.
4. Models
[18] In this study, we use a biospheric model and adistributed hydrologic model. One experiment is performedonly using the biospheric model, and the other is carried outby asynchronous coupling of the biospheric model anddistributed hydrologic model. The biospheric model is theIntegrated Biosphere Simulator (IBIS) [Foley et al., 1996]which describes biophysical, physiological, and ecologicalprocesses. The distributed hydrologic modeling is per-formed using Systeme Hydrologique Europeen (SHE)[Abbott et al., 1986a, 1988b]. These two models aredescribed in sections 4.1 and 4.2.
4.1. Biospheric Model
[19] IBIS models an extended range of terrestrialprocesses under given atmospheric conditions. Theseconditions include air temperature, precipitation, specifichumidity, cloudiness, and solar and longwave radiation. Thevegetation cover in IBIS is described by a combination ofplant functional types (PFTs) in order to represent vegeta-tion dynamics. The plant functional types are defined on thebasis of ecological characteristics: physiognomy (treesand grasses), leaf habit (evergreen and deciduous), photo-synthetic pathway (carbon 3 and carbon 4), and leaf form(broad leaf and needle leaf). Each of the PFTs hasdifferent responses to the given climate. The success ofany PFT is reflected in its leaf area index (LAI) andcarbon biomass.[20] IBIS has hierarchical and modular structure with four
modules: land surface module, vegetation phenologymodule, carbon balance module, and vegetation dynamics
Figure 3. U.S. Geological Survey land cover classification. Savannas occupy extensive area of WestAfrica.
4 of 13
W07505 KIM AND ELTAHIR: TOPOGRAPHY IN COEXISTENCE OF TREE AND GRASS W07505
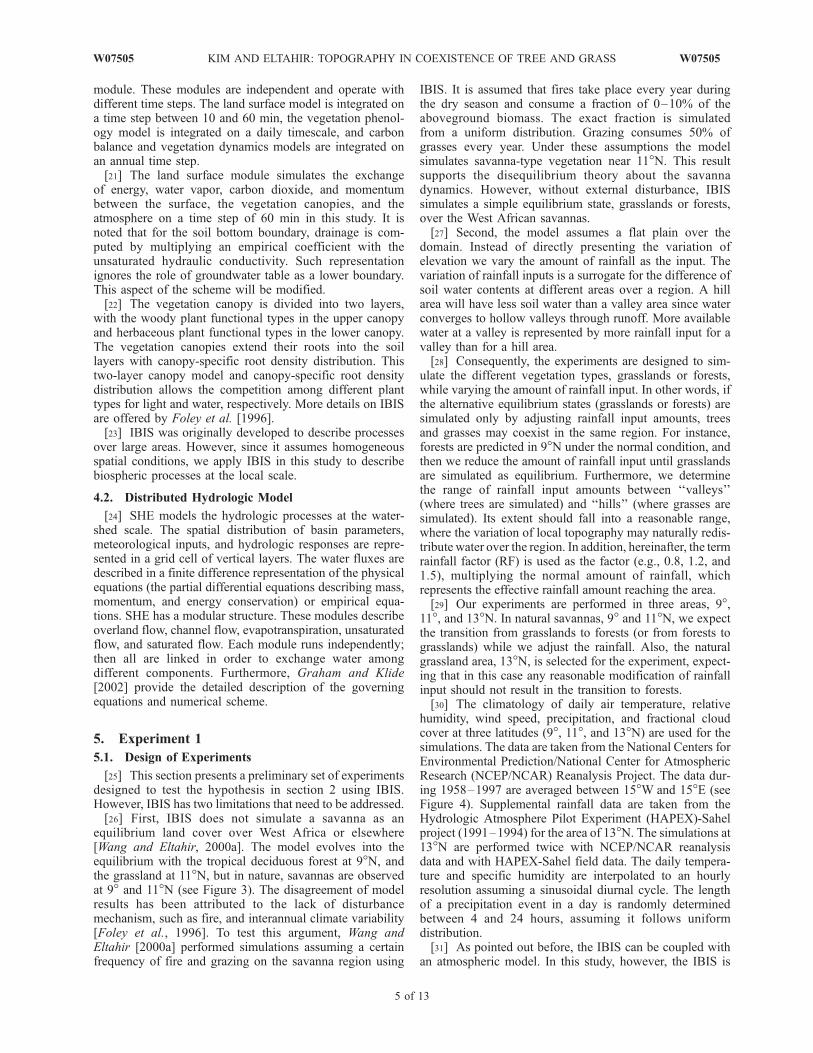
module. These modules are independent and operate withdifferent time steps. The land surface model is integrated ona time step between 10 and 60 min, the vegetation phenol-ogy model is integrated on a daily timescale, and carbonbalance and vegetation dynamics models are integrated onan annual time step.[21] The land surface module simulates the exchange
of energy, water vapor, carbon dioxide, and momentumbetween the surface, the vegetation canopies, and theatmosphere on a time step of 60 min in this study. It isnoted that for the soil bottom boundary, drainage is com-puted by multiplying an empirical coefficient with theunsaturated hydraulic conductivity. Such representationignores the role of groundwater table as a lower boundary.This aspect of the scheme will be modified.[22] The vegetation canopy is divided into two layers,
with the woody plant functional types in the upper canopyand herbaceous plant functional types in the lower canopy.The vegetation canopies extend their roots into the soillayers with canopy-specific root density distribution. Thistwo-layer canopy model and canopy-specific root densitydistribution allows the competition among different planttypes for light and water, respectively. More details on IBISare offered by Foley et al. [1996].[23] IBIS was originally developed to describe processes
over large areas. However, since it assumes homogeneousspatial conditions, we apply IBIS in this study to describebiospheric processes at the local scale.
4.2. Distributed Hydrologic Model
[24] SHE models the hydrologic processes at the water-shed scale. The spatial distribution of basin parameters,meteorological inputs, and hydrologic responses are repre-sented in a grid cell of vertical layers. The water fluxes aredescribed in a finite difference representation of the physicalequations (the partial differential equations describing mass,momentum, and energy conservation) or empirical equa-tions. SHE has a modular structure. These modules describeoverland flow, channel flow, evapotranspiration, unsaturatedflow, and saturated flow. Each module runs independently;then all are linked in order to exchange water amongdifferent components. Furthermore, Graham and Klide[2002] provide the detailed description of the governingequations and numerical scheme.
5. Experiment 1
5.1. Design of Experiments
[25] This section presents a preliminary set of experimentsdesigned to test the hypothesis in section 2 using IBIS.However, IBIS has two limitations that need to be addressed.[26] First, IBIS does not simulate a savanna as an
equilibrium land cover over West Africa or elsewhere[Wang and Eltahir, 2000a]. The model evolves into theequilibrium with the tropical deciduous forest at 9�N, andthe grassland at 11�N, but in nature, savannas are observedat 9� and 11�N (see Figure 3). The disagreement of modelresults has been attributed to the lack of disturbancemechanism, such as fire, and interannual climate variability[Foley et al., 1996]. To test this argument, Wang andEltahir [2000a] performed simulations assuming a certainfrequency of fire and grazing on the savanna region using
IBIS. It is assumed that fires take place every year duringthe dry season and consume a fraction of 0–10% of theaboveground biomass. The exact fraction is simulatedfrom a uniform distribution. Grazing consumes 50% ofgrasses every year. Under these assumptions the modelsimulates savanna-type vegetation near 11�N. This resultsupports the disequilibrium theory about the savannadynamics. However, without external disturbance, IBISsimulates a simple equilibrium state, grasslands or forests,over the West African savannas.[27] Second, the model assumes a flat plain over the
domain. Instead of directly presenting the variation ofelevation we vary the amount of rainfall as the input. Thevariation of rainfall inputs is a surrogate for the difference ofsoil water contents at different areas over a region. A hillarea will have less soil water than a valley area since waterconverges to hollow valleys through runoff. More availablewater at a valley is represented by more rainfall input for avalley than for a hill area.[28] Consequently, the experiments are designed to sim-
ulate the different vegetation types, grasslands or forests,while varying the amount of rainfall input. In other words, ifthe alternative equilibrium states (grasslands or forests) aresimulated only by adjusting rainfall input amounts, treesand grasses may coexist in the same region. For instance,forests are predicted in 9�N under the normal condition, andthen we reduce the amount of rainfall input until grasslandsare simulated as equilibrium. Furthermore, we determinethe range of rainfall input amounts between ‘‘valleys’’(where trees are simulated) and ‘‘hills’’ (where grasses aresimulated). Its extent should fall into a reasonable range,where the variation of local topography may naturally redis-tribute water over the region. In addition, hereinafter, the termrainfall factor (RF) is used as the factor (e.g., 0.8, 1.2, and1.5), multiplying the normal amount of rainfall, whichrepresents the effective rainfall amount reaching the area.[29] Our experiments are performed in three areas, 9�,
11�, and 13�N. In natural savannas, 9� and 11�N, we expectthe transition from grasslands to forests (or from forests tograsslands) while we adjust the rainfall. Also, the naturalgrassland area, 13�N, is selected for the experiment, expect-ing that in this case any reasonable modification of rainfallinput should not result in the transition to forests.[30] The climatology of daily air temperature, relative
humidity, wind speed, precipitation, and fractional cloudcover at three latitudes (9�, 11�, and 13�N) are used for thesimulations. The data are taken from the National Centers forEnvironmental Prediction/National Center for AtmosphericResearch (NCEP/NCAR) Reanalysis Project. The data dur-ing 1958–1997 are averaged between 15�W and 15�E (seeFigure 4). Supplemental rainfall data are taken from theHydrologic Atmosphere Pilot Experiment (HAPEX)-Sahelproject (1991–1994) for the area of 13�N. The simulations at13�N are performed twice with NCEP/NCAR reanalysisdata and with HAPEX-Sahel field data. The daily tempera-ture and specific humidity are interpolated to an hourlyresolution assuming a sinusoidal diurnal cycle. The lengthof a precipitation event in a day is randomly determinedbetween 4 and 24 hours, assuming it follows uniformdistribution.[31] As pointed out before, the IBIS can be coupled with
an atmospheric model. In this study, however, the IBIS is
W07505 KIM AND ELTAHIR: TOPOGRAPHY IN COEXISTENCE OF TREE AND GRASS
5 of 13
W07505
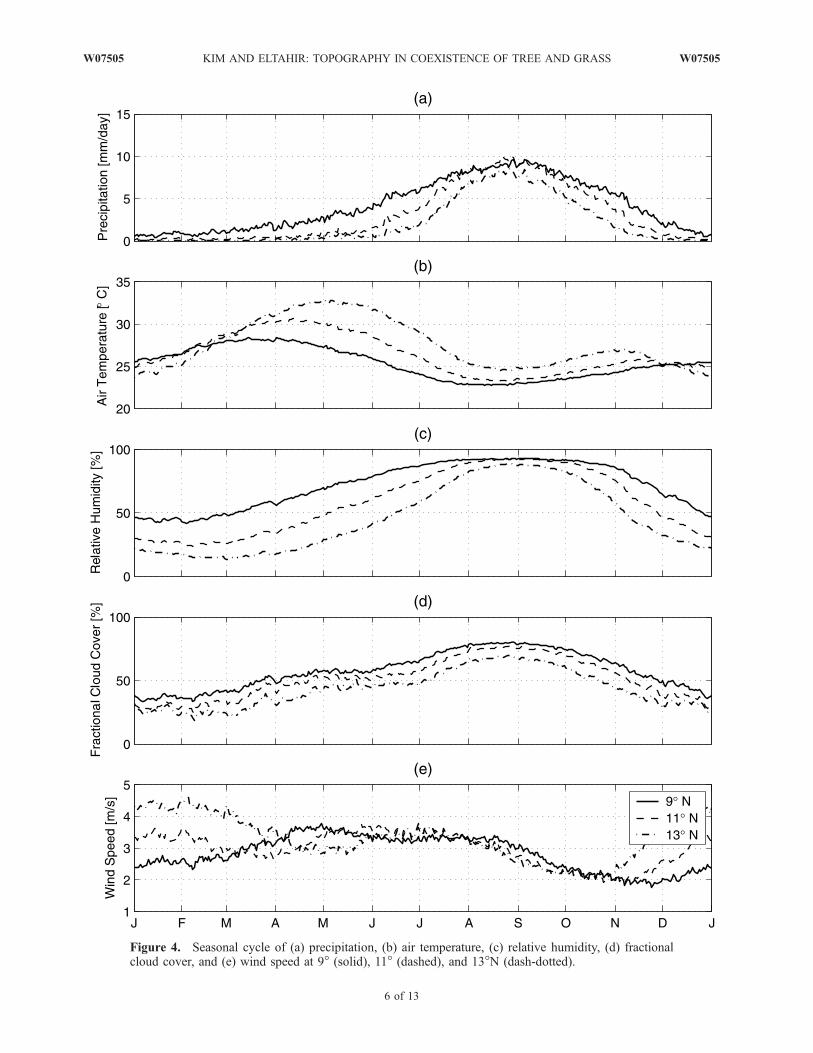
Figure 4. Seasonal cycle of (a) precipitation, (b) air temperature, (c) relative humidity, (d) fractionalcloud cover, and (e) wind speed at 9� (solid), 11� (dashed), and 13�N (dash-dotted).
6 of 13
W07505 KIM AND ELTAHIR: TOPOGRAPHY IN COEXISTENCE OF TREE AND GRASS W07505
used off-line, without two-way interaction between theatmosphere and biosphere. Moreover, simulations in thisset of experiments are performed assuming a free gravita-tional drainage condition at the bottom. This assumptionwill be relaxed later. As explained in section 4, the originalmodel describes the upper soil layers only down to 4 m.The discharge from the soil bottom is described by asimple coefficient multiplying the unsaturated hydraulicconductivity of the bottom layer. This coefficient rangesfrom 0 (no flux) to 1 (free gravitational drainage). Morediscussion about the lack of groundwater aquifers in themodel will be presented in section 6.[32] At the beginning of each simulation, all PFTs have
the same minimal LAIs of 0.1. Each type of vegetation hasequal opportunity to survive at the start time, and then theycompete with each other for water and light under the givenatmospheric condition. Simulations run for 250–500 yearsto give enough time to reach equilibrium state. We deter-mine if the model is close to the equilibrium by monitoringthe annual changes of LAI of upper and lower canopies. Astable state of LAIs is a characteristic of the equilibriumstate.
5.2. Results
5.2.1. Results at 9�N[33] The model predicts a dry deciduous forest under the
normal rainfall levels at 9�N. To determine the rainfall level
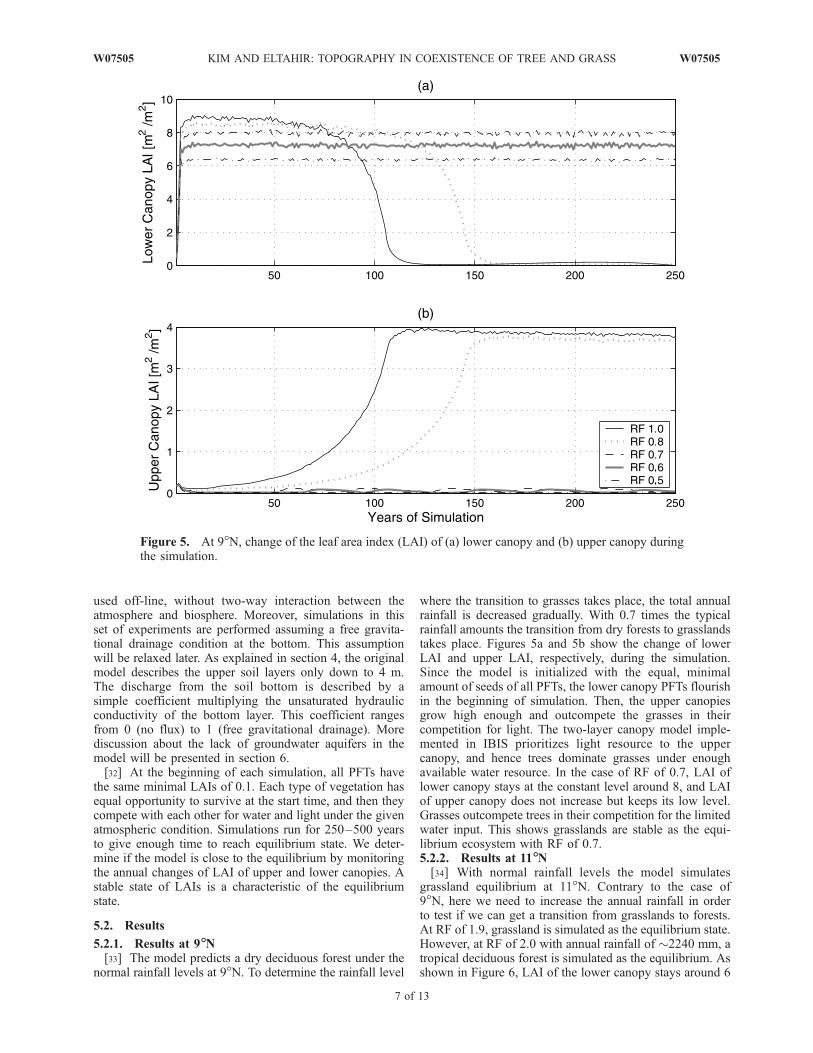
where the transition to grasses takes place, the total annualrainfall is decreased gradually. With 0.7 times the typicalrainfall amounts the transition from dry forests to grasslandstakes place. Figures 5a and 5b show the change of lowerLAI and upper LAI, respectively, during the simulation.Since the model is initialized with the equal, minimalamount of seeds of all PFTs, the lower canopy PFTs flourishin the beginning of simulation. Then, the upper canopiesgrow high enough and outcompete the grasses in theircompetition for light. The two-layer canopy model imple-mented in IBIS prioritizes light resource to the uppercanopy, and hence trees dominate grasses under enoughavailable water resource. In the case of RF of 0.7, LAI oflower canopy stays at the constant level around 8, and LAIof upper canopy does not increase but keeps its low level.Grasses outcompete trees in their competition for the limitedwater input. This shows grasslands are stable as the equi-librium ecosystem with RF of 0.7.5.2.2. Results at 11�N[34] With normal rainfall levels the model simulates
grassland equilibrium at 11�N. Contrary to the case of9�N, here we need to increase the annual rainfall in orderto test if we can get a transition from grasslands to forests.At RF of 1.9, grassland is simulated as the equilibrium state.However, at RF of 2.0 with annual rainfall of �2240 mm, atropical deciduous forest is simulated as the equilibrium. Asshown in Figure 6, LAI of the lower canopy stays around 6
Figure 5. At 9�N, change of the leaf area index (LAI) of (a) lower canopy and (b) upper canopy duringthe simulation.
W07505 KIM AND ELTAHIR: TOPOGRAPHY IN COEXISTENCE OF TREE AND GRASS
7 of 13
W07505
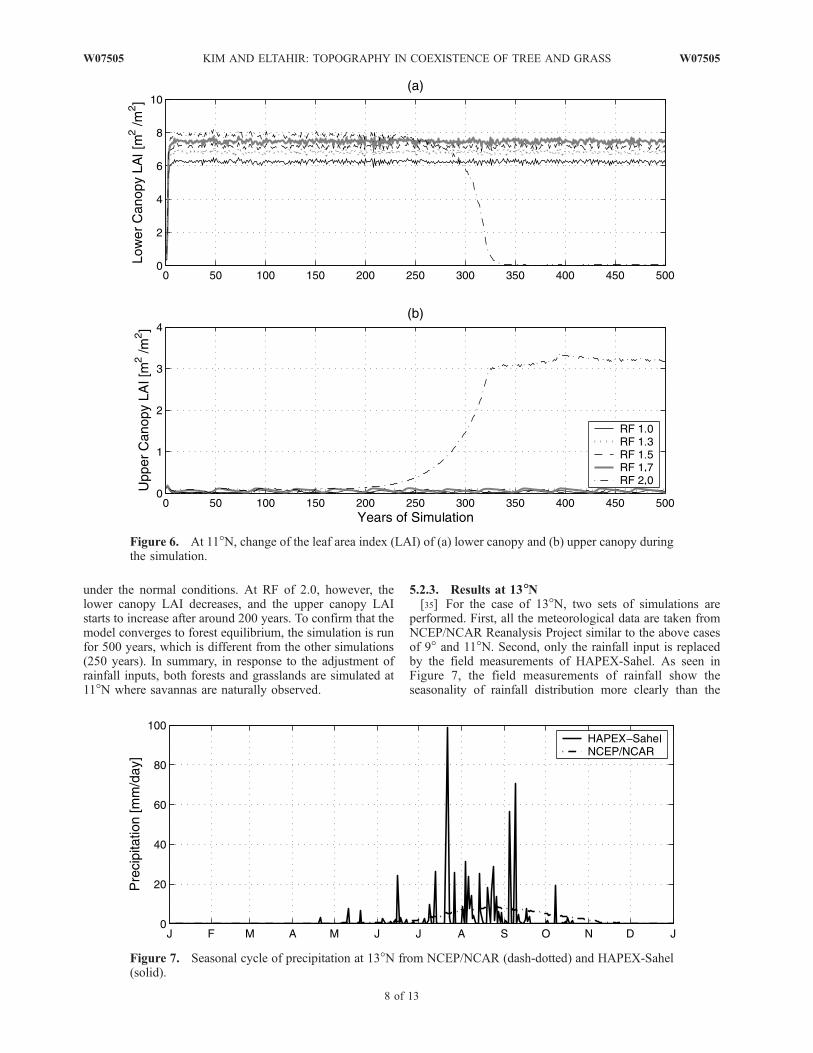
under the normal conditions. At RF of 2.0, however, thelower canopy LAI decreases, and the upper canopy LAIstarts to increase after around 200 years. To confirm that themodel converges to forest equilibrium, the simulation is runfor 500 years, which is different from the other simulations(250 years). In summary, in response to the adjustment ofrainfall inputs, both forests and grasslands are simulated at11�N where savannas are naturally observed.
5.2.3. Results at 13�N[35] For the case of 13�N, two sets of simulations are
performed. First, all the meteorological data are taken fromNCEP/NCAR Reanalysis Project similar to the above casesof 9� and 11�N. Second, only the rainfall input is replacedby the field measurements of HAPEX-Sahel. As seen inFigure 7, the field measurements of rainfall show theseasonality of rainfall distribution more clearly than the
Figure 6. At 11�N, change of the leaf area index (LAI) of (a) lower canopy and (b) upper canopy duringthe simulation.
Figure 7. Seasonal cycle of precipitation at 13�N from NCEP/NCAR (dash-dotted) and HAPEX-Sahel(solid).
8 of 13
W07505 KIM AND ELTAHIR: TOPOGRAPHY IN COEXISTENCE OF TREE AND GRASS W07505
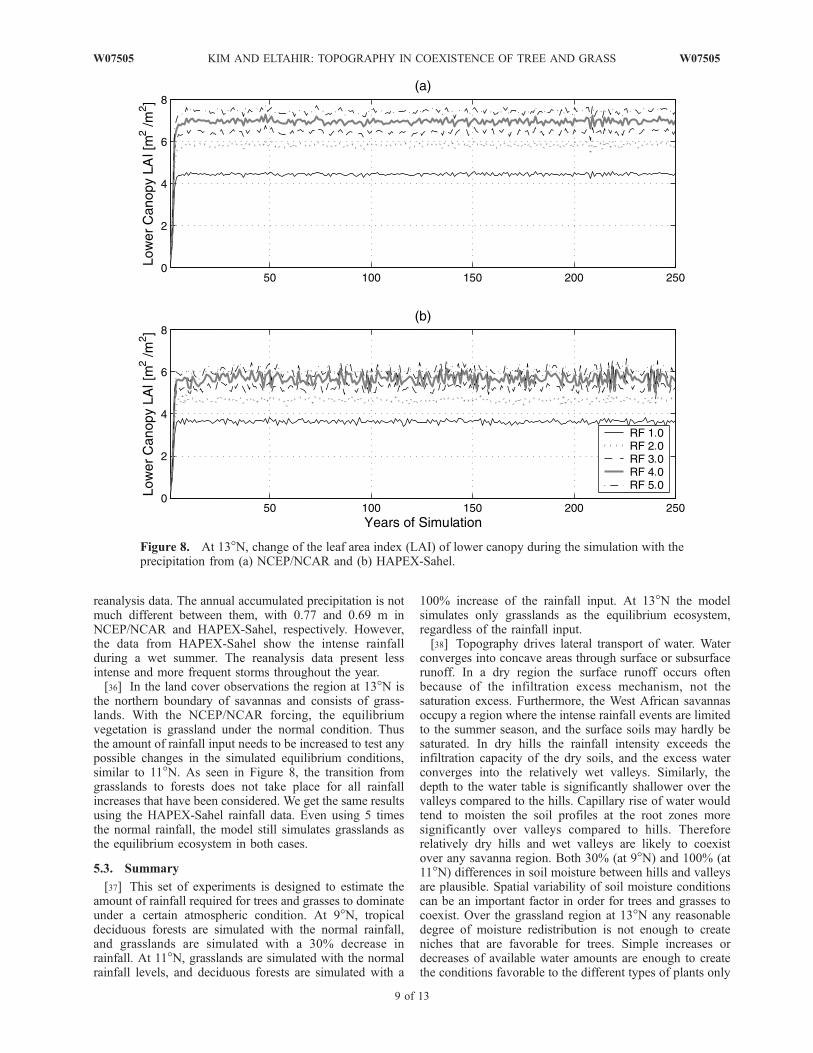
reanalysis data. The annual accumulated precipitation is notmuch different between them, with 0.77 and 0.69 m inNCEP/NCAR and HAPEX-Sahel, respectively. However,the data from HAPEX-Sahel show the intense rainfallduring a wet summer. The reanalysis data present lessintense and more frequent storms throughout the year.[36] In the land cover observations the region at 13�N is
the northern boundary of savannas and consists of grass-lands. With the NCEP/NCAR forcing, the equilibriumvegetation is grassland under the normal condition. Thusthe amount of rainfall input needs to be increased to test anypossible changes in the simulated equilibrium conditions,similar to 11�N. As seen in Figure 8, the transition fromgrasslands to forests does not take place for all rainfallincreases that have been considered. We get the same resultsusing the HAPEX-Sahel rainfall data. Even using 5 timesthe normal rainfall, the model still simulates grasslands asthe equilibrium ecosystem in both cases.
5.3. Summary
[37] This set of experiments is designed to estimate theamount of rainfall required for trees and grasses to dominateunder a certain atmospheric condition. At 9�N, tropicaldeciduous forests are simulated with the normal rainfall,and grasslands are simulated with a 30% decrease inrainfall. At 11�N, grasslands are simulated with the normalrainfall levels, and deciduous forests are simulated with a
100% increase of the rainfall input. At 13�N the modelsimulates only grasslands as the equilibrium ecosystem,regardless of the rainfall input.[38] Topography drives lateral transport of water. Water
converges into concave areas through surface or subsurfacerunoff. In a dry region the surface runoff occurs oftenbecause of the infiltration excess mechanism, not thesaturation excess. Furthermore, the West African savannasoccupy a region where the intense rainfall events are limitedto the summer season, and the surface soils may hardly besaturated. In dry hills the rainfall intensity exceeds theinfiltration capacity of the dry soils, and the excess waterconverges into the relatively wet valleys. Similarly, thedepth to the water table is significantly shallower over thevalleys compared to the hills. Capillary rise of water wouldtend to moisten the soil profiles at the root zones moresignificantly over valleys compared to hills. Thereforerelatively dry hills and wet valleys are likely to coexistover any savanna region. Both 30% (at 9�N) and 100% (at11�N) differences in soil moisture between hills and valleysare plausible. Spatial variability of soil moisture conditionscan be an important factor in order for trees and grasses tocoexist. Over the grassland region at 13�N any reasonabledegree of moisture redistribution is not enough to createniches that are favorable for trees. Simple increases ordecreases of available water amounts are enough to createthe conditions favorable to the different types of plants only
Figure 8. At 13�N, change of the leaf area index (LAI) of lower canopy during the simulation with theprecipitation from (a) NCEP/NCAR and (b) HAPEX-Sahel.
W07505 KIM AND ELTAHIR: TOPOGRAPHY IN COEXISTENCE OF TREE AND GRASS
9 of 13
W07505
for a specific climatic window that is characteristic ofnatural savannas (9� and 11�N).
6. Experiment 2
[39] The same hypothesis is tested in another set ofexperiments, using a modified version of IBIS. The soilmodel of IBIS is modified to include the groundwater table(GWT) as the lower boundary. This modification facilitatesstudying the response of IBIS to variations in the depth tothe GWT [Yeh, 2003]. The variation in GWT over a regioncan be simulated with SHE. Such variations reflect thespatial variability of elevation that has been suggested toexplain the coexistence of trees and grasses within savanna.
6.1. Methodology Using IBIS and SHE
[40] The level of GWT is highly correlated with soilmoisture. The variation of soil moisture can dictate differenttypes of vegetation, trees or grasses, given the climate ofsavannas as illustrated in the previous set of experiments.Consequently, it is postulated that the spatial variability ofGWT facilitates coexistence of trees and grasses in a region.A shallow GWT provides more water to the soil andvegetation than a deep one. Using IBIS, however, thiscannot be tested in a direct way, since the original modeldoes not represent the GWT.[41] The land-surface transfer scheme (LSX) model
[Pollard and Thompson, 1995; Thompson and Pollard,1995a, 1995b], used within IBIS for describing the landsurface processes, does not represent the dynamics of watertable physically. In the LSX the bottom boundary conditionof soil is specified as the unsaturated conductivity of thelowest layer multiplied by an empirical drainage coefficientranging from 0 to 1, where 0 is a no-flux condition such asimpermeable bedrock and 1 is a gravity drainage condition.Since this coefficient controls the drainage rate out of the soilcolumn, it has an important impact on partitioning of rainfallbetween runoff and evapotranspiration. However, it is im-possible to estimate the coefficient in the field since it is notphysically based. Similar to LSX most current land surfacemodels do not include a representation for the groundwatertable [Yeh, 2003]. Therefore the land surface models apply agravitational drainage condition or linear function of gravitydrainage condition with an empirical coefficient whichaccounts for the other factors affecting soil drainage suchas the location of bedrock or groundwater table [Boone andWetzel, 1996].[42] Since it is difficult to include a detailed groundwater
dynamics in a land surface model, we represent the ground-water table as a lower boundary for the soil column. Fromexperiments using SHE we obtain a reasonable estimate ofthe annual cycle of spatially variable location of the GWTcorresponding to the same rainfall forcing. Valley areashave shallow groundwater table depths that fluctuate fol-lowing storm events. Hill areas have deep water tabledepths that are less sensitive to storm events than valleyareas. Therefore the bottom boundary of IBIS can bespecified with the cycle of groundwater table correspondingto the different topographic characteristics. We will seewhether the IBIS simulations result in different or sameequilibrium vegetation (forests or grasslands) correspondingto the differently specified GWT at each region. If the IBIScould simulate forests and grasslands respectively in each
run with different cycles of GWT at the same latitude, wewould conclude that IBIS-SHE simulates the savanna eco-system. We expect the areas with a shallow (deep) watertable might have forest (grassland) as equilibrium only innatural savannas. In order to include the GWT as aboundary the soil model of IBIS is modified.[43] In simulations using SHE the model assumes homo-
geneous atmospheric conditions and homogeneous soil prop-erties over the domain. The redistribution of soil moisture is adirect response to topography. A small representative catch-ment (�820 km2) is delineated from GTOPO30 in theRepublic of Niger. This elevation field is used to generatethe annual cycle of GWT in response to the observedtopographic variations for all the experimental cases of 9�,11�, and 13�N. TheGWT is assumed to be at the surface at theinitial time. The simulations are repeated with the annualcycles of daily atmospheric conditions (rainfall intensity andpotential evaporation) until hydrologic variables, such as thedepth to GWT, reach equilibrium regardless of the initialarbitrary conditions. The resulting seasonal cycle of GWT isthen used to drive the modified IBIS including GWT as alower boundary condition.[44] The groundwater table depth is simulated assuming
bare soil conditions. This assumption may not be fullyjustified since the existence of vegetation would impactthe annual cycle of water table depth. However, thisassumption may not be extremely limiting since our objec-tive here is to understand the role of water table depth indictating the vegetation type and not to explore the fullrange of interactions between vegetation and the GWT.[45] Except for adding the GWT, all other conditions are
the same as the former set in experiment 1. However, theresults from the region at 9�N, where savannas are observedbut forests are simulated using IBIS, are not presented here.In the previous set of experiments the bottom of the soilcolumn is assumed to have free gravitational drainagecondition. Despite that assumption, IBIS simulates a dryforest at 9�N, where savanna ecosystem is observed inreality. Adding a water table boundary condition shouldmake the soil moister and hence should not result in atransition to grass. Therefore the simulations at 9�N result indry forest regardless of the depth of the GWT.
6.2. Results
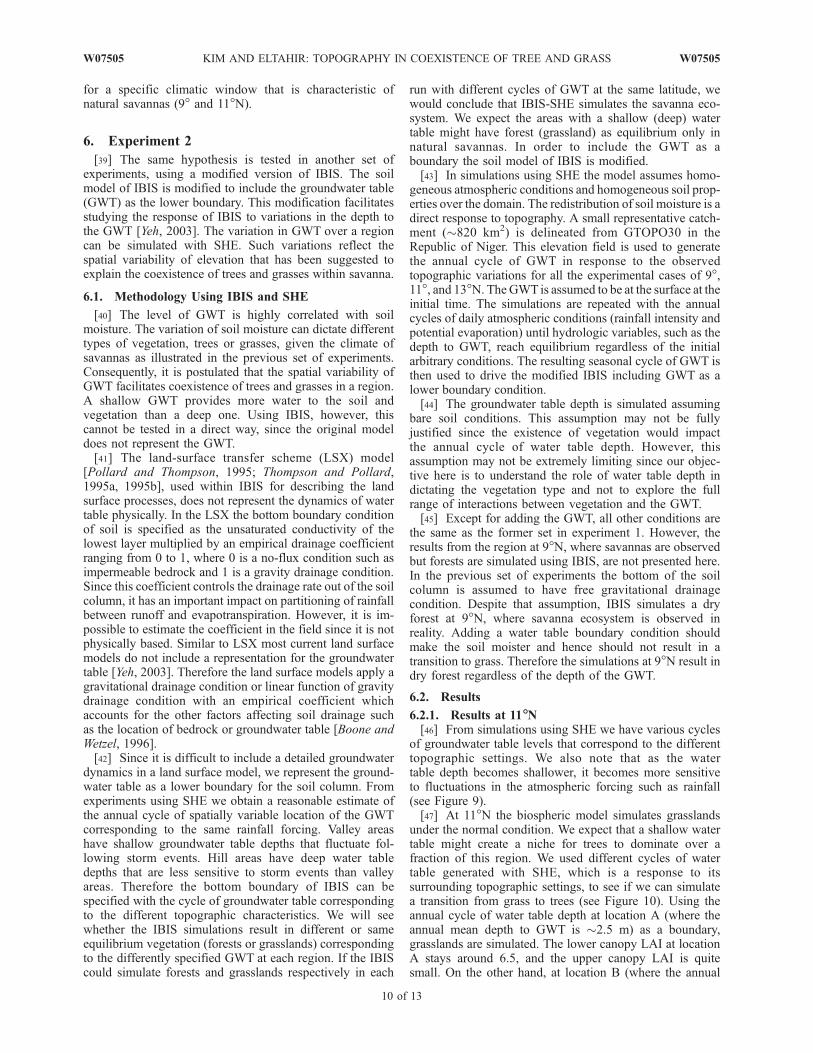
6.2.1. Results at 11�N[46] From simulations using SHE we have various cycles
of groundwater table levels that correspond to the differenttopographic settings. We also note that as the watertable depth becomes shallower, it becomes more sensitiveto fluctuations in the atmospheric forcing such as rainfall(see Figure 9).[47] At 11�N the biospheric model simulates grasslands
under the normal condition. We expect that a shallow watertable might create a niche for trees to dominate over afraction of this region. We used different cycles of watertable generated with SHE, which is a response to itssurrounding topographic settings, to see if we can simulatea transition from grass to trees (see Figure 10). Using theannual cycle of water table depth at location A (where theannual mean depth to GWT is �2.5 m) as a boundary,grasslands are simulated. The lower canopy LAI at locationA stays around 6.5, and the upper canopy LAI is quitesmall. On the other hand, at location B (where the annual
10 of 13
W07505 KIM AND ELTAHIR: TOPOGRAPHY IN COEXISTENCE OF TREE AND GRASS W07505
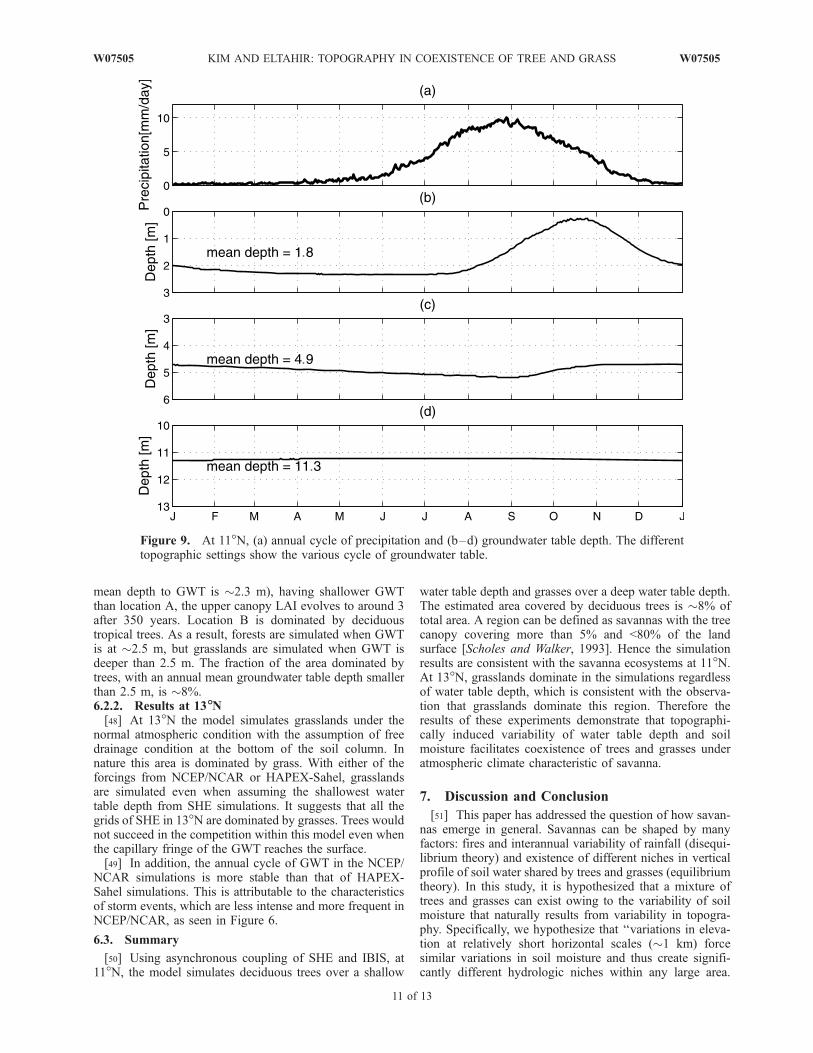
mean depth to GWT is �2.3 m), having shallower GWTthan location A, the upper canopy LAI evolves to around 3after 350 years. Location B is dominated by deciduoustropical trees. As a result, forests are simulated when GWTis at �2.5 m, but grasslands are simulated when GWT isdeeper than 2.5 m. The fraction of the area dominated bytrees, with an annual mean groundwater table depth smallerthan 2.5 m, is �8%.6.2.2. Results at 13�N[48] At 13�N the model simulates grasslands under the
normal atmospheric condition with the assumption of freedrainage condition at the bottom of the soil column. Innature this area is dominated by grass. With either of theforcings from NCEP/NCAR or HAPEX-Sahel, grasslandsare simulated even when assuming the shallowest watertable depth from SHE simulations. It suggests that all thegrids of SHE in 13�N are dominated by grasses. Trees wouldnot succeed in the competition within this model even whenthe capillary fringe of the GWT reaches the surface.[49] In addition, the annual cycle of GWT in the NCEP/
NCAR simulations is more stable than that of HAPEX-Sahel simulations. This is attributable to the characteristicsof storm events, which are less intense and more frequent inNCEP/NCAR, as seen in Figure 6.
6.3. Summary
[50] Using asynchronous coupling of SHE and IBIS, at11�N, the model simulates deciduous trees over a shallow
water table depth and grasses over a deep water table depth.The estimated area covered by deciduous trees is �8% oftotal area. A region can be defined as savannas with the treecanopy covering more than 5% and <80% of the landsurface [Scholes and Walker, 1993]. Hence the simulationresults are consistent with the savanna ecosystems at 11�N.At 13�N, grasslands dominate in the simulations regardlessof water table depth, which is consistent with the observa-tion that grasslands dominate this region. Therefore theresults of these experiments demonstrate that topographi-cally induced variability of water table depth and soilmoisture facilitates coexistence of trees and grasses underatmospheric climate characteristic of savanna.
7. Discussion and Conclusion
[51] This paper has addressed the question of how savan-nas emerge in general. Savannas can be shaped by manyfactors: fires and interannual variability of rainfall (disequi-librium theory) and existence of different niches in verticalprofile of soil water shared by trees and grasses (equilibriumtheory). In this study, it is hypothesized that a mixture oftrees and grasses can exist owing to the variability of soilmoisture that naturally results from variability in topogra-phy. Specifically, we hypothesize that ‘‘variations in eleva-tion at relatively short horizontal scales (�1 km) forcesimilar variations in soil moisture and thus create signifi-cantly different hydrologic niches within any large area.
Figure 9. At 11�N, (a) annual cycle of precipitation and (b–d) groundwater table depth. The differenttopographic settings show the various cycle of groundwater table.
W07505 KIM AND ELTAHIR: TOPOGRAPHY IN COEXISTENCE OF TREE AND GRASS
11 of 13
W07505
Under water-limited conditions the relatively wet valleysfavor trees, while the relatively dry hills favor grasses. Thiscoexistence of trees and grasses is only possible for awindow of climatic conditions that is characteristic ofsavannas.’’ This hypothesis has been tested using thebiosphere model (IBIS) only and asynchronous couplingof the biospheric model (IBIS) and a distributed hydrologicmodel (SHE).[52] In the two sets of experiments we simulate different
types of vegetation in response to different water conditionsonly in natural savannas, not in natural grasslands (seeTable 1). In the first set of experiments the different waterconditions are simulated by prescribing different magni-tudes of the rainfall forcing. In the second set of experi-ments the different water conditions are simulated byprescribing different water table depths. The spatial varia-tion of water availability in the horizontal is shown tofacilitate coexistence of trees and grasses in savannas. Bothresults suggest that the variability of soil moisture forced bytopography can be a determinant factor of vegetationdistribution within savannas. Further, they confirm that thisrole of topography can be significant only in a certainclimatic window characteristic of savannas.[53] In the first set of experiments, prescribed forcing of
around 1000 and 2000 mm of annual rainfall defines thegrass/tree transition at 9� and 11�N, respectively. These
amounts are quite different, although both regions fall intosavannas. This result suggests that other meteorologicalinputs such as air temperature and solar radiation (refer toFigure 4) perhaps play important roles and demonstratesthat water is not the only one determinant factor in savan-nas. Moreover, at 13�N, grassland is simulated even whenvery high rainfall is assumed. The experiments at 13�N onlysimulate grasslands as equilibrium ecosystems. We observegrasslands in nature. Even with more than 3500 mm of theannual accumulated rainfall, only grasses are simulated inthe model. This amount of rainfall is enough to supportforests in the areas of 9� and 11�N.[54] In the second set of experiments, by using SHE and
IBIS asynchronously, the model simulates trees at 9�N, evenwhen the GWT is assumed to be infinitely deep; at 13�N themodel simulates grasses even when the capillary fringe of
Table 1. Summarized Results
Latitude, �N
9 11 13
Observation savannas savannas grasslandsIBIS forests grasslands grasslandsAsynchronous coupling
of IBIS and SHEforests savannas grasslands
Figure 10. At 11�N, change of the leaf area index (LAI) of (a) lower canopy and (b) upper canopyduring the simulation in location A (annual mean depth to GWT is 2.5 m, solid line) and location B(annual mean depth to GWT is 2.3 m, dash-dotted line). The different location in the same catchment canhave different types of vegetation, grass or tree, only in savannas.
12 of 13
W07505 KIM AND ELTAHIR: TOPOGRAPHY IN COEXISTENCE OF TREE AND GRASS W07505
the GWT reaches the surface. However, for the transitionalclimate, at 11�N, trees are simulated when the GWT is at�2.5 m from the surface, but grasses are simulated when theGWT is deeper than 2.5 m. Trees are not simulated at 13�Neven with the shallowest water table depth. It suggests thatother meteorological conditions may limit this region andmake it impossible to support trees. Figure 4 shows that thearea at 13�N is under more severe environments for plantswith higher temperature, less relative humidity, and lesscloud cover compared to other regions. These factorsperhaps prevent the growth of woody plants.[55] In this study, we only include grasslands and
savannas for the experimental simulations, but not forests,the southern limit of savannas. In the moist forest of thesouthern subregion of West Africa the water availabilitydoes not limit the plant growth. Rather, solar energyavailability does, owing to the existence of clouds [Wangand Eltahir, 2000b]. The coastal area near the AtlanticOcean receives plenty of moisture supply which would easethe local water deficit that may arise owing to topographicconditions. Therefore the modification of available waterthrough any input (rainfall amount or GWT) has not beenapplied to investigate the plant growth in the coastal forestecosystem using IBIS. On the other hand, the water-limitedgrasslands and savannas cannot easily rebound from thecertain range of modification in water availability. As aresult the change in water availability can affect the growthof plants.[56] The stated hypothesis suggests that a mixture of trees
and grasses may coexist in response to the variation oftopography in natural savannas. A model that can fullydescribe the complex distributed hydrologic processes in-cluding the dynamics of vegetation is required to test theproposed hypothesis. However, the availability of suchmodels is limited, although a few models such as Topog-IRM [Vertessy et al., 1996] and Regional Hydro-EcologicSimulation System (RHESSys) [Mackay and Band, 1997;Mackay, 2001] have been developed. The ecohydrologicalmodels often combine the biogeochemical and hydrologicalcomponents to predict the spatial distribution of the fluxesof energy, water, carbon (plant growth), and nutrients (e.g.,nitrogen). However, the models listed above concentrate onthe biogeochemical processes to estimate the vegetationproductivity (ecosystem function) instead of simulatingthe biogeographic responses to climate (ecosystem struc-ture) and thus predicting the local dominance of vegetationtypes [Mello et al., 2001]. As a consequence it was essentialin our study to implement a scheme that simulates plantcompetition for available resources such as IBIS. Thedevelopment of fully coupled distributed model will helpin better understanding the interplay between soil moistureand vegetation dynamics as well as in additional testing ofthe hypotheses on emergence of savanna.
[57] Acknowledgment. The authors would like to acknowledge thehelpful comments from two anonymous reviewers.
ReferencesAbbott, M. B., J. C. Bathurst, P. E. O’Connel, and J. Rasmussen (1986a),An introduction to the European Hydrological System—Systeme Hydro-logique Europeen ‘‘SHE,’’ 1: History and philosophy of a physically-based distributed modelling system, J. Hydrol., 87, 45–59.
Abbott, M. B., J. C. Bathurst, P. E. O’Connel, and J. Rasmussen (1986b),An introduction to the European Hydrological System—Systeme
Hydrologique Europeen ‘‘SHE,’’ 2: Structure of a physically-baseddistributed modelling system, J. Hydrol., 87, 61–77.
Anderson, J., E. Hardy, J. Roach, and R. Witmer (1976), A land use andland cover classification system for use with remote sensor data, U.S.Geol. Surv. Prof. Pap., 964, 28 pp.
Boone, A., and P. J. Wetzel (1996), Issues related to low resolution model-ing of soil moisture: Experience with the PLACE model, Global Planet.Change, 13, 161–181.
Bourliere, F., and M. Hadley (1983), Present-Day Savannas: Overview inEcosystem of the World—Tropical Savannas, Elsevier Sci., New York.
Casper, B. B., and R. B. Jackson (1997), Plant competition underground,Annu. Rev. Ecol. Syst., 28, 545–570.
Eagleson, P. S., and R. I. Segarra (1985), Water-limited equilibrium ofsavanna vegetation systems, Water Resour. Res., 21(10), 1483–1493.
Foley, J. A., C. Prentice, N. Ramankutty, S. Levis, D. Pollard, S. Stitch, andA. Haxeltine (1996), An integrated biosphere model of land surfaceprocesses, terrestrial carbon balance, and vegetation dynamics, GlobalBiogeochem. Cycles, 10(4), 603–628.
Graham, D., and L. Klide (2002), MIKE SHE User Guide, DHI Water andEnviron., Hørsholm, Denmark.
Jeltsch, F., G. E. Weber, and V. Grimm (2000), Ecological bufferingmechanisms in savannas: A unifying theory of long-term tree-grasscoexistence, Plant Ecol., 151, 161–171.
Mackay, D. S. (2001), Evaluation of hydrologic equilibrium in a mountain-ous watershed: Incorporating forest canopy spatial adjustment to soilbiogeochemical processes, Adv. Water Resour., 24, 1211–1227.
Mackay, D. S., and L. E. Band (1997), Forest ecosystem processes at thewatershed scale: Dynamic coupling of distributed hydrology and canopygrowth, Hydrol. Processes, 11, 1197–1217.
Mello, J., A. Janetos, D. Schimel, and T. Kittel (2001), Climate ChangeImpacts on the United States: The Potential Consequences of ClimateVariability and Change: Foundation/A Report of the National Assess-ment Synthesis Team, US Global Change Research Program, chap. 2,Cambridge Univ. Press, New York.
Pollard, D., and S. L. Thompson (1995), Use of a land-surface-transferscheme (LSX) in a global climate model: The response to doublingstomatal resistance, Global Planet. Change, 10, 129–161.
Porporato, A., P. D’Odorico, F. Laio, and I. Rodriquez-Iturbe (2003),Hydrologic controls on soil carbon and nitrogen cycles. 1. Modelingscheme, Adv. Water Resour., 26, 45–58.
Rodriguez-Iturbe, I., P. D’Odorico, A. Porporato, and L. Ridolfi (1999),Tree-grass coexistence in savannas: The role of spatial dynamics andclimate fluctuations, Geophys. Res. Lett., 26(2), 247–250.
Scholes, R. J., and B. H. Walker (1993), An African Savanna, Synthesis ofthe Nylsvley Study, Cambridge Univ. Press, New York.
Skarpe, C. (1992), Dynamics of savanna ecosystems, J. Veg. Sci., 3, 293–300.
Thompson, S. L., and D. Pollard (1995a), A global climate model(GENESIS) with a land-surface transfer scheme (LSX). Part 1: Presentclimate simulation, J. Clim., 8, 732–761.
Thompson, S. L., and D. Pollard (1995b), A global climate model(GENESIS) with a land-surface transfer scheme (LSX). Part 2: CO2
sensitivity, J. Clim., 8, 1104–1121.Vertessy, R. A., T. J. Hatton, R. G. Benyon, and W. R. Dawes (1996), Long-term growth and water balance predictions for a mountain ash (Eucalyp-tus regnans) forest catchment subject to clear-felling and regeneration,Tree Physiol., 16, 221–232.
Walker, B. H., C. Holling, and R. M. Peterman (1981), Stability of semi-aridsavanna grazing systems, J. Ecol., 69(2), 473–498.
Walter, H. (1971), Ecology of Tropical and Subtropical Vegetation, Oliverand Boyd, White Plains, N. Y.
Wang, G., and E. A. B. Eltahir (2000a), Biosphere-atmosphere interactionsover West Africa. 1: Development and validation of a coupled dynamicmodel, Q. J. R. Meteorol. Soc., 126, 1239–1260.
Wang, G., and E. A. B. Eltahir (2000b), Biosphere-atmosphere interactionsover West Africa. 2: Multiple climate equilibria, Q. J. R. Meteorol. Soc.,126, 1261–1280.
Yeh, P. J. (2003), Representation of water table dynamics in a land surfacescheme: Observations, models, and analyses, Ph.D. thesis, Mass. Inst. ofTechnol., Cambridge.
����������������������������E. A. B. Eltahir and Y. Kim, Ralph M. Parsons Laboratory, Department
of Civil and Environmental Engineering, Massachusetts Institute ofTechnology, 77 Massachusetts Ave., Cambridge, MA 02139, USA.([email protected]; [email protected])
W07505 KIM AND ELTAHIR: TOPOGRAPHY IN COEXISTENCE OF TREE AND GRASS
13 of 13
W07505