role of planktonic bacteria in productivity and cycling of organic matter in the eastern pacific...
TRANSCRIPT
Hydrobiologia 209: 39-50, 1991. 0 1991 Kluwer Academic Publishers. Printed in Belgium. 39
Role of planktonic bacteria in productivity and cycling of organic matter in the Eastern Pacific Ocean
Y.I. Sorokin & T.I. Mamaeva South Dept., Institute of Oceanology Acad. Sci. USSR, Gelendzhik, Krasnodar district, 3.53470, USSR
Received 27 April 1989; in revised form 19 January 1990; accepted 20 March 1990
Key words: bacterioplankton, productivity, labile organic matter, turnover time, eastern pacific ocean, pelagic ecosystems
Abstract
Total number, biomass, production, and respiration of bacterioplankton were measured in oligotrophic, mesotrophic and eutrophic waters of the Eastern Pacific. Total number of bacteria in the upper mixed layer and in the upper thermocline boundary layers varied from 30-60.103 ml- ’ in oligotrophic waters to 100-400. lo3 ml- ’ in mesotrophic waters of fronts and divergences, and to l-25. lo6 ml- ’ in eutrophic waters of coastal upwellings. Wet biomass varied from 5-10 mg 1-l in oligotrophic waters, to 50-200 mg 1-l in mesotrophic waters, and to l-2 g m- 3 in eutrophic waters. Below the layer of maximum temperature gradient i.e. below 35-50 m, bacterioplankton density decreased 5-10 times. P/B coefficients per day were highest in the oligotrophic surface water (N l), and lowest in the eutrophic ones (0.2-0.4). In mesotrophic waters they were intermediate (0.4-1.0). the stock of labile organic matter (LOM) accessible to microbial action varied from 0.3 to 1.6 mg C l- ‘. Its highest value occurred in the upwelling area. The stock of LOM does not noticeably decrease from the euphotic zone to a depth of 2000 m. Its turnover time varied from 5 to 45 days in surface waters, and 30-50 years in deep oceanic waters. The role of bacterioplankton in productivity and in cycling of organic matter in surface - and deep oceanic waters is discussed.
Introduction
The eastern Pacific ocean is an area of active hydrodynamics (Wyrtki, 1966 ; Wooster, 1970). Zones of upwelling, divergences, and oceanic fronts provide intensive mixing and uplifting of nutrient-rich waters into the euphotic zone. These processes are responsible for a high productivity of the pelagic community and for an intensive fishery (Ryther, 1969; Moiseev, 1969; Barber & Smith, 198 1; Vinogradov, 198 1). Previous studies showed the importance of the bacterioplankton as
a food source for pelagic marine ecosystems (Sorokin, 1981; Azam et al., 1983), for example in the Peruvian (Sorokin & Mikheev, 1979; Sorokin & Mamaeva, 1980; Sorokin & Kogelshatz, 1979) and Equatorial upwellings (Sorokin et al., 1977a, k; Sorokin et al., 1977b). The bacterio- plankton in those ecosystems produces more than half of the heterotrophic particulate food and plankton respiration. It provides one of the main ways of using the energy stored in organic matter produced by phytoplankton in upwellings and divergences. In these productive regions of the
40
ocean the bacterioplankton is also an important food source for the zooplankton (Petipa et al., 1977 ; Sorokin & Mikhheev, 1979).
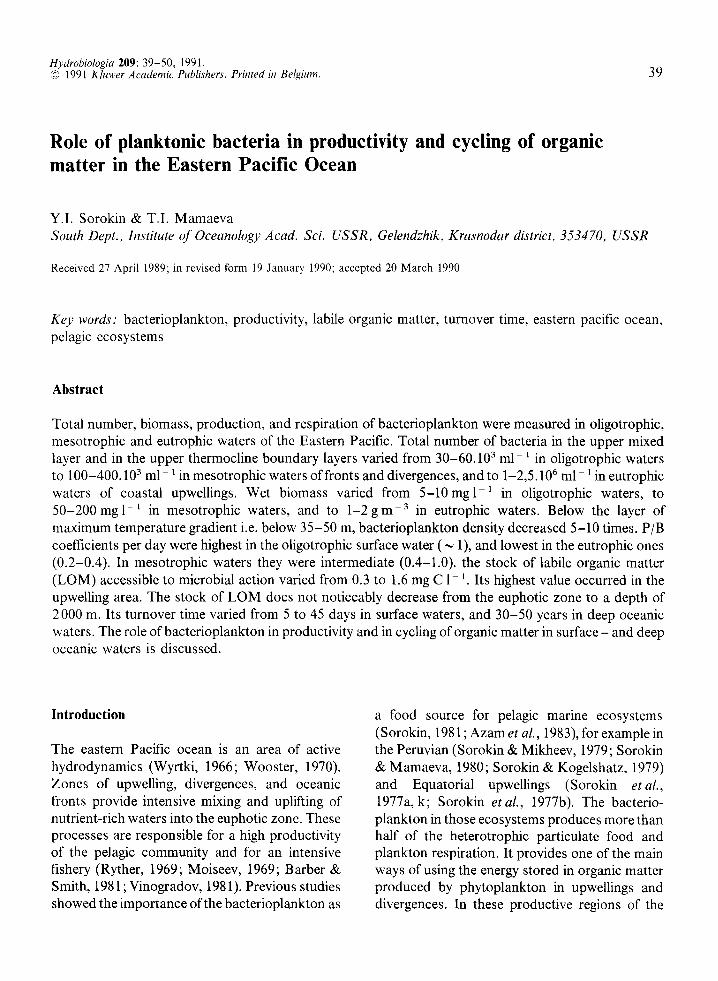
The present study deals with the trophic role of planktonic bacteria in the South-Eastern Pacific ocean. It was carried out during the 34th cruise of the ‘Academic Kurchatov’ in February-March 1982. The stock of labile organic matter (LOM) and its turnover time were also measured. The following 5 main sites were selected: oligotrophic tropical waters, areas of Equatorial divergence and subtropical convergence, the Peruvian up- welling, and the subantarctic waters (Fig. 1).
Materials and methods
Samples were taken at 32 stations in 140 1 plastic bottles at 12-15 different depths between the sur- face and 200 m. At some stations samples were
N
2o"
60° s
120° 9o" 600 w
Fig. 1. Main study sites; 1 - Trade Wind current, station 3536; 2 - equatorial frontal area between Galapagos and Equador, stations 3639-3648; 3 - oceanic part of Peruvian section, stations 3551-3576; 4 - coastal part of Peruvian cross section; 5 - Cabo Nazca ridge, stations 3591-3593; 6,7 - subtropical convergence, stations 3598-3612; 8 - sub-
antarctic waters, station 3616.
collected down to 2 000 m. Sampling depths in the euphotic zone were selected after recording pro- tiles of temperature, chlorophyll, and biolumi- nescence in order not to miss the microplankton maxima (Sorokin, 197 1; Vinogradov et al., 1970; Gitelson et al., 197 1).
Total bacterial number was estimated by direct microscopic counts on membrane filters (SYN- POR-7, Czechoslovakia, pore size 0.2 pm) (Sorokin & Kadota, 1972; Sorokin, 1971). Bac- terial cell volumes were corrected for shrinkage in dried preparations by a factor 1.6 (Sazhin et al., 1987). Microbial production (P) was measured by the radiocarbon method (cJ: Sorokin, 1971) ex- pressed as wet biomass with a carbon content of 20% (Lee & Fuhrman, 1987) and calculated by P = A.74 mg rnp3 day- ‘. (A = dark assimilation of CO, as measured in Cr4-experiments). Micro- bial respiration (M) was calculated as follows:
M= P*(l - K,)*O.2 = 0.425 P
K2 (in PgCll’d-I),
with: P = microbial production in pg 1~ ’ d - ’ of wet biomass ; K, : assimilation efficiency coefficient by bacterioplankton for growth equal to 0.32 (Sorokin & Mamaeva, 1980); 0.2 = con- version coefficient of wet bacterial biomass into carbon, Temperature of dark incubation was 20 “C.
The stock of labile organic matter accessible to microbial consumption (LOM) was evaluated from the BOD values (a,) measured in isolated sea water samples at optimum to in the dark (Zsolnay, 1975; Sorokin & Mamaeva, 1980). Values of a, were obtained from BOD after 3 days (a,) and 6 days (a,) using the corrected formula of Lapshin (1952)
4 a, = 2.21 *a3 - a6
pgo,l-1.
The assumption is that the microplankton in BOD bottles respires only that part of LOM cor- responding to a,. The remainder is used by microorganisms for growth (P), with an efficiency
of 32 %. Thus the initial amount of LOM used (and consequently - the stock of LOM) equals a, + P. The value of P can be calculated as
P= a .K, L, because a, actually represents respi- 1 - K,
ration. If K, = 0.32, P = a,..0.47; thus:
S = (a,. + q.0.47) = q.1.47 pg 0, ll ‘, or S is (a,..1.47).0.47 = a,.0.69p.g C ll’, if: 0.47 - car- bon equivalent of oxygen at RQ = 0.8.
The turnover time of LOM (T) was calculated as the ratio of the stock of LOM to total hetero- trophic respiration per day (M,, mg C l- r d- ‘):
T = S days. The value of M, was calculated
assuming that microbial respiration is 60% of total heterotrophic respiration in the open ocean (Sorokin, 198 1).
Results
Number, biomass, production and respiration rates of bacterioplankton
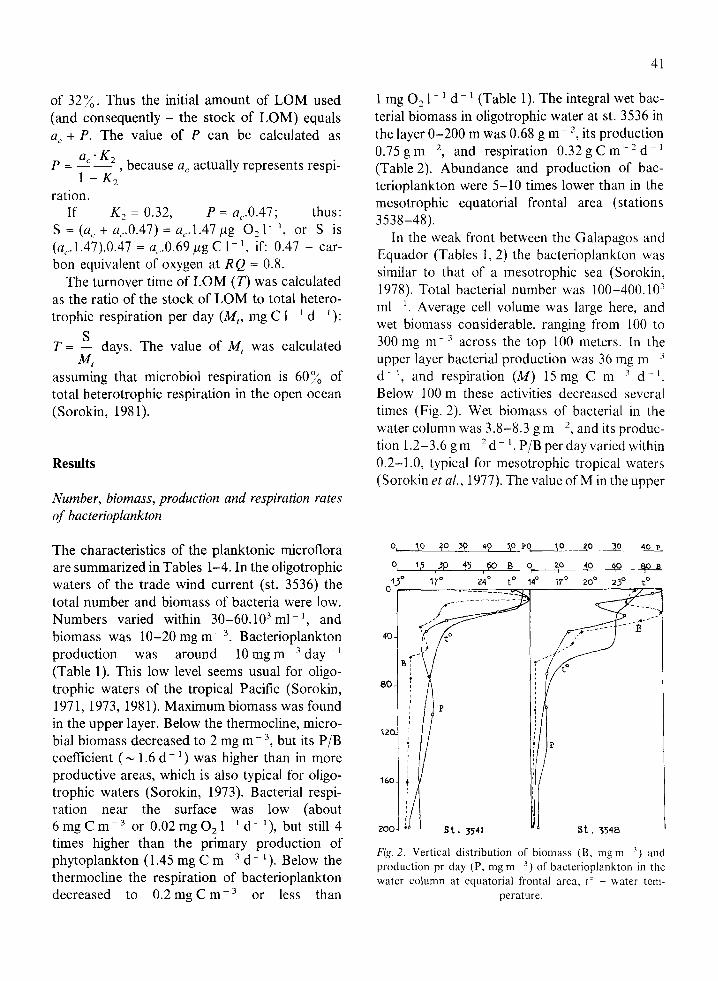
The characteristics of the planktonic microflora are summarized in Tables l-4. In the oligotrophic waters of the trade wind current (st. 3536) the total number and biomass of bacteria were low. Numbers varied within 30-60. lo3 ml - ‘, and biomass was lo-20 mg me3. Bacterioplankton production was around 10 mg m - 3 day - ’ (Table 1). This low level seems usual for oligo- trophic waters of the tropical Pacific (Sorokin, 1971, 1973, 1981). Maximum biomass was found in the upper layer. Below the thermocline, micro- bial biomass decreased to 2 mg m- 3, but its P/B coefficient (N 1.6 d - ‘) was higher than in more productive areas, which is also typical for oligo- trophic waters (Sorokin, 1973). Bacterial respi- ration near the surface was low (about 6mgCme3 or O.O2mgO,l~‘d-‘), but still 4 times higher than the primary production of phytoplankton (1.45 mg C m ~ 3 d - ’ ). Below the thermocline the respiration of bacterioplankton decreased to 0.2 mg C m - 3 or less than
41
1 mg 0, l- ’ d - ’ (Table 1). The integral wet bac- terial biomass in oligotrophic water at st. 3536 in the layer O-200 m was 0.68 g m 2, its production 0.75 g rne2, and respiration 0.32 g C m- ’ d ’ (Table 2). Abundance and production of bac- terioplankton were 5-10 times lower than in the mesotrophic equatorial frontal area (stations 3538-48).
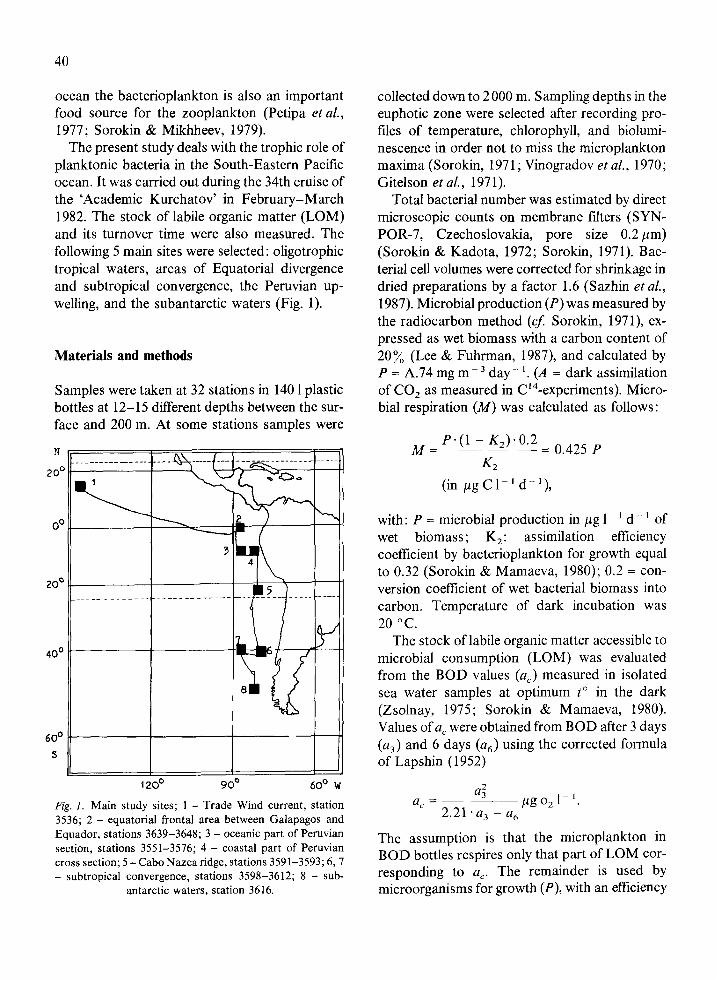
In the weak front between the Galapagos and Equador (Tables 1,2) the bacterioplankton was similar to that of a mesotrophic sea (Sorokin, 1978). Total bacterial number was 100-400.10’ ml ‘. Average cell volume was large here, and wet biomass considerable, ranging from 100 to 300 mg m- 3 across the top 100 meters. In the upper layer bacterial production was 36 mg m - 3 d-“, and respiration (M) 15mg C mm’ d I. Below 100 m these activities decreased several times (Fig. 2). Wet biomass of bacterial in the water column was 3.8-8.3 g mm 2, and its produc- tion 1.2-3.6 g m 2 d - ‘. P/B per day varied within 0.2-1.0, typical for mesotrophic tropical waters (Sorokin et al., 1977). The value of M in the upper
0, I,0 qo >p 4p r,o P9 IO ?O 3,o 40 P
0 ‘7 J(, 45 $0 B 9 10 4P 40 80 B
13" 24' to 14O 17' 20' 23' to
>
1
i P
st. 3548
Fig. 2. Vertical distribution of biomass (B, mg m ‘) and production pr day (P, mg m- ‘) of bacterioplankton in the water column at equatorial frontal area, t’ - water tem-
perature.
R
Table
1.
Ave
rage
va
lues
of
tota
l ba
cteria
(N
), bi
omas
s (B
), pr
oduc
tion
(P),
resp
iratio
n (M
b),
and
of t
he v
olum
e of
one
cell
(V)
in
the
bacte
riopla
nkto
n po
pulat
ions
in se
para
te l
ayer
s of
wat
er i
nteg
rate
d pe
r wh
ole
area
s in
vest
igat
ed.
Desig
natio
ns
of t
he l
ayer
s fo
r wh
ich
aver
age
valu
es
were
cal
cula
ted:
UM
-
uppe
r m
ixed
laye
r, LT
- l
ayer
of
ther
moc
line
max
imum
te
mpe
ratu
re
grad
ient
s,
BT =
belo
w th
e lay
er
LT.
Laye
r
Posit
ion
Dept
h ra
nges
, m
Nu
mbe
r of
sa
mpl
es
Bacte
riopla
nkto
n
N,
Vb
103m
l-’ pm
3 B,
P,
P/
B M
, m
gmm
3 m
gmm
3d-’
mgC
m-3
dm’
Area
an
d NN
of
sta
tions
North
Tr
ade
Wind
cu
rrent
; 35
36
Equa
toria
l fro
ntal
ar
ea;
3538
, 35
39,
3540
, 35
41,
3548
North
of
Naz
ca
Ridg
e;
3591
; 35
92;
3593
Subt
ropic
al co
nver
genc
e at
86’
W;
3608
; 36
12;
3613
; 36
14
Suba
ntar
ctic
wate
rs;
3616
UM
O-40
4
34
0.25
9
14
1.6
6.0
LT
40-5
2 2
20
0.10
2
5 2.
5 2.
1 BT
70
-90
6 28
0.
10
3 0.
5 0.
2 0.
2
UM
O-20
19
16
7 0.
25
42
36
0.9
15.3
LT
20
-60
19
132
0.25
33
17
0.
5 7.
2 BT
60
-200
28
32
0.
25
8 7
0.9
3.0
UM
O-40
18
26
3 0.
15
39
24
0.6
10.2
LT
40
-80
13
328
0.15
49
33
0.
7 14
.0
BT
80-2
00
17
179
0.25
45
15
0.
3 6.
4
UM
o-45
23
27
4 0.
13
36
21
0.6
8.9
LT
45-8
0 12
25
1 0.
13
33
15
0.5
6.4
BT
75-2
00
15
130
0.20
26
8
0.3
3.4
UM
o-37
5
354
0.11
39
17
0.
4 7.
2 LT
37
-65
3 41
3 0.
14
58
14
0.2
6.0
BT
65-2
00
7 91
0.
20
18
8 0.
4 3.
4
43
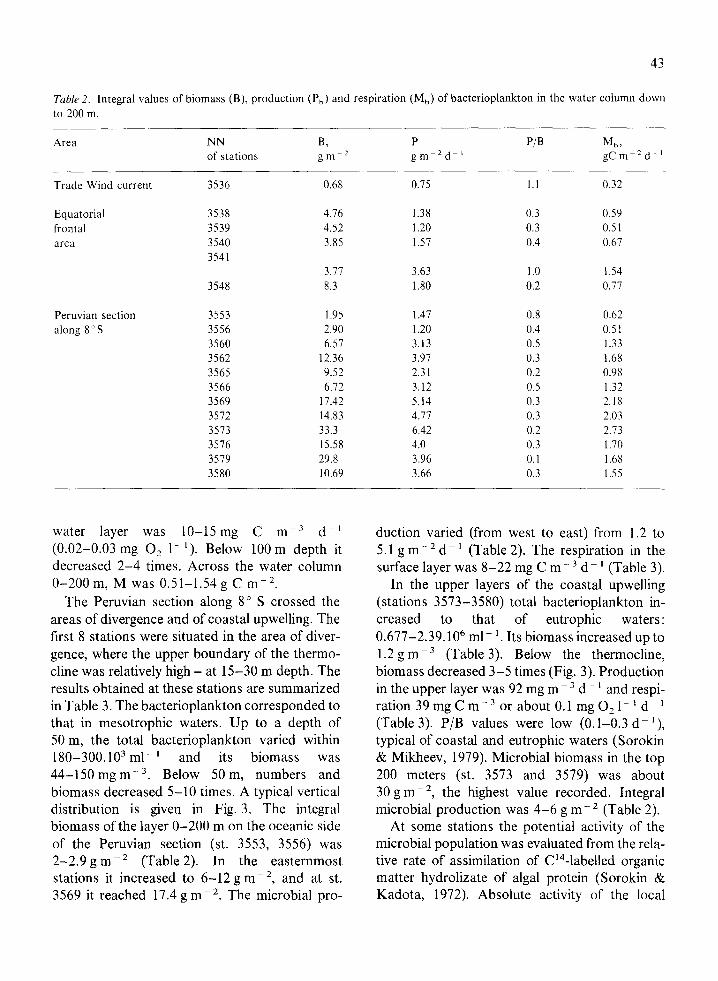
Table 2. Integral values of biomass (B), production (P,) and respiration (M,) of bacterioplankton in the water column down to 200 m.
Area
Trade Wind current
Equatorial frontal area
Peruvian section along 8’S
NN of stations
3536
3538 3539 3540 3541
3548
3553 3556 3560 3562 3565 3566 3569 3512 3573 3576 3519 3580
B, gm-”
0.68
4.16 4.52 3.85
3.11 8.3
1.95 2.90 6.57
12.36 9.52 6.12
11.42 14.83 33.3 15.58 29.8 10.69
water layer was lo-15mg C rnp3 d-i (0.02-0.03 mg 0, l- ‘). Below 100 m depth it decreased 2-4 times. Across the water column O-200 m, M was 0.51-1.54 g C mm2.
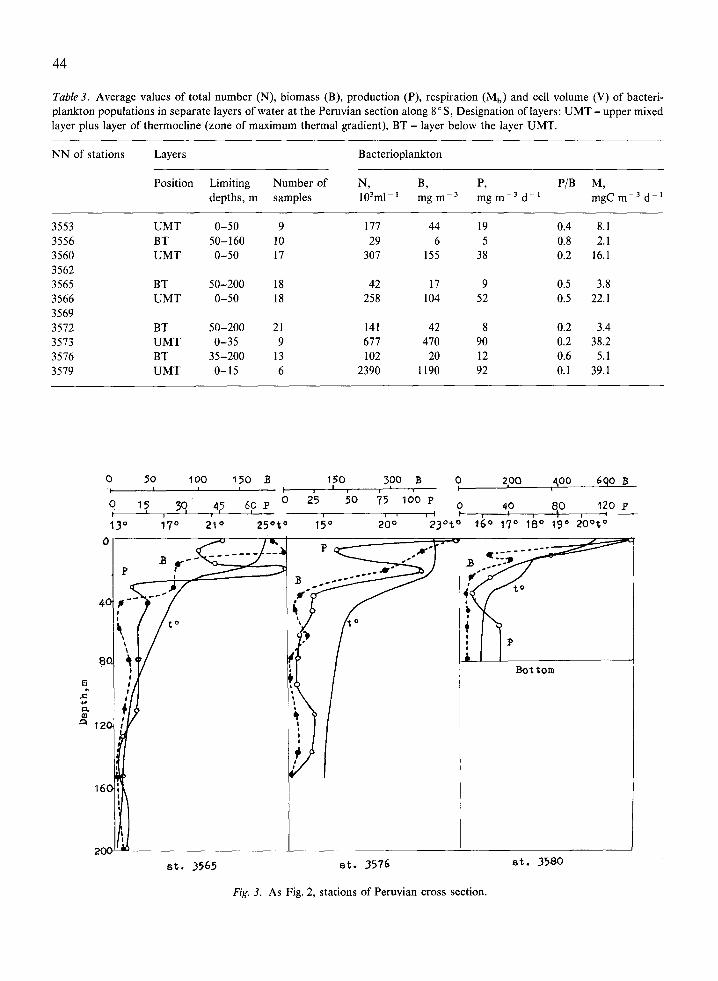
The Peruvian section along 8” S crossed the areas of divergence and of coastal upwelling. The first 8 stations were situated in the area of diver- gence, where the upper boundary of the thermo- cline was relatively high - at 15-30 m depth. The results obtained at these stations are summarized in Table 3. The bacterioplankton corresponded to that in mesotrophic waters. Up to a depth of 50 m, the total bacterioplankton varied within 180-300.103 ml-’ and its biomass was 44-150 mg rnp3. Below 50 m, numbers and biomass decreased 5-10 times. A typical vertical distribution is given in Fig. 3. The integral biomass of the layer O-200 m on the oceanic side of the Peruvian section (st. 3553, 3556) was 2-2.9 g rnb2 (Table 2). In the easternmost stations it increased to 6-12 g rnp2, and at st. 3569 it reached 17.4 g me2. The microbial pro-
P gm -Zd-’
0.15
1.38 1.20 1.57
3.63 1.80
1.47 1.20 3.13 3.97 2.31 3.12 5.14 4.11 6.42 4.0 3.96 3.66
P/B
1.1
0.3 0.3 0.4
1.0 0.2
0.8 0.4 0.5 0.3 0.2 0.5 0.3 0.3 0.2 0.3 0.1 0.3
Mb, gCm-*d ’
0.32
0.59 0.51 0.61
1.54 0.77
0.62 0.51 1.33 1.68
0.98 1.32 2.18 2.03 2.73 1.70 1.68 1.55
duction varied (from west to east) from 1.2 to 5.1 g m - 2 d - ’ (Table 2). The respiration in the surface layer was 8-22 mg C m- 3 d - i (Table 3).
In the upper layers of the coastal upwelling (stations 3573-3580) total bacterioplankton in- creased to that of eutrophic waters : 0.677-2.39. lo6 ml- ‘. Its biomass increased up to 1.2 g m - 3 (Table 3). Below the thermocline, biomass decreased 3-5 times (Fig. 3). Production in the upper layer was 92 mg m ~ 3 d - ’ and respi- ration39mgCm~30rabout0.1mg021-‘d~’ (Table 3). P/B values were low (0.1-0.3 dd ‘), typical of coastal and eutrophic waters (Sorokin & Mikheev, 1979). Microbial biomass in the top 200 meters (st. 3573 and 3579) was about 30gme2, the highest value recorded. Integral microbial production was 4-6 g me2 (Table 2).
At some stations the potential activity of the microbial population was evaluated from the rela- tive rate of assimilation of C14-labelled organic matter hydrolizate of algal protein (Sorokin & Kadota, 1972). Absolute activity of the local
44
Table 3. Average values of total number (N), biomass (B), production (P), respiration (Mb) and cell volume (V) of bacteri- plankton populations in separate layers of water at the Peruvian section along 8” S, Designation of layers: UMT - upper mixed layer plus layer of thermochne (zone of maximum thermal gradient), BT - layer below the layer UMT.
NN of stations Layers Bacterioplankton
Position Limiting Number of N, R P, P/B M, depths, m samples 10%-r mg mm3 mg m -3 d-L mgC m-3 dd*
3553 3556 3560 3562 3565 3566 3569 3512 3573 3576 3519
UMT O-50 9 111 44 19 0.4 8.1 BT 50-160 10 29 6 5 0.8 2.1 UMT O-50 17 307 155 38 0.2 16.1
BT 50-200 18 42 17 9 0.5 3.8 UMT O-50 18 258 104 52 0.5 22.1
BT 50-200 21 141 42 8 0.2 3.4 UMT o-35 9 671 470 90 0.2 38.2 BT 35-200 13 102 20 12 0.6 5.1 UMT o-15 6 2390 1190 92 0.1 39.1
0 50 100 150 B 150 300 B 0 -V’
zpo qoo 6qO B I- 0 75 t 3g 4; 6? P ' 25 5o 75 100 P o 40 120 p I , 8,O , ~__
13” i70 210 250t0 15O 200 230t” 160 17" lb0 190 20°t0
at. 3565 et. 3576
Bottom
at. 3580
Fig. 3. As Fig. 2, stations of Peruvian cross section.
45
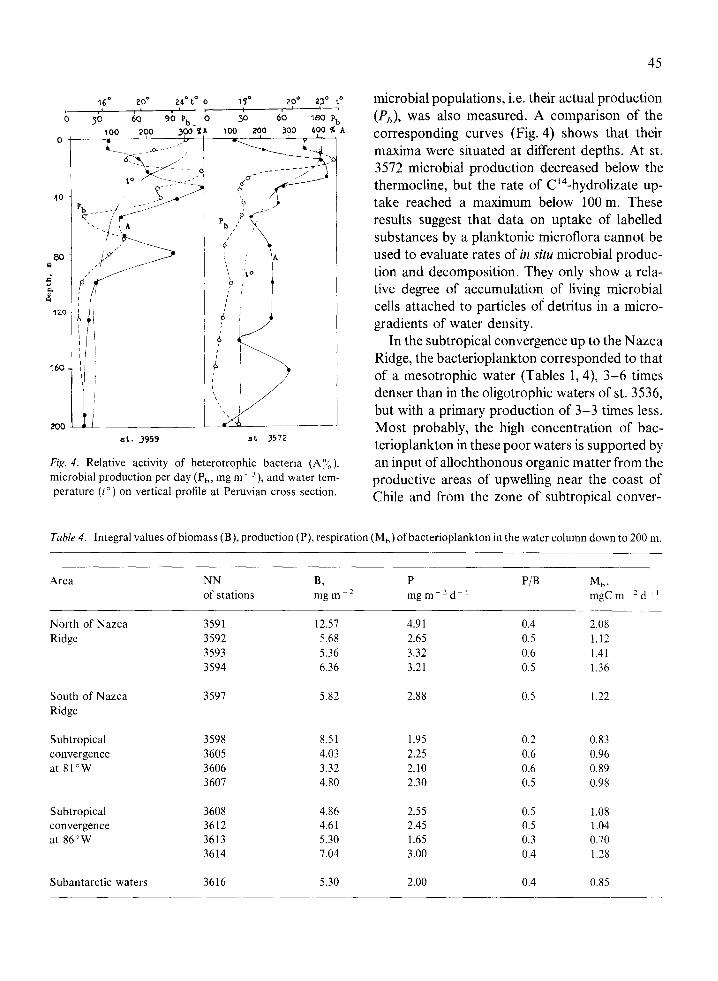
microbial populations, i.e. their actual production (Pb), was also measured. A comparison of the corresponding curves (Fig. 4) shows that their maxima were situated at different depths. At st. 3572 microbial production decreased below the thermocline, but the rate of C’4-hydrolizate up- take reached a maximum below 100 m. These results suggest that data on uptake of labelled substances by a planktonic microflora cannot be used to evaluate rates of in situ microbial produc- tion and decomposition. They only show a rela- tive degree of accumulation of living microbial cells attached to particles of detritus in a micro- gradients of water density.
In the subtropical convergence up to the Nazca Ridge, the bacterioplankton corresponded to that of a mesotrophic water (Tables 1,4), 3-6 times denser than in the oligotrophic waters of st. 3536, but with a primary production of 3-3 times less. Most probably, the high concentration of bac- terioplankton in these poor waters is supported by an input of allochthonous organic matter from the productive areas of upwelling near the coast of Chile and from the zone of subtropical conver-
16” ZOO zu"to 0 19 zoo 21° to / 0 30 60 90 P, 0 30 60 180 Pb
0 1 40
160
200 et. 3959
Fig. 4. Relative activity of heterotrophic bacteria (A%), microbial production per day (P,,, mg m - 3), and water tem- perature (t”) on vertical profile at Peruvian cross section.
Table 4. Integral values ofbiomass (B), production (P), respiration (Mb) ofbacterioplankton in the water column down to 200 m.
Area NN B, P of stations mgm-’ mgm-‘d-’
Mb, mgCm-‘d ’
North of Nazca Ridge
3591 12.57 4.91 0.4 2.08 3592 5.68 2.65 0.5 1.12 3593 5.36 3.32 0.6 1.41 3594 6.36 3.21 0.5 1.36
South of Nazca Ridge
3597 5.82 2.88 0.5 1.22
Subtropical convergence at 8l”W
3598 8.51 1.95 0.2 0.83 3605 4.03 2.25 0.6 0.96 3606 3.32 2.10 0.6 0.89 3607 4.80 2.30 0.5 0.98
Subtropical convergence at 86”W
3612 3613 3614
4.86 2.55 0.5 1.08 4.61 2.45 0.5 1.04 5.30 1.65 0.3 0.70 7.04 3.00 0.4 1.28
Subantarctic waters 3616 5.30 2.00 0.4 0.85
46
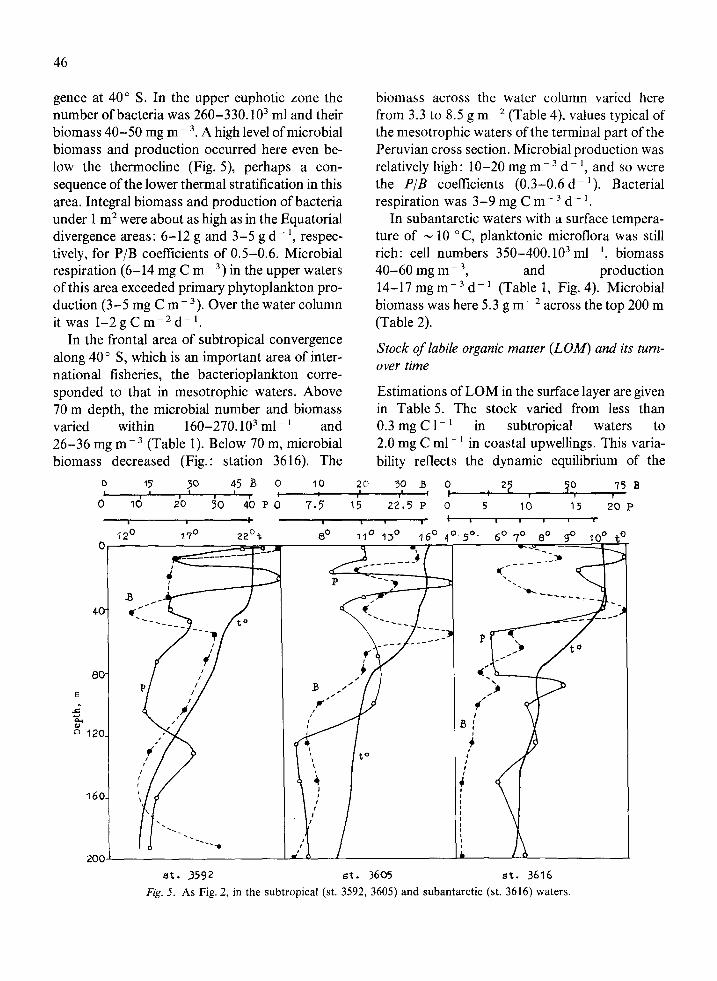
gence at 40” S. In the upper euphotic zone the number of bacteria was 260-330. lo3 ml and their biomass 40-50 mg m- 3. A high level of microbial biomass and production occurred here even be- low the thermocline (Fig. 5), perhaps a con- sequence of the lower thermal stratification in this area. Integral biomass and production of bacteria under 1 m* were about as high as in the Equatorial divergence areas: 6-12 g and 3-5 g d- ‘, respec- tively, for P/B coefficients of 0.5-0.6. Microbial respiration (6-14 mg C m- ‘) in the upper waters of this area exceeded primary phytoplankton pro- duction (3-5 mg C me3). Over the water column it was l-2gCm-*d-l.
biomass across the water column varied here from 3.3 to 8.5 g m ~ * (Table 4), values typical of the mesotrophic waters of the terminal part of the Peruvian cross section. Microbial production was relatively high: lo-20 mg m 3 d- ‘, and so were the P/B coefficients (0.3-0.6 d- ‘). Bacterial respiration was 3-9 mg C m- 3 d- ‘.
In subantarctic waters with a surface tempera- ture of N 10 “C, planktonic microflora was still rich: cell numbers 350-400. lo3 ml- ‘, biomass 40-60 mg m - 3, and production 14-17 mg rnp3 d- ’ (Table 1, Fig. 4). Microbial biomass was here 5.3 g me2 across the top 200 m (Table 2).
In the frontal area of subtropical convergence along 40” S, which is an important area of inter- national fisheries, the bacterioplankton corre- sponded to that in mesotrophic waters. Above 70 m depth, the microbial number and biomass varied within 160-270.103 ml- i and 26-36 mg m - 3 (Table 1). Below 70 m, microbial biomass decreased (Fig.: station 3616). The
Stock of labile organic matter (LO&f) and its turn- over time
Estimations of LOM in the surface layer are given in Table 5. The stock varied from less than 0.3mgCl-’ in subtropical waters to 2.0 mg C ml- i in coastal upwellings. This varia- bility reflects the dynamic equilibrium of the
0 IS 30 45B 0 10 20 30 B 0 75 B I 1 I I r I I 27 70 I I r I , 1 0 10 20 70 40 P 0 7.5 15 22.5 P 0 5 10 15 20 P
I + 1 1 I f-t, 618 1 f 12O 170 22"t 8' 11' 13' 16’ 4O.5’. 10' t'
st. 3592 st. 3605 st. 3616 Fig. 5. As Fig. 2, in the subtropical (st. 3592, 3605) and subantarctic (st. 3616) waters.
47
processes of production (by phytoplankton) and decomposition. The maximum rates of these two processes usually do not coincide in time (Sorokin, 1977). Values of the turnover time (T) of LOM in surface waters (Table 5) varied from 4 to 47 days. Fast turnover was observed in eutrophic water of coastal upwellings (4-8 days), and slow turnover (48 days) in the cold waters of the Subantarctic.
0 0 076 ‘70 I,5 cm . w/n
9 7
300
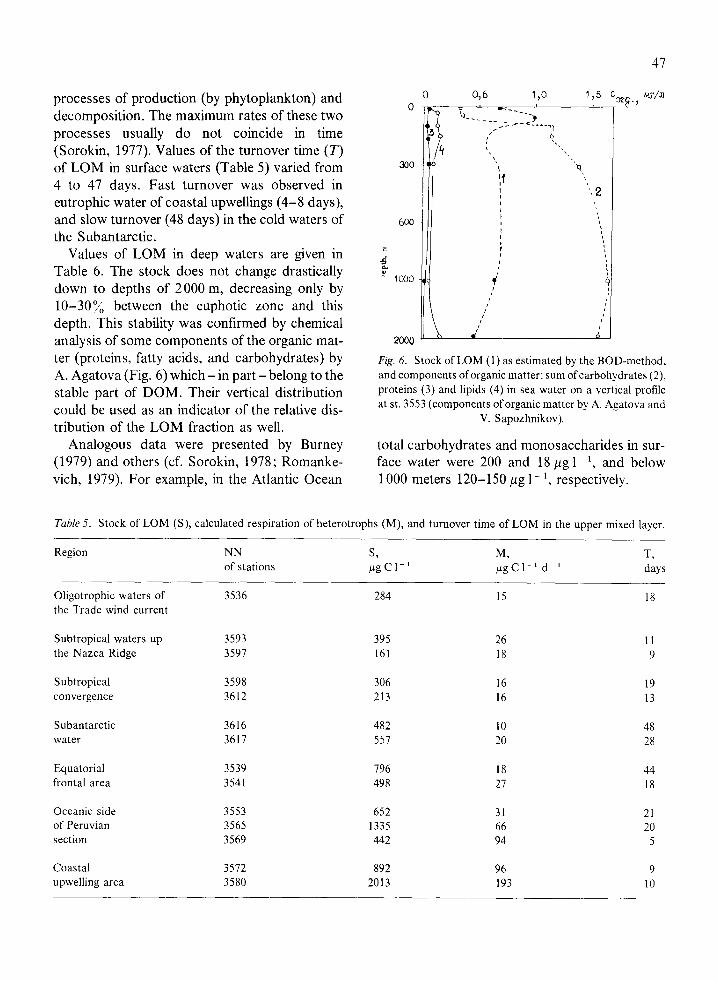
Values of LOM in deep waters are given in Table 6. The stock does not change drastically down to depths of 2000 m, decreasing only by lo-30% between the euphotic zone and this depth. This stability was confirmed by chemical analysis of some components of the organic mat- ter (proteins, fatty acids, and carbohydrates) by A. Agatova (Fig. 6) which - in part - belong to the stable part of DOM. Their vertical distribution could be used as an indicator of the relative dis- tribution of the LOM fraction as well.
2000
Fig. 6. Stock of LOM (1) as estimated by the BOD-method, and components oforganic matter: sum of carbohydrates (2) proteins (3) and lipids (4) in sea water on a vertical profile at st. 3553 (components oforganic matter by A. Agatova and
V. Sapozhnikov).
Analogous data were presented by Burney total carbohydrates and monosaccharides in sur- (1979) and others (cf. Sorokin, 1978; Romanke- face water were 200 and 18 pg 1 - ‘, and below vich, 1979). For example, in the Atlantic Ocean 1000 meters 120-150 pg l- ‘, respectively.
Table 5. Stock of LOM (S), calculated respiration of heterotrophs (M), and turnover time of LOM in the upper mixed layer.
Region NN of stations
s, pgCl-’
M, PgCl-’ dd’
T, days
Oligotrophic waters of the Trade wind current
3536 284 15 18
Subtropical waters up 3593 395 26 11 the Nazca Ridge 3591 161 18 9
Subtropical 3598 306 16 19 convergence 3612 213 16 13
Subantarctic 3616 482 10 48 water 3617 557 20 28
Equatorial 3539 196 18 44 frontal area 3541 498 21 18
Oceanic side 3553 652 31 21 of Peruvian 3565 1335 66 20 section 3569 442 94 5
Coastal 3512 892 96 9 upwelling area 3580 2013 193 10
48
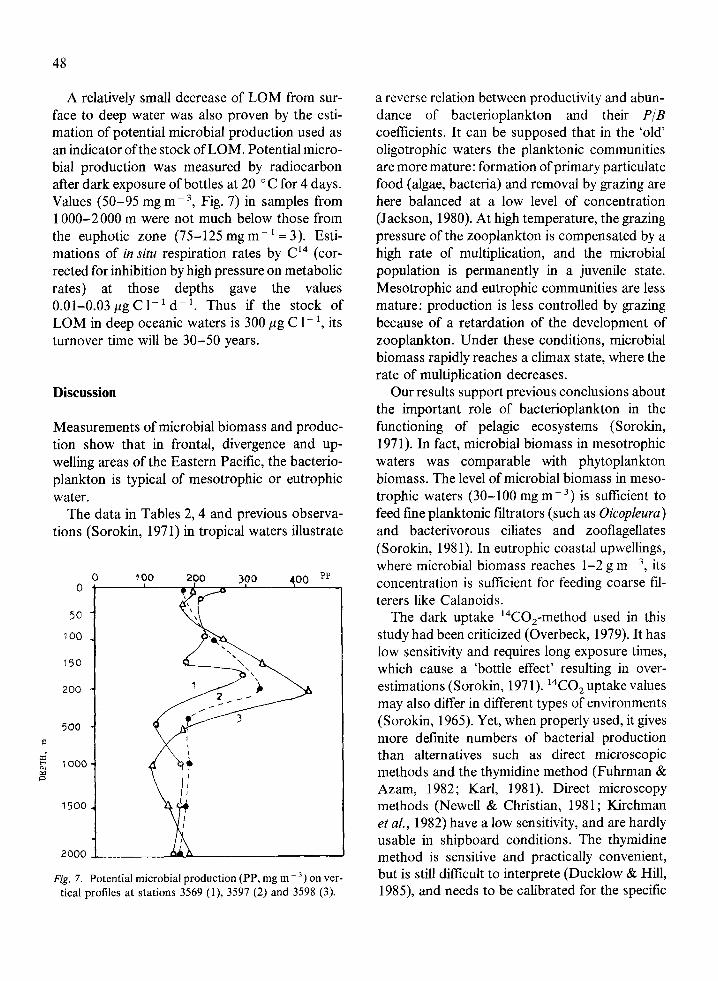
A relatively small decrease of LOM from sur- face to deep water was also proven by the esti- mation of potential microbial production used as an indicator ofthe stock of LOM. Potential micro- bial production was measured by radiocarbon after dark exposure of bottles at 20 ‘C for 4 days. Values (50-95 mg m- 3, Fig. 7) in samples from 1000-2000 m were not much below those from the euphotic zone (75-125 mg m- ’ = 3). Esti- mations of in situ respiration rates by Cl4 (cor- rected for inhibition by high pressure on metabolic rates) at those depths gave the values 0.01-0.03 pg C 1-l d- ‘. Thus if the stock of LOM in deep oceanic waters is 300 pg C l- ‘, its turnover time will be 30-50 years.
Discussion
Measurements of microbial biomass and produc- tion show that in frontal, divergence and up- welling areas of the Eastern Pacific, the bacterio- plankton is typical of mesotrophic or eutrophic water.
The data in Tables 2,4 and previous observa- tions (Sorokin, 1971) in tropical waters illustrate
Fig. 7. Potential microbial production (PP, mg m - 3, on ver- tical profiles at stations 3569 (I), 3597 (2) and 3598 (3).
a reverse relation between productivity and abun- dance of bacterioplankton and their P/B coefficients. It can be supposed that in the ‘old’ oligotrophic waters the planktonic communities are more mature: formation of primary particulate food (algae, bacteria) and removal by grazing are here balanced at a low level of concentration (Jackson, 1980). At high temperature, the grazing pressure of the zooplankton is compensated by a high rate of multiplication, and the microbial population is permanently in a juvenile state. Mesotrophic and eutrophic communities are less mature: production is less controlled by grazing because of a retardation of the development of zooplankton. Under these conditions, microbial biomass rapidly reaches a climax state, where the rate of multiplication decreases.
Our results support previous conclusions about the important role of bacterioplankton in the functioning of pelagic ecosystems (Sorokin, 1971). In fact, microbial biomass in mesotrophic waters was comparable with phytoplankton biomass. The level of microbial biomass in meso- trophic waters (30-100 mg m-‘) is sufficient to feed fine planktonic filtrators (such as Oicopleuru) and bacterivorous ciliates and zooflagellates (Sorokin, 198 1). In eutrophic coastal upwellings, where microbial biomass reaches 1-2 g m- 3, its concentration is sufficient for feeding coarse fil- terers like Calanoids.
The dark uptake “C0,-method used in this study had been criticized (Overbeck, 1979). It has low sensitivity and requires long exposure times, which cause a ‘bottle effect’ resulting in over- estimations (Sorokin, 1971). 14C0, uptake values may also differ in different types of environments (Sorokin, 1965). Yet, when properly used, it gives more definite numbers of bacterial production than alternatives such as direct microscopic methods and the thymidine method (Fuhrman & Azam, 1982; Karl, 1981). Direct microscopy methods (Newell & Christian, 1981; Kirchman et al., 1982) have a low sensitivity, and are hardly usable in shipboard conditions. The thymidine method is sensitive and practically convenient, but is still difficult to interprete (Ducklow & Hill, 1985), and needs to be calibrated for the specific
49
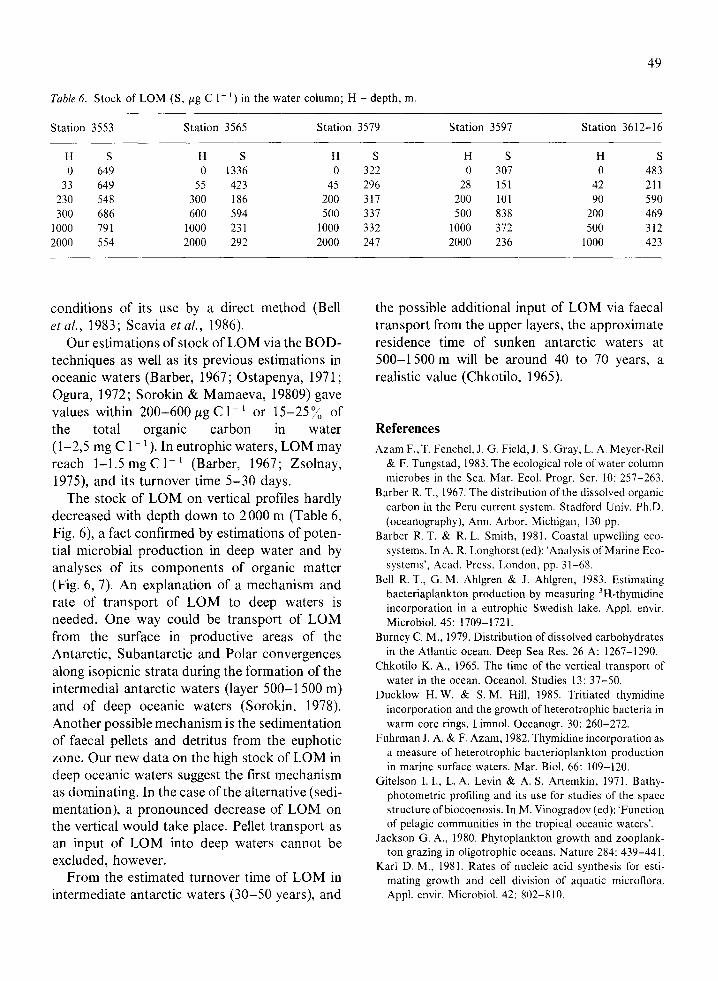
Table 6. Stock of LOM (S, pg C l- ‘) in the water column; H - depth, m.
Station 3553 Station 3565 Station 3579 Station 3597 Station 3612-16
H S H S H S H S H S 0 649 0 1336 0 322 0 307 0 483
33 649 55 423 45 296 28 151 42 211 230 548 300 186 200 317 200 101 90 590 300 686 600 594 500 337 500 838 200 469
1000 791 1000 231 1000 332 1000 372 500 312 2000 554 2000 292 2000 247 2000 236 1000 423
conditions of its use by a direct method (Bell et al., 1983; Scavia et al., 1986).
Our estimations of stock of LOM via the BOD- techniques as well as its previous estimations in oceanic waters (Barber, 1967 ; Ostapenya, 197 1; Ogura, 1972; Sorokin 8z Mamaeva, 19809) gave values within 200-600 pg C 1~ ’ or 15-25 y0 of the total organic carbon in water (l-25 mg C l- ‘). In eutrophic waters, LOM may reach l-l.5 mg C l- ’ (Barber, 1967; Zsolnay, 1975), and its turnover time 5-30 days.
the possible additional input of LOM via faecal transport from the upper layers, the approximate residence time of sunken antarctic waters at 500-1500 m will be around 40 to 70 years, a realistic value (Chkotilo, 1965).
References
The stock of LOM on vertical profiles hardly decreased with depth down to 2000 m (Table 6, Fig. 6), a fact confirmed by estimations of poten- tial microbial production in deep water and by analyses of its components of organic matter (Fig. 6,7). An explanation of a mechanism and rate of transport of LOM to deep waters is needed. One way could be transport of LOM from the surface in productive areas of the Antarctic, Subantarctic and Polar convergences along isopicnic strata during the formation of the intermedial antarctic waters (layer 500-l 500 m) and of deep oceanic waters (Sorokin, 1978). Another possible mechanism is the sedimentation of faecal pellets and detritus from the euphotic zone. Our new data on the high stock of LOM in deep oceanic waters suggest the first mechanism as dominating. In the case of the alternative (sedi- mentation), a pronounced decrease of LOM on the vertical would take place. Pellet transport as an input of LOM into deep waters cannot be excluded, however.
Azam F., T. Fenchel, J. G. Field, J. S. Gray, L. A. Meyer-Reil & F. Tungstad, 1983. The ecological role of water column microbes in the Sea. Mar. Ecol. Progr. Ser. 10: 257-263.
Barber R. T., 1967. The distribution of the dissolved organic carbon in the Peru current system. Stadford Univ. Ph.D. (oceanography), Ann. Arbor. Michigan, 130 pp.
Barber R. T. & R. L. Smith, 1981. Coastal upwelling eco- systems. In A. R. Longhorst (ed): ‘Analysis of Marine Eco- systems’, Acad. Press, London, pp. 31-68.
Bell R. T., G. M. Ahlgren & J. Ahlgren, 1983. Estimating bacteriaplankton production by measuring 3H-thymidine incorporation in a eutrophic Swedish lake. Appl. envir. Microbial. 45: 1709-1721.
From the estimated turnover time of LOM in intermediate antarctic waters (30-50 years), and
Burney C. M., 1979. Distribution of dissolved carbohydrates in the Atlantic ocean. Deep Sea Res. 26 A: 1267-1290.
Chkotilo K. A., 1965. The time of the vertical transport of water in the ocean. Oceanol. Studies 13: 37-50.
Ducklow H. W. & S. M. Hill, 1985. Tritiated thymidine incorporation and the growth of heterotrophic bacteria in warm core rings. Limnol. Oceanogr. 30: 260-272.
Fuhrman J. A. & F. Azam, 1982. Thymidine incorporation as a measure of heterotrophic bacterioplankton production in marine surface waters. Mar. Biol. 66: 109-120.
Gitelson I. I., L. A. Levin & A. S. Artemkin, 1971. Bathy- photometric profiling and its use for studies of the space structure of biocoenosis. In M. Vinogradov (ed): ‘Function of pelagic communities in the tropical oceanic waters’.
Jackson G. A., 1980. Phytoplankton growth and zooplank- ton grazing in oligotrophic oceans. Nature 284: 439-441.
Karl D. M., 1981. Rates of nucleic acid synthesis for esti- mating growth and cell division of aquatic microflora. Appl. envir. Microbial. 42: 802-810.
50
Kirchman D., H. Ducklow & R. Mitchell, 1982. Estimates of bacterial growth from changes of uptake rates and biomass. Appl. envir. Microbial. 44: 1296-1307.
Lee S. & J. A. Fuhrman, 1987. Biovolume and biomass of marine bacterioplankton. Appl. envir. Microbial. 53: 1298-1303.
Moiseev P. A., 1968. Biological resources of the World Ocean. Moscow.
Nevell S. Y. & R. R. Christian, 1981. Frequency of dividing cells as an estimator of bacterial productivity. Appl. envir. Microbial. 42: 23-31.
Ogura N., 1972. Rate and extent of decomposition of dis- solved organic matter in surface seawater. Mar. Biol. 13: 89-93.
Ostapenya A. P., 1971. Biochemical consumption of oxygen. In M. Vinogradov (ed.): ‘Functioning of the pelagic com- munities in tropical oceanic waters’. Moscow, pp. 250-254.
Overbeck J., 1979. Dark CO2 uptake - biochemical background and its relevance to in situ bacterial produc- tion. Arch. Hydrobiol. Beih. 12: 38-47.
Petipa T. S., A. V. Monakov, Y. I. Sorokin & I. V. Kukina, 1977. Balance of matter and energy in copepods in tropical upwelling area. Polskie Arch. Hydrobiol. Suppl. 24: 213-230.
Romanenko V. I., 1964. Heterotrophic assimilation of CO2 by aquatic microflora. Microbiologia 33: 679-683.
Romankevich E. A., 1979. Composition of organic matter. In 0. Bordovsky (ed.): Chemistry of the ocean, Moscow 1: 266-277.
Ryther J. H., 1969. Photosynthesis and fish production in the sea. Science 166: 72-76.
Scavia D. & G. Laird, 1987. Bacterioplankton in lake Michigan. Limnol. Oceanogr. 32: 1017-1033.
Sorokin Y. I., 1965. On the trophic role of chemosynthesis and microbial biosynthesis in water bodies. Mem. ital. Idrobiol. 18: 187-200.
Sorokin Y. I., 1969. Experimental study of influence of pres- sure and temperature upon the metabolism of deep sea microflora. Microbiologiya 38: 868-877.
Sorokin Y. I., 1971. On the role of bacteria in productivity of tropical oceanic waters. Int. Revue ges. Hydrobiol. 56: l-48.
Sorokin Y. I., 1973. Data on the biological productivity ofthe tropical oceanic waters. Mar. Biol. 20: 177-196.
Sorokin Y. I., 1977. Heterotrophic phase of plankton suc- cession in the Japan sea. Mar. Biol. 41: 107-117.
Sorokin Y. I., 1978. Organic matter decomposition and nutrients regeneration. In: Kinne 0. (ed.), Marine Ecology. Academic Press, New York, pp. 501-616.
Sorokin Y. I., 1981. Microheterotrophic microorganisms in marine ecosystems. ‘Analysis ofmarine ecosystems’, Acad. Press, London, pp. 293-342.
Sorokin Y. I. & H. Kadota, 1972. Microbial production and decomposition in fresh waters. I.B.P. Handbook 23: 112 PP.
Sorokin Y. I. & J. Kogelshatz, 1979. Analysis of hetero- trophic microplankton in an upwelling area. Hydrobiologia 66: 195-208.
Sorokin Y. I. & T. I. Mamaeva, 1980. Rate and efficiency of the utilization oflabile organic matter by planktonic micro- flora in coastal Peruvian waters. Polsk Arch. Hydrobiol. 27: 447-456.
Sorokin Y. I. & V. N. Mikheev, 1979. On the characteristics of the Peruvian upwelling ecosystem. Hydrobiologia 62: 165-189.
Sorokin Y. I. & E. B. Paveljeva, 1978. On structure and functioning of the ecosystem of salmon lake. Hydro- biologia 57: 25-48.
Sorokin Y. I., E. B. Paveljeva & M. I. Vasiljeva, 1977a. Pro- ductivity and trophic role of bacterioplankton. Polsk. Arch. Hydrobiol. 24 24 (Suppl.): 241-259.
Sorokin Y. I., I. N. Sukhanova & G. N. Konivalova, 1977b. Primary production and the phytoplankton of the equa- torial region in the Eastern Pacific ocean. Polsk. Arch. Hydrobiol. 24 (Suppl.): 148-162.
Vinogradov M. E., 1981. Ecosystems of Equatorial upwelling. In A. R. Longhorst (ed.): ‘Analysis of Marine Ecosystems’, Acad. Press, London, pp. 69-93.
Vinogradov M. E., I. I. Gitelson & Y. I. Sorokin, 1970. The vertical structure of pelagic community in the tropical ocean. Mar. Biol. 6: 3.
Wooster W. S., 1970. The Scientific exploration of the South Pacific. Nat. Acad. Sci., Washington DC., 250 pp.
Wyrtki K., 1966. The oceanography of the eastern equatorial Pacific ocean. Oceanogr. Mar. Biol. annu. Rev. 4: 33-68.
Zsolnay A., 1975. Total labile carbon in the euphotic zone of the Baltic sea as measured by BOD. Mar. Biol. 29: 125-128.