roi needed: reality-computing trends for industrial...
TRANSCRIPT

UT21449
ROI Needed: Reality-Computing Trends for Industrial Facilities Scott Diaz – Director of Business Development, BIM/CIM FARO Technologies, Inc. John Bunn – Technical Sales Engineer FARO Technologies, Inc. Nicolas Arnold – VP Product SKUR, Inc.
Description
Times are tough, budgets are tight, and teams are lean. The past year has been full of heartache—especially for those working in the petrochemical field. Long gone are the days of $100 oil. Nonetheless, facilities are busy and business must continue. Maintaining facilities on a tighter budget means owners are looking for the best possible return on investment. Technology to the rescue! This class will welcome a variety of real-world stories about how engineering firms are benefiting from their investment in reality capture and Autodesk, Inc.’s, reality-computing workflows. Attendees will listen to their peers share stories about the latest trends for extracting value from point clouds in the plant environment and how it is saving their company money. Topics may include point clouds to fabrication, scanning for asset management, verifying new design in the as-built environment, and more. In addition, speakers will show practical demonstrations of how these workflows are accomplished in Autodesk software This session features AutoCAD Plant 3D and ReCap 360.
Your AU Expert(s)
Scott Diaz, FARO Technologies, Inc., Director Business Development, BIM/CIM Scott Diaz is director of business development for BIM/CIM at FARO Technologies, Inc. Over the past 8 years he has been directly involved with rapidly advancing surveying technologies throughout a variety of industries with a focus on promoting, developing and teaching Autodesk based reality capture/reality computing workflows. Scott has a background in business management and marketing with an MBA from Lamar University. He is the former owner of kubit USA, Inc. acquired by FARO Technologies, Inc. in March 2015.
John Bunn, FARO Technologies, Technical Sales Engineer
Learning Objectives
Discover how engineering firms and owner/operators are experiencing high returns from their investments in reality-computing technology
Learn the latest trends and Autodesk tools for extracting value from laser-scan data
View practical demonstrations on how to create typically needed plant deliverables from as-built point clouds Learn about reality-computing workflow pains and solutions from peers actively using the technology today

John Bunn was formerly the director of technical sales for kubit USA and an assistant product manager for kubit globally. Since kubit’s acquisition, he has taken the role of Technical Sales Engineer to assist customers and colleagues with optimizing their workflows in a variety of different applications and industries. John has more than 17 years of AutoCAD experience as a user and professional programmer with specialty knowledge in the industrial facility/piping design space. He is an expert level user and trainer of point cloud design and modeling within the AutoCAD environment.
Nicolas Arnold, SKUR Inc., VP Product Nicolas Arnold serves as SKUR’s VP of Product Development. Nic brings over 15 years of experience in product and innovation management, mostly related to construction applications. He co-founded BuildPoint, an e-commerce solution for the construction industry. He joined Siemens in a corporate consulting role to focus on product development and innovation management. Nicolas served as VP of Product and Innovation Management for ADAPT, a structural engineering software firm. Most recently, he was program manager for an ESA mission related development project and co-founded nifty4D, Switzerland’s first VDC consulting firm. Nicolas earned his civil engineering degree from Technical University Munich, Germany.
Improving ROI With New Technology The past year has been a wake-up call for those working in petrochemical. Long gone are the days of $100 oil. Crude prices have more than halved since mid-2014 forcing budget cuts into the billions. According to the International Energy Agency (IEA) global upstream exploration and production on oil and gas spending has fallen by more than $300 billion across the industry in 2015-2016. Around 2/3 of this comes from cost cuts rather than cancelling or shelving projects. In other words, facilities remain busy and business must continue. Companies must maintain facilities on a tighter budget while preserving infrastructure that will allow them to compete if/when the market recovers. Owners are faced with the reality of cutting costs and operating smarter which means investment in new technology. According to a Reuters October 2016 article entitled Oil majors experiment with technology to weather crisis “executives say the growing attention on technologies that have been around for some time shows how wasteful the global industry had been the years before the downturn when – with crude at above $100 a barrel– oil companies’ had little inventive to develop fields efficiently.” Times have changed and the race to finding ROI is in full effect. In summary, technical innovation in the industry is not about one large change; it is about many incremental workflow improvements which accumulate to much lower costs. How is new technology playing a role to assist in these practices? In the same light how is reality computing technology continuing to play a role?
New Technology for Industrial Facilities The following examples are merely a sample of what companies are investigating as technology
Drone Inspection The use of UAVs are quickly making their way into industrial facilities as well as offshore platforms. No need for plant shut-down, dangerous equipment climbing, or additional manpower. Periodic inspections can be carried out with low cost to owners. https://youtu.be/71_NYF-5tnk

CYBERHAWK DRONES USED FOR FLARE STACK INSPECTIONS
Motion of the Ocean Recently Shell has developed a new type of pipe called a “steel lazy wave riser” to carry oil and gas from its deepwater fields in the Gulf of Mexico. The pipe bends to absorb the motion of the sea and the floating platform which is boosting production.
Steel Lazy Wave Rider
Use data better, reduce waste, cut costs The oil industry, unlike other industries like construction, is one of the most digitalized industries. Companies must put the vast amount of data to work in more efficient ways. Improvements in data management software are allowing companies like Shell and ExxonMobil to cut wate through smarter ordering of construction materials. When companies get stuck with excess material they can suffer great losses because resale value is quite low. According to Patrick Holcomb, VP at Intergraph, “previously it was industry standard to order 3-5% more materials than needed, which in a billion dollar project is a lot of money.”
Reality Computing Technology The rest of this handout will focus on how reality computing technology is assisting in cost reduction and better ROI for industrial facilities. Particular attention will be paid to real customers implementing 3D laser scanning with Autodesk software.

Customer Success Story - Hargrove
Hargrove Engineers is a company with multiple locations all over the U.S. This particular branch is located in Beaumont, TX. They strive in using new technology and practices to achieve their company’s ultimate goal : Hargrove’s safety culture protects and promotes the well-being of every person who works with us and every person touched by our work. For Hargrove, our philosophy is not only to comply with all safety and environmental rules and regulations but to set the standard by working safely on-site and off. We operate as a Team to create workplaces that are healthful and free from all incident and injury.
Heater Equipment Replacement The first project we will focus on was a heater replacement. There were many difficulties for this project, and all of these problems pointed to utilizing laser scanning as the perfect solution.
VIEW FROM THE EAST SIDE OF THE PREHEATER - LOOKING UP AT THE FLANGE CONNECTION AT THE COLD
GAS OUTLET DUCT (3D AUTOCAD MODEL POSITIONED IN THE POINT CLOUD)
Project Overview The equipment was being built in a fabrication shop in the Czech Republic, and they needed to verify it would fit before being shipped to the U.S.

VIEW FROM THE EAST SIDE OF THE PREHEATER - LOOKING UP AT THE FLANGE CONNECTION AT THE
COLD GAS OUTLET DUCT (PHOTO VIEW FROM LASER SCANNER)
Estimated Deadline Project began in March 2016 and needed to be completed before August 2016 to avoid a shutdown.
VIEW FROM THE WEST SIDE OF THE PREHEATER - LOOKING UP AT THE FLANGE CONNECTION AT THE
COLD AIR INLET DUCT (3D AUTOCAD MODEL POSITIONED IN THE POINT CLOUD)
Financial/Safety Concerns Wanted to verify everything would fit perfectly before having to ship heavy parts
from Czech Republic.

Needed to have all this fixed and fully-functional before August 2016 to avoid shutdown costs
Crane time is very expensive. Wanted to limit crane time as much as possible
Area of concern was 3 stories tall, so safety was a major concern. It is much safer to be able to scan on the ground versus climb a ladder or use a lift
VIEW FROM THE WEST SIDE OF THE PREHEATER - LOOKING UP AT THE FLANGE CONNECTION AT THE
COLD AIR INLET DUCT (PHOTO VIEW FROM LASER SCANNER)
Project Difficulties If it didn’t fit, they would have to ship back and forth to Czech Republic or make
field adjustments. This would also mean wasted crane time (very expensive)
Original equipment and concrete was poured 50 years ago
No decent drawings to go off of. Even if they did have good drawings, they would be 50 years old. The images they had were PDFs created off of microfilm images of hand-drawn drawings from original construction
Elevated foundation makes field work difficult

VIEW FROM THE SOUTH SIDE OF THE PREHEATER - LOOKING UP AT THE FLANGE CONNECTION AT THE
HOT AIR OUTLET DUCT (3D AUTOCAD MODEL POSITIONED IN THE POINT CLOUD)
Materials Used FARO X330 Laser Scanner
AutoCAD 2016 with CADWorx plug-in
FARO SCENE
PointSense Plant 16.5
Steps Taken Scan with FARO X300
Bring data into SCENE to register and clean data
Imported into RCP format for use in AutoCAD
Used PointSense Plant to visualize and measure key areas
Modeling completed in CADWorx

VIEW FROM THE SOUTH SIDE OF THE PREHEATER - LOOKING UP AT THE FLANGE CONNECTION AT THE
HOT AIR OUTLET DUCT (PHOTO VIEW FROM LASER SCANNER)
Completed Project Statistics Actual time to complete
o Scanning and Registration took 3 hours o Modeling took 3 days
Actual cost o Standard labor units for roughly 30 hours
VIEW FROM THE NORTH WEST SIDE OF THE PREHEATER - LOOKING UP AT THE FLANGE CONNECTION AT
THE HOT AIR OUTLET DUCT

(3D AUTOCAD MODEL POSITIONED IN THE POINT CLOUD)
Interesting Note By scanning ahead of time, they actually found out the bolt pattern was backwards on the blower box (3 stories tall). Without laser scanning, they would have had to receive the part from Czech Republic, use the crane to lift into place, send it back to the Czech Republic and start all over again. MAJOR TIME AND MONEY SAVINGS!
VIEW FROM THE NORTH WEST SIDE OF THE PREHEATER - LOOKING UP AT THE FLANGE CONNECTION AT
THE HOT AIR OUTLET DUCT (3D AUTOCAD MODEL POSITIONED IN THE POINT CLOUD)
End Result : Return on Investment Saved $25,000 on crane time by discovering backwards bolt pattern before being
in the field Saved roughly $2,000 on labor units Avoided safety concerns during measurements by being able to scan on the
ground Completed project nearly 5 months ahead of deadline
Emergency Jacketed Sulfur Pit Piping The second project was a very time-sensitive situation with a huge health risk. There was a leak in a Sulfur Pit that traditional methods would require workers who were Fresh Air Certified, in order to inspect and measure the area.
Project Overview The leak in the Sulfur Pit caused a steam pressure leak. This created a very short window to diagnose and fix the issue, in order to avoid a complete shutdown from the pressure getting too low. There was about a 20-30 foot area that needed to be scanned.

Estimated Deadline This was an emergency situation, so the deadline was immediate. Things had to be done as quickly as possible.
Financial/Safety Concerns A shutdown would cost at least $100,000 per day
This particular area would require personnel who were Fresh Air Certified, in order to get close enough to the area to inspect and measure
JACKETED SULPHUR PIT PIPING LOOKING NORTHEAST. THE SCAN WAS TAKEN FROM OUTSIDE A
BARRICADE ABOUT 30-40 FEET FROM THE PIPING (3D AUTOCAD MODEL POSITIONED IN THE POINT CLOUD)
Project Difficulties 30 foot hard barricade around the area made it impossible to access quickly
Needed Fresh Air Certified personnel to measure up close if they used traditional methods
This was a major emergency with a very critical need for the fastest response possible
Materials Used FARO X330 Laser Scanner
AutoCAD 2016 with CADWorx plug-in
PointSense Plant 16.5
Steps Taken Scan with FARO X300
Bring data into SCENE to register and clean data
Imported into RCP format for use in AutoCAD
Used PointSense Plant to backmodel key tie-in points and existing piping
New modeling completed in CADWorx

Completed Project Statistics Actual time to complete
o Project was completed (Issued for Construction) in less than a week! o 3 spools completed for steam jacketed piping o Roughly 20 feet of piping going to and from a control valve and another
pipe that went downhill into the sulfur pit with a temperature control
Actual cost o Standard labor units for less than a week
STEAM LINE REPAIR FROM THE SOUTHEAST
(3D AUTOCAD MODEL POSITIONED IN THE POINT CLOUD)
Interesting Notes The client was skeptical about everything, so they brought extra materials and fittings just in case. Everything fit perfectly on the first try, and they were so impressed they immediately came back with two more projects!

The immediate project after this was very similar with an emergency steam repair. If this area failed, the entire unit would have been shut down. The steam was blowing out, so no one could get close enough to it to measure. They brought some air movers to blow the steam away, scanned it, and had everything done in a few hours.
End Result : Return on Investment Saved a lot of money on not needing a full day of Fresh Air Certified personnel to
measure and assess damage Only needed a three hour shutdown to install, versus an entire day to measure
and install later. This is a cost of $16,000 versus $100,000+ Avoided putting contractors in a dangerous area by being able to scan from
beyond the barricade
Customer Success Story – SKUR Clients
The SKUR ROI proposition is simple and impressive.
In case after case, the cost of buying or renting a scanner, performing scans, and then running the SKUR Diff process results in ROI beyond expectations. Simply put, SKUR allows quality control to happen in real-time, risk mitigation is simplified, errors are fixed sooner, supply chains don't get stopped, and personnel is utilized with greater efficiency.
Validating Designed Interfaces To Receive Manufactured Components Construction projects often need to precisely match a built interface with components after being manufactured or assembled remotely. The most common and classic examples are large-scale Mechanical systems for plants and complicated facades in commercial construction projects. Because one part is often built remotely, an error in the on-site as-built component will cause significant delays if discovered after manufacture, shipping, and attempted installation. Of course, manufacturing errors of the remotely built parts lead to the same consequences.
Project and Problem Description A new corporate headquarters was designed with an almost 100-yard-long twisting and undulating glass facade connecting to a cantilevered atrium roof. The question from the project was whether the faceplates, slanted load bearing columns and cast-in-place anchor bolts on site are located within the required tolerances for the curtain wall to be installed.
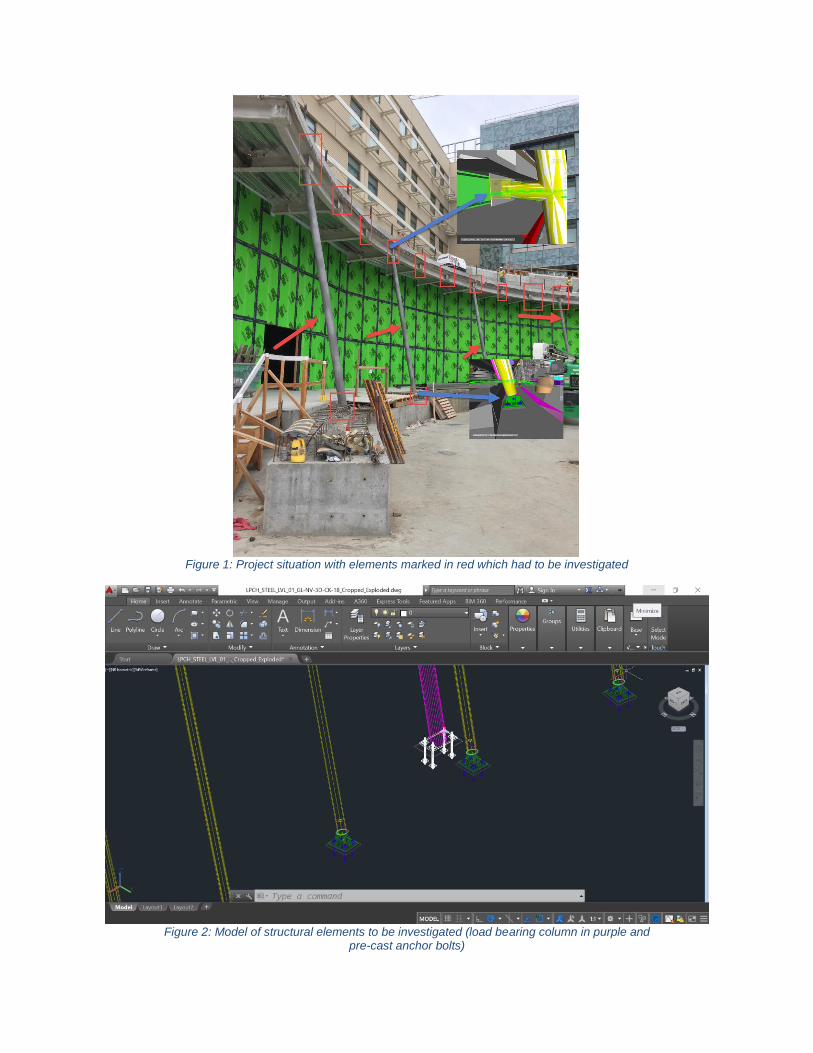
Figure 1: Project situation with elements marked in red which had to be investigated
Figure 2: Model of structural elements to be investigated (load bearing column in purple and
pre-cast anchor bolts)
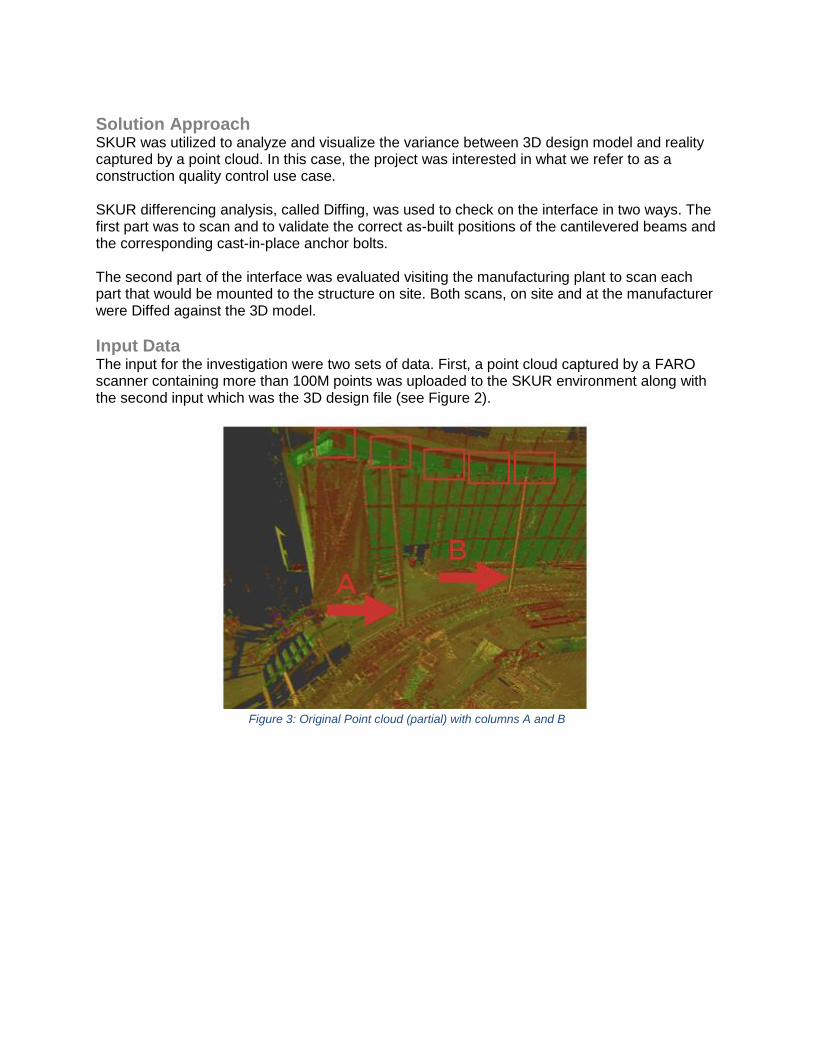
Solution Approach SKUR was utilized to analyze and visualize the variance between 3D design model and reality captured by a point cloud. In this case, the project was interested in what we refer to as a construction quality control use case. SKUR differencing analysis, called Diffing, was used to check on the interface in two ways. The first part was to scan and to validate the correct as-built positions of the cantilevered beams and the corresponding cast-in-place anchor bolts. The second part of the interface was evaluated visiting the manufacturing plant to scan each part that would be mounted to the structure on site. Both scans, on site and at the manufacturer were Diffed against the 3D model.
Input Data The input for the investigation were two sets of data. First, a point cloud captured by a FARO scanner containing more than 100M points was uploaded to the SKUR environment along with the second input which was the 3D design file (see Figure 2).
Figure 3: Original Point cloud (partial) with columns A and B

Figure 4: Design file showing same location as in point cloud (Figure 3)
Results The results revealed three valuable insights. First, the requirement for the anchor bolts to be place with 1/8inch accuracy was satisfied not only from a numerical perspective but also as far as the deviation direction. The contractor was concerned that individual anchor bolts would deviate in opposite direction in which case the combined deviation would exceed 1/4 inch and therefore would cause issues. SKUR could show that this was not the case as the results not only provide the value of deviation but also the direction in which an elements deviates. The second outcome was related to the on-site face plates as the interface to the curtain wall. It turned out that some of them deviated too much for the installation to be successful. Many of them has to be re-positioned. The third insight was regarding the elements on the manufacturer side. It was verified that with the faceplates repositioned, the curtain wall elements could absorb the remaining deviations.

Figure 5: SKUR stoplight color model with value and direction of variance
Figure 6: SKUR heatmap for upper area of Column A indicating the shift
The fact that SKUR could analyze with a point cloud captured by a FARO scanner dense enough to deliver results in the 1/8 inch accuracy level is impressive. In general, SKUR could compare the 3D model and point cloud much faster, more consistent and more accurate than a human eye. In this case, where many elements had to be investigated, the manual process would have been too slow and error prone. Especially in the case of the anchor bolts that were pre-cast and located under rebar, it was practically

impossible for a human to overlay the model with the point cloud and to derive results on the 1/8 inch accuracy - it was simply not visible to the human eye.
Figure 7: Complete point cloud including SKUR heatmap indicating which points were utilized
for analysis
Currently, SKUR exports its visual results into two file formats. One, into Autodesk Navisworks Manage file (NWC file) which contains the original design model, the colorized stoplight color model as well as the colorized point cloud, called heatmap. For the stoplight color model, all elements from the original design model are colored in either green, yellow or red color, depending on the accuracy analyzed by SKUR between model and point cloud. The tolerances can be set within SKUR. The point cloud heat map is colorized in the same fashion - green, yellow and red depending on the variance between point and model object. It reveals more insights into the individual element as the stoplight color model. For example, the heatmap can reveal a column getting off-center along its length.
The second file format that can be exported from SKUR is Autodesk Recap. This especially speaks to the use case of model quality control where a model is created from point cloud data and the SKUR heatmap would be imported into the modeling environment such as Autodesk Revit to reveal variances between model and reality.
Outlook? - FARO Integration
- SKUR online viewer

Experimenting With Point Cloud Meshing
Meshing point cloud data is starting to become extremely useful for many situations. There are a number of tools and plug-ins that can help assist with this process. We will take a look at a very specific use and discuss why meshing was the best option.
Tank Volumetric Calculation With Deadwood This test project for a customer involved two internal laser scans of a vertical vessel. They were interested in knowing the volume contained at specific height intervals along the tank. Since internal piping and structural components take up volume, this must be removed from the calculation.
VIEW INSIDE THE TANK WITH DEADWOOD IN MULTIPLE LOCATIONS
So Why Meshing? Depending on a project’s needs, the optimal workflow usually is the one that is fastest and most accurate. In many cases, meshing is both of these things. Let’s take a look at the advantages of meshing :
Typically can generated automatically without much user input Able to create complex contours that are difficult to model manually (i.e.
facial features, ground undulation, etc.) Exportable into formats accepted by most modeling software Generally time-efficient
In this project, we did not need to know each component as an individual piece. The customer did not care what type of elbow it was or what size steel was inside. They just needed the overall volume of the objects.

MESHED COMPONENTS DIRECTLY FROM POINT CLOUD DATA
Project Steps Completed to Achieve Results We began by bringing this particular scan set into FARO SCENE 6.2. There is a new meshing feature that was used to create and export the mesh. While there are a few options for file format, we used a .OBJ export for this. After this, we converted the .OBJ file to a .FBX file using Autodesk FBX Converter. This is a free converter made by Autodesk. This can be found here http://usa.autodesk.com/adsk/servlet/pc/item?siteID=123112&id=22694909 After the conversion, we used AutoCAD’s FBX Import utility and ran our PointSense Plant Tank Analysis routine, making sure to choose the mesh for the deadwood to reduce from the volume.
Products Used FARO X330 Laser Scanner
FARO SCENE 6.2
Autodesk FBX Converter
AutoCAD 2017
FARO PointSense Plant

ReCap 360 Scan-to-Mesh Service A very useful new feature from Autodesk is the Scan-to-Mesh Service. This is a premium service that has yielded some amazing results, and it can be a very powerful option for larger areas or areas with finer detail. From the ReCap 360 website :
Select the scans surrounding the object or asset you want to turn into a photo-textured mesh, such as equipment in a factory. Send this information to our new scan-to-mesh cloud service to create an accurate 3D model. You can then reuse this asset for various purposes. This service works with up to 20 laser scans chosen around the object or assets.
MESH CREATED FROM RECAP 360’s SCAN-TO-MESH SERVICE