robeco low volatility
TRANSCRIPT

AIA Assignment 2: Performance Analysis
David De Wolf
March 18, 2016
Abstract
The Robeco European Conservative Equities I EUR fund is a low volatility fund that tries to
outperform their benchmark (MSCI Europe Composite Index) by analyzing and selecting low
volatile stocks. Results clearly show that the fund bene�ts from its low volatility strategy as it
protects the fund in a bear market. From the style analysis, we learn that the managers do not
use market timing as a strategy for their investments decisions. Alternatively, results coming from
the Mama & French 4 Factor & Bu�et Alpha Model show that the fund is managed by skilled
managers who are able to beat the benchmark. When the fund composition has been broken down
in a sectorial and geographical exposure, results show that the managers give the right information
about their investments in the di�erent geographical areas but that they tend to change exposures
to the di�erent sectorial areas over time.
1

1 Introduction to the fund
1.1 Overview
Robeco has a long history when it comes down to quantitative investing. Since 1994, they are a suc-
cessful player in managing portfolios constructed by precisely de�ned regulations. Their models are
based on their own independent research that tries to bene�t from market ine�ciencies on �xed income
and equity markets.
The Robeco European Conservative Equities I EUR fund is a �ve star Morningstar ranked (open
end) defensive equity fund that has been launched by Robeco Asset Management in April of the year
2007. It is constructed by investing at least two thirds of all positions in companies that have a statu-
ary position within European Union. The fund itself is called conservative since it aims to hold stocks
with a lower volatility than the European average.
This philosophy seems to be contradictory to the risk versus return relationship. Though, Robeco
and its track record prove that this strategy worked in post �nancial crisis period. The philosophy
behind the fund's strategy is that taking a higher risk does not always get rewarded by a higher return
in the end.
The fund itself is �scally managed from Luxembourg. This can be derived from its �scal structure, as it
o�cially carries the �scal label of a SICAV (Société d'Investissement à Capital Variable). In short, this
means that the share capital of the fund is variable and that the value in total consists of the summed
value of all net assets of the sub-funds, constituted as shares without a statement of their nominal value.
Thanks to their special �scal context, all SICAV/SICAF investment funds which are domiciled in
Luxembourg, are exempt from corporate taxation. The only tax that they need to pay is a subscrip-
tion tax of 0.05% on their net assets. As of today, four fund managers have a total amount of 1.604
million euros under management.
1.2 Investment approach
The long - term goal of the fund is to achieve returns comparable to those on the selected MSCI Europe
benchmark, but at a distinctly lower level of downside risk. According to the predetermined selection
policy, only low-volatile stocks are taken into consideration by using a highly selective quantitative
model that ranks stocks in a variety of ways.
Analysts in this case typically look at parameters such as market sensitivity, volatility, under or over
valuation and sentiment. The fund's prospectus adds that the fund is constructed from a bottom up
approach. This strategy tries to focus more on individual company performance rather than on the
industry in which that company operates or on the economy as a whole.
2

1.3 Management
Arlette van Ditshuizen has a MSc in Econometrics and Quantitative Economics from the Erasmus
University of Rotterdam and started her career at Robeco as a Senior Manager Structured products
and Senior Portfolio Manager before moving to Robeco Asset Management in February of 2007 where
she developed the Robeco Conservative Equities I EUR fund together with her 3 colleagues.
Jan Sytze Mosselaar is CFA charter holder and has a MSc in Financial Economics from the Uni-
versity of Groningen. He joined Robeco in 2004 where he was responsible for the derivative and equity
linked structured product transactions for the retail and institutional market. Later on in 2014, he
joined Robeco's asset management devision in Quantitative Equities where he now manages under the
supervision of Mr van Vliet.
Maarten Pol�iet has a MSc from the University of Tilburg in Financial Economics and completed
a post graduate at the University of Amsterdam in 2002. He launched his career as a portfolio man-
ager at BNP. As of October 2005, he joined Robeco as a senior Investment Specialist where he was
responsible for the communication of several Robeco funds. From 2008 onwards, he has been active in
the Quantitative Equities department of Robeco Asset Management where currently works together
with his three other colleagues.
Pim van Vliet has a Phd from the Erasmus University in Rotterdam within the �eld of empirical
�nancial research and downsize risk. Mr van Vliet started as Head of Allocation Research and is seen
as the founding father of the Conservative Equity (low volatility) strategy back in 2005. Later on in
2009, he moved to the development of the GTAA strategy which tries to explode cross market value
and momentum e�ects. As of 2010, he is head of all Conservative Equities Funds that currently has
in total more than 9 billion euros under management.
1.4 Investment scope
1.4.1 Overview
Robeco distinguishes between four di�erent allocation methods: asset allocation, country allocation,
currency allocation and sector allocation. The following subsections give a broad overview of these
di�erent allocation methods and shed light on the composition of the fund compared to their prede-
termined benchmark, the MSCI Europe.
Additionally the top 9 largest holdings are added. Pie charts are used to graphically break down
the composition of the fund. By doing this we try to symmetrically analyze the structure in order to
get �rst hand insight of how the fund is constructed. Only publicly disclosed information from the
Robeco Asset Management website.
1.4.2 Asset allocation
In terms of asset allocation, 99.5% of the total fund is completely invested in Equity as of January,
31st. A spare amount of 80,25 million euros or 0.5% is allocated to cash to make new investments
when new opportunities are discovered following the earlier described bottom up investment approach.
3
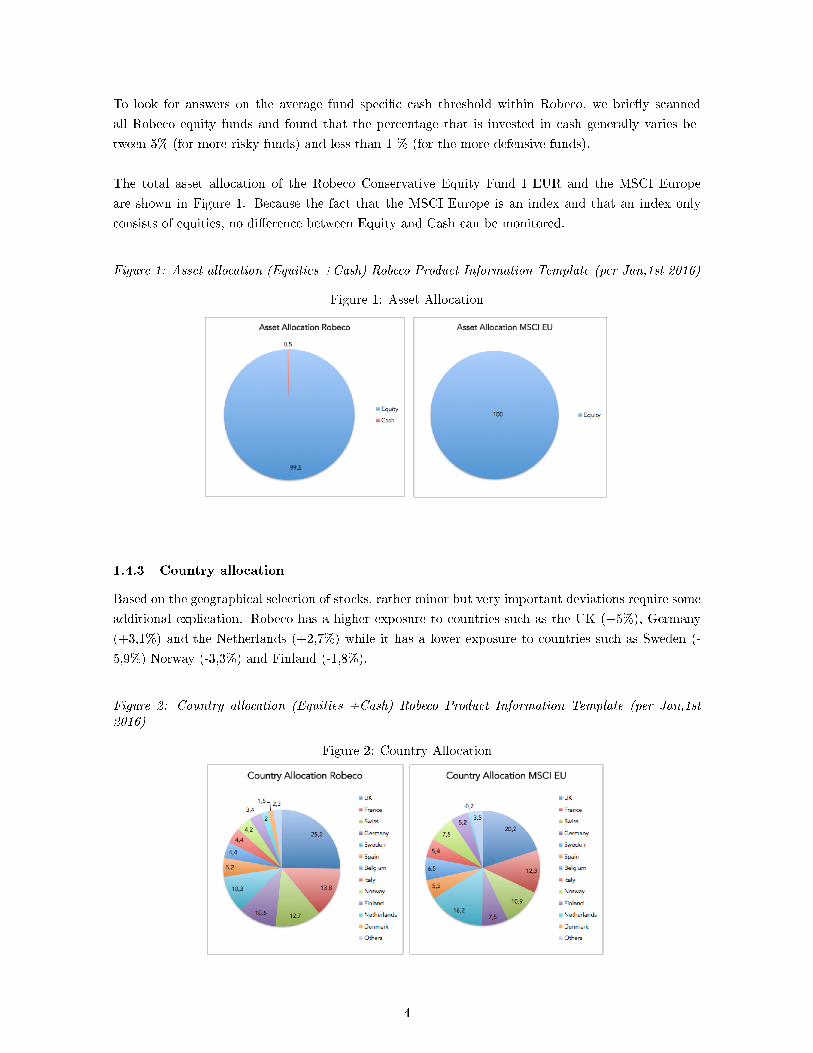
To look for answers on the average fund speci�c cash threshold within Robeco, we brie�y scanned
all Robeco equity funds and found that the percentage that is invested in cash generally varies be-
tween 5% (for more risky funds) and less than 1 % (for the more defensive funds).
The total asset allocation of the Robeco Conservative Equity Fund I EUR and the MSCI Europe
are shown in Figure 1. Because the fact that the MSCI Europe is an index and that an index only
consists of equities, no di�erence between Equity and Cash can be monitored.
Figure 1: Asset allocation (Equities +Cash) Robeco Product Information Template (per Jan,1st 2016)
Figure 1: Asset Allocation
1.4.3 Country allocation
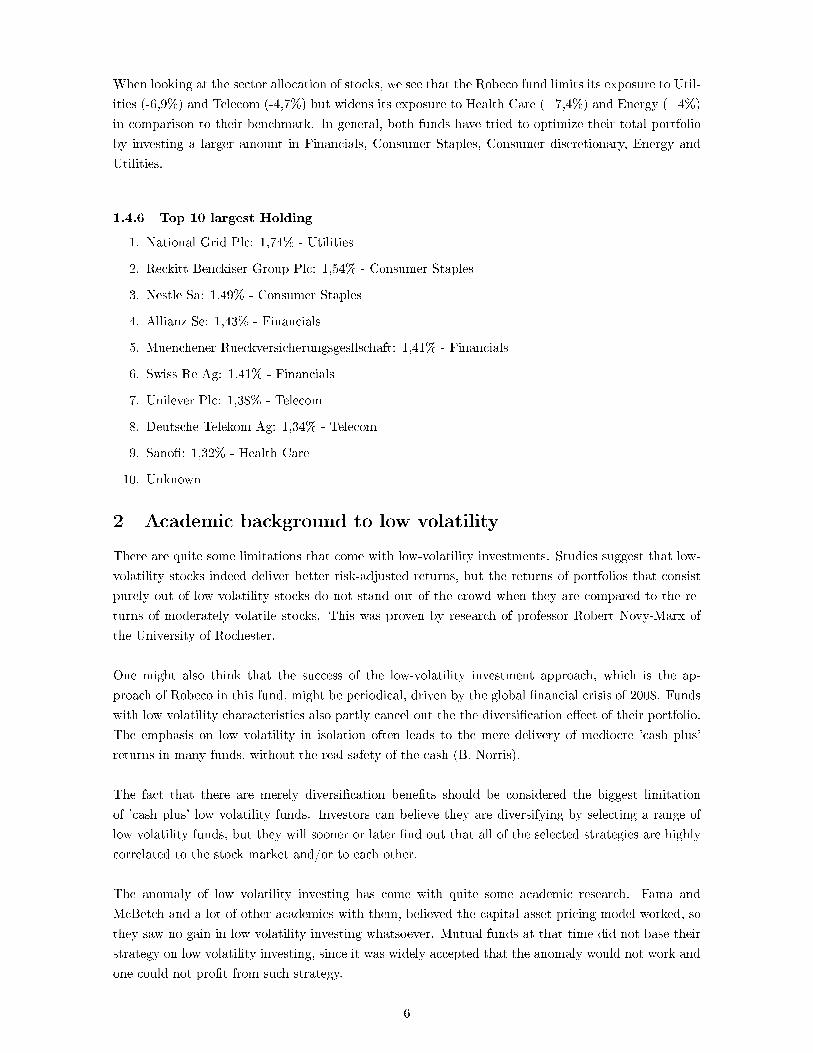
Based on the geographical selection of stocks, rather minor but very important deviations require some
additional explication. Robeco has a higher exposure to countries such as the UK (+5%), Germany
(+3,1%) and the Netherlands (+2,7%) while it has a lower exposure to countries such as Sweden (-
5,9%) Norway (-3,3%) and Finland (-1,8%).
Figure 2: Country allocation (Equities +Cash) Robeco Product Information Template (per Jan,1st2016)
Figure 2: Country Allocation
4

The corresponding pie charts on the previous pages show the detailed exposure to the di�erent countries
for both the Robeco Conservative Equity Fund and its benchmark. It shows that the largest proportion
of the fund is allocated to the UK (25,2%), France (13,8%) and Swiss (12,7%) followed by Germany
(10,6%) and Sweden (10,3%). In total �ve di�erent countries represent 72,6 % of the total amount
that is allocated to the 11 di�erent European countries.
1.4.4 Currency allocation
Because of the larger geographical exposure to the United Kingdom, more speci�cally 45,4% (+5,3%)
of the total value is allocated to the Pound Sterling in comparison to the benchmark. Another 24,9%
is allocated to the Euro. Two other categories (Swiss Francs & the Swedish Krona) are good for a
combined exposure of 22,7 % while some other residual categories represent an exposure of 7%.
Figure 3: Currency allocation (Equities +Cash) Robeco Product Information Template (per Jan,1st2016)
Figure 3: Currency Allocation
1.4.5 Sector allocation
Figure 4: Sector allocation (Equities +Cash) Robeco Product Information Template (per Jan,1st 2016)
Figure 4: Sector Allocation
5
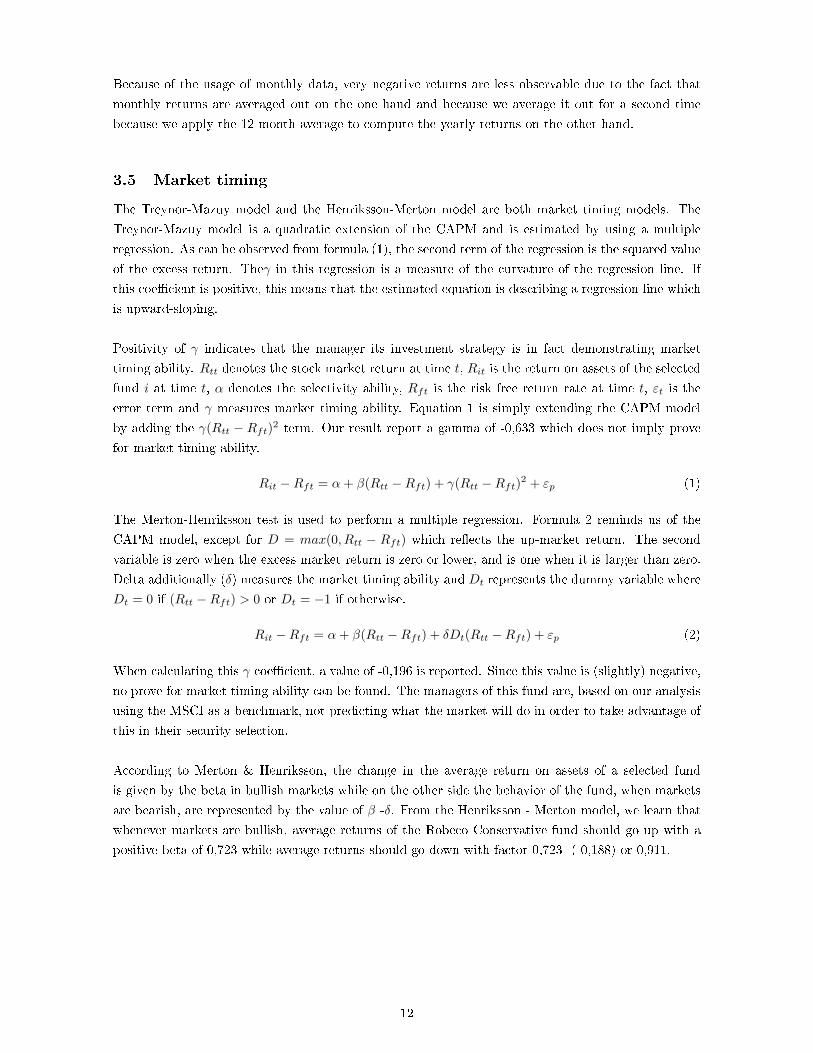
When looking at the sector allocation of stocks, we see that the Robeco fund limits its exposure to Util-
ities (-6,9%) and Telecom (-4,7%) but widens its exposure to Health Care (+7,4%) and Energy (+4%)
in comparison to their benchmark. In general, both funds have tried to optimize their total portfolio
by investing a larger amount in Financials, Consumer Staples, Consumer discretionary, Energy and
Utilities.
1.4.6 Top 10 largest Holding
1. National Grid Plc: 1,74% - Utilities
2. Reckitt Benckiser Group Plc: 1,54% - Consumer Staples
3. Nestle Sa: 1,49% - Consumer Staples
4. Allianz Se: 1,43% - Financials
5. Muenchener Rueckversicherungsgesllschaft: 1,41% - Financials
6. Swiss Re Ag: 1,41% - Financials
7. Unilever Plc: 1,38% - Telecom
8. Deutsche Telekom Ag: 1,34% - Telecom
9. Sano�: 1,32% - Health Care
10. Unknown
2 Academic background to low volatility
There are quite some limitations that come with low-volatility investments. Studies suggest that low-
volatility stocks indeed deliver better risk-adjusted returns, but the returns of portfolios that consist
purely out of low-volatility stocks do not stand out of the crowd when they are compared to the re-
turns of moderately volatile stocks. This was proven by research of professor Robert Novy-Marx of
the University of Rochester.
One might also think that the success of the low-volatility investment approach, which is the ap-
proach of Robeco in this fund, might be periodical, driven by the global �nancial crisis of 2008. Funds
with low volatility characteristics also partly cancel out the the diversi�cation e�ect of their portfolio.
The emphasis on low volatility in isolation often leads to the mere delivery of mediocre 'cash plus'
returns in many funds, without the real safety of the cash (B. Norris).
The fact that there are merely diversi�cation bene�ts should be considered the biggest limitation
of 'cash plus' low volatility funds. Investors can believe they are diversifying by selecting a range of
low volatility funds, but they will sooner or later �nd out that all of the selected strategies are highly
correlated to the stock market and/or to each other.
The anomaly of low volatility investing has come with quite some academic research. Fama and
McBetch and a lot of other academics with them, believed the capital asset pricing model worked, so
they saw no gain in low volatility investing whatsoever. Mutual funds at that time did not base their
strategy on low volatility investing, since it was widely accepted that the anomaly would not work and
one could not pro�t from such strategy.
6

Robert Haugan et al. (1975) was one of the authors who dared to criticize the empirical e�orts
that support the concept of a risk premium, and measure the risk-return tradeo�. Haugan et al. em-
pirically measured the relationship between risk and return over various time periods, and found that
they could not support the conventional hypothesis that more risk necessarily comes with a higher
return. Their results even show the contrary: over the long run, stock portfolios with fewer variance
in monthly returns generate bigger average returns compared to stock portfolios that bear more risk.
Baker et al. (2011) go further on this topic. They argue that high-beta and high-volatility stocks
have underperformed their counterparts, low-beta and low-volatility stocks for a long time. This
sounds like an anomaly, since it is very contradicting to the common �nancial beliefs and principles.
They argue that most of the anomalies in �nance can be seen as �di�erent returns for similar risks�.
Examples of these are value and momentum strategies. This anomaly of low-risk, however, has a
totally di�erent character than these other anomalies, since it implies `the best of both worlds': in-
vesting with lower risk and at a higher return. The irrational investor still overpays high-risk stocks,
while a rational investor could exploit this `best of both worlds' anomaly. Smart investors can bene�t
from the behavior of these irrational investors. These smart investors that aim to maximize returns in
relation to total risk need to encourage their managers to do this by focusing on the benchmark-free
Sharpe ratio, instead of the commonly used information ratio. Whenever irrational investors are abun-
dantly present and stick to their standard benchmarks, smart investors could bene�t from this strategy.
The widely cited authors Black and Fisher set up a model that relates the expected return of an
e�cient portfolio to its beta. This model consisted of two straight lines where the segment for the
higher-risk portfolios had a smaller slope than the segment for the lower-risk portfolios. This is again
provides evidence of the discussed anomaly which Robeco its strategy tries to bene�t from.
3 Fund analysis
3.1 Descriptive statistics
Table 1 shows the descriptive statistics of the daily returns of the Robeco European Conservative Equity fund,the MSCI Europe Composite index and the Euronext 100 for the time from November 2007, 1st to the March2016,1st. The Euronext 100 is used as an additional third benchmark because we faced a low correlation betweenthe return series of the fund and its main benchmark. Based on the �rst results, this could argue that the wrongbenchmark has been chosen. New analysis fades this suspicion away.
Table 1: Daily returns descriptivesFull sample Robeco European Conservative Equity MSCI EU EURONEXT 100
Mean 0,023 0,008 0,014
Median 0,000 0,000 0,008
Minimum -5,890 -9,677 -8,561
Maximum 7,866 11,361 10,874
SD 1,102 1,595 1,430
Skewness -0,131 0,162 0,190
Ex.Kurtosis 5,215 6,673 6,456
7

Robeco uses the MSCI EU as its benchmark. For comparison, we also added the Euronext 100 index.
The average return of the Robeco European Conservative equity fund is clearly higher than the bench-
mark, MSCI EU. The Euronext 100 seems to do better than the MSCI EU, but is still underperforming
compared to the Robeco fund. The median of the NEXT 100 is however the only one in our analysis
that is bigger than 0.
As expected from a low-volatility fund, observed volatility (measured by the standard deviation) of
the Robeco fund is a lot smaller in comparison to their indices. This implies that its minimum is
higher and its maximum is lower compared to the benchmarks. The excess kurtosis of the MSCI EU
and the Euronext 100 lay close to one another. They all show leptokurtic results but the Euronext
and MSCI indices are far more leptokurtic than the Robeco fund. These indices have fatter tails than
the Robeco fund. Remarkable is that based on the skewness, results show that Robeco has more left
skewed return distribution while the two benchmarks have a more right skewed distribution.
Table 2 shows the descriptive statistics of the monthly returns for the Robeco European Conservative Equity
fund, the MSCI Europe Composite Index and the Euronext 100 from the July 2007,1st to the March,1st 2016.
Table 2: Monthly returns descriptivesFull sample Robeco European Conservative Equity MSCI EU EURONEXT 100
Mean 0,033 0,123 0,117
Median 0,000 0,120 0,000
Minimum -3,333 -3,778 -2,453
Maximum 2,198 4,753 3,971
SD 0,900 1,321 1,165
Skewness -0,589 0,739 0,854
Ex. Kurtsosis 2,356 2,941 1,606
Looking at the monthly data, we see a di�erent result. We see that the average return of Robeco is
a lot smaller than the average return of the two benchmarks. The standard deviation stays smaller,
which indicates the lower volatility. We can observe for both monthly and daily data that the skewness
is only negative for the Robeco fund, whereas MSCI EU and Euronext both show a positive skewness.
The excess kurtosis is signi�cantly smaller for the monthly data, compared to the daily data, which
is obvious. However, when looking at the monthly data, the Robeco fund does not have the smallest
excess kurtosis anymore. Instead, the Euronext 100 took its place. The minimum is also higher for
the Euronext 100 index for the monthly returns, whereas the Robeco fund also was the out-performer
for the daily returns. This is not compensated with a higher maximum, as the Robeco fund has the
lowest maximum both in the daily returns as in the monthly returns.
3.2 Correlation coe�cients
The correlation coe�cient of the return of the Robeco European Conservative Equity fund (Robeco
ECE) compared to its benchmark, the MSCI Europe index, is 0,187. At �rst sight, this seems like
a fairly small number, but it does make sense. Since the MSCI EU index comprises a huge amount
of stocks, and Robeco selects only the low volatility stocks from this index, it is logical that their
correlation coe�cient is more or less equal to the percentage of stocks they select from this fund. This
fades away our suspicion of choosing the MSCI as the wrong benchmark (Cfr. table 1).
8
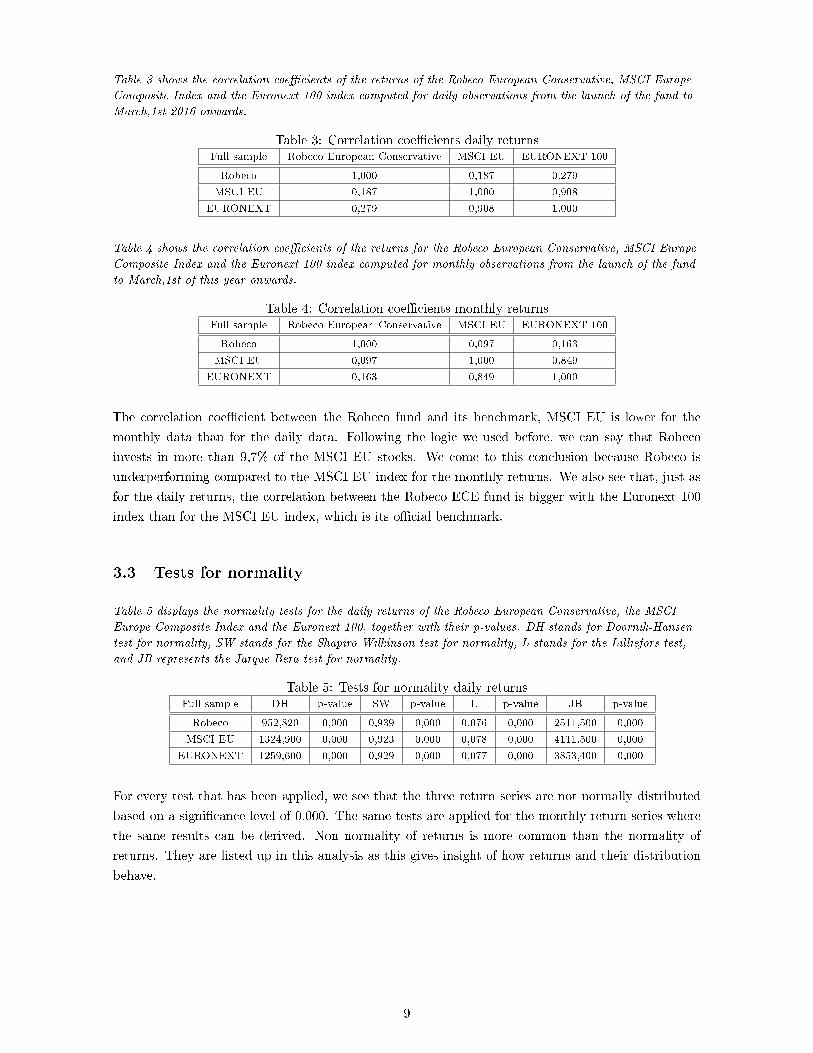
Table 3 shows the correlation coe�cients of the returns of the Robeco European Conservative, MSCI Europe
Composite Index and the Euronext 100 index computed for daily observations from the launch of the fund to
March,1st 2016 onwards.
Table 3: Correlation coe�cients daily returnsFull sample Robeco European Conservative MSCI EU EURONEXT 100
Robeco 1,000 0,187 0,279
MSCI EU 0,187 1,000 0,908
EURONEXT 0,279 0,908 1,000
Table 4 shows the correlation coe�cients of the returns for the Robeco European Conservative, MSCI Europe
Composite Index and the Euronext 100 index computed for monthly observations from the launch of the fund
to March,1st of this year onwards.
Table 4: Correlation coe�cients monthly returnsFull sample Robeco European Conservative MSCI EU EURONEXT 100
Robeco 1,000 0,097 0,163
MSCI EU 0,097 1,000 0,849
EURONEXT 0,163 0,849 1,000
The correlation coe�cient between the Robeco fund and its benchmark, MSCI EU is lower for the
monthly data than for the daily data. Following the logic we used before, we can say that Robeco
invests in more than 9,7% of the MSCI EU stocks. We come to this conclusion because Robeco is
underperforming compared to the MSCI EU index for the monthly returns. We also see that, just as
for the daily returns, the correlation between the Robeco ECE fund is bigger with the Euronext 100
index than for the MSCI EU index, which is its o�cial benchmark.
3.3 Tests for normality
Table 5 displays the normality tests for the daily returns of the Robeco European Conservative, the MSCI
Europe Composite Index and the Euronext 100, together with their p-values. DH stands for Doornik-Hansen
test for normality, SW stands for the Shapiro-Wilkinson test for normality, L stands for the Lilliefors test,
and JB represents the Jarque-Bera test for normality.
Table 5: Tests for normality daily returnsFull sample DH p-value SW p-value L p-value JB p-value
Robeco 952,820 0,000 0,939 0,000 0,076 0,000 2511,500 0,000
MSCI EU 1324,900 0,000 0,923 0,000 0,078 0,000 4111,500 0,000
EURONEXT 1259,600 0,000 0,929 0,000 0,077 0,000 3853,400 0,000
For every test that has been applied, we see that the three return series are not normally distributed
based on a signi�cance level of 0,000. The same tests are applied for the monthly return series where
the same results can be derived. Non normality of returns is more common than the normality of
returns. They are listed up in this analysis as this gives insight of how returns and their distribution
behave.
9

Table 6 shows the normality tests for the monthly returns of the Robeco European Conservative, the MSCI
European Composite Index and the Euronext 100, together with their p-values. DH stands for
Doornik-Hansen test for normality, SW stands for the Shapiro-Wilkinson test for normality, L stands for the
Lilliefors test, and JB represents the Jarque-Bera test for normality.
Table 6: Tests for normality monthly returnsFull sample DH p-value SW p-value L p-value JB p-value
Robeco 16,231 0,000 0,944 0,000 0,112 0,000 29,200 0,000
MSCI EU 19,314 0,000 0,923 0,000 0,121 0,000 45,572 0,000
EURONEXT 11,076 0,004 0,943 0,000 0,104 0,010 23,143 0,000
3.4 Historical Outperformance
Figure 5 shows the monthly returns for Robeco Conservative Equities and the MSCI Europe Composite Index
benchmark from November 2007 to March 2016.
Figure 5: Monthly Return Comparison
Figure 5 shows the time series plot of the Robeco returns, represented by the blue line, compared to
the returns of its index, the MSCI. The Conservative Equity strategy of Robeco is based on the concept
that defensive portfolios of low-volatility stocks are able to generate better risk-adjusted returns than
portfolios of higher-risk stocks over the long term. Figure 6 con�rms this. It shows the cumulative
return performance for our fund.
10

Figure 6 shows how much an investment of 100 euros would �uctuate over time. Whenever a comparisonhas been made, we know that Robeco outperforms the MSCI European Composite Index. It bene�ts from itslow volatility strategy in the downside, as it keeps it upwards potential more or less at the same level as itsbenchmark. Based on the results, an investor would end up with an total amount of 148,475 euro if they investedin the Robeco fund and 124,859 euro if they invested in the MSCI EU.
Figure 6: Performance Net
During the crisis period, we see that in higher peaks for both Robeco and MSCI during the period
2008-2009 but Robeco still maintained a lower volatility than its benchmark. Next, we measured the
yearly performance of Robeco with respect to its benchmark MSCI over the period 2007 to YTD as
shown in Table 7. The yearly performance is calculated on the basis of average monthly returns from
both Robeco and MSCI.
Average yearly returns, standard deviations & Sharpe ratios for the Robeco Conservative Equity fund and the
MSCI Europe Composite index over the time period of November 2007 to March 2016. Sharpe ratios are
computed as ((Rp-Rf)/SD average yearly returns). The 1 month risk free rate that is used has been downloaded
from the Kenneth R. French database for the monthly F&F 4 factor model for the European market in order
to be consistent in this entire report.
Table 7: Summary average yearly returns (based on monthly returns)Returns in % 2007 2008 2009 2010 2011 2012 2013 2014 2015 YTD
Robeco 0.598 -2.007 0.728 1.325 -0.658 1.447 1.346 1.346 1.566 -1.178
MSCI -0.383 -2.901 1.094 1.398 -1.207 1.450 1.442 1.516 1.354 -2.627
Standard Dev 2007 2008 2009 2010 2011 2012 2013 2014 2015 YTD
Robeco 0.846 4.479 5.063 3.211 2.639 2.839 2.314 2.672 4.649 3.193
MSCI 0.542 5.701 9.656 4.219 4.471 4.747 2.638 2.856 5.449 5.449
Sharpe Ratio 2007 2008 2009 2010 2011 2012 2013 2014 2015 YTD
Robeco -0.752 -0.644 0.287 0.277 -0.075 0.456 0.569 0.523 0.278 0.394
MSCI -3.396 -0.897 0.181 0.228 -0.169 0.281 0.523 0.334 0.257 0.269
It is clear that there was a crisis e�ect for both the MSCI EU and Robeco. In this case, Robeco has
been less a�ected by crisis than its benchmark in terms of yearly return performance, based on the
monthly returns. Robeco its Sharpe ratios always report higher values which indicate that they try to
limit the risk in order to boost the risk/return relationship (proof for the low volatility approach).
11
Because of the usage of monthly data, very negative returns are less observable due to the fact that
monthly returns are averaged out on the one hand and because we average it out for a second time
because we apply the 12 month average to compute the yearly returns on the other hand.
3.5 Market timing
The Treynor-Mazuy model and the Henriksson-Merton model are both market timing models. The
Treynor-Mazuy model is a quadratic extension of the CAPM and is estimated by using a multiple
regression. As can be observed from formula (1), the second term of the regression is the squared value
of the excess return. Theγ in this regression is a measure of the curvature of the regression line. If
this coe�cient is positive, this means that the estimated equation is describing a regression line which
is upward-sloping.
Positivity of γ indicates that the manager its investment strategy is in fact demonstrating market
timing ability. Rtt denotes the stock market return at time t, Rit is the return on assets of the selected
fund i at time t, α denotes the selectivity ability, Rft is the risk free return rate at time t, εt is the
error term and γ measures market timing ability. Equation 1 is simply extending the CAPM model
by adding the γ(Rtt − Rft)2 term. Our result report a gamma of -0,633 which does not imply prove
for market timing ability.
Rit −Rft = α+ β(Rtt −Rft) + γ(Rtt −Rft)2 + εp (1)
The Merton-Henriksson test is used to perform a multiple regression. Formula 2 reminds us of the
CAPM model, except for D = max(0, Rtt − Rft) which re�ects the up-market return. The second
variable is zero when the excess market return is zero or lower, and is one when it is larger than zero.
Delta additionally (δ) measures the market timing ability and Dt represents the dummy variable where
Dt = 0 if (Rtt −Rft) > 0 or Dt = −1 if otherwise.
Rit −Rft = α+ β(Rtt −Rft) + δDt(Rtt −Rft) + εp (2)
When calculating this γ coe�cient, a value of -0,196 is reported. Since this value is (slightly) negative,
no prove for market timing ability can be found. The managers of this fund are, based on our analysis
using the MSCI as a benchmark, not predicting what the market will do in order to take advantage of
this in their security selection.
According to Merton & Henriksson, the change in the average return on assets of a selected fund
is given by the beta in bullish markets while on the other side the behavior of the fund, when markets
are bearish, are represented by the value of β -δ. From the Henriksson - Merton model, we learn that
whenever markets are bullish, average returns of the Robeco Conservative fund should go up with a
positive beta of 0,723 while average returns should go down with factor 0,723 -(-0,188) or 0,911.
12
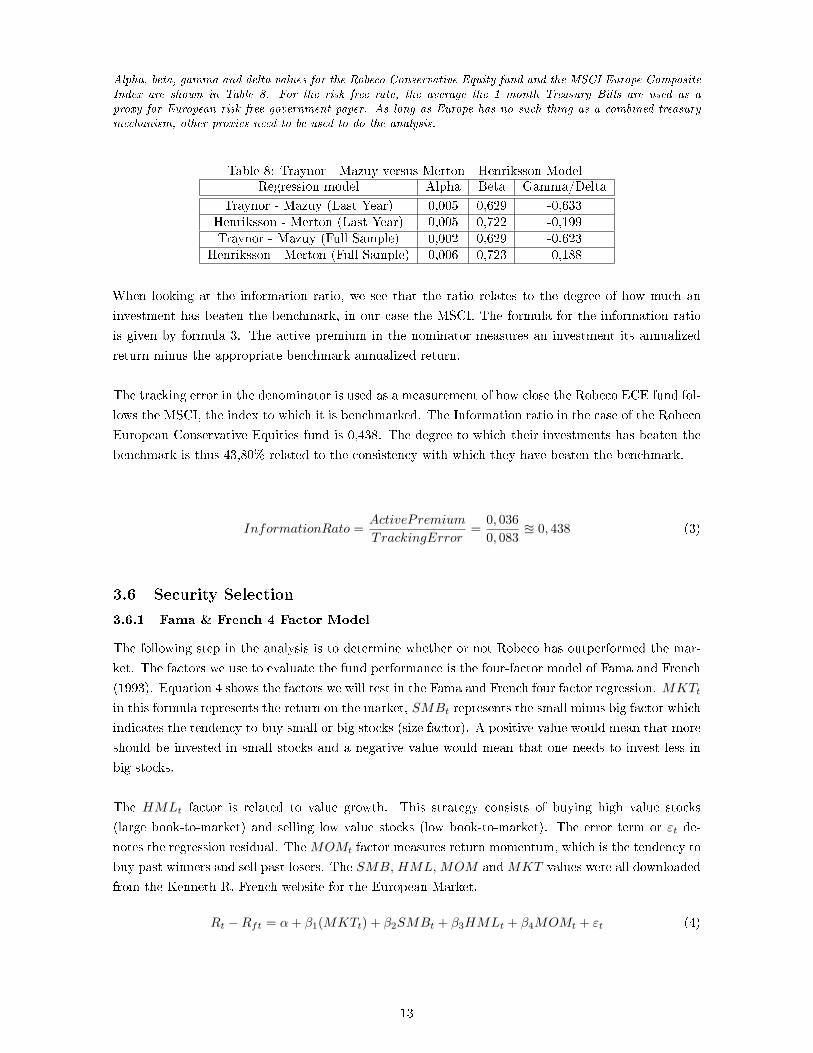
Alpha, beta, gamma and delta values for the Robeco Conservative Equity fund and the MSCI Europe CompositeIndex are shown in Table 8. For the risk free rate, the average the 1 month Treasury Bills are used as aproxy for European risk free government paper. As long as Europe has no such thing as a combined treasurymechanism, other proxies need to be used to do the analysis.
Table 8: Traynor - Mazuy versus Merton - Henriksson ModelRegression model Alpha Beta Gamma/Delta
Traynor - Mazuy (Last Year) 0,005 0,629 -0,633Henriksson - Merton (Last Year) 0,005 0,722 -0,199Traynor - Mazuy (Full Sample) 0,002 0,629 -0,623
Henriksson - Merton (Full Sample) 0,006 0,723 -0,188
When looking at the information ratio, we see that the ratio relates to the degree of how much an
investment has beaten the benchmark, in our case the MSCI. The formula for the information ratio
is given by formula 3. The active premium in the nominator measures an investment its annualized
return minus the appropriate benchmark annualized return.
The tracking error in the denominator is used as a measurement of how close the Robeco ECE fund fol-
lows the MSCI, the index to which it is benchmarked. The Information ratio in the case of the Robeco
European Conservative Equities fund is 0,438. The degree to which their investments has beaten the
benchmark is thus 43,80% related to the consistency with which they have beaten the benchmark.
InformationRato =ActivePremium
TrackingError=
0, 036
0, 083u 0, 438 (3)
3.6 Security Selection
3.6.1 Fama & French 4 Factor Model
The following step in the analysis is to determine whether or not Robeco has outperformed the mar-
ket. The factors we use to evaluate the fund performance is the four-factor model of Fama and French
(1993). Equation 4 shows the factors we will test in the Fama and French four factor regression. MKTt
in this formula represents the return on the market, SMBt represents the small minus big factor which
indicates the tendency to buy small or big stocks (size factor). A positive value would mean that more
should be invested in small stocks and a negative value would mean that one needs to invest less in
big stocks.
The HMLt factor is related to value growth. This strategy consists of buying high value stocks
(large book-to-market) and selling low value stocks (low book-to-market). The error term or εt de-
notes the regression residual. TheMOMt factor measures return momentum, which is the tendency to
buy past winners and sell past losers. The SMB, HML, MOM andMKT values were all downloaded
from the Kenneth R. French website for the European Market.
Rt −Rft = α+ β1(MKTt) + β2SMBt + β3HMLt + β4MOMt + εt (4)
13

Table 9 illustrates the regression results for the Fama & French four-factor model calculated from the followingregression: Rt − Rft = α + β1(MKTt) + β2SMBt + β3HMLt + β4MOMt + εt where MKT is the marketreturn, SMB is the small-minus-big factor, HML denotes the high-minus-low factor, MOM is the Europeanmomentum factor, and εt represents the regression residuals.
Table 9: Fama Fench 4 Factor ModelCoe�cients Estimates Standard Error t value p - value
Alpha 0,451 0,146 3,088 0,002
MKT 0,640 0,028 22,110 0,000
SMB 0,067 0,077 0,875 0,384
HML 0,012 0,069 0,178 0,859
MOM 0,029 0,039 0,755 0,452
R Squared 85,750% F-statistic 138,400
Adj R Squared 85,130% P - value 0,000
As a result a signi�cant positive alpha value (0,451) is found that we are dealing with skilled managers
have beaten the benchmark. Our model has an Adjusted R squared of 85% which tells that eighty �ve
of the variance in the returns of the Robeco Conservative is explained by the four factor model from
Fama Fench. Additionally, we see that the market risk premium factor reports a positive (0,640) and
signi�cant value. All other three factors do not report any statistical signi�cant p-value which makes
economic interpretation useless.
3.6.2 Bu�et Alpha 6 Factor Model
Prior research done by Frazzini et al. (2013) showed that extending the Fama French three-factor
model would help better explain excess returns. They did this by adding three additional factors:
UMDt, BABt, QMJt. UMDt measures momentum, which explains to buy stocks that have been
outperforming and sell stocks that have been underperforming the market. BABt stands for �betting
against beta� and re�ects the tendency to buy safe (low beta stocks) and sell risky (high beta stocks).
The last variable QMJt, represents �quality minus junk� and shows the tendency to buy high quality
companies which are �companies that are pro�table, growing, safe and have high payout� (Frazzini et
al. 2013). The UMD, BAB, and UMD variables values were downloaded from the website of Andrea
Frazzini for the European Market. For the next regression, the following formula is used in order to
come to the results listed in table 10.
Rt −Rft = α+ β1(RMt −Rft) + β2SMBt + β3HMLt + β4MOMt + β5BABt + βQMJt + εt (5)
Results coming from the extended Bu�et Alpha provide veri�cation for the Mama & French four factor
model. Our intercept or alpha (0,360) is again positive and signi�cant for the 95% con�dence interval.
The market premium is again signi�cant with corresponding positive (0,647) value which means that
the market premium can be used as a predictor for the return of the fund.
14

Table 10 shows the results coming from the Fama & French regression by including two additional variables.The regression equation used is as follows: Rt−Rft = α+β1(RMt−Rft)+β2SMBt+β3HMLt+β4MOMt+β5BABt + βQMJt + εtwhere BAB denotes the European betting against beta factor and QMJ denotes theEuropean quality minus junk factor.
Table 10: Bu�et AlphaCoe�cients Estimates Standard Error t value p - value
Alpha 0,360 0,155 2,324 0,022
MKT 0,647 0,030 21,866 0,000
SMB -0,034 0,087 -0,389 0,698
HML 0,127 0,097 1,312 0,193
MOM -0,021 0,048 -0,446 0,657
BAB 2,520 5,582 0,451 0,653
QMJ 18,601 11,298 1,646 0,103
R Squared 86,240% F-statistic 93,990
Adj R Squared 85,320% P -value 0,000
3.6.3 Geographical weights
Robeco uses three approaches to allocate assets: a greograhical approach, a sectorial approach and a
currency approach. here, we look for the composition of the fund and how it relates to management
style and performance measurements. The analysis will come from research of Sharpe (1992). Asset
allocation is the composition of a portfolio across �major� asset classes. To determine the optimal asset
mix, it is necessary to evaluate the exposures of each asset in a portfolio. Once exposures have been
determined, we can measure how well managers have performed based on their value added through
active management. To accomplish this, Sharpe utilized an asset class factor model as follows:
Ri = [bi1F1 + bi2F2 + ...+ binFn] + ei (6)
where Ri denotes the return on the asset i, the F values are the values of each factor (here the sector),
the b values denote the sensitivities of the return on the asset (Ri) to the F factors, and ei is the
non-factor component of the return on i. In addition, the goal of using quadratic programming is
to �nd the best set of asset class exposure that equals 100% in the end and that conforms to the
fundamentals of the fund its policy information, making it sure that no short position is applied to
any asset class. Here, the equation is stated as follows:
e = R1 − [b1F1 + b2F2 + ...+ bnFn] (7)
where e is the di�erence between the return on the fund and the return on a passive fund with the
same style (asset allocation), R1 is the return of the fund, the b values denote the asset class exposures
and the F values denote the returns of the asset classes we are analyzing.
Table 11 shows the constrained weights of the fund with corresponding R - Squared of 67,162% for the MSCI
indices of the following countries: Sweden, Finland, France, Italy, Netherlands, Norway, Spain, Sweden, Swiss,
UK and Belgium over the time period of November 2007 to March 2016.
Table 11: Weights Robeco European EquitiesCountry DEN FIN FRA ITA NET NOR SP SWE SWI UK BEL
Weights Constr Q 11,526% 0,000% 23,578% 0,000% 23,521% 0,000% 0,000% 0,000% 32,674% 30,023% 1,995%
Weights UnconstR 9,679% 3,846% 49,965% -16,468% -5,298 1,834% 7,322% -7,707% 0,751% 13,200% 12,131%
15

Based on this constrained results, we �nd that the public available information is true. The funds
exposure is the highest for Swiss, UK, France, the Netherlands, Denmark and Belgium. Based on the
analysis of the geographical exposure, we �nd slight deviations but do not �nd large deviations from
the pie charts in the �rst part of this report. Figure number 7 shows the composition from Table 11
graphically.
Figure 7 graphically shows the constrained weights of the fund and the MSCI indices of the following countries:Sweden, Finland, France, Italy, Netherlands, Norway, Spain, Sweden, Swiss, UK and Belgium over the timeperiod of November 2007 until the last month, March 2016
Figure 7: Style Weights
In case a rolling window of 36 months is applied for the Robeco Equities Conservative fund, we see
that the exposure to Belgium is decreased over time until April 2014. From there on, Belgium gained
a positive stake in the fund. It is remarkable that the United Kingdom was not considered as an
investment opportunity during the �rst years while it is now a important holding block in the fund
together with France, Swiss and Denmark. A few other countries pop up somewhere April - May '12
where we see that Italy gained interest together with the Netherlands and Finland.
Figure 8 shows the 36 month rolling style weights of the fund with corresponding values for the MSCI indicesof the following countries: Sweden, Finland, France, Italy, Netherlands, Norway, Spain, Sweden, Swiss, UKand Belgium over the time period of November 2007 to March 2016.
Figure 8: Rolling 36 M Style Weights Robeco European Equities
16

3.6.4 Sectoral weights
Table 12 shows the constrained weights of the fund with corresponding R Squared 82,971% for the MSCIindices of the following sectors: utilities, industrials, consumer staples, consumer discretionary, health careand �nancials over the time period of November 2007 to March 2016. What is remarkable is that �nancials,which should be weighted over 20% has no weighting factor. We tested for every �nancial MSCI index (World,Europe, US) but did not �nd any satisfying results for the �nancial sector. Therefore we included the WorldFinancials (World) and European �nancials (Finan) to look how �nancials �uctuated over time.
Table 12: Weights Robeco European EquitiesSectors UTI IND CON DIS HEA FIN
Weights Constr Quadratic 23,622% 17,500% 36,694% 4,317% 17,595% 0,000%
Weights Unconstr Norm -16,613% 16,194% 17,124% 8,037% 6,911% 13,532%
Based on this constrained results, we �nd that the public available information is not fully true for
the sector composition. The funds exposure is the highest for consumer staples, followed by utilities,
industrials, health care, and consumer discretionary. Based on the analysis of the geographical expo-
sure, we �nd large deviations from the pie charts in the �rst part of this report. Financials for example
do show up in the 36 month style weights but does not deliver a satisfying results in the constrained
style weight model although they say that approximately 20% is invested in �nancials, according to
the pie charts in section 1. Figure 9 shows the composition from Table 12 graphically.
Figure 9 shows the constrained weights of the fund with corresponding R Squared of 82,971% for the MSCI
indices of the following sectors: utilities, industrials, consumer con, consumer dis, health care and �nancials
over the time period of November 2007 to March 2016. What is remarkable is that �nancials, which should be
weighted over 20% has no weighting factor. We tested for every �nancial MSCI index (World, Europe, US) but
did not �nd any satisfying results for the �nancial sector. Therefore we included the World Financials (World)
and European �nancials (Finan) to look how �nancials �uctuated over time.
Figure 9: Style Weights
From the 36 month style weights, we learn that consumer staples, health care and utilities are supposed
to be the building blocks of the fund. What is remarkable is that they start to invest in the European
�nancial sector but that they reduced all positions from Oct '14 onwards and shifted that investment
into world �nancials (black). From the rolling style weights we see that over the last months the
exposure to industrials increased again and that they cut their positions in the consumer discretionary
sector.
17

Figure 10 shows the 36 month rolling style weights of the fund with corresponding values for the MSCI indices ofthe following sectors: utilities, industrials, consumer staples, consumer discretionary, health care and �nancials2016. We tested for every �nancial MSCI index (World, Europe, US) but did not �nd any satisfying results forthe �nancial sector. Therefore we included the World Financials (World, black bars) and European �nancials(Finan, yellow bars) to look how �nancials �uctuated over time.
Figure 10: Rolling 36 M Style Weights Robeco European Equities
4 Conclusion
The Robeco Conservative Europe Equity I EUR fund is a fund that has been managed by 4 Dutch
managers as from November 2007 onwards. It uses the technique of low - volatility investing in
order to make investment decision to outperform their selected benchmark (MSCI Europe Composite
Index). The results in this report show that there is no clear evidence for the usage of market timing.
Additionally, outperformance can be derived as they clearly bene�t from the low volatility strategy in
bear markets. Results furthermore indicate that managers are skilled and that they are able to beat
the benchmark. This is proven by the Fama and French 4 factor and the Bu�et Alpha Model. When
the composition in the last part of this paper is broken down into several parts, results show that
the geographical exposure does not deviate too much from the public available information for retail
investors. Although results are satisfying for the geographical approach, sectorial analysis sheds light
on the exposure to the prede�ned sectors. Here, results show that the highest proportion is invested
in Consumer staples instead of Financials. Financials were in this case considered as an investment
opportunity but they are not longer seen as an important investment class. Instead, the exposure to
European �nancials decreased as the interest in World �nancials has increased over the last 24 months.
18

5 References
[1] Baker, M., Bradley, B., & Wurgler, J. (2011). Benchmarks as limits to arbitrage: low-volatility.Financial Analysts Journal, 67(1), 40-54.
[2] Black, F. (1972). Capital market equilibrium with restricted borrowing. The Journal of Busi-ness, 45(3), 444-455.
[3] Frazzini, Andrea, Kabiller, David, & Pedersen, Lasse Heje . 2013. Buett's alpha . NBER WorkingPap er w19681. NBER.
[4] Haugen, R. A., & Heins, A. J. (1975). Risk and the rate of return on �nancial assets: Someold wine in new bottles. Journal of Financial and Quantitative Analysis, 10(05), 775-784.
[5] Jian,W. A nonparametric test of market timing. Journal of Empirical Finance 10 (2003) 399�425.
[6] Norris, B. (2015). Do Low Volatility Funds Deliver Positive Returns? Morningstar.
[7] Pollock, M. A. (2015). In search of low-volatility investments. The Wall Street Journal.
[8] Sharpe, William F. 1992. Asset allo cation: management style and p erformance meas- urement.Journal of Portfolio Management , 18 (2), 719.
[9] Shen, Pu . 2003. Market timing strategies that worked. Journal of Portfolio Management ,29 (2), 576
[10]Skrinjaric, T. Market Timing Ability of Mutual Fund wiTh Tests Applied on several CroatianFund. Croatian Operational Research Review (CRORR), Vol. 4, 2013
19