robbery and theft by brendan duffy. preparation preparation for this analysis involved isolating...
TRANSCRIPT
ROBBERY AND THEFTBy Brendan Duffy
PreparationPreparation for this analysis involved isolating incidents only related to robbery and theft. The study area is the University of Utah and the data range is 5 yrs. All information was provided by the Spillman Database; any records missing spatial information was discarded in this analysis.
L(x) is the likelihoodn is the total number recorder incidents related to robbery and theft.L(x) = amount/n *100, where amount is the value of crime occurrence for each category.
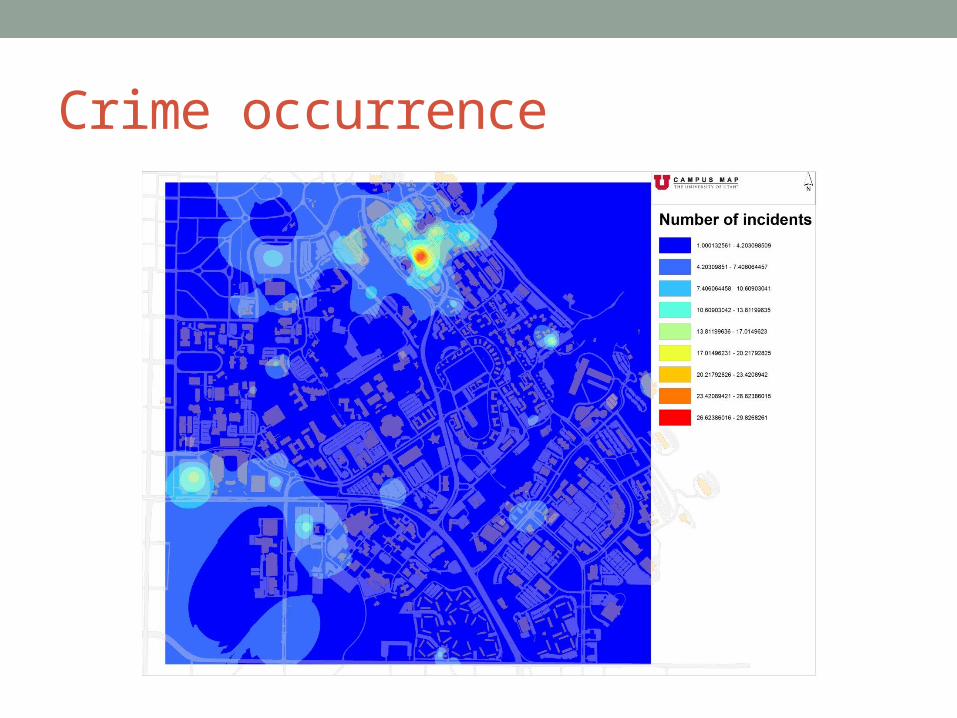
Crime occurrence

Crime Locations: Buildings
Most frequent crime location buildings:Medical Center Parking Terrace, University Hospital, University Hospital Parking Terrace, Primary Children’s Medical Center, A. Ray Olpin Union, Kennecott, Museum of Natural History, Warnock Engineering, and Campus bookstore.
Crime Locations: Roads and Lots
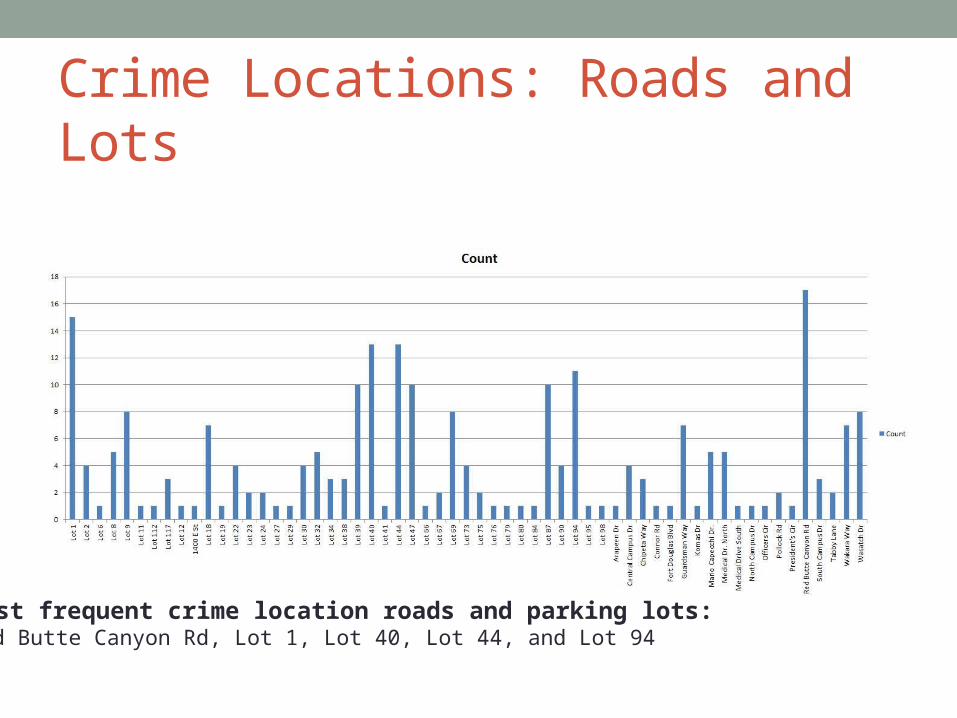
Most frequent crime location roads and parking lots: Red Butte Canyon Rd, Lot 1, Lot 40, Lot 44, and Lot 94
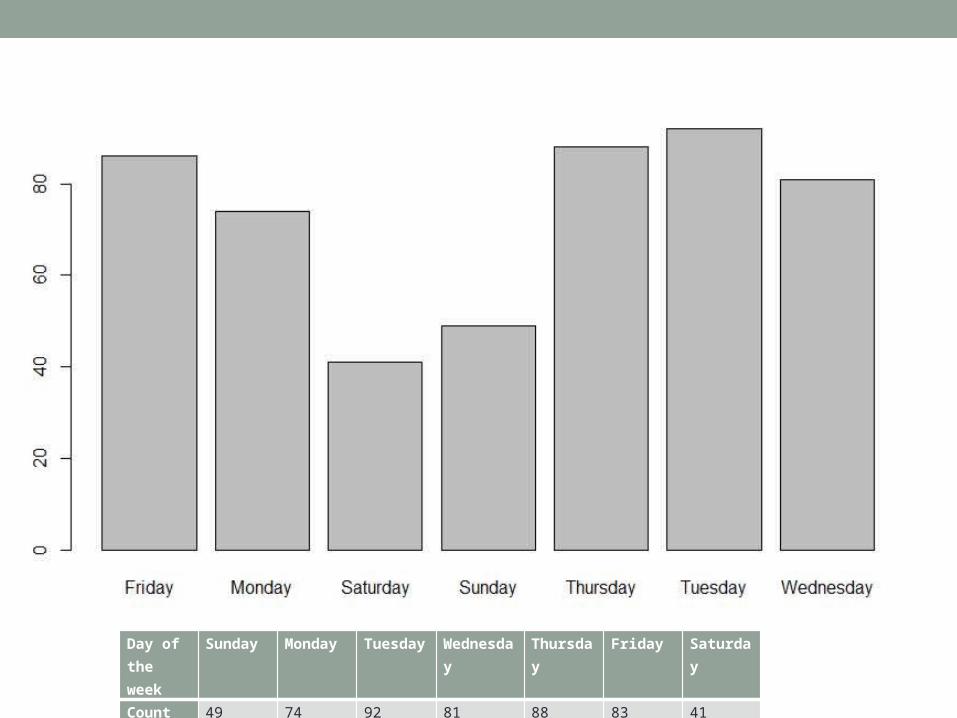
Day of the week
Sunday Monday Tuesday Wednesday
Thursday
Friday Saturday
Count 49 74 92 81 88 83 41L(x) 9.58 14.48 18.00 15.85 17.22 16.24 8.02

Hot Spot Map by Day

Months
Jan Feb Mar Apr May Jun Jul Aug Sep Oct Nov Dec
Count 47 36 36 47 35 32 34 44 41 50 71 38L(x) 9.19
7.04
7.04
9.19 6.84 6.26 6.65 8.61 8.02 9.78 13.8 7.43
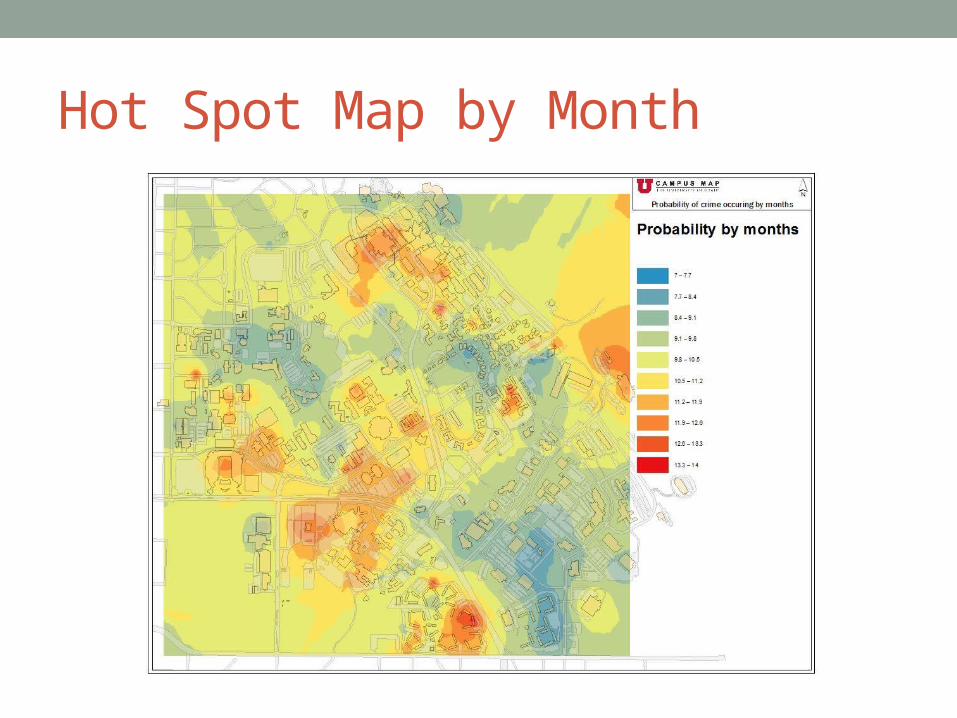
Hot Spot Map by Month

L(x) = amount/n *100, where amount is the value of crime occurrence for each hour in the day.
L(x) = amount/n *100, where amount is the value of crime occurrence for each hour in the day.
Hours 12pm 1pm 2pm 3pm 4pm 5pm 6pm 7pm 8pm 9pm 10pm 11pmCount 32 27 26 31 28 25 35 22 12 34 20 13L(x) 6.26 5.28 5.08 6.06 5.47 4.89 6.84 4.30 2.34 6.65 3.91 2.54
Hours 12am 1am 2am 3am 4am 5am 6am 7am 8am 9am 10am 11am
Count 14 8 3 1 5 7 15 39 44 34 30 22L(x) 2.73 1.56 0.58 0.19 0.97 1.36 2.93 7.63 8.61 6.65 5.87 4.30
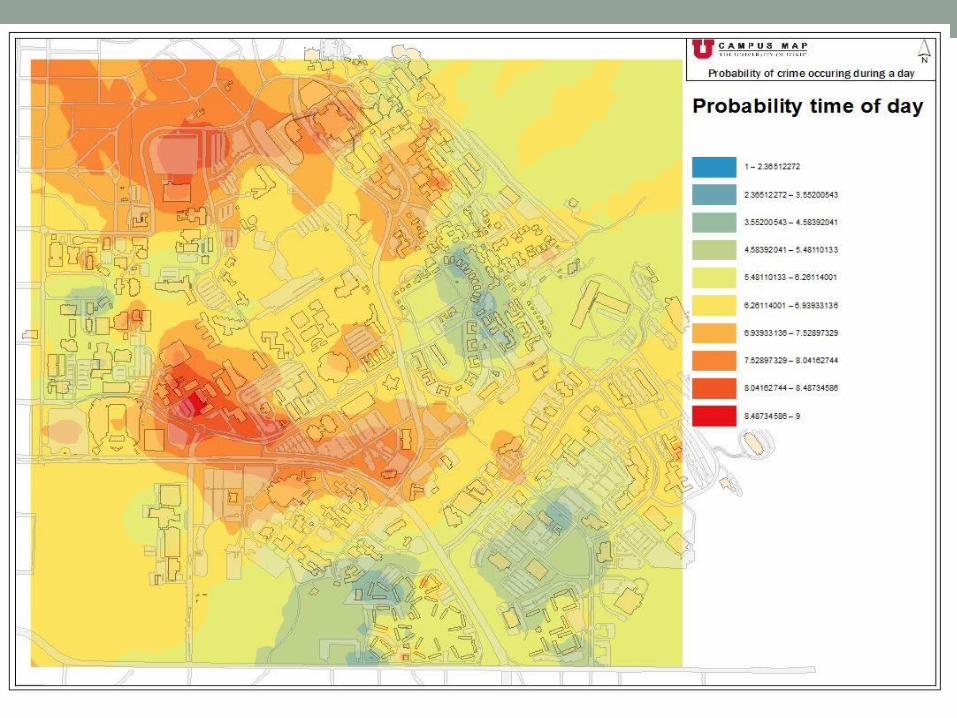

Findings• Most frequent times:
8am, 7am, 6pm, 9am, 12pm, 10am, 3pm
• Most frequent days: Tuesday, Thursday, Friday
• Most frequent months: November, January, October, and April
• Most frequent crime location buildings: Medical Center Parking Terrace, University Hospital, University Hospital Parking Terrace, Primary Children’s Medical Center, A. Ray Olpin Union, Kennecott, Museum of Natural History, Warnock Engineering, and Campus bookstore.
• Most frequent crime location roads and parking lots: Red Butte Canyon Rd, Lot 1, Lot 40, Lot 44, and Lot 94

Recommendations• Pursue improvements to Spillman data:
1. Tie all incidents to a specific location.• Address• Intersection of roads (1800 E at South Campus Dr.)• Parking Lot #’s• Building Name or Number
• Use initial study as a baseline and move forward with comparison analysis every quarter or least twice a year.
• Perform a time series analysis to compare month to previous months identifying changes in robbery/theft patterns.
• Consider predictive analysis and modify approach to prevention.
Recommendations (cont.)• Analysis findings going forward will show success in
strategies and areas for improvement. • Correlate class schedules and events to provide further
analysis on campus.