road traffic crashes in new south wales - 2014 · road traffic crashes in new south wales 2014 8 ....
TRANSCRIPT
ROAD TRAFFIC CRASHES IN NEW SOUTH WALES Statistical Statement for the year ended 31 December 2014
Prepared by the Centre for Road Safety, Transport for NSW
18 Lee Street Chippendale NSW 2008
Telephone: (02) 8202 2200 Facsimile: (02) 8202 2209 Postal address: PO Box K659 Haymarket NSW 1240
Internet: http://roadsafety.transport.nsw.gov.au/
E-mail: http://roadsafety.transport.nsw.gov.au/cgi-bin/index.cgi?action=feedback.form
Further information:
For further information concerning road crash statistics for New South Wales, write to the:
NSW Centre for Road Safety PO Box K659 Haymarket NSW 1240
ISSN 0155-2546 © State of NSW through Transport for NSW
Extracts from this publication may be reproduced provided the source is fully acknowledged.
Contents
SUMMARY DATA FOR 2014 6
MAIN POINTS FOR 2014 7
INTERPRETING TABLES CORRECTLY 8
PREFACE 9 Scope of crash statistics 9
How crash data are processed 10
Special notes 11
Definitions and explanatory notes 12
Criteria for determining speeding and fatigue involvement 14
CRASH AND CASUALTY TRENDS 15 Table 1 Trends in New South Wales 1950, 1955, 1960, 1965, 1970-2014 16
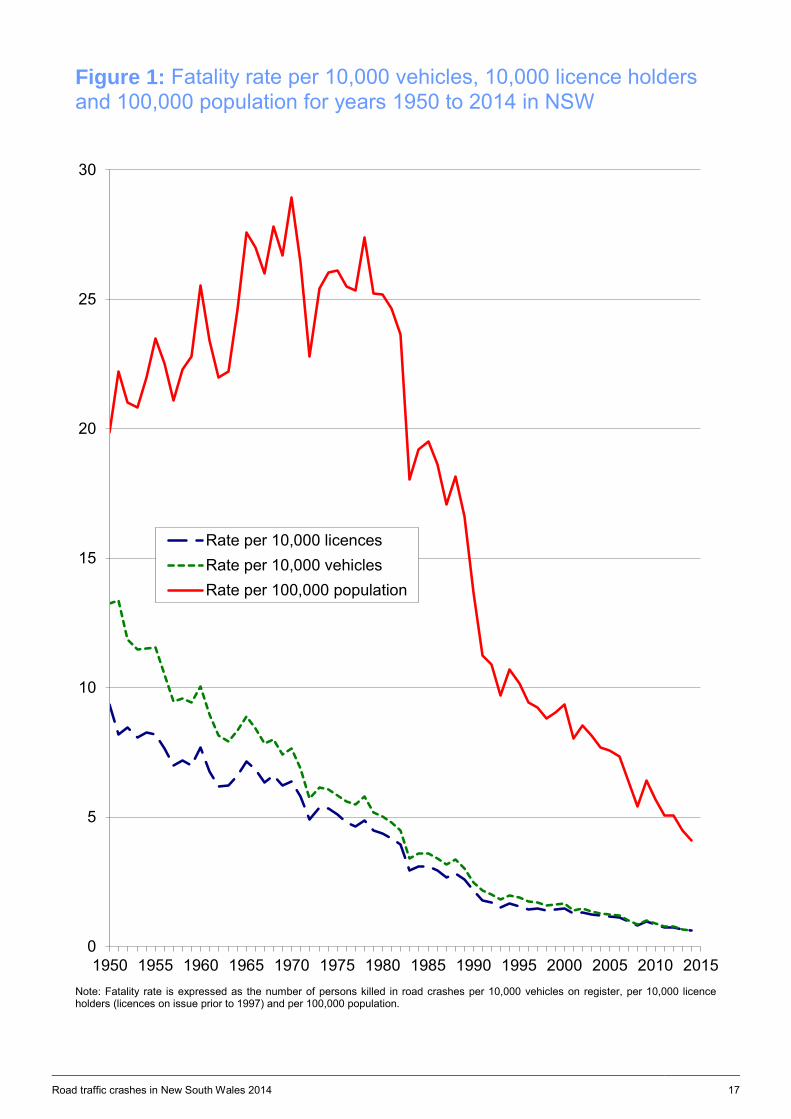
Figure 1 Fatality rate per 10,000 vehicles, 10,000 licence holders and 100,000 population for years 1950 to 2014 in NSW 17
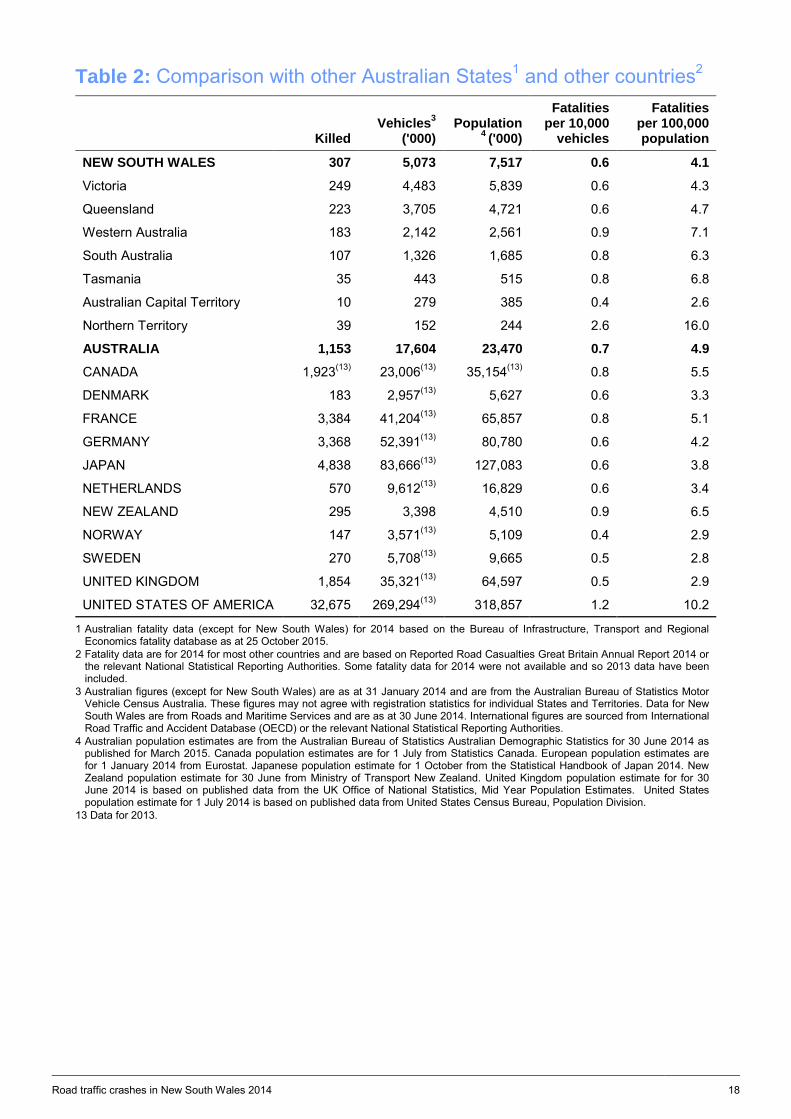
Table 2 Comparison with other Australian States and other countries 18
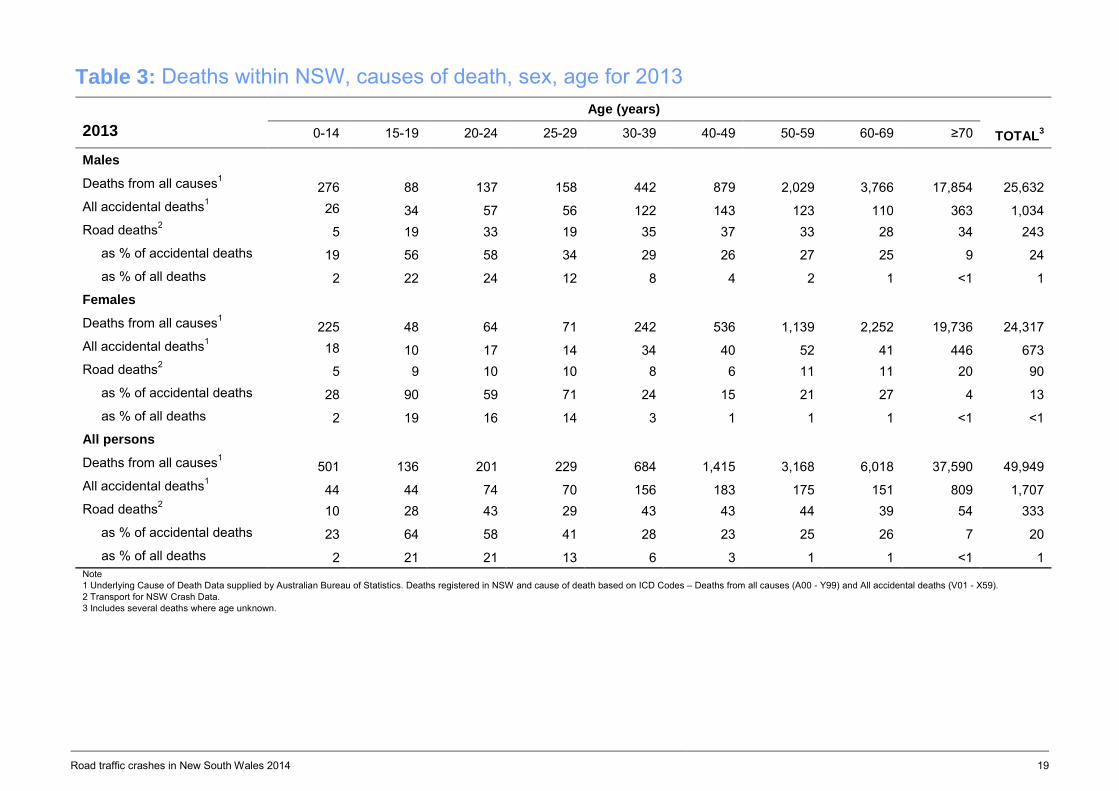
Table 3 Deaths within NSW, causes of death, sex, age for 2013 19
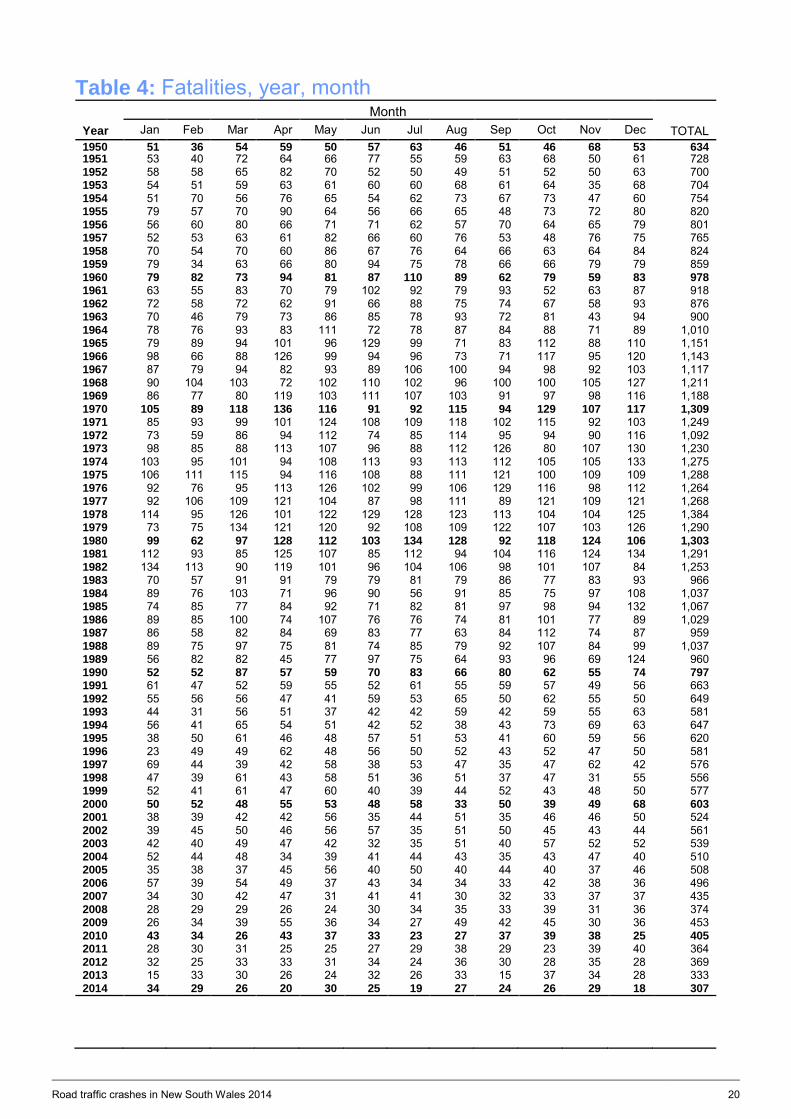
Table 4 Fatalities, year, month 20
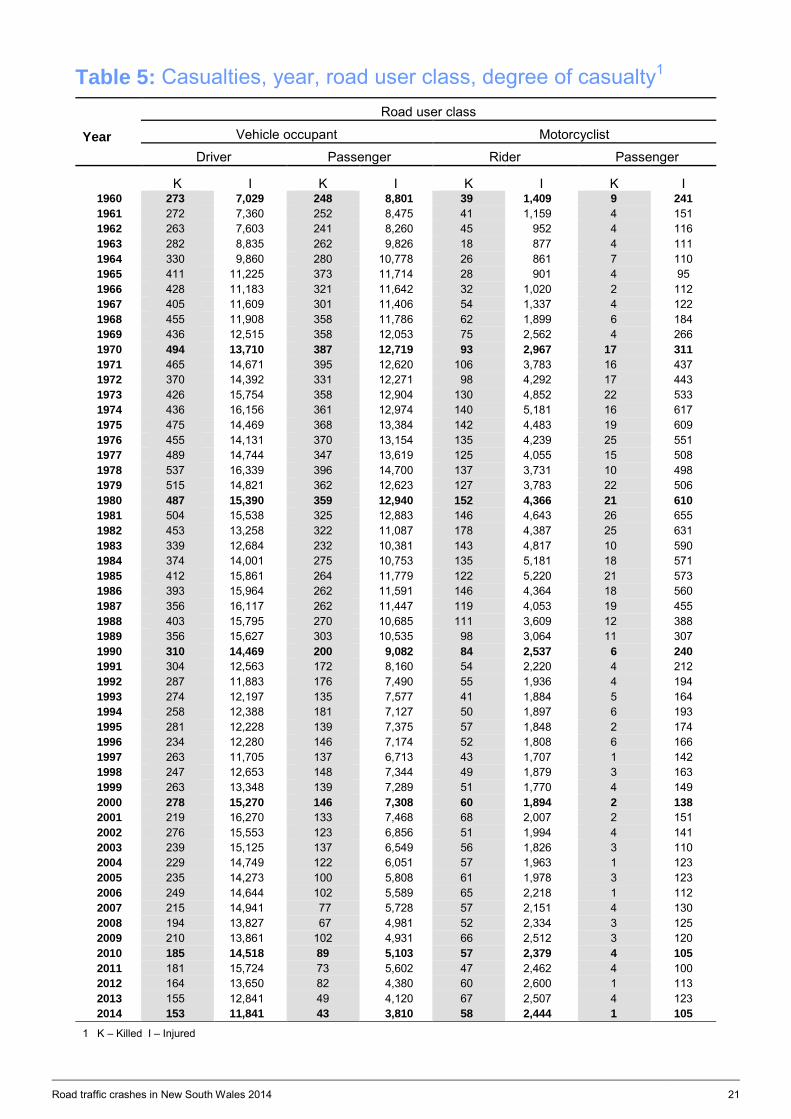
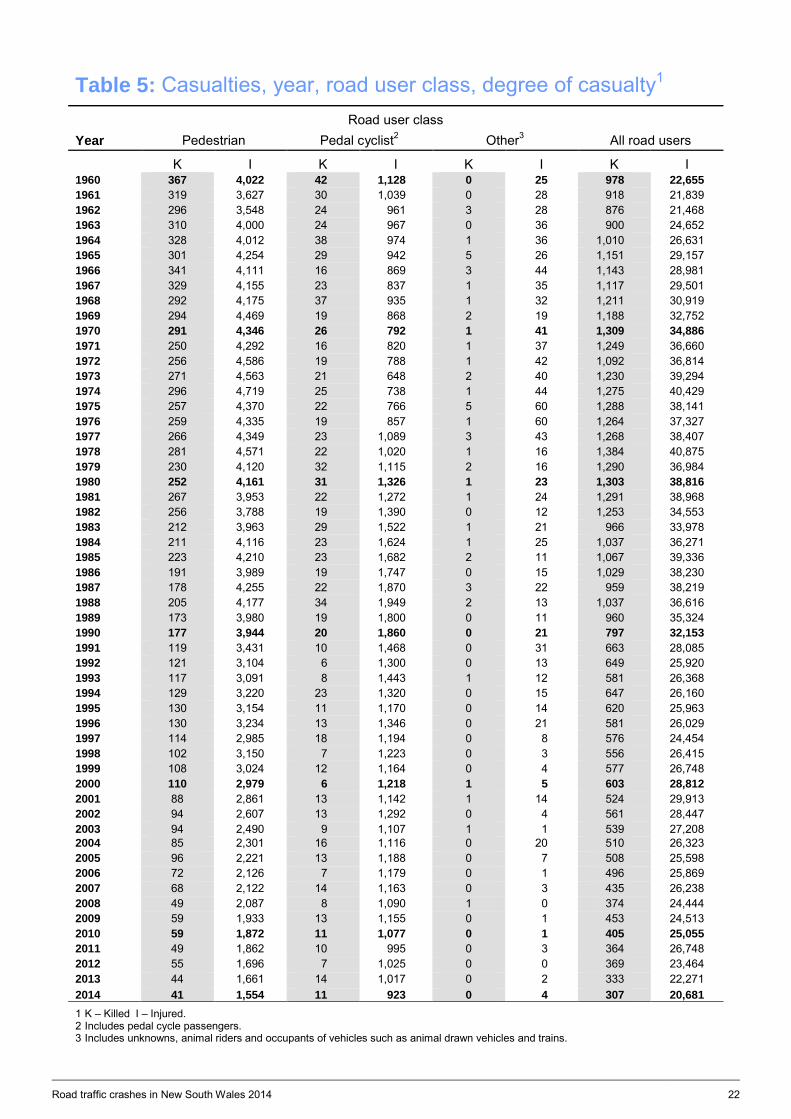
Table 5 Casualties, year, road user class, degree of casualty 21
ROAD CRASHES IN 2014 23 Time distribution of crashes
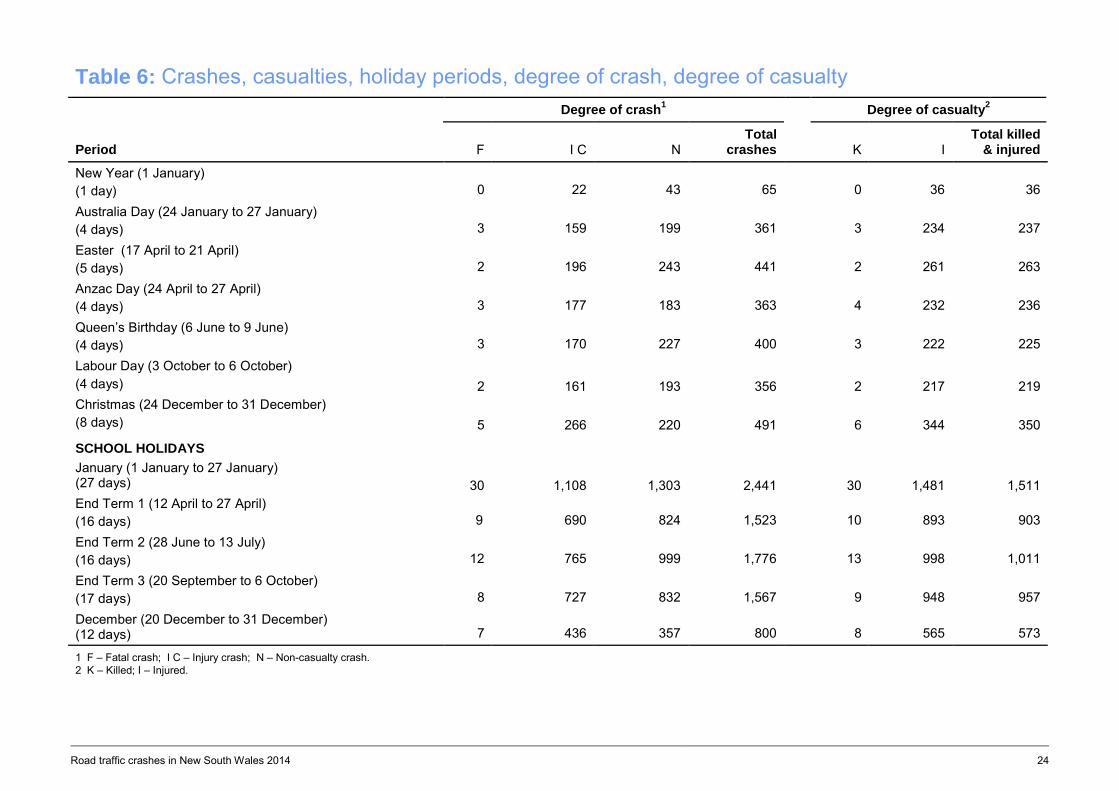
Table 6 Crashes, casualties, holiday periods, degree of crash, degree of casualty 24
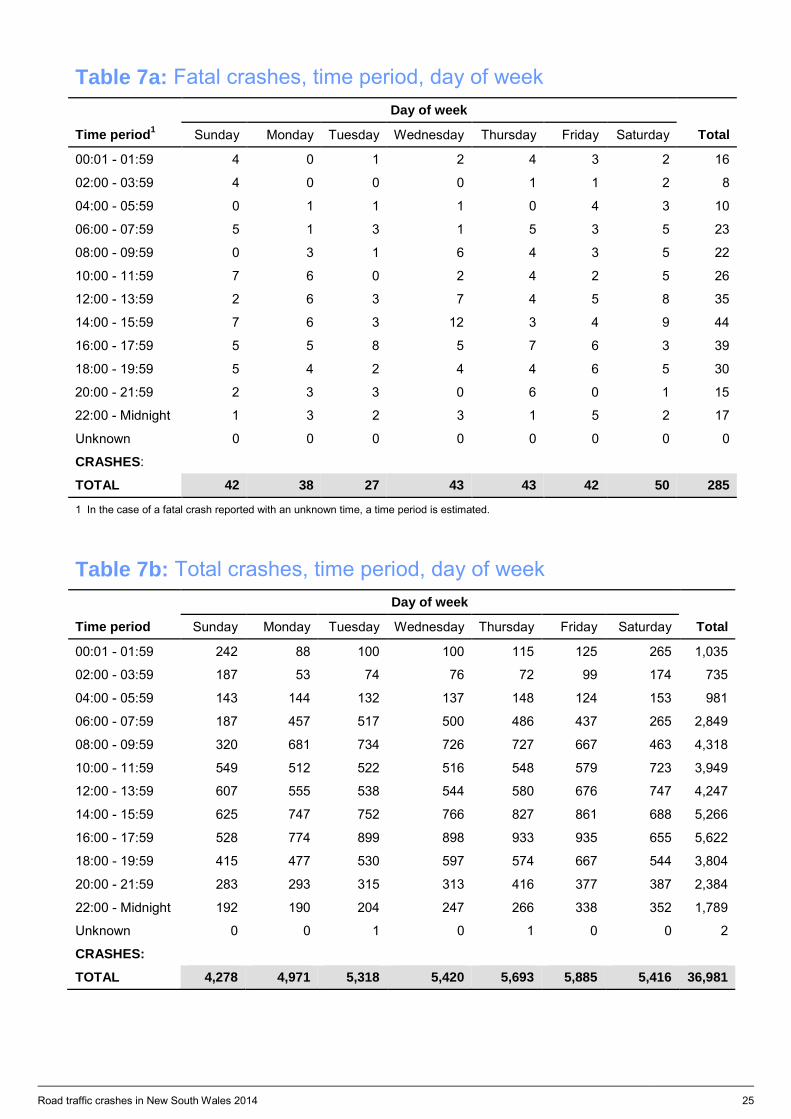
Table 7a Fatal crashes, time period, day of week 25
Table 7b Total crashes, time period, day of week 25
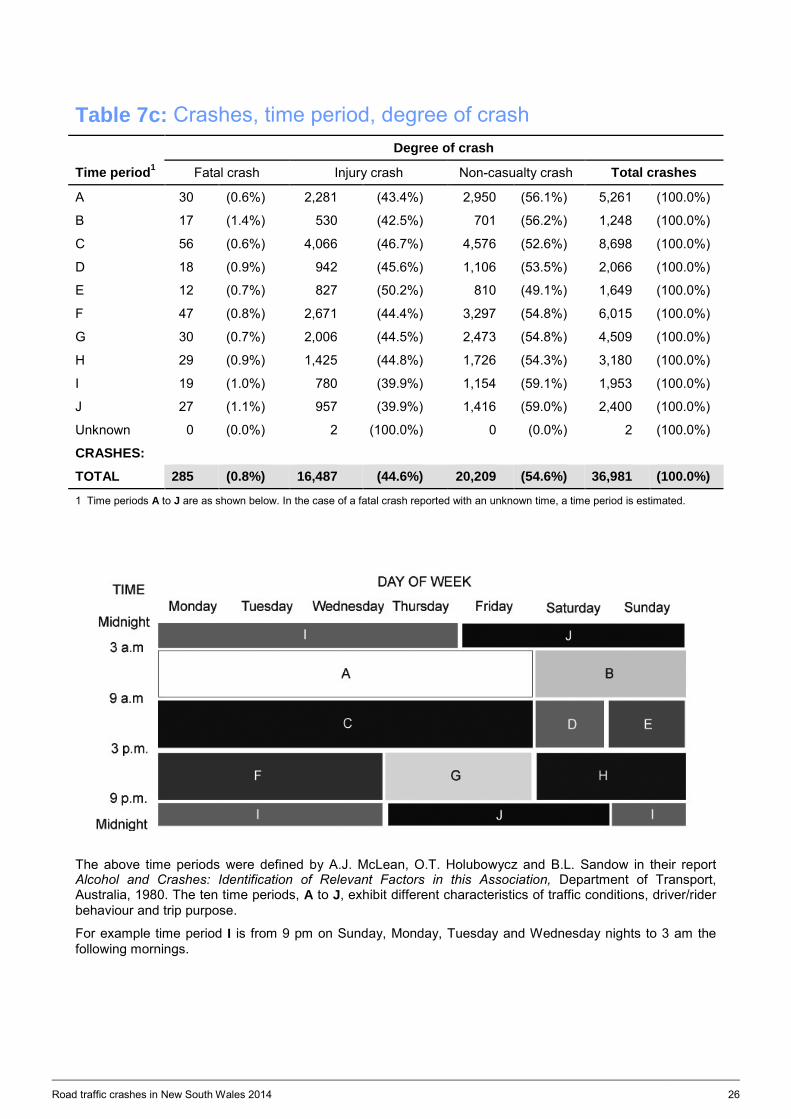
Table 7c Crashes, time period, degree of crash 26
Crash types
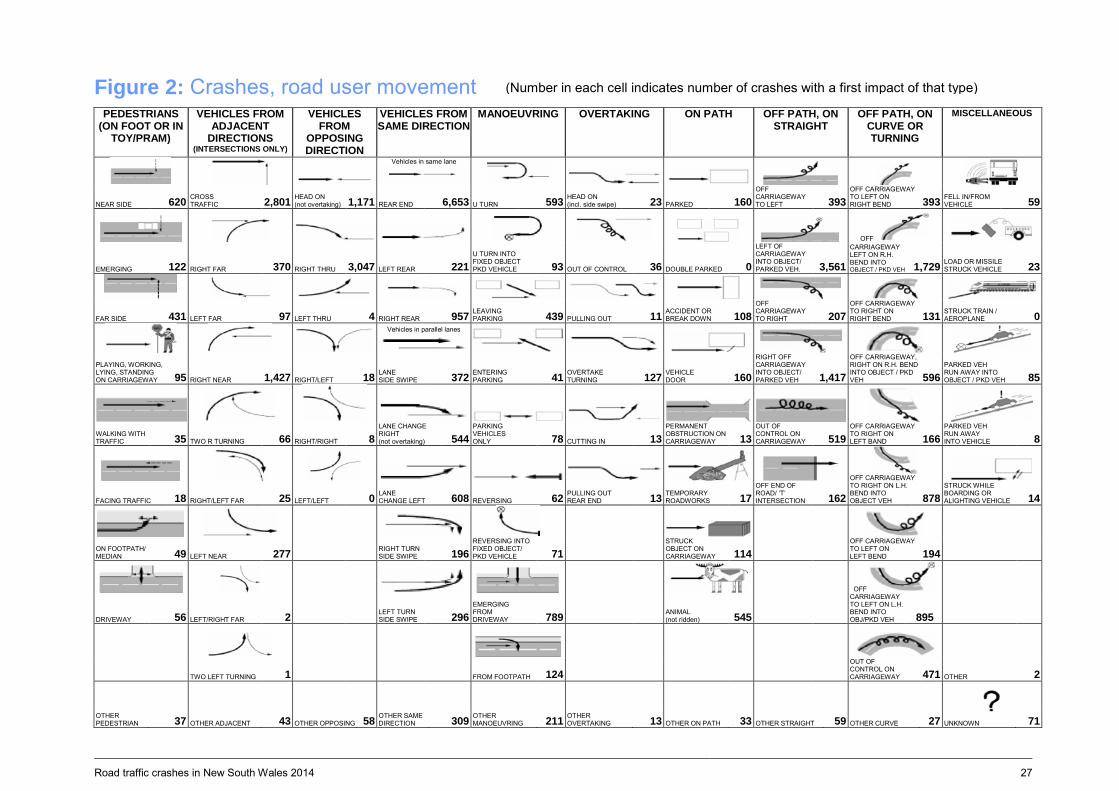
Figure 2 Crashes, road user movement 27
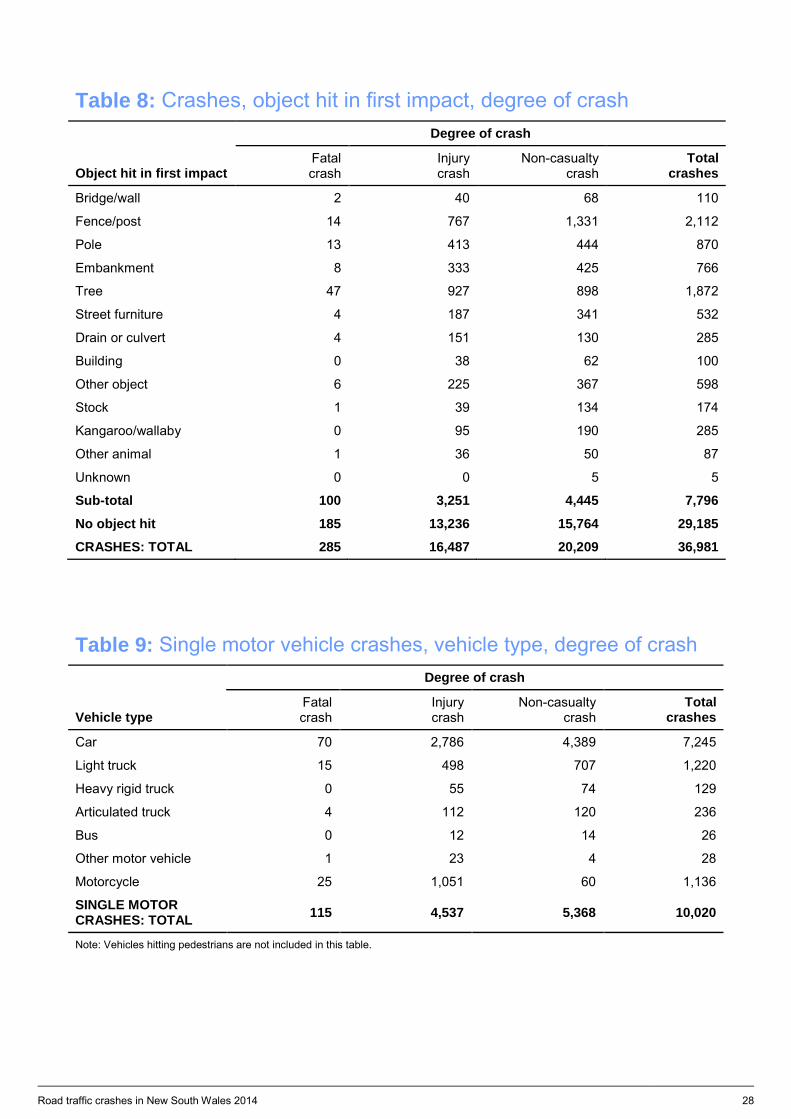
Table 8 Crashes, object hit in first impact, degree of crash 28
Table 9 Single motor vehicle crashes, vehicle type, degree of crash 28
Motor vehicle types
Table 10 Crashes, casualties, type of crash, degree of crash, degree of casualty 29
Table 11 Motor vehicles involved and involvement rate, vehicle type, degree of crash 30
Factors and errors possibly contributing to crashes
Table 12 Crashes, factors, degree of crash 30
Table 13 Crashes, degree of crash, alcohol involvement, time period 31
Table 14 Crashes, degree of crash, alcohol involvement, urbanisation 32
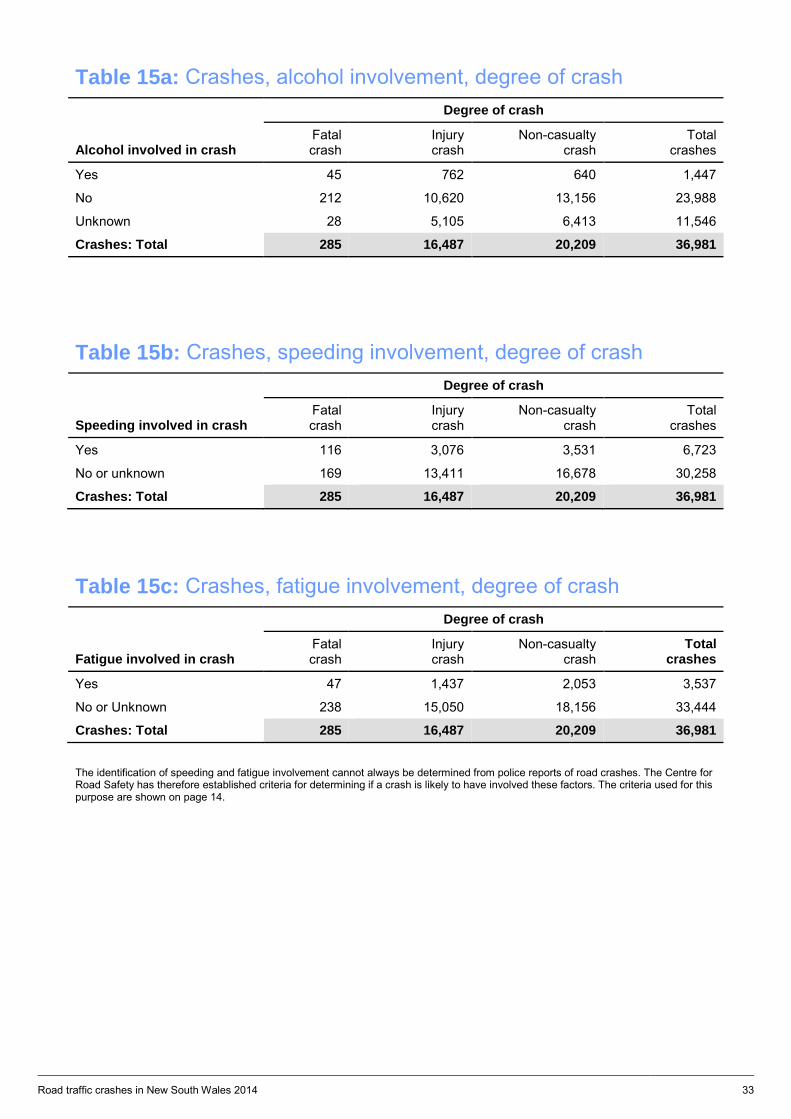
Table 15a Crashes, alcohol involvement, degree of crash 33
Table 15b Crashes, speeding involvement, degree of crash 33
Table 15c Crashes, fatigue involvement, degree of crash 33
Controllers in crashes
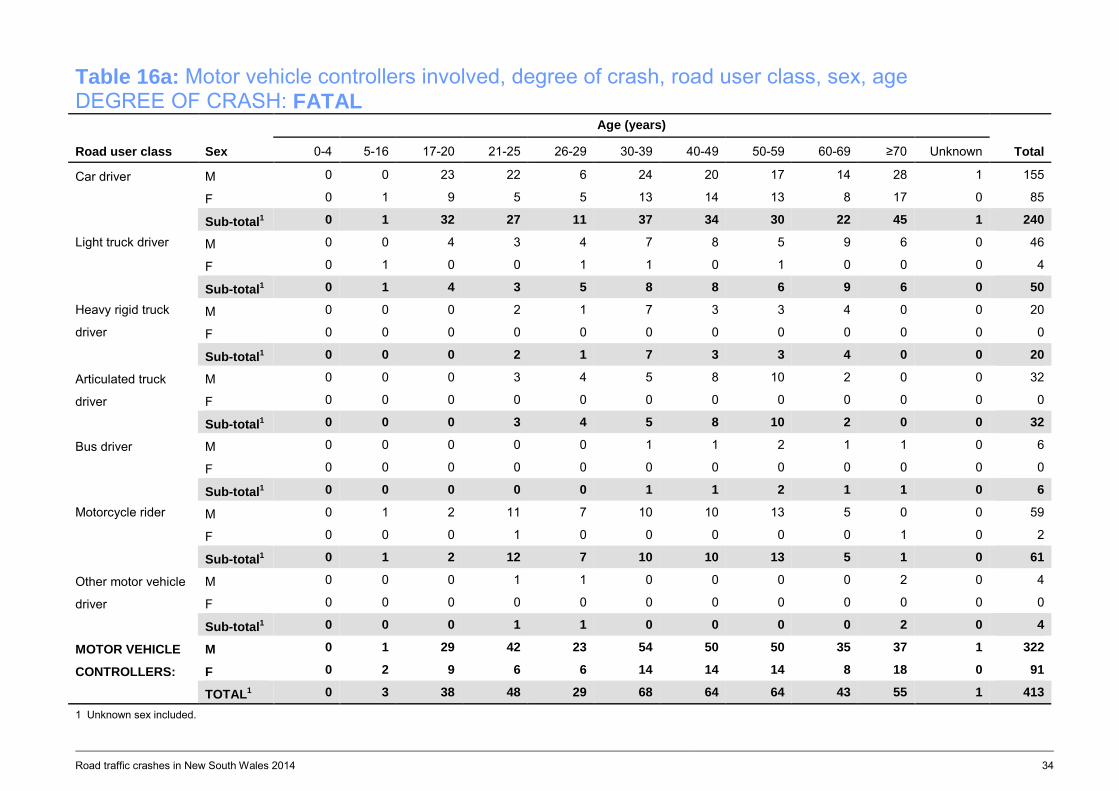
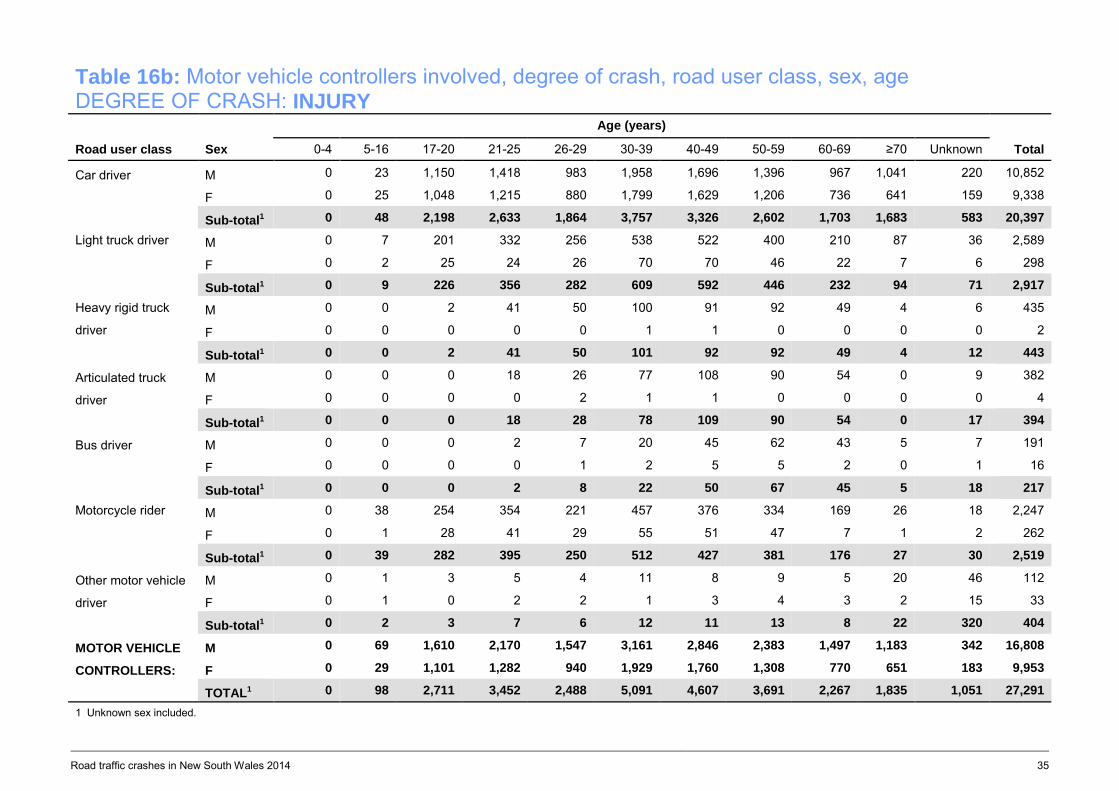
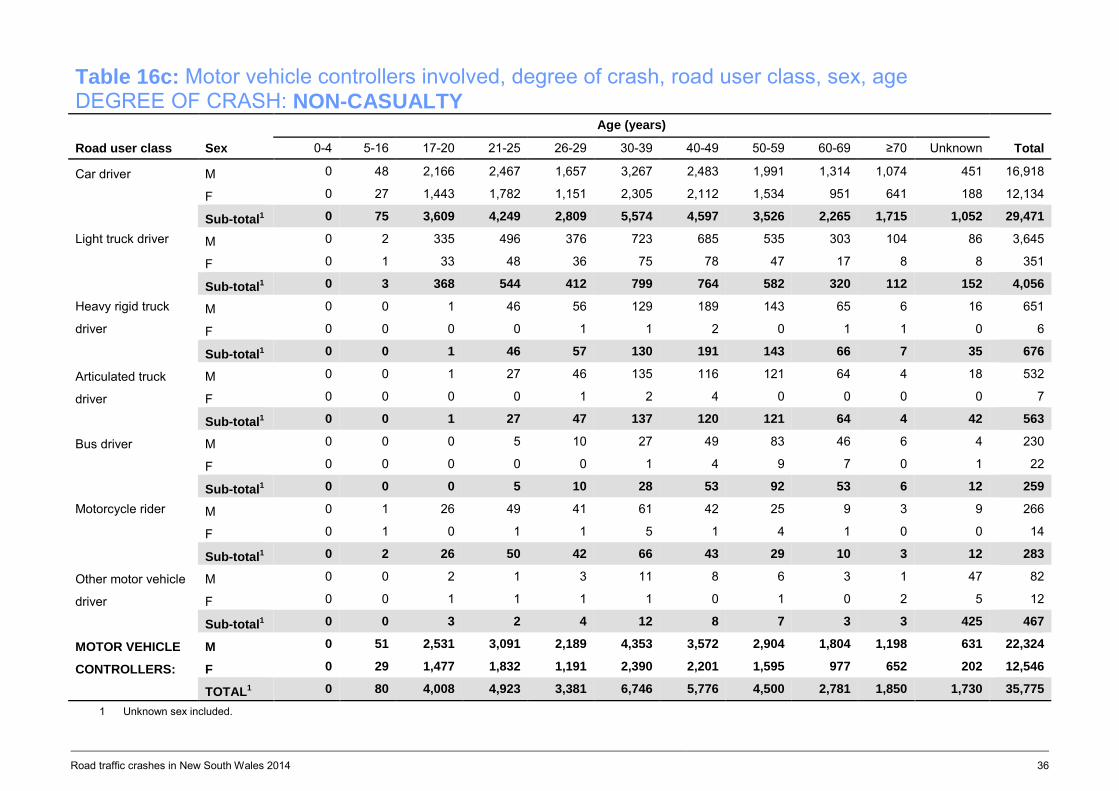
Table 16 Motor vehicle controllers involved, degree of crash, road user class, sex, age
a Degree of crash: Fatal 34
b Degree of crash: Injury 35
c Degree of crash: Non-casualty 36
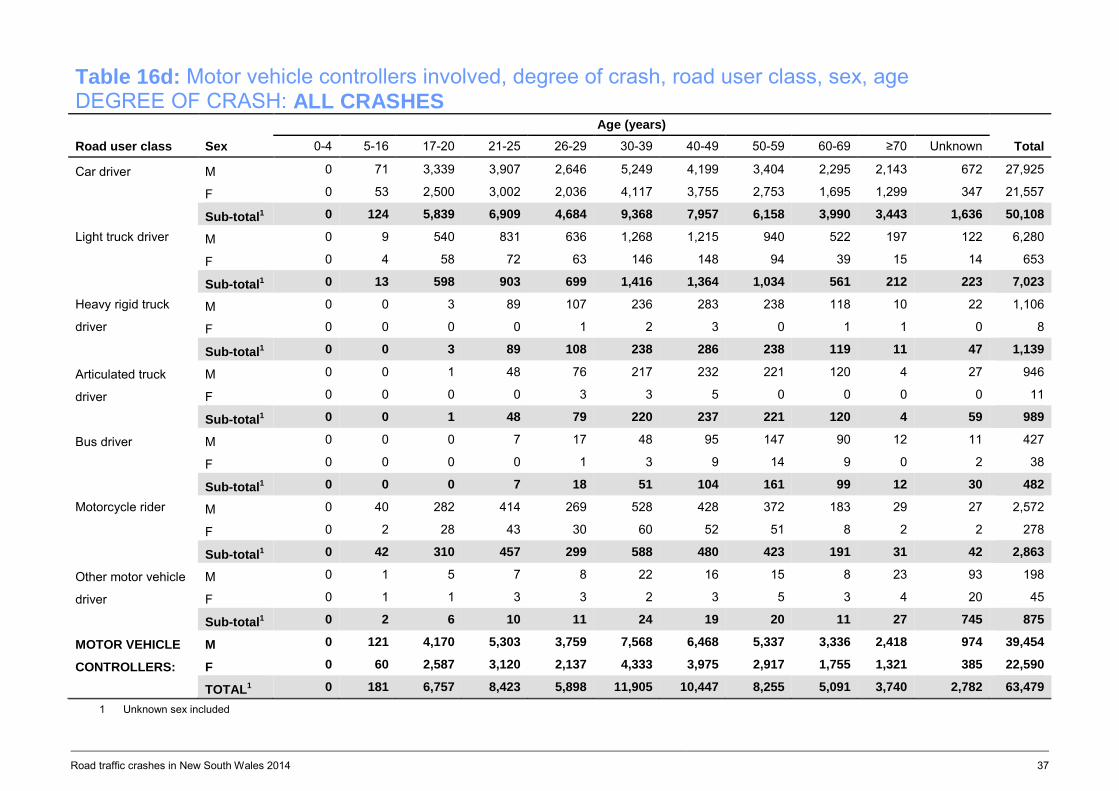
d Degree of crash: All crashes 37
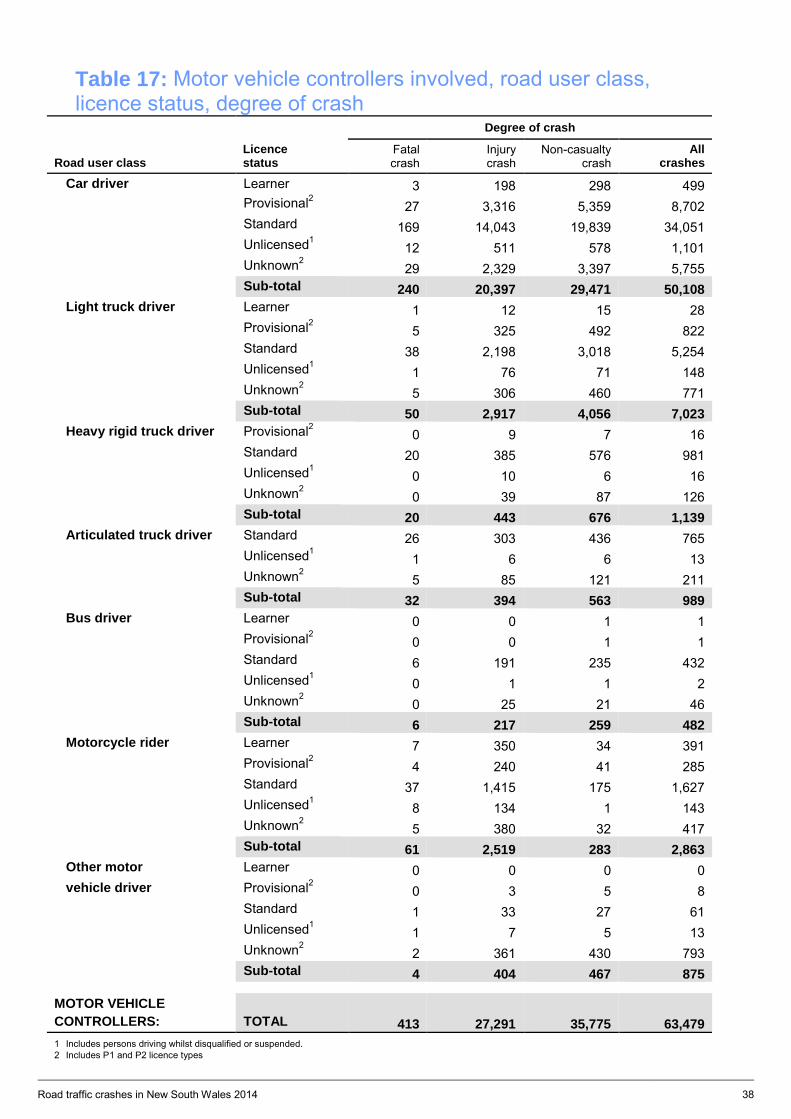
Table 17 Motor vehicle controllers involved, road user class, licence status, degree of crash 38
Table 18 Motor vehicle controllers involved, degree of crash,
blood alcohol concentration, sex, age
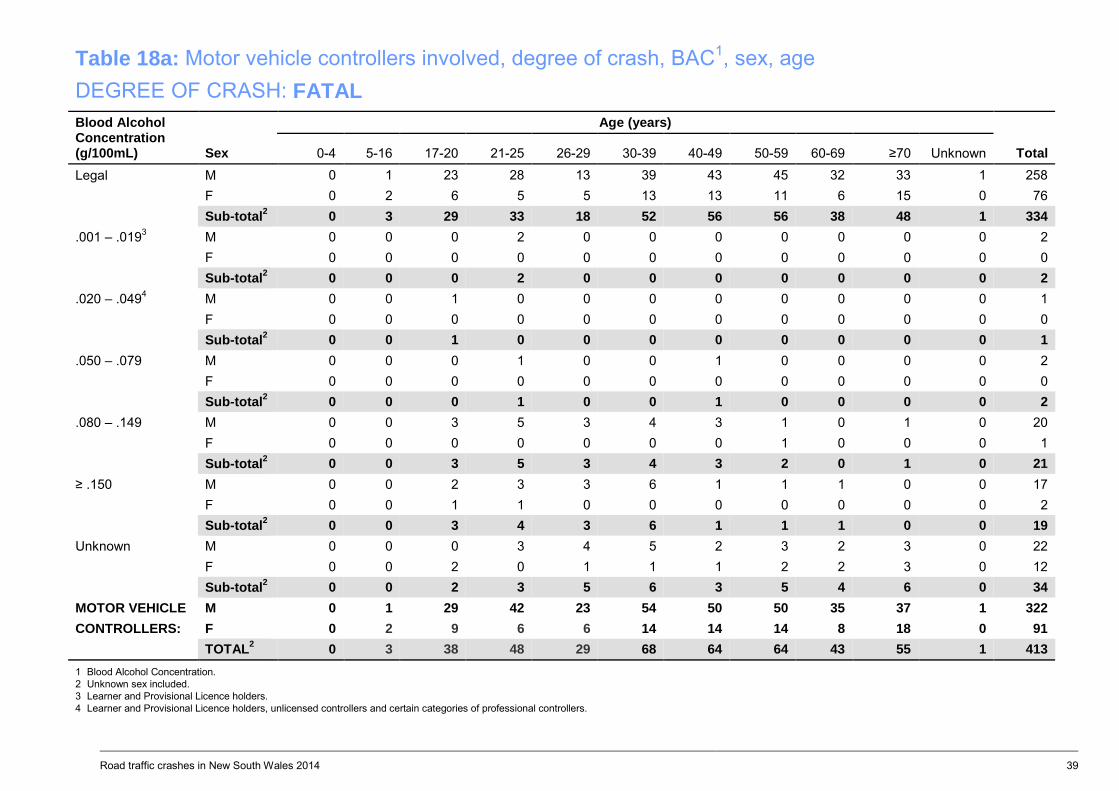
a Degree of crash: Fatal 39
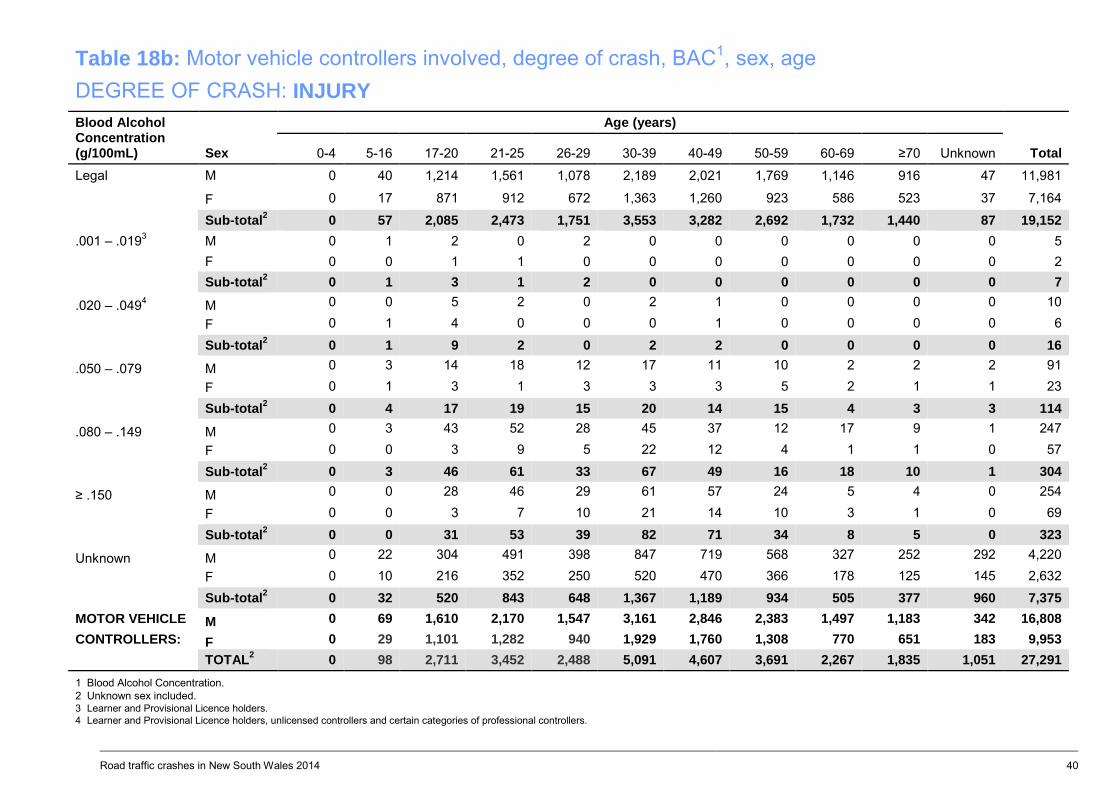
b Degree of crash: Injury 40
c Degree of crash: Non-casualty 41
d Degree of crash: All crashes 42
Table 19 Speeding motor vehicle controllers involved, degree of crash, sex, age 43
Table 20 Fatigued motor vehicle controllers involved, degree of crash, sex, age 44
Location and distribution of crashes
Table 21a Crashes, location type, degree of crash 45
Table 21b Crashes, feature of location, degree of crash 45
Table 22 Crashes, area, speed limit, degree of crash 46
Table 23 Crashes, alignment, surface condition, degree of crash 47
Table 24 Crashes, casualties, region, local government area, degree of crash,
degree of casualty 48
Table 25 Crashes, casualties, route, local government area, degree of crash,
degree of casualty 57
CASUALTIES IN 2014 71 Road user class, age and sex distribution of casualties
Table 26 Casualties, road user class, degree of casualty 73
Table 27 Casualties, degree of casualty, road user class, sex, age
a Degree of casualty: Killed 74
b Degree of casualty: Injured 75
c Degree of casualty: All casualties 76
Safety device for casualties
Table 28 Road vehicle casualties, road user class, safety device used, degree of casualty 77
Alcohol for casualties
Table 29 Motor vehicle controller casualties, degree of casualty,
blood alcohol concentration, sex, age
a Degree of casualty: Killed 78
b Degree of casualty: Injured 79
c Degree of casualty: All casualties 80
Table 30 Motor vehicle controller casualties, degree of casualty, road user class, blood alcohol concentration
a Degree of casualty: Killed 81
b Degree of casualty: Injured 81
c Degree of casualty: All casualties 82
Table 31a Casualties, alcohol involvement in crash, degree of casualty 83
Table 31b Casualties, speeding involvement in crash, degree of casualty 83
Table 31c Casualties, fatigue involvement in crash, degree of casualty 83
REFERENCE INFORMATION 84 Demographic data
Table 32 New South Wales residents, age, sex 85
Table 33 Licence holders, age of licence holder, sex of licence holder 86
Vehicle information
Table 34 Vehicles on register, vehicle type 87
INDEX 88
Road traffic crashes in New South Wales 2014 6
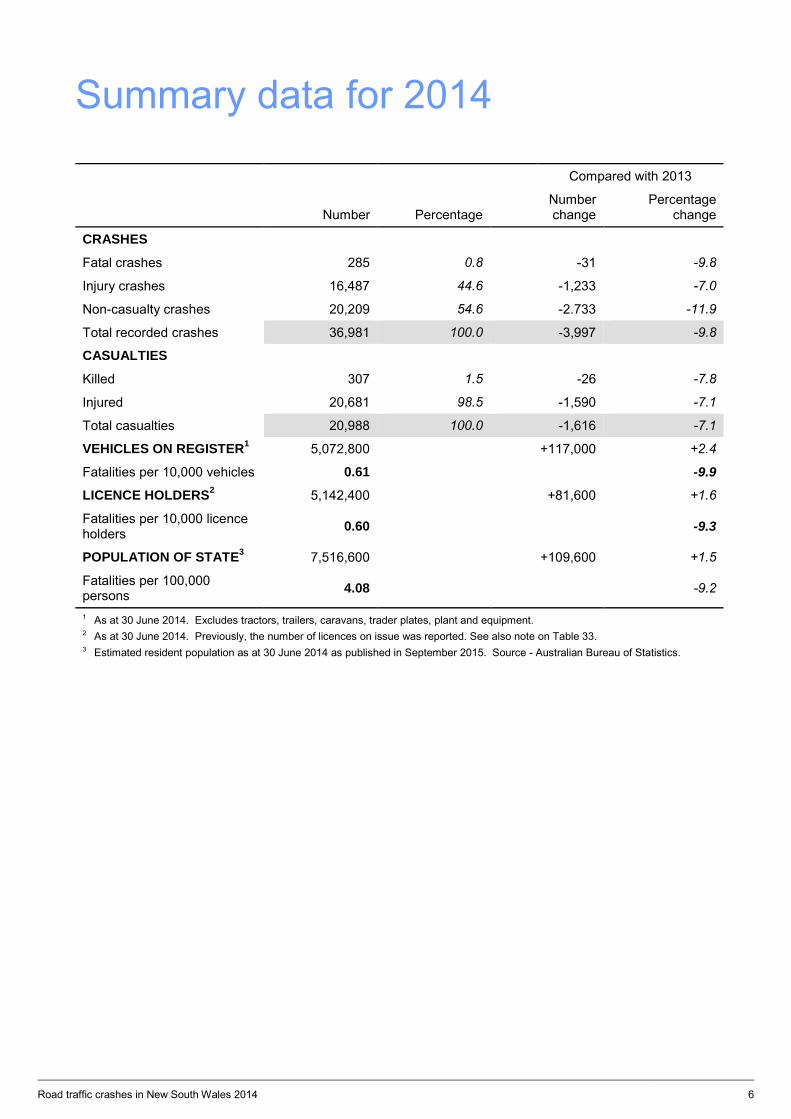
Summary data for 2014
Compared with 2013
Number Percentage
Number change
Percentage change
CRASHES
Fatal crashes 285 0.8 -31 -9.8
Injury crashes 16,487 44.6 -1,233 -7.0
Non-casualty crashes 20,209 54.6 -2.733 -11.9
Total recorded crashes 36,981 100.0 -3,997 -9.8
CASUALTIES
Killed 307 1.5 -26 -7.8
Injured 20,681 98.5 -1,590 -7.1
Total casualties 20,988 100.0 -1,616 -7.1
VEHICLES ON REGISTER1 5,072,800 +117,000 +2.4
Fatalities per 10,000 vehicles 0.61 -9.9
LICENCE HOLDERS2 5,142,400 +81,600 +1.6
Fatalities per 10,000 licence holders 0.60 -9.3
POPULATION OF STATE3 7,516,600 +109,600 +1.5
Fatalities per 100,000 persons 4.08 -9.2
1 As at 30 June 2014. Excludes tractors, trailers, caravans, trader plates, plant and equipment. 2 As at 30 June 2014. Previously, the number of licences on issue was reported. See also note on Table 33. 3 Estimated resident population as at 30 June 2014 as published in September 2015. Source - Australian Bureau of Statistics.
Road traffic crashes in New South Wales 2014 7
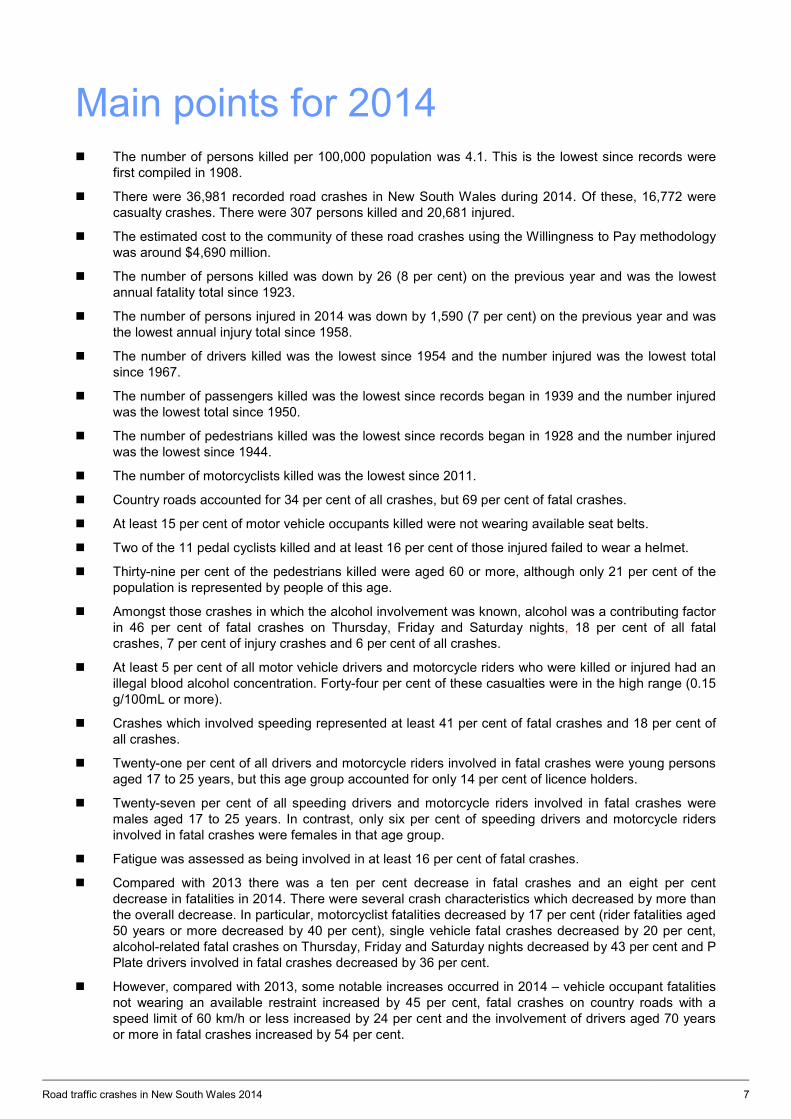
Main points for 2014 The number of persons killed per 100,000 population was 4.1. This is the lowest since records were
first compiled in 1908.
There were 36,981 recorded road crashes in New South Wales during 2014. Of these, 16,772 were casualty crashes. There were 307 persons killed and 20,681 injured.
The estimated cost to the community of these road crashes using the Willingness to Pay methodology was around $4,690 million.
The number of persons killed was down by 26 (8 per cent) on the previous year and was the lowest annual fatality total since 1923.
The number of persons injured in 2014 was down by 1,590 (7 per cent) on the previous year and was the lowest annual injury total since 1958.
The number of drivers killed was the lowest since 1954 and the number injured was the lowest total since 1967.
The number of passengers killed was the lowest since records began in 1939 and the number injured was the lowest total since 1950.
The number of pedestrians killed was the lowest since records began in 1928 and the number injured was the lowest since 1944.
The number of motorcyclists killed was the lowest since 2011.
Country roads accounted for 34 per cent of all crashes, but 69 per cent of fatal crashes.
At least 15 per cent of motor vehicle occupants killed were not wearing available seat belts.
Two of the 11 pedal cyclists killed and at least 16 per cent of those injured failed to wear a helmet.
Thirty-nine per cent of the pedestrians killed were aged 60 or more, although only 21 per cent of the population is represented by people of this age.
Amongst those crashes in which the alcohol involvement was known, alcohol was a contributing factor in 46 per cent of fatal crashes on Thursday, Friday and Saturday nights, 18 per cent of all fatal crashes, 7 per cent of injury crashes and 6 per cent of all crashes.
At least 5 per cent of all motor vehicle drivers and motorcycle riders who were killed or injured had an illegal blood alcohol concentration. Forty-four per cent of these casualties were in the high range (0.15 g/100mL or more).
Crashes which involved speeding represented at least 41 per cent of fatal crashes and 18 per cent of all crashes.
Twenty-one per cent of all drivers and motorcycle riders involved in fatal crashes were young persons aged 17 to 25 years, but this age group accounted for only 14 per cent of licence holders.
Twenty-seven per cent of all speeding drivers and motorcycle riders involved in fatal crashes were males aged 17 to 25 years. In contrast, only six per cent of speeding drivers and motorcycle riders involved in fatal crashes were females in that age group.
Fatigue was assessed as being involved in at least 16 per cent of fatal crashes.
Compared with 2013 there was a ten per cent decrease in fatal crashes and an eight per cent decrease in fatalities in 2014. There were several crash characteristics which decreased by more than the overall decrease. In particular, motorcyclist fatalities decreased by 17 per cent (rider fatalities aged 50 years or more decreased by 40 per cent), single vehicle fatal crashes decreased by 20 per cent, alcohol-related fatal crashes on Thursday, Friday and Saturday nights decreased by 43 per cent and P Plate drivers involved in fatal crashes decreased by 36 per cent.
However, compared with 2013, some notable increases occurred in 2014 – vehicle occupant fatalities not wearing an available restraint increased by 45 per cent, fatal crashes on country roads with a speed limit of 60 km/h or less increased by 24 per cent and the involvement of drivers aged 70 years or more in fatal crashes increased by 54 per cent.
Road traffic crashes in New South Wales 2014 8
Interpreting tables correctly
It is essential to understand which particular data items are being counted in a table in order to avoid mistakes in interpreting them.
Convention for table headings The first word(s) in the title of a table indicates the data items being counted. For example, Table 5 gives counts of casualties, Table 13 gives counts of crashes and Table 29 gives counts of motor vehicle controller casualties. Remaining words in the table titles indicate the classification variables.
EXAMPLE 1
Suppose you wish to know the number of car drivers aged 17-20 years who were killed. If you looked at Table 16a, on page 34, saw the word fatal in the heading and assumed that the table was counting persons killed, you would deduce that 32 car drivers aged 17-20 were killed. That is not the correct answer. Table 16a is counting motor vehicle controllers involved in fatal crashes regardless of whether those controllers were themselves killed.
To determine the number of car drivers aged 17-20 who were killed you would need to use Table 27a, on page 74. This table is counting casualties and the degree of casualty is the category killed. The correct answer to the above question, as indicated in this table, is 18.
EXAMPLE 2
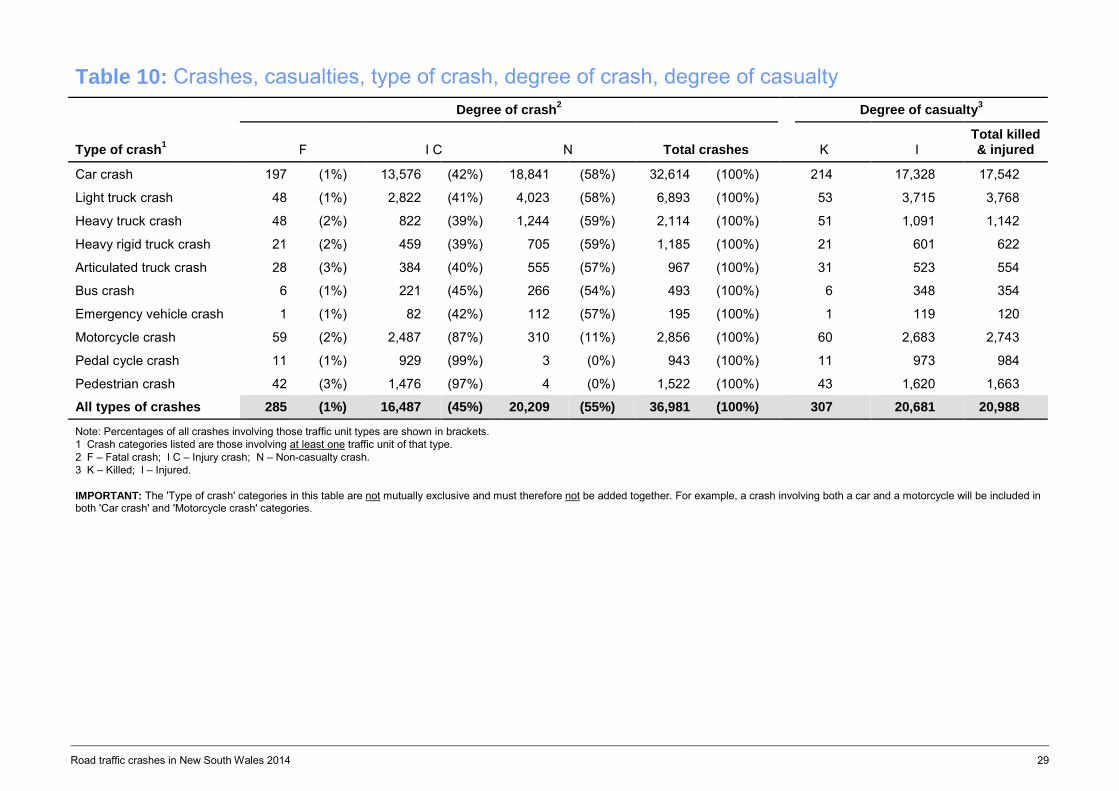
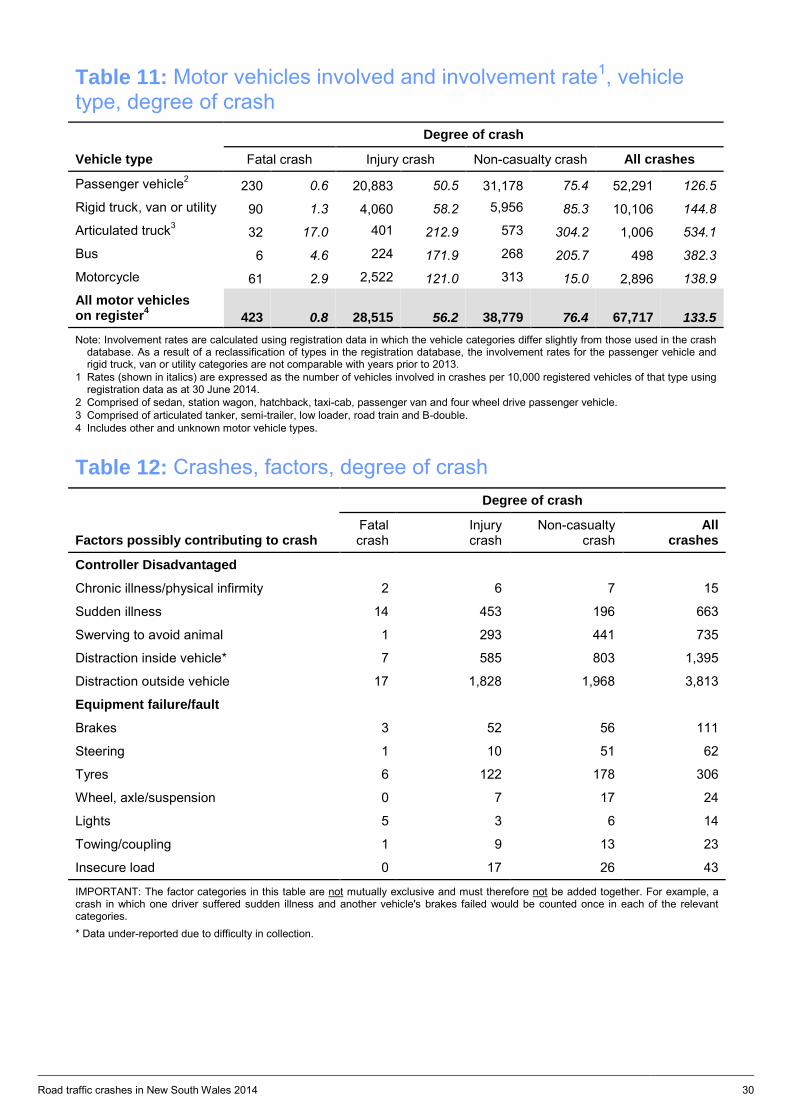
Suppose you wish to know how many injury crashes involved at least one motorcycle. If you looked at Table 11, on page 30, and did not note that the table is counting motor vehicles involved in crashes, you might be tempted to assume that the answer to your question was 2,522. That is not the correct answer.
There can be more than one motorcycle involved in a particular crash so to answer this question you need to look at a table which is counting crashes, not motor vehicles involved in crashes.
The correct answer of 2,487 is to be found from Table 10, on page 29, which is counting crashes and casualties for particular types of crashes.
EXAMPLE 3
Don’t make assumptions about the nature of persons killed or injured that are not justified by the information presented. Table 10 tells us the numbers of casualties from different types of crashes but does not imply anything about the road user classes of those casualties.
For example, when considering casualties from pedal cycle crashes you cannot assume that all casualties were pedal cycle riders or pedal cycle passengers. Some may be pedestrians or even truck drivers. A little lateral thinking is necessary to understand all the implications.
Road traffic crashes in New South Wales 2014 9
Preface
Scope of crash statistics Significant changes to the collection and processing of crash data have occurred during 2014. The introduction of self-reporting of crashes by NSW Police as well as the identification of serious injury information from NSW Health records have both impacted the 2014 crash data.
Crash statistics included in this Statistical Statement
The crash statistics recorded by Transport for NSW and included in this Statistical Statement are confined to those crashes which conform to the national guidelines for reporting and classifying road vehicle crashes and are based on the following criteria:
1 The crash was reported to the police 2 The crash occurred on a road open to the public 3 The crash involved at least one moving road vehicle 4 The crash involved at least one person being killed or injured or at least one motor vehicle being
towed away. Reports for some crashes are not received until well into the following year and after the annual crash database has been finalised. These amount to fewer than 1% of recorded crashes and are counted in the following year's statistics.
Crash data reported in this Statistical Statement were finalised and released in September 2015.
Criteria for reporting crashes in 2014
Prior to 2000, Section 8 (3) of the Traffic Act 1909 required a road crash in New South Wales to be reported to the police when any person was killed or injured or property damage over $500 was sustained.
On 1 December 1999, the Traffic Act was repealed and replaced by new traffic legislation including the adoption of the Australian Road Rules. The new traffic legislation is found in the Road Transport (General) Act 1999 and the Road Transport (Safety and Traffic Management) Act 1999 and the regulations made under those Acts.
Rule 287 (3) of the Road Rules requires a crash to be reported to police when any person is killed or injured; when drivers involved in the crash do not exchange particulars; or when a vehicle involved in the crash is towed away.
As of 15 October 2014 NSW Police do not attend or investigate crashes in which a vehicle is towed away but no-one is injured or killed. These crashes are now required to be self-reported by involved parties to Police via the Police Assistance Line (PAL). If medical attention for an injury is sought more than 24 hours after a crash, this may also be reported via PAL as an injury crash.
Impact of crash self-reporting
The introduction of self-reporting for crashes has impacted trends in the crash data from October 2014. Crash records collected directly from involved parties contain less descriptive data making the determination of attributes such as road user movements and contributing factors less reliable or unavailable for these crashes. Self-reported crashes make up 10.4 per cent of non-casualty crashes and 4.5 per cent of injury crashes in 2014.
The introduction of self-reporting of crashes has resulted in a decrease in the number of crashes recorded by NSW Police. Non-injury crashes reported in 2014 have declined by 12 per cent from 2013. Some of this decrease is attributed to the change since October 2014.
Road traffic crashes in New South Wales 2014 10
How crash data are processed The processing of crash data in New South Wales directly involves three organisations: the NSW Police Force, Spinal Cord Injuries Australia (SCI) and Transport for NSW. Within Transport for NSW, the Centre for Road Safety (CRS) is the office responsible for the collation and dissemination of road crash data.
As of July 1997 information related to a road crash is entered directly into COPS (Computerised Operational Policing System) by a police officer, using details collected by them from the scene and witness accounts, or a Police Assistance Line (PAL) operator from details provided by the person reporting the crash. A sketch or site diagram of the crash site is completed for casualty crashes where a police officer attended the crash scene.
Completed and verified data for all crashes are transferred from COPS, on a weekly basis, and electronically forwarded to the CRS. The crash information and site diagrams are electronically available to SCI, a business enterprise employing physically disabled people, contracted to the CRS to provide a coding and data entry service. Using the CrashLink Data Capture System, accurate location information is determined for each crash and the collision summary/narrative describing the crash and data items is interpreted, validated and coded into consistent values. While less information is captured by PAL for self-reported crashes, these crashes are still coded in the same manner with capture of most data fields possible from the available information.
A computer checking process is performed to identify inconsistencies and errors which may have occurred during the data entry and validation phases. In addition, results of blood alcohol analyses are regularly obtained from the NSW Health Pathology Forensic and Analytical Science Services. A further checking process is undertaken each quarter to identify and correct any anomalies in the data prior to finalisation.
In the case of a fatal crash, police officers send a preliminary report, generated from COPS, by facsimile to the CRS. This provides initial information which is used to compile a preliminary database of fatal crashes. Hence, it is possible to monitor and analyse fatal crashes on a daily basis. A site diagram of the crash scene is usually supplied later, which enables location and crash details to be confirmed and updated if required. Final fatal crash data are captured upon receipt of the data regularly received electronically from the NSW Police Force.
The CRS crash reporting database, known as CrashLink, is used extensively within Transport for NSW for monitoring and research work, strategic planning and the production of routine reports and analyses. Members of the public and organisations such as the Federal Department of Infrastructure and Regional Development, NSW Police Force, National Roads and Motorist’s Association, Australian Bureau of Statistics and Local Governments also regularly use road crash information.
Special notes
Comparing data with previous years Extra injury information 2005 - 2014
In 2014 a project was conducted to match crash records from CrashLink to hospital records from NSW Health. This linkage resulted in the identification of hospital admissions for persons previously identified by Police as uninjured drivers or riders. This extra information has been used to enhance the crash data for 2005 to 2014 by including the additional injured people as casualties. This also has the effect of changing some towaway crashes to injury crashes. This has resulted, on average, in an additional 360 casualties per year for this time period. The total number of crashes each year has not been changed by the inclusion of this information.
Table 1 and Table 5 in this statistical statement include these data from 2005 to 2014. All tables from Table 6 in this statistical statement include these data for 2014. Care must be taken when assessing trends over time from years prior to 2005 or from previously published statistical statements.
Road traffic crashes in New South Wales 2014 11
Injury statistics recording process change
Due to coding practice changes in the injury recording process since 2012, injury statistics are not directly comparable with those for 2010 and 2011. A coding practice change spanning the period from mid 2010 to the end of 2011 was found to result in a slightly elevated number of recorded injuries. Based on a review of 2012 data, statistics for the six quarters from September 2010 to December 2011 inclusive are estimated to reflect around nine per cent more injuries than would have been the case if the practice had not changed. Based on this estimation, annual total casualties reported in the 2010 statistical statement may be assumed to include an increase of around 4.5 per cent due to this change.
A fewer number of injuries from 2012 onwards reflects the reversal of this coding practice. This effect is less for the number of injury crashes with the increase in injury crash numbers being estimated at around 5.5 per cent for the affected quarters.
There is no indication of any geographic bias in the effect, with urban and rural increases expected to be consistent. However, there is evidence to show that there is a bias in the road user class statistics. Most of the over-reporting is apparent in the motor vehicle occupant road user classes (driver or passenger), with more vulnerable user classes such as motorcycle riders or pedestrians having only a minimal over-reporting.
Historical data changes
Due to the introduction by police of the paperless system described in How crash data are processed, there may be inconsistencies in the reporting of some data fields. In particular, the classification of injury data into serious injury or other injury was discontinued from 1998 as the police reported that ‘admitted to hospital’ data were no longer available. The assignment of an unknown value has increased in frequency for a number of fields and decreased for others.
The introduction of the Graduated Licensing System in 2000 resulted in an increase in the number of Provisional Licence holders.
In 2010 an improvement was made to the identification of contributing factors. This improvement is reflected mainly in tables 8 and 12. In 2014 a system change made it possible for more than one factor to be captured for each vehicle. Table 12 now counts all contributing factors so slight increases in the number of crashes with factors recorded are expected.
In 2011 the NSW Police Force improved their data export procedures to ensure a more consistent supply of crash data, with a resultant improvement in the identification of injuries from reported crashes.
Pedal cycle crashes It is recognised that a substantial proportion of non-fatal pedal cycle crashes are not reported to police. As the NSW Police Force is the only source of crash notification used in this statement, statistics relating to pedal cycle crashes may not accurately reflect the situation.
Zero alcohol limit The Road Transport (Safety and Traffic Management) Act 1999, prescribes a zero alcohol limit in NSW for novice licence holders commencing 3 May 2004. The zero alcohol limit means learner, provisional P1 and provisional P2 licence holders may not consume any alcohol before driving. Relevant tables in this statement incorporate the zero alcohol limit (novice range prescribed concentration of alcohol (PCA) and special range PCA offences).
Local Government Areas The Local Government Areas used in this statement represent the boundaries in force in 2014. These boundaries differ from those represented in versions of this publication prior to 2013.
Speed criteria change Commencing 1 January 2010 the criteria for determining whether a crash can be considered to have involved speeding was improved to assess whether or not the vehicle was travelling in excess of that permitted, based on licence class or vehicle weight. Refer to Speeding on page 14
Road traffic crashes in New South Wales 2014 12
Definitions and explanatory notes Animal rider A person sitting on/riding a horse or other animal.
Articulated truck Comprised of articulated tanker, semi-trailer, low loader, road train and B-double.
Bicycle rider See Pedal cycle rider.
Bus Includes ‘State Transit Authority’ bus and long distance/tourist coach.
Car Includes sedan, station wagon, utility (based on car design), panel van (based on car design), coupe, hatchback, sports car, passenger van and four wheel drive passenger vehicle.
Carriageway That part of the road improved or designed and/or ordinarily used for vehicular movement. When a road has two or more of these portions, divided by a median strip or other physical separation, each of these is a separate carriageway.
Casualty Any person killed or injured as a result of a crash.
Controller A person occupying the controlling position of a road vehicle.
Crash Any apparently unpremeditated event reported to the police and resulting in death, injury or property damage attributable to the movement of a road vehicle on a road.
Driver A controller of a motor vehicle other than a motorcycle.
Emergency Includes ambulance, fire brigade vehicle, police patrol car (or van) and tow truck. Vehicle Fatal crash A crash for which there is at least one fatality.
Fatality A person who dies within 30 days of a crash as a result of injuries received in that crash.
Footpath That part of the road which is ordinarily reserved for pedestrian movement as a matter of right or custom.
Heavy truck Comprised of heavy rigid truck and articulated truck.
Heavy rigid truck Comprised of rigid lorry and rigid tanker with a tare weight in excess of 4.5 tonnes.
Injured A person who is injured as a result of a crash, and who does not die as a result of those injuries within 30 days of the crash.
Injury crash A non-fatal crash for which at least one person is injured.
Intersection crash A crash for which the first impact occurs at or within 10 metres of an intersection.
Killed See Fatality.
Light truck Includes panel van (not based on car design), utility (not based on car design) and mobile vending vehicle.
Motor vehicle Any road vehicle which is mechanically or electrically powered but not operated on rails.
Motorcycle Any mechanically or electrically propelled two or three-wheeled machine with or without side-car. Includes solo motorcycle, motorcycle with sidecar, motor scooter, mini-bike, three-wheeled special mobility vehicle and moped (motorised ‘pedal cycle’).
Motorcycle A person on but not controlling a motorcycle. passenger
Motorcycle rider A person occupying the controlling position of a motorcycle.
Newcastle Comprised of the following local government areas: Newcastle and Lake Macquarie. Metropolitan Area
Non-casualty A crash for which at least one vehicle is towed away but there is no fatality or person crash injured.
Passenger Any person, other than the controller, who is in, on, boarding, entering, alighting or falling from a road vehicle at the time of the crash, provided a portion of the person is in/on the road vehicle.
Road traffic crashes in New South Wales 2014 13
Pedal cycle Any two or three-wheeled device operated solely by pedals and propelled by human power except toy vehicles or other pedestrian conveyances. Includes bicycles with side-car, trailer or training wheels attached.
Pedal cycle A person on but not controlling a pedal cycle. passenger Pedal cycle rider A person occupying the controlling position of a pedal cycle.
Pedestrian Any person who is not in, on, boarding, entering, alighting or falling from a road vehicle at the time of the crash.
Pedestrian Any device, ordinarily operated on the footpath, by which a pedestrian may move, or by Conveyance which a pedestrian may move another pedestrian or goods. Includes non-motorised
scooter, pedal car, skateboard, roller skates, in-line skates, toy tricycle, unicycle, push cart, sled, trolley, non-motorised go-cart, billycart, pram, wheelbarrow, handbarrow, non-motorised wheelchair or any other toy device used as a means of mobility.
Road The area devoted to public travel within a surveyed road reserve. Includes a footpath and
cycle path inside the road reserve and a median strip or traffic island.
Road vehicle Any device (except pedestrian conveyance) upon which or by which any person or property may be transported or drawn on a road.
Sydney Metropolitan Area Comprised of the following local government areas: City of Sydney, Ashfield, Auburn,
Bankstown, Blacktown, Botany Bay, Burwood, Camden, Campbelltown, Canada Bay, Canterbury, Fairfield, Holroyd, Hornsby, Hunters Hill, Hurstville, Kogarah, Ku-ring-gai, Lane Cove, Leichhardt, Liverpool, Manly, Marrickville, Mosman, North Sydney, Parramatta, Penrith, Pittwater, Randwick, Rockdale, Ryde, Strathfield, Sutherland, The Hills, Warringah, Waverley, Willoughby and Woollahra.
Wollongong Metropolitan Area Comprised of the following local government areas: Wollongong and Shellharbour.
Road traffic crashes in New South Wales 2014 14
Criteria for determining speeding and fatigue involvement
Speeding The identification of speeding (excessive speed for the prevailing conditions) as a contributing factor in road crashes cannot always be determined directly from police reports of those crashes. Certain circumstances, however, suggest the involvement of speeding. The Centre for Road Safety has therefore drawn up criteria for determining whether or not a crash is to be considered as having involved speeding as a contributing factor.
Speeding is considered to have been a contributing factor to a road crash if that crash involved at least one speeding motor vehicle.
A motor vehicle is assessed as having been speeding if it satisfies the conditions described below under (a) or (b) or both.
(a) The vehicle’s controller (driver or rider) was charged with a speeding offence; or
the vehicle was described by police as travelling at excessive speed; or
the stated speed of the vehicle was in excess of that permitted for the vehicle controller’s licence class or the vehicle weight (introduced 1 January 2010); or
the stated speed of the vehicle was in excess of the speed limit.
(b) The vehicle was performing a manoeuvre characteristic of excessive speed, that is:
while on a curve the vehicle jack-knifed, skidded, slid or the controller lost control; or
the vehicle ran off the road while negotiating a bend or turning a corner and the controller was not distracted by something or disadvantaged by drowsiness or sudden illness and was not swerving to avoid another vehicle, animal or object and the vehicle did not suffer equipment failure.
Fatigue The identification of fatigue as a contributing factor in road crashes similarly cannot always be determined directly from police reports of those crashes and the following criteria are used to assess its involvement. Fatigue is considered to have been involved as a contributing factor to a road crash if that crash involved at least one fatigued motor vehicle controller.
A motor vehicle controller is assessed as having been fatigued if the conditions described under (c) or (d) are satisfied together or separately.
(c) The vehicle’s controller was described by police as being asleep, drowsy or fatigued.
(d) The vehicle performed a manoeuvre which suggested loss of concentration of the controller due to fatigue, that is
the vehicle travelled onto the incorrect side of a straight road and was involved in a head-on collision (and was not overtaking another vehicle and no other relevant factor was identified); or
the vehicle ran off a straight road or off the road to the outside of a curve and the vehicle was not directly identified as travelling at excessive speed and there was no other relevant factor identified for the manoeuvre.
Crash and casualty trends
— Historical data
— Fatality rates
— Interstate and international comparisons
— Causes of death
Road traffic crashes in New South Wales 2014 16
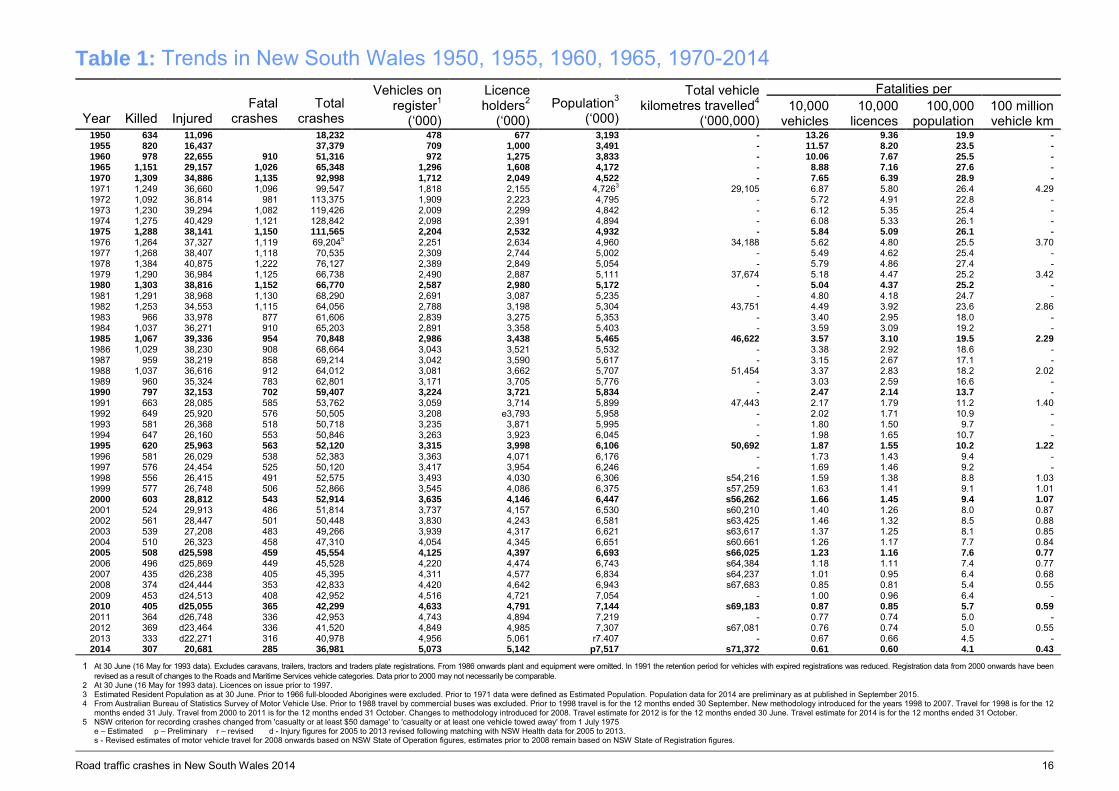
Table 1: Trends in New South Wales 1950, 1955, 1960, 1965, 1970-2014
Year Killed Injured Fatal
crashes Total
crashes
Vehicles on register1
(‘000)
Licence holders2
(‘000) Population3
(‘000)
Total vehicle kilometres travelled4
(‘000,000)
Fatalities per 10,000
vehicles 10,000
licences 100,000
population 100 million vehicle km
1950 634 11,096 18,232 478 677 3,193 - 13.26 9.36 19.9 - 1955 820 16,437 37,379 709 1,000 3,491 - 11.57 8.20 23.5 - 1960 978 22,655 910 51,316 972 1,275 3,833 - 10.06 7.67 25.5 - 1965 1,151 29,157 1,026 65,348 1,296 1,608 4,172 - 8.88 7.16 27.6 - 1970 1,309 34,886 1,135 92,998 1,712 2,049 4,522 - 7.65 6.39 28.9 - 1971 1,249 36,660 1,096 99,547 1,818 2,155 4,7263 29,105 6.87 5.80 26.4 4.29 1972 1,092 36,814 981 113,375 1,909 2,223 4,795 - 5.72 4.91 22.8 - 1973 1,230 39,294 1,082 119,426 2,009 2,299 4,842 - 6.12 5.35 25.4 - 1974 1,275 40,429 1,121 128,842 2,098 2,391 4,894 - 6.08 5.33 26.1 - 1975 1,288 38,141 1,150 111,565 2,204 2,532 4,932 - 5.84 5.09 26.1 - 1976 1,264 37,327 1,119 69,2045 2,251 2,634 4,960 34,188 5.62 4.80 25.5 3.70 1977 1,268 38,407 1,118 70,535 2,309 2,744 5,002 - 5.49 4.62 25.4 - 1978 1,384 40,875 1,222 76,127 2,389 2,849 5,054 - 5.79 4.86 27.4 - 1979 1,290 36,984 1,125 66,738 2,490 2,887 5,111 37,674 5.18 4.47 25.2 3.42 1980 1,303 38,816 1,152 66,770 2,587 2,980 5,172 - 5.04 4.37 25.2 - 1981 1,291 38,968 1,130 68,290 2,691 3,087 5,235 - 4.80 4.18 24.7 - 1982 1,253 34,553 1,115 64,056 2,788 3,198 5,304 43,751 4.49 3.92 23.6 2.86 1983 966 33,978 877 61,606 2,839 3,275 5,353 - 3.40 2.95 18.0 - 1984 1,037 36,271 910 65,203 2,891 3,358 5,403 - 3.59 3.09 19.2 - 1985 1,067 39,336 954 70,848 2,986 3,438 5,465 46,622 3.57 3.10 19.5 2.29 1986 1,029 38,230 908 68,664 3,043 3,521 5,532 - 3.38 2.92 18.6 - 1987 959 38,219 858 69,214 3,042 3,590 5,617 - 3.15 2.67 17.1 - 1988 1,037 36,616 912 64,012 3,081 3,662 5,707 51,454 3.37 2.83 18.2 2.02 1989 960 35,324 783 62,801 3,171 3,705 5,776 - 3.03 2.59 16.6 - 1990 797 32,153 702 59,407 3,224 3,721 5,834 - 2.47 2.14 13.7 - 1991 663 28,085 585 53,762 3,059 3,714 5,899 47,443 2.17 1.79 11.2 1.40 1992 649 25,920 576 50,505 3,208 e3,793 5,958 - 2.02 1.71 10.9 - 1993 581 26,368 518 50,718 3,235 3,871 5,995 - 1.80 1.50 9.7 - 1994 647 26,160 553 50,846 3,263 3,923 6,045 - 1.98 1.65 10.7 - 1995 620 25,963 563 52,120 3,315 3,998 6,106 50,692 1.87 1.55 10.2 1.22 1996 581 26,029 538 52,383 3,363 4,071 6,176 - 1.73 1.43 9.4 - 1997 576 24,454 525 50,120 3,417 3,954 6,246 - 1.69 1.46 9.2 - 1998 556 26,415 491 52,575 3,493 4,030 6,306 s54,216 1.59 1.38 8.8 1.03 1999 577 26,748 506 52,866 3,545 4,086 6,375 s57,259 1.63 1.41 9.1 1.01 2000 603 28,812 543 52,914 3,635 4,146 6,447 s56,262 1.66 1.45 9.4 1.07 2001 524 29,913 486 51,814 3,737 4,157 6,530 s60,210 1.40 1.26 8.0 0.87 2002 561 28,447 501 50,448 3,830 4,243 6,581 s63,425 1.46 1.32 8.5 0.88 2003 539 27,208 483 49,266 3,939 4,317 6,621 s63,617 1.37 1.25 8.1 0.85 2004 510 26,323 458 47,310 4,054 4,345 6,651 s60.661 1.26 1.17 7.7 0.84 2005 508 d25,598 459 45,554 4,125 4,397 6,693 s66,025 1.23 1.16 7.6 0.77 2006 496 d25,869 449 45,528 4,220 4,474 6,743 s64,384 1.18 1.11 7.4 0.77 2007 435 d26,238 405 45,395 4,311 4,577 6,834 s64,237 1.01 0.95 6.4 0.68 2008 374 d24,444 353 42,833 4,420 4,642 6,943 s67,683 0.85 0.81 5.4 0.55 2009 453 d24,513 408 42,952 4,516 4,721 7,054 - 1.00 0.96 6.4 - 2010 405 d25,055 365 42,299 4,633 4,791 7,144 s69,183 0.87 0.85 5.7 0.59 2011 364 d26,748 336 42,953 4,743 4,894 7,219 - 0.77 0.74 5.0 - 2012 369 d23,464 336 41,520 4,849 4,985 7,307 s67,081 0.76 0.74 5.0 0.55 2013 333 d22,271 316 40,978 4,956 5,061 r7.407 - 0.67 0.66 4.5 - 2014 307 20,681 285 36,981 5,073 5,142 p7,517 s71,372 0.61 0.60 4.1 0.43
1 At 30 June (16 May for 1993 data). Excludes caravans, trailers, tractors and traders plate registrations. From 1986 onwards plant and equipment were omitted. In 1991 the retention period for vehicles with expired registrations was reduced. Registration data from 2000 onwards have been revised as a result of changes to the Roads and Maritime Services vehicle categories. Data prior to 2000 may not necessarily be comparable.
2 At 30 June (16 May for 1993 data). Licences on issue prior to 1997. 3 Estimated Resident Population as at 30 June. Prior to 1966 full-blooded Aborigines were excluded. Prior to 1971 data were defined as Estimated Population. Population data for 2014 are preliminary as at published in September 2015. 4 From Australian Bureau of Statistics Survey of Motor Vehicle Use. Prior to 1988 travel by commercial buses was excluded. Prior to 1998 travel is for the 12 months ended 30 September. New methodology introduced for the years 1998 to 2007. Travel for 1998 is for the 12
months ended 31 July. Travel from 2000 to 2011 is for the 12 months ended 31 October. Changes to methodology introduced for 2008. Travel estimate for 2012 is for the 12 months ended 30 June. Travel estimate for 2014 is for the 12 months ended 31 October.
5 NSW criterion for recording crashes changed from 'casualty or at least $50 damage' to 'casualty or at least one vehicle towed away' from 1 July 1975 e – Estimated p – Preliminary r – revised d - Injury figures for 2005 to 2013 revised following matching with NSW Health data for 2005 to 2013.
s - Revised estimates of motor vehicle travel for 2008 onwards based on NSW State of Operation figures, estimates prior to 2008 remain based on NSW State of Registration figures.
Road traffic crashes in New South Wales 2014 17
Figure 1: Fatality rate per 10,000 vehicles, 10,000 licence holders and 100,000 population for years 1950 to 2014 in NSW
Note: Fatality rate is expressed as the number of persons killed in road crashes per 10,000 vehicles on register, per 10,000 licence holders (licences on issue prior to 1997) and per 100,000 population.
0
5
10
15
20
25
30
1950 1955 1960 1965 1970 1975 1980 1985 1990 1995 2000 2005 2010 2015
Rate per 10,000 licencesRate per 10,000 vehiclesRate per 100,000 population
Road traffic crashes in New South Wales 2014 18
Table 2: Comparison with other Australian States1 and other countries2
Killed Vehicles3
('000) Population
4 ('000)
Fatalities per 10,000
vehicles
Fatalities per 100,000 population
NEW SOUTH WALES 307 5,073 7,517 0.6 4.1
Victoria 249 4,483 5,839 0.6 4.3
Queensland 223 3,705 4,721 0.6 4.7
Western Australia 183 2,142 2,561 0.9 7.1
South Australia 107 1,326 1,685 0.8 6.3
Tasmania 35 443 515 0.8 6.8
Australian Capital Territory 10 279 385 0.4 2.6
Northern Territory 39 152 244 2.6 16.0
AUSTRALIA 1,153 17,604 23,470 0.7 4.9
CANADA 1,923(13) 23,006(13) 35,154(13) 0.8 5.5
DENMARK 183 2,957(13) 5,627 0.6 3.3
FRANCE 3,384 41,204(13) 65,857 0.8 5.1
GERMANY 3,368 52,391(13) 80,780 0.6 4.2
JAPAN 4,838 83,666(13) 127,083 0.6 3.8
NETHERLANDS 570 9,612(13) 16,829 0.6 3.4
NEW ZEALAND 295 3,398 4,510 0.9 6.5
NORWAY 147 3,571(13) 5,109 0.4 2.9
SWEDEN 270 5,708(13) 9,665 0.5 2.8
UNITED KINGDOM 1,854 35,321(13) 64,597 0.5 2.9
UNITED STATES OF AMERICA 32,675 269,294(13) 318,857 1.2 10.2
1 Australian fatality data (except for New South Wales) for 2014 based on the Bureau of Infrastructure, Transport and Regional Economics fatality database as at 25 October 2015.
2 Fatality data are for 2014 for most other countries and are based on Reported Road Casualties Great Britain Annual Report 2014 or the relevant National Statistical Reporting Authorities. Some fatality data for 2014 were not available and so 2013 data have been included.
3 Australian figures (except for New South Wales) are as at 31 January 2014 and are from the Australian Bureau of Statistics Motor Vehicle Census Australia. These figures may not agree with registration statistics for individual States and Territories. Data for New South Wales are from Roads and Maritime Services and are as at 30 June 2014. International figures are sourced from International Road Traffic and Accident Database (OECD) or the relevant National Statistical Reporting Authorities.
4 Australian population estimates are from the Australian Bureau of Statistics Australian Demographic Statistics for 30 June 2014 as published for March 2015. Canada population estimates are for 1 July from Statistics Canada. European population estimates are for 1 January 2014 from Eurostat. Japanese population estimate for 1 October from the Statistical Handbook of Japan 2014. New Zealand population estimate for 30 June from Ministry of Transport New Zealand. United Kingdom population estimate for for 30 June 2014 is based on published data from the UK Office of National Statistics, Mid Year Population Estimates. United States population estimate for 1 July 2014 is based on published data from United States Census Bureau, Population Division.
13 Data for 2013.
Road traffic crashes in New South Wales 2014 19
Table 3: Deaths within NSW, causes of death, sex, age for 2013
2013 Age (years)
TOTAL3 0-14 15-19 20-24 25-29 30-39 40-49 50-59 60-69 ≥70
Males
Deaths from all causes1 276 88 137 158 442 879 2,029 3,766 17,854 25,632
All accidental deaths1 26 34 57 56 122 143 123 110 363 1,034 Road deaths2 5 19 33 19 35 37 33 28 34 243
as % of accidental deaths 19 56 58 34 29 26 27 25 9 24 as % of all deaths 2 22 24 12 8 4 2 1 <1 1
Females Deaths from all causes1
225 48 64 71 242 536 1,139 2,252 19,736 24,317 All accidental deaths1 18 10 17 14 34 40 52 41 446 673 Road deaths2 5 9 10 10 8 6 11 11 20 90
as % of accidental deaths 28 90 59 71 24 15 21 27 4 13 as % of all deaths 2 19 16 14 3 1 1 1 <1 <1
All persons Deaths from all causes1
501 136 201 229 684 1,415 3,168 6,018 37,590 49,949 All accidental deaths1
44 44 74 70 156 183 175 151 809 1,707 Road deaths2 10 28 43 29 43 43 44 39 54 333
as % of accidental deaths 23 64 58 41 28 23 25 26 7 20 as % of all deaths 2 21 21 13 6 3 1 1 <1 1
Note 1 Underlying Cause of Death Data supplied by Australian Bureau of Statistics. Deaths registered in NSW and cause of death based on ICD Codes – Deaths from all causes (A00 - Y99) and All accidental deaths (V01 - X59). 2 Transport for NSW Crash Data. 3 Includes several deaths where age unknown.
Road traffic crashes in New South Wales 2014 20
Table 4: Fatalities, year, month
Year Month
TOTAL Jan Feb Mar Apr May Jun Jul Aug Sep Oct Nov Dec 1950 51 36 54 59 50 57 63 46 51 46 68 53 634 1951 53 40 72 64 66 77 55 59 63 68 50 61 728 1952 58 58 65 82 70 52 50 49 51 52 50 63 700 1953 54 51 59 63 61 60 60 68 61 64 35 68 704 1954 51 70 56 76 65 54 62 73 67 73 47 60 754 1955 79 57 70 90 64 56 66 65 48 73 72 80 820 1956 56 60 80 66 71 71 62 57 70 64 65 79 801 1957 52 53 63 61 82 66 60 76 53 48 76 75 765 1958 70 54 70 60 86 67 76 64 66 63 64 84 824 1959 79 34 63 66 80 94 75 78 66 66 79 79 859 1960 79 82 73 94 81 87 110 89 62 79 59 83 978 1961 63 55 83 70 79 102 92 79 93 52 63 87 918 1962 72 58 72 62 91 66 88 75 74 67 58 93 876 1963 70 46 79 73 86 85 78 93 72 81 43 94 900 1964 78 76 93 83 111 72 78 87 84 88 71 89 1,010 1965 79 89 94 101 96 129 99 71 83 112 88 110 1,151 1966 98 66 88 126 99 94 96 73 71 117 95 120 1,143 1967 87 79 94 82 93 89 106 100 94 98 92 103 1,117 1968 90 104 103 72 102 110 102 96 100 100 105 127 1,211 1969 86 77 80 119 103 111 107 103 91 97 98 116 1,188 1970 105 89 118 136 116 91 92 115 94 129 107 117 1,309 1971 85 93 99 101 124 108 109 118 102 115 92 103 1,249 1972 73 59 86 94 112 74 85 114 95 94 90 116 1,092 1973 98 85 88 113 107 96 88 112 126 80 107 130 1,230 1974 103 95 101 94 108 113 93 113 112 105 105 133 1,275 1975 106 111 115 94 116 108 88 111 121 100 109 109 1,288 1976 92 76 95 113 126 102 99 106 129 116 98 112 1,264 1977 92 106 109 121 104 87 98 111 89 121 109 121 1,268 1978 114 95 126 101 122 129 128 123 113 104 104 125 1,384 1979 73 75 134 121 120 92 108 109 122 107 103 126 1,290 1980 99 62 97 128 112 103 134 128 92 118 124 106 1,303 1981 112 93 85 125 107 85 112 94 104 116 124 134 1,291 1982 134 113 90 119 101 96 104 106 98 101 107 84 1,253 1983 70 57 91 91 79 79 81 79 86 77 83 93 966 1984 89 76 103 71 96 90 56 91 85 75 97 108 1,037 1985 74 85 77 84 92 71 82 81 97 98 94 132 1,067 1986 89 85 100 74 107 76 76 74 81 101 77 89 1,029 1987 86 58 82 84 69 83 77 63 84 112 74 87 959 1988 89 75 97 75 81 74 85 79 92 107 84 99 1,037 1989 56 82 82 45 77 97 75 64 93 96 69 124 960 1990 52 52 87 57 59 70 83 66 80 62 55 74 797 1991 61 47 52 59 55 52 61 55 59 57 49 56 663 1992 55 56 56 47 41 59 53 65 50 62 55 50 649 1993 44 31 56 51 37 42 42 59 42 59 55 63 581 1994 56 41 65 54 51 42 52 38 43 73 69 63 647 1995 38 50 61 46 48 57 51 53 41 60 59 56 620 1996 23 49 49 62 48 56 50 52 43 52 47 50 581 1997 69 44 39 42 58 38 53 47 35 47 62 42 576 1998 47 39 61 43 58 51 36 51 37 47 31 55 556 1999 52 41 61 47 60 40 39 44 52 43 48 50 577 2000 50 52 48 55 53 48 58 33 50 39 49 68 603 2001 38 39 42 42 56 35 44 51 35 46 46 50 524 2002 39 45 50 46 56 57 35 51 50 45 43 44 561 2003 42 40 49 47 42 32 35 51 40 57 52 52 539 2004 52 44 48 34 39 41 44 43 35 43 47 40 510 2005 35 38 37 45 56 40 50 40 44 40 37 46 508 2006 57 39 54 49 37 43 34 34 33 42 38 36 496 2007 34 30 42 47 31 41 41 30 32 33 37 37 435 2008 28 29 29 26 24 30 34 35 33 39 31 36 374 2009 26 34 39 55 36 34 27 49 42 45 30 36 453 2010 43 34 26 43 37 33 23 27 37 39 38 25 405 2011 28 30 31 25 25 27 29 38 29 23 39 40 364 2012 32 25 33 33 31 34 24 36 30 28 35 28 369 2013 15 33 30 26 24 32 26 33 15 37 34 28 333
2014 34 29 26 20 30 25 19 27 24 26 29 18 307
Road traffic crashes in New South Wales 2014 21
Table 5: Casualties, year, road user class, degree of casualty1
Year
Road user class
Vehicle occupant Motorcyclist
Driver Passenger Rider Passenger
K I K I K I K I 1960 273 7,029 248 8,801 39 1,409 9 241 1961 272 7,360 252 8,475 41 1,159 4 151 1962 263 7,603 241 8,260 45 952 4 116 1963 282 8,835 262 9,826 18 877 4 111 1964 330 9,860 280 10,778 26 861 7 110 1965 411 11,225 373 11,714 28 901 4 95 1966 428 11,183 321 11,642 32 1,020 2 112 1967 405 11,609 301 11,406 54 1,337 4 122 1968 455 11,908 358 11,786 62 1,899 6 184 1969 436 12,515 358 12,053 75 2,562 4 266 1970 494 13,710 387 12,719 93 2,967 17 311 1971 465 14,671 395 12,620 106 3,783 16 437 1972 370 14,392 331 12,271 98 4,292 17 443 1973 426 15,754 358 12,904 130 4,852 22 533 1974 436 16,156 361 12,974 140 5,181 16 617 1975 475 14,469 368 13,384 142 4,483 19 609 1976 455 14,131 370 13,154 135 4,239 25 551 1977 489 14,744 347 13,619 125 4,055 15 508 1978 537 16,339 396 14,700 137 3,731 10 498 1979 515 14,821 362 12,623 127 3,783 22 506 1980 487 15,390 359 12,940 152 4,366 21 610 1981 504 15,538 325 12,883 146 4,643 26 655 1982 453 13,258 322 11,087 178 4,387 25 631 1983 339 12,684 232 10,381 143 4,817 10 590 1984 374 14,001 275 10,753 135 5,181 18 571 1985 412 15,861 264 11,779 122 5,220 21 573 1986 393 15,964 262 11,591 146 4,364 18 560 1987 356 16,117 262 11,447 119 4,053 19 455 1988 403 15,795 270 10,685 111 3,609 12 388 1989 356 15,627 303 10,535 98 3,064 11 307 1990 310 14,469 200 9,082 84 2,537 6 240 1991 304 12,563 172 8,160 54 2,220 4 212 1992 287 11,883 176 7,490 55 1,936 4 194 1993 274 12,197 135 7,577 41 1,884 5 164 1994 258 12,388 181 7,127 50 1,897 6 193 1995 281 12,228 139 7,375 57 1,848 2 174 1996 234 12,280 146 7,174 52 1,808 6 166 1997 263 11,705 137 6,713 43 1,707 1 142 1998 247 12,653 148 7,344 49 1,879 3 163 1999 263 13,348 139 7,289 51 1,770 4 149 2000 278 15,270 146 7,308 60 1,894 2 138 2001 219 16,270 133 7,468 68 2,007 2 151 2002 276 15,553 123 6,856 51 1,994 4 141 2003 239 15,125 137 6,549 56 1,826 3 110 2004 229 14,749 122 6,051 57 1,963 1 123 2005 235 14,273 100 5,808 61 1,978 3 123 2006 249 14,644 102 5,589 65 2,218 1 112 2007 215 14,941 77 5,728 57 2,151 4 130 2008 194 13,827 67 4,981 52 2,334 3 125 2009 210 13,861 102 4,931 66 2,512 3 120 2010 185 14,518 89 5,103 57 2,379 4 105 2011 181 15,724 73 5,602 47 2,462 4 100 2012 164 13,650 82 4,380 60 2,600 1 113 2013 155 12,841 49 4,120 67 2,507 4 123 2014 153 11,841 43 3,810 58 2,444 1 105
1 K – Killed I – Injured
Road traffic crashes in New South Wales 2014 22
Table 5: Casualties, year, road user class, degree of casualty1
Road user class Year Pedestrian Pedal cyclist2 Other3 All road users
K I K I K I K I 1960 367 4,022 42 1,128 0 25 978 22,655 1961 319 3,627 30 1,039 0 28 918 21,839 1962 296 3,548 24 961 3 28 876 21,468 1963 310 4,000 24 967 0 36 900 24,652 1964 328 4,012 38 974 1 36 1,010 26,631 1965 301 4,254 29 942 5 26 1,151 29,157 1966 341 4,111 16 869 3 44 1,143 28,981 1967 329 4,155 23 837 1 35 1,117 29,501 1968 292 4,175 37 935 1 32 1,211 30,919 1969 294 4,469 19 868 2 19 1,188 32,752 1970 291 4,346 26 792 1 41 1,309 34,886 1971 250 4,292 16 820 1 37 1,249 36,660 1972 256 4,586 19 788 1 42 1,092 36,814 1973 271 4,563 21 648 2 40 1,230 39,294 1974 296 4,719 25 738 1 44 1,275 40,429 1975 257 4,370 22 766 5 60 1,288 38,141 1976 259 4,335 19 857 1 60 1,264 37,327 1977 266 4,349 23 1,089 3 43 1,268 38,407 1978 281 4,571 22 1,020 1 16 1,384 40,875 1979 230 4,120 32 1,115 2 16 1,290 36,984 1980 252 4,161 31 1,326 1 23 1,303 38,816 1981 267 3,953 22 1,272 1 24 1,291 38,968 1982 256 3,788 19 1,390 0 12 1,253 34,553 1983 212 3,963 29 1,522 1 21 966 33,978 1984 211 4,116 23 1,624 1 25 1,037 36,271 1985 223 4,210 23 1,682 2 11 1,067 39,336 1986 191 3,989 19 1,747 0 15 1,029 38,230 1987 178 4,255 22 1,870 3 22 959 38,219 1988 205 4,177 34 1,949 2 13 1,037 36,616 1989 173 3,980 19 1,800 0 11 960 35,324 1990 177 3,944 20 1,860 0 21 797 32,153 1991 119 3,431 10 1,468 0 31 663 28,085 1992 121 3,104 6 1,300 0 13 649 25,920 1993 117 3,091 8 1,443 1 12 581 26,368 1994 129 3,220 23 1,320 0 15 647 26,160 1995 130 3,154 11 1,170 0 14 620 25,963 1996 130 3,234 13 1,346 0 21 581 26,029 1997 114 2,985 18 1,194 0 8 576 24,454 1998 102 3,150 7 1,223 0 3 556 26,415 1999 108 3,024 12 1,164 0 4 577 26,748 2000 110 2,979 6 1,218 1 5 603 28,812 2001 88 2,861 13 1,142 1 14 524 29,913 2002 94 2,607 13 1,292 0 4 561 28,447 2003 94 2,490 9 1,107 1 1 539 27,208 2004 85 2,301 16 1,116 0 20 510 26,323 2005 96 2,221 13 1,188 0 7 508 25,598 2006 72 2,126 7 1,179 0 1 496 25,869 2007 68 2,122 14 1,163 0 3 435 26,238 2008 49 2,087 8 1,090 1 0 374 24,444 2009 59 1,933 13 1,155 0 1 453 24,513 2010 59 1,872 11 1,077 0 1 405 25,055 2011 49 1,862 10 995 0 3 364 26,748 2012 55 1,696 7 1,025 0 0 369 23,464 2013 44 1,661 14 1,017 0 2 333 22,271 2014 41 1,554 11 923 0 4 307 20,681 1 K – Killed I – Injured. 2 Includes pedal cycle passengers. 3 Includes unknowns, animal riders and occupants of vehicles such as animal drawn vehicles and trains.
Road crashes in 2014
— Time distribution
— Crash types
— Motor vehicle types
— Factors in crashes
— Controllers in crashes
— Location and distribution of crashes
Road traffic crashes in New South Wales 2014 24
Table 6: Crashes, casualties, holiday periods, degree of crash, degree of casualty
Period
Degree of crash1 Degree of casualty2
F I C N Total
crashes K I Total killed
& injured
New Year (1 January) (1 day) 0 22 43 65 0 36 36 Australia Day (24 January to 27 January) (4 days) 3 159 199 361 3 234 237 Easter (17 April to 21 April) (5 days) 2 196 243 441 2 261 263 Anzac Day (24 April to 27 April) (4 days) 3 177 183 363 4 232 236 Queen’s Birthday (6 June to 9 June) (4 days) 3 170 227 400 3 222 225 Labour Day (3 October to 6 October) (4 days) 2 161 193 356 2 217 219 Christmas (24 December to 31 December) (8 days) 5 266 220 491 6 344 350
SCHOOL HOLIDAYS January (1 January to 27 January) (27 days) 30 1,108 1,303 2,441 30 1,481 1,511 End Term 1 (12 April to 27 April) (16 days) 9 690 824 1,523 10 893 903 End Term 2 (28 June to 13 July) (16 days) 12 765 999 1,776 13 998 1,011 End Term 3 (20 September to 6 October) (17 days) 8 727 832 1,567 9 948 957 December (20 December to 31 December) (12 days) 7 436 357 800 8 565 573
1 F – Fatal crash; I C – Injury crash; N – Non-casualty crash. 2 K – Killed; I – Injured.
Road traffic crashes in New South Wales 2014 25
Table 7a: Fatal crashes, time period, day of week Day of week
Time period1 Sunday Monday Tuesday Wednesday Thursday Friday Saturday Total
00:01 - 01:59 4 0 1 2 4 3 2 16
02:00 - 03:59 4 0 0 0 1 1 2 8
04:00 - 05:59 0 1 1 1 0 4 3 10
06:00 - 07:59 5 1 3 1 5 3 5 23
08:00 - 09:59 0 3 1 6 4 3 5 22
10:00 - 11:59 7 6 0 2 4 2 5 26
12:00 - 13:59 2 6 3 7 4 5 8 35
14:00 - 15:59 7 6 3 12 3 4 9 44
16:00 - 17:59 5 5 8 5 7 6 3 39
18:00 - 19:59 5 4 2 4 4 6 5 30
20:00 - 21:59 2 3 3 0 6 0 1 15
22:00 - Midnight 1 3 2 3 1 5 2 17
Unknown 0 0 0 0 0 0 0 0
CRASHES:
TOTAL 42 38 27 43 43 42 50 285
1 In the case of a fatal crash reported with an unknown time, a time period is estimated.
Table 7b: Total crashes, time period, day of week
Day of week
Time period Sunday Monday Tuesday Wednesday Thursday Friday Saturday Total
00:01 - 01:59 242 88 100 100 115 125 265 1,035
02:00 - 03:59 187 53 74 76 72 99 174 735
04:00 - 05:59 143 144 132 137 148 124 153 981
06:00 - 07:59 187 457 517 500 486 437 265 2,849
08:00 - 09:59 320 681 734 726 727 667 463 4,318
10:00 - 11:59 549 512 522 516 548 579 723 3,949
12:00 - 13:59 607 555 538 544 580 676 747 4,247
14:00 - 15:59 625 747 752 766 827 861 688 5,266
16:00 - 17:59 528 774 899 898 933 935 655 5,622
18:00 - 19:59 415 477 530 597 574 667 544 3,804
20:00 - 21:59 283 293 315 313 416 377 387 2,384
22:00 - Midnight 192 190 204 247 266 338 352 1,789
Unknown 0 0 1 0 1 0 0 2
CRASHES:
TOTAL 4,278 4,971 5,318 5,420 5,693 5,885 5,416 36,981
Road traffic crashes in New South Wales 2014 26
Table 7c: Crashes, time period, degree of crash Degree of crash
Time period1 Fatal crash Injury crash Non-casualty crash Total crashes
A 30 (0.6%) 2,281 (43.4%) 2,950 (56.1%) 5,261 (100.0%)
B 17 (1.4%) 530 (42.5%) 701 (56.2%) 1,248 (100.0%)
C 56 (0.6%) 4,066 (46.7%) 4,576 (52.6%) 8,698 (100.0%)
D 18 (0.9%) 942 (45.6%) 1,106 (53.5%) 2,066 (100.0%)
E 12 (0.7%) 827 (50.2%) 810 (49.1%) 1,649 (100.0%)
F 47 (0.8%) 2,671 (44.4%) 3,297 (54.8%) 6,015 (100.0%)
G 30 (0.7%) 2,006 (44.5%) 2,473 (54.8%) 4,509 (100.0%)
H 29 (0.9%) 1,425 (44.8%) 1,726 (54.3%) 3,180 (100.0%)
I 19 (1.0%) 780 (39.9%) 1,154 (59.1%) 1,953 (100.0%)
J 27 (1.1%) 957 (39.9%) 1,416 (59.0%) 2,400 (100.0%)
Unknown 0 (0.0%) 2 (100.0%) 0 (0.0%) 2 (100.0%)
CRASHES:
TOTAL 285 (0.8%) 16,487 (44.6%) 20,209 (54.6%) 36,981 (100.0%)
1 Time periods A to J are as shown below. In the case of a fatal crash reported with an unknown time, a time period is estimated.
The above time periods were defined by A.J. McLean, O.T. Holubowycz and B.L. Sandow in their report Alcohol and Crashes: Identification of Relevant Factors in this Association, Department of Transport, Australia, 1980. The ten time periods, A to J, exhibit different characteristics of traffic conditions, driver/rider behaviour and trip purpose.
For example time period I is from 9 pm on Sunday, Monday, Tuesday and Wednesday nights to 3 am the following mornings.
Road traffic crashes in New South Wales 2014 27
(Number in each cell indicates number of crashes with a first impact of that type) Figure 2: Crashes, road user movement PEDESTRIANS
(ON FOOT OR IN TOY/PRAM)
VEHICLES FROM ADJACENT
DIRECTIONS (INTERSECTIONS ONLY)
VEHICLES FROM
OPPOSING DIRECTION
VEHICLES FROM SAME DIRECTION
MANOEUVRING OVERTAKING ON PATH OFF PATH, ON STRAIGHT
OFF PATH, ON CURVE OR TURNING
MISCELLANEOUS
Vehicles in same lane
NEAR SIDE 620 CROSS TRAFFIC 2,801 HEAD ON
(not overtaking) 1,171 REAR END 6,653 U TURN 593 HEAD ON (incl. side swipe) 23 PARKED 160
OFF CARRIAGEWAY TO LEFT 393
OFF CARRIAGEWAY TO LEFT ON RIGHT BEND 393 FELL IN/FROM
VEHICLE 59
OFF
EMERGING 122 RIGHT FAR 370 RIGHT THRU 3,047 LEFT REAR 221 U TURN INTO FIXED OBJECT PKD VEHICLE 93 OUT OF CONTROL 36 DOUBLE PARKED 0
LEFT OF CARRIAGEWAY INTO OBJECT/ PARKED VEH. 3,561
CARRIAGEWAY LEFT ON R.H. BEND INTO OBJECT / PKD VEH 1,729 LOAD OR MISSILE
STRUCK VEHICLE 23
FAR SIDE 431 LEFT FAR 97 LEFT THRU 4 RIGHT REAR 957 LEAVING PARKING 439 PULLING OUT 11 ACCIDENT OR
BREAK DOWN 108 OFF CARRIAGEWAY TO RIGHT 207
OFF CARRIAGEWAY TO RIGHT ON RIGHT BEND 131 STRUCK TRAIN /
AEROPLANE 0
Vehicles in parallel lanes
PLAYING, WORKING, LYING, STANDING ON CARRIAGEWAY 95 RIGHT NEAR 1,427 RIGHT/LEFT 18 LANE
SIDE SWIPE 372 ENTERING PARKING 41 OVERTAKE
TURNING 127 VEHICLE DOOR 160
RIGHT OFF CARRIAGEWAY INTO OBJECT/ PARKED VEH 1,417
OFF CARRIAGEWAY, RIGHT ON R.H. BEND INTO OBJECT / PKD VEH 596
PARKED VEH RUN AWAY INTO OBJECT / PKD VEH 85
WALKING WITH TRAFFIC 35 TWO R TURNING 66 RIGHT/RIGHT 8
LANE CHANGE RIGHT (not overtaking) 544
PARKING VEHICLES ONLY 78 CUTTING IN 13
PERMANENT OBSTRUCTION ON CARRIAGEWAY 13
OUT OF CONTROL ON CARRIAGEWAY 519
OFF CARRIAGEWAY TO RIGHT ON LEFT BAND 166
PARKED VEH RUN AWAY INTO VEHICLE 8
OFF CARRIAGEWAY
FACING TRAFFIC 18 RIGHT/LEFT FAR 25 LEFT/LEFT 0 LANE CHANGE LEFT 608 REVERSING 62 PULLING OUT
REAR END 13 TEMPORARY ROADWORKS 17
OFF END OF ROAD/ ‘T’ INTERSECTION 162
TO RIGHT ON L.H. BEND INTO OBJECT VEH 878
STRUCK WHILE BOARDING OR ALIGHTING VEHICLE 14
ON FOOTPATH/ MEDIAN 49 LEFT NEAR 277
RIGHT TURN SIDE SWIPE 196
REVERSING INTO FIXED OBJECT/ PKD VEHICLE 71
STRUCK OBJECT ON CARRIAGEWAY 114
OFF CARRIAGEWAY TO LEFT ON LEFT BEND 194
OFF
DRIVEWAY 56 LEFT/RIGHT FAR 2 LEFT TURN SIDE SWIPE 296
EMERGING FROM DRIVEWAY 789
ANIMAL (not ridden) 545
CARRIAGEWAY TO LEFT ON L.H. BEND INTO OBJ/PKD VEH 895
TWO LEFT TURNING 1 FROM FOOTPATH 124 OUT OF CONTROL ON CARRIAGEWAY 471 OTHER 2
OTHER PEDESTRIAN 37 OTHER ADJACENT 43 OTHER OPPOSING 58 OTHER SAME
DIRECTION 309 OTHER MANOEUVRING 211 OTHER
OVERTAKING 13 OTHER ON PATH 33 OTHER STRAIGHT 59 OTHER CURVE 27 UNKNOWN 71
Road traffic crashes in New South Wales 2014 28
Table 8: Crashes, object hit in first impact, degree of crash Degree of crash
Object hit in first impact Fatal crash
Injury crash
Non-casualty crash
Total crashes
Bridge/wall 2 40 68 110
Fence/post 14 767 1,331 2,112
Pole 13 413 444 870
Embankment 8 333 425 766
Tree 47 927 898 1,872
Street furniture 4 187 341 532
Drain or culvert 4 151 130 285
Building 0 38 62 100
Other object 6 225 367 598
Stock 1 39 134 174
Kangaroo/wallaby 0 95 190 285
Other animal 1 36 50 87
Unknown 0 0 5 5
Sub-total 100 3,251 4,445 7,796
No object hit 185 13,236 15,764 29,185
CRASHES: TOTAL 285 16,487 20,209 36,981
Table 9: Single motor vehicle crashes, vehicle type, degree of crash
Degree of crash
Vehicle type Fatal crash
Injury crash
Non-casualty crash
Total crashes
Car 70 2,786 4,389 7,245
Light truck 15 498 707 1,220
Heavy rigid truck 0 55 74 129
Articulated truck 4 112 120 236
Bus 0 12 14 26
Other motor vehicle 1 23 4 28
Motorcycle 25 1,051 60 1,136
SINGLE MOTOR CRASHES: TOTAL 115 4,537 5,368 10,020
Note: Vehicles hitting pedestrians are not included in this table.
Road traffic crashes in New South Wales 2014 29
Table 10: Crashes, casualties, type of crash, degree of crash, degree of casualty
Type of crash1
Degree of crash2 Degree of casualty3
F I C N Total crashes K I Total killed & injured
Car crash 197 (1%) 13,576 (42%) 18,841 (58%) 32,614 (100%) 214 17,328 17,542
Light truck crash 48 (1%) 2,822 (41%) 4,023 (58%) 6,893 (100%) 53 3,715 3,768
Heavy truck crash 48 (2%) 822 (39%) 1,244 (59%) 2,114 (100%) 51 1,091 1,142
Heavy rigid truck crash 21 (2%) 459 (39%) 705 (59%) 1,185 (100%) 21 601 622
Articulated truck crash 28 (3%) 384 (40%) 555 (57%) 967 (100%) 31 523 554
Bus crash 6 (1%) 221 (45%) 266 (54%) 493 (100%) 6 348 354
Emergency vehicle crash 1 (1%) 82 (42%) 112 (57%) 195 (100%) 1 119 120
Motorcycle crash 59 (2%) 2,487 (87%) 310 (11%) 2,856 (100%) 60 2,683 2,743
Pedal cycle crash 11 (1%) 929 (99%) 3 (0%) 943 (100%) 11 973 984
Pedestrian crash 42 (3%) 1,476 (97%) 4 (0%) 1,522 (100%) 43 1,620 1,663
All types of crashes 285 (1%) 16,487 (45%) 20,209 (55%) 36,981 (100%) 307 20,681 20,988
Note: Percentages of all crashes involving those traffic unit types are shown in brackets. 1 Crash categories listed are those involving at least one traffic unit of that type. 2 F – Fatal crash; I C – Injury crash; N – Non-casualty crash. 3 K – Killed; I – Injured. IMPORTANT: The 'Type of crash' categories in this table are not mutually exclusive and must therefore not be added together. For example, a crash involving both a car and a motorcycle will be included in both 'Car crash' and 'Motorcycle crash' categories.
Road traffic crashes in New South Wales 2014 30
Table 11: Motor vehicles involved and involvement rate1, vehicle type, degree of crash
Degree of crash
Vehicle type Fatal crash Injury crash Non-casualty crash All crashes
Passenger vehicle2 230 0.6 20,883 50.5 31,178 75.4 52,291 126.5 Rigid truck, van or utility 90 1.3 4,060 58.2 5,956 85.3 10,106 144.8 Articulated truck3 32 17.0 401 212.9 573 304.2 1,006 534.1 Bus 6 4.6 224 171.9 268 205.7 498 382.3 Motorcycle 61 2.9 2,522 121.0 313 15.0 2,896 138.9 All motor vehicles on register4 423 0.8 28,515 56.2 38,779 76.4 67,717 133.5 Note: Involvement rates are calculated using registration data in which the vehicle categories differ slightly from those used in the crash
database. As a result of a reclassification of types in the registration database, the involvement rates for the passenger vehicle and rigid truck, van or utility categories are not comparable with years prior to 2013.
1 Rates (shown in italics) are expressed as the number of vehicles involved in crashes per 10,000 registered vehicles of that type using registration data as at 30 June 2014.
2 Comprised of sedan, station wagon, hatchback, taxi-cab, passenger van and four wheel drive passenger vehicle. 3 Comprised of articulated tanker, semi-trailer, low loader, road train and B-double. 4 Includes other and unknown motor vehicle types.
Table 12: Crashes, factors, degree of crash Degree of crash
Factors possibly contributing to crash Fatal crash
Injury crash
Non-casualty crash
All crashes
Controller Disadvantaged
Chronic illness/physical infirmity 2 6 7 15
Sudden illness 14 453 196 663
Swerving to avoid animal 1 293 441 735
Distraction inside vehicle* 7 585 803 1,395
Distraction outside vehicle 17 1,828 1,968 3,813
Equipment failure/fault
Brakes 3 52 56 111
Steering 1 10 51 62
Tyres 6 122 178 306
Wheel, axle/suspension 0 7 17 24
Lights 5 3 6 14
Towing/coupling 1 9 13 23
Insecure load 0 17 26 43
IMPORTANT: The factor categories in this table are not mutually exclusive and must therefore not be added together. For example, a crash in which one driver suffered sudden illness and another vehicle's brakes failed would be counted once in each of the relevant categories. * Data under-reported due to difficulty in collection.
Road traffic crashes in New South Wales 2014 31
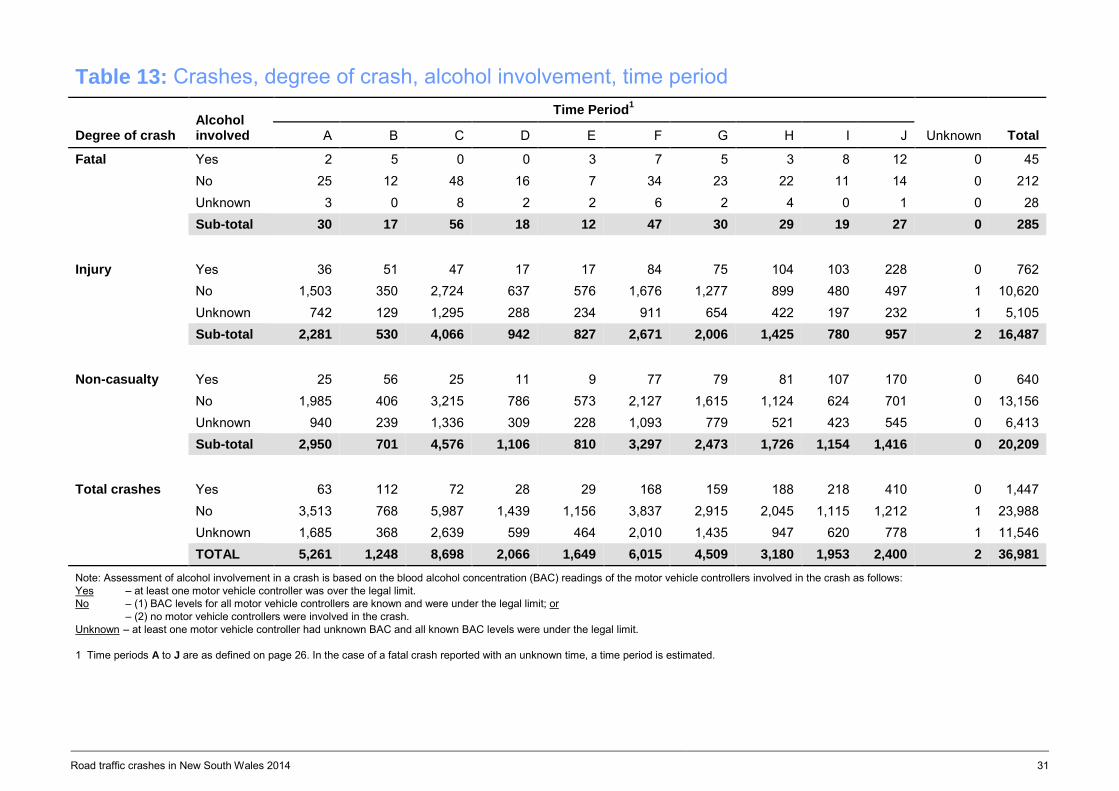
Table 13: Crashes, degree of crash, alcohol involvement, time period
Degree of crash Alcohol involved
Time Period1
Unknown Total A B C D E F G H I J
Fatal Yes 2 5 0 0 3 7 5 3 8 12 0 45 No 25 12 48 16 7 34 23 22 11 14 0 212 Unknown 3 0 8 2 2 6 2 4 0 1 0 28 Sub-total 30 17 56 18 12 47 30 29 19 27 0 285
Injury Yes 36 51 47 17 17 84 75 104 103 228 0 762 No 1,503 350 2,724 637 576 1,676 1,277 899 480 497 1 10,620 Unknown 742 129 1,295 288 234 911 654 422 197 232 1 5,105 Sub-total 2,281 530 4,066 942 827 2,671 2,006 1,425 780 957 2 16,487
Non-casualty Yes 25 56 25 11 9 77 79 81 107 170 0 640 No 1,985 406 3,215 786 573 2,127 1,615 1,124 624 701 0 13,156 Unknown 940 239 1,336 309 228 1,093 779 521 423 545 0 6,413 Sub-total 2,950 701 4,576 1,106 810 3,297 2,473 1,726 1,154 1,416 0 20,209
Total crashes Yes 63 112 72 28 29 168 159 188 218 410 0 1,447 No 3,513 768 5,987 1,439 1,156 3,837 2,915 2,045 1,115 1,212 1 23,988 Unknown 1,685 368 2,639 599 464 2,010 1,435 947 620 778 1 11,546 TOTAL 5,261 1,248 8,698 2,066 1,649 6,015 4,509 3,180 1,953 2,400 2 36,981 Note: Assessment of alcohol involvement in a crash is based on the blood alcohol concentration (BAC) readings of the motor vehicle controllers involved in the crash as follows: Yes – at least one motor vehicle controller was over the legal limit. No – (1) BAC levels for all motor vehicle controllers are known and were under the legal limit; or – (2) no motor vehicle controllers were involved in the crash. Unknown – at least one motor vehicle controller had unknown BAC and all known BAC levels were under the legal limit. 1 Time periods A to J are as defined on page 26. In the case of a fatal crash reported with an unknown time, a time period is estimated.
Road traffic crashes in New South Wales 2014 32
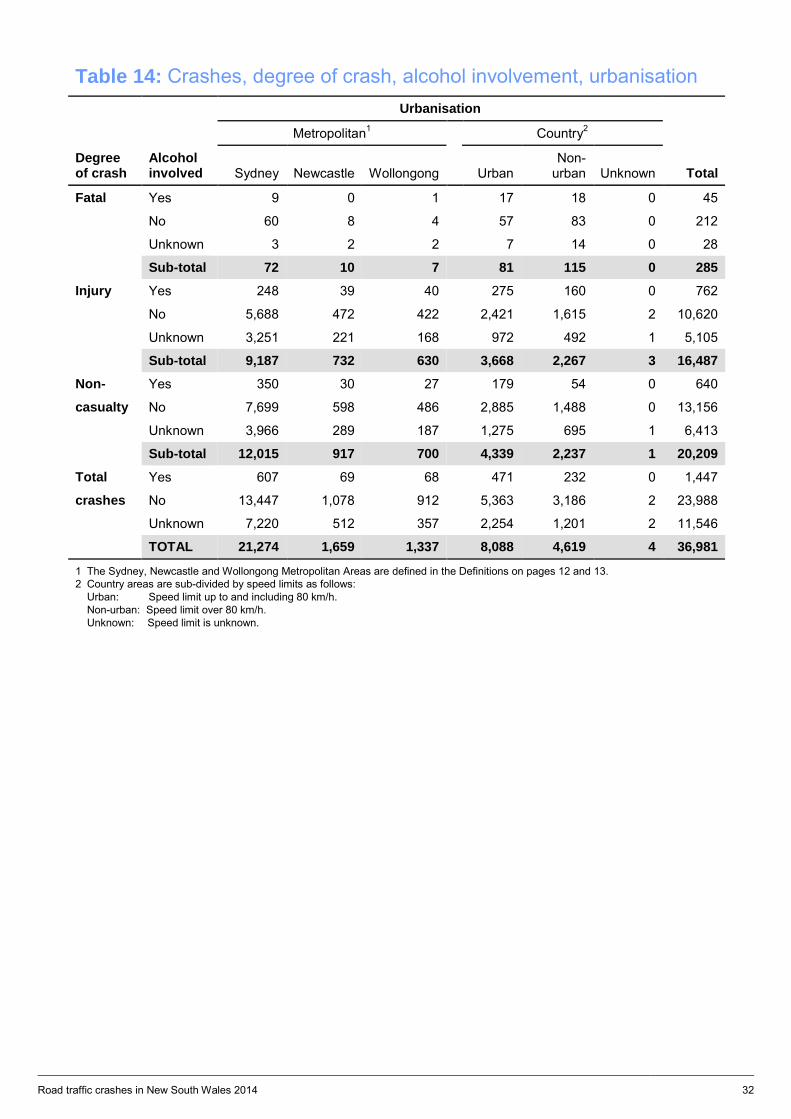
Table 14: Crashes, degree of crash, alcohol involvement, urbanisation
Degree of crash
Alcohol involved
Urbanisation
Total
Metropolitan1 Country2
Sydney Newcastle Wollongong Urban Non-
urban Unknown
Fatal Yes 9 0 1 17 18 0 45
No 60 8 4 57 83 0 212
Unknown 3 2 2 7 14 0 28
Sub-total 72 10 7 81 115 0 285
Injury Yes 248 39 40 275 160 0 762
No 5,688 472 422 2,421 1,615 2 10,620
Unknown 3,251 221 168 972 492 1 5,105
Sub-total 9,187 732 630 3,668 2,267 3 16,487
Non- Yes 350 30 27 179 54 0 640
casualty No 7,699 598 486 2,885 1,488 0 13,156
Unknown 3,966 289 187 1,275 695 1 6,413
Sub-total 12,015 917 700 4,339 2,237 1 20,209
Total Yes 607 69 68 471 232 0 1,447
crashes No 13,447 1,078 912 5,363 3,186 2 23,988
Unknown 7,220 512 357 2,254 1,201 2 11,546
TOTAL 21,274 1,659 1,337 8,088 4,619 4 36,981
1 The Sydney, Newcastle and Wollongong Metropolitan Areas are defined in the Definitions on pages 12 and 13. 2 Country areas are sub-divided by speed limits as follows: Urban: Speed limit up to and including 80 km/h. Non-urban: Speed limit over 80 km/h. Unknown: Speed limit is unknown.
Road traffic crashes in New South Wales 2014 33
Table 15a: Crashes, alcohol involvement, degree of crash
Alcohol involved in crash
Degree of crash
Fatal crash
Injury crash
Non-casualty crash
Total crashes
Yes 45 762 640 1,447
No 212 10,620 13,156 23,988
Unknown 28 5,105 6,413 11,546
Crashes: Total 285 16,487 20,209 36,981
Table 15b: Crashes, speeding involvement, degree of crash
Speeding involved in crash
Degree of crash
Fatal crash
Injury crash
Non-casualty crash
Total crashes
Yes 116 3,076 3,531 6,723
No or unknown 169 13,411 16,678 30,258
Crashes: Total 285 16,487 20,209 36,981
Table 15c: Crashes, fatigue involvement, degree of crash
Fatigue involved in crash
Degree of crash
Fatal crash
Injury crash
Non-casualty crash
Total crashes
Yes 47 1,437 2,053 3,537
No or Unknown 238 15,050 18,156 33,444
Crashes: Total 285 16,487 20,209 36,981 The identification of speeding and fatigue involvement cannot always be determined from police reports of road crashes. The Centre for Road Safety has therefore established criteria for determining if a crash is likely to have involved these factors. The criteria used for this purpose are shown on page 14.
Road traffic crashes in New South Wales 2014 34
Table 16a: Motor vehicle controllers involved, degree of crash, road user class, sex, age DEGREE OF CRASH: FATAL
Road user class Sex
Age (years)
Total 0-4 5-16 17-20 21-25 26-29 30-39 40-49 50-59 60-69 ≥70 Unknown
Car driver M 0 0 23 22 6 24 20 17 14 28 1 155
F 0 1 9 5 5 13 14 13 8 17 0 85
Sub-total1 0 1 32 27 11 37 34 30 22 45 1 240
Light truck driver M 0 0 4 3 4 7 8 5 9 6 0 46
F 0 1 0 0 1 1 0 1 0 0 0 4
Sub-total1 0 1 4 3 5 8 8 6 9 6 0 50
Heavy rigid truck M 0 0 0 2 1 7 3 3 4 0 0 20
driver F 0 0 0 0 0 0 0 0 0 0 0 0
Sub-total1 0 0 0 2 1 7 3 3 4 0 0 20
Articulated truck M 0 0 0 3 4 5 8 10 2 0 0 32
driver F 0 0 0 0 0 0 0 0 0 0 0 0
Sub-total1 0 0 0 3 4 5 8 10 2 0 0 32
Bus driver M 0 0 0 0 0 1 1 2 1 1 0 6
F 0 0 0 0 0 0 0 0 0 0 0 0
Sub-total1 0 0 0 0 0 1 1 2 1 1 0 6
Motorcycle rider M 0 1 2 11 7 10 10 13 5 0 0 59
F 0 0 0 1 0 0 0 0 0 1 0 2
Sub-total1 0 1 2 12 7 10 10 13 5 1 0 61
Other motor vehicle M 0 0 0 1 1 0 0 0 0 2 0 4
driver F 0 0 0 0 0 0 0 0 0 0 0 0
Sub-total1 0 0 0 1 1 0 0 0 0 2 0 4
MOTOR VEHICLE M 0 1 29 42 23 54 50 50 35 37 1 322
CONTROLLERS: F 0 2 9 6 6 14 14 14 8 18 0 91
TOTAL1 0 3 38 48 29 68 64 64 43 55 1 413
1 Unknown sex included.
Road traffic crashes in New South Wales 2014 35
Table 16b: Motor vehicle controllers involved, degree of crash, road user class, sex, age DEGREE OF CRASH: INJURY
Road user class Sex
Age (years)
Total 0-4 5-16 17-20 21-25 26-29 30-39 40-49 50-59 60-69 ≥70 Unknown
Car driver M 0 23 1,150 1,418 983 1,958 1,696 1,396 967 1,041 220 10,852
F 0 25 1,048 1,215 880 1,799 1,629 1,206 736 641 159 9,338
Sub-total1 0 48 2,198 2,633 1,864 3,757 3,326 2,602 1,703 1,683 583 20,397
Light truck driver M 0 7 201 332 256 538 522 400 210 87 36 2,589
F 0 2 25 24 26 70 70 46 22 7 6 298
Sub-total1 0 9 226 356 282 609 592 446 232 94 71 2,917
Heavy rigid truck M 0 0 2 41 50 100 91 92 49 4 6 435
driver F 0 0 0 0 0 1 1 0 0 0 0 2
Sub-total1 0 0 2 41 50 101 92 92 49 4 12 443
Articulated truck M 0 0 0 18 26 77 108 90 54 0 9 382
driver F 0 0 0 0 2 1 1 0 0 0 0 4
Sub-total1 0 0 0 18 28 78 109 90 54 0 17 394
Bus driver M 0 0 0 2 7 20 45 62 43 5 7 191
F 0 0 0 0 1 2 5 5 2 0 1 16
Sub-total1 0 0 0 2 8 22 50 67 45 5 18 217
Motorcycle rider M 0 38 254 354 221 457 376 334 169 26 18 2,247
F 0 1 28 41 29 55 51 47 7 1 2 262
Sub-total1 0 39 282 395 250 512 427 381 176 27 30 2,519
Other motor vehicle M 0 1 3 5 4 11 8 9 5 20 46 112
driver F 0 1 0 2 2 1 3 4 3 2 15 33
Sub-total1 0 2 3 7 6 12 11 13 8 22 320 404
MOTOR VEHICLE M 0 69 1,610 2,170 1,547 3,161 2,846 2,383 1,497 1,183 342 16,808
CONTROLLERS: F 0 29 1,101 1,282 940 1,929 1,760 1,308 770 651 183 9,953
TOTAL1 0 98 2,711 3,452 2,488 5,091 4,607 3,691 2,267 1,835 1,051 27,291 1 Unknown sex included.
Road traffic crashes in New South Wales 2014 36
Table 16c: Motor vehicle controllers involved, degree of crash, road user class, sex, age DEGREE OF CRASH: NON-CASUALTY
Road user class Sex
Age (years)
Total 0-4 5-16 17-20 21-25 26-29 30-39 40-49 50-59 60-69 ≥70 Unknown
Car driver M 0 48 2,166 2,467 1,657 3,267 2,483 1,991 1,314 1,074 451 16,918
F 0 27 1,443 1,782 1,151 2,305 2,112 1,534 951 641 188 12,134
Sub-total1 0 75 3,609 4,249 2,809 5,574 4,597 3,526 2,265 1,715 1,052 29,471
Light truck driver M 0 2 335 496 376 723 685 535 303 104 86 3,645
F 0 1 33 48 36 75 78 47 17 8 8 351
Sub-total1 0 3 368 544 412 799 764 582 320 112 152 4,056
Heavy rigid truck M 0 0 1 46 56 129 189 143 65 6 16 651
driver F 0 0 0 0 1 1 2 0 1 1 0 6
Sub-total1 0 0 1 46 57 130 191 143 66 7 35 676
Articulated truck M 0 0 1 27 46 135 116 121 64 4 18 532
driver F 0 0 0 0 1 2 4 0 0 0 0 7
Sub-total1 0 0 1 27 47 137 120 121 64 4 42 563
Bus driver M 0 0 0 5 10 27 49 83 46 6 4 230
F 0 0 0 0 0 1 4 9 7 0 1 22
Sub-total1 0 0 0 5 10 28 53 92 53 6 12 259
Motorcycle rider M 0 1 26 49 41 61 42 25 9 3 9 266
F 0 1 0 1 1 5 1 4 1 0 0 14
Sub-total1 0 2 26 50 42 66 43 29 10 3 12 283
Other motor vehicle M 0 0 2 1 3 11 8 6 3 1 47 82
driver F 0 0 1 1 1 1 0 1 0 2 5 12
Sub-total1 0 0 3 2 4 12 8 7 3 3 425 467
MOTOR VEHICLE M 0 51 2,531 3,091 2,189 4,353 3,572 2,904 1,804 1,198 631 22,324
CONTROLLERS: F 0 29 1,477 1,832 1,191 2,390 2,201 1,595 977 652 202 12,546
TOTAL1 0 80 4,008 4,923 3,381 6,746 5,776 4,500 2,781 1,850 1,730 35,775
1 Unknown sex included.
Road traffic crashes in New South Wales 2014 37
Table 16d: Motor vehicle controllers involved, degree of crash, road user class, sex, age DEGREE OF CRASH: ALL CRASHES
Road user class Sex Age (years)
Total 0-4 5-16 17-20 21-25 26-29 30-39 40-49 50-59 60-69 ≥70 Unknown
Car driver M 0 71 3,339 3,907 2,646 5,249 4,199 3,404 2,295 2,143 672 27,925
F 0 53 2,500 3,002 2,036 4,117 3,755 2,753 1,695 1,299 347 21,557
Sub-total1 0 124 5,839 6,909 4,684 9,368 7,957 6,158 3,990 3,443 1,636 50,108
Light truck driver M 0 9 540 831 636 1,268 1,215 940 522 197 122 6,280
F 0 4 58 72 63 146 148 94 39 15 14 653
Sub-total1 0 13 598 903 699 1,416 1,364 1,034 561 212 223 7,023
Heavy rigid truck M 0 0 3 89 107 236 283 238 118 10 22 1,106
driver F 0 0 0 0 1 2 3 0 1 1 0 8
Sub-total1 0 0 3 89 108 238 286 238 119 11 47 1,139
Articulated truck M 0 0 1 48 76 217 232 221 120 4 27 946
driver F 0 0 0 0 3 3 5 0 0 0 0 11
Sub-total1 0 0 1 48 79 220 237 221 120 4 59 989
Bus driver M 0 0 0 7 17 48 95 147 90 12 11 427
F 0 0 0 0 1 3 9 14 9 0 2 38
Sub-total1 0 0 0 7 18 51 104 161 99 12 30 482
Motorcycle rider M 0 40 282 414 269 528 428 372 183 29 27 2,572
F 0 2 28 43 30 60 52 51 8 2 2 278
Sub-total1 0 42 310 457 299 588 480 423 191 31 42 2,863
Other motor vehicle M 0 1 5 7 8 22 16 15 8 23 93 198
driver F 0 1 1 3 3 2 3 5 3 4 20 45
Sub-total1 0 2 6 10 11 24 19 20 11 27 745 875
MOTOR VEHICLE M 0 121 4,170 5,303 3,759 7,568 6,468 5,337 3,336 2,418 974 39,454
CONTROLLERS: F 0 60 2,587 3,120 2,137 4,333 3,975 2,917 1,755 1,321 385 22,590
TOTAL1 0 181 6,757 8,423 5,898 11,905 10,447 8,255 5,091 3,740 2,782 63,479 1 Unknown sex included
Road traffic crashes in New South Wales 2014 38
Table 17: Motor vehicle controllers involved, road user class, licence status, degree of crash
Road user class
Degree of crash
Licence status
Fatal crash
Injury crash
Non-casualty crash
All crashes
Car driver Learner 3 198 298 499 Provisional2
27 3,316 5,359 8,702 Standard 169 14,043 19,839 34,051 Unlicensed1
12 511 578 1,101 Unknown2
29 2,329 3,397 5,755 Sub-total 240 20,397 29,471 50,108
Light truck driver Learner 1 12 15 28 Provisional2
5 325 492 822 Standard 38 2,198 3,018 5,254 Unlicensed1
1 76 71 148 Unknown2
5 306 460 771 Sub-total 50 2,917 4,056 7,023
Heavy rigid truck driver Provisional2 0 9 7 16 Standard 20 385 576 981
Unlicensed1 0 10 6 16
Unknown2 0 39 87 126
Sub-total 20 443 676 1,139 Articulated truck driver Standard 26 303 436 765
Unlicensed1 1 6 6 13
Unknown2 5 85 121 211
Sub-total 32 394 563 989 Bus driver Learner 0 0 1 1
Provisional2 0 0 1 1
Standard 6 191 235 432 Unlicensed1
0 1 1 2 Unknown2
0 25 21 46 Sub-total 6 217 259 482
Motorcycle rider Learner 7 350 34 391 Provisional2
4 240 41 285 Standard 37 1,415 175 1,627 Unlicensed1
8 134 1 143 Unknown2
5 380 32 417 Sub-total 61 2,519 283 2,863
Other motor Learner 0 0 0 0 vehicle driver Provisional2
0 3 5 8 Standard 1 33 27 61 Unlicensed1
1 7 5 13 Unknown2
2 361 430 793 Sub-total 4 404 467 875 MOTOR VEHICLE CONTROLLERS: TOTAL 413 27,291 35,775 63,479 1 Includes persons driving whilst disqualified or suspended. 2 Includes P1 and P2 licence types
Road traffic crashes in New South Wales 2014 39
Table 18a: Motor vehicle controllers involved, degree of crash, BAC1, sex, age DEGREE OF CRASH: FATAL Blood Alcohol Concentration (g/100mL) Sex
Age (years)
Total 0-4 5-16 17-20 21-25 26-29 30-39 40-49 50-59 60-69 ≥70 Unknown Legal M 0 1 23 28 13 39 43 45 32 33 1 258 F 0 2 6 5 5 13 13 11 6 15 0 76 Sub-total2 0 3 29 33 18 52 56 56 38 48 1 334 .001 – .0193 M 0 0 0 2 0 0 0 0 0 0 0 2 F 0 0 0 0 0 0 0 0 0 0 0 0 Sub-total2 0 0 0 2 0 0 0 0 0 0 0 2 .020 – .0494 M 0 0 1 0 0 0 0 0 0 0 0 1 F 0 0 0 0 0 0 0 0 0 0 0 0 Sub-total2 0 0 1 0 0 0 0 0 0 0 0 1 .050 – .079 M 0 0 0 1 0 0 1 0 0 0 0 2 F 0 0 0 0 0 0 0 0 0 0 0 0 Sub-total2 0 0 0 1 0 0 1 0 0 0 0 2 .080 – .149 M 0 0 3 5 3 4 3 1 0 1 0 20 F 0 0 0 0 0 0 0 1 0 0 0 1 Sub-total2 0 0 3 5 3 4 3 2 0 1 0 21 ≥ .150 M 0 0 2 3 3 6 1 1 1 0 0 17 F 0 0 1 1 0 0 0 0 0 0 0 2 Sub-total2 0 0 3 4 3 6 1 1 1 0 0 19 Unknown M 0 0 0 3 4 5 2 3 2 3 0 22 F 0 0 2 0 1 1 1 2 2 3 0 12 Sub-total2 0 0 2 3 5 6 3 5 4 6 0 34 MOTOR VEHICLE M 0 1 29 42 23 54 50 50 35 37 1 322 CONTROLLERS: F 0 2 9 6 6 14 14 14 8 18 0 91 TOTAL2 0 3 38 48 29 68 64 64 43 55 1 413 1 Blood Alcohol Concentration. 2 Unknown sex included. 3 Learner and Provisional Licence holders. 4 Learner and Provisional Licence holders, unlicensed controllers and certain categories of professional controllers.
Road traffic crashes in New South Wales 2014 40
Table 18b: Motor vehicle controllers involved, degree of crash, BAC1, sex, age DEGREE OF CRASH: INJURY Blood Alcohol Concentration (g/100mL) Sex
Age (years)
Total 0-4 5-16 17-20 21-25 26-29 30-39 40-49 50-59 60-69 ≥70 Unknown
Legal M 0 40 1,214 1,561 1,078 2,189 2,021 1,769 1,146 916 47 11,981
F 0 17 871 912 672 1,363 1,260 923 586 523 37 7,164
Sub-total2 0 57 2,085 2,473 1,751 3,553 3,282 2,692 1,732 1,440 87 19,152 .001 – .0193 M 0 1 2 0 2 0 0 0 0 0 0 5 F 0 0 1 1 0 0 0 0 0 0 0 2 Sub-total2 0 1 3 1 2 0 0 0 0 0 0 7
.020 – .0494 M 0 0 5 2 0 2 1 0 0 0 0 10
F 0 1 4 0 0 0 1 0 0 0 0 6
Sub-total2 0 1 9 2 0 2 2 0 0 0 0 16
.050 – .079 M 0 3 14 18 12 17 11 10 2 2 2 91
F 0 1 3 1 3 3 3 5 2 1 1 23
Sub-total2 0 4 17 19 15 20 14 15 4 3 3 114
.080 – .149 M 0 3 43 52 28 45 37 12 17 9 1 247
F 0 0 3 9 5 22 12 4 1 1 0 57
Sub-total2 0 3 46 61 33 67 49 16 18 10 1 304
≥ .150 M 0 0 28 46 29 61 57 24 5 4 0 254
F 0 0 3 7 10 21 14 10 3 1 0 69
Sub-total2 0 0 31 53 39 82 71 34 8 5 0 323
Unknown M 0 22 304 491 398 847 719 568 327 252 292 4,220
F 0 10 216 352 250 520 470 366 178 125 145 2,632
Sub-total2 0 32 520 843 648 1,367 1,189 934 505 377 960 7,375 MOTOR VEHICLE M 0 69 1,610 2,170 1,547 3,161 2,846 2,383 1,497 1,183 342 16,808 CONTROLLERS: F 0 29 1,101 1,282 940 1,929 1,760 1,308 770 651 183 9,953
TOTAL2 0 98 2,711 3,452 2,488 5,091 4,607 3,691 2,267 1,835 1,051 27,291 1 Blood Alcohol Concentration. 2 Unknown sex included. 3 Learner and Provisional Licence holders. 4 Learner and Provisional Licence holders, unlicensed controllers and certain categories of professional controllers.
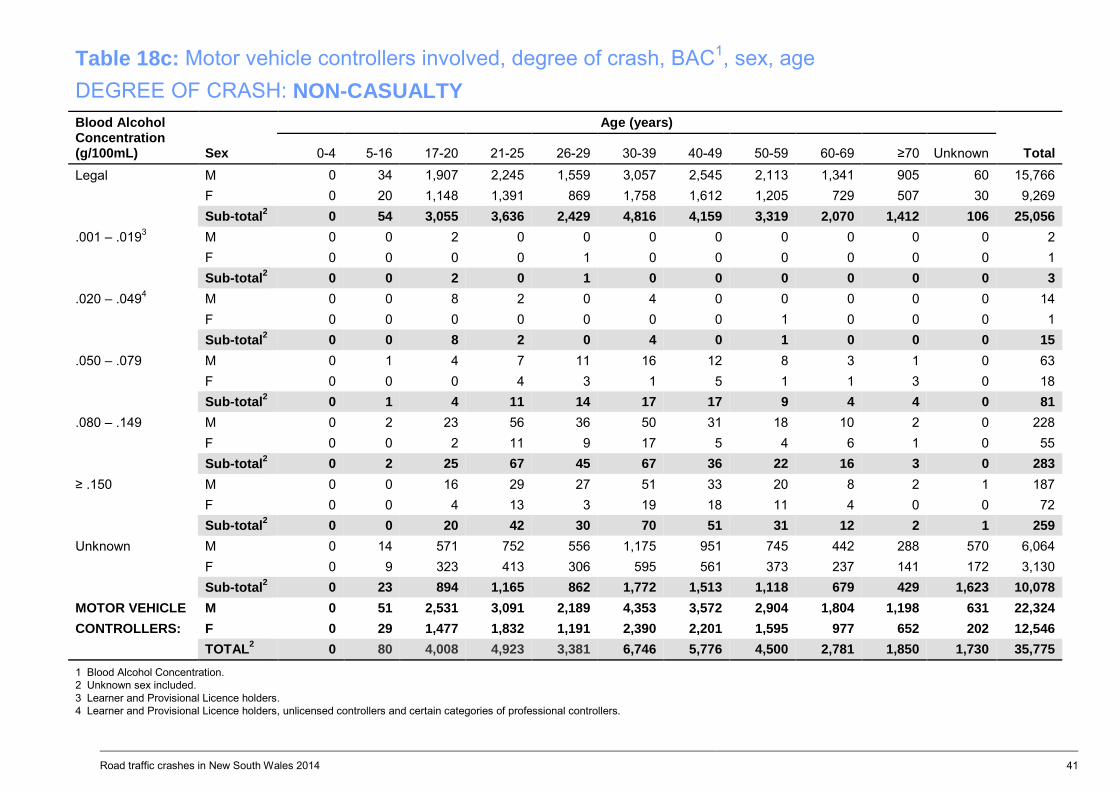
Road traffic crashes in New South Wales 2014 41
Table 18c: Motor vehicle controllers involved, degree of crash, BAC1, sex, age DEGREE OF CRASH: NON-CASUALTY Blood Alcohol Concentration (g/100mL) Sex
Age (years)
Total 0-4 5-16 17-20 21-25 26-29 30-39 40-49 50-59 60-69 ≥70 Unknown Legal M 0 34 1,907 2,245 1,559 3,057 2,545 2,113 1,341 905 60 15,766 F 0 20 1,148 1,391 869 1,758 1,612 1,205 729 507 30 9,269 Sub-total2 0 54 3,055 3,636 2,429 4,816 4,159 3,319 2,070 1,412 106 25,056 .001 – .0193 M 0 0 2 0 0 0 0 0 0 0 0 2 F 0 0 0 0 1 0 0 0 0 0 0 1 Sub-total2 0 0 2 0 1 0 0 0 0 0 0 3 .020 – .0494 M 0 0 8 2 0 4 0 0 0 0 0 14 F 0 0 0 0 0 0 0 1 0 0 0 1 Sub-total2 0 0 8 2 0 4 0 1 0 0 0 15 .050 – .079 M 0 1 4 7 11 16 12 8 3 1 0 63 F 0 0 0 4 3 1 5 1 1 3 0 18 Sub-total2 0 1 4 11 14 17 17 9 4 4 0 81 .080 – .149 M 0 2 23 56 36 50 31 18 10 2 0 228 F 0 0 2 11 9 17 5 4 6 1 0 55 Sub-total2 0 2 25 67 45 67 36 22 16 3 0 283 ≥ .150 M 0 0 16 29 27 51 33 20 8 2 1 187 F 0 0 4 13 3 19 18 11 4 0 0 72 Sub-total2 0 0 20 42 30 70 51 31 12 2 1 259 Unknown M 0 14 571 752 556 1,175 951 745 442 288 570 6,064 F 0 9 323 413 306 595 561 373 237 141 172 3,130 Sub-total2 0 23 894 1,165 862 1,772 1,513 1,118 679 429 1,623 10,078 MOTOR VEHICLE M 0 51 2,531 3,091 2,189 4,353 3,572 2,904 1,804 1,198 631 22,324 CONTROLLERS: F 0 29 1,477 1,832 1,191 2,390 2,201 1,595 977 652 202 12,546 TOTAL2 0 80 4,008 4,923 3,381 6,746 5,776 4,500 2,781 1,850 1,730 35,775 1 Blood Alcohol Concentration. 2 Unknown sex included. 3 Learner and Provisional Licence holders. 4 Learner and Provisional Licence holders, unlicensed controllers and certain categories of professional controllers.
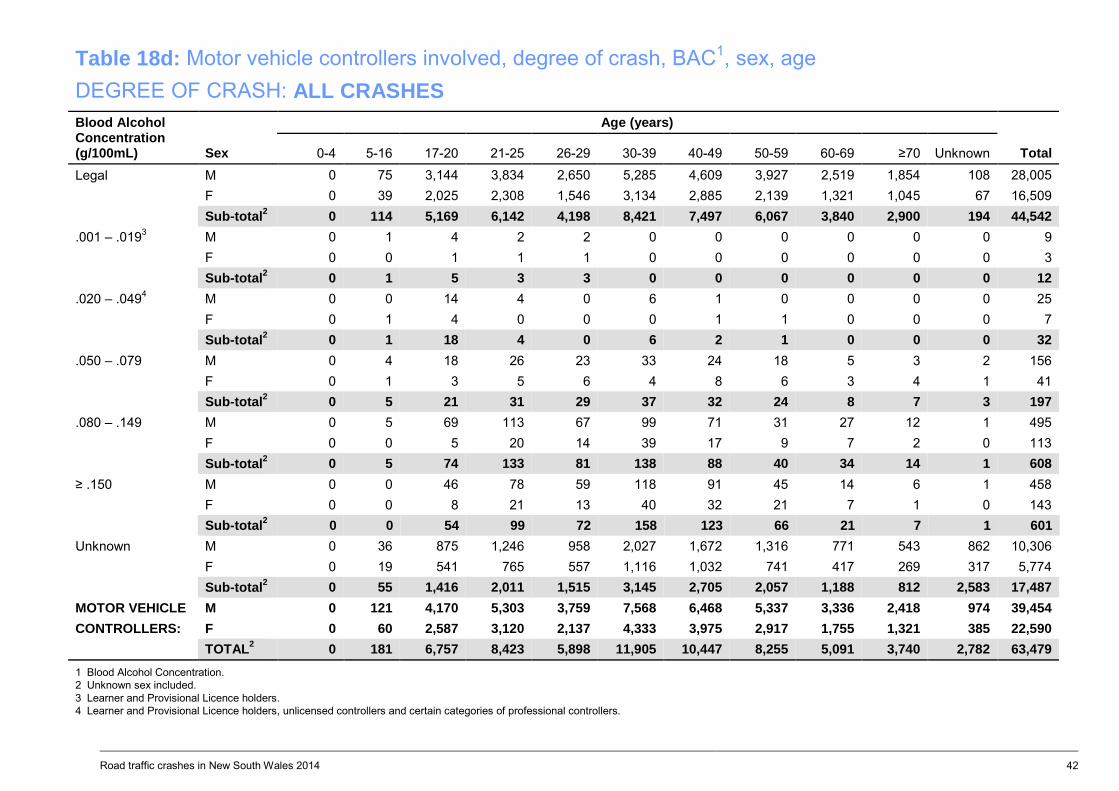
Road traffic crashes in New South Wales 2014 42
Table 18d: Motor vehicle controllers involved, degree of crash, BAC1, sex, age DEGREE OF CRASH: ALL CRASHES Blood Alcohol Concentration (g/100mL) Sex
Age (years)
Total 0-4 5-16 17-20 21-25 26-29 30-39 40-49 50-59 60-69 ≥70 Unknown Legal M 0 75 3,144 3,834 2,650 5,285 4,609 3,927 2,519 1,854 108 28,005 F 0 39 2,025 2,308 1,546 3,134 2,885 2,139 1,321 1,045 67 16,509 Sub-total2 0 114 5,169 6,142 4,198 8,421 7,497 6,067 3,840 2,900 194 44,542 .001 – .0193 M 0 1 4 2 2 0 0 0 0 0 0 9 F 0 0 1 1 1 0 0 0 0 0 0 3 Sub-total2 0 1 5 3 3 0 0 0 0 0 0 12 .020 – .0494 M 0 0 14 4 0 6 1 0 0 0 0 25 F 0 1 4 0 0 0 1 1 0 0 0 7 Sub-total2 0 1 18 4 0 6 2 1 0 0 0 32 .050 – .079 M 0 4 18 26 23 33 24 18 5 3 2 156 F 0 1 3 5 6 4 8 6 3 4 1 41 Sub-total2 0 5 21 31 29 37 32 24 8 7 3 197 .080 – .149 M 0 5 69 113 67 99 71 31 27 12 1 495 F 0 0 5 20 14 39 17 9 7 2 0 113 Sub-total2 0 5 74 133 81 138 88 40 34 14 1 608 ≥ .150 M 0 0 46 78 59 118 91 45 14 6 1 458 F 0 0 8 21 13 40 32 21 7 1 0 143 Sub-total2 0 0 54 99 72 158 123 66 21 7 1 601 Unknown M 0 36 875 1,246 958 2,027 1,672 1,316 771 543 862 10,306 F 0 19 541 765 557 1,116 1,032 741 417 269 317 5,774 Sub-total2 0 55 1,416 2,011 1,515 3,145 2,705 2,057 1,188 812 2,583 17,487 MOTOR VEHICLE M 0 121 4,170 5,303 3,759 7,568 6,468 5,337 3,336 2,418 974 39,454 CONTROLLERS: F 0 60 2,587 3,120 2,137 4,333 3,975 2,917 1,755 1,321 385 22,590 TOTAL2 0 181 6,757 8,423 5,898 11,905 10,447 8,255 5,091 3,740 2,782 63,479 1 Blood Alcohol Concentration. 2 Unknown sex included. 3 Learner and Provisional Licence holders. 4 Learner and Provisional Licence holders, unlicensed controllers and certain categories of professional controllers.

Road traffic crashes in New South Wales 2014 43
Table 19: Speeding motor vehicle controllers involved, degree of crash, sex, age
Degree of crash Sex
Age (years)
Total 0-4 5-16 17-20 21-25 26-29 30-39 40-49 50-59 60-69 ≥70 Unknown
Fatal M 0 0 14 18 6 22 14 7 9 5 0 95
F 0 0 5 2 2 6 2 3 1 3 0 24
Sub-total1 0 0 19 20 8 28 16 10 10 8 0 119
Injury M 0 25 359 332 225 357 330 257 156 97 22 2,160
F 0 6 179 140 83 171 148 97 60 72 4 960
Sub-total1 0 31 538 472 308 528 478 354 216 169 45 3,139
Non-casualty M 0 13 525 422 251 444 309 221 120 75 102 2,482
F 0 4 195 169 86 185 137 85 68 38 12 979
Sub-total1 0 17 720 591 338 629 447 306 188 113 245 3,594
SPEEDING
MOTOR VEHICLE M 0 38 898 772 482 823 653 485 285 177 124 4,737
CONTROLLERS: F 0 10 379 311 171 362 287 185 129 113 16 1,963
TOTAL1 0 48 1,277 1,083 654 1,185 941 670 414 290 290 6,852 1 Unknown sex included. The identification of speeding involvement cannot always be determined from police reports of road crashes. The Centre for Road Safety has therefore established criteria for determining if a crash is likely to have involved this factor. The criteria used for this purpose are shown on page 14.
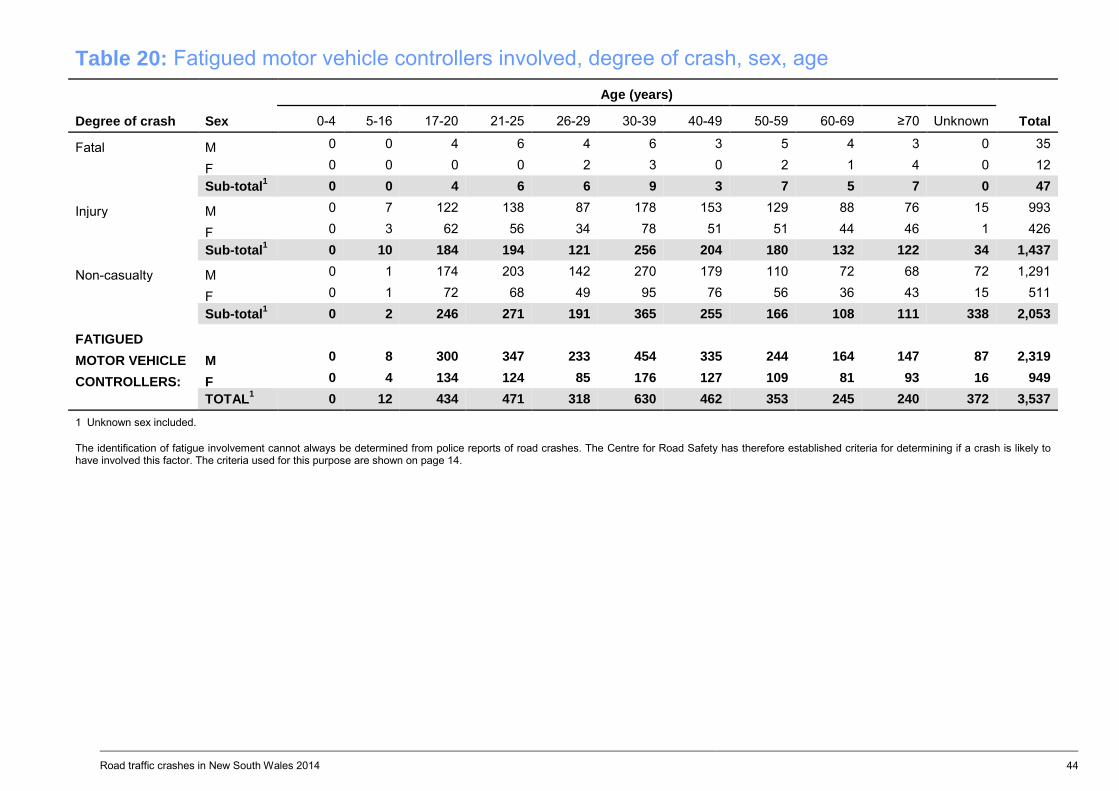
Road traffic crashes in New South Wales 2014 44
Table 20: Fatigued motor vehicle controllers involved, degree of crash, sex, age
Degree of crash Sex
Age (years)
Total 0-4 5-16 17-20 21-25 26-29 30-39 40-49 50-59 60-69 ≥70 Unknown
Fatal M 0 0 4 6 4 6 3 5 4 3 0 35
F 0 0 0 0 2 3 0 2 1 4 0 12
Sub-total1 0 0 4 6 6 9 3 7 5 7 0 47
Injury M 0 7 122 138 87 178 153 129 88 76 15 993
F 0 3 62 56 34 78 51 51 44 46 1 426
Sub-total1 0 10 184 194 121 256 204 180 132 122 34 1,437
Non-casualty M 0 1 174 203 142 270 179 110 72 68 72 1,291
F 0 1 72 68 49 95 76 56 36 43 15 511
Sub-total1 0 2 246 271 191 365 255 166 108 111 338 2,053
FATIGUED
MOTOR VEHICLE M 0 8 300 347 233 454 335 244 164 147 87 2,319
CONTROLLERS: F 0 4 134 124 85 176 127 109 81 93 16 949
TOTAL1 0 12 434 471 318 630 462 353 245 240 372 3,537 1 Unknown sex included. The identification of fatigue involvement cannot always be determined from police reports of road crashes. The Centre for Road Safety has therefore established criteria for determining if a crash is likely to have involved this factor. The criteria used for this purpose are shown on page 14.
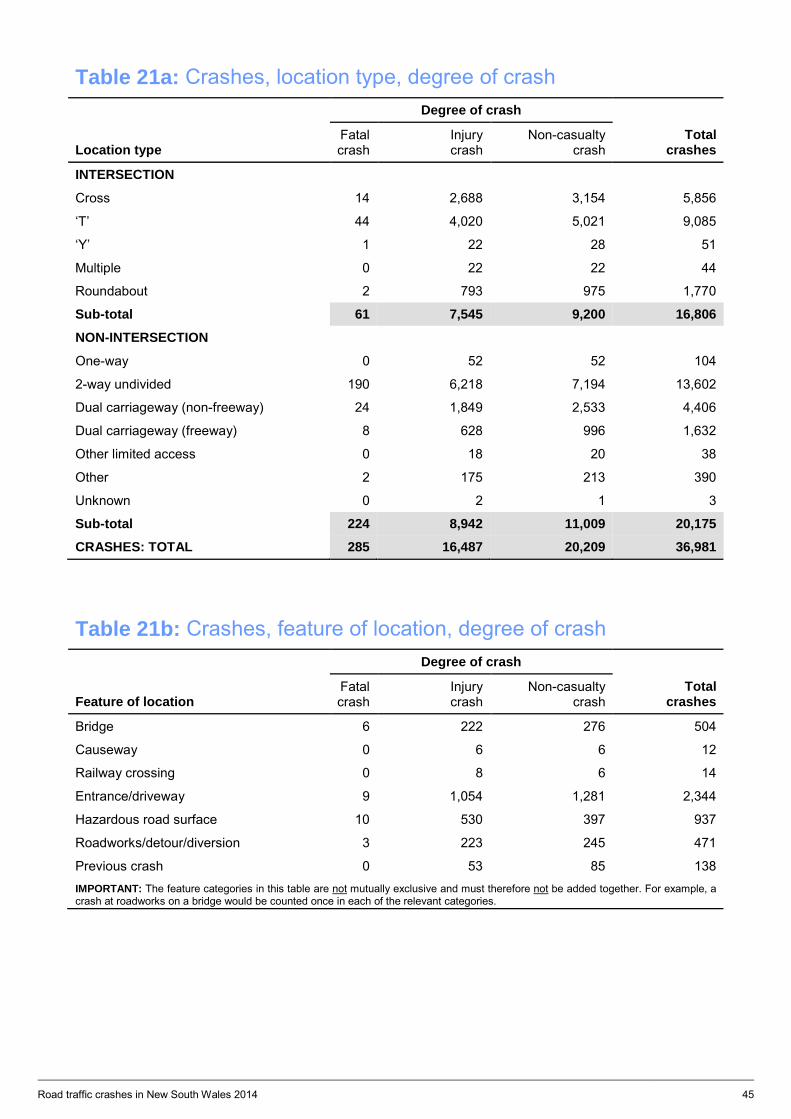
Road traffic crashes in New South Wales 2014 45
Table 21a: Crashes, location type, degree of crash Degree of crash
Location type Fatal crash
Injury crash
Non-casualty crash
Total crashes
INTERSECTION
Cross 14 2,688 3,154 5,856
‘T’ 44 4,020 5,021 9,085
‘Y’ 1 22 28 51
Multiple 0 22 22 44
Roundabout 2 793 975 1,770
Sub-total 61 7,545 9,200 16,806
NON-INTERSECTION
One-way 0 52 52 104
2-way undivided 190 6,218 7,194 13,602
Dual carriageway (non-freeway) 24 1,849 2,533 4,406
Dual carriageway (freeway) 8 628 996 1,632
Other limited access 0 18 20 38
Other 2 175 213 390
Unknown 0 2 1 3
Sub-total 224 8,942 11,009 20,175
CRASHES: TOTAL 285 16,487 20,209 36,981
Table 21b: Crashes, feature of location, degree of crash Degree of crash
Feature of location Fatal crash
Injury crash
Non-casualty crash
Total crashes
Bridge 6 222 276 504
Causeway 0 6 6 12
Railway crossing 0 8 6 14
Entrance/driveway 9 1,054 1,281 2,344
Hazardous road surface 10 530 397 937
Roadworks/detour/diversion 3 223 245 471
Previous crash 0 53 85 138 IMPORTANT: The feature categories in this table are not mutually exclusive and must therefore not be added together. For example, a crash at roadworks on a bridge would be counted once in each of the relevant categories.
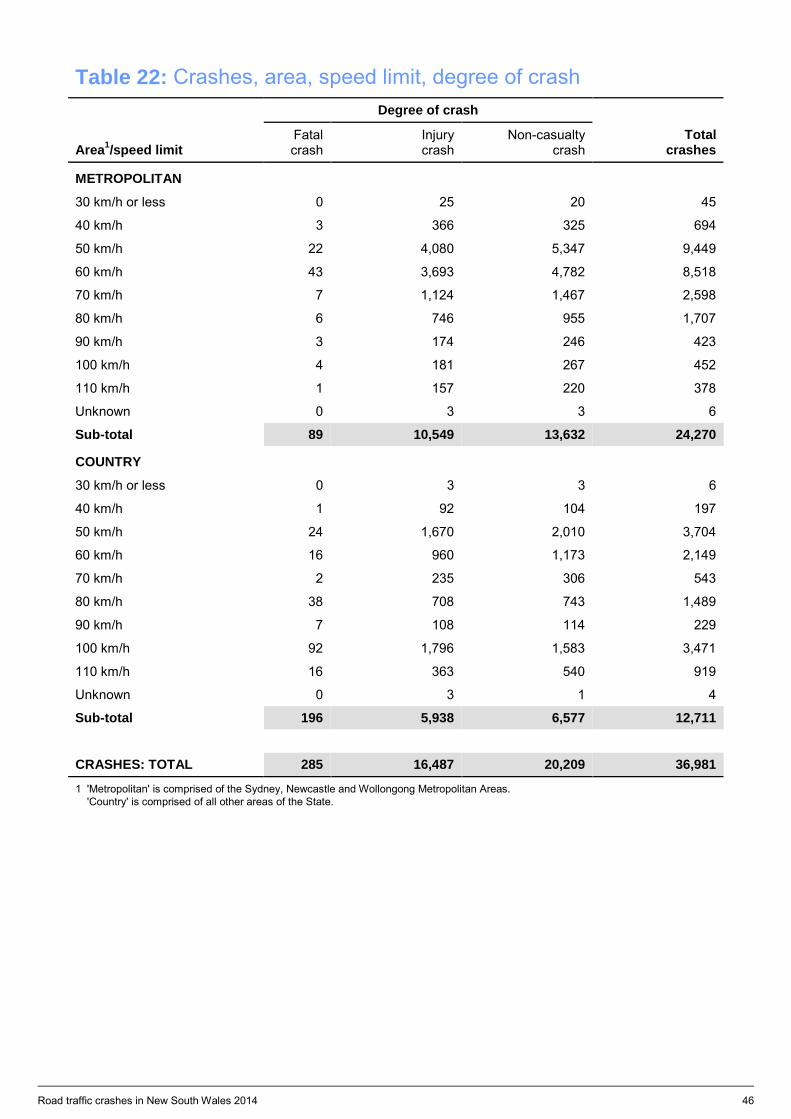
Road traffic crashes in New South Wales 2014 46
Table 22: Crashes, area, speed limit, degree of crash Degree of crash
Area1/speed limit Fatal crash
Injury crash
Non-casualty crash
Total crashes
METROPOLITAN
30 km/h or less 0 25 20 45
40 km/h 3 366 325 694
50 km/h 22 4,080 5,347 9,449
60 km/h 43 3,693 4,782 8,518
70 km/h 7 1,124 1,467 2,598
80 km/h 6 746 955 1,707
90 km/h 3 174 246 423
100 km/h 4 181 267 452
110 km/h 1 157 220 378
Unknown 0 3 3 6
Sub-total 89 10,549 13,632 24,270
COUNTRY
30 km/h or less 0 3 3 6
40 km/h 1 92 104 197
50 km/h 24 1,670 2,010 3,704
60 km/h 16 960 1,173 2,149
70 km/h 2 235 306 543
80 km/h 38 708 743 1,489
90 km/h 7 108 114 229
100 km/h 92 1,796 1,583 3,471
110 km/h 16 363 540 919
Unknown 0 3 1 4
Sub-total 196 5,938 6,577 12,711
CRASHES: TOTAL 285 16,487 20,209 36,981
1 'Metropolitan' is comprised of the Sydney, Newcastle and Wollongong Metropolitan Areas. 'Country' is comprised of all other areas of the State.
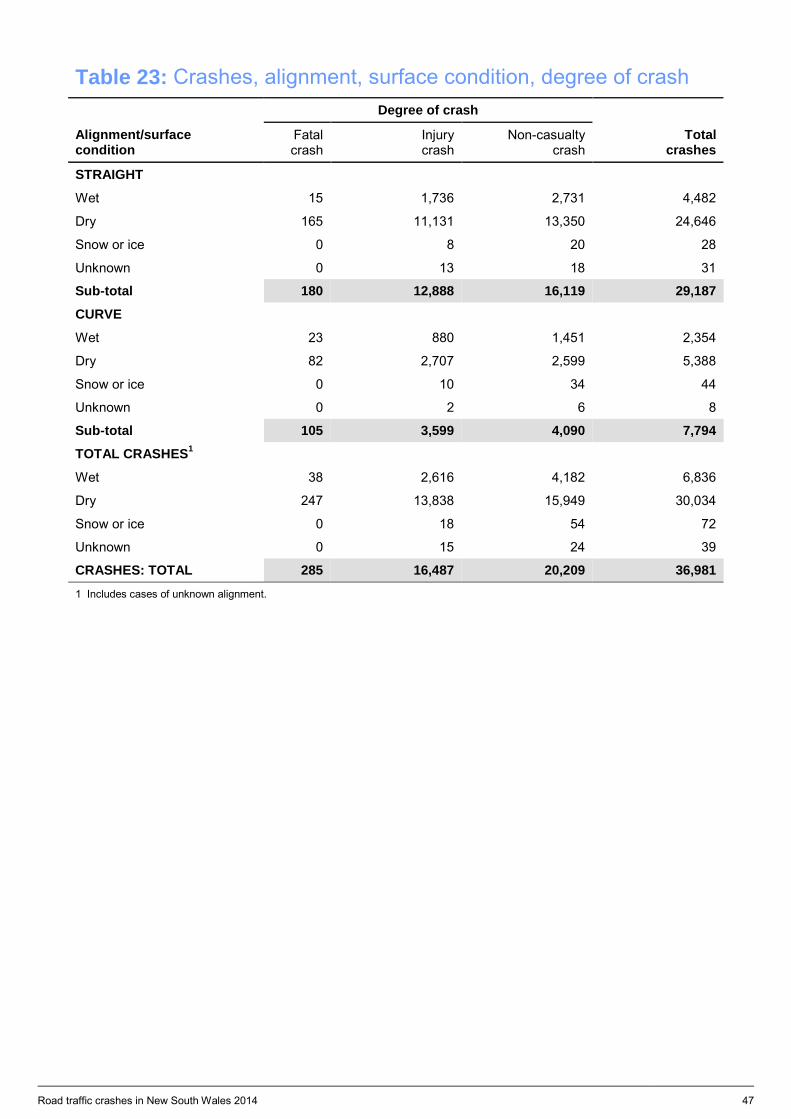
Road traffic crashes in New South Wales 2014 47
Table 23: Crashes, alignment, surface condition, degree of crash Degree of crash
Alignment/surface condition
Fatal crash
Injury crash
Non-casualty crash
Total crashes
STRAIGHT
Wet 15 1,736 2,731 4,482
Dry 165 11,131 13,350 24,646
Snow or ice 0 8 20 28
Unknown 0 13 18 31
Sub-total 180 12,888 16,119 29,187
CURVE
Wet 23 880 1,451 2,354
Dry 82 2,707 2,599 5,388
Snow or ice 0 10 34 44
Unknown 0 2 6 8
Sub-total 105 3,599 4,090 7,794
TOTAL CRASHES1
Wet 38 2,616 4,182 6,836
Dry 247 13,838 15,949 30,034
Snow or ice 0 18 54 72
Unknown 0 15 24 39
CRASHES: TOTAL 285 16,487 20,209 36,981 1 Includes cases of unknown alignment.
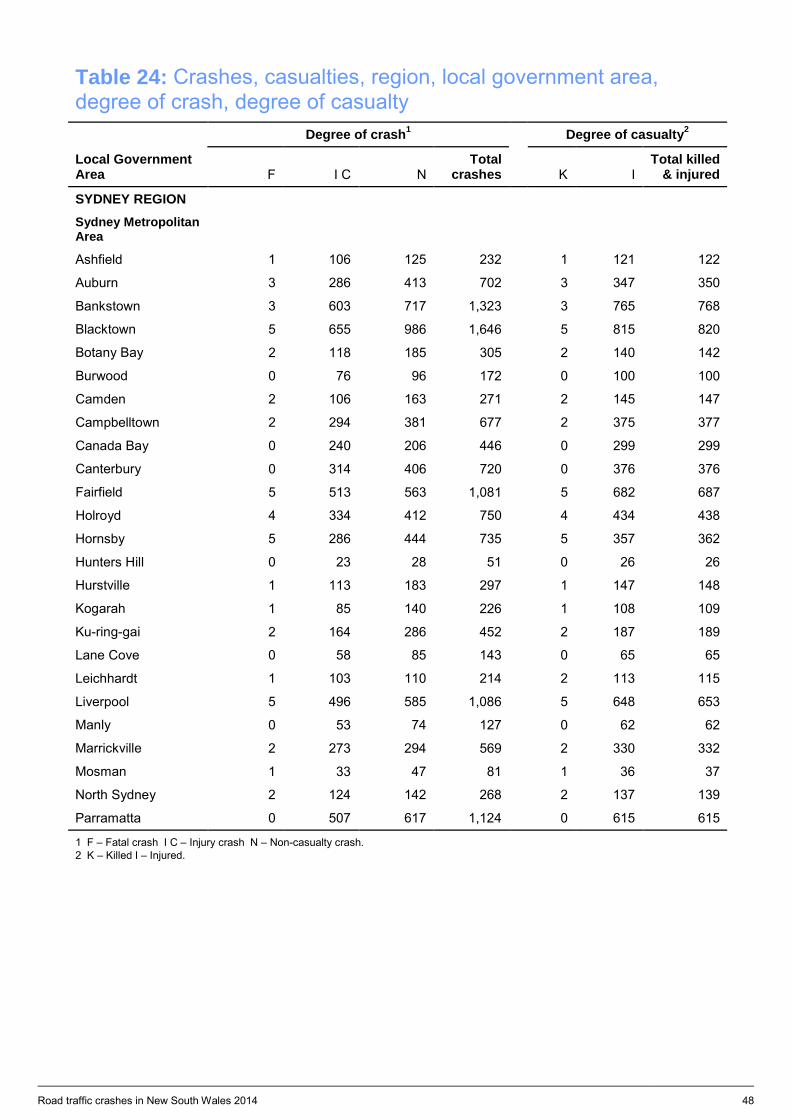
Road traffic crashes in New South Wales 2014 48
Table 24: Crashes, casualties, region, local government area, degree of crash, degree of casualty
Local Government Area
Degree of crash1 Degree of casualty2
F I C N Total
crashes K I Total killed
& injured
SYDNEY REGION
Sydney Metropolitan Area
Ashfield 1 106 125 232 1 121 122
Auburn 3 286 413 702 3 347 350
Bankstown 3 603 717 1,323 3 765 768
Blacktown 5 655 986 1,646 5 815 820
Botany Bay 2 118 185 305 2 140 142
Burwood 0 76 96 172 0 100 100
Camden 2 106 163 271 2 145 147
Campbelltown 2 294 381 677 2 375 377
Canada Bay 0 240 206 446 0 299 299
Canterbury 0 314 406 720 0 376 376
Fairfield 5 513 563 1,081 5 682 687
Holroyd 4 334 412 750 4 434 438
Hornsby 5 286 444 735 5 357 362
Hunters Hill 0 23 28 51 0 26 26
Hurstville 1 113 183 297 1 147 148
Kogarah 1 85 140 226 1 108 109
Ku-ring-gai 2 164 286 452 2 187 189
Lane Cove 0 58 85 143 0 65 65
Leichhardt 1 103 110 214 2 113 115
Liverpool 5 496 585 1,086 5 648 653
Manly 0 53 74 127 0 62 62
Marrickville 2 273 294 569 2 330 332
Mosman 1 33 47 81 1 36 37
North Sydney 2 124 142 268 2 137 139
Parramatta 0 507 617 1,124 0 615 615
1 F – Fatal crash I C – Injury crash N – Non-casualty crash. 2 K – Killed I – Injured.
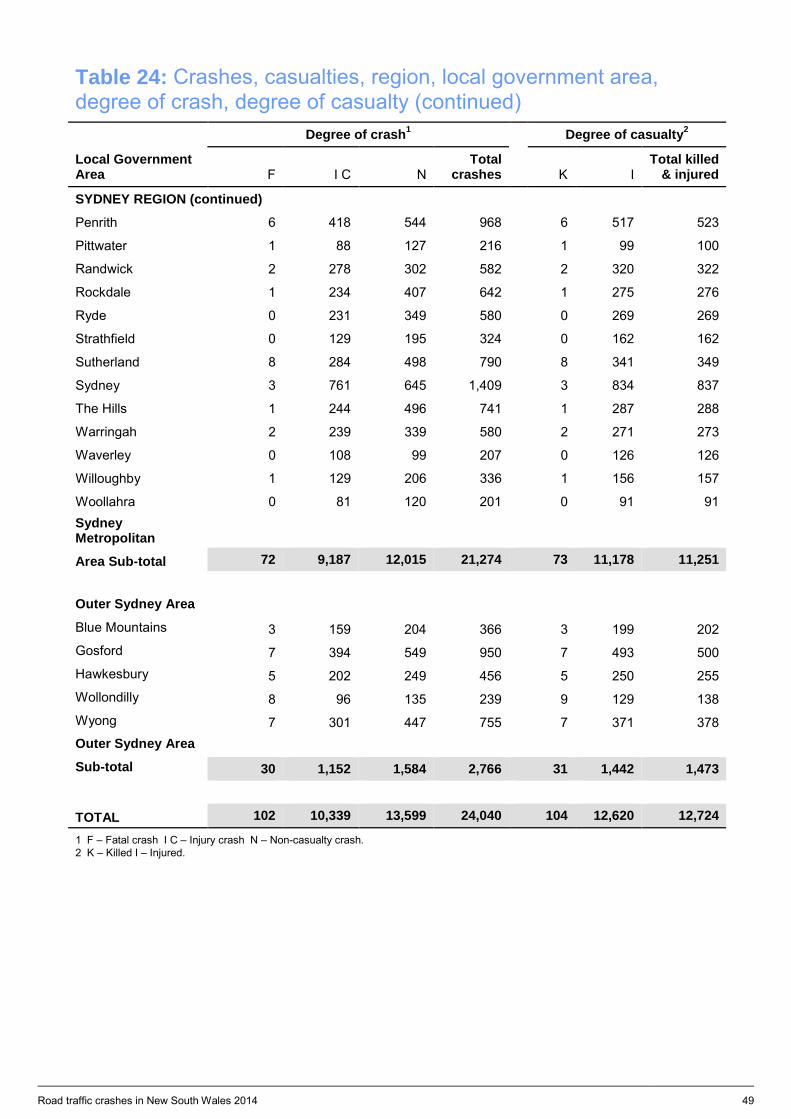
Road traffic crashes in New South Wales 2014 49
Table 24: Crashes, casualties, region, local government area, degree of crash, degree of casualty (continued)
Local Government Area
Degree of crash1 Degree of casualty2
F I C N Total
crashes K I Total killed
& injured
SYDNEY REGION (continued)
Penrith 6 418 544 968 6 517 523
Pittwater 1 88 127 216 1 99 100
Randwick 2 278 302 582 2 320 322
Rockdale 1 234 407 642 1 275 276
Ryde 0 231 349 580 0 269 269
Strathfield 0 129 195 324 0 162 162
Sutherland 8 284 498 790 8 341 349
Sydney 3 761 645 1,409 3 834 837
The Hills 1 244 496 741 1 287 288
Warringah 2 239 339 580 2 271 273
Waverley 0 108 99 207 0 126 126
Willoughby 1 129 206 336 1 156 157
Woollahra 0 81 120 201 0 91 91 Sydney Metropolitan
Area Sub-total 72 9,187 12,015 21,274 73 11,178 11,251 Outer Sydney Area Blue Mountains 3 159 204 366 3 199 202 Gosford 7 394 549 950 7 493 500 Hawkesbury 5 202 249 456 5 250 255 Wollondilly 8 96 135 239 9 129 138 Wyong 7 301 447 755 7 371 378 Outer Sydney Area Sub-total 30 1,152 1,584 2,766 31 1,442 1,473
TOTAL 102 10,339 13,599 24,040 104 12,620 12,724
1 F – Fatal crash I C – Injury crash N – Non-casualty crash. 2 K – Killed I – Injured.
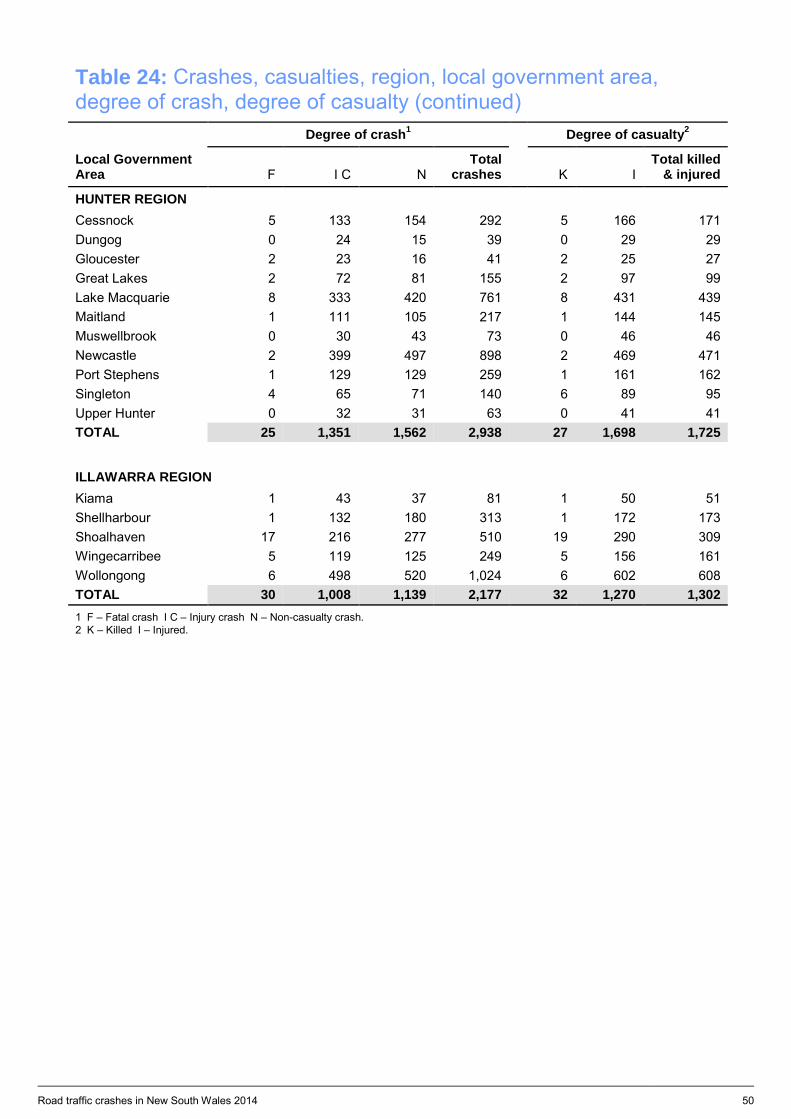
Road traffic crashes in New South Wales 2014 50
Table 24: Crashes, casualties, region, local government area, degree of crash, degree of casualty (continued)
Local Government Area
Degree of crash1 Degree of casualty2
F I C N Total
crashes K I Total killed
& injured
HUNTER REGION Cessnock 5 133 154 292 5 166 171 Dungog 0 24 15 39 0 29 29 Gloucester 2 23 16 41 2 25 27 Great Lakes 2 72 81 155 2 97 99 Lake Macquarie 8 333 420 761 8 431 439 Maitland 1 111 105 217 1 144 145 Muswellbrook 0 30 43 73 0 46 46 Newcastle 2 399 497 898 2 469 471 Port Stephens 1 129 129 259 1 161 162 Singleton 4 65 71 140 6 89 95 Upper Hunter 0 32 31 63 0 41 41 TOTAL 25 1,351 1,562 2,938 27 1,698 1,725
ILLAWARRA REGION Kiama 1 43 37 81 1 50 51 Shellharbour 1 132 180 313 1 172 173 Shoalhaven 17 216 277 510 19 290 309 Wingecarribee 5 119 125 249 5 156 161 Wollongong 6 498 520 1,024 6 602 608 TOTAL 30 1,008 1,139 2,177 32 1,270 1,302 1 F – Fatal crash I C – Injury crash N – Non-casualty crash. 2 K – Killed I – Injured.

Road traffic crashes in New South Wales 2014 51
Table 24: Crashes, casualties, region, local government area, degree of crash, degree of casualty (continued)
Local Government Area
Degree of crash1 Degree of casualty2
F I C N Total
crashes K I Total killed
& injured
NORTH COAST REGION
Ballina 4 83 107 194 9 106 115
Bellingen 1 36 28 65 1 47 48
Byron 5 110 114 229 5 145 150
Clarence Valley 4 147 138 289 5 192 197
Coffs Harbour 6 155 149 310 6 189 195
Greater Taree 1 99 137 237 2 120 122
Kempsey 3 86 66 155 3 105 108
Kyogle 0 42 21 63 0 50 50
Lismore 2 109 156 267 2 142 144
Lord Howe Island 0 3 0 3 0 3 3
Nambucca 1 40 36 77 1 60 61 Port Macquarie-Hastings 5 152 159 316 7 240 247
Richmond Valley 6 57 58 121 7 84 91
Tweed 2 221 225 448 2 295 297 TOTAL 40 1,340 1,394 2,774 50 1,778 1,828 1 F – Fatal crash I C – Injury crash N – Non-casualty crash. 2 K – Killed I – Injured.
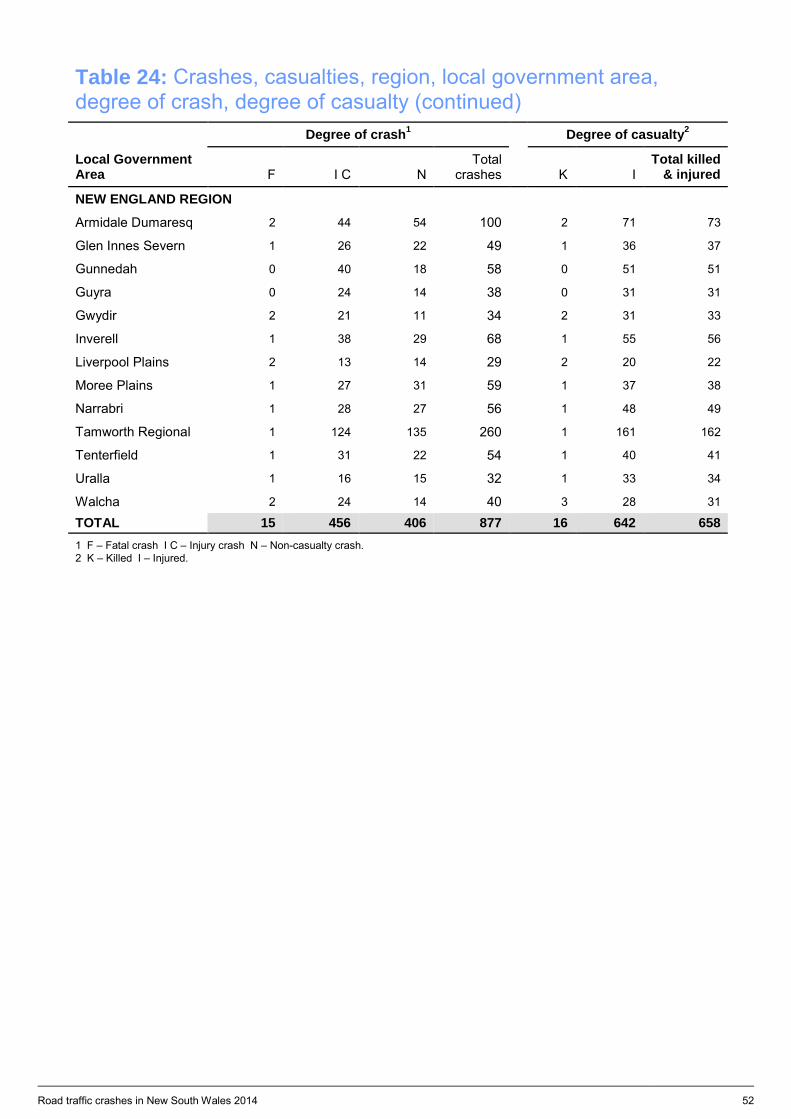
Road traffic crashes in New South Wales 2014 52
Table 24: Crashes, casualties, region, local government area, degree of crash, degree of casualty (continued)
Local Government Area
Degree of crash1 Degree of casualty2
F I C N Total
crashes K I Total killed
& injured
NEW ENGLAND REGION
Armidale Dumaresq 2 44 54 100 2 71 73
Glen Innes Severn 1 26 22 49 1 36 37
Gunnedah 0 40 18 58 0 51 51
Guyra 0 24 14 38 0 31 31
Gwydir 2 21 11 34 2 31 33
Inverell 1 38 29 68 1 55 56
Liverpool Plains 2 13 14 29 2 20 22
Moree Plains 1 27 31 59 1 37 38
Narrabri 1 28 27 56 1 48 49
Tamworth Regional 1 124 135 260 1 161 162
Tenterfield 1 31 22 54 1 40 41
Uralla 1 16 15 32 1 33 34
Walcha 2 24 14 40 3 28 31
TOTAL 15 456 406 877 16 642 658 1 F – Fatal crash I C – Injury crash N – Non-casualty crash. 2 K – Killed I – Injured.
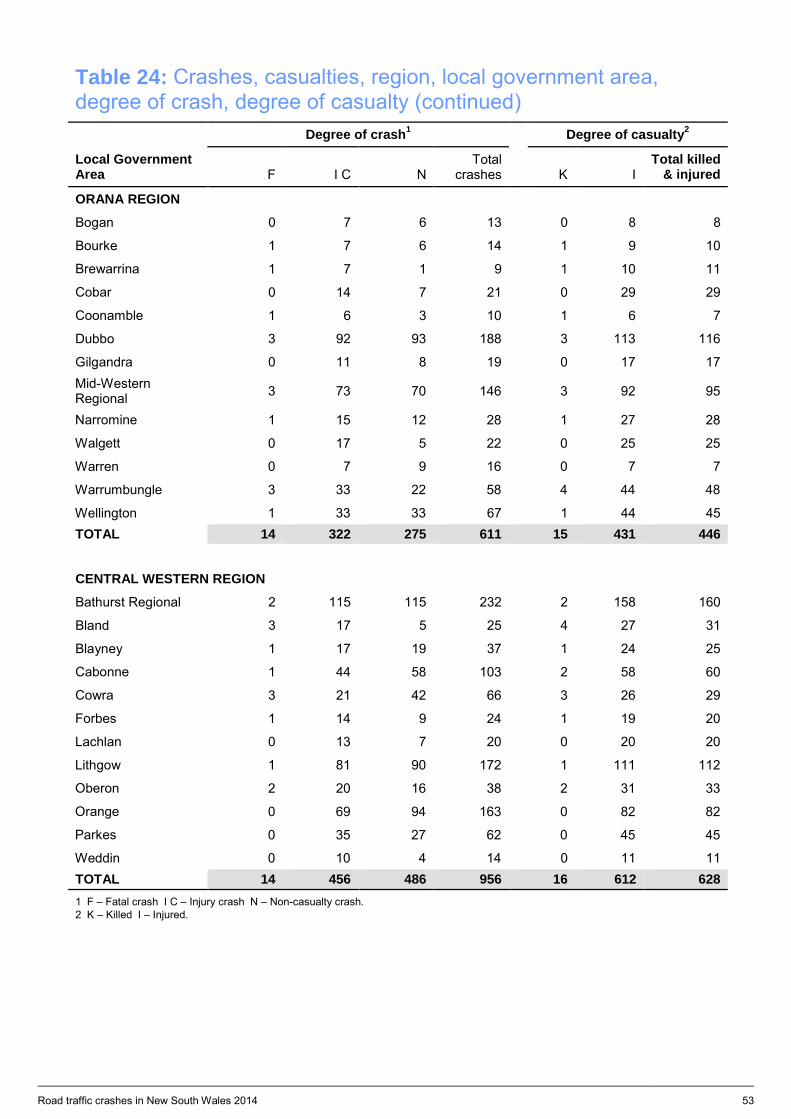
Road traffic crashes in New South Wales 2014 53
Table 24: Crashes, casualties, region, local government area, degree of crash, degree of casualty (continued)
Local Government Area
Degree of crash1 Degree of casualty2
F I C N Total
crashes K I Total killed
& injured
ORANA REGION
Bogan 0 7 6 13 0 8 8
Bourke 1 7 6 14 1 9 10
Brewarrina 1 7 1 9 1 10 11
Cobar 0 14 7 21 0 29 29
Coonamble 1 6 3 10 1 6 7
Dubbo 3 92 93 188 3 113 116
Gilgandra 0 11 8 19 0 17 17 Mid-Western Regional 3 73 70 146 3 92 95
Narromine 1 15 12 28 1 27 28
Walgett 0 17 5 22 0 25 25
Warren 0 7 9 16 0 7 7
Warrumbungle 3 33 22 58 4 44 48
Wellington 1 33 33 67 1 44 45 TOTAL 14 322 275 611 15 431 446
CENTRAL WESTERN REGION
Bathurst Regional 2 115 115 232 2 158 160
Bland 3 17 5 25 4 27 31
Blayney 1 17 19 37 1 24 25
Cabonne 1 44 58 103 2 58 60
Cowra 3 21 42 66 3 26 29
Forbes 1 14 9 24 1 19 20
Lachlan 0 13 7 20 0 20 20
Lithgow 1 81 90 172 1 111 112
Oberon 2 20 16 38 2 31 33
Orange 0 69 94 163 0 82 82
Parkes 0 35 27 62 0 45 45
Weddin 0 10 4 14 0 11 11 TOTAL 14 456 486 956 16 612 628 1 F – Fatal crash I C – Injury crash N – Non-casualty crash. 2 K – Killed I – Injured.
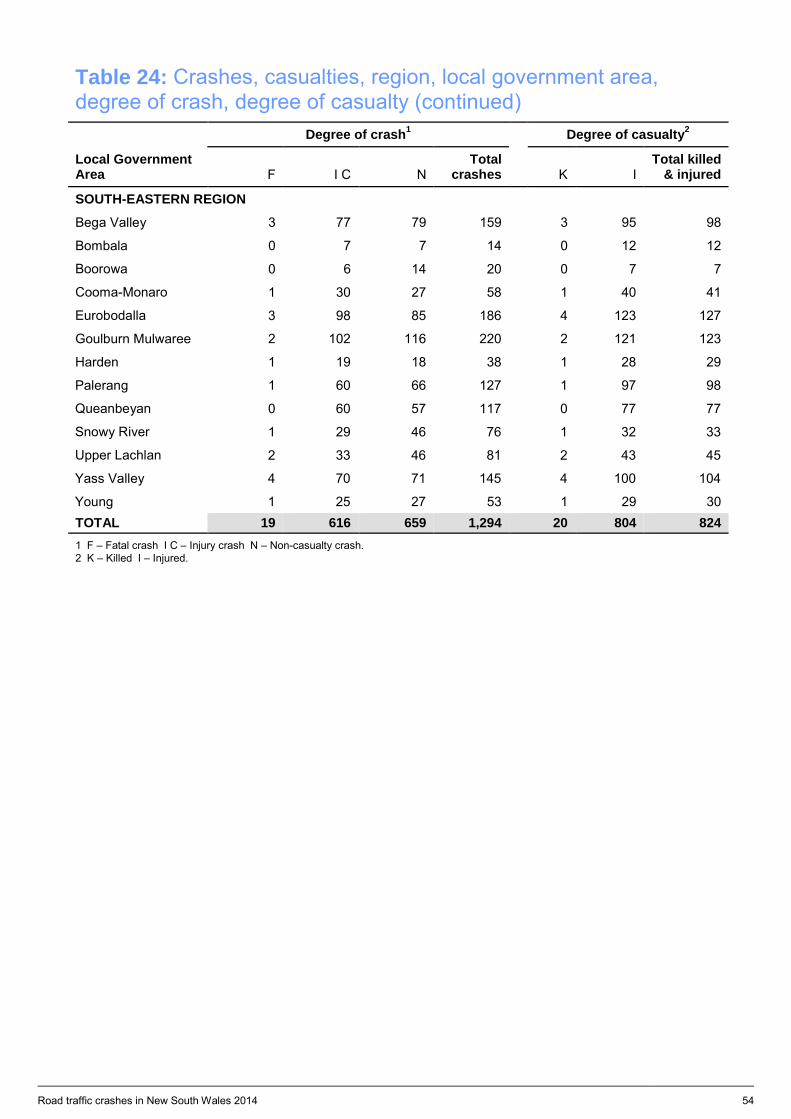
Road traffic crashes in New South Wales 2014 54
Table 24: Crashes, casualties, region, local government area, degree of crash, degree of casualty (continued)
Local Government Area
Degree of crash1 Degree of casualty2
F I C N Total
crashes K I Total killed
& injured
SOUTH-EASTERN REGION
Bega Valley 3 77 79 159 3 95 98
Bombala 0 7 7 14 0 12 12
Boorowa 0 6 14 20 0 7 7
Cooma-Monaro 1 30 27 58 1 40 41
Eurobodalla 3 98 85 186 4 123 127
Goulburn Mulwaree 2 102 116 220 2 121 123
Harden 1 19 18 38 1 28 29
Palerang 1 60 66 127 1 97 98
Queanbeyan 0 60 57 117 0 77 77
Snowy River 1 29 46 76 1 32 33
Upper Lachlan 2 33 46 81 2 43 45
Yass Valley 4 70 71 145 4 100 104
Young 1 25 27 53 1 29 30 TOTAL 19 616 659 1,294 20 804 824 1 F – Fatal crash I C – Injury crash N – Non-casualty crash. 2 K – Killed I – Injured.
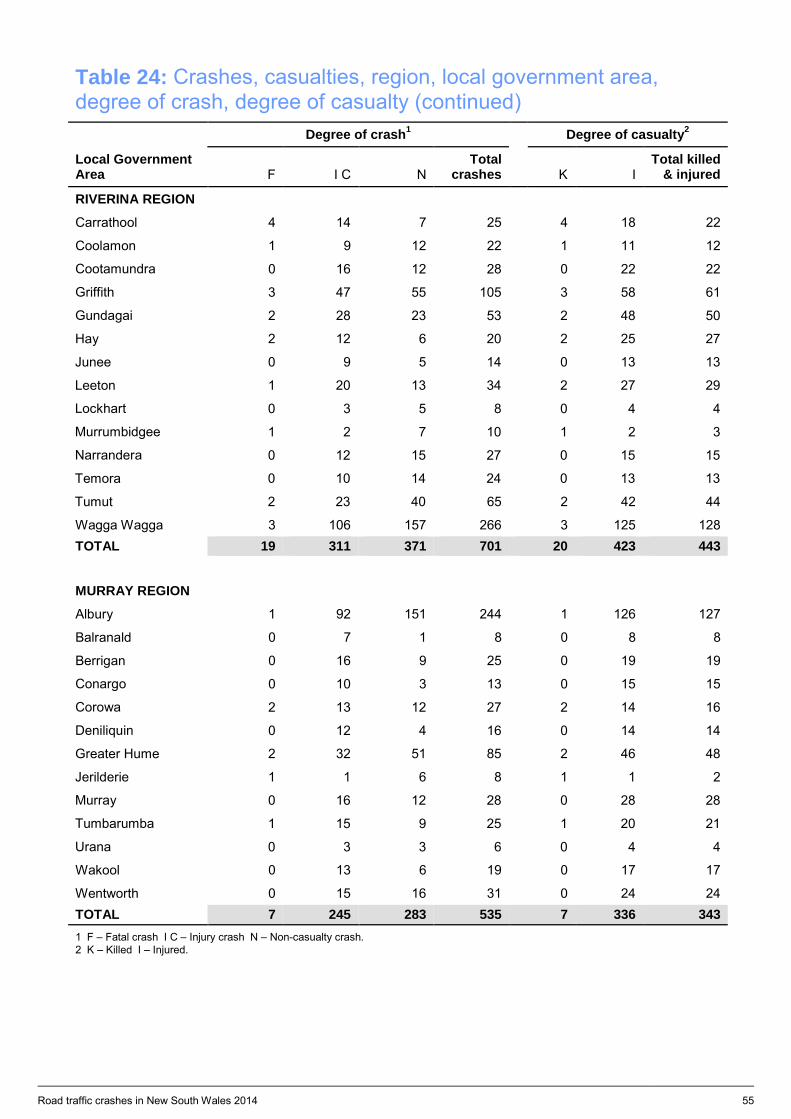
Road traffic crashes in New South Wales 2014 55
Table 24: Crashes, casualties, region, local government area, degree of crash, degree of casualty (continued)
Local Government Area
Degree of crash1 Degree of casualty2
F I C N Total
crashes K I Total killed
& injured
RIVERINA REGION
Carrathool 4 14 7 25 4 18 22
Coolamon 1 9 12 22 1 11 12
Cootamundra 0 16 12 28 0 22 22
Griffith 3 47 55 105 3 58 61
Gundagai 2 28 23 53 2 48 50
Hay 2 12 6 20 2 25 27
Junee 0 9 5 14 0 13 13
Leeton 1 20 13 34 2 27 29
Lockhart 0 3 5 8 0 4 4
Murrumbidgee 1 2 7 10 1 2 3
Narrandera 0 12 15 27 0 15 15
Temora 0 10 14 24 0 13 13
Tumut 2 23 40 65 2 42 44
Wagga Wagga 3 106 157 266 3 125 128 TOTAL 19 311 371 701 20 423 443
MURRAY REGION
Albury 1 92 151 244 1 126 127
Balranald 0 7 1 8 0 8 8
Berrigan 0 16 9 25 0 19 19
Conargo 0 10 3 13 0 15 15
Corowa 2 13 12 27 2 14 16
Deniliquin 0 12 4 16 0 14 14
Greater Hume 2 32 51 85 2 46 48
Jerilderie 1 1 6 8 1 1 2
Murray 0 16 12 28 0 28 28
Tumbarumba 1 15 9 25 1 20 21
Urana 0 3 3 6 0 4 4
Wakool 0 13 6 19 0 17 17
Wentworth 0 15 16 31 0 24 24 TOTAL 7 245 283 535 7 336 343 1 F – Fatal crash I C – Injury crash N – Non-casualty crash. 2 K – Killed I – Injured.
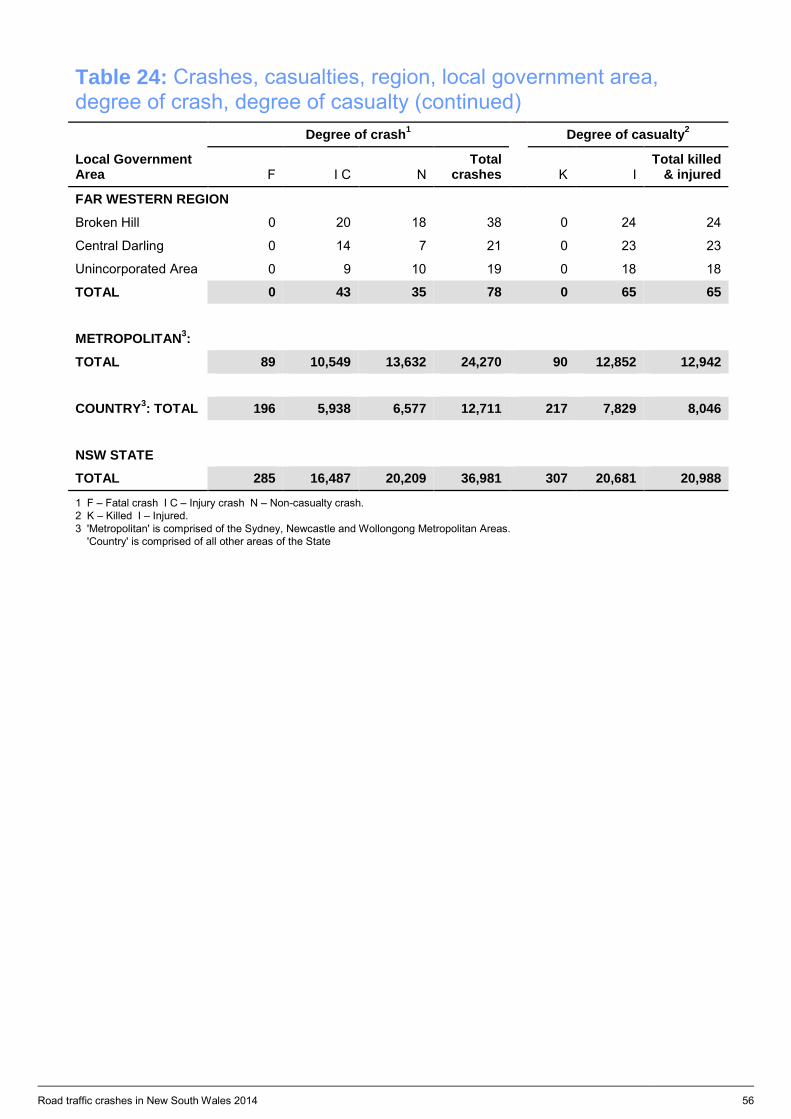
Road traffic crashes in New South Wales 2014 56
Table 24: Crashes, casualties, region, local government area, degree of crash, degree of casualty (continued)
Local Government Area
Degree of crash1 Degree of casualty2
F I C N Total
crashes K I Total killed
& injured
FAR WESTERN REGION
Broken Hill 0 20 18 38 0 24 24
Central Darling 0 14 7 21 0 23 23
Unincorporated Area 0 9 10 19 0 18 18
TOTAL 0 43 35 78 0 65 65
METROPOLITAN3:
TOTAL 89 10,549 13,632 24,270 90 12,852 12,942
COUNTRY3: TOTAL 196 5,938 6,577 12,711 217 7,829 8,046
NSW STATE
TOTAL 285 16,487 20,209 36,981 307 20,681 20,988
1 F – Fatal crash I C – Injury crash N – Non-casualty crash. 2 K – Killed I – Injured. 3 'Metropolitan' is comprised of the Sydney, Newcastle and Wollongong Metropolitan Areas. 'Country' is comprised of all other areas of the State
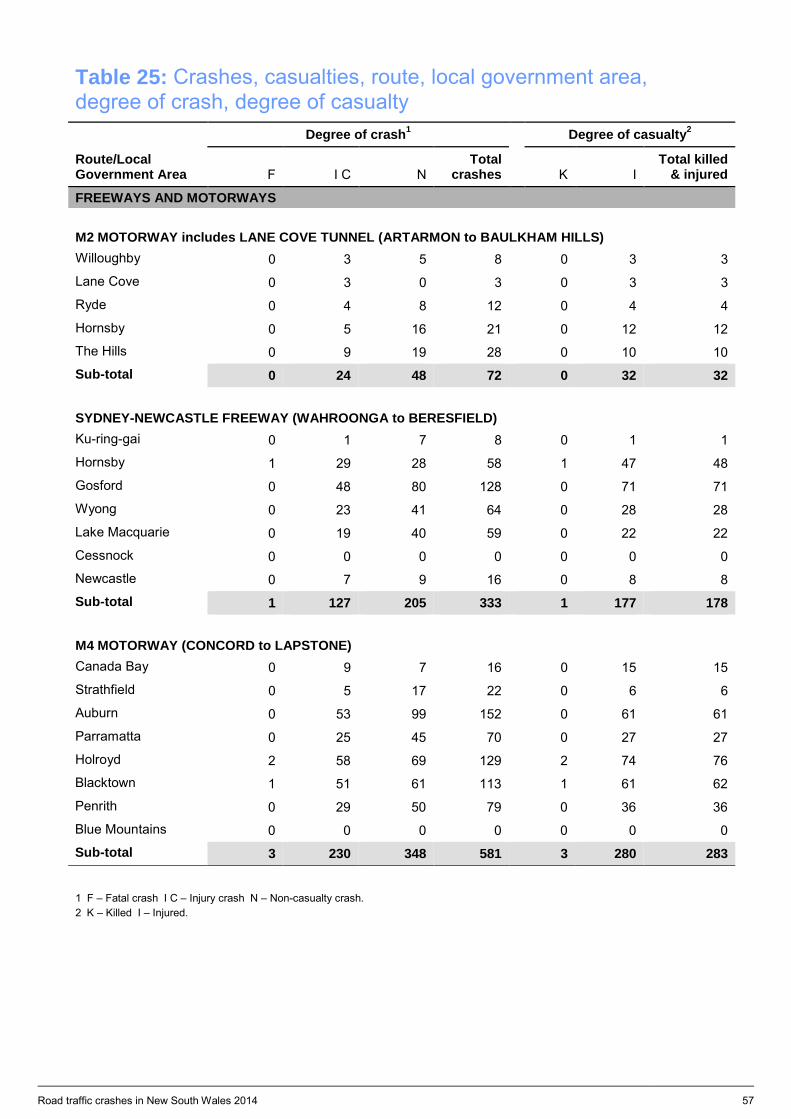
Road traffic crashes in New South Wales 2014 57
Table 25: Crashes, casualties, route, local government area, degree of crash, degree of casualty
Route/Local Government Area
Degree of crash1 Degree of casualty2
F I C N Total
crashes K I Total killed
& injured
FREEWAYS AND MOTORWAYS M2 MOTORWAY includes LANE COVE TUNNEL (ARTARMON to BAULKHAM HILLS) Willoughby 0 3 5 8 0 3 3 Lane Cove 0 3 0 3 0 3 3 Ryde 0 4 8 12 0 4 4 Hornsby 0 5 16 21 0 12 12 The Hills 0 9 19 28 0 10 10 Sub-total 0 24 48 72 0 32 32 SYDNEY-NEWCASTLE FREEWAY (WAHROONGA to BERESFIELD) Ku-ring-gai 0 1 7 8 0 1 1 Hornsby 1 29 28 58 1 47 48 Gosford 0 48 80 128 0 71 71 Wyong 0 23 41 64 0 28 28 Lake Macquarie 0 19 40 59 0 22 22 Cessnock 0 0 0 0 0 0 0 Newcastle 0 7 9 16 0 8 8 Sub-total 1 127 205 333 1 177 178 M4 MOTORWAY (CONCORD to LAPSTONE) Canada Bay 0 9 7 16 0 15 15 Strathfield 0 5 17 22 0 6 6 Auburn 0 53 99 152 0 61 61 Parramatta 0 25 45 70 0 27 27 Holroyd 2 58 69 129 2 74 76 Blacktown 1 51 61 113 1 61 62 Penrith 0 29 50 79 0 36 36 Blue Mountains 0 0 0 0 0 0 0 Sub-total 3 230 348 581 3 280 283 1 F – Fatal crash I C – Injury crash N – Non-casualty crash. 2 K – Killed I – Injured.
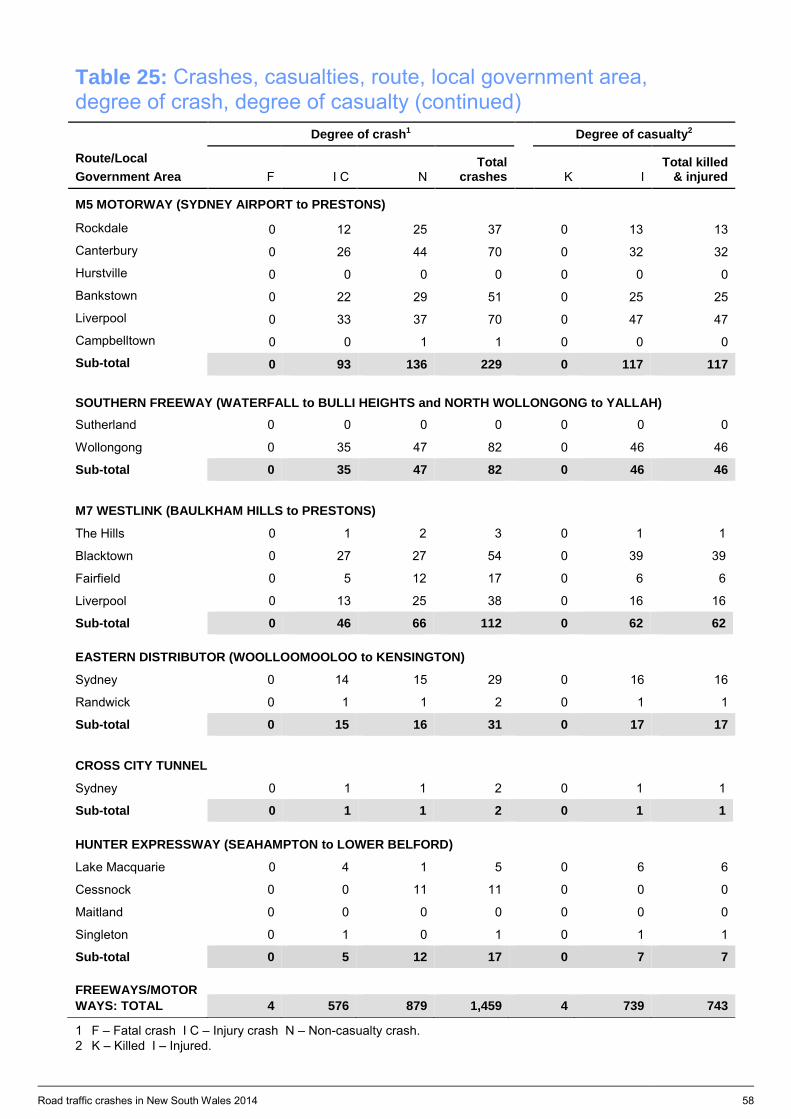
Road traffic crashes in New South Wales 2014 58
Table 25: Crashes, casualties, route, local government area, degree of crash, degree of casualty (continued) Degree of crash1 Degree of casualty2
Route/Local Government Area F I C N
Total crashes K I
Total killed & injured
M5 MOTORWAY (SYDNEY AIRPORT to PRESTONS)
Rockdale 0 12 25 37 0 13 13
Canterbury 0 26 44 70 0 32 32
Hurstville 0 0 0 0 0 0 0
Bankstown 0 22 29 51 0 25 25
Liverpool 0 33 37 70 0 47 47
Campbelltown 0 0 1 1 0 0 0 Sub-total 0 93 136 229 0 117 117 SOUTHERN FREEWAY (WATERFALL to BULLI HEIGHTS and NORTH WOLLONGONG to YALLAH) Sutherland 0 0 0 0 0 0 0
Wollongong 0 35 47 82 0 46 46
Sub-total 0 35 47 82 0 46 46
M7 WESTLINK (BAULKHAM HILLS to PRESTONS)
The Hills 0 1 2 3 0 1 1
Blacktown 0 27 27 54 0 39 39
Fairfield 0 5 12 17 0 6 6
Liverpool 0 13 25 38 0 16 16
Sub-total 0 46 66 112 0 62 62
EASTERN DISTRIBUTOR (WOOLLOOMOOLOO to KENSINGTON)
Sydney 0 14 15 29 0 16 16
Randwick 0 1 1 2 0 1 1
Sub-total 0 15 16 31 0 17 17
CROSS CITY TUNNEL
Sydney 0 1 1 2 0 1 1
Sub-total 0 1 1 2 0 1 1
HUNTER EXPRESSWAY (SEAHAMPTON to LOWER BELFORD)
Lake Macquarie 0 4 1 5 0 6 6
Cessnock 0 0 11 11 0 0 0
Maitland 0 0 0 0 0 0 0
Singleton 0 1 0 1 0 1 1
Sub-total 0 5 12 17 0 7 7 FREEWAYS/MOTOR
WAYS: TOTAL 4 576 879 1,459 4 739 743
1 F – Fatal crash I C – Injury crash N – Non-casualty crash. 2 K – Killed I – Injured.
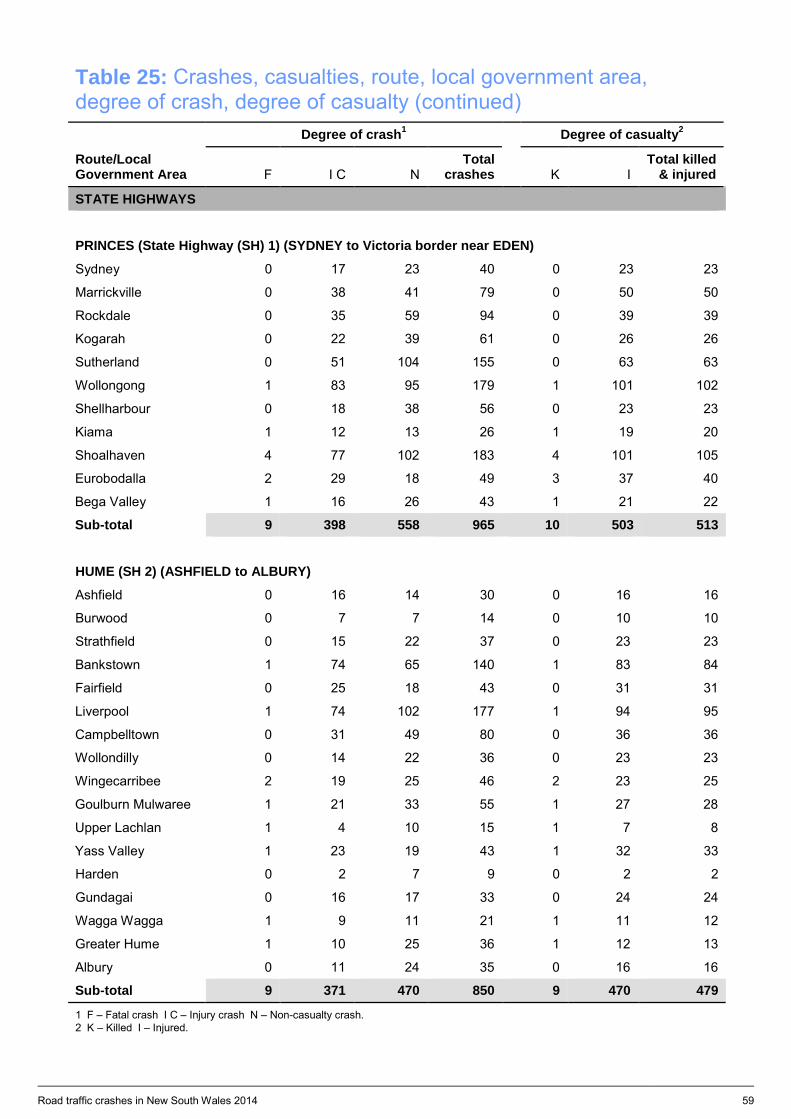
Road traffic crashes in New South Wales 2014 59
Table 25: Crashes, casualties, route, local government area, degree of crash, degree of casualty (continued)
Route/Local Government Area
Degree of crash1 Degree of casualty2
F I C N Total
crashes K I Total killed
& injured
STATE HIGHWAYS
PRINCES (State Highway (SH) 1) (SYDNEY to Victoria border near EDEN)
Sydney 0 17 23 40 0 23 23
Marrickville 0 38 41 79 0 50 50
Rockdale 0 35 59 94 0 39 39
Kogarah 0 22 39 61 0 26 26
Sutherland 0 51 104 155 0 63 63
Wollongong 1 83 95 179 1 101 102
Shellharbour 0 18 38 56 0 23 23
Kiama 1 12 13 26 1 19 20
Shoalhaven 4 77 102 183 4 101 105
Eurobodalla 2 29 18 49 3 37 40
Bega Valley 1 16 26 43 1 21 22
Sub-total 9 398 558 965 10 503 513
HUME (SH 2) (ASHFIELD to ALBURY)
Ashfield 0 16 14 30 0 16 16
Burwood 0 7 7 14 0 10 10
Strathfield 0 15 22 37 0 23 23
Bankstown 1 74 65 140 1 83 84
Fairfield 0 25 18 43 0 31 31
Liverpool 1 74 102 177 1 94 95
Campbelltown 0 31 49 80 0 36 36
Wollondilly 0 14 22 36 0 23 23
Wingecarribee 2 19 25 46 2 23 25
Goulburn Mulwaree 1 21 33 55 1 27 28
Upper Lachlan 1 4 10 15 1 7 8
Yass Valley 1 23 19 43 1 32 33
Harden 0 2 7 9 0 2 2
Gundagai 0 16 17 33 0 24 24
Wagga Wagga 1 9 11 21 1 11 12
Greater Hume 1 10 25 36 1 12 13
Albury 0 11 24 35 0 16 16
Sub-total 9 371 470 850 9 470 479
1 F – Fatal crash I C – Injury crash N – Non-casualty crash. 2 K – Killed I – Injured.
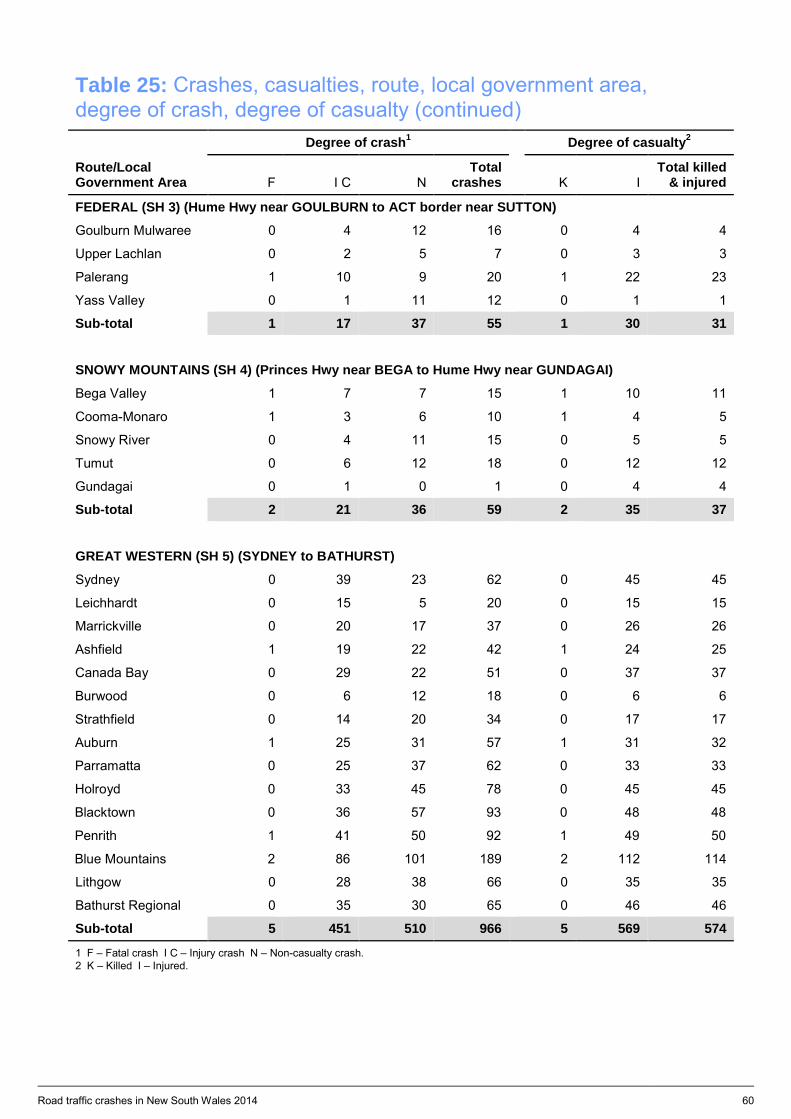
Road traffic crashes in New South Wales 2014 60
Table 25: Crashes, casualties, route, local government area, degree of crash, degree of casualty (continued)
Route/Local Government Area
Degree of crash1 Degree of casualty2
F I C N Total
crashes K I Total killed
& injured
FEDERAL (SH 3) (Hume Hwy near GOULBURN to ACT border near SUTTON)
Goulburn Mulwaree 0 4 12 16 0 4 4
Upper Lachlan 0 2 5 7 0 3 3
Palerang 1 10 9 20 1 22 23
Yass Valley 0 1 11 12 0 1 1
Sub-total 1 17 37 55 1 30 31
SNOWY MOUNTAINS (SH 4) (Princes Hwy near BEGA to Hume Hwy near GUNDAGAI)
Bega Valley 1 7 7 15 1 10 11
Cooma-Monaro 1 3 6 10 1 4 5
Snowy River 0 4 11 15 0 5 5
Tumut 0 6 12 18 0 12 12
Gundagai 0 1 0 1 0 4 4
Sub-total 2 21 36 59 2 35 37
GREAT WESTERN (SH 5) (SYDNEY to BATHURST)
Sydney 0 39 23 62 0 45 45
Leichhardt 0 15 5 20 0 15 15
Marrickville 0 20 17 37 0 26 26
Ashfield 1 19 22 42 1 24 25
Canada Bay 0 29 22 51 0 37 37
Burwood 0 6 12 18 0 6 6
Strathfield 0 14 20 34 0 17 17
Auburn 1 25 31 57 1 31 32
Parramatta 0 25 37 62 0 33 33
Holroyd 0 33 45 78 0 45 45
Blacktown 0 36 57 93 0 48 48
Penrith 1 41 50 92 1 49 50
Blue Mountains 2 86 101 189 2 112 114
Lithgow 0 28 38 66 0 35 35
Bathurst Regional 0 35 30 65 0 46 46
Sub-total 5 451 510 966 5 569 574
1 F – Fatal crash I C – Injury crash N – Non-casualty crash. 2 K – Killed I – Injured.
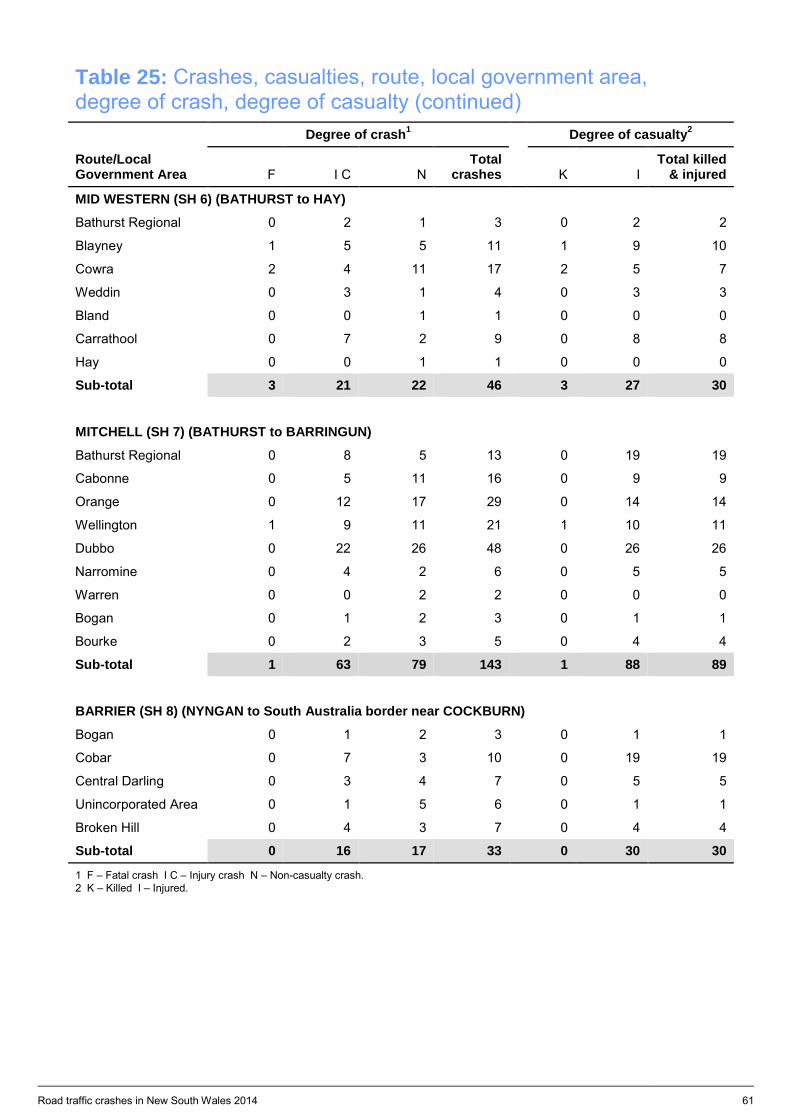
Road traffic crashes in New South Wales 2014 61
Table 25: Crashes, casualties, route, local government area, degree of crash, degree of casualty (continued)
Route/Local Government Area
Degree of crash1 Degree of casualty2
F I C N Total
crashes K I Total killed
& injured
MID WESTERN (SH 6) (BATHURST to HAY)
Bathurst Regional 0 2 1 3 0 2 2
Blayney 1 5 5 11 1 9 10
Cowra 2 4 11 17 2 5 7
Weddin 0 3 1 4 0 3 3
Bland 0 0 1 1 0 0 0
Carrathool 0 7 2 9 0 8 8
Hay 0 0 1 1 0 0 0
Sub-total 3 21 22 46 3 27 30
MITCHELL (SH 7) (BATHURST to BARRINGUN)
Bathurst Regional 0 8 5 13 0 19 19
Cabonne 0 5 11 16 0 9 9
Orange 0 12 17 29 0 14 14
Wellington 1 9 11 21 1 10 11
Dubbo 0 22 26 48 0 26 26
Narromine 0 4 2 6 0 5 5
Warren 0 0 2 2 0 0 0
Bogan 0 1 2 3 0 1 1
Bourke 0 2 3 5 0 4 4
Sub-total 1 63 79 143 1 88 89
BARRIER (SH 8) (NYNGAN to South Australia border near COCKBURN)
Bogan 0 1 2 3 0 1 1
Cobar 0 7 3 10 0 19 19
Central Darling 0 3 4 7 0 5 5
Unincorporated Area 0 1 5 6 0 1 1
Broken Hill 0 4 3 7 0 4 4
Sub-total 0 16 17 33 0 30 30
1 F – Fatal crash I C – Injury crash N – Non-casualty crash. 2 K – Killed I – Injured.
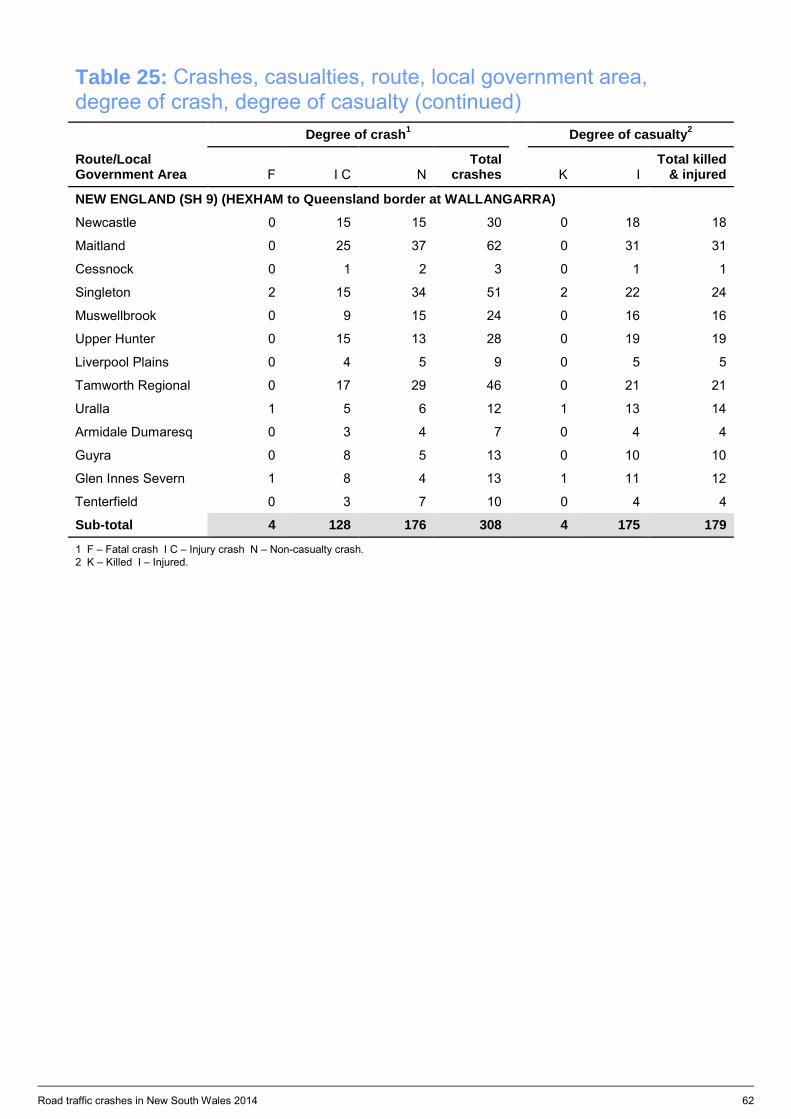
Road traffic crashes in New South Wales 2014 62
Table 25: Crashes, casualties, route, local government area, degree of crash, degree of casualty (continued)
Route/Local Government Area
Degree of crash1 Degree of casualty2
F I C N Total
crashes K I Total killed
& injured
NEW ENGLAND (SH 9) (HEXHAM to Queensland border at WALLANGARRA)
Newcastle 0 15 15 30 0 18 18
Maitland 0 25 37 62 0 31 31
Cessnock 0 1 2 3 0 1 1
Singleton 2 15 34 51 2 22 24
Muswellbrook 0 9 15 24 0 16 16
Upper Hunter 0 15 13 28 0 19 19
Liverpool Plains 0 4 5 9 0 5 5
Tamworth Regional 0 17 29 46 0 21 21
Uralla 1 5 6 12 1 13 14
Armidale Dumaresq 0 3 4 7 0 4 4
Guyra 0 8 5 13 0 10 10
Glen Innes Severn 1 8 4 13 1 11 12
Tenterfield 0 3 7 10 0 4 4
Sub-total 4 128 176 308 4 175 179
1 F – Fatal crash I C – Injury crash N – Non-casualty crash. 2 K – Killed I – Injured.
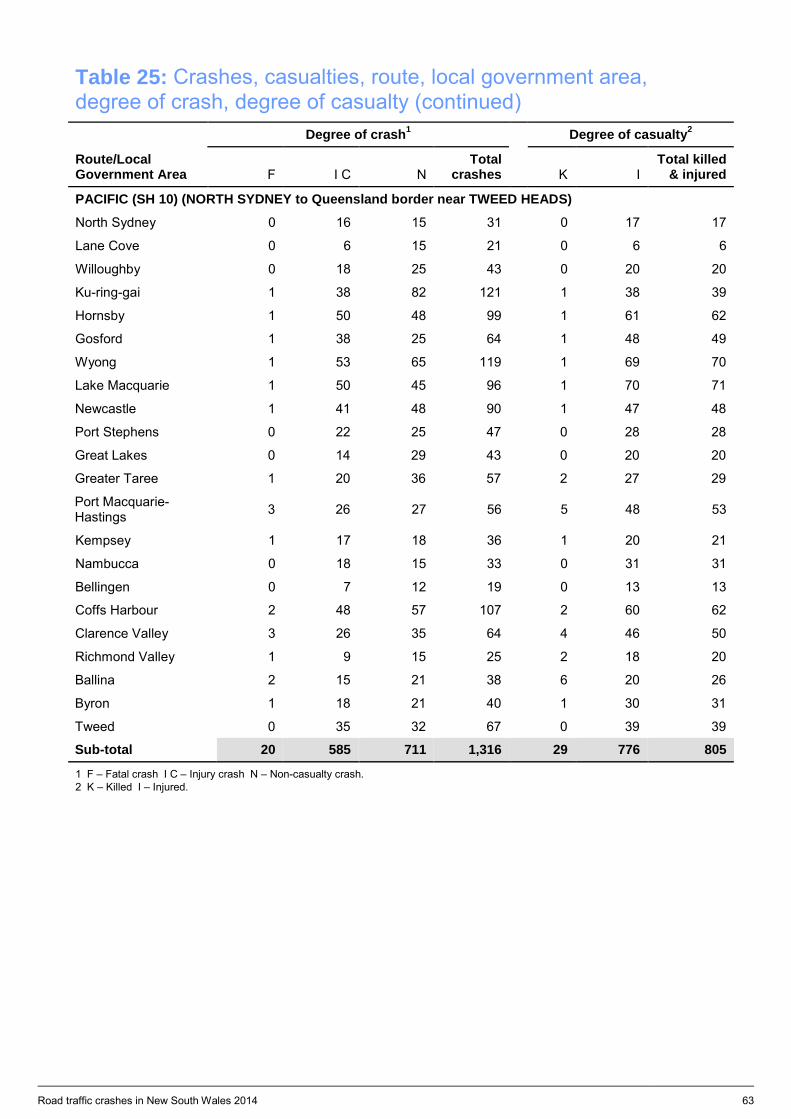
Road traffic crashes in New South Wales 2014 63
Table 25: Crashes, casualties, route, local government area, degree of crash, degree of casualty (continued)
Route/Local Government Area
Degree of crash1 Degree of casualty2
F I C N Total
crashes K I Total killed
& injured
PACIFIC (SH 10) (NORTH SYDNEY to Queensland border near TWEED HEADS)
North Sydney 0 16 15 31 0 17 17
Lane Cove 0 6 15 21 0 6 6
Willoughby 0 18 25 43 0 20 20
Ku-ring-gai 1 38 82 121 1 38 39
Hornsby 1 50 48 99 1 61 62
Gosford 1 38 25 64 1 48 49
Wyong 1 53 65 119 1 69 70
Lake Macquarie 1 50 45 96 1 70 71
Newcastle 1 41 48 90 1 47 48
Port Stephens 0 22 25 47 0 28 28
Great Lakes 0 14 29 43 0 20 20
Greater Taree 1 20 36 57 2 27 29
Port Macquarie-Hastings 3 26 27 56 5 48 53
Kempsey 1 17 18 36 1 20 21
Nambucca 0 18 15 33 0 31 31
Bellingen 0 7 12 19 0 13 13
Coffs Harbour 2 48 57 107 2 60 62
Clarence Valley 3 26 35 64 4 46 50
Richmond Valley 1 9 15 25 2 18 20
Ballina 2 15 21 38 6 20 26
Byron 1 18 21 40 1 30 31
Tweed 0 35 32 67 0 39 39
Sub-total 20 585 711 1,316 29 776 805
1 F – Fatal crash I C – Injury crash N – Non-casualty crash. 2 K – Killed I – Injured.
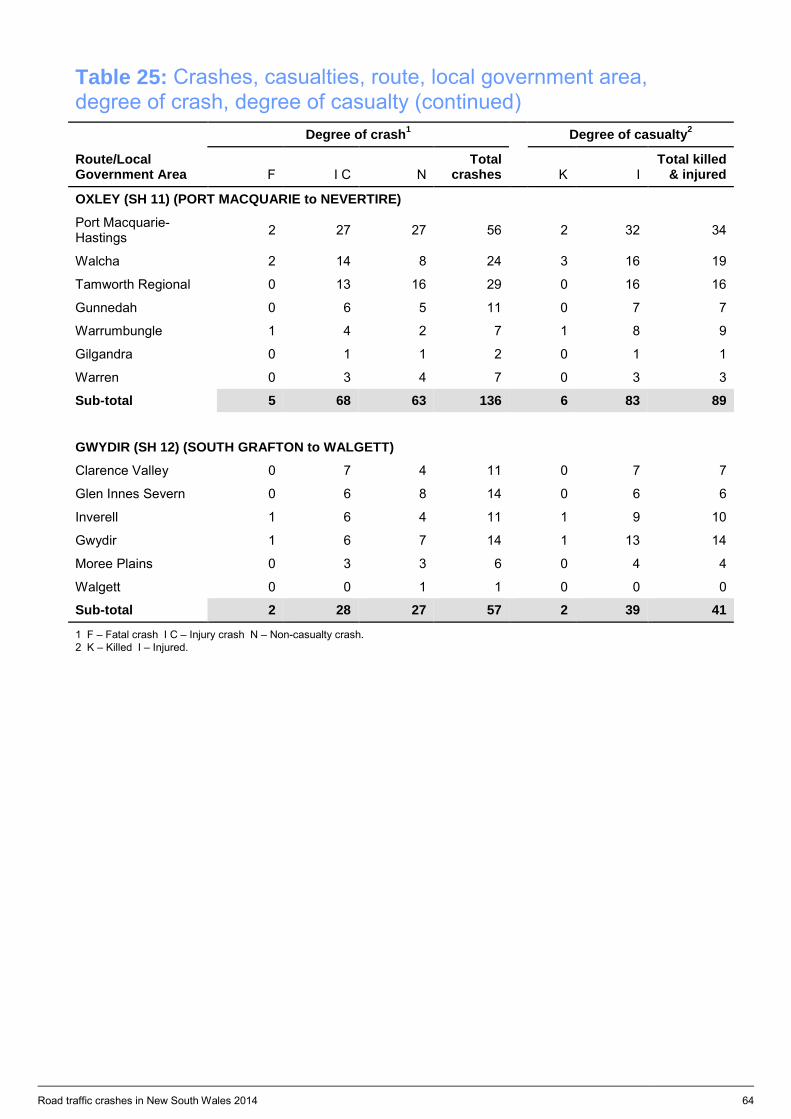
Road traffic crashes in New South Wales 2014 64
Table 25: Crashes, casualties, route, local government area, degree of crash, degree of casualty (continued)
Route/Local Government Area
Degree of crash1 Degree of casualty2
F I C N Total
crashes K I Total killed
& injured
OXLEY (SH 11) (PORT MACQUARIE to NEVERTIRE)
Port Macquarie-Hastings 2 27 27 56 2 32 34
Walcha 2 14 8 24 3 16 19
Tamworth Regional 0 13 16 29 0 16 16
Gunnedah 0 6 5 11 0 7 7
Warrumbungle 1 4 2 7 1 8 9
Gilgandra 0 1 1 2 0 1 1
Warren 0 3 4 7 0 3 3
Sub-total 5 68 63 136 6 83 89
GWYDIR (SH 12) (SOUTH GRAFTON to WALGETT)
Clarence Valley 0 7 4 11 0 7 7
Glen Innes Severn 0 6 8 14 0 6 6
Inverell 1 6 4 11 1 9 10
Gwydir 1 6 7 14 1 13 14
Moree Plains 0 3 3 6 0 4 4
Walgett 0 0 1 1 0 0 0
Sub-total 2 28 27 57 2 39 41
1 F – Fatal crash I C – Injury crash N – Non-casualty crash. 2 K – Killed I – Injured.
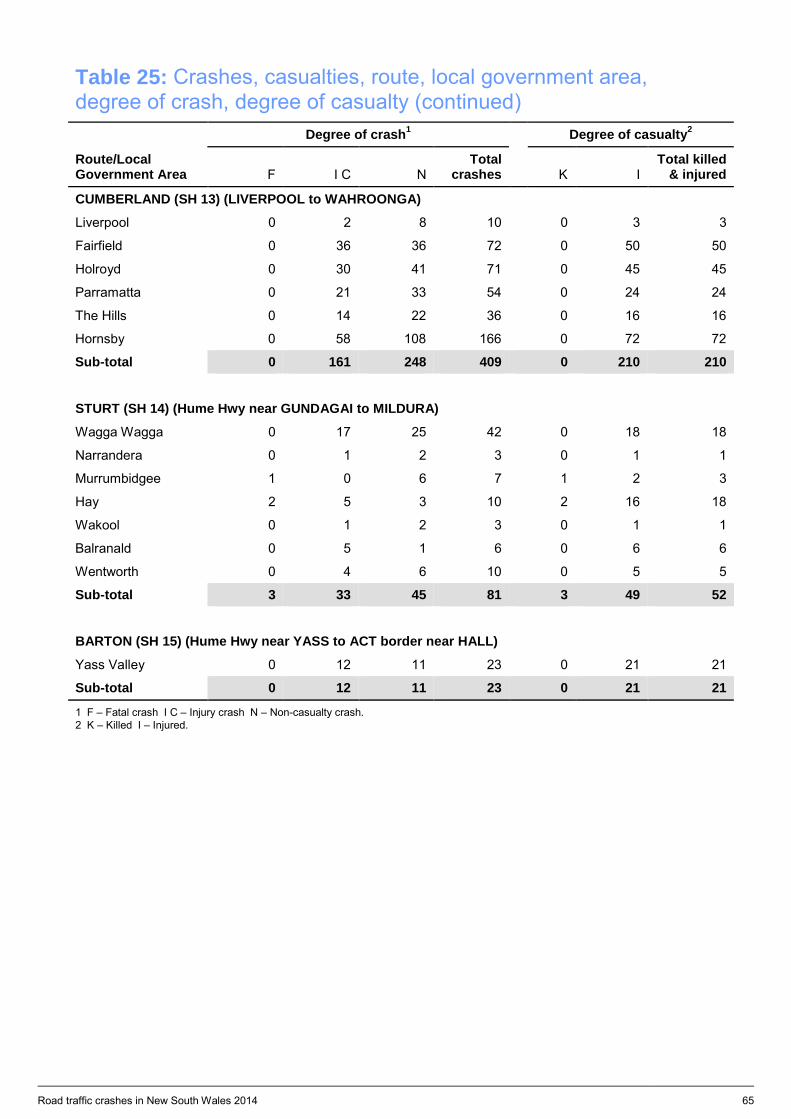
Road traffic crashes in New South Wales 2014 65
Table 25: Crashes, casualties, route, local government area, degree of crash, degree of casualty (continued)
Route/Local Government Area
Degree of crash1 Degree of casualty2
F I C N Total
crashes K I Total killed
& injured
CUMBERLAND (SH 13) (LIVERPOOL to WAHROONGA)
Liverpool 0 2 8 10 0 3 3
Fairfield 0 36 36 72 0 50 50
Holroyd 0 30 41 71 0 45 45
Parramatta 0 21 33 54 0 24 24
The Hills 0 14 22 36 0 16 16
Hornsby 0 58 108 166 0 72 72
Sub-total 0 161 248 409 0 210 210
STURT (SH 14) (Hume Hwy near GUNDAGAI to MILDURA)
Wagga Wagga 0 17 25 42 0 18 18
Narrandera 0 1 2 3 0 1 1
Murrumbidgee 1 0 6 7 1 2 3
Hay 2 5 3 10 2 16 18
Wakool 0 1 2 3 0 1 1
Balranald 0 5 1 6 0 6 6
Wentworth 0 4 6 10 0 5 5
Sub-total 3 33 45 81 3 49 52
BARTON (SH 15) (Hume Hwy near YASS to ACT border near HALL)
Yass Valley 0 12 11 23 0 21 21
Sub-total 0 12 11 23 0 21 21
1 F – Fatal crash I C – Injury crash N – Non-casualty crash. 2 K – Killed I – Injured.
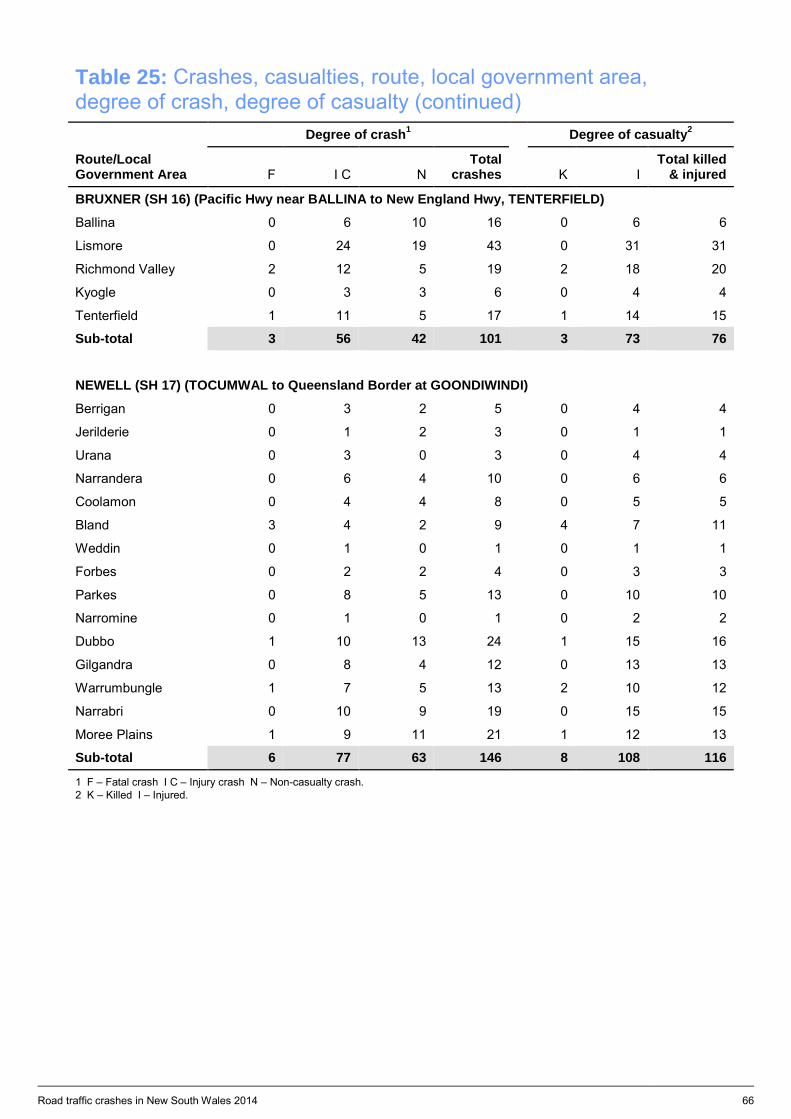
Road traffic crashes in New South Wales 2014 66
Table 25: Crashes, casualties, route, local government area, degree of crash, degree of casualty (continued)
Route/Local Government Area
Degree of crash1 Degree of casualty2
F I C N Total
crashes K I Total killed
& injured
BRUXNER (SH 16) (Pacific Hwy near BALLINA to New England Hwy, TENTERFIELD)
Ballina 0 6 10 16 0 6 6
Lismore 0 24 19 43 0 31 31
Richmond Valley 2 12 5 19 2 18 20
Kyogle 0 3 3 6 0 4 4
Tenterfield 1 11 5 17 1 14 15
Sub-total 3 56 42 101 3 73 76
NEWELL (SH 17) (TOCUMWAL to Queensland Border at GOONDIWINDI)
Berrigan 0 3 2 5 0 4 4
Jerilderie 0 1 2 3 0 1 1
Urana 0 3 0 3 0 4 4
Narrandera 0 6 4 10 0 6 6
Coolamon 0 4 4 8 0 5 5
Bland 3 4 2 9 4 7 11
Weddin 0 1 0 1 0 1 1
Forbes 0 2 2 4 0 3 3
Parkes 0 8 5 13 0 10 10
Narromine 0 1 0 1 0 2 2
Dubbo 1 10 13 24 1 15 16
Gilgandra 0 8 4 12 0 13 13
Warrumbungle 1 7 5 13 2 10 12
Narrabri 0 10 9 19 0 15 15
Moree Plains 1 9 11 21 1 12 13
Sub-total 6 77 63 146 8 108 116
1 F – Fatal crash I C – Injury crash N – Non-casualty crash. 2 K – Killed I – Injured.
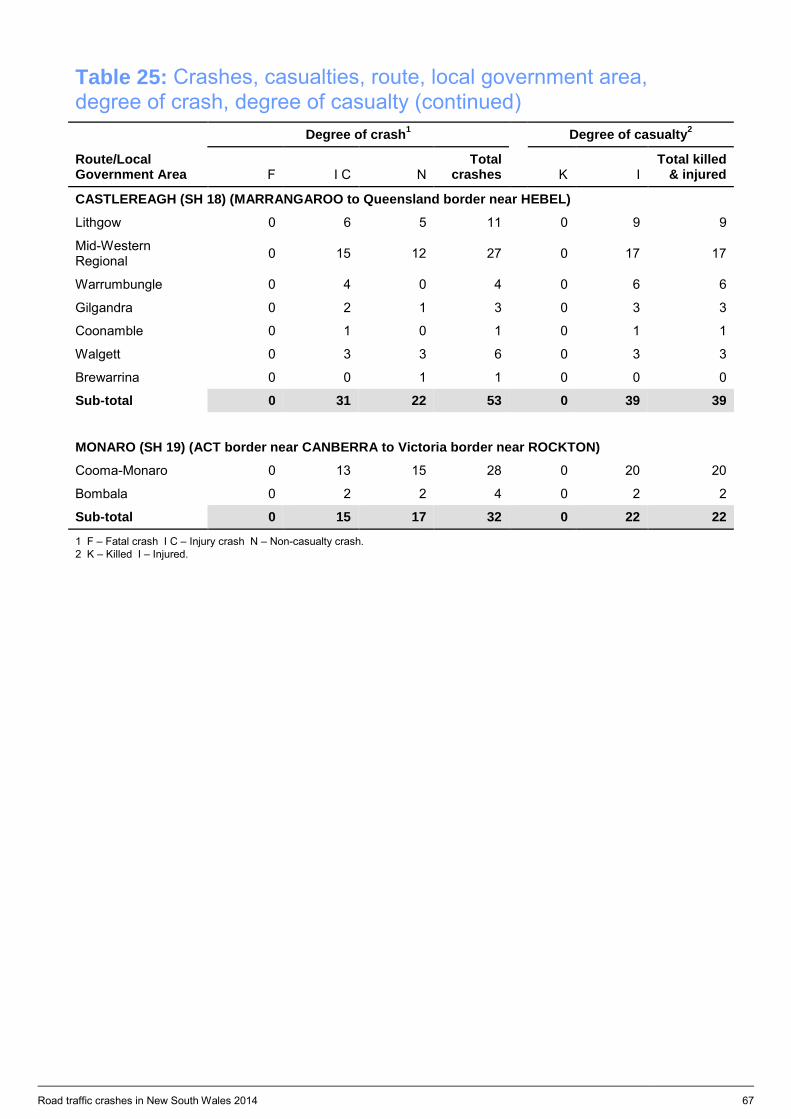
Road traffic crashes in New South Wales 2014 67
Table 25: Crashes, casualties, route, local government area, degree of crash, degree of casualty (continued)
Route/Local Government Area
Degree of crash1 Degree of casualty2
F I C N Total
crashes K I Total killed
& injured
CASTLEREAGH (SH 18) (MARRANGAROO to Queensland border near HEBEL)
Lithgow 0 6 5 11 0 9 9
Mid-Western Regional 0 15 12 27 0 17 17
Warrumbungle 0 4 0 4 0 6 6
Gilgandra 0 2 1 3 0 3 3
Coonamble 0 1 0 1 0 1 1
Walgett 0 3 3 6 0 3 3
Brewarrina 0 0 1 1 0 0 0
Sub-total 0 31 22 53 0 39 39
MONARO (SH 19) (ACT border near CANBERRA to Victoria border near ROCKTON)
Cooma-Monaro 0 13 15 28 0 20 20
Bombala 0 2 2 4 0 2 2
Sub-total 0 15 17 32 0 22 22
1 F – Fatal crash I C – Injury crash N – Non-casualty crash. 2 K – Killed I – Injured.
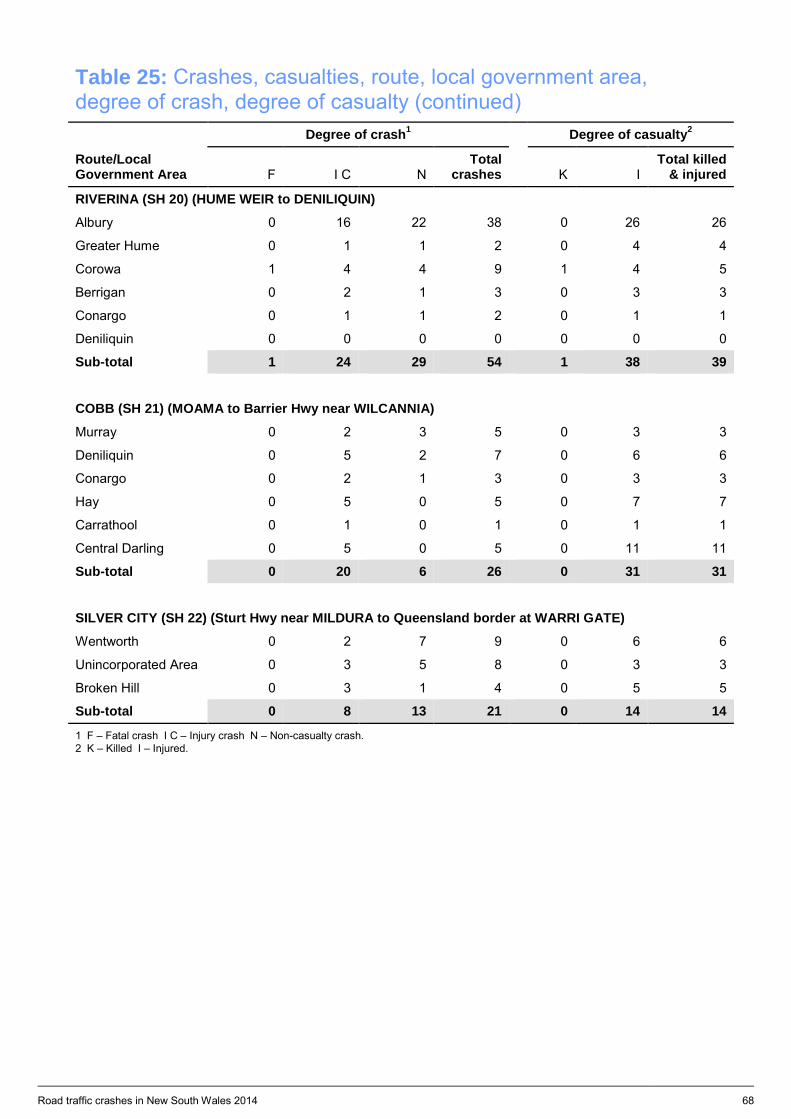
Road traffic crashes in New South Wales 2014 68
Table 25: Crashes, casualties, route, local government area, degree of crash, degree of casualty (continued)
Route/Local Government Area
Degree of crash1 Degree of casualty2
F I C N Total
crashes K I Total killed
& injured
RIVERINA (SH 20) (HUME WEIR to DENILIQUIN)
Albury 0 16 22 38 0 26 26
Greater Hume 0 1 1 2 0 4 4
Corowa 1 4 4 9 1 4 5
Berrigan 0 2 1 3 0 3 3
Conargo 0 1 1 2 0 1 1
Deniliquin 0 0 0 0 0 0 0
Sub-total 1 24 29 54 1 38 39
COBB (SH 21) (MOAMA to Barrier Hwy near WILCANNIA)
Murray 0 2 3 5 0 3 3
Deniliquin 0 5 2 7 0 6 6
Conargo 0 2 1 3 0 3 3
Hay 0 5 0 5 0 7 7
Carrathool 0 1 0 1 0 1 1
Central Darling 0 5 0 5 0 11 11
Sub-total 0 20 6 26 0 31 31
SILVER CITY (SH 22) (Sturt Hwy near MILDURA to Queensland border at WARRI GATE)
Wentworth 0 2 7 9 0 6 6
Unincorporated Area 0 3 5 8 0 3 3
Broken Hill 0 3 1 4 0 5 5
Sub-total 0 8 13 21 0 14 14
1 F – Fatal crash I C – Injury crash N – Non-casualty crash. 2 K – Killed I – Injured.
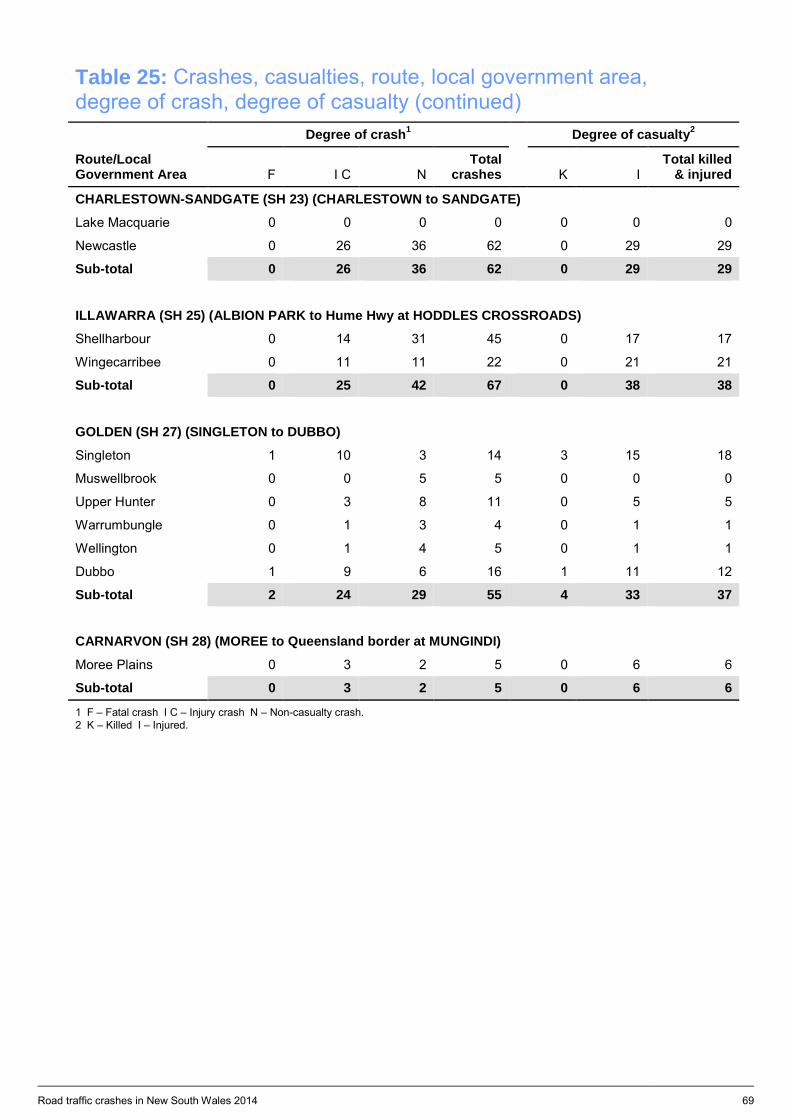
Road traffic crashes in New South Wales 2014 69
Table 25: Crashes, casualties, route, local government area, degree of crash, degree of casualty (continued)
Route/Local Government Area
Degree of crash1 Degree of casualty2
F I C N Total
crashes K I Total killed
& injured
CHARLESTOWN-SANDGATE (SH 23) (CHARLESTOWN to SANDGATE)
Lake Macquarie 0 0 0 0 0 0 0
Newcastle 0 26 36 62 0 29 29
Sub-total 0 26 36 62 0 29 29
ILLAWARRA (SH 25) (ALBION PARK to Hume Hwy at HODDLES CROSSROADS)
Shellharbour 0 14 31 45 0 17 17
Wingecarribee 0 11 11 22 0 21 21
Sub-total 0 25 42 67 0 38 38
GOLDEN (SH 27) (SINGLETON to DUBBO)
Singleton 1 10 3 14 3 15 18
Muswellbrook 0 0 5 5 0 0 0
Upper Hunter 0 3 8 11 0 5 5
Warrumbungle 0 1 3 4 0 1 1
Wellington 0 1 4 5 0 1 1
Dubbo 1 9 6 16 1 11 12
Sub-total 2 24 29 55 4 33 37
CARNARVON (SH 28) (MOREE to Queensland border at MUNGINDI)
Moree Plains 0 3 2 5 0 6 6
Sub-total 0 3 2 5 0 6 6
1 F – Fatal crash I C – Injury crash N – Non-casualty crash. 2 K – Killed I – Injured.
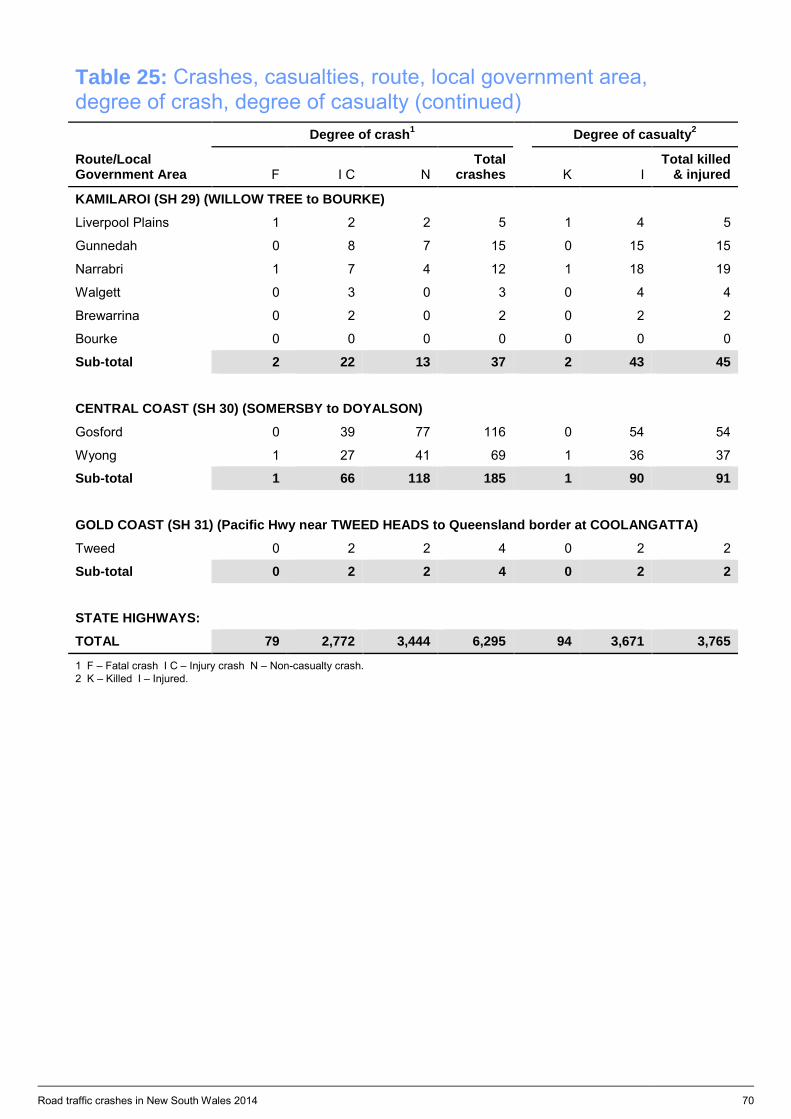
Road traffic crashes in New South Wales 2014 70
Table 25: Crashes, casualties, route, local government area, degree of crash, degree of casualty (continued)
Route/Local Government Area
Degree of crash1 Degree of casualty2
F I C N Total
crashes K I Total killed
& injured
KAMILAROI (SH 29) (WILLOW TREE to BOURKE)
Liverpool Plains 1 2 2 5 1 4 5
Gunnedah 0 8 7 15 0 15 15
Narrabri 1 7 4 12 1 18 19
Walgett 0 3 0 3 0 4 4
Brewarrina 0 2 0 2 0 2 2
Bourke 0 0 0 0 0 0 0
Sub-total 2 22 13 37 2 43 45
CENTRAL COAST (SH 30) (SOMERSBY to DOYALSON)
Gosford 0 39 77 116 0 54 54
Wyong 1 27 41 69 1 36 37
Sub-total 1 66 118 185 1 90 91
GOLD COAST (SH 31) (Pacific Hwy near TWEED HEADS to Queensland border at COOLANGATTA)
Tweed 0 2 2 4 0 2 2
Sub-total 0 2 2 4 0 2 2
STATE HIGHWAYS:
TOTAL 79 2,772 3,444 6,295 94 3,671 3,765
1 F – Fatal crash I C – Injury crash N – Non-casualty crash. 2 K – Killed I – Injured.
Casualties in 2014
— Road user class
— Age and sex distribution
— Safety devices
— Alcohol and controller casualties
— Alcohol, speeding and fatigue

Road traffic crashes in New South Wales 2014 72
This page intentionally left blank.
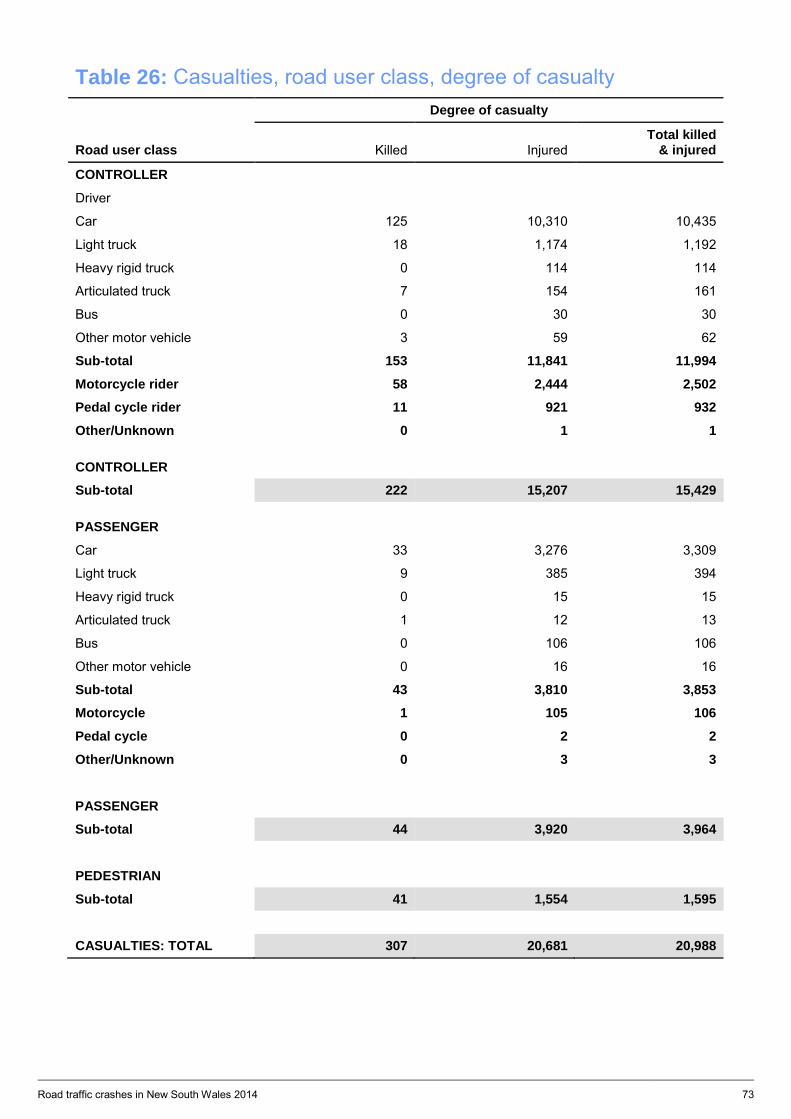
Road traffic crashes in New South Wales 2014 73
Table 26: Casualties, road user class, degree of casualty
Road user class
Degree of casualty
Killed Injured Total killed
& injured
CONTROLLER
Driver
Car 125 10,310 10,435
Light truck 18 1,174 1,192
Heavy rigid truck 0 114 114
Articulated truck 7 154 161
Bus 0 30 30
Other motor vehicle 3 59 62
Sub-total 153 11,841 11,994
Motorcycle rider 58 2,444 2,502
Pedal cycle rider 11 921 932
Other/Unknown 0 1 1
CONTROLLER
Sub-total 222 15,207 15,429
PASSENGER
Car 33 3,276 3,309
Light truck 9 385 394
Heavy rigid truck 0 15 15
Articulated truck 1 12 13
Bus 0 106 106
Other motor vehicle 0 16 16
Sub-total 43 3,810 3,853
Motorcycle 1 105 106
Pedal cycle 0 2 2
Other/Unknown 0 3 3
PASSENGER
Sub-total 44 3,920 3,964
PEDESTRIAN
Sub-total 41 1,554 1,595
CASUALTIES: TOTAL 307 20,681 20,988
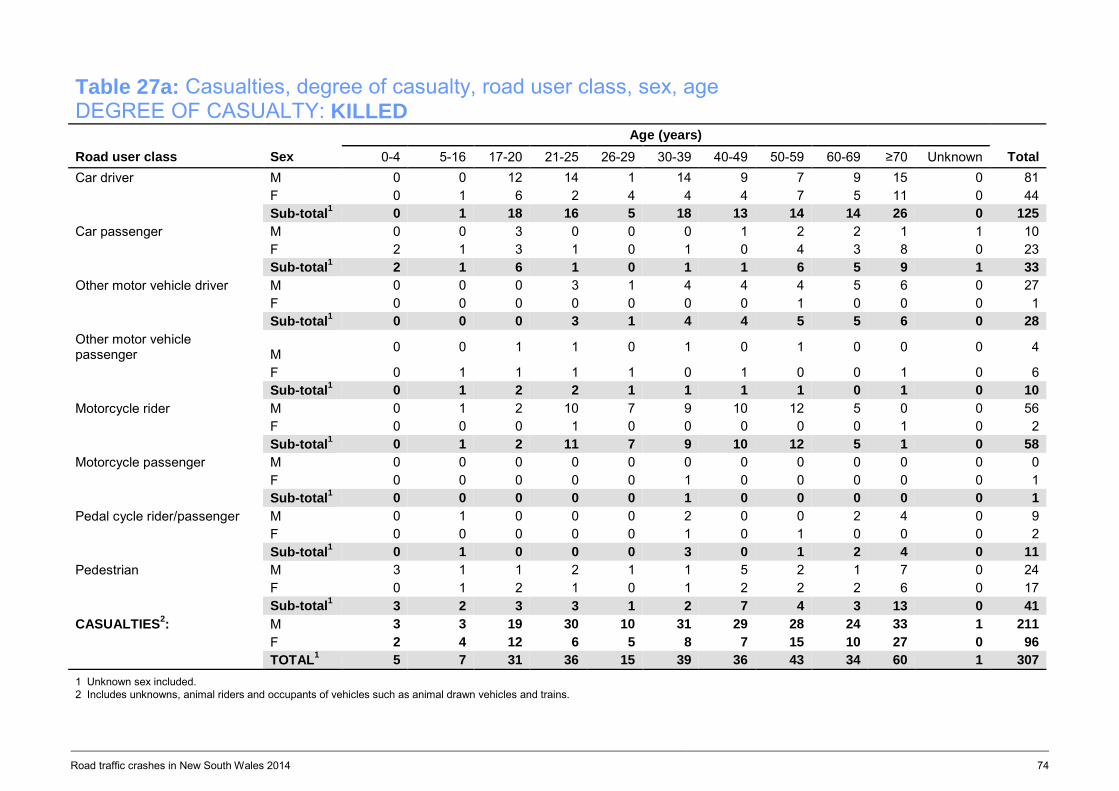
Road traffic crashes in New South Wales 2014 74
Table 27a: Casualties, degree of casualty, road user class, sex, age DEGREE OF CASUALTY: KILLED
Road user class Sex Age (years)
Total 0-4 5-16 17-20 21-25 26-29 30-39 40-49 50-59 60-69 ≥70 Unknown Car driver M 0 0 12 14 1 14 9 7 9 15 0 81 F 0 1 6 2 4 4 4 7 5 11 0 44 Sub-total1 0 1 18 16 5 18 13 14 14 26 0 125 Car passenger M 0 0 3 0 0 0 1 2 2 1 1 10 F 2 1 3 1 0 1 0 4 3 8 0 23 Sub-total1 2 1 6 1 0 1 1 6 5 9 1 33 Other motor vehicle driver M 0 0 0 3 1 4 4 4 5 6 0 27 F 0 0 0 0 0 0 0 1 0 0 0 1 Sub-total1 0 0 0 3 1 4 4 5 5 6 0 28 Other motor vehicle passenger M 0 0 1 1 0 1 0 1 0 0 0 4
F 0 1 1 1 1 0 1 0 0 1 0 6 Sub-total1 0 1 2 2 1 1 1 1 0 1 0 10 Motorcycle rider M 0 1 2 10 7 9 10 12 5 0 0 56 F 0 0 0 1 0 0 0 0 0 1 0 2 Sub-total1 0 1 2 11 7 9 10 12 5 1 0 58 Motorcycle passenger M 0 0 0 0 0 0 0 0 0 0 0 0 F 0 0 0 0 0 1 0 0 0 0 0 1 Sub-total1 0 0 0 0 0 1 0 0 0 0 0 1 Pedal cycle rider/passenger M 0 1 0 0 0 2 0 0 2 4 0 9 F 0 0 0 0 0 1 0 1 0 0 0 2 Sub-total1 0 1 0 0 0 3 0 1 2 4 0 11 Pedestrian M 3 1 1 2 1 1 5 2 1 7 0 24 F 0 1 2 1 0 1 2 2 2 6 0 17 Sub-total1 3 2 3 3 1 2 7 4 3 13 0 41 CASUALTIES2: M 3 3 19 30 10 31 29 28 24 33 1 211 F 2 4 12 6 5 8 7 15 10 27 0 96 TOTAL1 5 7 31 36 15 39 36 43 34 60 1 307 1 Unknown sex included. 2 Includes unknowns, animal riders and occupants of vehicles such as animal drawn vehicles and trains.
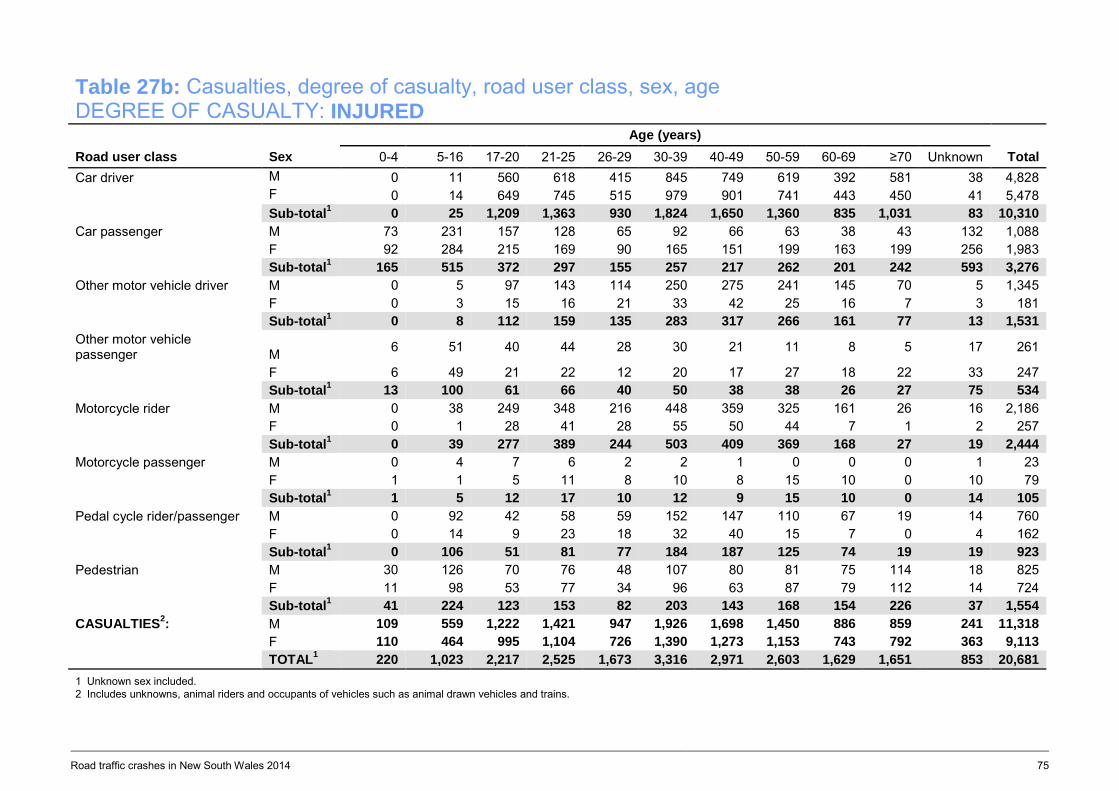
Road traffic crashes in New South Wales 2014 75
Table 27b: Casualties, degree of casualty, road user class, sex, age DEGREE OF CASUALTY: INJURED
Road user class Sex Age (years)
Total 0-4 5-16 17-20 21-25 26-29 30-39 40-49 50-59 60-69 ≥70 Unknown Car driver M 0 11 560 618 415 845 749 619 392 581 38 4,828 F 0 14 649 745 515 979 901 741 443 450 41 5,478 Sub-total1 0 25 1,209 1,363 930 1,824 1,650 1,360 835 1,031 83 10,310 Car passenger M 73 231 157 128 65 92 66 63 38 43 132 1,088 F 92 284 215 169 90 165 151 199 163 199 256 1,983 Sub-total1 165 515 372 297 155 257 217 262 201 242 593 3,276 Other motor vehicle driver M 0 5 97 143 114 250 275 241 145 70 5 1,345 F 0 3 15 16 21 33 42 25 16 7 3 181 Sub-total1 0 8 112 159 135 283 317 266 161 77 13 1,531 Other motor vehicle passenger M 6 51 40 44 28 30 21 11 8 5 17 261
F 6 49 21 22 12 20 17 27 18 22 33 247 Sub-total1 13 100 61 66 40 50 38 38 26 27 75 534 Motorcycle rider M 0 38 249 348 216 448 359 325 161 26 16 2,186 F 0 1 28 41 28 55 50 44 7 1 2 257 Sub-total1 0 39 277 389 244 503 409 369 168 27 19 2,444 Motorcycle passenger M 0 4 7 6 2 2 1 0 0 0 1 23 F 1 1 5 11 8 10 8 15 10 0 10 79 Sub-total1 1 5 12 17 10 12 9 15 10 0 14 105 Pedal cycle rider/passenger M 0 92 42 58 59 152 147 110 67 19 14 760 F 0 14 9 23 18 32 40 15 7 0 4 162 Sub-total1 0 106 51 81 77 184 187 125 74 19 19 923 Pedestrian M 30 126 70 76 48 107 80 81 75 114 18 825 F 11 98 53 77 34 96 63 87 79 112 14 724 Sub-total1 41 224 123 153 82 203 143 168 154 226 37 1,554 CASUALTIES2: M 109 559 1,222 1,421 947 1,926 1,698 1,450 886 859 241 11,318 F 110 464 995 1,104 726 1,390 1,273 1,153 743 792 363 9,113 TOTAL1 220 1,023 2,217 2,525 1,673 3,316 2,971 2,603 1,629 1,651 853 20,681 1 Unknown sex included. 2 Includes unknowns, animal riders and occupants of vehicles such as animal drawn vehicles and trains.
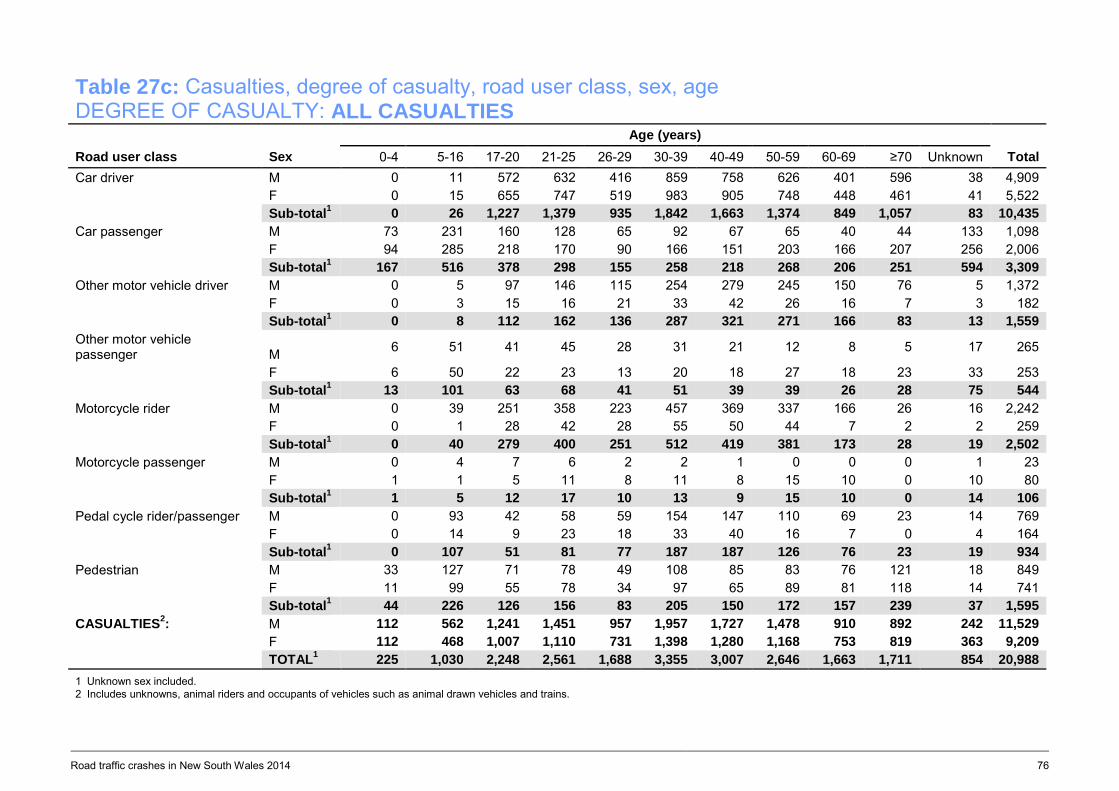
Road traffic crashes in New South Wales 2014 76
Table 27c: Casualties, degree of casualty, road user class, sex, age DEGREE OF CASUALTY: ALL CASUALTIES
Road user class Sex Age (years)
Total 0-4 5-16 17-20 21-25 26-29 30-39 40-49 50-59 60-69 ≥70 Unknown Car driver M 0 11 572 632 416 859 758 626 401 596 38 4,909 F 0 15 655 747 519 983 905 748 448 461 41 5,522 Sub-total1 0 26 1,227 1,379 935 1,842 1,663 1,374 849 1,057 83 10,435 Car passenger M 73 231 160 128 65 92 67 65 40 44 133 1,098 F 94 285 218 170 90 166 151 203 166 207 256 2,006 Sub-total1 167 516 378 298 155 258 218 268 206 251 594 3,309 Other motor vehicle driver M 0 5 97 146 115 254 279 245 150 76 5 1,372 F 0 3 15 16 21 33 42 26 16 7 3 182 Sub-total1 0 8 112 162 136 287 321 271 166 83 13 1,559 Other motor vehicle passenger M 6 51 41 45 28 31 21 12 8 5 17 265
F 6 50 22 23 13 20 18 27 18 23 33 253 Sub-total1 13 101 63 68 41 51 39 39 26 28 75 544 Motorcycle rider M 0 39 251 358 223 457 369 337 166 26 16 2,242 F 0 1 28 42 28 55 50 44 7 2 2 259 Sub-total1 0 40 279 400 251 512 419 381 173 28 19 2,502 Motorcycle passenger M 0 4 7 6 2 2 1 0 0 0 1 23 F 1 1 5 11 8 11 8 15 10 0 10 80 Sub-total1 1 5 12 17 10 13 9 15 10 0 14 106 Pedal cycle rider/passenger M 0 93 42 58 59 154 147 110 69 23 14 769 F 0 14 9 23 18 33 40 16 7 0 4 164 Sub-total1 0 107 51 81 77 187 187 126 76 23 19 934 Pedestrian M 33 127 71 78 49 108 85 83 76 121 18 849 F 11 99 55 78 34 97 65 89 81 118 14 741 Sub-total1 44 226 126 156 83 205 150 172 157 239 37 1,595 CASUALTIES2: M 112 562 1,241 1,451 957 1,957 1,727 1,478 910 892 242 11,529 F 112 468 1,007 1,110 731 1,398 1,280 1,168 753 819 363 9,209 TOTAL1 225 1,030 2,248 2,561 1,688 3,355 3,007 2,646 1,663 1,711 854 20,988 1 Unknown sex included. 2 Includes unknowns, animal riders and occupants of vehicles such as animal drawn vehicles and trains.
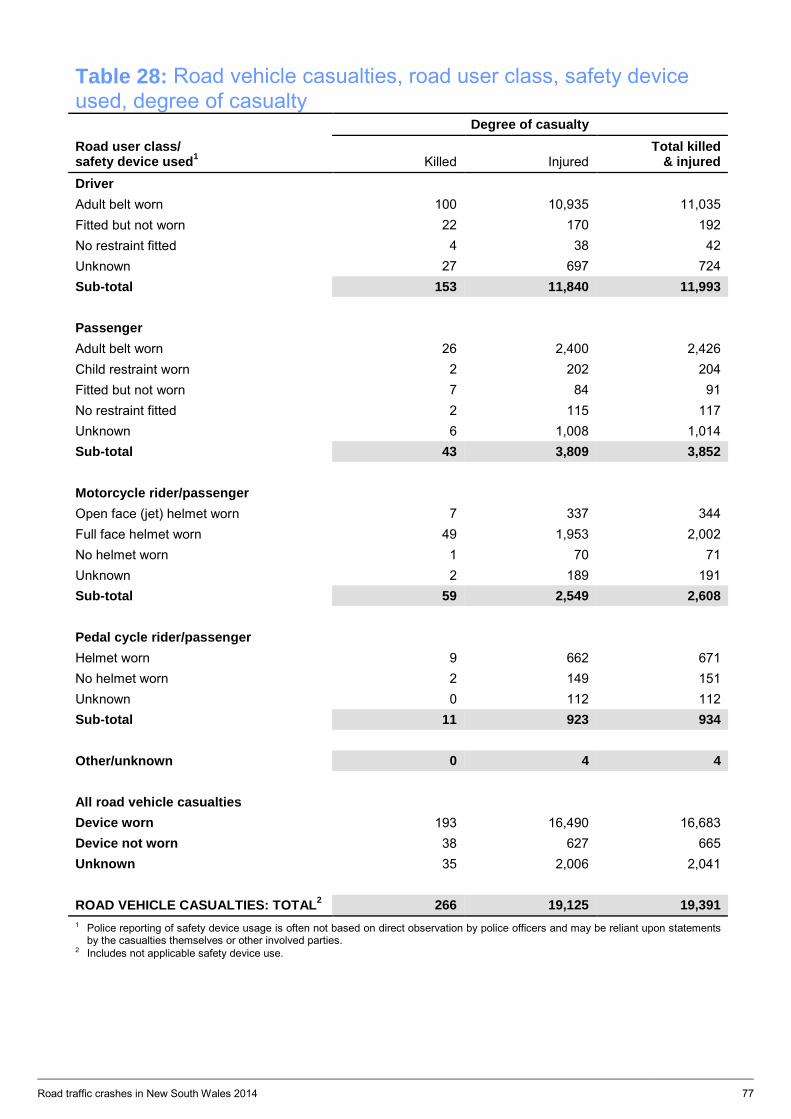
Road traffic crashes in New South Wales 2014 77
Table 28: Road vehicle casualties, road user class, safety device used, degree of casualty
Road user class/ safety device used1
Degree of casualty
Killed Injured Total killed
& injured Driver Adult belt worn 100 10,935 11,035 Fitted but not worn 22 170 192 No restraint fitted 4 38 42 Unknown 27 697 724 Sub-total 153 11,840 11,993 Passenger Adult belt worn 26 2,400 2,426 Child restraint worn 2 202 204 Fitted but not worn 7 84 91 No restraint fitted 2 115 117 Unknown 6 1,008 1,014 Sub-total 43 3,809 3,852 Motorcycle rider/passenger Open face (jet) helmet worn 7 337 344 Full face helmet worn 49 1,953 2,002 No helmet worn 1 70 71 Unknown 2 189 191 Sub-total 59 2,549 2,608 Pedal cycle rider/passenger Helmet worn 9 662 671 No helmet worn 2 149 151 Unknown 0 112 112 Sub-total 11 923 934 Other/unknown 0 4 4 All road vehicle casualties Device worn 193 16,490 16,683 Device not worn 38 627 665 Unknown 35 2,006 2,041 ROAD VEHICLE CASUALTIES: TOTAL2 266 19,125 19,391 1 Police reporting of safety device usage is often not based on direct observation by police officers and may be reliant upon statements
by the casualties themselves or other involved parties. 2 Includes not applicable safety device use.
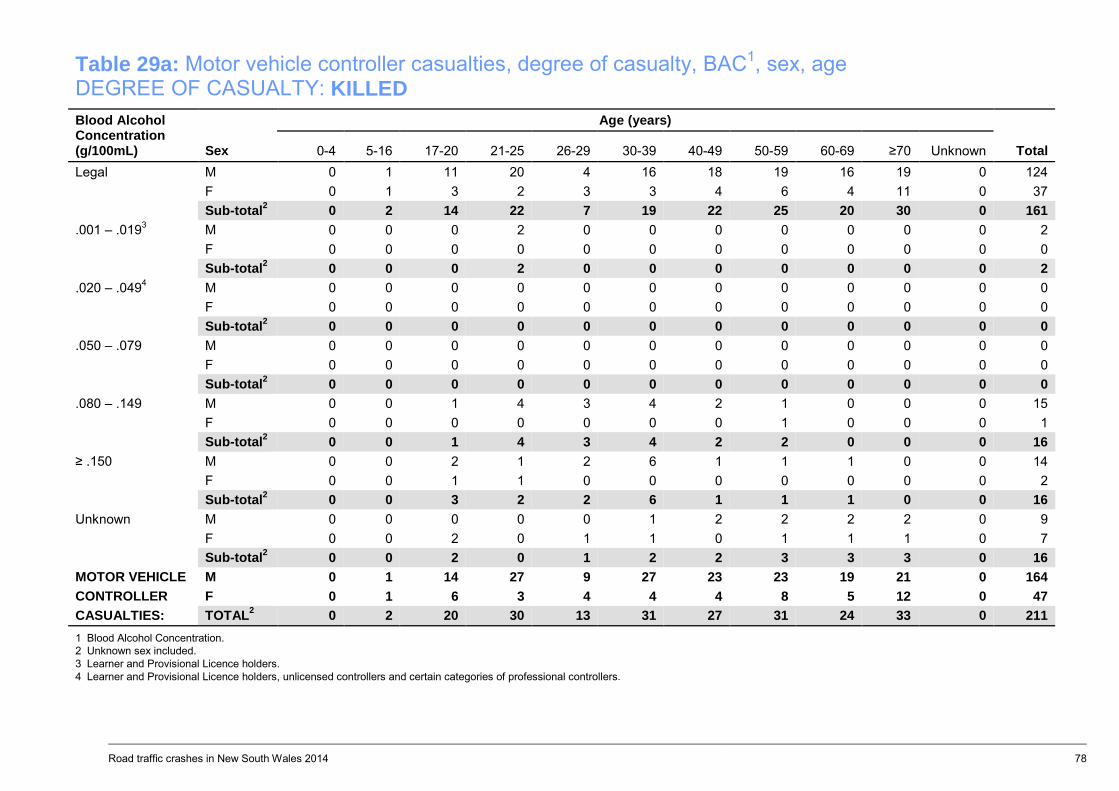
Road traffic crashes in New South Wales 2014 78
Table 29a: Motor vehicle controller casualties, degree of casualty, BAC1, sex, age DEGREE OF CASUALTY: KILLED Blood Alcohol Concentration (g/100mL) Sex
Age (years)
Total 0-4 5-16 17-20 21-25 26-29 30-39 40-49 50-59 60-69 ≥70 Unknown Legal M 0 1 11 20 4 16 18 19 16 19 0 124 F 0 1 3 2 3 3 4 6 4 11 0 37 Sub-total2 0 2 14 22 7 19 22 25 20 30 0 161 .001 – .0193 M 0 0 0 2 0 0 0 0 0 0 0 2 F 0 0 0 0 0 0 0 0 0 0 0 0 Sub-total2 0 0 0 2 0 0 0 0 0 0 0 2 .020 – .0494 M 0 0 0 0 0 0 0 0 0 0 0 0 F 0 0 0 0 0 0 0 0 0 0 0 0 Sub-total2 0 0 0 0 0 0 0 0 0 0 0 0 .050 – .079 M 0 0 0 0 0 0 0 0 0 0 0 0 F 0 0 0 0 0 0 0 0 0 0 0 0 Sub-total2 0 0 0 0 0 0 0 0 0 0 0 0 .080 – .149 M 0 0 1 4 3 4 2 1 0 0 0 15 F 0 0 0 0 0 0 0 1 0 0 0 1 Sub-total2 0 0 1 4 3 4 2 2 0 0 0 16 ≥ .150 M 0 0 2 1 2 6 1 1 1 0 0 14 F 0 0 1 1 0 0 0 0 0 0 0 2 Sub-total2 0 0 3 2 2 6 1 1 1 0 0 16 Unknown M 0 0 0 0 0 1 2 2 2 2 0 9 F 0 0 2 0 1 1 0 1 1 1 0 7 Sub-total2 0 0 2 0 1 2 2 3 3 3 0 16 MOTOR VEHICLE M 0 1 14 27 9 27 23 23 19 21 0 164 CONTROLLER F 0 1 6 3 4 4 4 8 5 12 0 47 CASUALTIES: TOTAL2 0 2 20 30 13 31 27 31 24 33 0 211 1 Blood Alcohol Concentration. 2 Unknown sex included. 3 Learner and Provisional Licence holders. 4 Learner and Provisional Licence holders, unlicensed controllers and certain categories of professional controllers.

Road traffic crashes in New South Wales 2014 79
Table 29b: Motor vehicle controller casualties, degree of casualty, BAC1, sex, age DEGREE OF CASUALTY: INJURED Blood Alcohol Concentration (g/100mL) Sex
Age (years)
Total 0-4 5-16 17-20 21-25 26-29 30-39 40-49 50-59 60-69 ≥70 Unknown Legal M 0 29 695 782 514 1,037 949 871 546 533 20 5,976 F 0 9 575 577 395 744 673 559 354 379 17 4,282 Sub-total2 0 38 1,270 1,359 909 1,781 1,622 1,430 900 912 37 10,258 .001 – .0193 M 0 1 2 0 2 0 0 0 0 0 0 5 F 0 0 1 1 0 0 0 0 0 0 0 2 Sub-total2 0 1 3 1 2 0 0 0 0 0 0 7 .020 – .0494 M 0 0 4 2 0 1 1 0 0 0 0 8 F 0 1 4 0 0 0 1 0 0 0 0 6 Sub-total2 0 1 8 2 0 1 2 0 0 0 0 14 .050 – .079 M 0 2 13 15 11 12 6 5 1 1 2 68 F 0 1 2 1 3 2 3 4 2 0 0 18 Sub-total2 0 3 15 16 14 14 9 9 3 1 2 86 .080 – .149 M 0 2 43 43 25 41 32 10 13 7 1 217 F 0 0 3 8 5 16 10 4 0 1 0 47 Sub-total2 0 2 46 51 30 57 42 14 13 8 1 264 ≥ .150 M 0 0 24 42 28 55 48 22 5 4 0 228 F 0 0 3 6 9 19 14 10 2 1 0 64 Sub-total2 0 0 27 48 37 74 62 32 7 5 0 292 Unknown M 0 20 125 225 165 397 347 277 133 132 36 1,857 F 0 7 104 209 152 286 292 233 108 77 29 1,497 Sub-total2 0 27 229 434 317 683 639 510 241 209 75 3,364 MOTOR VEHICLE M 0 54 906 1,109 745 1,543 1,383 1,185 698 677 59 8,359 CONTROLLER F 0 18 692 802 564 1,067 993 810 466 458 46 5,916 CASUALTIES: TOTAL2 0 72 1,598 1,911 1,309 2,610 2,376 1,995 1,164 1,135 115 14,285 1 Blood Alcohol Concentration. 2 Unknown sex included. 3 Learner and Provisional Licence holders. 4 Learner and Provisional Licence holders, unlicensed controllers and certain categories of professional controllers.
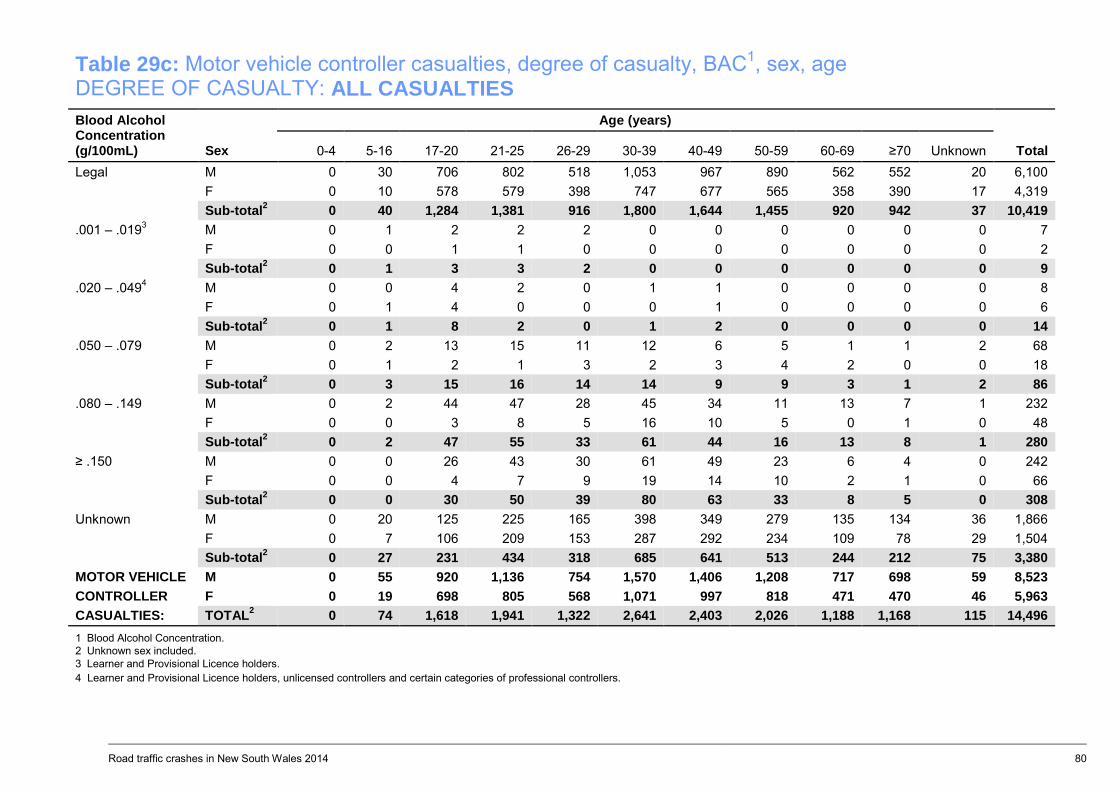
Road traffic crashes in New South Wales 2014 80
Table 29c: Motor vehicle controller casualties, degree of casualty, BAC1, sex, age DEGREE OF CASUALTY: ALL CASUALTIES Blood Alcohol Concentration (g/100mL) Sex
Age (years)
Total 0-4 5-16 17-20 21-25 26-29 30-39 40-49 50-59 60-69 ≥70 Unknown Legal M 0 30 706 802 518 1,053 967 890 562 552 20 6,100 F 0 10 578 579 398 747 677 565 358 390 17 4,319 Sub-total2 0 40 1,284 1,381 916 1,800 1,644 1,455 920 942 37 10,419 .001 – .0193 M 0 1 2 2 2 0 0 0 0 0 0 7 F 0 0 1 1 0 0 0 0 0 0 0 2 Sub-total2 0 1 3 3 2 0 0 0 0 0 0 9 .020 – .0494 M 0 0 4 2 0 1 1 0 0 0 0 8 F 0 1 4 0 0 0 1 0 0 0 0 6 Sub-total2 0 1 8 2 0 1 2 0 0 0 0 14 .050 – .079 M 0 2 13 15 11 12 6 5 1 1 2 68 F 0 1 2 1 3 2 3 4 2 0 0 18 Sub-total2 0 3 15 16 14 14 9 9 3 1 2 86 .080 – .149 M 0 2 44 47 28 45 34 11 13 7 1 232 F 0 0 3 8 5 16 10 5 0 1 0 48 Sub-total2 0 2 47 55 33 61 44 16 13 8 1 280 ≥ .150 M 0 0 26 43 30 61 49 23 6 4 0 242 F 0 0 4 7 9 19 14 10 2 1 0 66 Sub-total2 0 0 30 50 39 80 63 33 8 5 0 308 Unknown M 0 20 125 225 165 398 349 279 135 134 36 1,866 F 0 7 106 209 153 287 292 234 109 78 29 1,504 Sub-total2 0 27 231 434 318 685 641 513 244 212 75 3,380 MOTOR VEHICLE M 0 55 920 1,136 754 1,570 1,406 1,208 717 698 59 8,523 CONTROLLER F 0 19 698 805 568 1,071 997 818 471 470 46 5,963 CASUALTIES: TOTAL2 0 74 1,618 1,941 1,322 2,641 2,403 2,026 1,188 1,168 115 14,496 1 Blood Alcohol Concentration. 2 Unknown sex included. 3 Learner and Provisional Licence holders. 4 Learner and Provisional Licence holders, unlicensed controllers and certain categories of professional controllers.
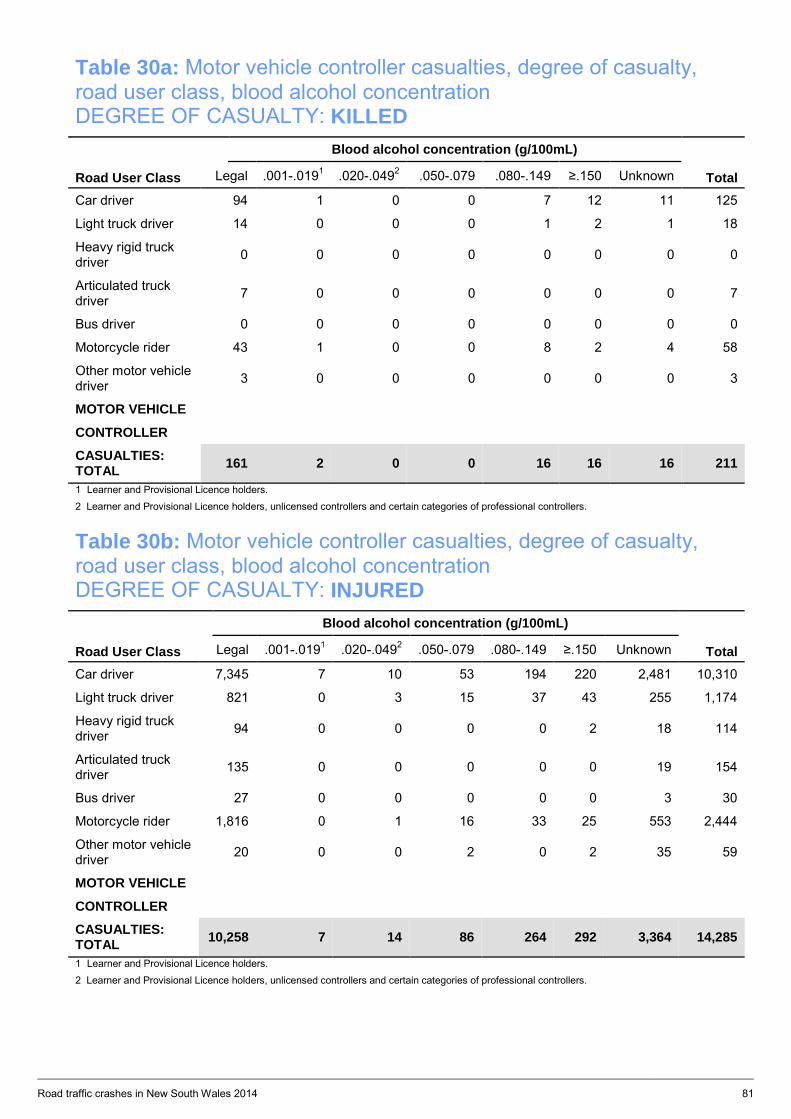
Road traffic crashes in New South Wales 2014 81
Table 30a: Motor vehicle controller casualties, degree of casualty, road user class, blood alcohol concentration DEGREE OF CASUALTY: KILLED Blood alcohol concentration (g/100mL)
Road User Class
Legal .001-.0191 .020-.0492 .050-.079 .080-.149 ≥.150 Unknown Total Car driver 94 1 0 0 7 12 11 125
Light truck driver 14 0 0 0 1 2 1 18
Heavy rigid truck driver 0 0 0 0 0 0 0 0
Articulated truck driver 7 0 0 0 0 0 0 7
Bus driver 0 0 0 0 0 0 0 0
Motorcycle rider 43 1 0 0 8 2 4 58
Other motor vehicle driver 3 0 0 0 0 0 0 3
MOTOR VEHICLE
CONTROLLER
CASUALTIES: TOTAL 161 2 0 0 16 16 16 211
1 Learner and Provisional Licence holders.
2 Learner and Provisional Licence holders, unlicensed controllers and certain categories of professional controllers.
Table 30b: Motor vehicle controller casualties, degree of casualty, road user class, blood alcohol concentration DEGREE OF CASUALTY: INJURED Blood alcohol concentration (g/100mL)
Road User Class
Legal .001-.0191 .020-.0492 .050-.079 .080-.149 ≥.150 Unknown Total Car driver 7,345 7 10 53 194 220 2,481 10,310
Light truck driver 821 0 3 15 37 43 255 1,174
Heavy rigid truck driver 94 0 0 0 0 2 18 114
Articulated truck driver 135 0 0 0 0 0 19 154
Bus driver 27 0 0 0 0 0 3 30
Motorcycle rider 1,816 0 1 16 33 25 553 2,444
Other motor vehicle driver 20 0 0 2 0 2 35 59
MOTOR VEHICLE
CONTROLLER
CASUALTIES: TOTAL 10,258 7 14 86 264 292 3,364 14,285
1 Learner and Provisional Licence holders.
2 Learner and Provisional Licence holders, unlicensed controllers and certain categories of professional controllers.
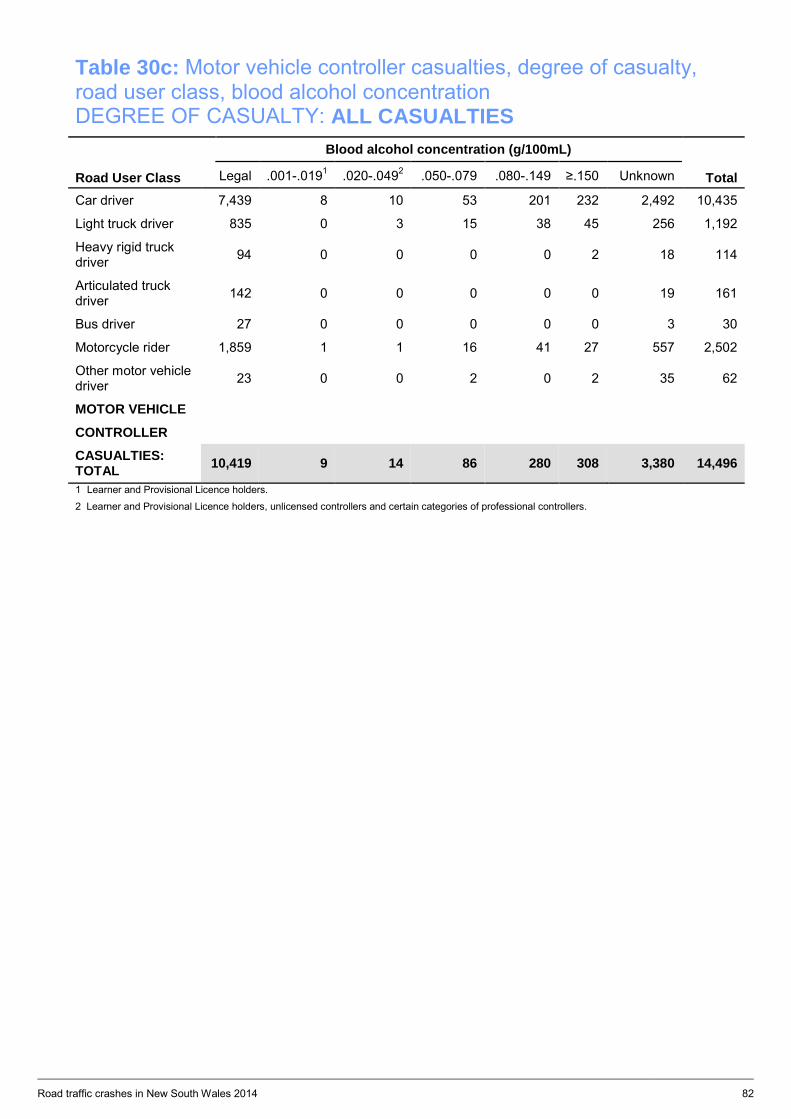
Road traffic crashes in New South Wales 2014 82
Table 30c: Motor vehicle controller casualties, degree of casualty, road user class, blood alcohol concentration DEGREE OF CASUALTY: ALL CASUALTIES Blood alcohol concentration (g/100mL)
Road User Class
Legal .001-.0191 .020-.0492 .050-.079 .080-.149 ≥.150 Unknown Total Car driver 7,439 8 10 53 201 232 2,492 10,435
Light truck driver 835 0 3 15 38 45 256 1,192
Heavy rigid truck driver 94 0 0 0 0 2 18 114
Articulated truck driver 142 0 0 0 0 0 19 161
Bus driver 27 0 0 0 0 0 3 30
Motorcycle rider 1,859 1 1 16 41 27 557 2,502
Other motor vehicle driver 23 0 0 2 0 2 35 62
MOTOR VEHICLE
CONTROLLER
CASUALTIES: TOTAL 10,419 9 14 86 280 308 3,380 14,496
1 Learner and Provisional Licence holders.
2 Learner and Provisional Licence holders, unlicensed controllers and certain categories of professional controllers.
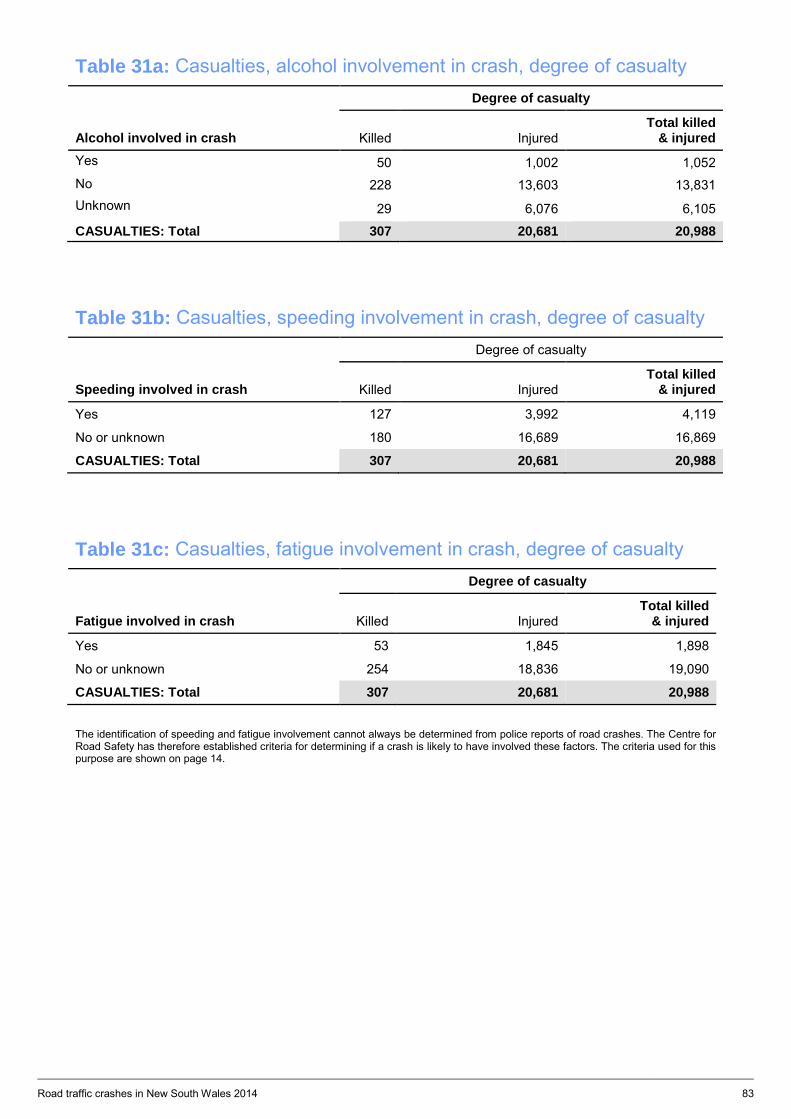
Road traffic crashes in New South Wales 2014 83
Table 31a: Casualties, alcohol involvement in crash, degree of casualty
Alcohol involved in crash
Degree of casualty
Killed Injured Total killed
& injured Yes 50 1,002 1,052 No 228 13,603 13,831 Unknown 29 6,076 6,105
CASUALTIES: Total 307 20,681 20,988
Table 31b: Casualties, speeding involvement in crash, degree of casualty
Speeding involved in crash
Degree of casualty
Killed Injured Total killed
& injured
Yes 127 3,992 4,119
No or unknown 180 16,689 16,869
CASUALTIES: Total 307 20,681 20,988
Table 31c: Casualties, fatigue involvement in crash, degree of casualty
Fatigue involved in crash
Degree of casualty
Killed Injured Total killed
& injured
Yes 53 1,845 1,898
No or unknown 254 18,836 19,090
CASUALTIES: Total 307 20,681 20,988
The identification of speeding and fatigue involvement cannot always be determined from police reports of road crashes. The Centre for Road Safety has therefore established criteria for determining if a crash is likely to have involved these factors. The criteria used for this purpose are shown on page 14.
Reference information
— Population
— Licence
— Vehicles
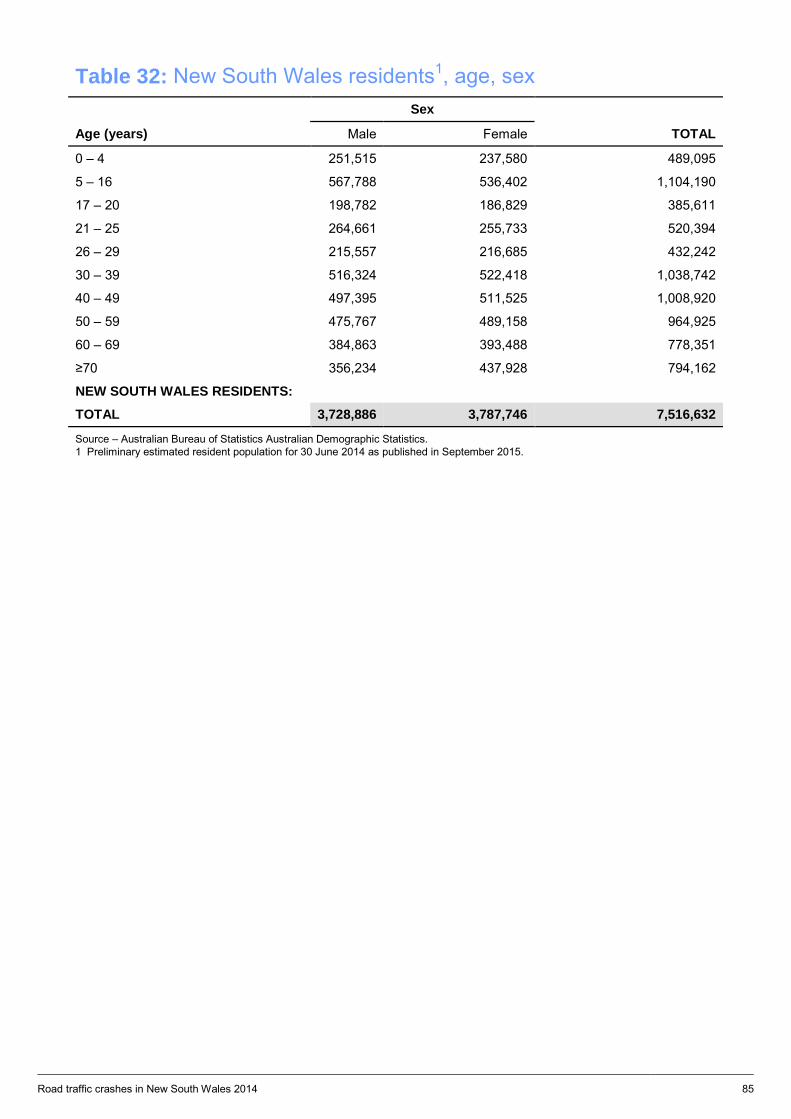
Road traffic crashes in New South Wales 2014 85
Table 32: New South Wales residents1, age, sex Sex
Age (years) Male Female TOTAL
0 – 4 251,515 237,580 489,095
5 – 16 567,788 536,402 1,104,190
17 – 20 198,782 186,829 385,611
21 – 25 264,661 255,733 520,394
26 – 29 215,557 216,685 432,242
30 – 39 516,324 522,418 1,038,742
40 – 49 497,395 511,525 1,008,920
50 – 59 475,767 489,158 964,925
60 – 69 384,863 393,488 778,351
≥70 356,234 437,928 794,162
NEW SOUTH WALES RESIDENTS:
TOTAL 3,728,886 3,787,746 7,516,632
Source – Australian Bureau of Statistics Australian Demographic Statistics. 1 Preliminary estimated resident population for 30 June 2014 as published in September 2015.
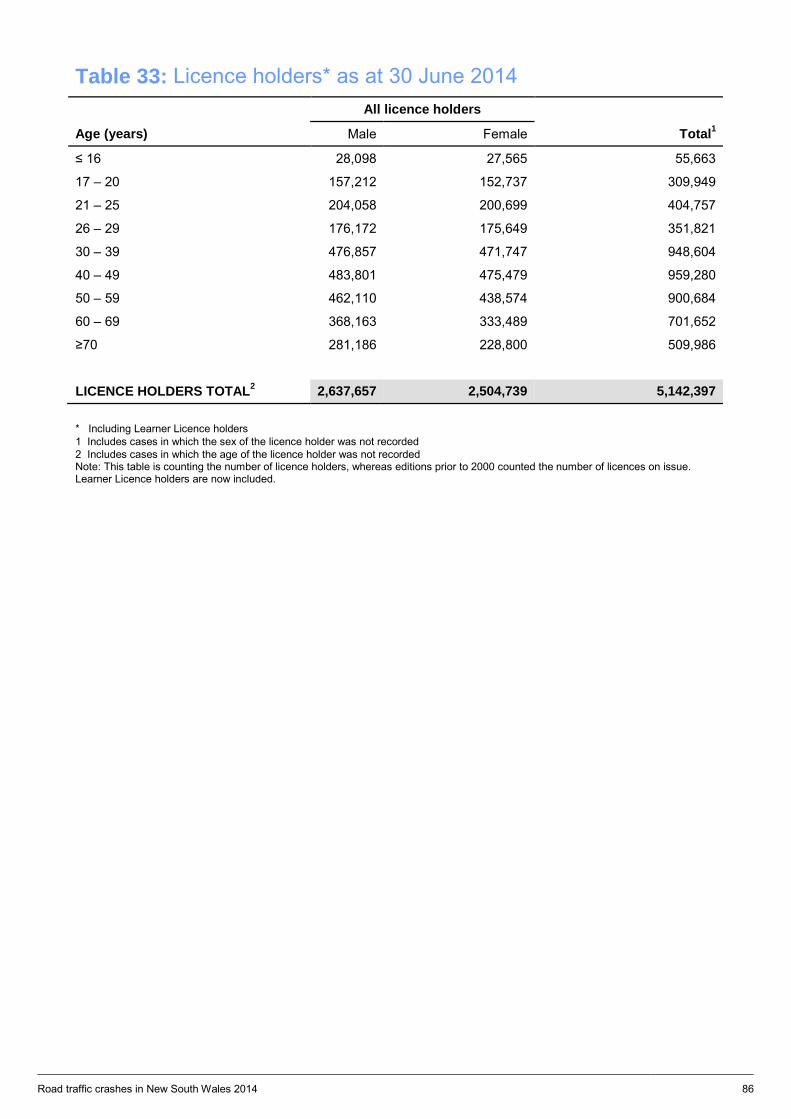
Road traffic crashes in New South Wales 2014 86
Table 33: Licence holders* as at 30 June 2014 All licence holders
Age (years) Male Female Total1
≤ 16 28,098 27,565 55,663
17 – 20 157,212 152,737 309,949
21 – 25 204,058 200,699 404,757
26 – 29 176,172 175,649 351,821
30 – 39 476,857 471,747 948,604
40 – 49 483,801 475,479 959,280
50 – 59 462,110 438,574 900,684
60 – 69 368,163 333,489 701,652
≥70 281,186 228,800 509,986
LICENCE HOLDERS TOTAL2 2,637,657 2,504,739 5,142,397
* Including Learner Licence holders 1 Includes cases in which the sex of the licence holder was not recorded 2 Includes cases in which the age of the licence holder was not recorded Note: This table is counting the number of licence holders, whereas editions prior to 2000 counted the number of licences on issue. Learner Licence holders are now included.
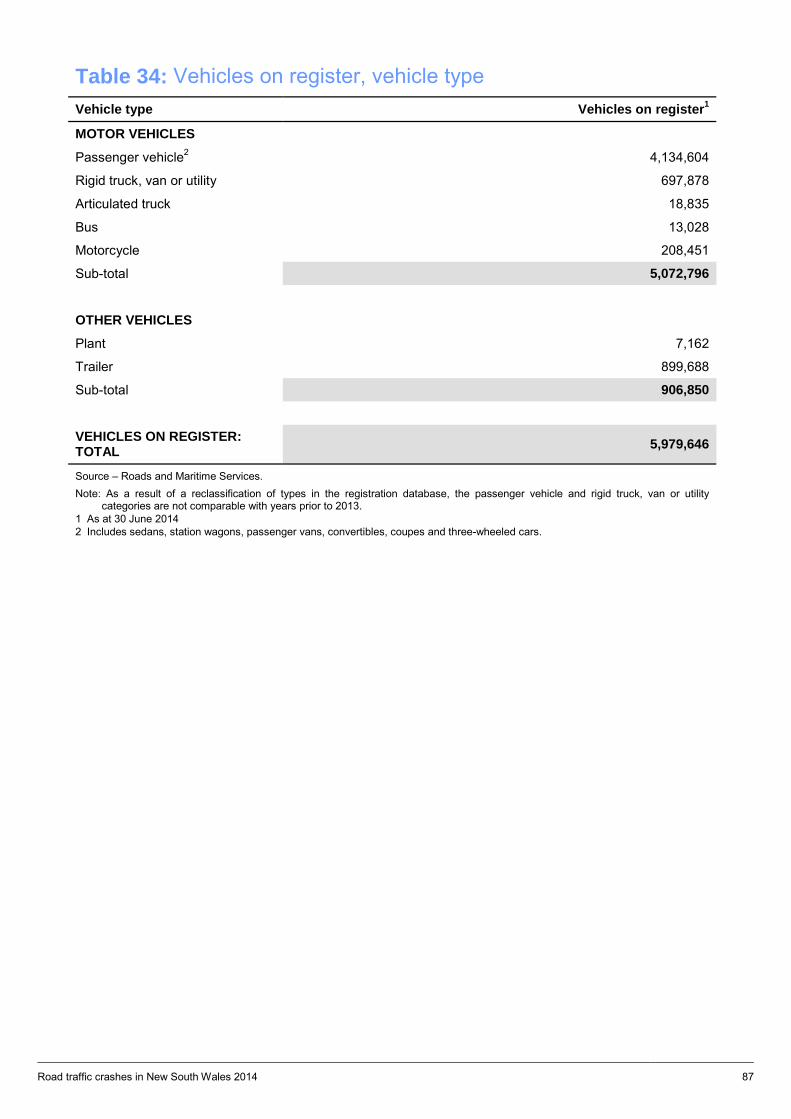
Road traffic crashes in New South Wales 2014 87
Table 34: Vehicles on register, vehicle type Vehicle type Vehicles on register1
MOTOR VEHICLES
Passenger vehicle2 4,134,604
Rigid truck, van or utility 697,878
Articulated truck 18,835
Bus 13,028
Motorcycle 208,451
Sub-total 5,072,796
OTHER VEHICLES Plant 7,162
Trailer 899,688
Sub-total 906,850
VEHICLES ON REGISTER: TOTAL 5,979,646
Source – Roads and Maritime Services. Note: As a result of a reclassification of types in the registration database, the passenger vehicle and rigid truck, van or utility
categories are not comparable with years prior to 2013. 1 As at 30 June 2014 2 Includes sedans, station wagons, passenger vans, convertibles, coupes and three-wheeled cars.

Index
Road traffic crashes in New South Wales 2014 89
References in normal type are to page number, or range of pages, which are relevant to the entry. References in bold type are to the page number of figures.
An asterisk (*) following a main entry indicates that the meaning of the word, as used in this statistical statement, appears in the definitions on pages 12-13.
A age casualties 74-76, 78-80 causes of death 19 controllers 34-37, 39-44, 78-80 licence holders 86 population of NSW 85 alcohol concentration 39-42, 78-82 involvement in crashes 31-33 zero alcohol limit 11 ambulances see emergency vehicles Anzac Day holiday 24 area see country areas; local government areas; metropolitan area; regions (State) articulated trucks* casualties 29 , 73, 81-82 controller casualties 73, 81-82 controllers 34-38 crashes 29 involvement rate 30 single vehicle crashes 28 Australia Day holiday 24
B BAC see alcohol concentration bicycles see pedal cycles blood alcohol concentration see alcohol concentration buses* casualties 29, 73, 81-82 controller casualties 73, 81-82 controllers 34-38 crashes 29 involvement rate 30 single vehicle crashes 28
C Cars* casualties 29, 73-76, 81-82 controller casualties 73-76, 81-82 controllers 34-38 crashes 29 single vehicle crashes 28
carriageway* 45 casualties* see also fatalities age 74-76, 78-80 alcohol concentration of 78-82
area see country areas; local government areas; metropolitan area; regions (State)
comparative statistics 6, 18, 19 controllers 73-82 degree of see casualties main entry; fatalities from alcohol-involved crashes 83 from fatigue-involved crashes 83 from speeding-involved crashes 83 helmets, use of see safety devices holiday periods 24 road types see roads road user classes see road user classes safety devices, use of 77 seat belts, use of see safety devices sex 74-76, 78-80 trends 16, 21-22 vehicle types involved buses 29, 73, 81-82 cars 29, 73-76, 81-82 motorcycles 73-77, 81-82 pedal cycles 29, 73-77 trucks 29, 73, 81-82 causes of death 19 children see age Christmas holiday 24
coaches see buses comparative statistics 6, 18, 19 see also trends control, loss of 27 controllers* see also road user classes age 34-37, 39-44, 78-80 alcohol concentration 39-42, 78-82 casualties 73-82 degree of crash 34-44 licence status 38 motor vehicle 34-44, 73-82 road user classes 34-38, 73-77, 81-82 sex 34-37, 39-44, 78-80 trends 21-22 vehicle types 34-38, 73-76, 81-82
Road traffic crashes in New South Wales 2014 90
convention for table headings 8 condition, surface 47 cost of crashes 7 council areas see local government areas country areas alcohol involvement 32 casualties 49-70 crashes 32, 46, 49-70 speed limits 46 countries, other 18 crashes* alcohol involvement in 31-33 alignment, road 47
area see country areas; local government areas; metropolitan area; regions (State)
comparative statistics 6 cost of 7 criteria for inclusion 9 degree of 6, 24-26, 28-33, 45-70 factors contributing to 30, 33 fatal 6, 16, 24-26, 28-33, 45-70 fatigue involvement in 33 features of location of 45 see also road user movements holiday periods 24 injury see injury crashes local government areas 48-70 location types 45 non-casualty 6, 24-26, 28-33, 45-70 object hit in 28 see also road user movements persons involved in see road user classes road types see roads road user movements 27 routes 57-70 single vehicle 27, 28 speed limits 46 speeding involvement in 33, 43 time periods 25, 26, 31 trends 16
vehicle types involved in see vehicles, types involved
urbanisation 32 curve, crashes on 47
D Day of week, crashes by 25 deaths see also fatalities causes of 19
definitions 12 - 13 degree of crash 6, 24, 26, 28-33, 45-70 see also crashes degree of casualty see fatalities; casualties distance travelled 16 drink driving see alcohol drivers* see controllers
E Easter holiday 24 emergency vehicles* 29
F Factors contributing to crashes 30, 33 fatal crashes* 6, 16, 24-26, 28-33, 45-70 see crashes for subentries fatalities* see also casualties comparative statistics 6, 18, 19 month 20 number of 6 rate of 16, 17, 18 trends 16, 20 year 16, 20, 21-22 fatigue 14, 33, 83 fatigued controllers, 44 features of location 45 see also road user movements fire brigade vehicles see emergency vehicles footpath* 27 freeways and motorways casualties 57-58 crashes 57-58
H Head on impacts 27 heavy rigid trucks* see also rigid trucks casualties 29, 73, 81-82 controller casualties 73, 81-82 controllers 34-38 crashes 29 single vehicle crashes 28 heavy vehicles see heavy rigid trucks; articulated trucks; buses helmets see safety devices highways see roads, highways holiday periods 24
Road traffic crashes in New South Wales 2014 91
hour of day, crashes by 25
I Impact, first angle of 27 object hit in 28 road user movement 27 injured* see fatalities; casualties injury crashes* 6, 24-26, 28-33, 45-70 see crashes for subentries international comparisons 18 intersections* crashes at 27, 45 interstate comparisons 18 involvement rates of motor vehicles 30
K Killed see fatalities
L Labour Day holiday 24 licence age and sex of holders 86 holders 6, 16, 86 status 38 light commercial vehicles involvement rate 30 light trucks* see also rigid trucks casualties 29, 73, 81-82 controller casualties 73, 81-82 controllers 34-38 crashes 29 single vehicle crashes 28 local government areas 11, 48-70 location type of crashes 27, 45 loss of control see control, loss of
M Main points for 2014 6, 7 main routes (specific) see routes (selected) manoeuvres see road user movements metropolitan area
see also definitions of Sydney, Newcastle & Wollongong metropolitan areas 12-13
alcohol involvement 32 casualties 56 Sydney 48-49
crashes 32, 46, 56 Sydney 48-49 speed limits 46 months 20 motor vehicle controllers see controllers motor vehicles* see also individual vehicle types distance travelled 16 drivers see controllers involvement rates 30 registered 6, 16, 18, 87 single vehicle crashes 28 types involved see vehicles, types involved motorcycles* casualties age 74-76 degree of 73-77, 81-82 helmet use 77 sex 74-76 trends 21-22 controllers age 34-37 alcohol concentration 81-82 sex 34-37 licence status 38 crashes 28, 29, 30 involvement rate 30 passengers 21-22, 73-76 riders see motorcycles, controllers trends 21-22 motorways and freeways casualties 57-58 crashes 57-58 movements of vehicles and pedestrians see road user movement
N New Year holiday 24 Newcastle Metropolitan Area* see metropolitan area non-casualty crashes* 6, 24, 26, 28-33, 45-70 see crashes for subentries non-intersection crashes 27, 45
O Objects hit 28 see also road user movement overtaking 27
Road traffic crashes in New South Wales 2014 92
P Passengers* casualties age 74-76 degree of 73-77 safety device, use of 77 sex 74-76 trends 21-22 vehicle types 73-76 passenger vehicles involvement rate 30 pedal cycles* casualties age 74-76 degree of 73-77 helmet use 77 sex 74-76 trends 21-22 crashes 11, 29 pedestrians* casualties age 74-76 degree of 73-76 sex 74-76 trends 21-22 crashes 27, 29 movements of 27 persons involved in crashes see road user classes police vehicles see emergency vehicles population age 85 comparative statistics 18 NSW 6, 18, 85 trends 16 public holidays see holiday periods
Q Queen’s Birthday holiday 24
R Rear end impacts 27 regions (State) 48-56 registered vehicles 6, 16, 18, 87 residents see population restraints see safety devices riders see controllers; motorcycles; pedal cycles
rigid trucks 30 see also heavy rigid trucks; light trucks roads* see also routes for specific routes freeways 57-58 highways 59-70 road user classes see also controllers; passengers; motorcycles; pedal cycles; pedestrians age 34-37, 74-76 alcohol concentration 81-82 casualties 21-22, 73-76, 81-82 degree of crash 34-38 degree of casualty 73-76, 81-82 licence status 38 sex 34-37, 74-76 trends 21-22 road user movements 27 roundabouts 45 routes (selected) 57-70 RUMs 27
S Safety devices casualties’ use of 77 school holidays 24 seat belts see safety devices semi-trailers see articulated trucks severity of crash see degree of crash of injury see fatalities; casualties sex casualties 74-76 causes of death 19 controller casualties 74-76, 78-80 controllers, motor vehicle 34-37, 39-42 licence holders 86 population of NSW 85 single vehicle crashes 27, 28 speed limits 46 speeding 14, 33, 83 speeding, controllers 43 states, other 18 State regions see regions summary for 2014 6, 7 Sydney Metropolitan Area* see metropolitan area
T Tables, convention for headings 8 time of day, crashes by 25
Road traffic crashes in New South Wales 2014 93
time periods 25, 26, 31 time series see trends tow trucks see emergency vehicles towaway crashes see non-casualty crashes trends casualties 16, 21-22 crashes 16 distance travelled 16 fatalities 16, 20-22 licence holders 16 population 16 road user classes 21-22 vehicles on register 16 trucks see articulated trucks; heavy rigid trucks; light trucks
U Urbanisation, of crash location 32
V Vehicles see also motor vehicles; individual vehicle types distance travelled 16 involvement rates 30 manoeuvres see road user movements movements see road user movements on register 6, 16, 18, 87 out of control see control, loss of types involved casualties 73-76, 81-82 controllers 34-38 crashes 28, 29, 30
W Wollongong Metropolitan Area* see metropolitan area
Y Years 16, 20-22