road freight transport vademecum - european...
TRANSCRIPT
Road Freight Transport Vademecum
European Commission Directorate General Energy and Transport Directorate E – Inland Transport Unit E.1 – Land Transport Policy March 2009
2
Table of Contents
1 Introduction _______________________________________________________________ 3
2 Key highlights ______________________________________________________________ 3
3 The road freight transport market ______________________________________________ 5
3.1 Inland freight transport ________________________________________________________ 5
3.2 Integration of the market _______________________________________________________ 9 3.2.1 Main flags in international transport ____________________________________________________ 12 3.2.2 Foreign hauliers in international transport________________________________________________ 14 3.2.3 Cross-trade and cabotage transport _____________________________________________________ 16 3.2.4 Relations with third countries _________________________________________________________ 21
3.3 Turnover and productivity_____________________________________________________ 24
3.4 Efficiency ___________________________________________________________________ 25
3.5 Own account versus for hire and reward transport ________________________________ 27
3.6 Fragmentation and employment ________________________________________________ 27
3.7 Evolution of haulage costs _____________________________________________________ 30
3.8 Vehicle fleet composition by age ________________________________________________ 33
3.9 Development of Euro standards_________________________________________________ 33
3.10 Distances of road freight trips __________________________________________________ 34
3.11 Use of road infrastructure _____________________________________________________ 36
4 Energy consumption, CO2 emissions and environment ____________________________ 37
4.1 Energy consumption __________________________________________________________ 37
4.2 CO2 emissions _______________________________________________________________ 37
4.3 Pollutant emissions and air quality ______________________________________________ 39
5 Glossary__________________________________________________________________ 41
6 Selected references _________________________________________________________ 43
3
1 Introduction This report aims to provide easy to use data and analysis of key issues affecting the EU internal market for road freight transport. The statistical data used is primarily from EUROSTAT. The report is based on 2006 data that were generally the most recent statistics available at the time of conception of the report. Data from earlier years is used when 2006 data was not available.1 It has to be noted that the impact of the 2008/2009 economic downturn on road freight transport activities cannot yet be seen in official EU road transport statistics. A glossary of frequently used abbreviations and terms can be found in Chapter 5.
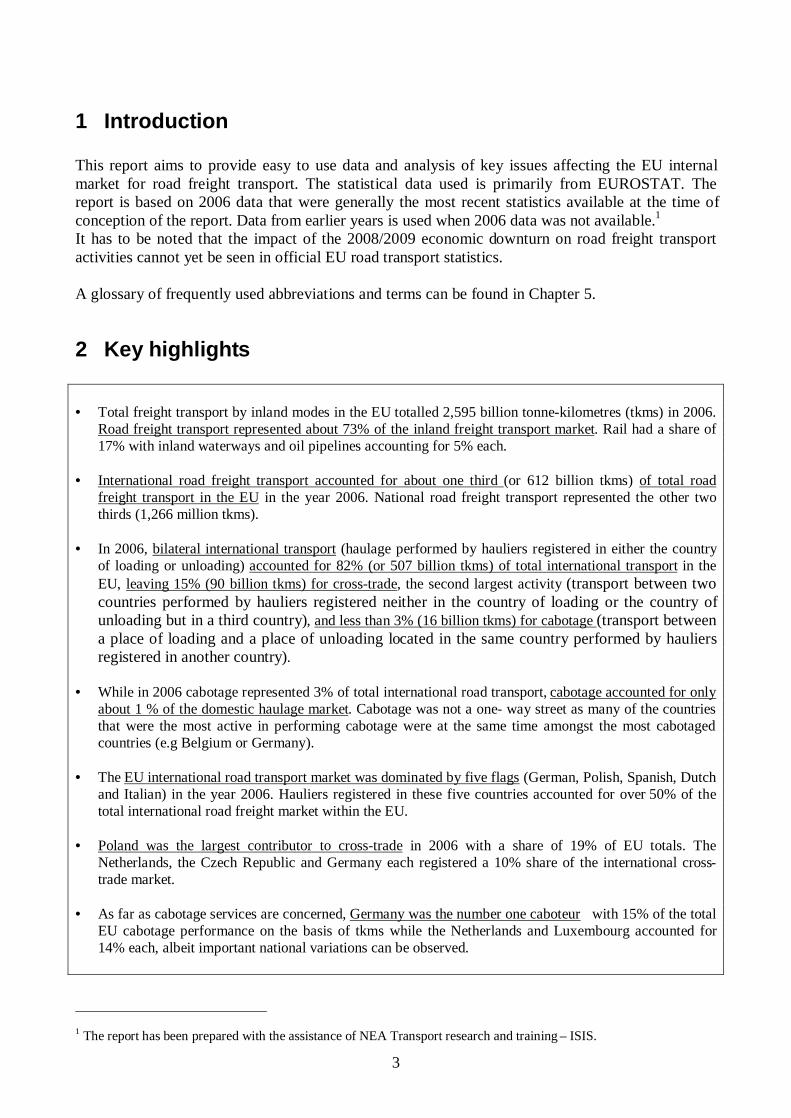
2 Key highlights • Total freight transport by inland modes in the EU totalled 2,595 billion tonne-kilometres (tkms) in 2006.
Road freight transport represented about 73% of the inland freight transport market. Rail had a share of 17% with inland waterways and oil pipelines accounting for 5% each.
• International road freight transport accounted for about one third (or 612 billion tkms) of total road
freight transport in the EU in the year 2006. National road freight transport represented the other two thirds (1,266 million tkms).
• In 2006, bilateral international transport (haulage performed by hauliers registered in either the country
of loading or unloading) accounted for 82% (or 507 billion tkms) of total international transport in the EU, leaving 15% (90 billion tkms) for cross-trade, the second largest activity (transport between two countries performed by hauliers registered neither in the country of loading or the country of unloading but in a third country), and less than 3% (16 billion tkms) for cabotage (transport between a place of loading and a place of unloading located in the same country performed by hauliers registered in another country).
• While in 2006 cabotage represented 3% of total international road transport, cabotage accounted for only
about 1 % of the domestic haulage market. Cabotage was not a one- way street as many of the countries that were the most active in performing cabotage were at the same time amongst the most cabotaged countries (e.g Belgium or Germany).
• The EU international road transport market was dominated by five flags (German, Polish, Spanish, Dutch
and Italian) in the year 2006. Hauliers registered in these five countries accounted for over 50% of the total international road freight market within the EU.
• Poland was the largest contributor to cross-trade in 2006 with a share of 19% of EU totals. The
Netherlands, the Czech Republic and Germany each registered a 10% share of the international cross-trade market.
• As far as cabotage services are concerned, Germany was the number one caboteur with 15% of the total
EU cabotage performance on the basis of tkms while the Netherlands and Luxembourg accounted for 14% each, albeit important national variations can be observed.
1 The report has been prepared with the assistance of NEA Transport research and training – ISIS.
4
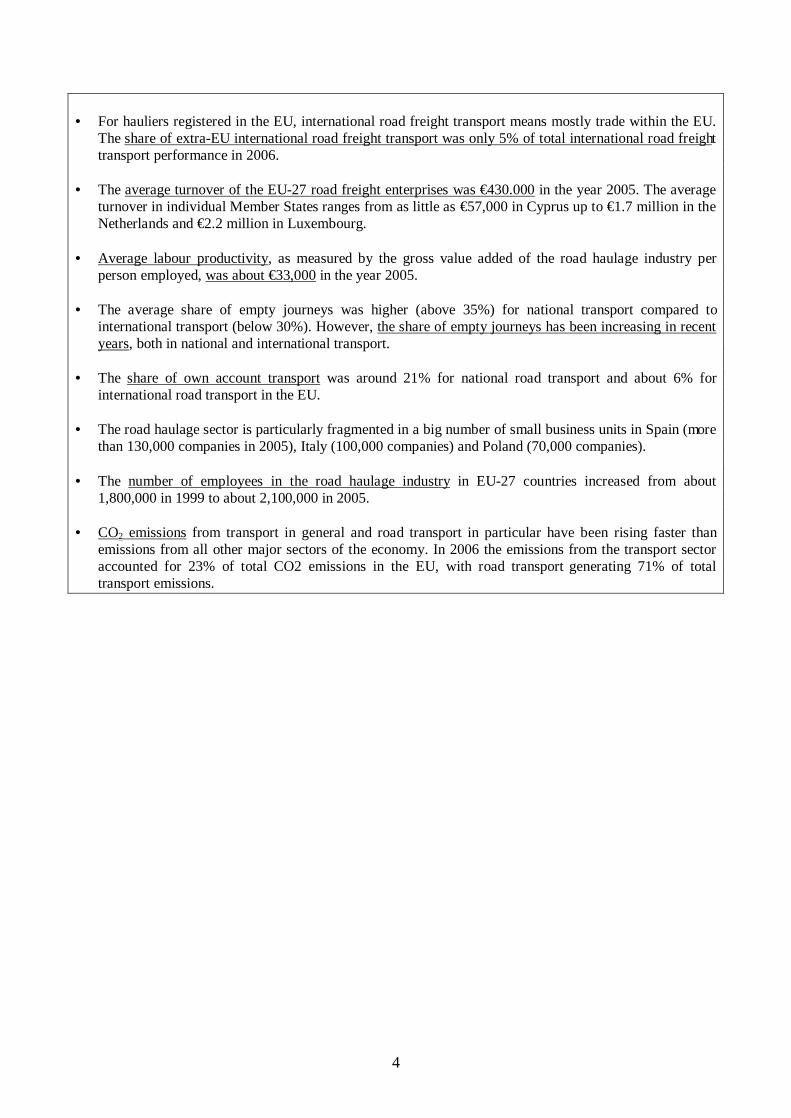
• For hauliers registered in the EU, international road freight transport means mostly trade within the EU.
The share of extra-EU international road freight transport was only 5% of total international road freight transport performance in 2006.
• The average turnover of the EU-27 road freight enterprises was €430.000 in the year 2005. The average
turnover in individual Member States ranges from as little as €57,000 in Cyprus up to €1.7 million in the Netherlands and €2.2 million in Luxembourg.
• Average labour productivity, as measured by the gross value added of the road haulage industry per
person employed, was about €33,000 in the year 2005. • The average share of empty journeys was higher (above 35%) for national transport compared to
international transport (below 30%). However, the share of empty journeys has been increasing in recent years, both in national and international transport.
• The share of own account transport was around 21% for national road transport and about 6% for
international road transport in the EU. • The road haulage sector is particularly fragmented in a big number of small business units in Spain (more
than 130,000 companies in 2005), Italy (100,000 companies) and Poland (70,000 companies). • The number of employees in the road haulage industry in EU-27 countries increased from about
1,800,000 in 1999 to about 2,100,000 in 2005. • CO2 emissions from transport in general and road transport in particular have been rising faster than
emissions from all other major sectors of the economy. In 2006 the emissions from the transport sector accounted for 23% of total CO2 emissions in the EU, with road transport generating 71% of total transport emissions.
5
3 The road freight transport market
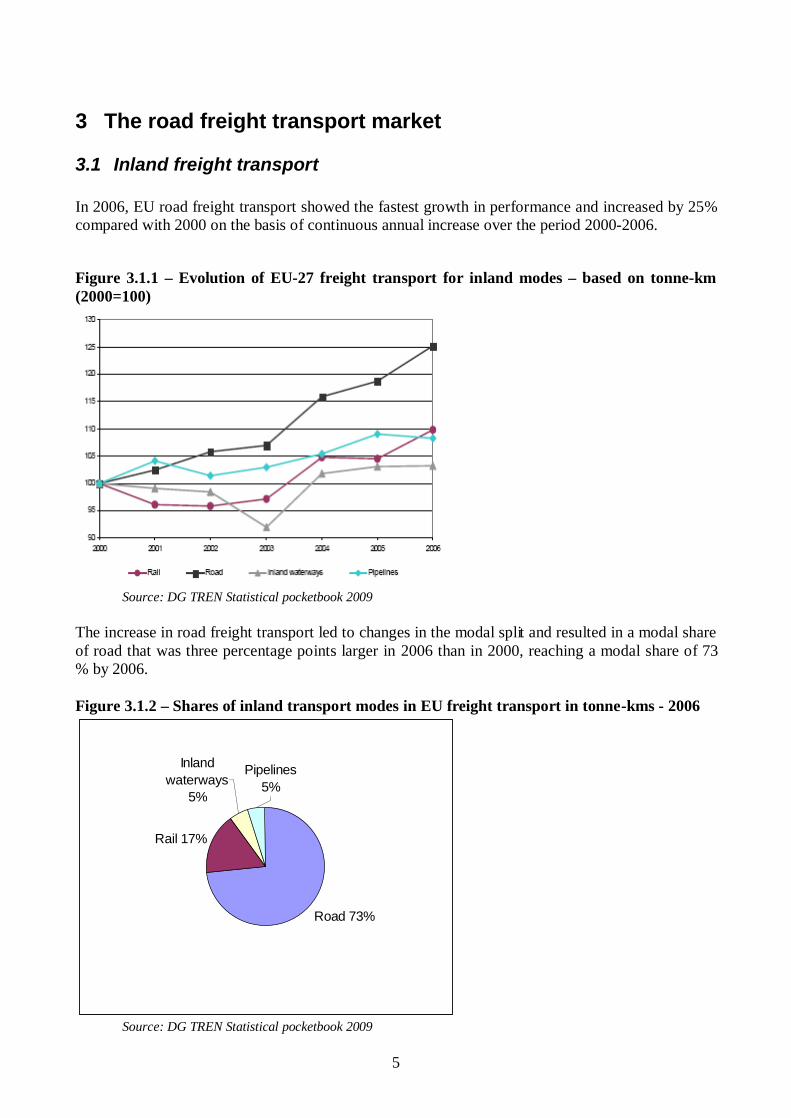
3.1 Inland freight transport In 2006, EU road freight transport showed the fastest growth in performance and increased by 25% compared with 2000 on the basis of continuous annual increase over the period 2000-2006.
Figure 3.1.1 – Evolution of EU-27 freight transport for inland modes – based on tonne-km (2000=100)
Source: DG TREN Statistical pocketbook 2009
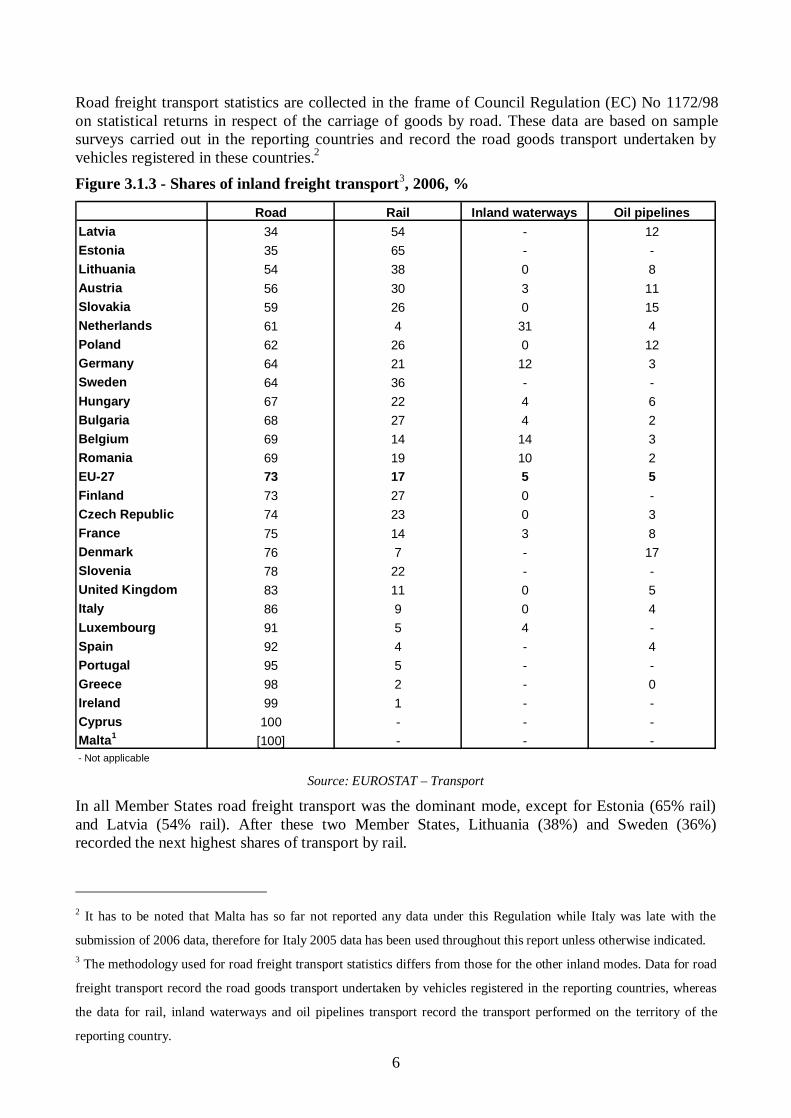
The increase in road freight transport led to changes in the modal split and resulted in a modal share of road that was three percentage points larger in 2006 than in 2000, reaching a modal share of 73 % by 2006. Figure 3.1.2 – Shares of inland transport modes in EU freight transport in tonne-kms - 2006
Road 73%
Rail 17%
Inland waterways
5%
Pipelines 5%
Source: DG TREN Statistical pocketbook 2009
6
Road freight transport statistics are collected in the frame of Council Regulation (EC) No 1172/98 on statistical returns in respect of the carriage of goods by road. These data are based on sample surveys carried out in the reporting countries and record the road goods transport undertaken by vehicles registered in these countries.2 Figure 3.1.3 - Shares of inland freight transport3, 2006, %
Road Rail Inland waterways Oil pipelinesLatvia 34 54 - 12Estonia 35 65 - -Lithuania 54 38 0 8Austria 56 30 3 11Slovakia 59 26 0 15Netherlands 61 4 31 4Poland 62 26 0 12Germany 64 21 12 3Sweden 64 36 - -Hungary 67 22 4 6Bulgaria 68 27 4 2Belgium 69 14 14 3Romania 69 19 10 2EU-27 73 17 5 5Finland 73 27 0 -Czech Republic 74 23 0 3France 75 14 3 8Denmark 76 7 - 17Slovenia 78 22 - -United Kingdom 83 11 0 5Italy 86 9 0 4Luxembourg 91 5 4 -Spain 92 4 - 4Portugal 95 5 - -Greece 98 2 - 0Ireland 99 1 - -Cyprus 100 - - -Malta1 [100] - - -- Not applicable
Source: EUROSTAT – Transport In all Member States road freight transport was the dominant mode, except for Estonia (65% rail) and Latvia (54% rail). After these two Member States, Lithuania (38%) and Sweden (36%) recorded the next highest shares of transport by rail.
2 It has to be noted that Malta has so far not reported any data under this Regulation while Italy was late with the
submission of 2006 data, therefore for Italy 2005 data has been used throughout this report unless otherwise indicated. 3 The methodology used for road freight transport statistics differs from those for the other inland modes. Data for road
freight transport record the road goods transport undertaken by vehicles registered in the reporting countries, whereas
the data for rail, inland waterways and oil pipelines transport record the transport performed on the territory of the
reporting country.
7
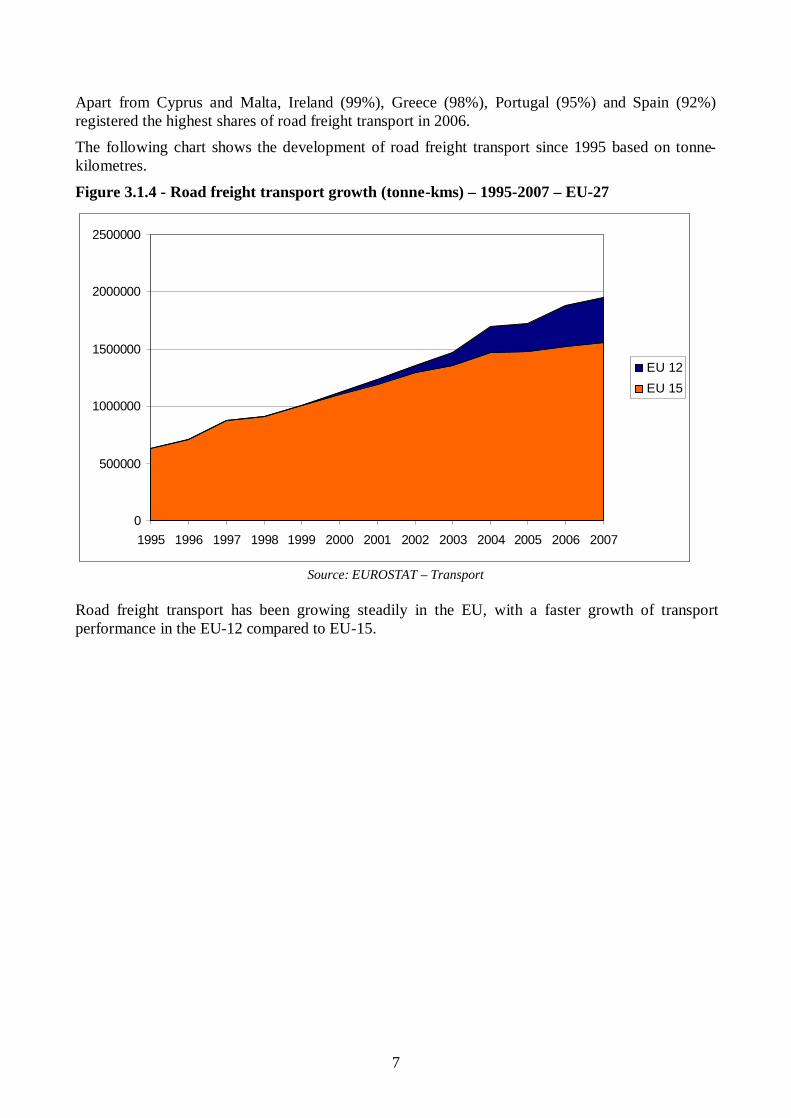
Apart from Cyprus and Malta, Ireland (99%), Greece (98%), Portugal (95%) and Spain (92%) registered the highest shares of road freight transport in 2006. The following chart shows the development of road freight transport since 1995 based on tonne-kilometres.
Figure 3.1.4 - Road freight transport growth (tonne-kms) – 1995-2007 – EU-27
0
500000
1000000
1500000
2000000
2500000
1995 1996 1997 1998 1999 2000 2001 2002 2003 2004 2005 2006 2007
EU 12EU 15
Source: EUROSTAT – Transport
Road freight transport has been growing steadily in the EU, with a faster growth of transport performance in the EU-12 compared to EU-15.
8
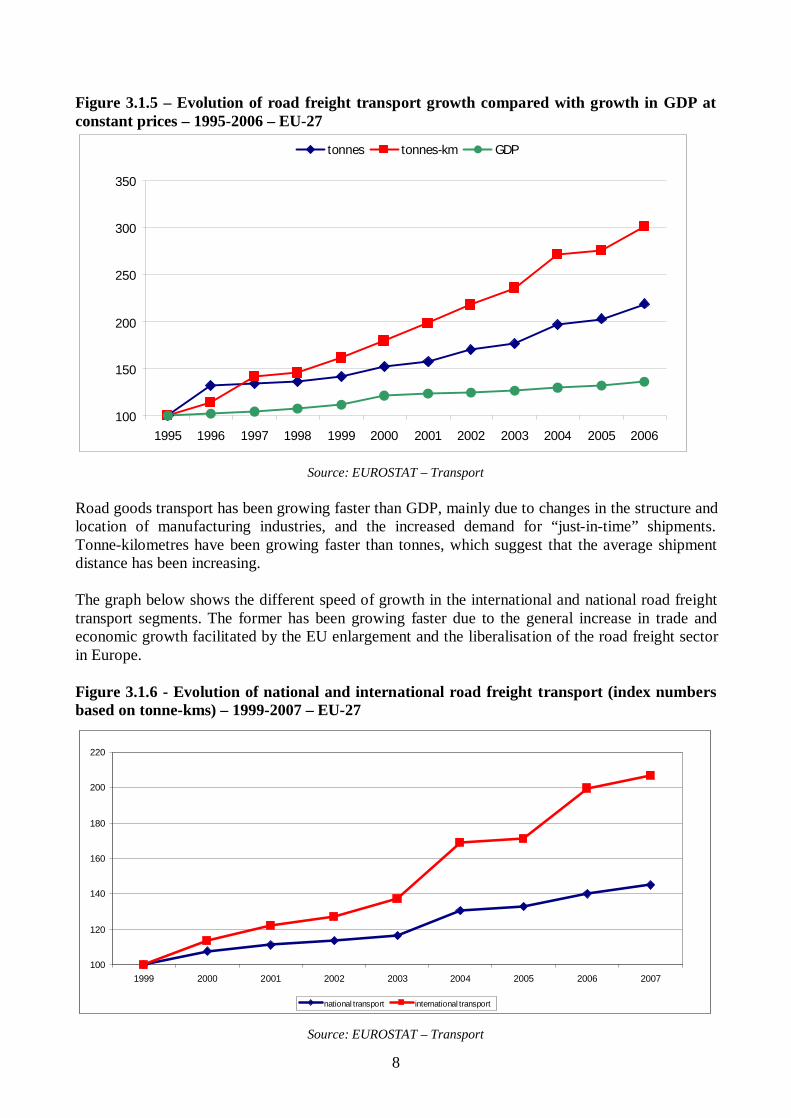
Figure 3.1.5 – Evolution of road freight transport growth compared with growth in GDP at constant prices – 1995-2006 – EU-27
100
150
200
250
300
350
1995 1996 1997 1998 1999 2000 2001 2002 2003 2004 2005 2006
tonnes tonnes-km GDP
Source: EUROSTAT – Transport
Road goods transport has been growing faster than GDP, mainly due to changes in the structure and location of manufacturing industries, and the increased demand for “just-in-time” shipments. Tonne-kilometres have been growing faster than tonnes, which suggest that the average shipment distance has been increasing. The graph below shows the different speed of growth in the international and national road freight transport segments. The former has been growing faster due to the general increase in trade and economic growth facilitated by the EU enlargement and the liberalisation of the road freight sector in Europe.
Figure 3.1.6 - Evolution of national and international road freight transport (index numbers based on tonne-kms) – 1999-2007 – EU-27
100
120
140
160
180
200
220
1999 2000 2001 2002 2003 2004 2005 2006 2007
national transport international transport
Source: EUROSTAT – Transport
9
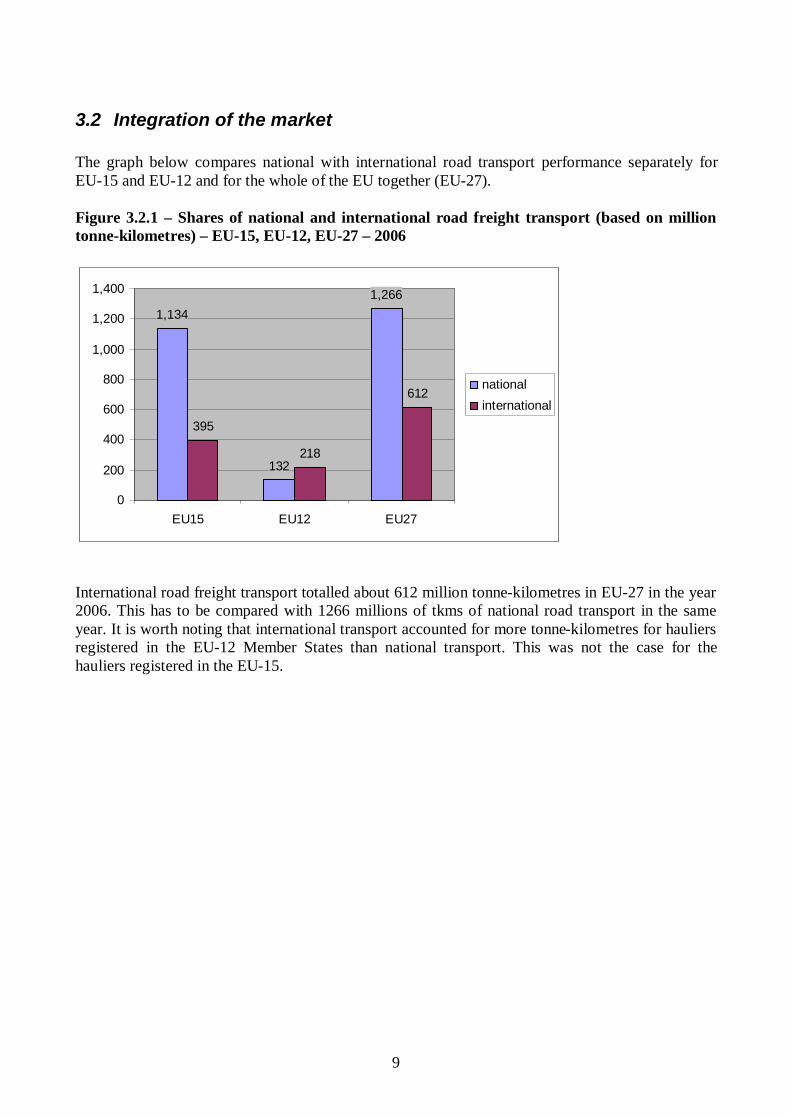
3.2 Integration of the market The graph below compares national with international road transport performance separately for EU-15 and EU-12 and for the whole of the EU together (EU-27). Figure 3.2.1 – Shares of national and international road freight transport (based on million tonne-kilometres) – EU-15, EU-12, EU-27 – 2006
1,134
132
1,266
395
218
612
0
200
400
600
800
1,000
1,200
1,400
EU15 EU12 EU27
nationalinternational
International road freight transport totalled about 612 million tonne-kilometres in EU-27 in the year 2006. This has to be compared with 1266 millions of tkms of national road transport in the same year. It is worth noting that international transport accounted for more tonne-kilometres for hauliers registered in the EU-12 Member States than national transport. This was not the case for the hauliers registered in the EU-15.
10
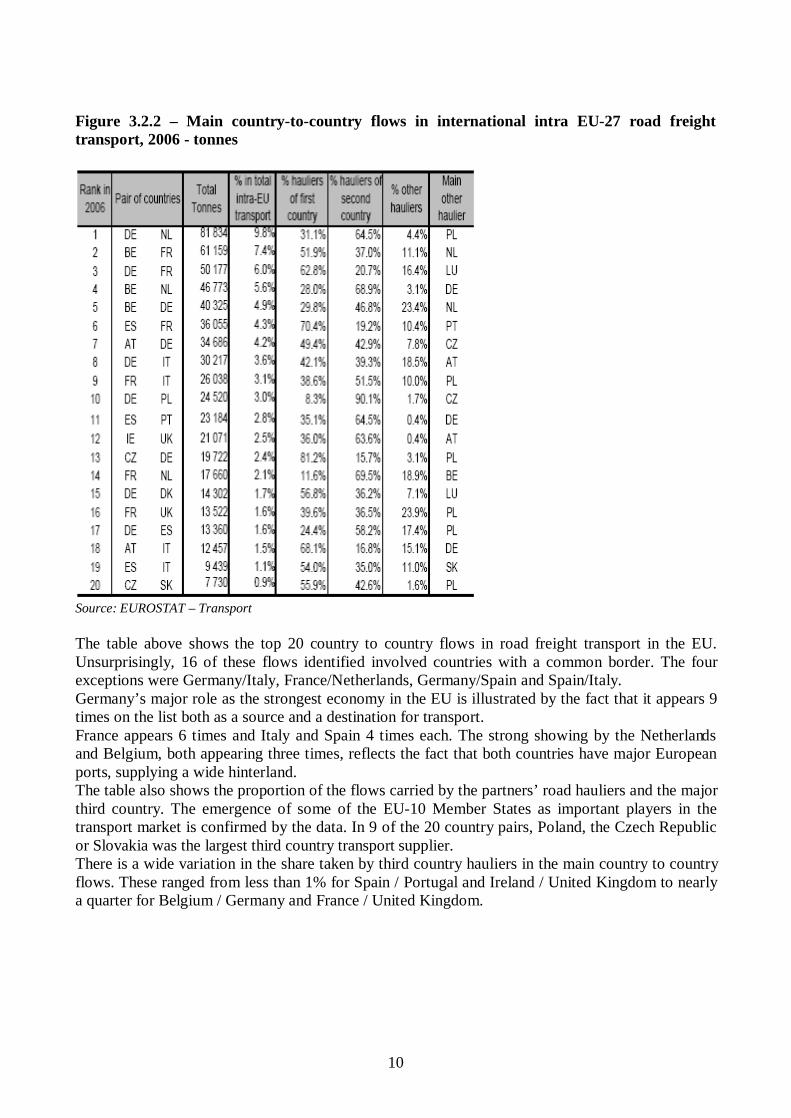
Figure 3.2.2 – Main country-to-country flows in international intra EU-27 road freight transport, 2006 - tonnes
Source: EUROSTAT – Transport The table above shows the top 20 country to country flows in road freight transport in the EU. Unsurprisingly, 16 of these flows identified involved countries with a common border. The four exceptions were Germany/Italy, France/Netherlands, Germany/Spain and Spain/Italy. Germany’s major role as the strongest economy in the EU is illustrated by the fact that it appears 9 times on the list both as a source and a destination for transport. France appears 6 times and Italy and Spain 4 times each. The strong showing by the Netherlands and Belgium, both appearing three times, reflects the fact that both countries have major European ports, supplying a wide hinterland. The table also shows the proportion of the flows carried by the partners’ road hauliers and the major third country. The emergence of some of the EU-10 Member States as important players in the transport market is confirmed by the data. In 9 of the 20 country pairs, Poland, the Czech Republic or Slovakia was the largest third country transport supplier. There is a wide variation in the share taken by third country hauliers in the main country to country flows. These ranged from less than 1% for Spain / Portugal and Ireland / United Kingdom to nearly a quarter for Belgium / Germany and France / United Kingdom.
11
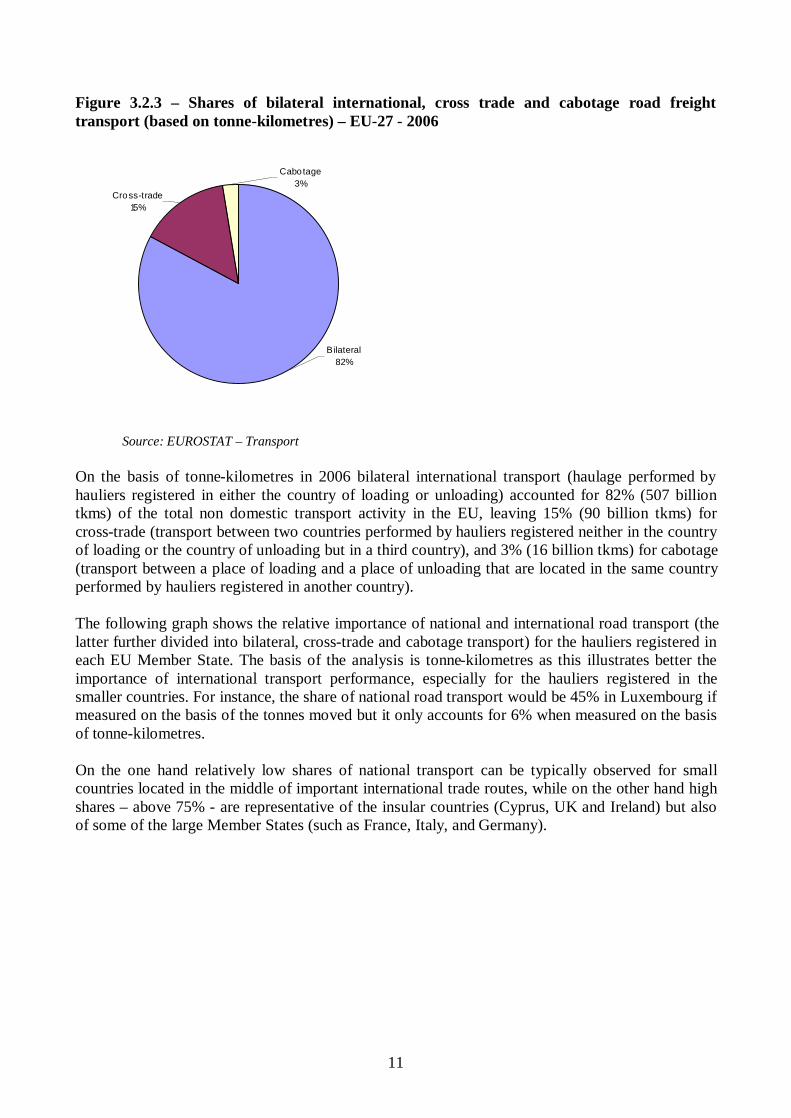
Figure 3.2.3 – Shares of bilateral international, cross trade and cabotage road freight transport (based on tonne-kilometres) – EU-27 - 2006
Bilateral82%
Cross-trade15%
Cabotage3%
Source: EUROSTAT – Transport
On the basis of tonne-kilometres in 2006 bilateral international transport (haulage performed by hauliers registered in either the country of loading or unloading) accounted for 82% (507 billion tkms) of the total non domestic transport activity in the EU, leaving 15% (90 billion tkms) for cross-trade (transport between two countries performed by hauliers registered neither in the country of loading or the country of unloading but in a third country), and 3% (16 billion tkms) for cabotage (transport between a place of loading and a place of unloading that are located in the same country performed by hauliers registered in another country). The following graph shows the relative importance of national and international road transport (the latter further divided into bilateral, cross-trade and cabotage transport) for the hauliers registered in each EU Member State. The basis of the analysis is tonne-kilometres as this illustrates better the importance of international transport performance, especially for the hauliers registered in the smaller countries. For instance, the share of national road transport would be 45% in Luxembourg if measured on the basis of the tonnes moved but it only accounts for 6% when measured on the basis of tonne-kilometres. On the one hand relatively low shares of national transport can be typically observed for small countries located in the middle of important international trade routes, while on the other hand high shares – above 75% - are representative of the insular countries (Cyprus, UK and Ireland) but also of some of the large Member States (such as France, Italy, and Germany).
12
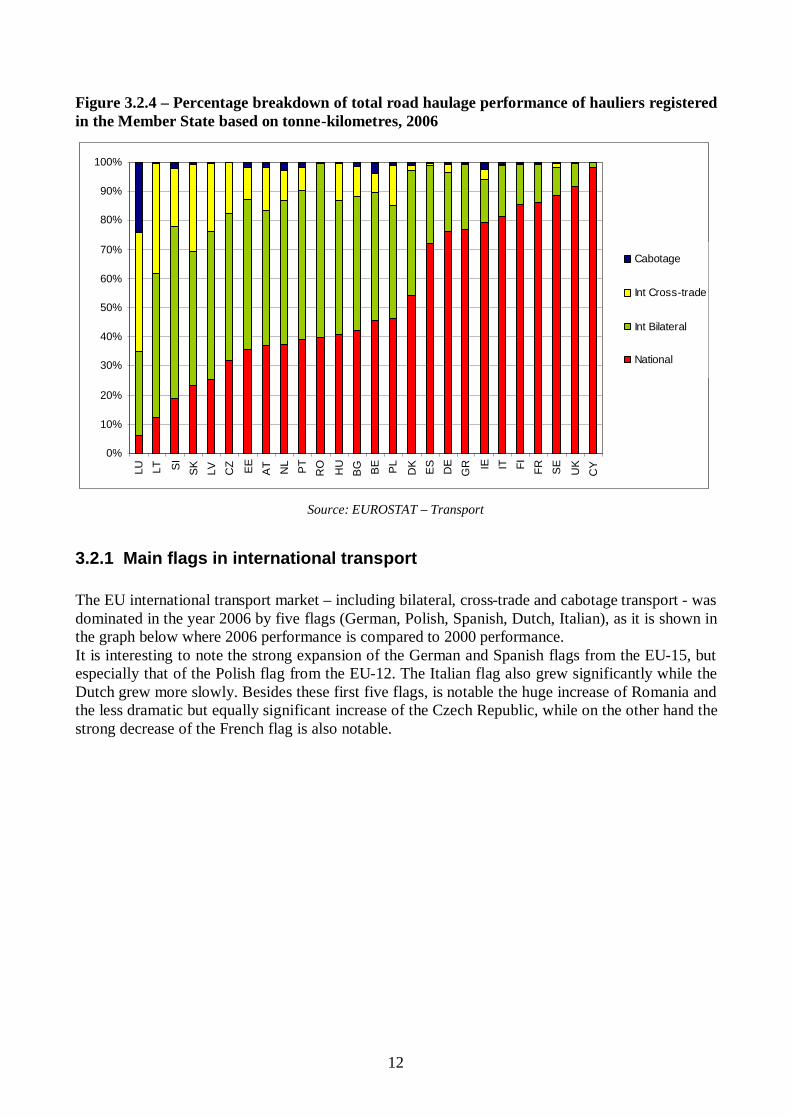
Figure 3.2.4 – Percentage breakdown of total road haulage performance of hauliers registered in the Member State based on tonne-kilometres, 2006
0%
10%
20%
30%
40%
50%
60%
70%
80%
90%
100%
LU LT SI
SK
LV CZ EE
AT NL PT
RO HU
BG BE PL
DK ES
DE
GR IE IT FI FR SE
UK
CY
Cabotage
Int Cross-trade
Int Bilateral
National
Source: EUROSTAT – Transport
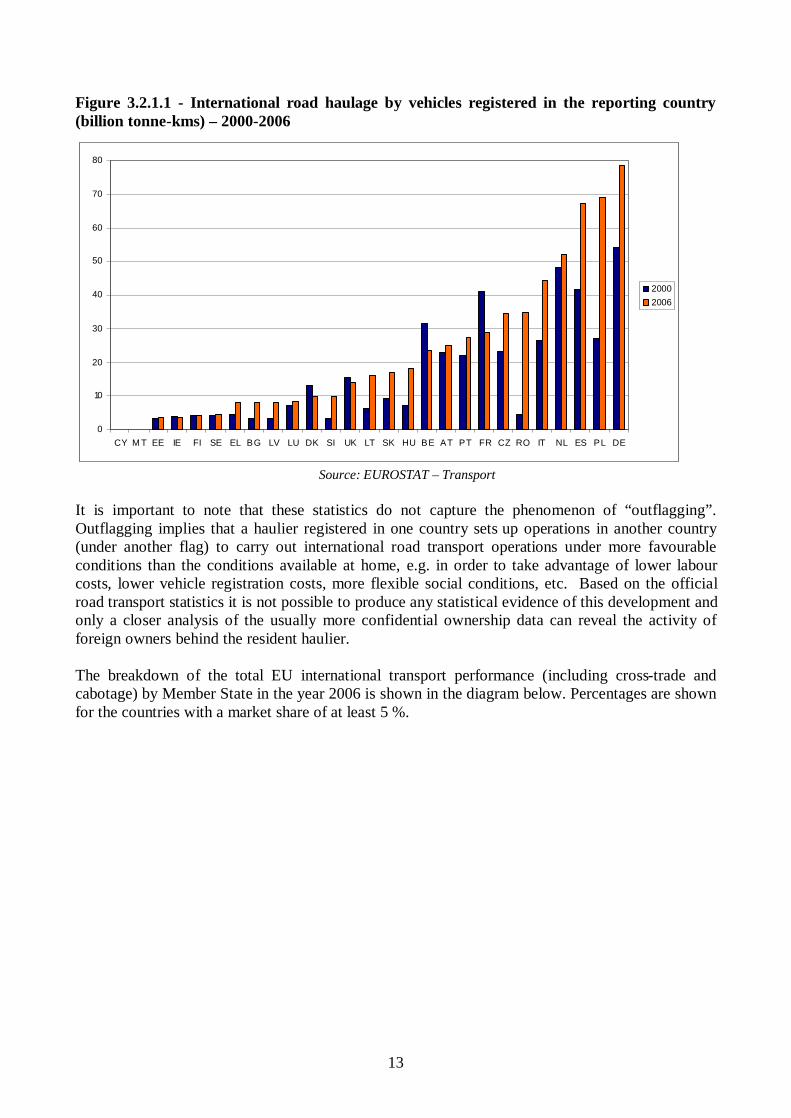
3.2.1 Main flags in international transport The EU international transport market – including bilateral, cross-trade and cabotage transport - was dominated in the year 2006 by five flags (German, Polish, Spanish, Dutch, Italian), as it is shown in the graph below where 2006 performance is compared to 2000 performance. It is interesting to note the strong expansion of the German and Spanish flags from the EU-15, but especially that of the Polish flag from the EU-12. The Italian flag also grew significantly while the Dutch grew more slowly. Besides these first five flags, is notable the huge increase of Romania and the less dramatic but equally significant increase of the Czech Republic, while on the other hand the strong decrease of the French flag is also notable.
13
Figure 3.2.1.1 - International road haulage by vehicles registered in the reporting country (billion tonne-kms) – 2000-2006
0
10
20
30
40
50
60
70
80
CY M T EE IE FI SE EL BG LV LU DK SI UK LT SK HU BE AT PT FR CZ RO IT NL ES PL DE
20002006
Source: EUROSTAT – Transport
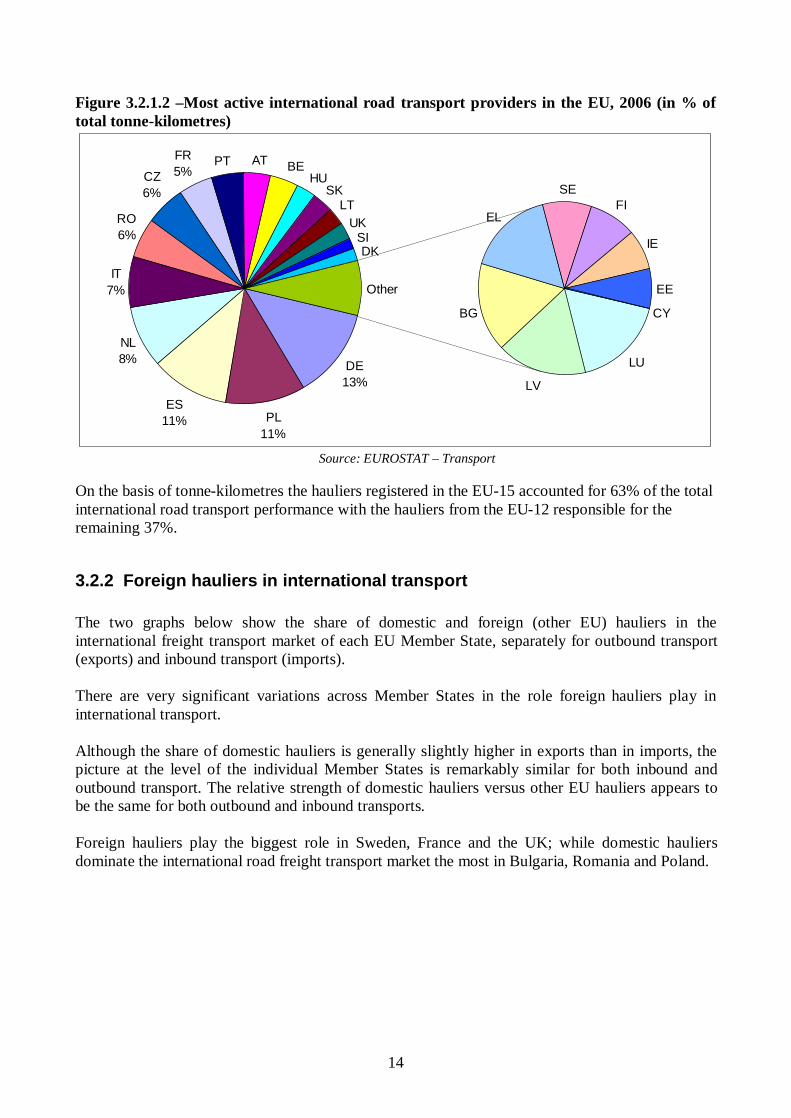
It is important to note that these statistics do not capture the phenomenon of “outflagging”. Outflagging implies that a haulier registered in one country sets up operations in another country (under another flag) to carry out international road transport operations under more favourable conditions than the conditions available at home, e.g. in order to take advantage of lower labour costs, lower vehicle registration costs, more flexible social conditions, etc. Based on the official road transport statistics it is not possible to produce any statistical evidence of this development and only a closer analysis of the usually more confidential ownership data can reveal the activity of foreign owners behind the resident haulier. The breakdown of the total EU international transport performance (including cross-trade and cabotage) by Member State in the year 2006 is shown in the diagram below. Percentages are shown for the countries with a market share of at least 5 %.
14
Figure 3.2.1.2 –Most active international road transport providers in the EU, 2006 (in % of total tonne-kilometres)
PT AT BEHU
SKLT
UKSIDK
LU
LV
BG
EL
SEFI
IE
EE
CY
FR5%CZ
6%
RO6%
IT7%
NL8%
ES11% PL
11%
DE13%
Other
Source: EUROSTAT – Transport
On the basis of tonne-kilometres the hauliers registered in the EU-15 accounted for 63% of the total international road transport performance with the hauliers from the EU-12 responsible for the remaining 37%.
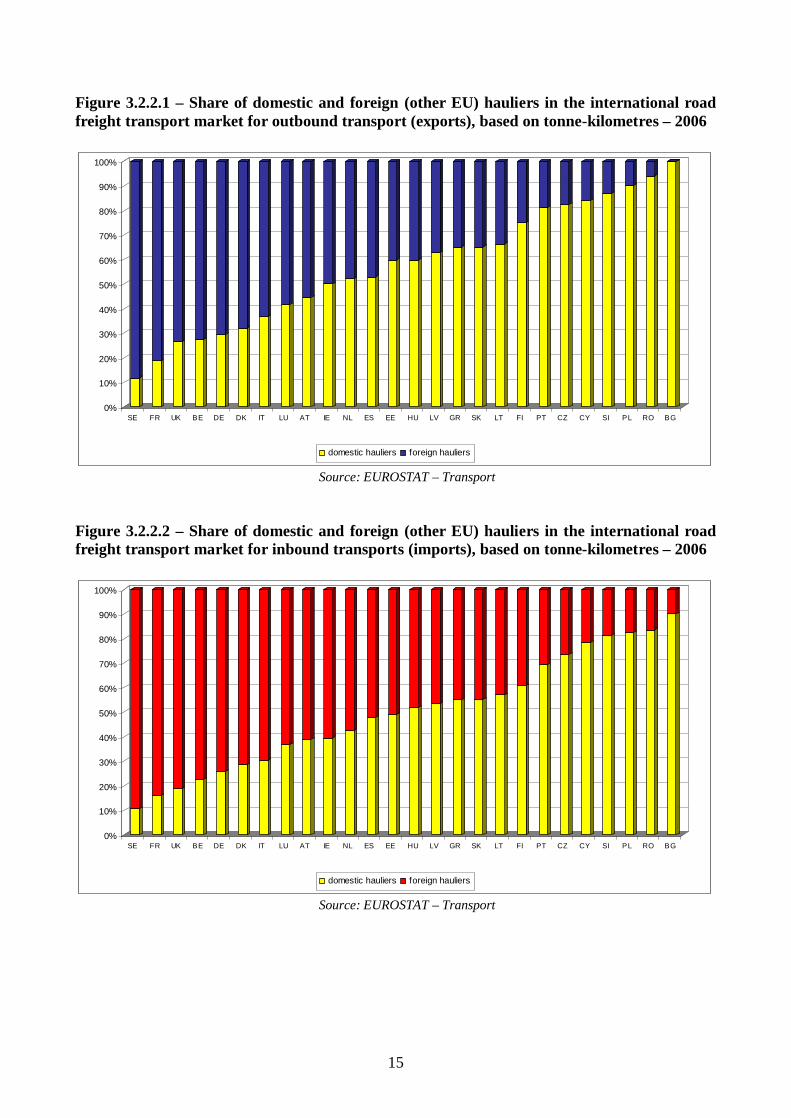
3.2.2 Foreign hauliers in international transport The two graphs below show the share of domestic and foreign (other EU) hauliers in the international freight transport market of each EU Member State, separately for outbound transport (exports) and inbound transport (imports). There are very significant variations across Member States in the role foreign hauliers play in international transport. Although the share of domestic hauliers is generally slightly higher in exports than in imports, the picture at the level of the individual Member States is remarkably similar for both inbound and outbound transport. The relative strength of domestic hauliers versus other EU hauliers appears to be the same for both outbound and inbound transports. Foreign hauliers play the biggest role in Sweden, France and the UK; while domestic hauliers dominate the international road freight transport market the most in Bulgaria, Romania and Poland.
15
Figure 3.2.2.1 – Share of domestic and foreign (other EU) hauliers in the international road freight transport market for outbound transport (exports), based on tonne-kilometres – 2006
0%
10%
20%
30%
40%
50%
60%
70%
80%
90%
100%
SE FR UK BE DE DK IT LU AT IE NL ES EE HU LV GR SK LT FI PT CZ CY SI PL RO BG
domestic hauliers foreign hauliers
Source: EUROSTAT – Transport Figure 3.2.2.2 – Share of domestic and foreign (other EU) hauliers in the international road freight transport market for inbound transports (imports), based on tonne-kilometres – 2006
0%
10%
20%
30%
40%
50%
60%
70%
80%
90%
100%
SE FR UK BE DE DK IT LU AT IE NL ES EE HU LV GR SK LT FI PT CZ CY SI PL RO BG
domestic hauliers foreign hauliers
Source: EUROSTAT – Transport
16
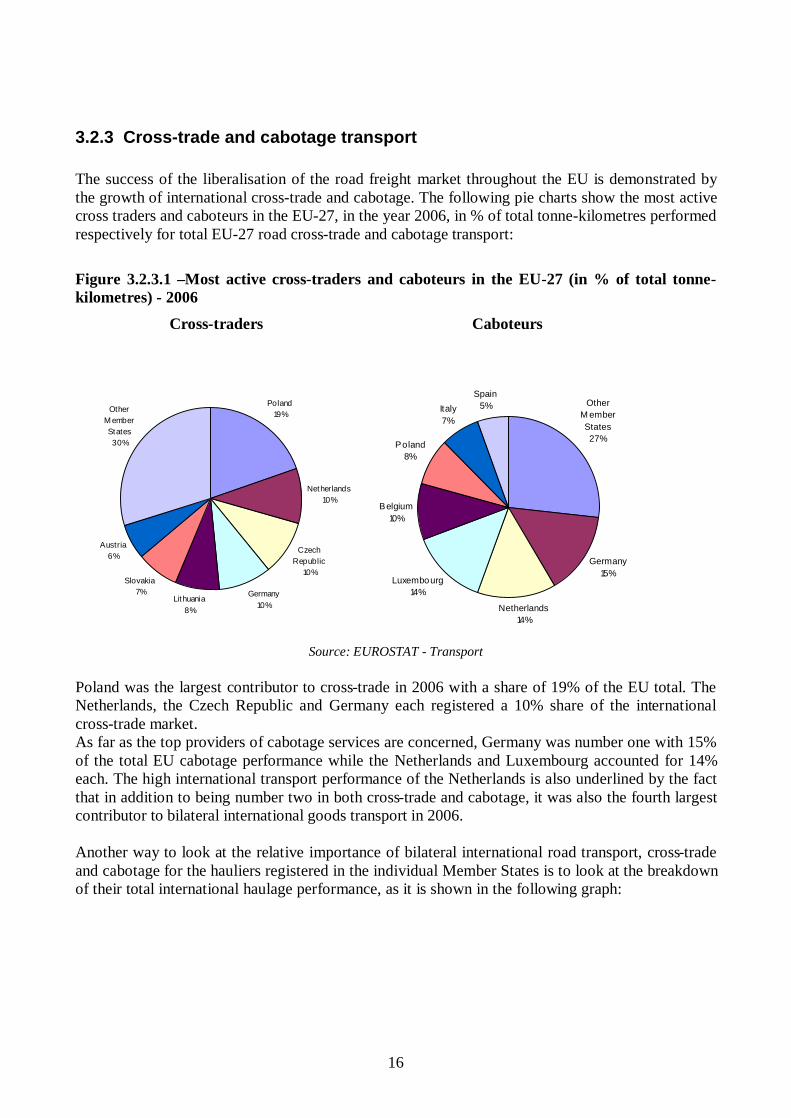
3.2.3 Cross-trade and cabotage transport The success of the liberalisation of the road freight market throughout the EU is demonstrated by the growth of international cross-trade and cabotage. The following pie charts show the most active cross traders and caboteurs in the EU-27, in the year 2006, in % of total tonne-kilometres performed respectively for total EU-27 road cross-trade and cabotage transport: Figure 3.2.3.1 –Most active cross-traders and caboteurs in the EU-27 (in % of total tonne-kilometres) - 2006
Cross-traders Caboteurs
Poland19%
Netherlands10%
Czech Republic
10%
Germany 10%
Lithuania8%
Slovakia7%
Austria6%
Other M ember States30%
Other M ember States27%
Germany 15%
Netherlands14%
Luxembourg14%
Belgium10%
Poland8%
Italy7%
Spain5%
Source: EUROSTAT - Transport
Poland was the largest contributor to cross-trade in 2006 with a share of 19% of the EU total. The Netherlands, the Czech Republic and Germany each registered a 10% share of the international cross-trade market. As far as the top providers of cabotage services are concerned, Germany was number one with 15% of the total EU cabotage performance while the Netherlands and Luxembourg accounted for 14% each. The high international transport performance of the Netherlands is also underlined by the fact that in addition to being number two in both cross-trade and cabotage, it was also the fourth largest contributor to bilateral international goods transport in 2006. Another way to look at the relative importance of bilateral international road transport, cross-trade and cabotage for the hauliers registered in the individual Member States is to look at the breakdown of their total international haulage performance, as it is shown in the following graph:
17
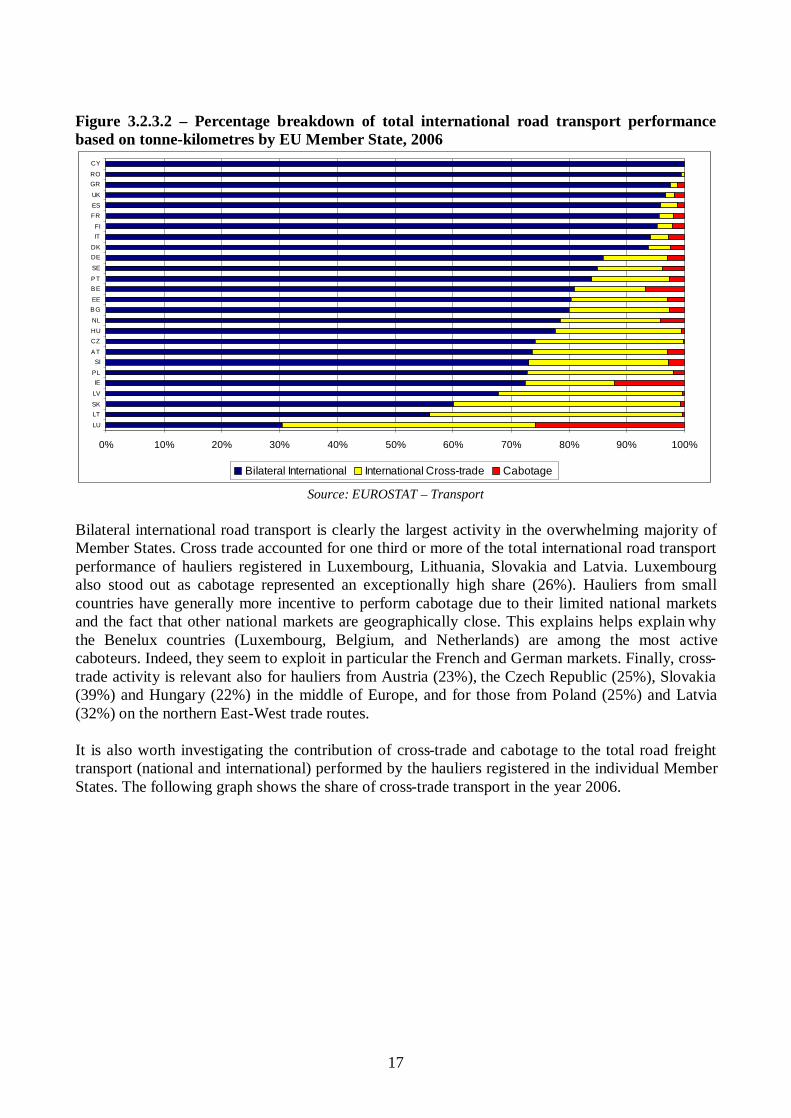
Figure 3.2.3.2 – Percentage breakdown of total international road transport performance based on tonne-kilometres by EU Member State, 2006
0% 10% 20% 30% 40% 50% 60% 70% 80% 90% 100%
LU
LTSK
LV
IEPL
SIAT
CZHUNL
BGEE
BEPT
SE
DEDK
ITFI
FRESUK
GRRO
CY
Bilateral International International Cross-trade Cabotage
Source: EUROSTAT – Transport
Bilateral international road transport is clearly the largest activity in the overwhelming majority of Member States. Cross trade accounted for one third or more of the total international road transport performance of hauliers registered in Luxembourg, Lithuania, Slovakia and Latvia. Luxembourg also stood out as cabotage represented an exceptionally high share (26%). Hauliers from small countries have generally more incentive to perform cabotage due to their limited national markets and the fact that other national markets are geographically close. This explains helps explain why the Benelux countries (Luxembourg, Belgium, and Netherlands) are among the most active caboteurs. Indeed, they seem to exploit in particular the French and German markets. Finally, cross-trade activity is relevant also for hauliers from Austria (23%), the Czech Republic (25%), Slovakia (39%) and Hungary (22%) in the middle of Europe, and for those from Poland (25%) and Latvia (32%) on the northern East-West trade routes. It is also worth investigating the contribution of cross-trade and cabotage to the total road freight transport (national and international) performed by the hauliers registered in the individual Member States. The following graph shows the share of cross-trade transport in the year 2006.
18
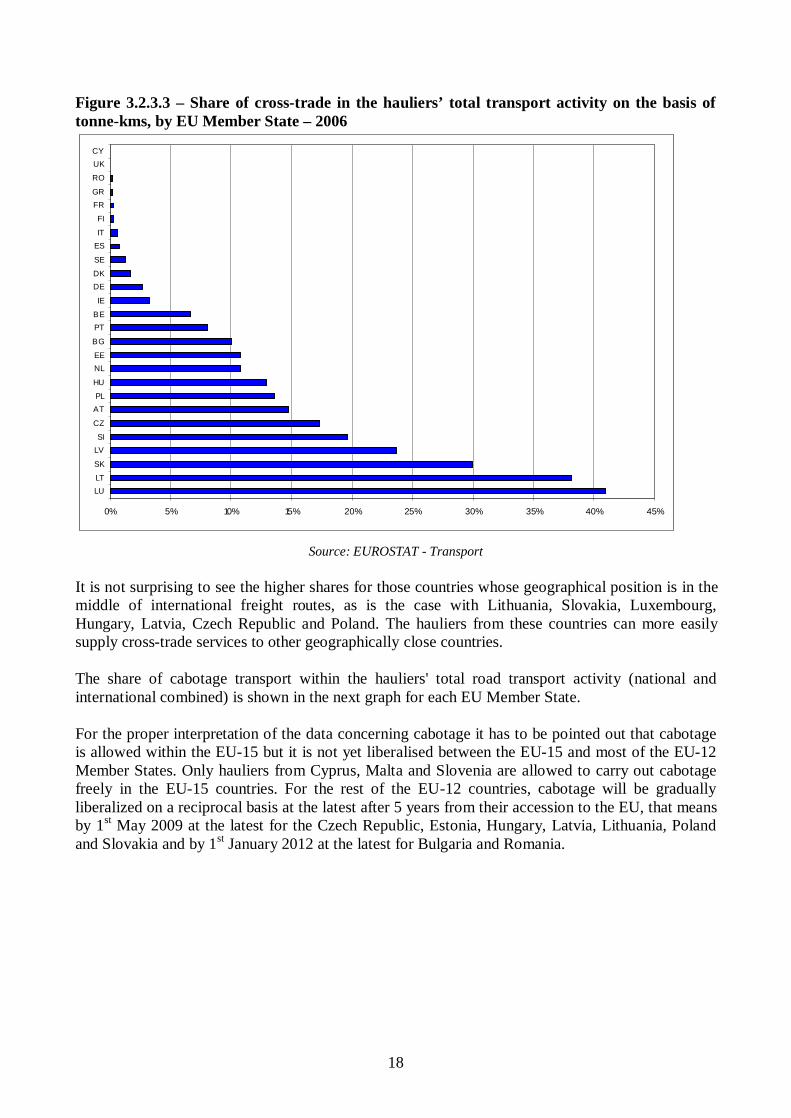
Figure 3.2.3.3 – Share of cross-trade in the hauliers’ total transport activity on the basis of tonne-kms, by EU Member State – 2006
0% 5% 10% 15% 20% 25% 30% 35% 40% 45%
LULT
SK
LVSI
CZ
ATPL
HU
NLEE
BG
PTBE
IE
DEDK
SE
ESIT
FI
FRGR
RO
UKCY
Source: EUROSTAT - Transport
It is not surprising to see the higher shares for those countries whose geographical position is in the middle of international freight routes, as is the case with Lithuania, Slovakia, Luxembourg, Hungary, Latvia, Czech Republic and Poland. The hauliers from these countries can more easily supply cross-trade services to other geographically close countries. The share of cabotage transport within the hauliers' total road transport activity (national and international combined) is shown in the next graph for each EU Member State. For the proper interpretation of the data concerning cabotage it has to be pointed out that cabotage is allowed within the EU-15 but it is not yet liberalised between the EU-15 and most of the EU-12 Member States. Only hauliers from Cyprus, Malta and Slovenia are allowed to carry out cabotage freely in the EU-15 countries. For the rest of the EU-12 countries, cabotage will be gradually liberalized on a reciprocal basis at the latest after 5 years from their accession to the EU, that means by 1st May 2009 at the latest for the Czech Republic, Estonia, Hungary, Latvia, Lithuania, Poland and Slovakia and by 1st January 2012 at the latest for Bulgaria and Romania.
19
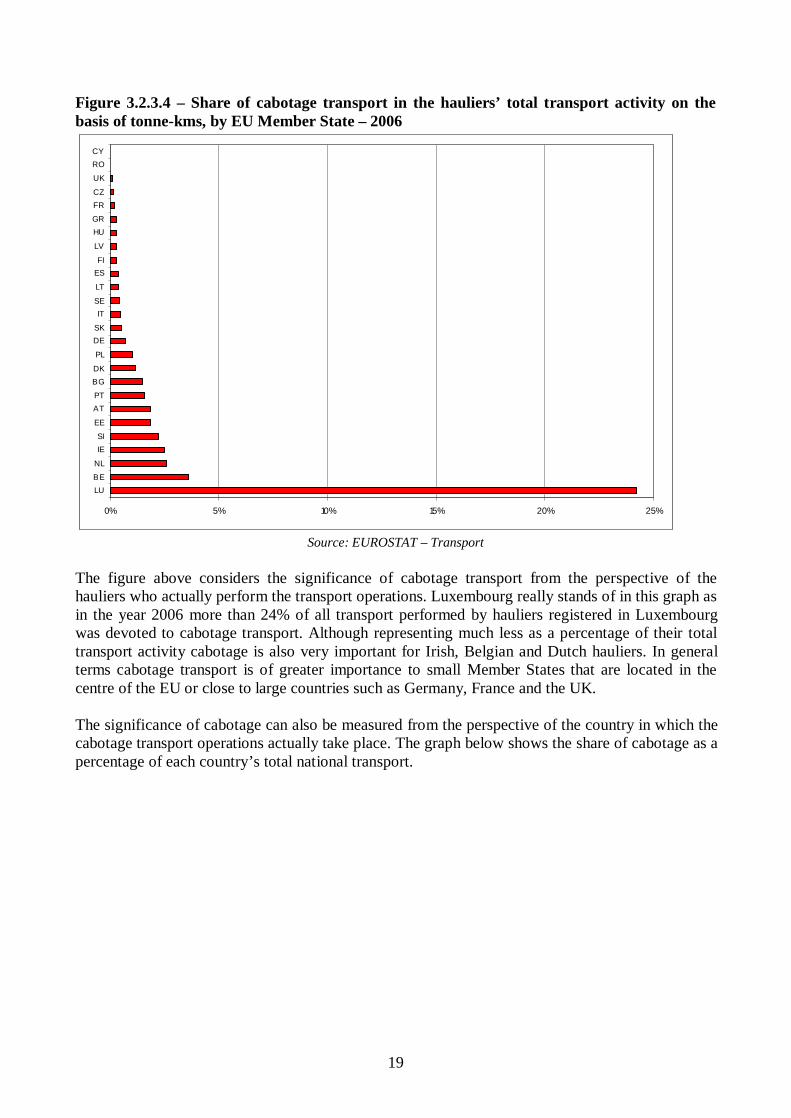
Figure 3.2.3.4 – Share of cabotage transport in the hauliers’ total transport activity on the basis of tonne-kms, by EU Member State – 2006
0% 5% 10% 15% 20% 25%
LUBE
NL
IESI
EE
ATPT
BGDK
PL
DESK
ITSE
LT
ESFI
LV
HUGR
FRCZ
UK
ROCY
Source: EUROSTAT – Transport
The figure above considers the significance of cabotage transport from the perspective of the hauliers who actually perform the transport operations. Luxembourg really stands of in this graph as in the year 2006 more than 24% of all transport performed by hauliers registered in Luxembourg was devoted to cabotage transport. Although representing much less as a percentage of their total transport activity cabotage is also very important for Irish, Belgian and Dutch hauliers. In general terms cabotage transport is of greater importance to small Member States that are located in the centre of the EU or close to large countries such as Germany, France and the UK. The significance of cabotage can also be measured from the perspective of the country in which the cabotage transport operations actually take place. The graph below shows the share of cabotage as a percentage of each country’s total national transport.

20
Figure 3.2.3.5 – Most cabotaged countries: share of cabotage in total domestic market in the country where the cabotage takes place on the basis of tonne-kms – 2006
0.0% 0.5% 1.0% 1.5% 2.0% 2.5% 3.0% 3.5%
BE
LU
FR
AT
DK
SE
DE
IE
NL
UK
ES
GR
IT
CZ
SK
HU
BG
IT
PT
RO
EE
FI
LV
PL
SI
Source: EUROSTAT - Transport
The figure above is an indication of the market share of foreign hauliers within the domestic markets of the Member States. For the EU as a whole the cabotage penetration rate is still only about 1 %. It is worth noting that cabotage is not a one way street and in many cases it is a reciprocal activity between Member States. Many of the countries that are the most active in performing cabotage are also amongst the most cabotaged countries (e.g. Germany).
21
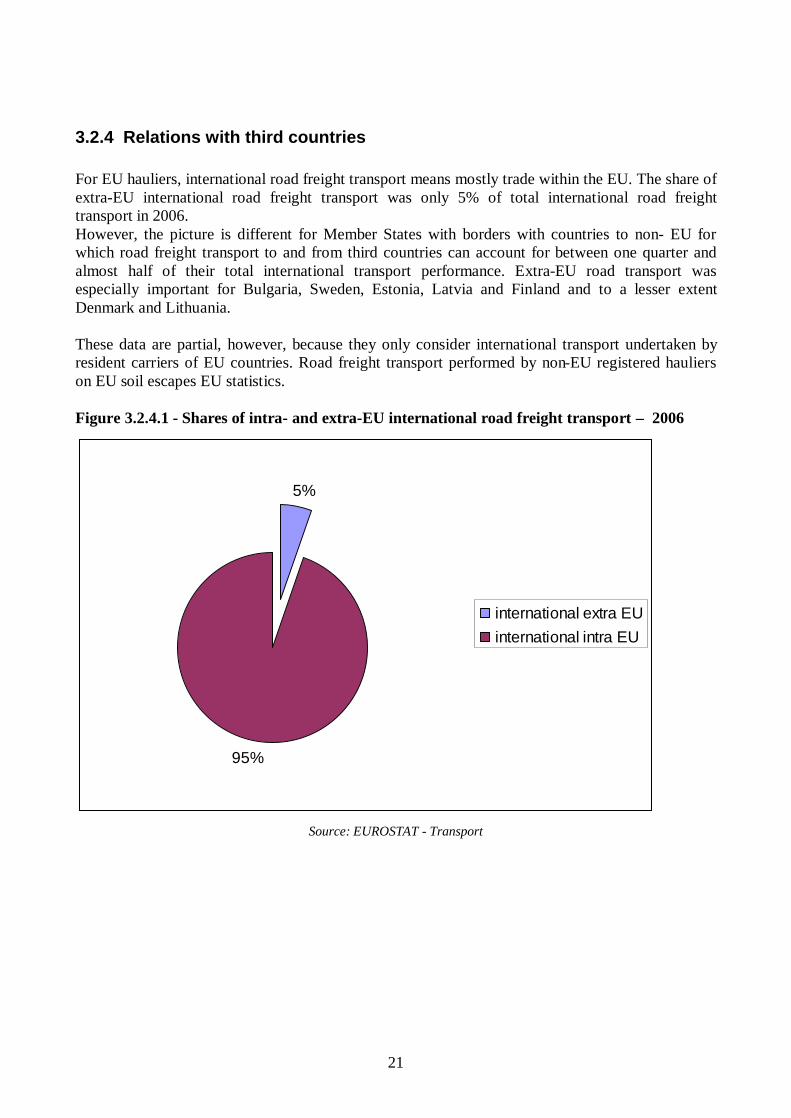
3.2.4 Relations with third countries For EU hauliers, international road freight transport means mostly trade within the EU. The share of extra-EU international road freight transport was only 5% of total international road freight transport in 2006. However, the picture is different for Member States with borders with countries to non- EU for which road freight transport to and from third countries can account for between one quarter and almost half of their total international transport performance. Extra-EU road transport was especially important for Bulgaria, Sweden, Estonia, Latvia and Finland and to a lesser extent Denmark and Lithuania. These data are partial, however, because they only consider international transport undertaken by resident carriers of EU countries. Road freight transport performed by non-EU registered hauliers on EU soil escapes EU statistics. Figure 3.2.4.1 - Shares of intra- and extra-EU international road freight transport – 2006
5%
95%
international extra EUinternational intra EU
Source: EUROSTAT - Transport
22
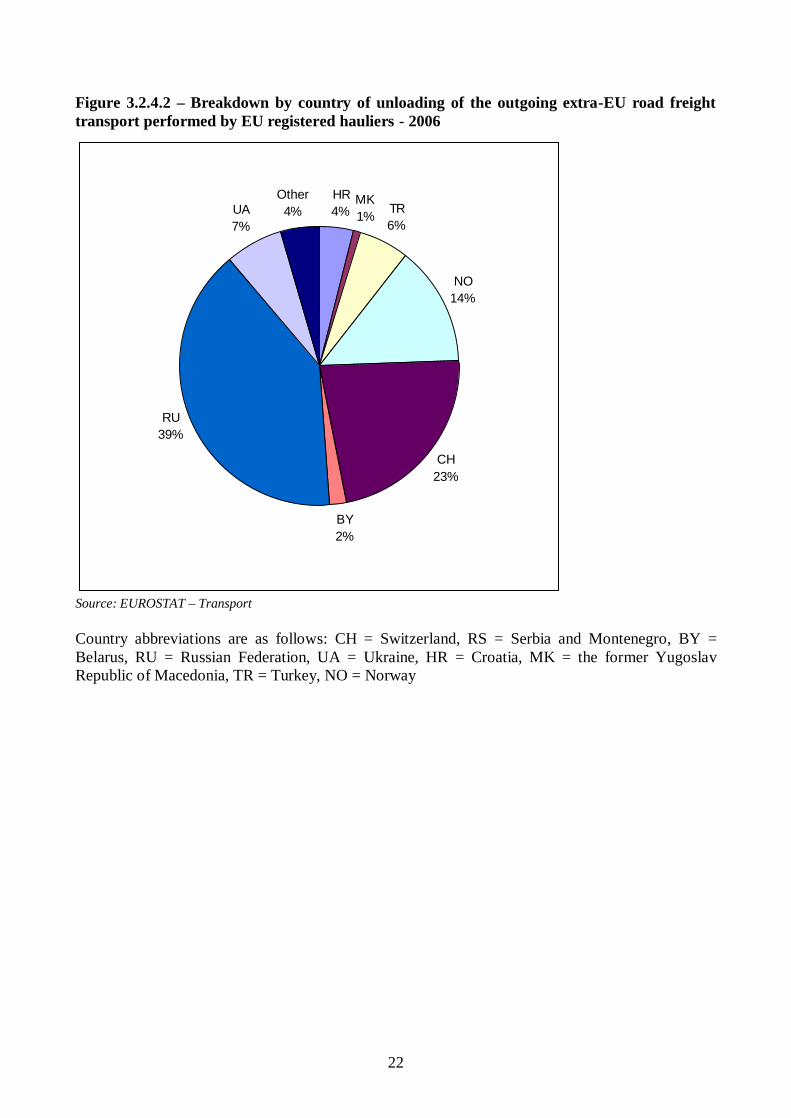
Figure 3.2.4.2 – Breakdown by country of unloading of the outgoing extra-EU road freight transport performed by EU registered hauliers - 2006
HR4%
MK1% TR
6%
NO14%
CH23%
BY2%
RU39%
UA7%
Other4%
Source: EUROSTAT – Transport Country abbreviations are as follows: CH = Switzerland, RS = Serbia and Montenegro, BY = Belarus, RU = Russian Federation, UA = Ukraine, HR = Croatia, MK = the former Yugoslav Republic of Macedonia, TR = Turkey, NO = Norway
23
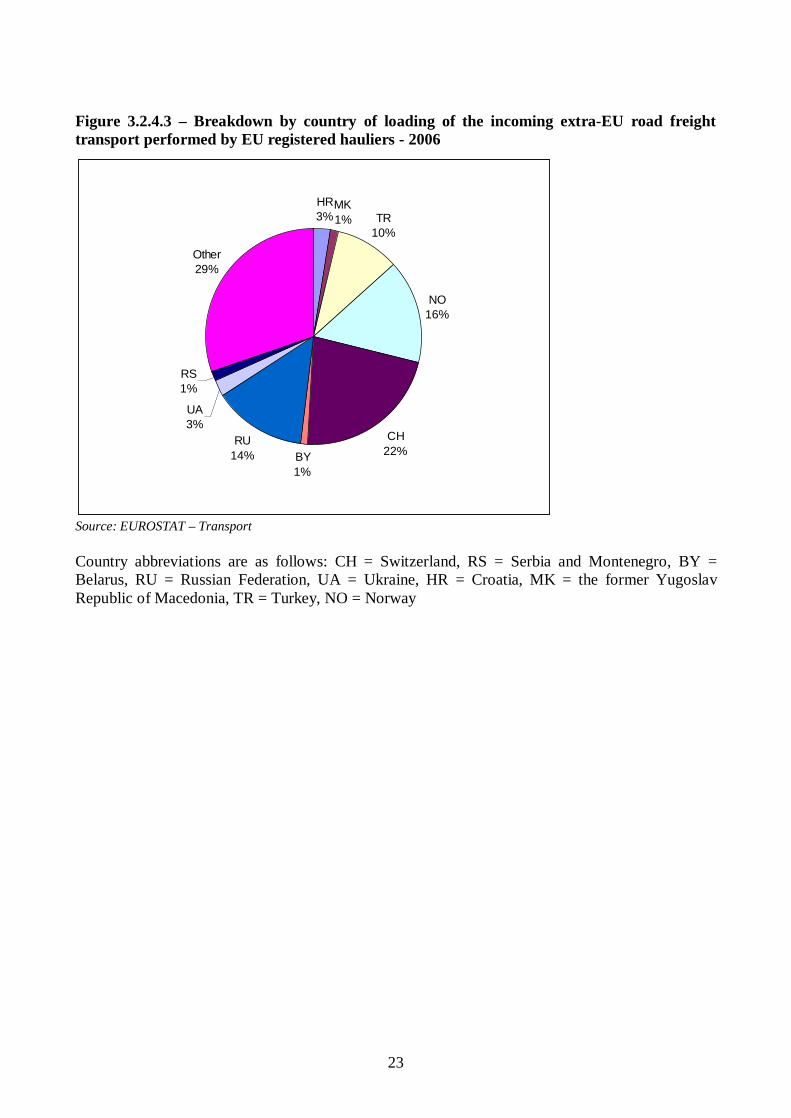
Figure 3.2.4.3 – Breakdown by country of loading of the incoming extra-EU road freight transport performed by EU registered hauliers - 2006
HR3%
MK1% TR
10%
NO16%
CH22%BY
1%
RU14%
UA3%
RS1%
Other29%
Source: EUROSTAT – Transport Country abbreviations are as follows: CH = Switzerland, RS = Serbia and Montenegro, BY = Belarus, RU = Russian Federation, UA = Ukraine, HR = Croatia, MK = the former Yugoslav Republic of Macedonia, TR = Turkey, NO = Norway
24
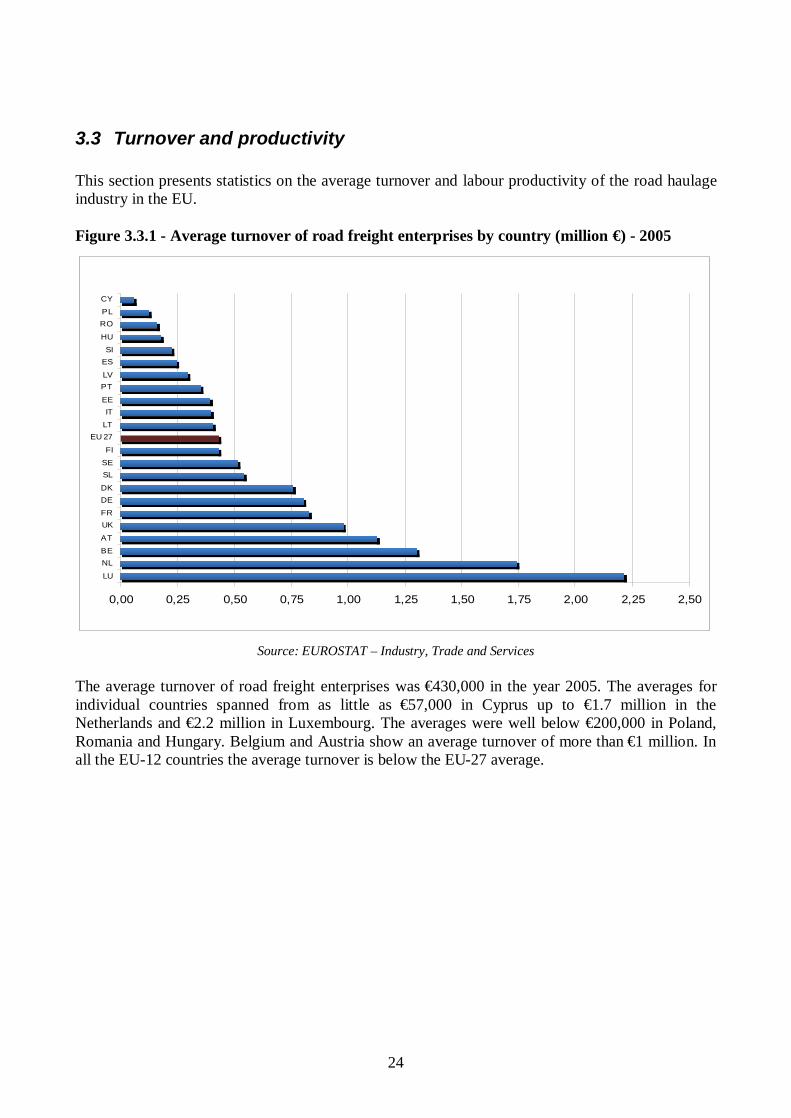
3.3 Turnover and productivity This section presents statistics on the average turnover and labour productivity of the road haulage industry in the EU.
Figure 3.3.1 - Average turnover of road freight enterprises by country (million €) - 2005
0,00 0,25 0,50 0,75 1,00 1,25 1,50 1,75 2,00 2,25 2,50
LU
NLBE
AT
UKFR
DEDK
SLSE
FI
EU 27LT
ITEE
PTLV
ESSI
HU
ROPL
CY
Source: EUROSTAT – Industry, Trade and Services
The average turnover of road freight enterprises was €430,000 in the year 2005. The averages for individual countries spanned from as little as €57,000 in Cyprus up to €1.7 million in the Netherlands and €2.2 million in Luxembourg. The averages were well below €200,000 in Poland, Romania and Hungary. Belgium and Austria show an average turnover of more than €1 million. In all the EU-12 countries the average turnover is below the EU-27 average.
25
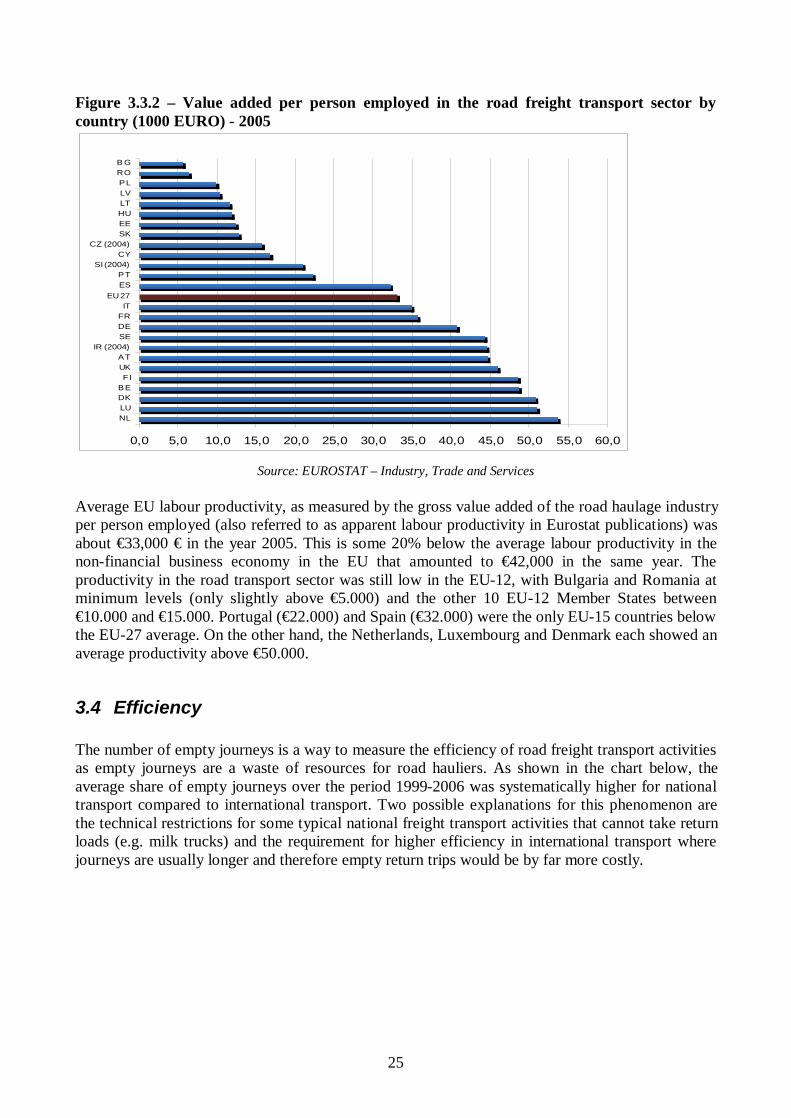
Figure 3.3.2 – Value added per person employed in the road freight transport sector by country (1000 EURO) - 2005
0,0 5,0 10,0 15,0 20,0 25,0 30,0 35,0 40,0 45,0 50,0 55,0 60,0
NLLUDKBEFI
UKAT
IR (2004)SEDEFRIT
EU 27ESPT
SI (2004)CY
CZ (2004)SKEEHULTLVPLROB G
Source: EUROSTAT – Industry, Trade and Services
Average EU labour productivity, as measured by the gross value added of the road haulage industry per person employed (also referred to as apparent labour productivity in Eurostat publications) was about €33,000 € in the year 2005. This is some 20% below the average labour productivity in the non-financial business economy in the EU that amounted to €42,000 in the same year. The productivity in the road transport sector was still low in the EU-12, with Bulgaria and Romania at minimum levels (only slightly above €5.000) and the other 10 EU-12 Member States between €10.000 and €15.000. Portugal (€22.000) and Spain (€32.000) were the only EU-15 countries below the EU-27 average. On the other hand, the Netherlands, Luxembourg and Denmark each showed an average productivity above €50.000.
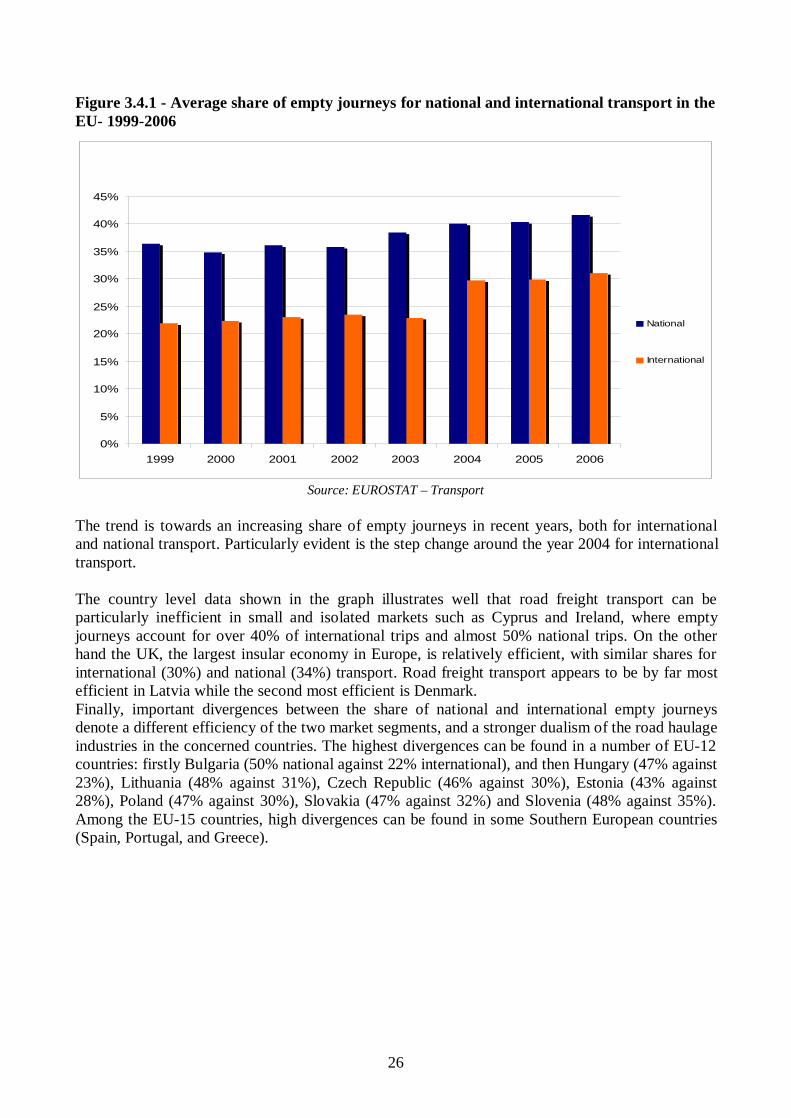
3.4 Efficiency The number of empty journeys is a way to measure the efficiency of road freight transport activities as empty journeys are a waste of resources for road hauliers. As shown in the chart below, the average share of empty journeys over the period 1999-2006 was systematically higher for national transport compared to international transport. Two possible explanations for this phenomenon are the technical restrictions for some typical national freight transport activities that cannot take return loads (e.g. milk trucks) and the requirement for higher efficiency in international transport where journeys are usually longer and therefore empty return trips would be by far more costly.
26
Figure 3.4.1 - Average share of empty journeys for national and international transport in the EU- 1999-2006
0%
5%
10%
15%
20%
25%
30%
35%
40%
45%
1999 2000 2001 2002 2003 2004 2005 2006
National
International
Source: EUROSTAT – Transport
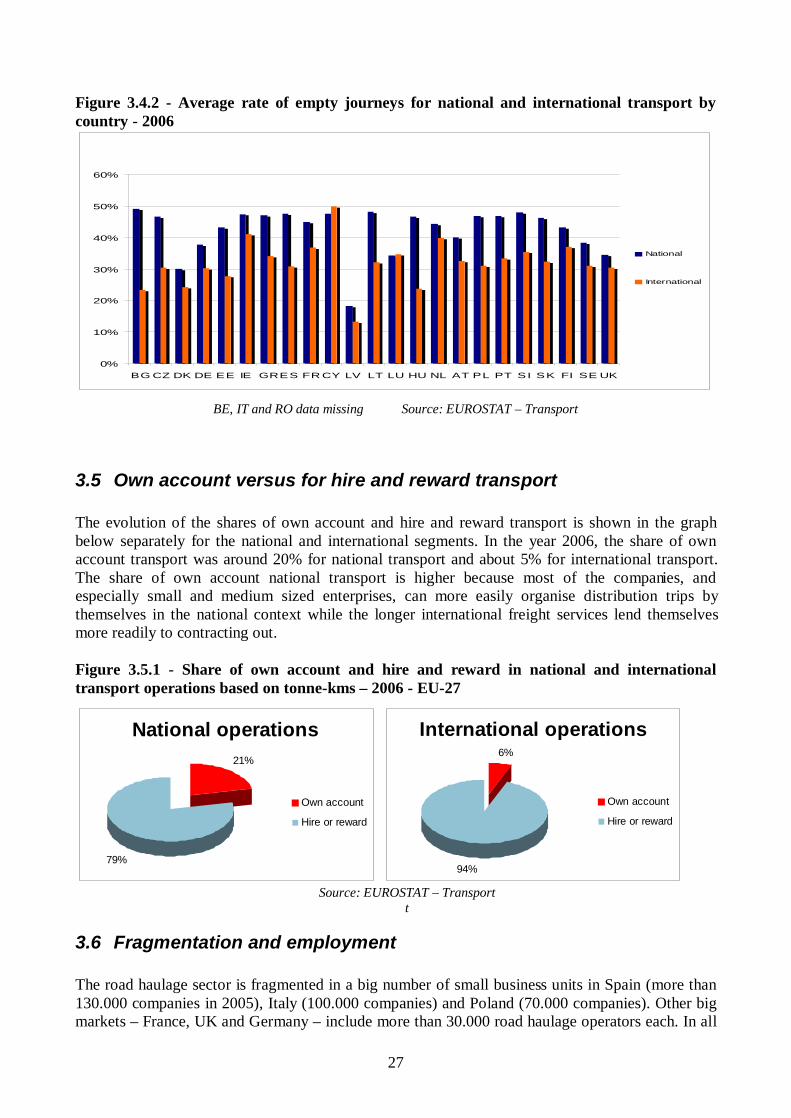
The trend is towards an increasing share of empty journeys in recent years, both for international and national transport. Particularly evident is the step change around the year 2004 for international transport. The country level data shown in the graph illustrates well that road freight transport can be particularly inefficient in small and isolated markets such as Cyprus and Ireland, where empty journeys account for over 40% of international trips and almost 50% national trips. On the other hand the UK, the largest insular economy in Europe, is relatively efficient, with similar shares for international (30%) and national (34%) transport. Road freight transport appears to be by far most efficient in Latvia while the second most efficient is Denmark. Finally, important divergences between the share of national and international empty journeys denote a different efficiency of the two market segments, and a stronger dualism of the road haulage industries in the concerned countries. The highest divergences can be found in a number of EU-12 countries: firstly Bulgaria (50% national against 22% international), and then Hungary (47% against 23%), Lithuania (48% against 31%), Czech Republic (46% against 30%), Estonia (43% against 28%), Poland (47% against 30%), Slovakia (47% against 32%) and Slovenia (48% against 35%). Among the EU-15 countries, high divergences can be found in some Southern European countries (Spain, Portugal, and Greece).
27
Figure 3.4.2 - Average rate of empty journeys for national and international transport by country - 2006
0%
10%
20%
30%
40%
50%
60%
B G C Z DK DE E E IE G R E S F R C Y L V L T L U HU NL A T P L P T S I S K F I S E UK
National
International
BE, IT and RO data missing Source: EUROSTAT – Transport
3.5 Own account versus for hire and reward transport The evolution of the shares of own account and hire and reward transport is shown in the graph below separately for the national and international segments. In the year 2006, the share of own account transport was around 20% for national transport and about 5% for international transport. The share of own account national transport is higher because most of the companies, and especially small and medium sized enterprises, can more easily organise distribution trips by themselves in the national context while the longer international freight services lend themselves more readily to contracting out.
Figure 3.5.1 - Share of own account and hire and reward in national and international transport operations based on tonne-kms – 2006 - EU-27
National operations21%
79%
Own account
Hire or reward
International operations6%
94%
Own account
Hire or reward
Source: EUROSTAT – Transport
t
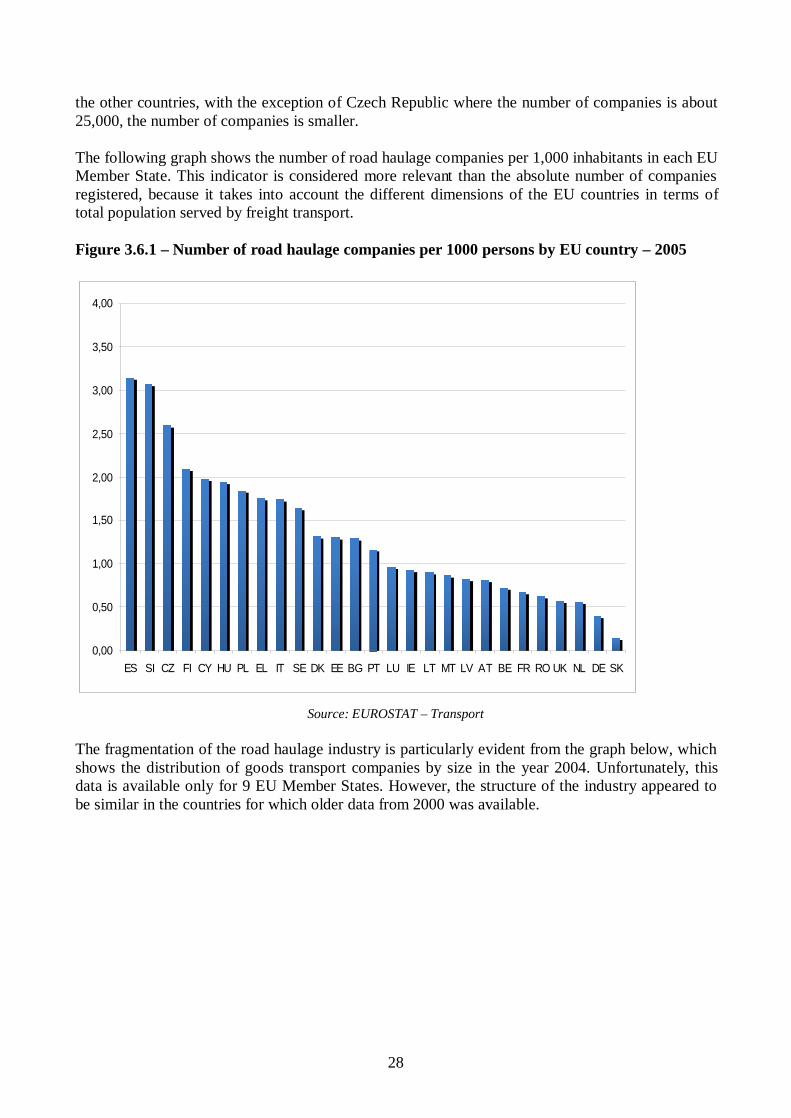
3.6 Fragmentation and employment The road haulage sector is fragmented in a big number of small business units in Spain (more than 130.000 companies in 2005), Italy (100.000 companies) and Poland (70.000 companies). Other big markets – France, UK and Germany – include more than 30.000 road haulage operators each. In all
28
the other countries, with the exception of Czech Republic where the number of companies is about 25,000, the number of companies is smaller. The following graph shows the number of road haulage companies per 1,000 inhabitants in each EU Member State. This indicator is considered more relevant than the absolute number of companies registered, because it takes into account the different dimensions of the EU countries in terms of total population served by freight transport. Figure 3.6.1 – Number of road haulage companies per 1000 persons by EU country – 2005
0,00
0,50
1,00
1,50
2,00
2,50
3,00
3,50
4,00
ES S I CZ FI CY HU PL EL IT S E DK EE BG PT L U IE L T MT LV A T BE FR RO UK NL DE S K
Source: EUROSTAT – Transport
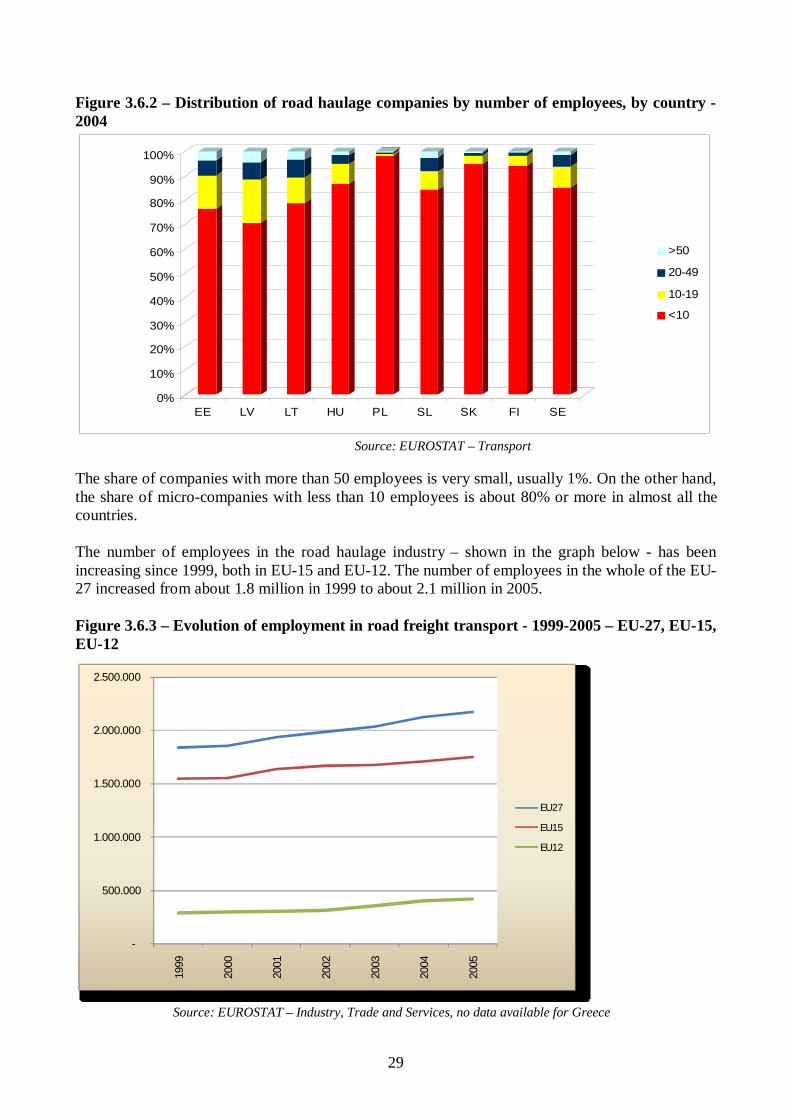
The fragmentation of the road haulage industry is particularly evident from the graph below, which shows the distribution of goods transport companies by size in the year 2004. Unfortunately, this data is available only for 9 EU Member States. However, the structure of the industry appeared to be similar in the countries for which older data from 2000 was available.
29
Figure 3.6.2 – Distribution of road haulage companies by number of employees, by country - 2004
0%
10%
20%
30%
40%
50%
60%
70%
80%
90%
100%
E E L V L T HU P L S L S K F I S E
> 50
20-49
10-19
< 10
Source: EUROSTAT – Transport
The share of companies with more than 50 employees is very small, usually 1%. On the other hand, the share of micro-companies with less than 10 employees is about 80% or more in almost all the countries. The number of employees in the road haulage industry – shown in the graph below - has been increasing since 1999, both in EU-15 and EU-12. The number of employees in the whole of the EU-27 increased from about 1.8 million in 1999 to about 2.1 million in 2005. Figure 3.6.3 – Evolution of employment in road freight transport - 1999-2005 – EU-27, EU-15, EU-12
-
500.000
1.000.000
1.500.000
2.000.000
2.500.000
1999
2000
2001
2002
2003
2004
2005
EU27
EU15
EU12
Source: EUROSTAT – Industry, Trade and Services, no data available for Greece
30
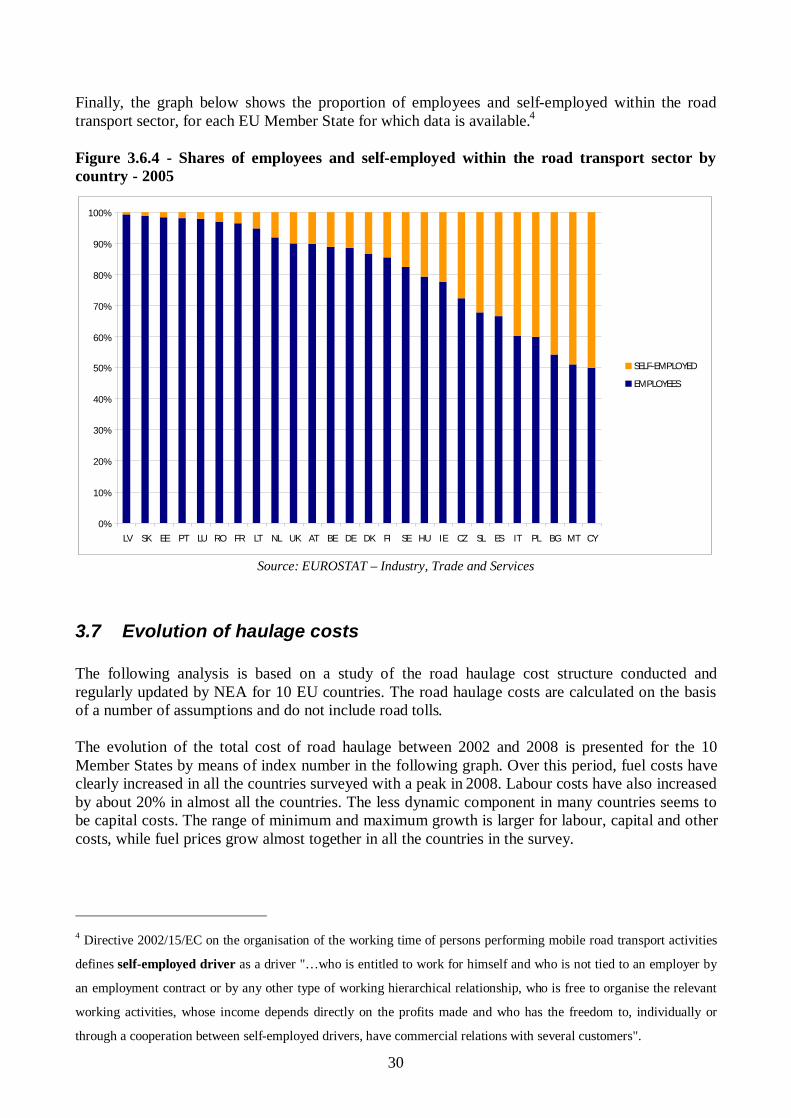
Finally, the graph below shows the proportion of employees and self-employed within the road transport sector, for each EU Member State for which data is available.4 Figure 3.6.4 - Shares of employees and self-employed within the road transport sector by country - 2005
0%
10%
20%
30%
40%
50%
60%
70%
80%
90%
100%
LV SK EE PT LU RO FR LT NL UK AT BE DE DK FI SE HU IE CZ SL ES IT PL BG MT CY
SELF-EMPLOYED
EMPLOYEES
Source: EUROSTAT – Industry, Trade and Services
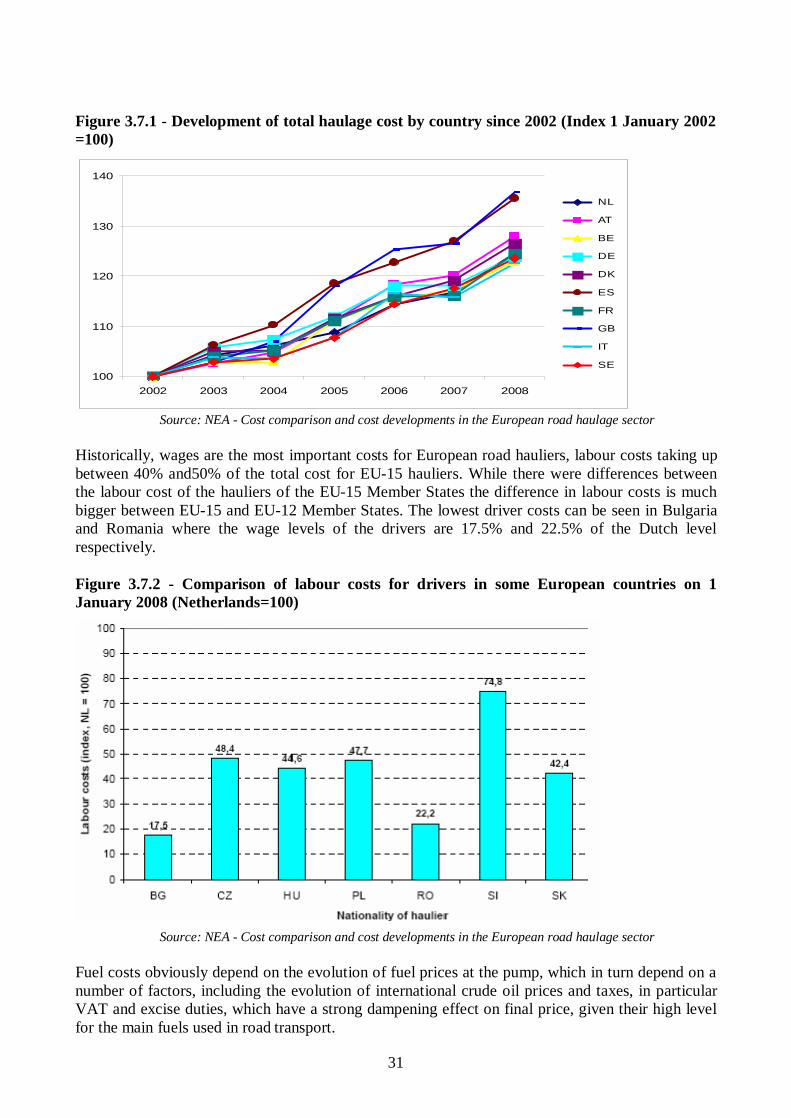
3.7 Evolution of haulage costs The following analysis is based on a study of the road haulage cost structure conducted and regularly updated by NEA for 10 EU countries. The road haulage costs are calculated on the basis of a number of assumptions and do not include road tolls. The evolution of the total cost of road haulage between 2002 and 2008 is presented for the 10 Member States by means of index number in the following graph. Over this period, fuel costs have clearly increased in all the countries surveyed with a peak in 2008. Labour costs have also increased by about 20% in almost all the countries. The less dynamic component in many countries seems to be capital costs. The range of minimum and maximum growth is larger for labour, capital and other costs, while fuel prices grow almost together in all the countries in the survey.
4 Directive 2002/15/EC on the organisation of the working time of persons performing mobile road transport activities
defines self-employed driver as a driver "…who is entitled to work for himself and who is not tied to an employer by
an employment contract or by any other type of working hierarchical relationship, who is free to organise the relevant
working activities, whose income depends directly on the profits made and who has the freedom to, individually or
through a cooperation between self-employed drivers, have commercial relations with several customers".
31
Figure 3.7.1 - Development of total haulage cost by country since 2002 (Index 1 January 2002 =100)
100
110
120
130
140
2002 2003 2004 2005 2006 2007 2008
N L
AT
B E
D E
D K
E S
F R
G B
IT
S E
Source: NEA - Cost comparison and cost developments in the European road haulage sector
Historically, wages are the most important costs for European road hauliers, labour costs taking up between 40% and50% of the total cost for EU-15 hauliers. While there were differences between the labour cost of the hauliers of the EU-15 Member States the difference in labour costs is much bigger between EU-15 and EU-12 Member States. The lowest driver costs can be seen in Bulgaria and Romania where the wage levels of the drivers are 17.5% and 22.5% of the Dutch level respectively. Figure 3.7.2 - Comparison of labour costs for drivers in some European countries on 1 January 2008 (Netherlands=100)
Source: NEA - Cost comparison and cost developments in the European road haulage sector
Fuel costs obviously depend on the evolution of fuel prices at the pump, which in turn depend on a number of factors, including the evolution of international crude oil prices and taxes, in particular VAT and excise duties, which have a strong dampening effect on final price, given their high level for the main fuels used in road transport.
32
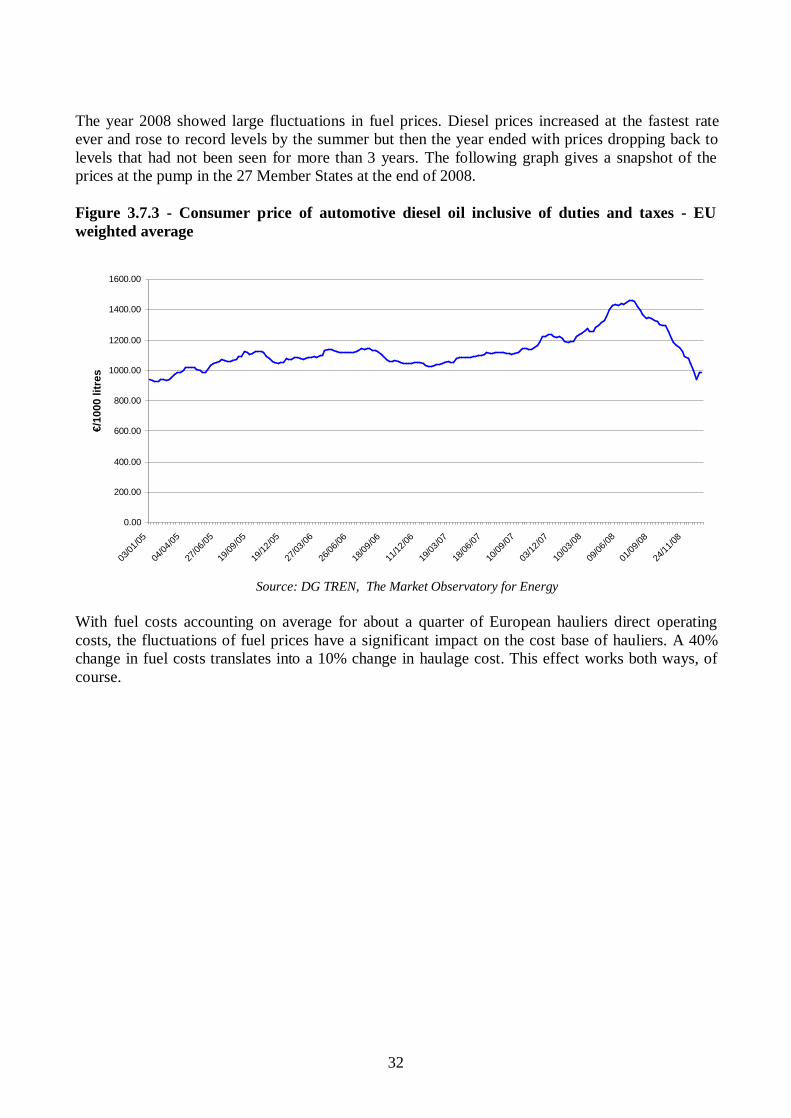
The year 2008 showed large fluctuations in fuel prices. Diesel prices increased at the fastest rate ever and rose to record levels by the summer but then the year ended with prices dropping back to levels that had not been seen for more than 3 years. The following graph gives a snapshot of the prices at the pump in the 27 Member States at the end of 2008. Figure 3.7.3 - Consumer price of automotive diesel oil inclusive of duties and taxes - EU weighted average
0.00
200.00
400.00
600.00
800.00
1000.00
1200.00
1400.00
1600.00
03/01
/05
04/04
/05
27/06
/05
19/09
/05
19/12
/05
27/03
/06
26/06
/06
18/09
/06
11/12
/06
19/03
/07
18/06
/07
10/09
/07
03/12
/07
10/03
/08
09/06
/08
01/09
/08
24/11
/08
€/10
00 li
tres
Source: DG TREN, The Market Observatory for Energy
With fuel costs accounting on average for about a quarter of European hauliers direct operating costs, the fluctuations of fuel prices have a significant impact on the cost base of hauliers. A 40% change in fuel costs translates into a 10% change in haulage cost. This effect works both ways, of course.
33
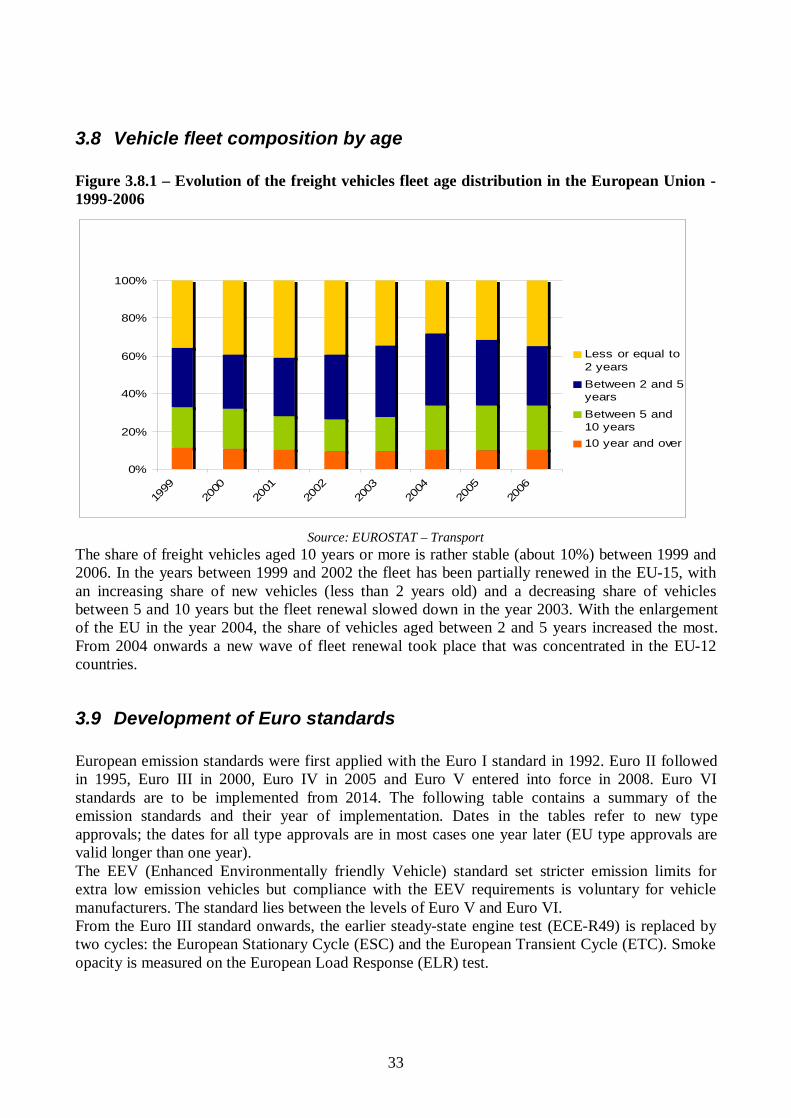
3.8 Vehicle fleet composition by age Figure 3.8.1 – Evolution of the freight vehicles fleet age distribution in the European Union - 1999-2006
0%
20%
40%
60%
80%
100%
1999
20002001
20022003
20042005
2006
L es s or equal to2 years
B etween 2 and 5years
B etween 5 and10 years
10 year and over
Source: EUROSTAT – Transport
The share of freight vehicles aged 10 years or more is rather stable (about 10%) between 1999 and 2006. In the years between 1999 and 2002 the fleet has been partially renewed in the EU-15, with an increasing share of new vehicles (less than 2 years old) and a decreasing share of vehicles between 5 and 10 years but the fleet renewal slowed down in the year 2003. With the enlargement of the EU in the year 2004, the share of vehicles aged between 2 and 5 years increased the most. From 2004 onwards a new wave of fleet renewal took place that was concentrated in the EU-12 countries.
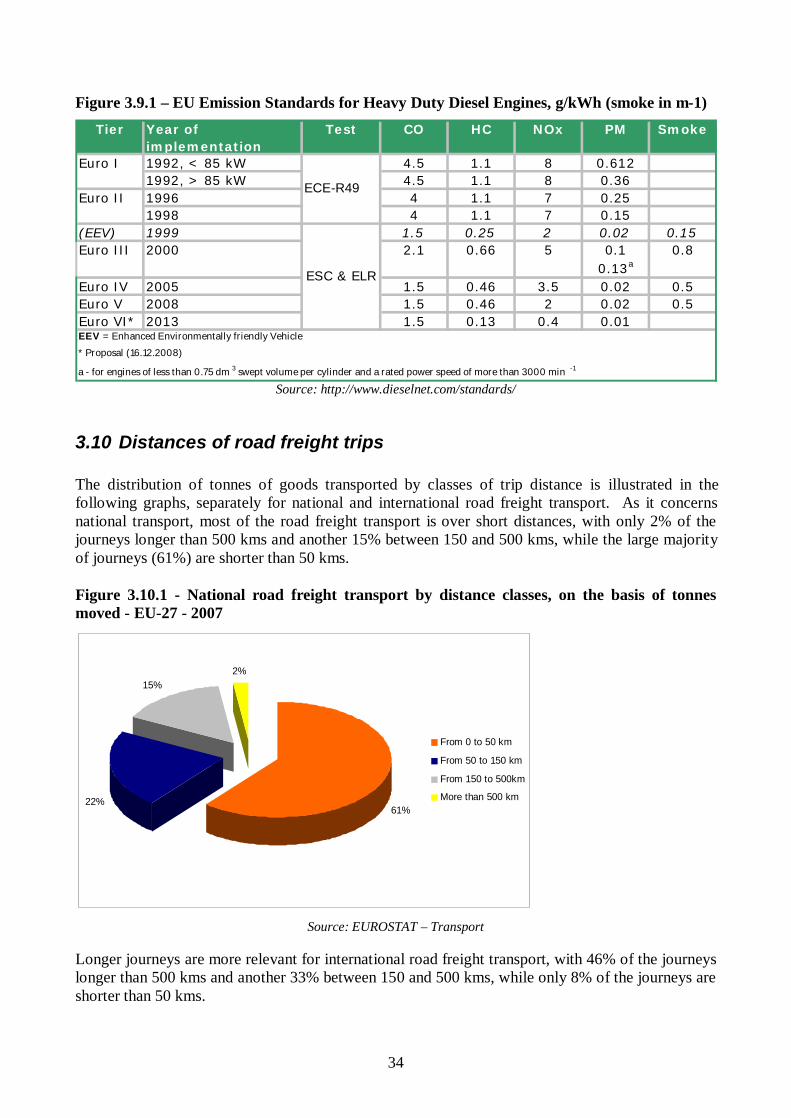
3.9 Development of Euro standards European emission standards were first applied with the Euro I standard in 1992. Euro II followed in 1995, Euro III in 2000, Euro IV in 2005 and Euro V entered into force in 2008. Euro VI standards are to be implemented from 2014. The following table contains a summary of the emission standards and their year of implementation. Dates in the tables refer to new type approvals; the dates for all type approvals are in most cases one year later (EU type approvals are valid longer than one year). The EEV (Enhanced Environmentally friendly Vehicle) standard set stricter emission limits for extra low emission vehicles but compliance with the EEV requirements is voluntary for vehicle manufacturers. The standard lies between the levels of Euro V and Euro VI. From the Euro III standard onwards, the earlier steady-state engine test (ECE-R49) is replaced by two cycles: the European Stationary Cycle (ESC) and the European Transient Cycle (ETC). Smoke opacity is measured on the European Load Response (ELR) test.
34
Figure 3.9.1 – EU Emission Standards for Heavy Duty Diesel Engines, g/kWh (smoke in m-1) Tier Year of
implementationTest CO HC NOx PM Smoke
1992, < 85 kW 4.5 1.1 8 0.6121992, > 85 kW 4.5 1.1 8 0.361996 4 1.1 7 0.251998 4 1.1 7 0.15
(EEV) 1999 1.5 0.25 2 0.02 0.150.1
0.13a
Euro IV 2005 1.5 0.46 3.5 0.02 0.5Euro V 2008 1.5 0.46 2 0.02 0.5Euro VI* 2013 1.5 0.13 0.4 0.01
Euro I
ECE-R49Euro II
2000Euro III
ESC & ELR
a - for engines of less than 0.75 dm 3 swept volume per cylinder and a rated power speed of more than 3000 min -1
2.1 0.66 5 0.8
EEV = Enhanced Environmentally friendly Vehicle
* Proposal (16.12.2008)
Source: http://www.dieselnet.com/standards/
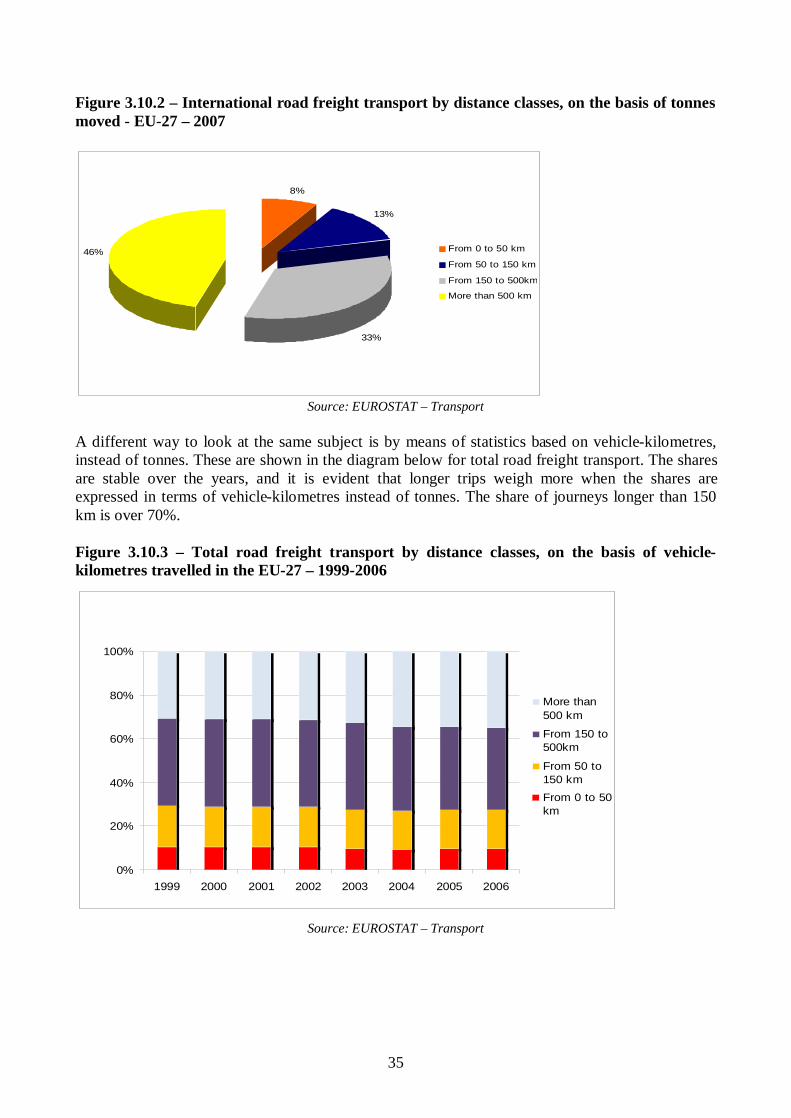
3.10 Distances of road freight trips The distribution of tonnes of goods transported by classes of trip distance is illustrated in the following graphs, separately for national and international road freight transport. As it concerns national transport, most of the road freight transport is over short distances, with only 2% of the journeys longer than 500 kms and another 15% between 150 and 500 kms, while the large majority of journeys (61%) are shorter than 50 kms. Figure 3.10.1 - National road freight transport by distance classes, on the basis of tonnes moved - EU-27 - 2007
61%22%
15%2%
F rom 0 to 50 km
F rom 50 to 150 km
F rom 150 to 500km
More than 500 km
Source: EUROSTAT – Transport
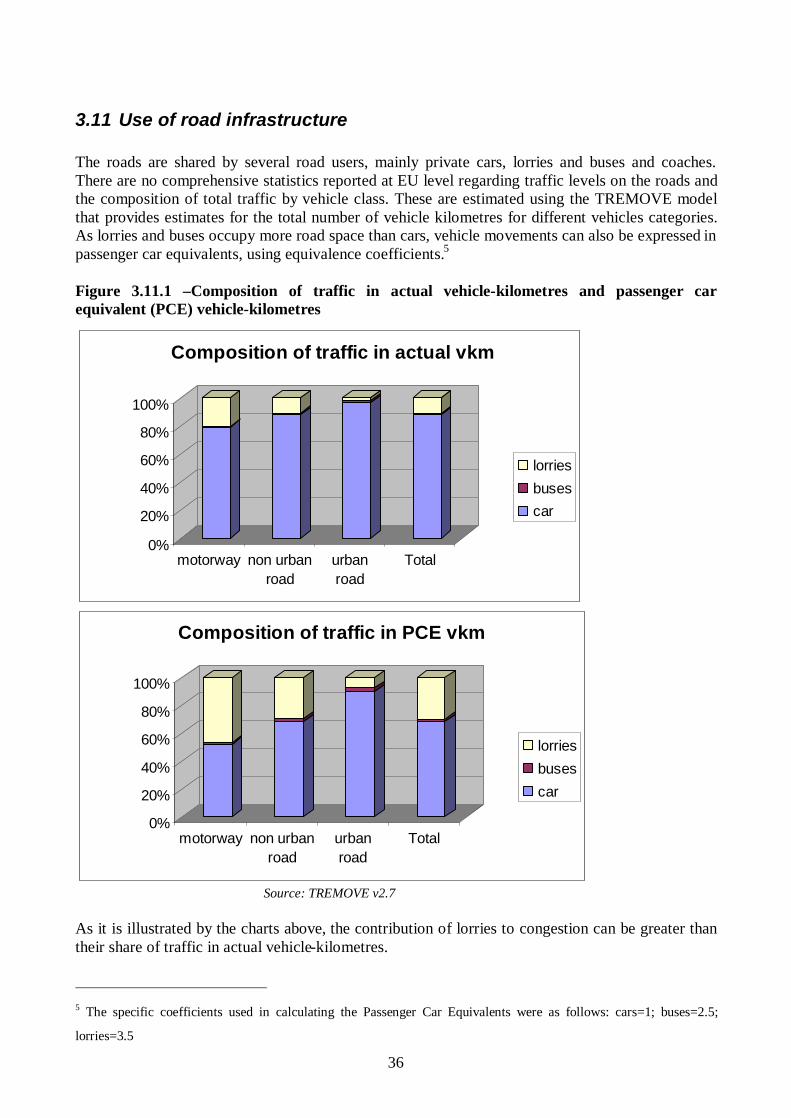
Longer journeys are more relevant for international road freight transport, with 46% of the journeys longer than 500 kms and another 33% between 150 and 500 kms, while only 8% of the journeys are shorter than 50 kms.
35
Figure 3.10.2 – International road freight transport by distance classes, on the basis of tonnes moved - EU-27 – 2007
8%
13%
33%
46% F rom 0 to 50 km
F rom 50 to 150 km
F rom 150 to 500km
More than 500 km
Source: EUROSTAT – Transport
A different way to look at the same subject is by means of statistics based on vehicle-kilometres, instead of tonnes. These are shown in the diagram below for total road freight transport. The shares are stable over the years, and it is evident that longer trips weigh more when the shares are expressed in terms of vehicle-kilometres instead of tonnes. The share of journeys longer than 150 km is over 70%. Figure 3.10.3 – Total road freight transport by distance classes, on the basis of vehicle-kilometres travelled in the EU-27 – 1999-2006
0%
20%
40%
60%
80%
100%
1999 2000 2001 2002 2003 2004 2005 2006
More than500 km
F rom 150 to500km
F rom 50 to150 km
F rom 0 to 50km
Source: EUROSTAT – Transport
36
3.11 Use of road infrastructure The roads are shared by several road users, mainly private cars, lorries and buses and coaches. There are no comprehensive statistics reported at EU level regarding traffic levels on the roads and the composition of total traffic by vehicle class. These are estimated using the TREMOVE model that provides estimates for the total number of vehicle kilometres for different vehicles categories. As lorries and buses occupy more road space than cars, vehicle movements can also be expressed in passenger car equivalents, using equivalence coefficients.5 Figure 3.11.1 –Composition of traffic in actual vehicle-kilometres and passenger car equivalent (PCE) vehicle-kilometres
0%
20%
40%
60%
80%
100%
motorway non urbanroad
urbanroad
Total
Composition of traffic in actual vkm
lorriesbusescar
0%
20%
40%
60%
80%
100%
motorway non urbanroad
urbanroad
Total
Composition of traffic in PCE vkm
lorriesbusescar
Source: TREMOVE v2.7
As it is illustrated by the charts above, the contribution of lorries to congestion can be greater than their share of traffic in actual vehicle-kilometres.
5 The specific coefficients used in calculating the Passenger Car Equivalents were as follows: cars=1; buses=2.5;
lorries=3.5
37
4 Energy consumption, CO2 emissions and environment
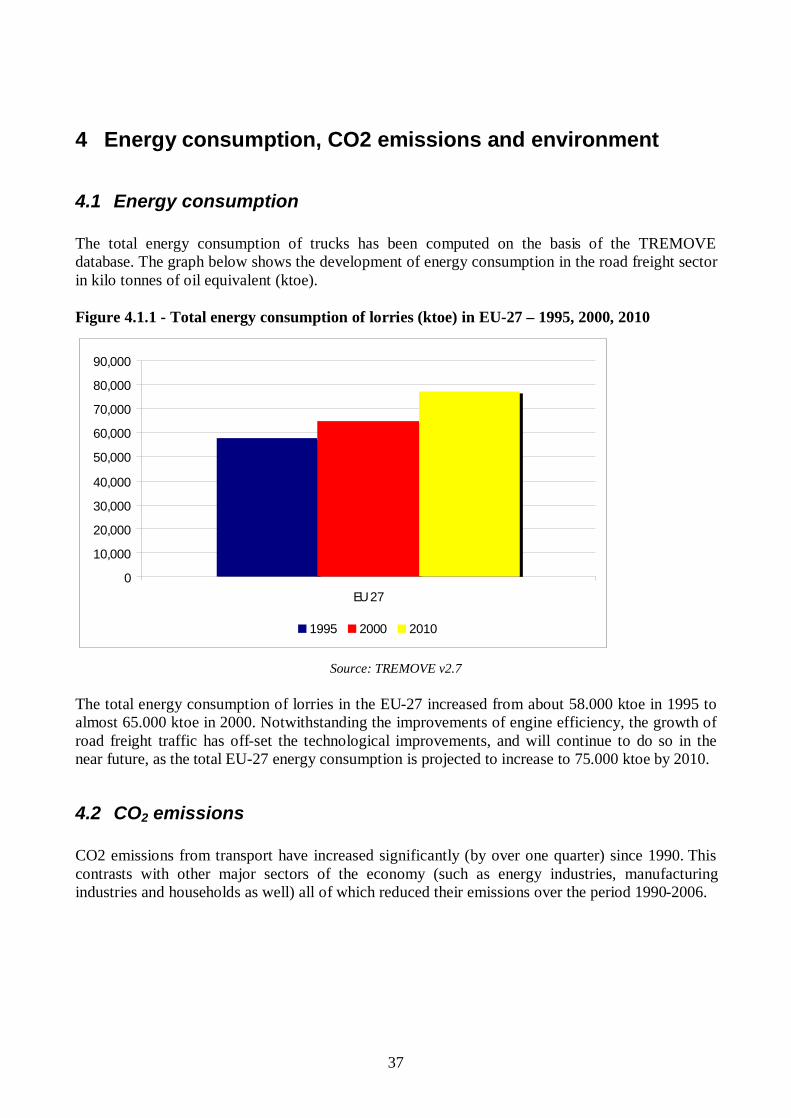
4.1 Energy consumption The total energy consumption of trucks has been computed on the basis of the TREMOVE database. The graph below shows the development of energy consumption in the road freight sector in kilo tonnes of oil equivalent (ktoe). Figure 4.1.1 - Total energy consumption of lorries (ktoe) in EU-27 – 1995, 2000, 2010
0
10,000
20,000
30,000
40,000
50,000
60,000
70,000
80,000
90,000
EU 27
1995 2000 2010
Source: TREMOVE v2.7
The total energy consumption of lorries in the EU-27 increased from about 58.000 ktoe in 1995 to almost 65.000 ktoe in 2000. Notwithstanding the improvements of engine efficiency, the growth of road freight traffic has off-set the technological improvements, and will continue to do so in the near future, as the total EU-27 energy consumption is projected to increase to 75.000 ktoe by 2010.
4.2 CO2 emissions
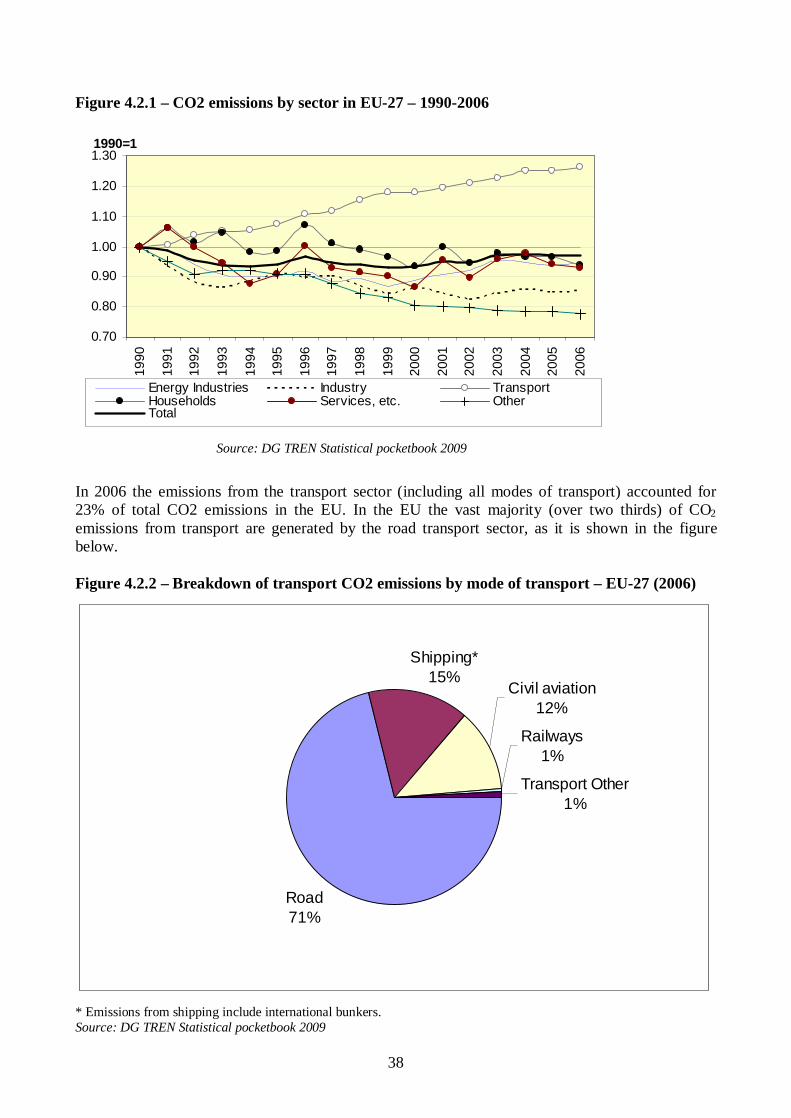
CO2 emissions from transport have increased significantly (by over one quarter) since 1990. This contrasts with other major sectors of the economy (such as energy industries, manufacturing industries and households as well) all of which reduced their emissions over the period 1990-2006.
38
Figure 4.2.1 – CO2 emissions by sector in EU-27 – 1990-2006
0.70
0.80
0.90
1.00
1.10
1.20
1.3019
90
1991
1992
1993
1994
1995
1996
1997
1998
1999
2000
2001
2002
2003
2004
2005
2006
1990=1
Energy Industries Industry TransportHouseholds Services, etc. Other Total
Source: DG TREN Statistical pocketbook 2009
In 2006 the emissions from the transport sector (including all modes of transport) accounted for 23% of total CO2 emissions in the EU. In the EU the vast majority (over two thirds) of CO2 emissions from transport are generated by the road transport sector, as it is shown in the figure below. Figure 4.2.2 – Breakdown of transport CO2 emissions by mode of transport – EU-27 (2006)
Road71%
Shipping*15%
Civil aviation12%
Railways1%
Transport Other1%
* Emissions from shipping include international bunkers. Source: DG TREN Statistical pocketbook 2009
39
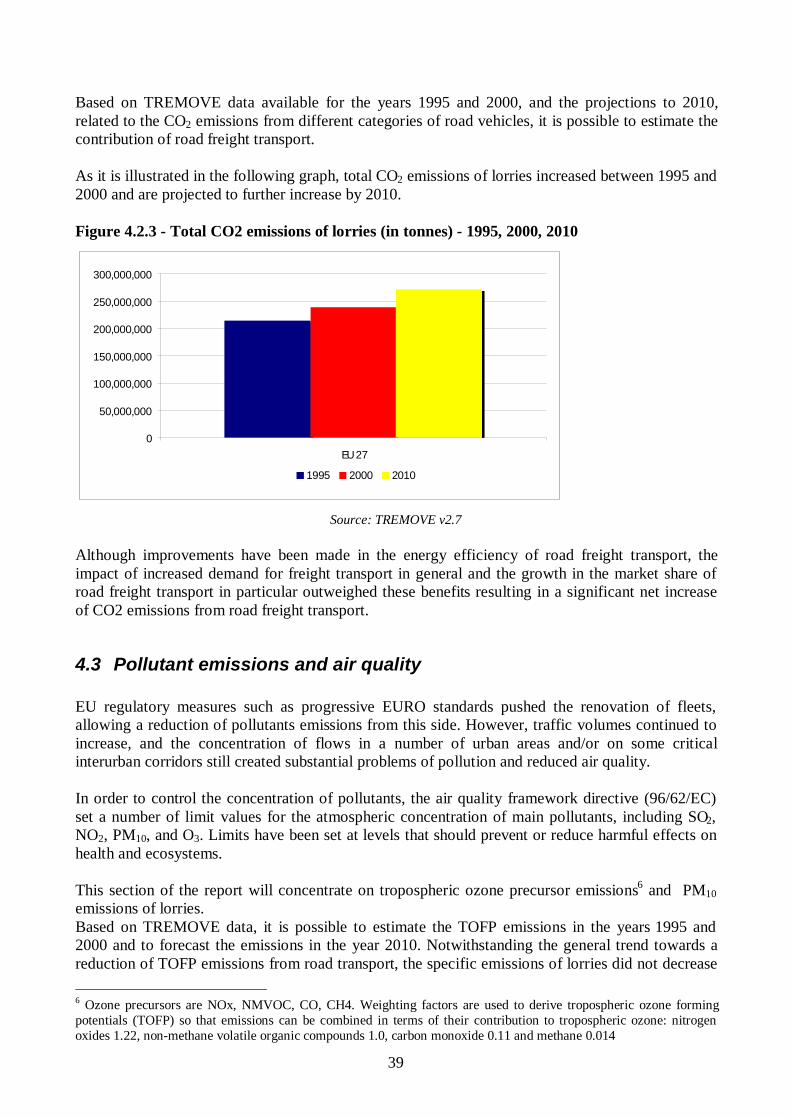
Based on TREMOVE data available for the years 1995 and 2000, and the projections to 2010, related to the CO2 emissions from different categories of road vehicles, it is possible to estimate the contribution of road freight transport. As it is illustrated in the following graph, total CO2 emissions of lorries increased between 1995 and 2000 and are projected to further increase by 2010. Figure 4.2.3 - Total CO2 emissions of lorries (in tonnes) - 1995, 2000, 2010
0
50,000,000
100,000,000
150,000,000
200,000,000
250,000,000
300,000,000
EU 27
1995 2000 2010
Source: TREMOVE v2.7
Although improvements have been made in the energy efficiency of road freight transport, the impact of increased demand for freight transport in general and the growth in the market share of road freight transport in particular outweighed these benefits resulting in a significant net increase of CO2 emissions from road freight transport.
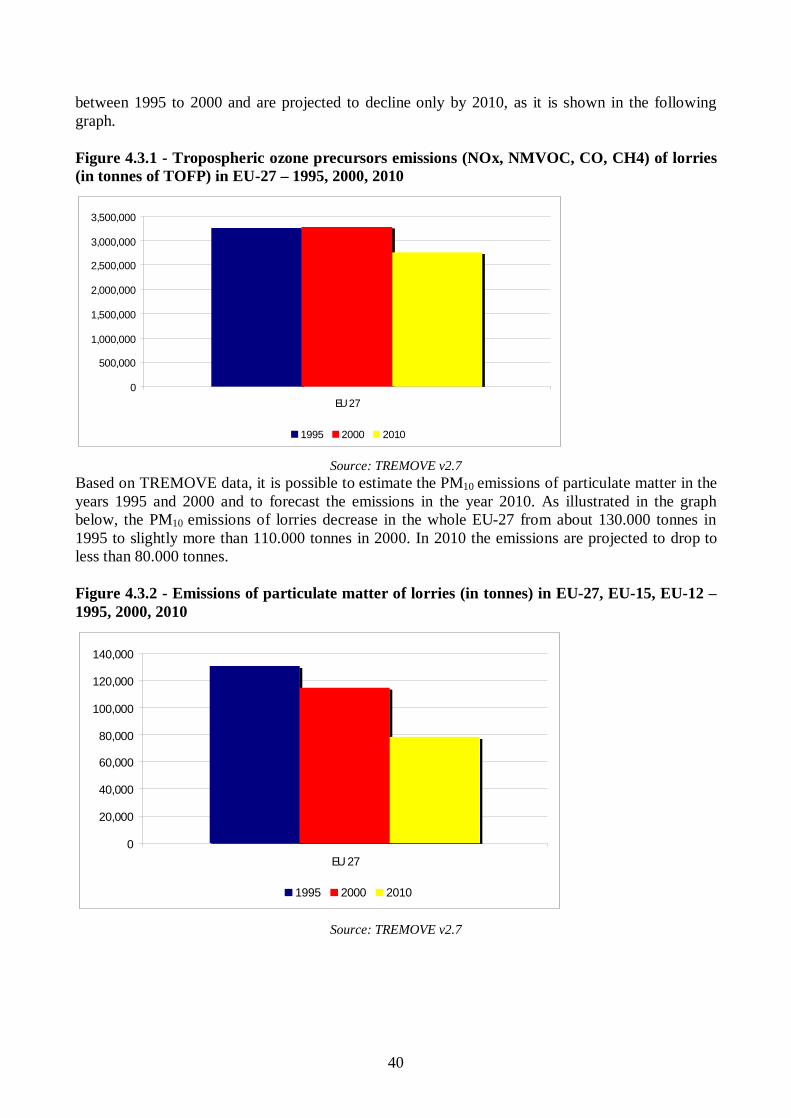
4.3 Pollutant emissions and air quality EU regulatory measures such as progressive EURO standards pushed the renovation of fleets, allowing a reduction of pollutants emissions from this side. However, traffic volumes continued to increase, and the concentration of flows in a number of urban areas and/or on some critical interurban corridors still created substantial problems of pollution and reduced air quality. In order to control the concentration of pollutants, the air quality framework directive (96/62/EC) set a number of limit values for the atmospheric concentration of main pollutants, including SO2, NO2, PM10, and O3. Limits have been set at levels that should prevent or reduce harmful effects on health and ecosystems. This section of the report will concentrate on tropospheric ozone precursor emissions6 and PM10 emissions of lorries. Based on TREMOVE data, it is possible to estimate the TOFP emissions in the years 1995 and 2000 and to forecast the emissions in the year 2010. Notwithstanding the general trend towards a reduction of TOFP emissions from road transport, the specific emissions of lorries did not decrease 6 Ozone precursors are NOx, NMVOC, CO, CH4. Weighting factors are used to derive tropospheric ozone forming potentials (TOFP) so that emissions can be combined in terms of their contribution to tropospheric ozone: nitrogen oxides 1.22, non-methane volatile organic compounds 1.0, carbon monoxide 0.11 and methane 0.014
40
between 1995 to 2000 and are projected to decline only by 2010, as it is shown in the following graph. Figure 4.3.1 - Tropospheric ozone precursors emissions (NOx, NMVOC, CO, CH4) of lorries (in tonnes of TOFP) in EU-27 – 1995, 2000, 2010
0
500,000
1,000,000
1,500,000
2,000,000
2,500,000
3,000,000
3,500,000
EU 27
1995 2000 2010
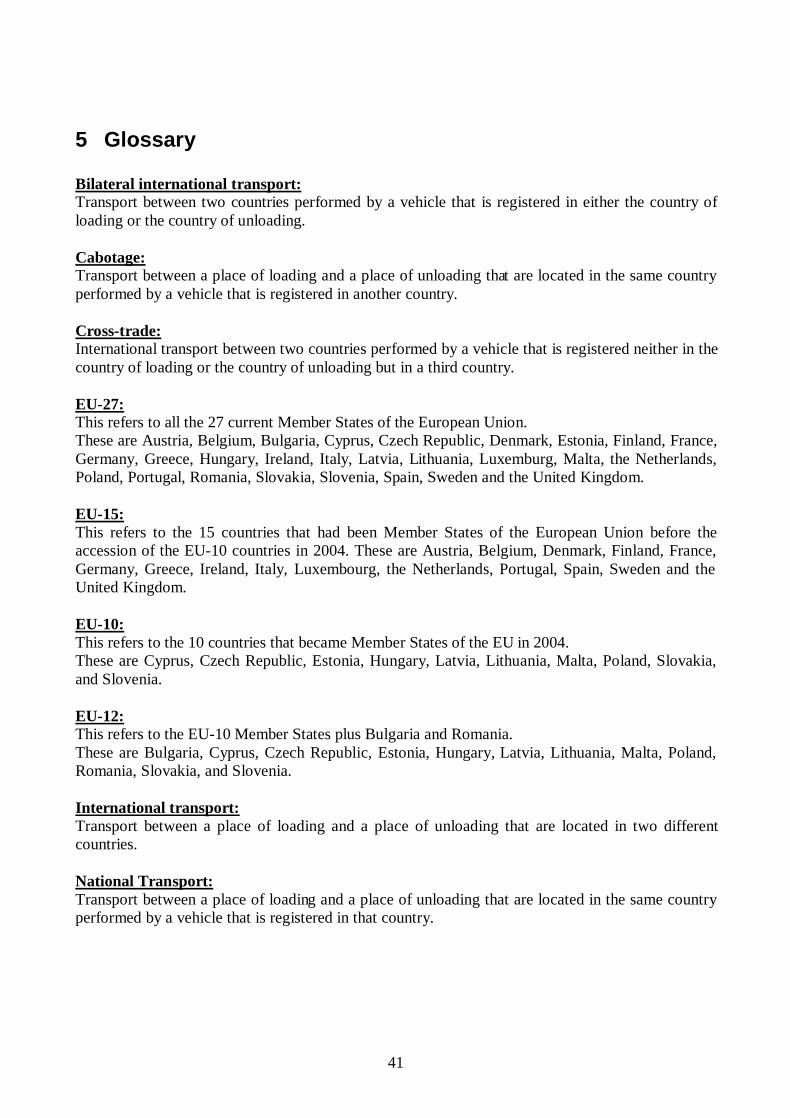
Source: TREMOVE v2.7 Based on TREMOVE data, it is possible to estimate the PM10 emissions of particulate matter in the years 1995 and 2000 and to forecast the emissions in the year 2010. As illustrated in the graph below, the PM10 emissions of lorries decrease in the whole EU-27 from about 130.000 tonnes in 1995 to slightly more than 110.000 tonnes in 2000. In 2010 the emissions are projected to drop to less than 80.000 tonnes. Figure 4.3.2 - Emissions of particulate matter of lorries (in tonnes) in EU-27, EU-15, EU-12 – 1995, 2000, 2010
0
20,000
40,000
60,000
80,000
100,000
120,000
140,000
EU 27
1995 2000 2010
Source: TREMOVE v2.7
41
5 Glossary Bilateral international transport: Transport between two countries performed by a vehicle that is registered in either the country of loading or the country of unloading. Cabotage: Transport between a place of loading and a place of unloading that are located in the same country performed by a vehicle that is registered in another country. Cross-trade: International transport between two countries performed by a vehicle that is registered neither in the country of loading or the country of unloading but in a third country. EU-27: This refers to all the 27 current Member States of the European Union. These are Austria, Belgium, Bulgaria, Cyprus, Czech Republic, Denmark, Estonia, Finland, France, Germany, Greece, Hungary, Ireland, Italy, Latvia, Lithuania, Luxemburg, Malta, the Netherlands, Poland, Portugal, Romania, Slovakia, Slovenia, Spain, Sweden and the United Kingdom. EU-15: This refers to the 15 countries that had been Member States of the European Union before the accession of the EU-10 countries in 2004. These are Austria, Belgium, Denmark, Finland, France, Germany, Greece, Ireland, Italy, Luxembourg, the Netherlands, Portugal, Spain, Sweden and the United Kingdom. EU-10: This refers to the 10 countries that became Member States of the EU in 2004. These are Cyprus, Czech Republic, Estonia, Hungary, Latvia, Lithuania, Malta, Poland, Slovakia, and Slovenia. EU-12: This refers to the EU-10 Member States plus Bulgaria and Romania. These are Bulgaria, Cyprus, Czech Republic, Estonia, Hungary, Latvia, Lithuania, Malta, Poland, Romania, Slovakia, and Slovenia. International transport: Transport between a place of loading and a place of unloading that are located in two different countries. National Transport: Transport between a place of loading and a place of unloading that are located in the same country performed by a vehicle that is registered in that country.
42
TREMOVE: TREMOVE is a policy assessment model to study the effects of different transport and environment policies on the emissions of the transport sector. The model estimates transport demand, modal shifts, vehicle stock renewal, emissions of air pollutants and the welfare level. The model can be applied for environmental and economic analysis of different policies such as road pricing, public transport pricing, emission standards, subsidies for cleaner cars etc. TREMOVE models both passenger and freight transport and covers the period 1995-2030. Concerning land transport, input databases are calibrated to feed the model for 31 European countries.
43
6 Selected references CE Delft – Internalisation measures and policy for the external cost of transport – Produced within the study Internalisation Measures and Policies for all external costs of transport (IMPACT) – Deliverable 3. European Environmental Agency – Greenhouse gas emission trends and projections in Europe 2008 - EEA Report No 5/2008 European Commission – DGTREN – EU Energy and Transport in Figures – Statistical Pocketbook 2007/2008 - 2008 European Commission – DGTREN – Study on Road Cabotage in the freight transport market – Framework Contract TREN/A1/56-2004 Lot 2 – Final Report submitted by ECORYS Nederland BV (NL) EUROSTAT – Panorama of transport – Statistical books, Edition 2007 EUROSTAT – Modal split in the inland Transport of the EU (Statistics in focus 35/2008) EUROSTAT – Competitiveness in EU road freight transport (Statistics in focus 97/2008) NEA – Cost comparison and cost developments in the European road haulage sector – Reference date 1-1-2008