road freight transport decoupling a comparative … · decoupling strategy aimed at boosting...
TRANSCRIPT
Road freight transport decoupling: A comparative analysis between the United Kingdom and Spain
Ana Alises* Jose Manuel Vassallo \ Andres Felipe Guzman2
A B S T R A C T
Economic g r o w t h has tradi t ional ly b e en l inked to road f re ight t ransport d emand , l ead ing to a s teady rise
in social and env i r onmen ta l impacts . Concern about this p r o b l e m has caused the EU to p r o m o t e a
decoup l ing strategy a i m e d at boost ing sustainable d e v e l o p m e n t in European countr ies b y improv ing the
e f f i c i ency o f t ransport systems w i t h o u t curb ing e c o n o m i c g r o w t h . O v e r the last f e w years empir i ca l
e v i d ence in s ome countr ies such as the Uni ted K i n g d o m has s h o w n an increase in GDP w h i l e the v o l u m e
o f road f re ight traf f ic has r ema ined stable or e v e n decreased. This pape r compares recent decoup l ing
t rends by ana lyz ing the e vo lu t i on o f road tonne-kms/GDP re lat ionship in the Uni ted K i n g d o m and Spain
f r o m 1999 to 2007. This compar i son seeks to ident i f y the main d i f f e rences and key dr ivers o f decoup l ing
in bo th countr ies. W e first p r ov i de an o v e r v i e w o f the d i ve rgences b e t w e e n both e c o n o m i c structures
and leve ls o f road transport intensity. Then w e conduct a d e compos i t i on analysis in o rde r to i den t i f y the
var iables that exp la in the e vo lu t i on o f truck traf f ic p e r unit o f GDP in each country. The results s h o w that
the increasing share o f services in GDP has substantial ly contr ibuted to decreas ing road transport
d e m a n d in bo th cases. Changes in road transport intensi ty due to i m p r o v e m e n t s in logist ic and supply
chain m a n a g e m e n t have b e en m o r e successful in the UK than in Spain.
1. Introduction
In most industrialized countries there has been a strong positive relationship between economic and transport growth, and specifically road transport. The growth of road transport activity has been the cause of a number of environmental and social problems. Greenhouse gas emissions from human activity, particularly road transport, produce global warming which is likely to cause an increase in natural disasters and negative consequences for property, infrastructure and the natural envir-onment. In addition, transport congestion has increased in many countries, affecting urban areas and leading to high social costs.
The current trend in numerous European countries towards enhancing sustainability, supported by the European Union (EU) as a means of tackling these environmental and social problems, promotes the decoupling of road transport growth from the economic development.
The subject of 'decoupling' has been widely treated by policy reports. For instance, it was the focus of the Standing Advisory Committee on Trunk Road Assessment (SACTRA) report in the United Kingdom in 1999, and has also been discussed in political documents such as the European White Paper on transport policy in 2001 (European Commission, 2001b). In this paper, the EU promoted a decoupling strategy as a key means to reduce the external costs of road transport by promoting GDP growth without increasing transport volumes. The EU also supported a research project which proposed the ultimate prioritization of policy measures based on their likely effectiveness in reducing road freight transport-related externalities (European Commission, 2003). EU Member States were encouraged to meet this challenge, for instance, by establishing higher costs for road freight transport, in a bid to stimulate improvements in logistics management and transfer some traffic volumes from road to more competitive and efficient modes. All these measures have the main goal of increasing transport efficiency through the internalization of the negative side-effects of transport (European Commission, 2001a).
Several researchers have studied decoupling by means of an approach that evaluates changes in road transport intensity. This ratio - road tonne-kms per unit of GDP - measures the link between the economy and road transport activity. Breaking or weakening this link, by applying actions or policies designed to
meet the objectives of the EU's sustainable development strategy, may change the historical values that have remained stable over a considerable period in each country. Furthermore, some countries have been undergoing a transition to more service-oriented economies, and as a consequence their economic growth has become progressively detached from transport demand, thus contributing to decoupling.
The aim of this paper is to review the trends for road transport and GDP growth in two case studies: the United Kingdom (UK) and Spain, and to analyze the reasons for their divergences. Specifically, the research focuses on determining the level of decoupling and on identifying the key drivers underlying its evolution over the years in each country through a decomposi-tion analysis. We chose these two countries for several reasons. The UK is one of the European countries in which decoupling has been most notable, whereas Spain has followed a very different trend. Finally both the UK and Spain are large countries with limited borders for the entry of freight by road, and thus cross-country traffic and major ports have a little effect on freight transport.
The paper is organized as follows. After the introduction, Section 2 reviews the existing literature on decoupling, and explains the main contributions of this research to the state of the art. Section 3 provides a comparison of the level of decoupling in both case studies, identifies the key drivers of decoupling and analyzes their trends throughout the period of analysis. This section also highlights the contributions of each economic sector to the global trends. Finally, Section 4 points out the main conclusions of this research.
2. Links between road freight transport and economy
It is widely accepted that transport accounts for a significant share of the GDP in industrialized countries. For this reason, the correlation between tonne-kms and GDP, known as "coupling", has traditionally been applied to forecast trends in freight trans-port demand, although some authors, such as McKinnon and Woodburn (1996), NEI (1997) and Kveiborg and Fosgerau (2007), claim that the factor to be taken into account is industrial sector production rather than GDP.
Despite the linearity assumptions in the relationship between GDP and transport demand - measured in tonne-kms - supported by authors such as Bennathan et al. (1992), at present, transport demand is rising more slowly than economic growth. Recent research has developed various empirical stu-dies analyzing the historical evidence for decoupling and its future potential (i.e. Banister and Stead (2002) and Gilbert and Nadeau (2002)). Possibly one of the most significant contribu-tions is the European 'REDEFINE' project (NEI, 1997), which examined road freight transport trends in five European coun-tries between 1985 and 1995 and concluded that rather than a decoupling there had been a "recoupling" of road freight transport growth and GDP in most countries, and that these trends were likely to continue.
In contrast, the analysis of transport trends in several research works led to clear evidence of decoupling in countries such as Japan, the United States (OECD, 2003) and the United Kingdom (McKinnon, 2007). For instance, in the UK, GDP rose by 21% between 1997 and 2005 while total tonne-kms grew by only 8%, being the divergence of road tonne-kms and GDP trends over this period even more notable.
According to McKinnon (2007), the different decoupling rates among countries depend on the share of "intensive industrial sectors" in the whole economy. This implies that some sectors such as agriculture or mining demand more tonne-kms in their
production processes than service sectors. As services expand their share of total GDP, this leads to a higher economic growth than transport growth (Ahman, 2004). Supply chain management may also change the "transport intensity" of industrial sectors by taking advantage of economies of scale or improving technology and logistics systems (Lehtonen, 2008).
The concept of "transport intensity" is defined as the ratio of freight transport to economic growth, i.e., tonne-kms per unit of GDP. Thus a decrease in this ratio points to a lower demand for freight transport services relative to GDP. The concept of "decou-pling" refers to a change in the historically constant intensity (Ahman, 2004).
Empirical studies have shown that transport intensities sub-stantially diverge among countries. Between 1975 and 1990, differences were found in patterns of transport intensity in European countries, and these figures were compared with the European Union average (Stead, 2001). The main conclusion of this study was that the stage of economic and social development influences the value of transport intensity and this measurement depends on economic structure, topography, geography, size, land uses, socio-economic factors and transport infrastructure. The World Bank conducted a cross-sector study, using 1989 data, of a sample of 33 countries at different stages of development in order to analyze decoupling by evaluating the evolution of transport intensity (Bennathan et al., 1992). The study demonstrated that, although the relationship between GDP and road tonne-kms was extremely close, there were differences between rich and less developed countries. This gap is even more notable for road freight transport intensities (SACTRA, 1999).
As can be seen, freight transport demand is influenced by a wide set of factors. A detailed comparison of two countries such as the United Kingdom and Spain with a different economic structure and different trends in road freight transport intensity could shed some light on understanding different transport decoupling trends. In view of the fact that some of the previous studies on decoupling mentioned in this section were conducted on an aggregate level, this paper contributes to the literature by devel-oping a more detailed analysis sorted by commodity groups. In addition, at present, no decomposition analysis has been developed to explain the main divergences in road transport between two different countries.
3. Decoupling economic activity and transport growth: the state of play in the United Kingdom and Spain
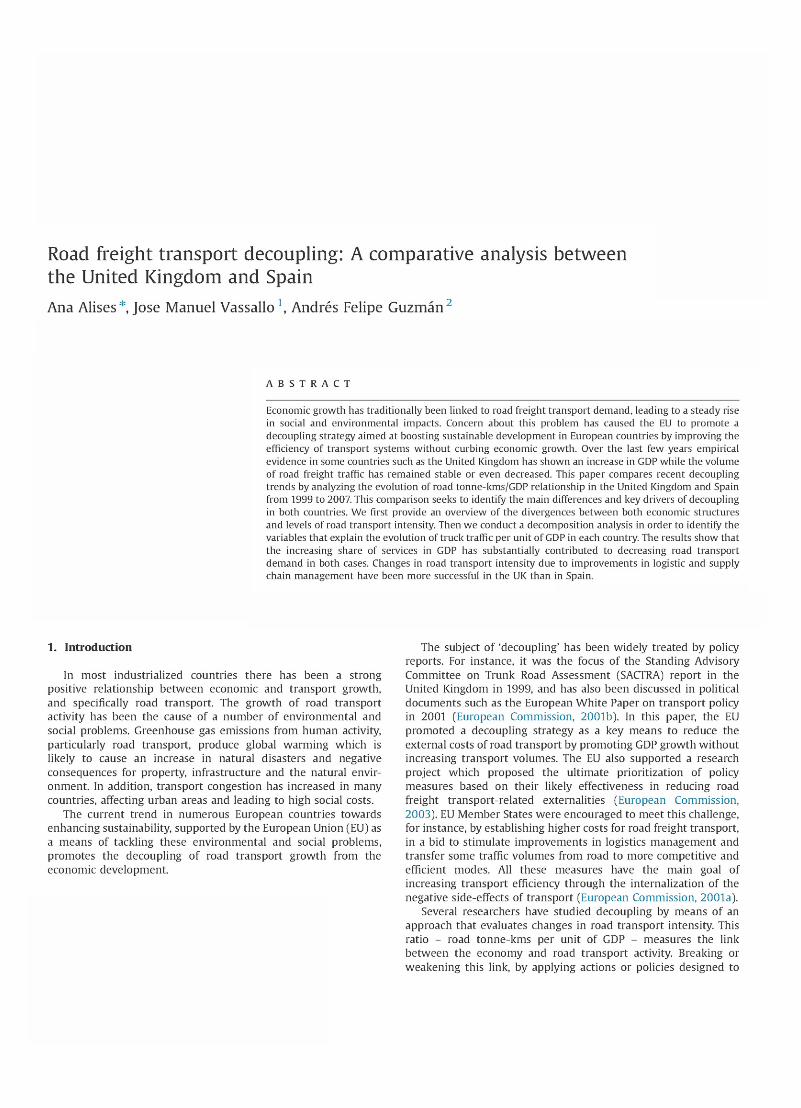
In recent decades the relationship between GDP and road tonne-kms has changed. This contrast is particularly notable in countries such as the UK and Spain, where different levels of decoupling can be observed, as shown graphically in Fig. 1. While the growth of real GDP in the period 1999-2007 led to a 95% rise in road freight transport in Spain, the volume of tonne-kms decreased by 19% in the United Kingdom, where economic growth was 87% measured in current U.S. dollars.
From the literature review, we have identified two key factors that should be considered to explain the evolution of decoupling: (1) the evolution of the structure of the economy caused by changes in the share of productive sectors in the total GDP; and (2) the rates of road transport intensity by sector.
Let RFTC be the total road freight transport in the country measured in tonne-kms, GDPC the Gross Domestic Product of the country C, RFTf,c
the road freight transport demand of each industry i and GDP,,C the Gross Domestic Product given by each sector. So, being GDPi,cIGDPi,c
the sectorial share of GDP of each industry and RfT;,c/GDPi,c its road freight transport intensity, it leads to define the relationship between road transport volume and GDP in a country through the following
UNITED K I N G D O M b 250
SPAIN
G R
DP oad tonne-kms
Note: Real GDP growths or declines (%) are based upon U.S. dollars real GDP variations.
Yearly USS GDP values are obtained by converting national currency GDP values to US$ using market exchange rates (yearly average)
Fig. 1. Growth in real GDP and road tonne-kms in the United K ingdom (a ) and Spain (b ) ( index 1999 = 100): 1999-2007.
equation. We want to note that the productive structure of the country is organized in n industries. UNITED K INGDOM
RFTC " (RFTlc GDPic GDP, GDPix GDPr (1)
From here on, this paper analyzes the evolution of two terms on the right-hand side of this equation over time, and how they have influenced decoupling trends in both the UK and Spain. The research uses data from 1999 to 2007. The information on road freight transport demand - data series of tonne-kms sorted by commodity group in each country - was obtained from EUROSTAT (Eurostat, 2013). This information was confirmed and completed with statistics from the UK Department for Transport for 2013 (Transport Statistics, 2013). Economic data were collected from the Input-Output (10) tables compiled by the World Input-Output Database (WIOD, 2013). This dataset provides the IO tables at current prices in US$ according to the national accounts. National currencies were converted using the US$ exchange rate and the fixed Euro rate for the Euro-zone countries.
To homogenize the economic and transport data, we have aggregated the original IO tables into 11 groups representing the main areas of economic activity. This aggregation was done according to the commodity groups in the transport dataset. The 11 industries are the following: (1) Food industry, (2) Mining, (3) Textile sector, (4) Wood products, (5) Paper, Printing and Publishing products, (6) Energy: Fuel and power products; (7) Che-mical products, (8) Machinery and transport equipment, (9) Man-ufacturing products, (10) Construction, and (11) Services. The first 10 sectors are transport-intensive sectors, whereas the 11th is not.
Data until 2007 was used due to the lack of complete informa-tion by commodity after this year. For more recent information we have identified gaps in the tonne-kms dataset for certain sectors like construction. An additional advantage of using this period is that it avoids the impact of the economic recession in Europe, as the distinctive nature of the economic downturn might distort the final results. The period 1999-2007 is sufficiently representative to show the divergences for the two case studies.
3.1. Economic structure and intensive sectors
As we have noted before, certain economic sectors demand more road tonne-kms per US$ of GDP than others. Specifically, service activities generate fewer road tonne-kms relative to their output than non-service activities such as manufacturing, agricul-ture or construction, which show higher road freight transport intensities. Therefore, it seems essential to look at the economic structure of a country in order to identify the key sectors driving road freight transport demand.
Service sectors
« ' " r S CONSUME"S E C T O R S
Transport"'"
Service seC^
SECTORS sector c o N S V ! M E B
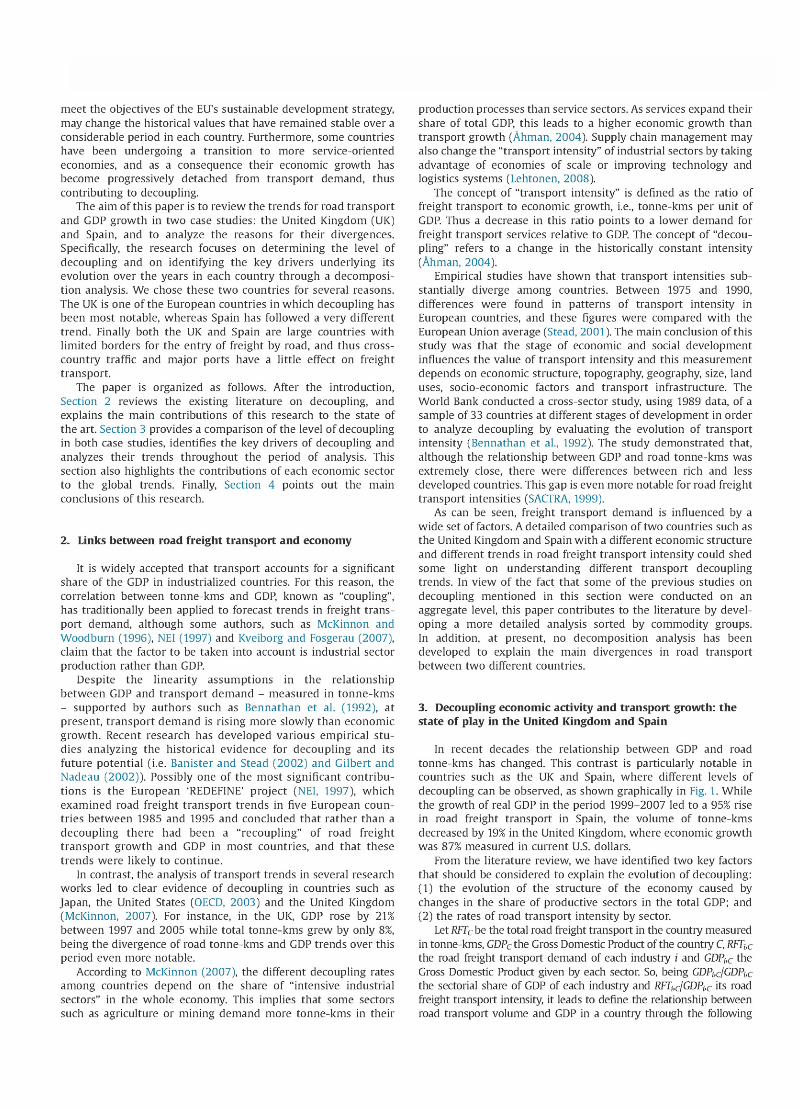
Fig. 2. Input-output transaction table (2007) for the United K ingdom (a ) and Spain (b). (For interpretation of the references to color in this f igure legend, the reader is referred to the web version of this article.)
Fig. 2 gives an overview of the main economic sectors in the national output in both economies—the UK and Spain—by showing graphically the national 2007 IO tables, with economic transactions among industries shown in US$. These IO tables reflect the inter-industry relationships within a country, and consider the whole economy organized into 35 sectors. The first 18 sectors in the
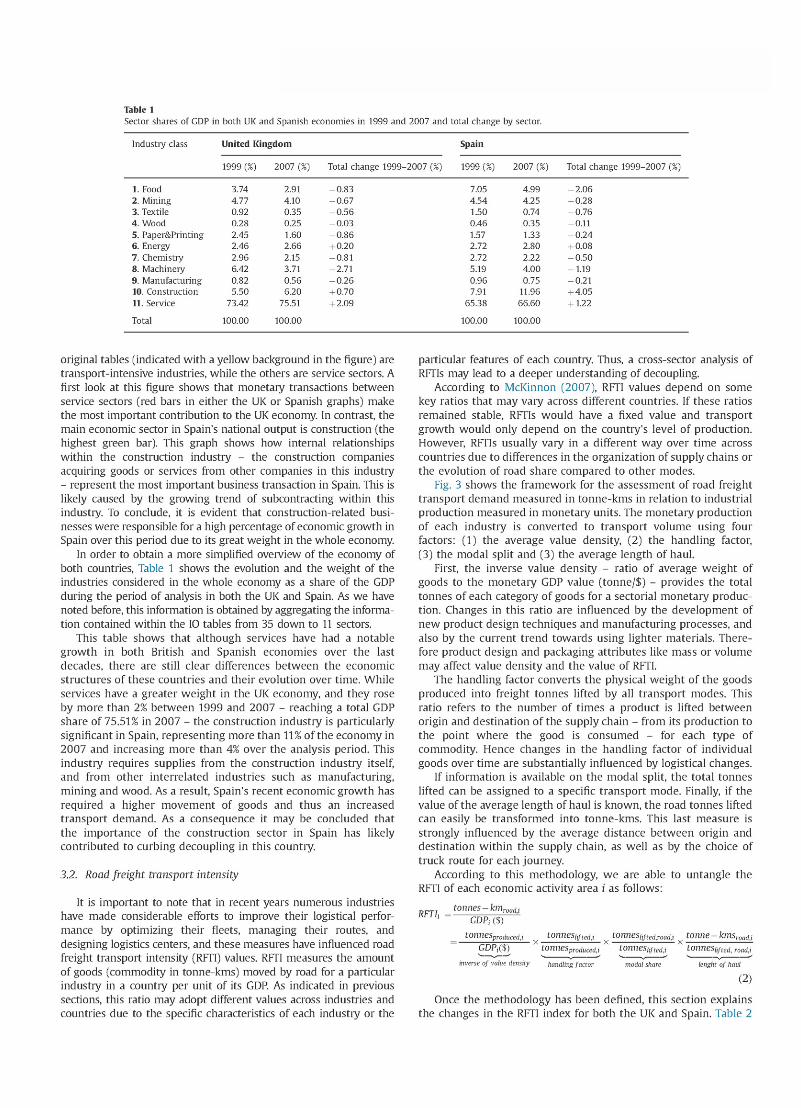
Table 1 Sector shares of GDP in both UK and Spanish economies in 1999 and 2007 and total change by sector.
Industry class United Kingdom Spain
1999 (%) 2007 (%) Total change 1999-2007 (%) 1999 (%) 2007 (%) Total change 1999-2007 (%)
1. Food 3.74 2.91 -0 .83 7.05 4.99 - 2 . 06 2. Mining 4.77 4.10 -0 .67 4.54 4.25 -0 .28 3. Textile 0.92 0.35 - 0 . 56 1.50 0.74 -0 .76 4. Wood 0.28 0.25 -0 .03 0.46 0.35 -0.11 5. Paper&Printing 2.45 1.60 - 0 . 86 1.57 1.33 - 0 . 2 4 6. Energy 2.46 2.66 + 0.20 2.72 2.80 + 0.08 7. Chemistry 2.96 2.15 -0 .81 2.72 2.22 - 0 . 5 0 8. Machinery 6.42 3.71 -2 .71 5.19 4.00 -1.19 9. Manufacturing 0.82 0.56 - 0 . 26 0.96 0.75 -0 .21 10. Construction 5.50 6.20 + 0.70 7.91 11.96 + 4.05 11. Service 73.42 75.51 + 2.09 65.38 66.60 + 1.22
Total 100.00 100.00 100.00 100.00
original tables (indicated with a yellow background in the figure) are transport-intensive industries, while the others are service sectors. A first look at this figure shows that monetary transactions between service sectors (red bars in either the UK or Spanish graphs) make the most important contribution to the UK economy. In contrast, the main economic sector in Spain's national output is construction (the highest green bar). This graph shows how internal relationships within the construction industry - the construction companies acquiring goods or services from other companies in this industry - represent the most important business transaction in Spain. This is likely caused by the growing trend of subcontracting within this industry. To conclude, it is evident that construction-related busi-nesses were responsible for a high percentage of economic growth in Spain over this period due to its great weight in the whole economy.
In order to obtain a more simplified overview of the economy of both countries, Table 1 shows the evolution and the weight of the industries considered in the whole economy as a share of the GDP during the period of analysis in both the UK and Spain. As we have noted before, this information is obtained by aggregating the informa-tion contained within the IO tables from 35 down to 11 sectors.
This table shows that although services have had a notable growth in both British and Spanish economies over the last decades, there are still clear differences between the economic structures of these countries and their evolution over time. Whi le services have a greater weight in the UK economy, and they rose by more than 2% between 1999 and 2007 - reaching a total GDP share of 75.51% in 2007 - the construction industry is particularly significant in Spain, representing more than 11% of the economy in 2007 and increasing more than 4% over the analysis period. This industry requires supplies from the construction industry itself, and from other interrelated industries such as manufacturing, mining and wood. As a result, Spain's recent economic growth has required a higher movement of goods and thus an increased transport demand. As a consequence it may be concluded that the importance of the construction sector in Spain has likely contributed to curbing decoupling in this country.
3.2. Road freight transport intensity
It is important to note that in recent years numerous industries have made considerable efforts to improve their logistical perfor-mance by optimizing their fleets, managing their routes, and designing logistics centers, and these measures have influenced road freight transport intensity (RFTI) values. RFTI measures the amount of goods (commodity in tonne-kms) moved by road for a particular industry in a country per unit of its GDP. As indicated in previous sections, this ratio may adopt different values across industries and countries due to the specific characteristics of each industry or the
particular features of each country. Thus, a cross-sector analysis of RFTIs may lead to a deeper understanding of decoupling.
According to McKinnon (2007), RFTI values depend on some key ratios that may vary across different countries. If these ratios remained stable, RFTIs would have a fixed value and transport growth would only depend on the country's level of production. However, RFTIs usually vary in a different way over time across countries due to differences in the organization of supply chains or the evolution of road share compared to other modes.
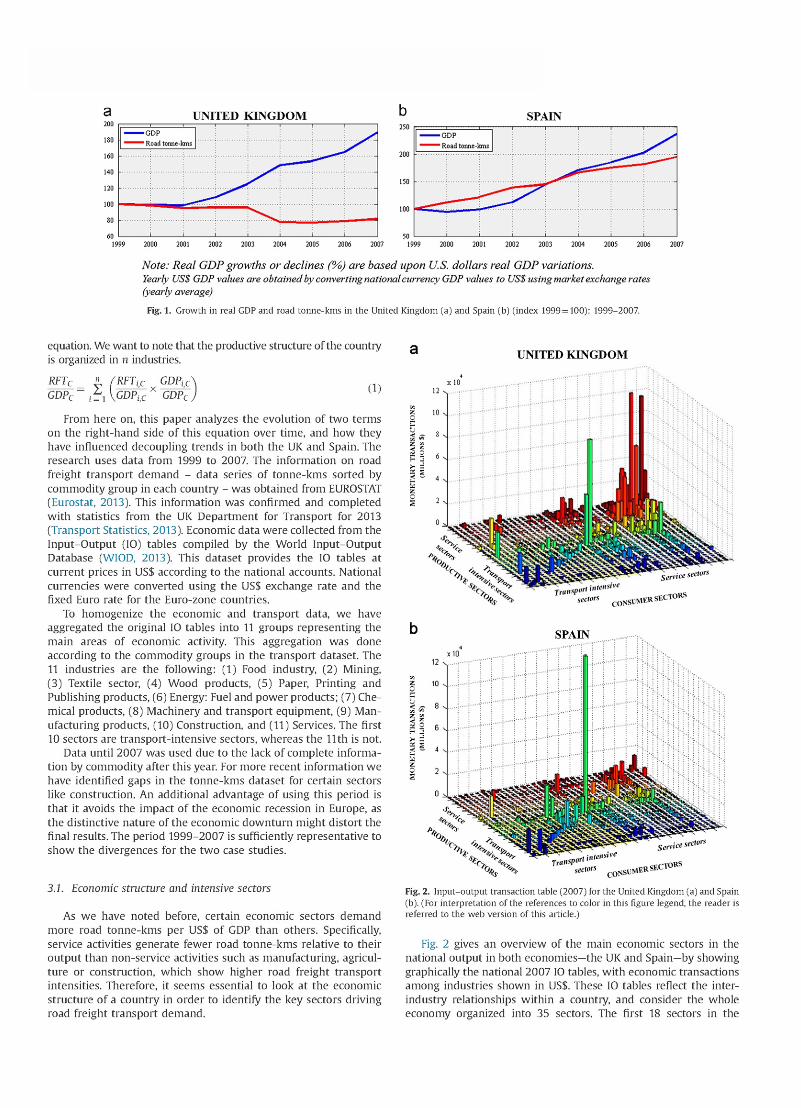
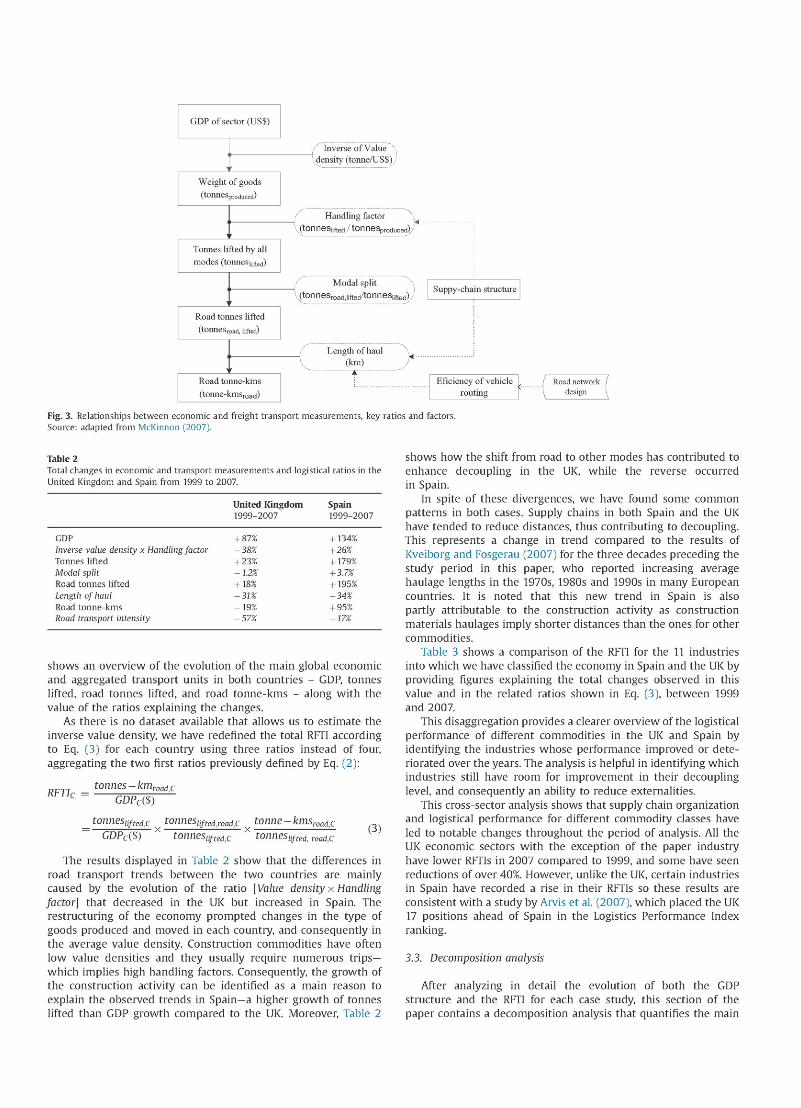
Fig. 3 shows the framework for the assessment of road freight transport demand measured in tonne-kms in relation to industrial production measured in monetary units. The monetary production of each industry is converted to transport volume using four factors: (1 ) the average value density, (2 ) the handling factor, (3 ) the modal split and (3 ) the average length of haul.
First, the inverse value density - ratio of average weight of goods to the monetary GDP value (tonne/$) - provides the total tonnes of each category of goods for a sectorial monetary produc-tion. Changes in this ratio are influenced by the development of new product design techniques and manufacturing processes, and also by the current trend towards using lighter materials. There-fore product design and packaging attributes like mass or volume may affect value density and the value of RFTI.
The handling factor converts the physical weight of the goods produced into freight tonnes lifted by all transport modes. This ratio refers to the number of times a product is lifted between origin and destination of the supply chain - f rom its production to the point where the good is consumed - for each type of commodity. Hence changes in the handling factor of individual goods over time are substantially influenced by logistical changes.
If information is available on the modal split, the total tonnes lifted can be assigned to a specific transport mode. Finally, if the value of the average length of haul is known, the road tonnes lifted can easily be transformed into tonne-kms. This last measure is strongly influenced by the average distance between origin and destination within the supply chain, as wel l as by the choice of truck route for each journey.
According to this methodology, w e are able to untangle the RFTI of each economic activity area i as follows:
tonnes-kmroadJ
RFTI> =—gdftW)— tonnesproducedj tonnes,,/tedJ tonnes,,f,edroadj tonne - kmsroad ,
GDP f($) x tonnesproduadJ x tonnes,iftedJ x tonnes,,fted: roadJ
inverse of value density handling factor modal share lenght of haul
(2)
Once the methodology has been defined, this section explains the changes in the RFTI index for both the UK and Spain. Table 2
GDP o f sector (US$)
/ Inverse o f V a l u e '
\density (tonne/US$)
Weight o f goods
(tonnesproduced)
Tonnes lifted by all
modes (tonnes l i f t ed)
Road tonnes lifted
(tonneSroad, lifted)
Handling factor
(tonnesiifted / tonnesproduced)
Moda l split
(ton n es r o ad jifted/to n n esiifted)
Length o f haul
" (km)
Suppy-chain structure
Road tonne-kms
(tonne-kmsroad)
Fig. 3. Relationships be tween economic and freight transport measurements, key ratios and factors.
Source: adapted f r om McKinnon (2007).
Eficiency o f vehicle / Road network / routing y design
Table 2 Total changes in economic and transport measurements and logistical ratios in the
United Kingdom and Spain f r om 1999 to 2007.
United Kingdom Spain 1999-2007 1999-2007
GDP + 87% + 134%
Inverse value density x Handling factor -38% +26%
Tonnes li fted + 23% + 179% Modal split - 1.2% +3.7%
Road tonnes li fted + 18% + 195%
Length of haul -31% -34%
Road tonne-kms - 1 9 % + 95% Road transport intensity -57% -17%
shows an overview of the evolution of the main global economic and aggregated transport units in both countries - GDP, tonnes lifted, road tonnes lifted, and road tonne-kms - along with the value of the ratios explaining the changes.
As there is no dataset available that allows us to estimate the inverse value density, we have redefined the total RFTI according to Eq. (3) for each country using three ratios instead of four, aggregating the two first ratios previously defined by Eq. (2):
RFTIc = tonnes - kmwadc
GDPC($)
tonnes,ifredc tonnes,ifredJ.oadc tonne -kmsroadx
GDPC($) tonnesUfred c tonnesUfKd mad c (3)
The results displayed in Table 2 show that the differences in road transport trends between the two countries are mainly caused by the evolution of the ratio [Value density x Handling
factor] that decreased in the UK but increased in Spain. The restructuring of the economy prompted changes in the type of goods produced and moved in each country, and consequently in the average value density. Construction commodities have often low value densities and they usually require numerous trips— which implies high handling factors. Consequently, the growth of the construction activity can be identified as a main reason to explain the observed trends in Spain—a higher growth of tonnes lifted than GDP growth compared to the UK. Moreover, Table 2
shows how the shift from road to other modes has contributed to enhance decoupling in the UK, while the reverse occurred in Spain.
In spite of these divergences, we have found some common patterns in both cases. Supply chains in both Spain and the UK have tended to reduce distances, thus contributing to decoupling. This represents a change in trend compared to the results of Kveiborg and Fosgerau (2007) for the three decades preceding the study period in this paper, who reported increasing average haulage lengths in the 1970s, 1980s and 1990s in many European countries. It is noted that this new trend in Spain is also partly attributable to the construction activity as construction materials haulages imply shorter distances than the ones for other commodities.
Table 3 shows a comparison of the RFTI for the 11 industries into which we have classified the economy in Spain and the UK by providing figures explaining the total changes observed in this value and in the related ratios shown in Eq. (3), between 1999 and 2007.
This disaggregation provides a clearer overview of the logistical performance of different commodities in the UK and Spain by identifying the industries whose performance improved or dete-riorated over the years. The analysis is helpful in identifying which industries still have room for improvement in their decoupling level, and consequently an ability to reduce externalities.
This cross-sector analysis shows that supply chain organization and logistical performance for different commodity classes have led to notable changes throughout the period of analysis. All the UK economic sectors with the exception of the paper industry have lower RFTIs in 2007 compared to 1999, and some have seen reductions of over 40%. However, unlike the UK, certain industries in Spain have recorded a rise in their RFTIs so these results are consistent with a study by Arvis et al. (2007), which placed the UK 17 positions ahead of Spain in the Logistics Performance Index ranking.
3.3. Decomposition analysis
After analyzing in detail the evolution of both the GDP structure and the RFTI for each case study, this section of the paper contains a decomposition analysis that quantifies the main
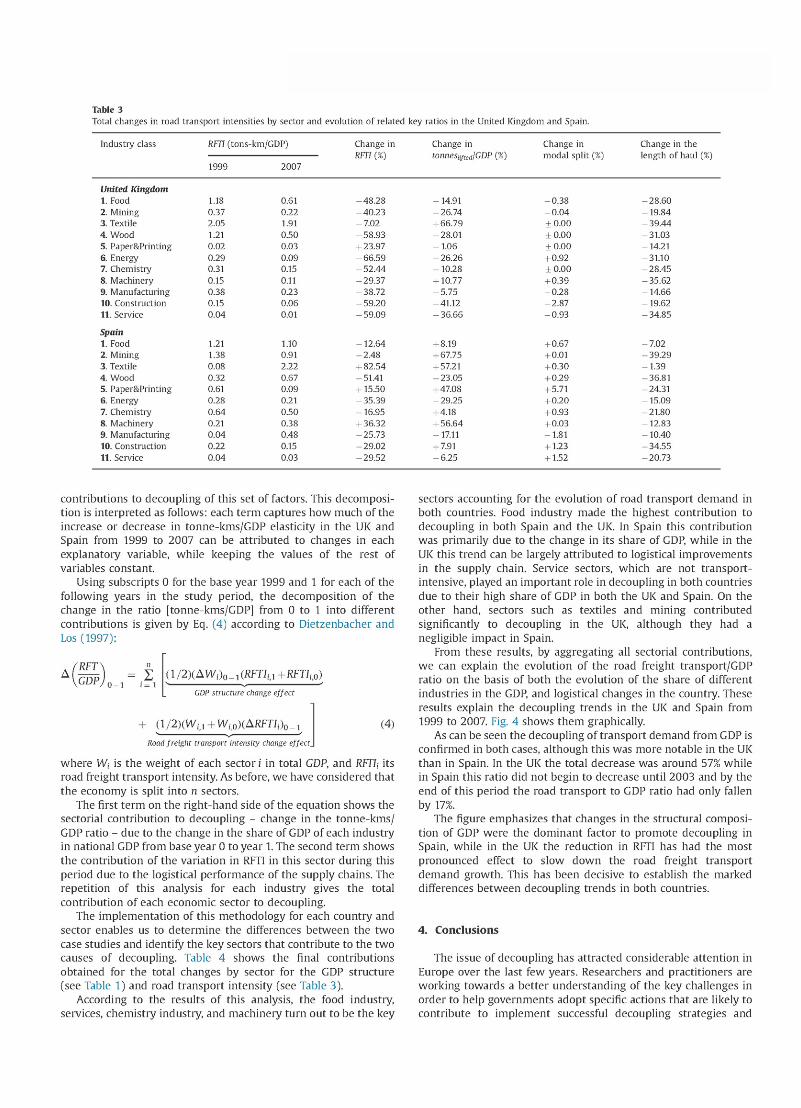
Table 3 Total changes in road transport intensities by sector and evolution of related key ratios in the United Kingdom and Spain.
Industry class RFTI (tons-km/GDP) Change in Change in Change in Change in the RFTI (%) tonnesiifteilIGDP (%) modal split (%) length of haul (%)
1999 2007
United Kingdom 1. Food 1.18 0.61 -48.28 -14.91 -0 .38 -28 .60 2. Mining 0.37 0.22 -40.23 -26.74 -0 .04 -19.84 3. Textile 2.05 1.91 -7 .02 + 66.79 + 0.00 -39 .44 4. Wood 1.21 0.50 -58.93 -28.01 + 0.00 -31.03 5. Paper&Printing 0.02 0.03 + 23.97 -1 .06 + 0.00 -14.21 6. Energy 0.29 0.09 -66 .59 -26.26 + 0.92 -31.10 7. Chemistry 0.31 0.15 -52 .44 -10.28 + 0.00 -28.45 8. Machinery 0.15 0.11 -29.37 + 10.77 + 0.39 -35.62 9. Manufacturing 0.38 0.23 -38.72 -5 .75 -0 .28 -14.66 10. Construction 0.15 0.06 -59 .20 -41.12 -2 .87 -19.62 11. Service 0.04 0.01 -59 .09 -36 .66 -0 .93 -34.85
Spain 1. Food 1.21 1.10 -12.64 + 8.19 + 0.67 -7 .02 2. Mining 1.38 0.91 -2 .48 + 67.75 + 0.01 -39 .29 3. Textile 0.08 2.22 + 82.54 + 57.21 + 0.30 -1 .39 4. Wood 0.32 0.67 -51.41 -23.05 + 0.29 -36.81 5. Paper&Printing 0.61 0.09 + 15.50 +47.08 + 5.71 -24.31 6. Energy 0.28 0.21 -35.39 -29.25 + 0.20 -15.09 7. Chemistry 0.64 0.50 -16.95 +4.18 + 0.93 -21.80 8. Machinery 0.21 0.38 + 36.32 + 56.64 + 0.03 -12.83 9. Manufacturing 0.04 0.48 -25.73 -17.11 -1.81 -10.40 10. Construction 0.22 0.15 -29.02 + 7.91 + 1.23 -34.55 11. Service 0.04 0.03 -29.52 -6 .25 + 1.52 -20.73
contributions to decoupling of this set of factors. This decomposi-tion is interpreted as follows: each term captures how much of the increase or decrease in tonne-kms/GDP elasticity in the UK and Spain from 1999 to 2007 can be attributed to changes in each explanatory variable, while keeping the values of the rest of variables constant.
Using subscripts 0 for the base year 1999 and 1 for each of the fol lowing years in the study period, the decomposition of the change in the ratio [tonne-kms/GDP] from 0 to 1 into different contributions is given by Eq. (4 ) according to Dietzenbacher and Los (1997):
[RFT\ _ "
\ g d p L _ i (V2)(AWi)0_-l(RFTIiA+RFTIL0)
GDP structure change effect
+ ( l / 2 ) ( W i l +WiQ)(A.RFTIi)0_
Road freight transport intensity change effect _
(4)
where W f is the weight of each sector i in total GDP, and RFTIf its road freight transport intensity. As before, w e have considered that the economy is split into n sectors.
The first term on the right-hand side of the equation shows the sectorial contribution to decoupling - change in the tonne-kms/ GDP ratio - due to the change in the share of GDP of each industry in national GDP from base year 0 to year 1. The second term shows the contribution of the variation in RFTI in this sector during this period due to the logistical performance of the supply chains. The repetition of this analysis for each industry gives the total contribution of each economic sector to decoupling.
The implementation of this methodology for each country and sector enables us to determine the differences between the two case studies and identify the key sectors that contribute to the two causes of decoupling. Table 4 shows the final contributions obtained for the total changes by sector for the GDP structure (see Table 1) and road transport intensity (see Table 3).
According to the results of this analysis, the food industry, services, chemistry industry, and machinery turn out to be the key
sectors accounting for the evolution of road transport demand in both countries. Food industry made the highest contribution to decoupling in both Spain and the UK. In Spain this contribution was primarily due to the change in its share of GDP, whi le in the UK this trend can be largely attributed to logistical improvements in the supply chain. Service sectors, which are not transport-intensive, played an important role in decoupling in both countries due to their high share of GDP in both the UK and Spain. On the other hand, sectors such as textiles and mining contributed significantly to decoupling in the UK, although they had a negligible impact in Spain.
From these results, by aggregating all sectorial contributions, w e can explain the evolution of the road freight transport/GDP ratio on the basis of both the evolution of the share of different industries in the GDP, and logistical changes in the country. These results explain the decoupling trends in the UK and Spain from 1999 to 2007. Fig. 4 shows them graphically.
As can be seen the decoupling of transport demand from GDP is confirmed in both cases, although this was more notable in the UK than in Spain. In the UK the total decrease was around 57% whi le in Spain this ratio did not begin to decrease until 2003 and by the end of this period the road transport to GDP ratio had only fallen by 17%.
The figure emphasizes that changes in the structural composi-tion of GDP were the dominant factor to promote decoupling in Spain, while in the UK the reduction in RFTI has had the most pronounced effect to slow down the road freight transport demand growth. This has been decisive to establish the marked differences between decoupling trends in both countries.
4. Conclusions
The issue of decoupling has attracted considerable attention in Europe over the last f ew years. Researchers and practitioners are working towards a better understanding of the key challenges in order to help governments adopt specific actions that are likely to contribute to implement successful decoupling strategies and
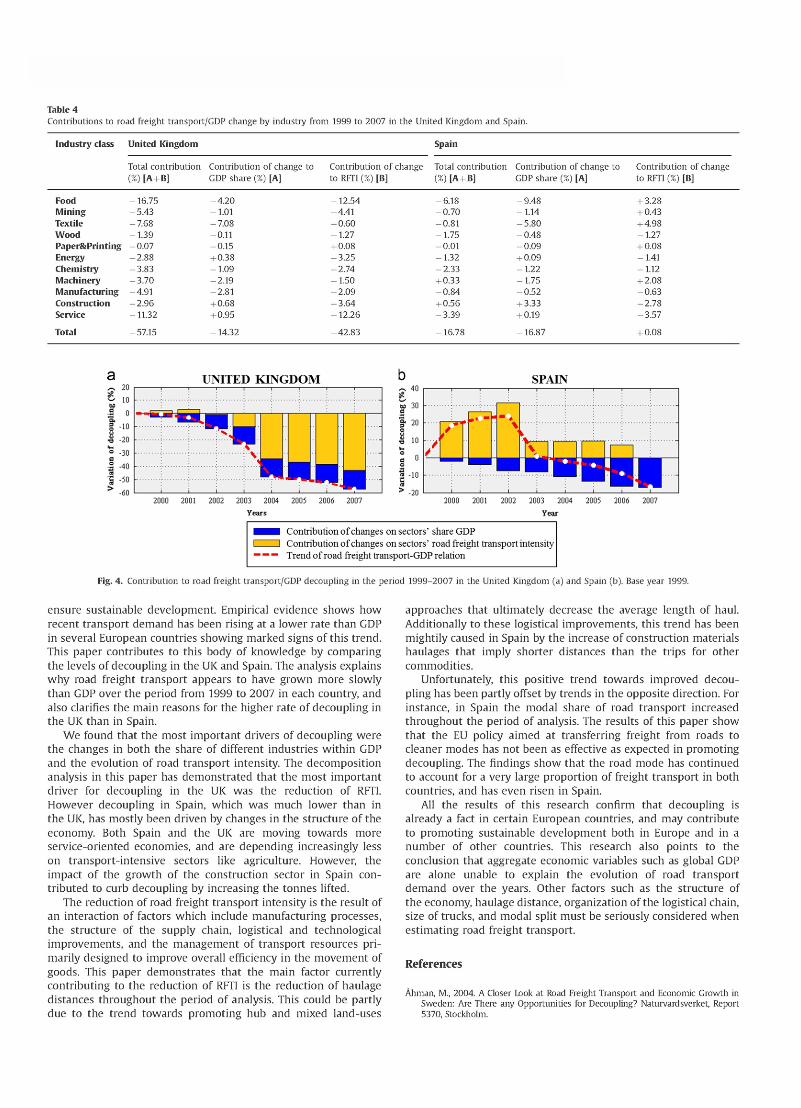
Table 4 Contributions to road freight transport/GDP change by industry f rom 1999 to 2007 in the United K ingdom and Spain.
Industry class United Kingdom Spain
Total contribution
(%) [ A + B ] Contribution of change to
GDP share (%) [A] Contribution of change
to RFTI (%) [B] Total contribution
(%) [ A + B ] Contribution of change to
GDP share (%) [A] Contribution of change
to RFTI (%) [B]
Food - 1 6 . 7 5 - 4 . 2 0 - 1 2 . 5 4 - 6 . 1 8 - 9 . 4 8 + 3.28 Mining - 5 . 4 3 - 1 . 01 - 4 . 4 1 - 0 . 7 0 -1 .14 + 0.43
Textile - 7 . 6 8 - 7 . 0 8 - 0 . 6 0 - 0 . 8 1 - 5 . 8 0 + 4.98
W o o d - 1 . 3 9 -0 .11 - 1 . 27 - 1 . 7 5 - 0 . 4 8 - 1 . 27 Paper&Printing - 0 . 0 7 -0 .15 + 0.08 - 0 . 0 1 - 0 . 0 9 + 0.08
Energy - 2 . 8 8 + 0.38 - 3 . 2 5 - 1 . 3 2 + 0.09 -1 .41
Chemistry - 3 . 8 3 - 1 . 0 9 - 2 . 7 4 - 2 . 3 3 - 1 . 2 2 -1 .12
Machinery - 3 . 7 0 - 2 . 1 9 - 1 . 5 0 + 0.33 - 1 . 7 5 + 2.08 Manufacturing - 4 . 9 1 - 2 . 8 1 - 2 . 0 9 - 0 . 8 4 - 0 . 5 2 - 0 . 6 3
Construction - 2 . 9 6 + 0.68 - 3 . 6 4 + 0.56 + 3.33 - 2 . 7 8
Service -11 .32 + 0.95 - 1 2 . 2 6 - 3 . 3 9 + 0.19 - 3 . 5 7
Total -57.15 - 1 4 . 3 2 - 4 2 . 8 3 - 1 6 . 7 8 - 1 6 . 8 7 + 0.08
a 20
£ If) If) M a 0 a. -ID •o •20 (4—1 o -111 a s -40 U -50 > -60
UNITED K I N G D O M SPAIN
9 2000 2001 2002 2003 2004 2005 2006 2007
Years
Contribution o f changes on sectors' share G D P
Contribution o f changes on sectors' road freight transport intensity
Trend o f road freight transport-GDP relation
Fig. 4. Contribution to road freight transport/GDP decoupling in the period 1999-2007 in the United Kingdom (a ) and Spain (b). Base year 1999.
ensure sustainable development. Empirical evidence shows how recent transport demand has been rising at a lower rate than GDP in several European countries showing marked signs of this trend. This paper contributes to this body of knowledge by comparing the levels of decoupling in the UK and Spain. The analysis explains why road freight transport appears to have grown more slowly than GDP over the period from 1999 to 2007 in each country, and also clarifies the main reasons for the higher rate of decoupling in the UK than in Spain.
We found that the most important drivers of decoupling were the changes in both the share of different industries within GDP and the evolution of road transport intensity. The decomposition analysis in this paper has demonstrated that the most important driver for decoupling in the UK was the reduction of RFTI. However decoupling in Spain, which was much lower than in the UK, has mostly been driven by changes in the structure of the economy. Both Spain and the UK are moving towards more service-oriented economies, and are depending increasingly less on transport-intensive sectors like agriculture. However, the impact of the growth of the construction sector in Spain con-tributed to curb decoupling by increasing the tonnes lifted.
The reduction of road freight transport intensity is the result of an interaction of factors which include manufacturing processes, the structure of the supply chain, logistical and technological improvements, and the management of transport resources pri-marily designed to improve overall efficiency in the movement of goods. This paper demonstrates that the main factor currently contributing to the reduction of RFTI is the reduction of haulage distances throughout the period of analysis. This could be partly due to the trend towards promoting hub and mixed land-uses
approaches that ultimately decrease the average length of haul. Additionally to these logistical improvements, this trend has been mightily caused in Spain by the increase of construction materials haulages that imply shorter distances than the trips for other commodities.
Unfortunately, this positive trend towards improved decou-pling has been partly offset by trends in the opposite direction. For instance, in Spain the modal share of road transport increased throughout the period of analysis. The results of this paper show that the EU policy aimed at transferring freight from roads to cleaner modes has not been as effective as expected in promoting decoupling. The findings show that the road mode has continued to account for a very large proportion of freight transport in both countries, and has even risen in Spain.
All the results of this research confirm that decoupling is already a fact in certain European countries, and may contribute to promoting sustainable development both in Europe and in a number of other countries. This research also points to the conclusion that aggregate economic variables such as global GDP are alone unable to explain the evolution of road transport demand over the years. Other factors such as the structure of the economy, haulage distance, organization of the logistical chain, size of trucks, and modal split must be seriously considered when estimating road freight transport.
References
Ahman, M., 2004. A Closer Look at Road Freight Transport and Economic Growth in Sweden: Are There any Opportunities for Decoupling? Naturvardsverket, Report 5370, Stockholm.
Arvis, J.F., Mustra, M.A., Panzer, J., Ojala, L, Naula, T., 2007. Connecting to Compete. Trade Logistics in the Global Economy. The Logistics Performance Index and Its Indicators, Washington, DC, World Bank.
Banister, David, Stead, Dominic, 2002. Reducing transport intensity. Eur. J. Transp. Infrastruct. Res. 2 (3/4), 161-178.
Bennathan, E., Fraser, J., Thompson, L.S., 1992. What Determines Demand for Freight Transport? Policy Research Working Papers. Transport, Infrastructure and Urban Development Department, The World Bank.
Transport Statistics, Great Britain. TSO: Department for Transport, London. Dietzenbacher, Erik, Los, Bart, 1997. Analyzing decomposition analyses. In: Simo-
novits, Andras, Steenge, Albert E. (Eds.), Prices, Growth and Cycles, pp. 108-131 European Commission. 2001a. A Sustainable Europe for a Better World: A European
Union Strategy for Sustainable Development (Commission's proposal to the Gothenburg European Council). Office for Official Publications of the European Communities.
European Commission. 2001b. European Transport Policy for 2020: Time to Decide [COM(2001)370], Office for Official Publications of the European Communities. <http://www.docstoc.com/docs/961695/The-World-Bank-report>.
European Commission, 2003. Freight transport intensity of production and con-sumption. Spain, <http://www.stoa.europarl.europa.eu/stoa/webdav/shared/ 3_activities/transport/general/ipts_freight_en.pdf>.
Eurostat, March 12, 2013. <http://epp.eurostat.ec.europa.eu>.
Gilbert, R, Nadeau, K, 2002. Decoupling economic growth and transport demand: a requirement for sustainability. In: Proceedings of the Conference on Transportation and Economic Development, Transportation Research Board, Portland, Oregon.
Kveiborg, Ole, Fosgerau, Mogens, 2007. Explaining the decoupling of freight traffic growth and economic growth. Transp. Policy 14 (1), 39-48.
Lehtonen, Markku, 2008. Energy use in UK road freight: a literature review. (August): 1-84.
McKinnon, Alan C., 2007. Decoupling of road freight transport and economic growth trends in the UK: an exploratory analysis. Transp. Rev. 27 (1), 37-64.
McKinnon, Alan C., Woodburn, Allan, 1996. Logistical restructuring and road freight traffic growth. Transportation 23 (2).
NEI, 1997. REDEFINE: relationship between demand for freight-transport and industrial effects, <http://www.cordis.europa.eu/transport/src/redefine.htm>.
OECD, 2003. Analysis of the links between transport and economic growth. <http://www.oecd.org/general/searchresults/>?q=Analysis of the Links Between Transport and Economic Growth&cx=012432601748511391518:xzeadub0 bOa&cof=FORID:ll&ie=UTF-8 (February 7, 2013).
Standing Advisory Comittee on Trunk Road Assessment (SACTRA), 1999. Transport and the economy: full report (SACTRA). Transport and the Economy.
Stead, Dominic, 2001. Trends in transport intensity across Europe. Transp. Policy 8 (1), 29-46.
"WIOD (Word Input-Output Database) project", (February 14, 2013) <http://www. wiod.org>.