rivalry, solidarity, and longevity among siblings: a life ... · rivalry, solidarity, and longevity...
TRANSCRIPT
DEMOGRAPHIC RESEARCH VOLUME 31, ARTICLE 38, PAGES 1167–1198 PUBLISHED 13 NOVEMBER 2014 http://www.demographic-research.org/Volumes/Vol31/38/ DOI: 10.4054/DemRes.2014.31.38 Research Article
Rivalry, solidarity, and longevity among siblings: A life course approach to the impact of sibship composition and birth order on later life mortality risk, Antwerp (1846–1920)
Robyn Donrovich
Paul Puschmann
Koen Matthijs
© 2014 Donrovich, Puschmann, & Matthijs. This open-access work is published under the terms of the Creative Commons Attribution NonCommercial License 2.0 Germany, which permits use, reproduction & distribution in any medium for non-commercial purposes, provided the original author(s) and source are given credit. See http:// creativecommons.org/licenses/by-nc/2.0/de/
Table of Contents
1 Introduction 1168 2 Historical context 1169 3 Theoretical background and previous research 1169 4 Materials and methods 1173 4.1 Database and study group 1173 4.2 Variables 1174 4.3 Methods 1177 5 Results 1178 5.1 Part I: Sibling composition in early life 1178 5.1.1 Main effects 1178 5.1.2 Interaction effects 1181 5.1.3 Part I: Discussion 1182 5.2 Part II: Sibling presence in later life 1184 5.2.1 Main effects 1184 5.2.2 Interaction effects 1185 5.2.3 Part II: Discussion 1189 6 Conclusions 1189 7 Acknowledgements 1191 References 1192 Appendix 1197
Demographic Research: Volume 31, Article 38
Research Article
http://www.demographic-research.org 1167
Rivalry, solidarity, and longevity among siblings:
A life course approach to the impact of sibship composition and
birth order on later life mortality risk, Antwerp (1846–1920)
Robyn Donrovich1
Paul Puschmann2
Koen Matthijs3
Abstract
BACKGROUND
Family composition and household dynamics, both in early and in later life, influence
individual health and longevity. Both positive and negative effects can be expected in
terms of sibling size and composition. On one hand, siblings compete with each other,
which may lead to resource dilution and increased adult mortality risks. On the other
hand, siblings protect and care for each other, which may have a positive impact on
longevity.
OBJECTIVE
To investigate the way in which sibling composition (with respect to sibship size, sex,
and birth order) in the family of orientation and the proximity of siblings in later life
relates to adult mortality risks at ages 50+.
METHODS
Life courses of 258 men and 275 women from the Antwerp COR*-database were
‗reconstructed‘ and analyzed by way of event history analysis using Gompertz shared
frailty models.
RESULTS
Being higher in birth order related to significantly higher mortality risk after age 50 for
men. Having older brothers, particularly those present in later life, was associated with
very high excess mortality risk for both sexes, though men were more strongly
disadvantaged. Having (more) younger sisters present at RP (research person) age 50
was related to significantly lower relative mortality risk for women.
1 Centre for Sociological Research, KU Leuven, Belgium. E-Mail:
[email protected]. 2 Centre for Sociological Research, KU Leuven, Belgium. E-Mail: [email protected]. 3 Centre for Sociological Research, KU Leuven, Belgium. E-Mail: [email protected].
Donrovich, Puschmann & Matthijs: Rivalry, solidarity, and longevity among siblings
1168 http://www.demographic-research.org
CONCLUSIONS
Our findings highlight the complex relationships between sibling and gender dynamics
and mortality risk in later life. Evidence of a lasting impact of sibling competition on
mortality risk over age 50 is found; and competition is only replaced by solidarity in
critical times (e.g., widowhood), wherein older sibling presence dissimilarly impacts
different social groups.
1. Introduction
A growing number of medical, epidemiological, and historical demographic studies find
a relationship between early life conditions and later life mortality (Oris 2005;
Bengtsson and Mineau 2009; Ben-Shlomo and Kuh 2002; Smith et al. 2009). Although
the discussion on the causal mechanisms behind this link continues, it is clear that
exposure to various risk factors in childhood has major negative effects on health and
life expectancy in later life. For example, exposure to famines, smoke, toxins, and
infectious diseases in childhood is associated with higher post-reproductive mortality
(Elo and Preston 1996; Hayward and Gorman 2004; Ben-Shlomo and Kuh 2002). It is
also accepted that the moment at which individuals are exposed to risk factors is
important, as certain periods in the life course are identified as critical or sensitive.
Moreover, risk factors operate at different levels of aggregation: the country, the
municipality, the neighborhood, the household, the family, and the individual (Ben-
Shlomo and Kuh 2002). In this article, we focus on individual level mortality risk
within the context of the family.
A family‘s role in the survival of its members is crucial, particularly for infants
and young children who spend most of their time within the home, and accordingly, are
highly dependent on individual family members to be their primary caretakers. While it
is clear that the presence or absence of certain family members has a direct influence on
the health, well-being, and survival chances of infants and children, there is also
evidence of long-term effects of family composition and internal family dynamics on
mortality outcomes in later life. Whereas parental and grandparental influence on infant
and child survival has been a primary focus of researchers, siblings‘ effect on survival
has not been studied as extensively. In this study we investigate whether the sibling
composition in the family of orientation and the proximity of siblings in later life have
an effect on longevity (in this study defined as survival past age 50). We use data from
the Antwerp COR*-database to ‗reconstruct‘ life courses and to link individuals to
family members both in and outside of the household. This is one of the few historical
demographic databases that allow us to study the life course of individuals in relation to
Demographic Research: Volume 31, Article 38
http://www.demographic-research.org 1169
the life course of their family members. We focus on the effect of sibship composition,
birth order, and sex on post-reproductive mortality, using cohorts born in the Belgian
district of Antwerp in the 19th
century. We follow 258 men and 275 women from age 50
on, in order to determine their mortality risks in relation to the family configuration
both in which they grew up, and in later life, controlling for other important factors.
2. Historical context
From a family perspective, the 19th
and early 20th
centuries witnessed important change.
First, the Western European marriage pattern was gradually beginning to disappear, as
the number of lifetime singles decreased and men and women started to marry earlier in
their life (Matthijs 2002). Simultaneously, a transition towards age homogamy began,
suggesting that egalitarian relations between husband and wife were gradually
becoming the new norm and that love became a necessary condition for marriage (Van
de Putte and Matthijs 2001; Coontz 2005). The fact that marriage witnesses were
increasingly sought among family members, especially siblings, could suggest that the
family was becoming a more important institution than it had been previously (Bras
2011; Matthijs 2003, 2006). Mortality decline strengthened family ties, as both parents
and children died less often prematurely, lengthening the time that they spent together.
Within the private sphere of the household, children had more time to play together,
thanks in part to industrialization and the decline of child labor, which strengthened the
bonds between brothers and sisters (Sanders 2002); and family members began to
participate more in joint leisure activities during weekends, especially on Sundays
(Gillis 1996).
The breadwinner–housewife model began to take root, which may have
strengthened family relationships, as women now had more time to spend with their
children. Overall during the course of the 19th
century, the transition from proto-
industry to modern industry, made a clearer distinction between work and family life,
underlining the emotional bonds between family members and weakening the
functional aspect of family relations.
3. Theoretical background and previous research
Life course studies on health propose that adult morbidity and mortality can be
explained, at least partly, by exposure to risk factors earlier in life (Ben-Shlomo and
Kuh 2002). Although researchers have been able to identify many risk factors in early
life which lead to higher mortality risk in later life, the causal link between and the
Donrovich, Puschmann & Matthijs: Rivalry, solidarity, and longevity among siblings
1170 http://www.demographic-research.org
mechanisms behind the two are often debated. In fact, many different pathways
between in utero, infant, and early childhood conditions and adult morbidity and
mortality have been suggested (Ben-Shlomo and Kuh 2002).
According to the critical period model, the health of individuals is biologically
pre-programmed in the womb and directly affects an individual down the line, as the
onset of chronic diseases manifest later in life (Barker 1994). Damage in critical periods
is believed to be irreversible, but life expectancy might be (further) shortened by later
life effect modifiers. Other researchers believe that outcomes in health and mortality in
later life are the result of an accumulation of risk during the life course. According to
the accumulation of risk model, an individual‘s experiences lead to cumulative damage
to the human body. Exposure to risks might be independent of each other and have
additive effects, or they may also be clustered where one risk acts as a trigger to other
risks (Ben-Shlomo and Kuh 2002). Contrary to the critical period model, health and
later life outcomes in the accumulation of risk approach are not so much pre-
programmed biologically, but are instead the outcome of a wide range of biological and
social factors from different stages of the life course (Kuh and Ben-Shlomo 1997).
Within the accumulation of risk paradigm, the life-style model argues that risky
behavior in adulthood is related to the socialization process of children. Whether adults
smoke, drink alcohol, eat unhealthily, or regularly exercise or not, can be traced back to
the prevalent behavior in the family of orientation, as children pick up habits and
behaviors from parents, siblings, and other relatives (Kuh and Ben-Shlomo 1997;
Hayward and Gorman 2004). According to the deprivation model, longevity differences
between individuals can be (partially) traced back to differences in the environmental
conditions in utero, in infancy, and in childhood. Forsdahl (1978) showed, for example,
that Norwegian adults born in regions with high infant mortality in the past had higher
incidence of cardiovascular diseases. Variations in cholesterol levels among men and
women in the age category 35–49 were linked to infant mortality rates at the time of
their birth. At the time the research was conducted, the differences in infant mortality
rates between regions in Norway had largely disappeared. He concluded that ―poverty
in childhood and adolescence, followed by later prosperity, results in high cholesterol
values [in later life]‖ (Forsdahl 1978: 34).
The terms scarring, acquired immunity, and selection have been used to describe
the direct or indirect positive/negative relationship between disease exposure in
childhood and adult mortality (Preston, Hill, and Drevenstedt 1998). Some historical
studies have found a strong relationship between high disease load and old age
mortality in rural parishes in southern Sweden in the 18th
and 19th
centuries (Bengtsson
and Lindström 2000, 2003). Results showed that exposure to airborne diseases during
the birth year (measured by use of yearly infant mortality rates) related to an increase in
older adult mortality risk. Other empirical research using the same database, Quaranta
Demographic Research: Volume 31, Article 38
http://www.demographic-research.org 1171
(2013), also highlighted the importance of infant mortality rates during the first year of
life as a predictor of adult mortality. These previous studies illustrate a scarring effect
from exposure to a high disease load in early life, in that being born during years with a
high infant mortality rate and prevalence of epidemics left a permanent ‗scar‘ on the
health of the individual affecting him or her down the line. However, exposure to
epidemics in early life could also yield a positive selection effect, meaning that those
who were able to survive these poor conditions in infancy and childhood acquired
immunity and were less likely to die from them in later life. Lee (1997) found some
evidence of this in Union army soldiers during the American Civil War. Troops from
healthier areas were more vulnerable to disease than those from harsher environments.
Surviving the adverse environment, in general, and reaching adulthood also suggests
that these individuals were ‗selected‘ from their frail peers who did not survive similar
poor conditions. Accordingly, these survivors benefitted from a health advantage in
later life.
Given the importance of early life conditions, the number and composition of
siblings one has may have implications on his or her health and longevity in later years;
further, the effect may be different for women and men. One hypothesis that can
address the way in which gender and sibships relate to the above life course models is
the resource dilution hypothesis (Blake 1981). This theory suggests that the more
siblings one has, the less family resources he or she will receive in infancy and
childhood. In other words, when there is an increasing number of children present in a
household, the overall quality of an individual child declines, as parental investments
relatively decrease per child. Given that the early years of life are deemed critical
according to life course epidemiology, sibling composition in childhood may have a
lasting influence on health and mortality in later life.
Some empirical studies have looked into the effect of sibship size on other
outcomes, since having more siblings means that more children needed to share the
same pool of resources (Blake 1987; Hertwig, Davis, and Sulloway 2002; Marks 2006).
Compared to those from smaller families, several researchers have found that those
born into larger families often have poorer educational outcomes, in terms of school
achievement (Rosenzweig and Wolpin 1980; Blake 1981; Hauser and Sewell 1986;
Hanushek 1992; Hill and O‘Neill 1994) or development of cognitive functions
(Belmont and Marolla 1973; Wolf 1982). Male and female infants and children were
most likely affected differently during resource competition. As there has been some
evidence of parental favoritism toward male offspring, females may have been
‗neglected‘ comparatively, in terms of developmental resources (Lloyd and Gage-
Brandon 1994). Accordingly, excess female mortality has been found in historical
European populations in certain age groups, particularly in younger ages (Devos 2000;
Eggerickx and Tabutin 1994; Kennedy 1973). During times of scarcity, adult women
Donrovich, Puschmann & Matthijs: Rivalry, solidarity, and longevity among siblings
1172 http://www.demographic-research.org
(in particular, mothers) in working class families may have put their husband‘s
nourishment ahead of their own (and their children‘s) thereby lowering their own
nutritional status, which can partly explain the excess female mortality risk in adulthood
in some historical populations (Humphries 1991; Klasen 1998). In addition to sibling
size and sex, the birth order of the individual may have also played a role. Children
born first or earlier in succession may have received more benefits than those born later,
as resources may have been exhausted on earlier children (Coall et al. 2009; Van Bavel
2006). Furthermore, the amount of medical care, such as vaccinations, had been shown
to decline for each successive child within a family (Hertwig, Davis, and Sulloway
2002), and girls were less likely to have received vaccinations compared to boys (Van
Poppel 2000). The effect may have been more pronounced for those in larger families,
especially for females, for reasons described above.
Even though sibling competition for resources may have an impact on investment
during childhood, sibling ties are also some of the longest lasting social relationships an
individual has in life. Bonds can be ever-changing (in strength or direction) throughout
the life course, but may become increasingly important in later adulthood and for the
elderly, particularly when one‘s own children are grown and one‘s spouse is gone
(Cumming and Schneider 1961). In the absence of children or spouse, aside from
providing companionship, siblings may have had to step in financially, as the social
welfare system in Belgium had not yet been fully established (Lamberts 2006). Given
the very long duration and importance of siblings ties, essentially lasting from cradle to
grave, we expect that sibling relationships or lack thereof will have had a strong
positive or negative effect on the later-life mortality risk of individual family members,
as poor social support is related to increased morbidity and mortality risk (House,
Landis, and Umberson 1988).
In light of these frameworks, we developed three hypotheses:
(H1) Sex: men will have higher mortality risk at ages 50+ compared to women,
but may fare better during resource competition.
(H2) Early life
A. Birth order: firstborns will be relatively better off than later-born
siblings.
B. Sibling composition: accordingly, having many older siblings (mostly
brothers) will leave the research person (from here abbreviated as RP)
especially vulnerable.
(H3) Later life: sibling presence in later life will be beneficial for RP‘s mortality
risk. Having younger siblings, in particular, will lower RP‘s mortality risk.
Demographic Research: Volume 31, Article 38
http://www.demographic-research.org 1173
4. Materials and methods
4.1 Database and study group
Data stems from the COR*-database, which contains linked micro level demographic
data on individual life courses in the Antwerp district from the period 1846–1920. The
data is a letter sample consisting of individuals whose surname began with ―COR‖ and
their co-residents (kin or non-kin) within a household. The database includes population
registers and vital registration records, containing information on births, deaths, and
marriages (Matthijs and Moreels 2010).
We performed a data retrieval from the Antwerp COR*-database, which is stored
in a series of tables in Microsoft Access 2010. The tables contain characteristics of
individuals, families, households, and life events for each RP. From these tables, we
‗reconstructed‘ individual life courses, producing a final ‗episode‘ file for analysis. We
linked individuals through a mother-identifier in order to construct sibship sizes,
composition, and birth orders, including only children, for our RPs. Our study group
included men and women who had:
i) a mother still alive and present at the 1846 register in Antwerp (as we linked
siblings through a mother identifier),
ii) birth date information,
iii) been born in the district of Antwerp, and
iv) whose birth dates fell between 1800 and 1859, so that the youngest cohorts
would have been able to reach ages 60–70 by the end of the study period.
The earliest birth date included in the study was 11 June 1801 and the latest birth
date recorded was 18 December 1859. Individuals were under risk from age 50 until
1920, the end of the last population register (1910) included in the COR*-database.
Individuals were censored at emigration if they left Antwerp after age 50 (n=1) or at the
start of the next population register (which is the end of the last population register in
which they were recorded) for those who disappeared from the population registers
without a recorded emigration date (n=97). In addition to these losses to follow-up,
there were a few limitations with the data. Given the rather short timeframe of our data
with reliable death certificates, more than half of the individuals in our study were still
alive by the end of the observation period, as 41% of the original study group (n=533)
died during the period of observation in the Antwerp district. Generated sibship size
may have been underestimated for the two earliest cohorts (1800–1829 and 1830–
1839), since the first population register in Antwerp did not begin until 1846. Given the
time lapse between birth dates and register opening, siblings may have moved away
Donrovich, Puschmann & Matthijs: Rivalry, solidarity, and longevity among siblings
1174 http://www.demographic-research.org
from Antwerp before register opening and had not been able to be linked to a mother in
the database. However, as long as the siblings were born in Antwerp (all study
participants were born in Antwerp) they should have been accounted for. We controlled
for birth cohort in order to mitigate this potential bias, as well as by excluding migrants
born outside of Antwerp, as we did not have full information on their siblings.
According to these criteria, our final study sample is 533 (275 women and 258 men).
4.2 Variables
Sex is coded as male and female. Birth cohort was grouped as 1800–1829, 1830–1839,
1840–1849, and 1850–1859. We included two variables occurring in early life as
proxies for potential health implications during development. The first is mother‘s age
at birth which has been associated with child health even in the long-term (Kemkes-
Grottenthaler 2004; Smith et al. 2009). We categorized it as ages 15–24, 25–34, and
35+. The variable disease exposure notes whether an epidemic occurred in the Antwerp
region during RP‘s critical years of development. Epidemics included cholera, malaria,
measles, small pox, and typhus. The variable was constructed using information
collected from Kruithof (1964). Since we only have the year in which the epidemic took
place, we coded this as a dummy variable, noting whether the epidemic took place in
the calendar year before, during, or after RP‘s birth year. Both father‘s and RP‘s
occupations are based on HISCO coding (Historical International Standard
Classification of Occupations). We used a HISCLASS classification system that takes
into account skill degree, supervision level, and whether the occupation was manual or
non-manual (Van Leeuwen and Maas 2005). Father‘s occupation (at birth) was grouped
into 4 categories: professionals, foremen, and skilled; farmers; unskilled and day
laborers; and a missing category if no information was found in the sources. We took
RP‘s occupation from the population register in which a person was 50 years old (start
of observation). We categorized occupations into 5 groups, representing somewhat
hierarchal levels: professionals, consisting of higher managers and professionals, lower
managers and professionals, clerical and sales personnel; foremen, skilled and lower
skilled workers; farmers, both skilled and unskilled; unskilled workers and day
laborers; and an unknown category if no occupation was found. Birth order was
grouped into 5 categories: only child (first and only born), 1st, 2
nd, 3
rd or higher and
unknown if a sibling did not have a birthdate recorded. The composition of siblings is
measured in 8 variables based on the number of younger brothers, younger sisters, older
brothers, and older sisters. The first set of the 4 sibling variables measured in childhood
(―ever-born‖ siblings) are used in Part I of the analysis and coded as 0, 1, 2, 3+. The
second set of sibling variables is measured at RP age 50 (Part II of the analysis), coded
Demographic Research: Volume 31, Article 38
http://www.demographic-research.org 1175
as 0, 1, 2+, and reflects whether or not the siblings were alive and residing in Antwerp.
RP‘s number of children ranged from 1–23 and is categorized as 1–4, 5–9, 10+, and 0
or ―unknown,‖ if they were not linked to any children in the sample. Marital status –
unmarried, married, widowed, and unknown was a time-varying covariate starting from
age 50, constructed from marriage certificates, vital registrations, and population
registers. While present in the registers, there were no divorces in our study group.
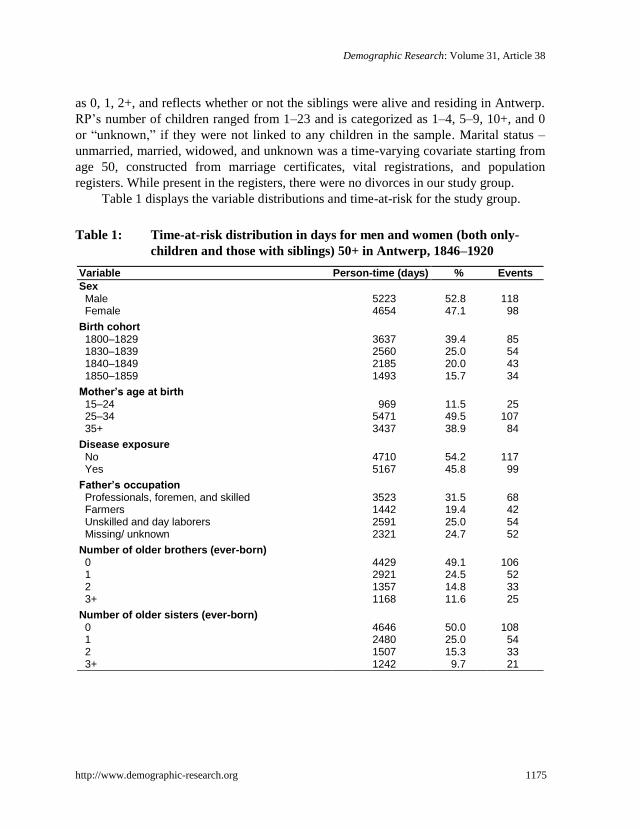
Table 1 displays the variable distributions and time-at-risk for the study group.
Table 1: Time-at-risk distribution in days for men and women (both only-
children and those with siblings) 50+ in Antwerp, 1846–1920
Variable Person-time (days) % Events
Sex Male 5223 52.8 118 Female 4654 47.1 98
Birth cohort 1800–1829 3637 39.4 85 1830–1839 2560 25.0 54 1840–1849 2185 20.0 43 1850–1859 1493 15.7 34
Mother’s age at birth 15–24 969 11.5 25 25–34 5471 49.5 107 35+ 3437 38.9 84
Disease exposure No 4710 54.2 117 Yes 5167 45.8 99
Father’s occupation Professionals, foremen, and skilled 3523 31.5 68 Farmers 1442 19.4 42 Unskilled and day laborers 2591 25.0 54 Missing/ unknown 2321 24.7 52
Number of older brothers (ever-born) 0 4429 49.1 106 1 2921 24.5 52 2 1357 14.8 33 3+ 1168 11.6 25
Number of older sisters (ever-born) 0 4646 50.0 108 1 2480 25.0 54 2 1507 15.3 33 3+ 1242 9.7 21
Donrovich, Puschmann & Matthijs: Rivalry, solidarity, and longevity among siblings
1176 http://www.demographic-research.org
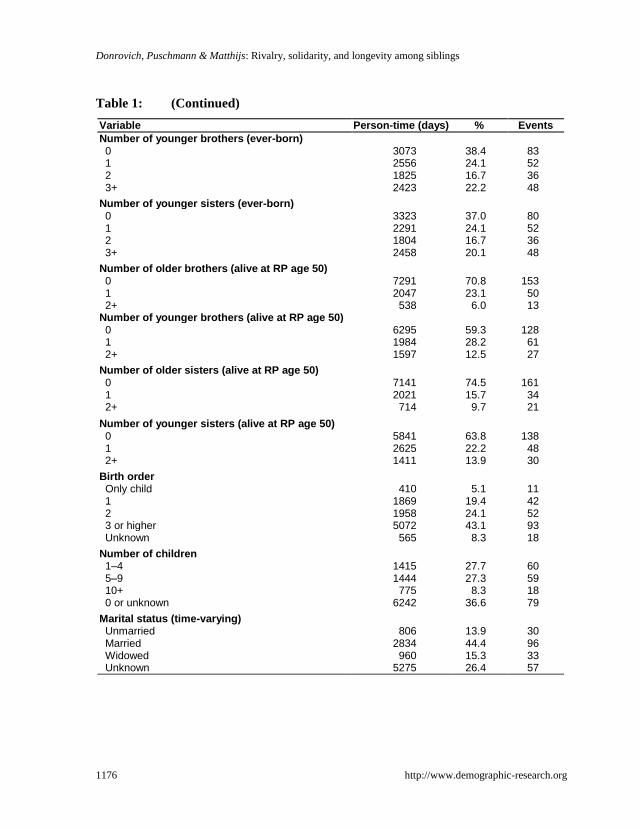
Table 1: (Continued)
Variable Person-time (days) % Events
Number of younger brothers (ever-born) 0 3073 38.4 83 1 2556 24.1 52 2 1825 16.7 36 3+ 2423 22.2 48
Number of younger sisters (ever-born) 0 3323 37.0 80 1 2291 24.1 52 2 1804 16.7 36 3+ 2458 20.1 48
Number of older brothers (alive at RP age 50) 0 7291 70.8 153 1 2047 23.1 50 2+ 538 6.0 13
Number of younger brothers (alive at RP age 50) 0 6295 59.3 128 1 1984 28.2 61 2+ 1597 12.5 27
Number of older sisters (alive at RP age 50) 0 7141 74.5 161 1 2021 15.7 34 2+ 714 9.7 21
Number of younger sisters (alive at RP age 50) 0 5841 63.8 138 1 2625 22.2 48 2+ 1411 13.9 30
Birth order Only child 410 5.1 11 1 1869 19.4 42 2 1958 24.1 52 3 or higher 5072 43.1 93 Unknown 565 8.3 18
Number of children 1–4 1415 27.7 60 5–9 1444 27.3 59 10+ 775 8.3 18 0 or unknown 6242 36.6 79
Marital status (time-varying) Unmarried 806 13.9 30 Married 2834 44.4 96 Widowed 960 15.3 33 Unknown 5275 26.4 57
Demographic Research: Volume 31, Article 38
http://www.demographic-research.org 1177
Table 1: (Continued)
Variable Person-time (days) % Events
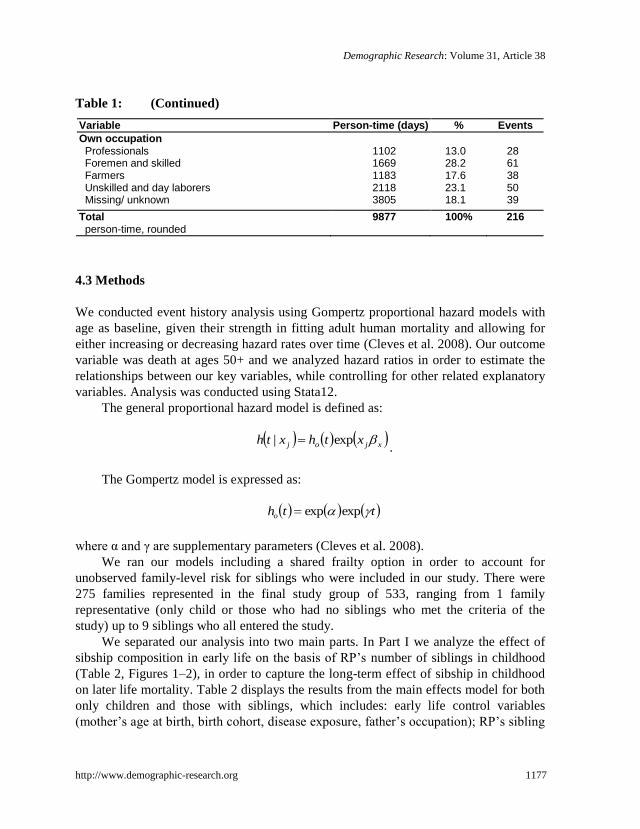
Own occupation Professionals 1102 13.0 28 Foremen and skilled 1669 28.2 61 Farmers 1183 17.6 38 Unskilled and day laborers 2118 23.1 50 Missing/ unknown 3805 18.1 39
Total 9877 100% 216 person-time, rounded
4.3 Methods
We conducted event history analysis using Gompertz proportional hazard models with
age as baseline, given their strength in fitting adult human mortality and allowing for
either increasing or decreasing hazard rates over time (Cleves et al. 2008). Our outcome
variable was death at ages 50+ and we analyzed hazard ratios in order to estimate the
relationships between our key variables, while controlling for other related explanatory
variables. Analysis was conducted using Stata12.
The general proportional hazard model is defined as:
xjoj xthxth exp| .
The Gompertz model is expressed as:
ttho expexp
where α and γ are supplementary parameters (Cleves et al. 2008).
We ran our models including a shared frailty option in order to account for
unobserved family-level risk for siblings who were included in our study. There were
275 families represented in the final study group of 533, ranging from 1 family
representative (only child or those who had no siblings who met the criteria of the
study) up to 9 siblings who all entered the study.
We separated our analysis into two main parts. In Part I we analyze the effect of
sibship composition in early life on the basis of RP‘s number of siblings in childhood
(Table 2, Figures 1–2), in order to capture the long-term effect of sibship in childhood
on later life mortality. Table 2 displays the results from the main effects model for both
only children and those with siblings, which includes: early life control variables
(mother‘s age at birth, birth cohort, disease exposure, father‘s occupation); RP‘s sibling
Donrovich, Puschmann & Matthijs: Rivalry, solidarity, and longevity among siblings
1178 http://www.demographic-research.org
composition in early life (number of older brothers, younger brothers, older sisters, and
younger sisters); and later life control variables (time-varying marital status, number of
children, and occupation). In order to see how risk varies by birth order and sex, and to
test hypothesis H2a, we interact these terms in Figure 1. Because of the positive
relationship found in Table 2 of having older brothers on mortality risk, Figure 2
presents the results from the interaction between number of older brothers and RP‘s sex.
In Part II we investigate the effect of the composition of surviving siblings who
were living in Antwerp at the start of the study (RP age 50), in order to test our
hypothesis H3 on the effect of sibling presence in later life (Tables 3–5, Figure 3a, 3b).
We included number of older brothers, younger brothers, older sisters, and younger
sisters at the start of observation for each study member (at age 50). Results from the
fully adjusted model are shown in Table 3 for our main sibship variables (full nested
models in the Appendix). Relative risks from the interaction between sex and number of
older brothers at RP‘s age 50 are shown in Figure 3a, and sex and number of younger
sisters in Figure 3b, in order to distinguish sex differences according to the number of
older brothers and younger sisters present in later life. Given that the presence of older
siblings in later life might have very different meaning (protective/ adverse/ none) for
those in different marital statuses (a strong mortality indicator), we interacted these
terms. Tables 4 and 5 present the results from the interaction between marital status and
number of older sisters and marital status and number of older brothers, respectively,
separately for men and women in the study.
5. Results
5.1 Part I: Sibling composition in early life
5.1.1 Main effects
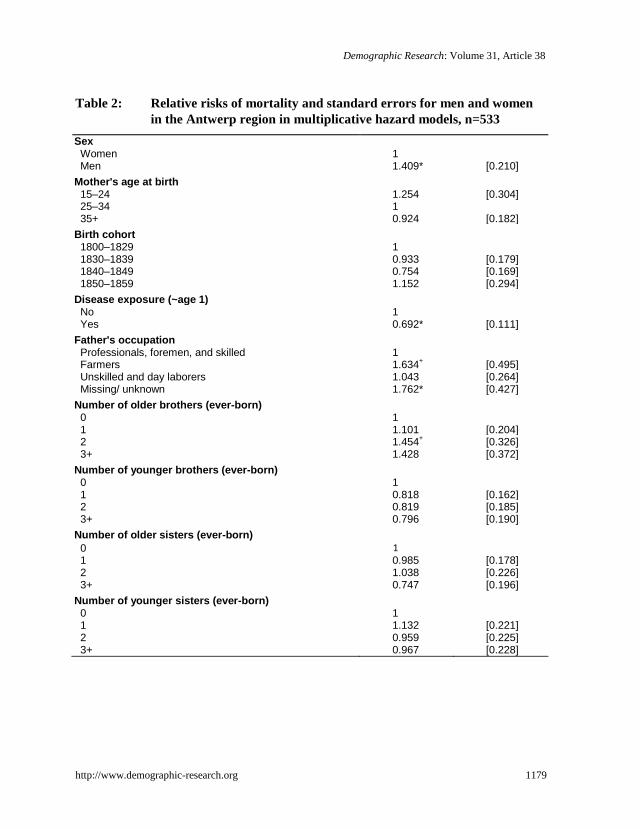
Relative mortality risks from age 50+ are displayed in Table 2 for men and women
during our study period in Antwerp. Of the 533 men and women in our study, there
were 216 deaths (118 men and 98 women) by the end of the study period, 1920.
Demographic Research: Volume 31, Article 38
http://www.demographic-research.org 1179
Table 2: Relative risks of mortality and standard errors for men and women
in the Antwerp region in multiplicative hazard models, n=533
Sex Women 1 Men 1.409* [0.210]
Mother's age at birth 15–24 1.254 [0.304] 25–34 1 35+ 0.924 [0.182]
Birth cohort 1800–1829 1 1830–1839 0.933 [0.179] 1840–1849 0.754 [0.169] 1850–1859 1.152 [0.294]
Disease exposure (~age 1) No 1 Yes 0.692* [0.111]
Father's occupation Professionals, foremen, and skilled 1 Farmers 1.634
+ [0.495]
Unskilled and day laborers 1.043 [0.264] Missing/ unknown 1.762* [0.427]
Number of older brothers (ever-born) 0 1 1 1.101 [0.204] 2 1.454
+ [0.326]
3+ 1.428 [0.372] Number of younger brothers (ever-born)
0 1 1 0.818 [0.162] 2 0.819 [0.185] 3+ 0.796 [0.190]
Number of older sisters (ever-born)
0 1 1 0.985 [0.178] 2 1.038 [0.226] 3+ 0.747 [0.196]
Number of younger sisters (ever-born) 0 1 1 1.132 [0.221] 2 0.959 [0.225] 3+ 0.967 [0.228]
Donrovich, Puschmann & Matthijs: Rivalry, solidarity, and longevity among siblings
1180 http://www.demographic-research.org
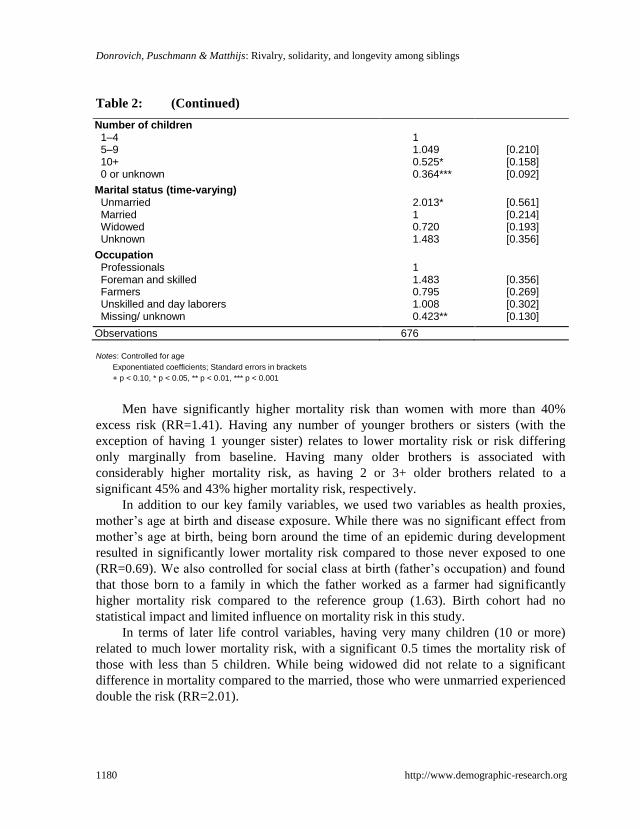
Table 2: (Continued)
Number of children 1–4 1 5–9 1.049 [0.210] 10+ 0.525* [0.158] 0 or unknown 0.364*** [0.092]
Marital status (time-varying) Unmarried 2.013* [0.561] Married 1 [0.214] Widowed 0.720 [0.193] Unknown 1.483 [0.356]
Occupation Professionals 1 Foreman and skilled 1.483 [0.356] Farmers 0.795 [0.269] Unskilled and day laborers 1.008 [0.302] Missing/ unknown 0.423** [0.130]
Observations 676
Notes: Controlled for age
Exponentiated coefficients; Standard errors in brackets
+ p < 0.10, * p < 0.05, ** p < 0.01, *** p < 0.001
Men have significantly higher mortality risk than women with more than 40%
excess risk (RR=1.41). Having any number of younger brothers or sisters (with the
exception of having 1 younger sister) relates to lower mortality risk or risk differing
only marginally from baseline. Having many older brothers is associated with
considerably higher mortality risk, as having 2 or 3+ older brothers related to a
significant 45% and 43% higher mortality risk, respectively.
In addition to our key family variables, we used two variables as health proxies,
mother‘s age at birth and disease exposure. While there was no significant effect from
mother‘s age at birth, being born around the time of an epidemic during development
resulted in significantly lower mortality risk compared to those never exposed to one
(RR=0.69). We also controlled for social class at birth (father‘s occupation) and found
that those born to a family in which the father worked as a farmer had significantly
higher mortality risk compared to the reference group (1.63). Birth cohort had no
statistical impact and limited influence on mortality risk in this study.
In terms of later life control variables, having very many children (10 or more)
related to much lower mortality risk, with a significant 0.5 times the mortality risk of
those with less than 5 children. While being widowed did not relate to a significant
difference in mortality compared to the married, those who were unmarried experienced
double the risk (RR=2.01).
Demographic Research: Volume 31, Article 38
http://www.demographic-research.org 1181
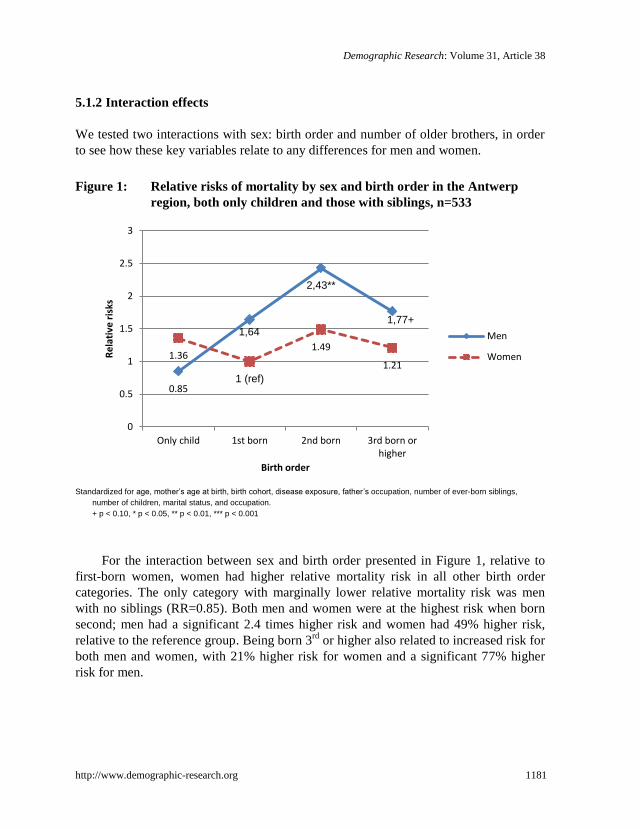
5.1.2 Interaction effects
We tested two interactions with sex: birth order and number of older brothers, in order
to see how these key variables relate to any differences for men and women.
Figure 1: Relative risks of mortality by sex and birth order in the Antwerp
region, both only children and those with siblings, n=533
Standardized for age, mother’s age at birth, birth cohort, disease exposure, father’s occupation, number of ever-born siblings,
number of children, marital status, and occupation.
+ p < 0.10, * p < 0.05, ** p < 0.01, *** p < 0.001
For the interaction between sex and birth order presented in Figure 1, relative to
first-born women, women had higher relative mortality risk in all other birth order
categories. The only category with marginally lower relative mortality risk was men
with no siblings (RR=0.85). Both men and women were at the highest risk when born
second; men had a significant 2.4 times higher risk and women had 49% higher risk,
relative to the reference group. Being born 3rd
or higher also related to increased risk for
both men and women, with 21% higher risk for women and a significant 77% higher
risk for men.
0.85
1,64
2,43**
1,77+
1.36
1 (ref)
1.49
1.21
0
0.5
1
1.5
2
2.5
3
Only child 1st born 2nd born 3rd born orhigher
Re
lati
ve r
isks
Birth order
Men
Women
Donrovich, Puschmann & Matthijs: Rivalry, solidarity, and longevity among siblings
1182 http://www.demographic-research.org
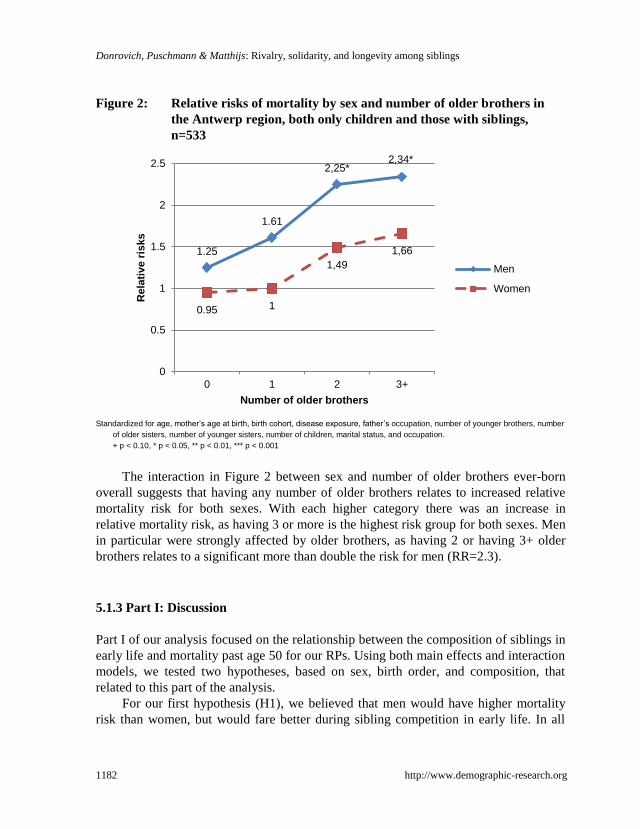
Figure 2: Relative risks of mortality by sex and number of older brothers in
the Antwerp region, both only children and those with siblings,
n=533
Standardized for age, mother’s age at birth, birth cohort, disease exposure, father’s occupation, number of younger brothers, number
of older sisters, number of younger sisters, number of children, marital status, and occupation.
+ p < 0.10, * p < 0.05, ** p < 0.01, *** p < 0.001
The interaction in Figure 2 between sex and number of older brothers ever-born
overall suggests that having any number of older brothers relates to increased relative
mortality risk for both sexes. With each higher category there was an increase in
relative mortality risk, as having 3 or more is the highest risk group for both sexes. Men
in particular were strongly affected by older brothers, as having 2 or having 3+ older
brothers relates to a significant more than double the risk for men (RR=2.3).
5.1.3 Part I: Discussion
Part I of our analysis focused on the relationship between the composition of siblings in
early life and mortality past age 50 for our RPs. Using both main effects and interaction
models, we tested two hypotheses, based on sex, birth order, and composition, that
related to this part of the analysis.
For our first hypothesis (H1), we believed that men would have higher mortality
risk than women, but would fare better during sibling competition in early life. In all
1.25
1.61
2,25* 2,34*
0.95 1
1,49
1,66
0
0.5
1
1.5
2
2.5
0 1 2 3+
Rela
tive r
isks
Number of older brothers
Men
Women
Demographic Research: Volume 31, Article 38
http://www.demographic-research.org 1183
main effects models, men had higher mortality risk, confirming the first part of our
hypothesis. However, the second part of our hypothesis was not confirmed, as men
seem even more negatively affected by being higher in order of birth, or having many
older brothers in early life, compared to women.
We hypothesized (H2a) that being higher in birth order would also relate to
increased mortality risk in later life, compared to only children or firstborns, as by the
time of RP‘s birth, one or more siblings has/have already been consuming parental
resources. Further, beyond resource scarcity, birth order has also been linked to several
social factors that influence one‘s life course, such as professional opportunities,
reproductive behavior, decisions about emigration, and personality (Sulloway 2001).
Being born first is most advantageous; and given that we find this relationship for
mortality over 50, this advantage appears to be life-long. Because the positive effect of
being a firstborn may have been linked to a younger mother‘s age at birth, which has its
own implications for the health and development of the fetus and future offspring, we
controlled for this separately. Accordingly, we suspect that firstborns received
preferential treatment from their parents, and/or lived a less risky lifestyle than their
later-born siblings, in order to be an example for their younger brothers and sisters. This
could also help explain why those born second are the most disadvantaged group for
both men and women, as younger siblings tend to rebel, and firstborns tend to be more
accepting of parental values or responsibility (Sulloway 1996).
We expected (H2b) that having a greater number of older siblings, particularly
brothers, would have a negative impact on RP‘s survival chances in later life, due to the
effect of resource dilution during early development, given that having a larger number
of siblings has been theoretically linked to lower investment in childhood (Blake 1987;
Hertwig, Davis, and Sulloway 2002; Marks 2006) and empirically shown to relate to
worse health in adulthood (Lundberg 1993). Our findings suggest that having a larger
number of older siblings does relate to lower survival chances after age 50. We found
that this was largely influenced by sibling sex, as having many older brothers was
related to a much higher significant mortality risk for members of our study group. In
order to further analyze this finding, we were interested in whether not only sibling sex
mattered, but also if the sex of the RP did. We interacted these variables and found that
both men and women had higher risk from having any number of older brothers, though
men were significantly more affected with very high excess risk at more than double.
Donrovich, Puschmann & Matthijs: Rivalry, solidarity, and longevity among siblings
1184 http://www.demographic-research.org
5.2 Part II: Sibling presence in later life
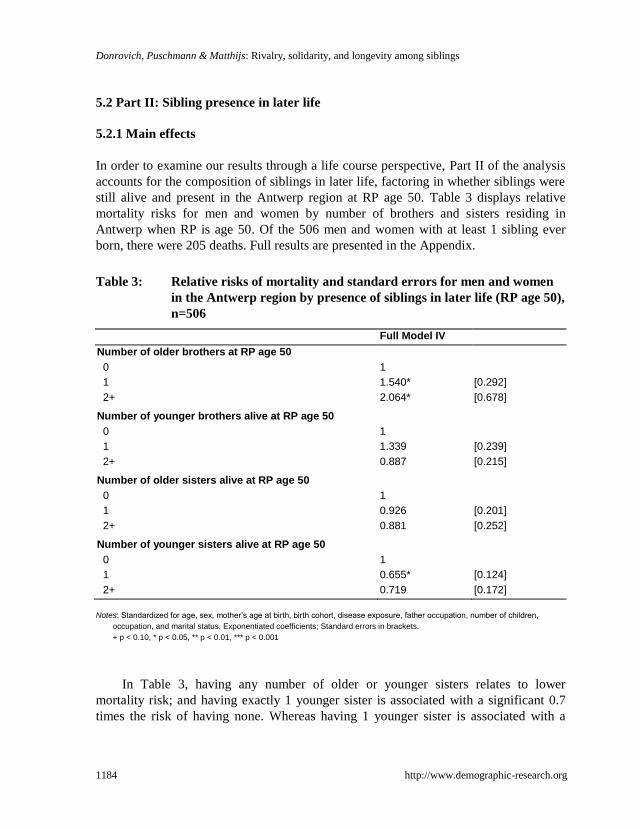
5.2.1 Main effects
In order to examine our results through a life course perspective, Part II of the analysis
accounts for the composition of siblings in later life, factoring in whether siblings were
still alive and present in the Antwerp region at RP age 50. Table 3 displays relative
mortality risks for men and women by number of brothers and sisters residing in
Antwerp when RP is age 50. Of the 506 men and women with at least 1 sibling ever
born, there were 205 deaths. Full results are presented in the Appendix.
Table 3: Relative risks of mortality and standard errors for men and women
in the Antwerp region by presence of siblings in later life (RP age 50),
n=506
Full Model IV
Number of older brothers at RP age 50
0 1
1 1.540* [0.292]
2+ 2.064* [0.678]
Number of younger brothers alive at RP age 50
0 1
1 1.339 [0.239]
2+ 0.887 [0.215]
Number of older sisters alive at RP age 50
0 1
1 0.926 [0.201]
2+ 0.881 [0.252]
Number of younger sisters alive at RP age 50
0 1
1 0.655* [0.124]
2+ 0.719 [0.172]
Notes: Standardized for age, sex, mother’s age at birth, birth cohort, disease exposure, father occupation, number of children,
occupation, and marital status. Exponentiated coefficients; Standard errors in brackets.
+ p < 0.10, * p < 0.05, ** p < 0.01, *** p < 0.001
In Table 3, having any number of older or younger sisters relates to lower
mortality risk; and having exactly 1 younger sister is associated with a significant 0.7
times the risk of having none. Whereas having 1 younger sister is associated with a
Demographic Research: Volume 31, Article 38
http://www.demographic-research.org 1185
lower relative mortality risk, having 1 younger brother has the opposite effect with
approximately 34% higher risk compared to having none (RR=1.34). However, the
highest risks belong to those having any number of older brothers. There is a significant
54% higher risk for having 1 and significant 2 times higher risk of having 2+ compared
to those having no older brothers present in later life.
5.2.2 Interaction effects
We performed four interactions based on sibling presence in later life: sex and number
of older brothers and younger sisters (Figure 3a and 3b) and RP‘s marital status and
number of older sisters (Table 4) and older brothers (Table 5).
In order to gauge any sex differences in the strong, positive relationship between
number of older brothers and mortality after age 50, and the inverse relationship
between younger sisters and mortality, we interacted these terms in Figures 3a and 3b,
respectively.
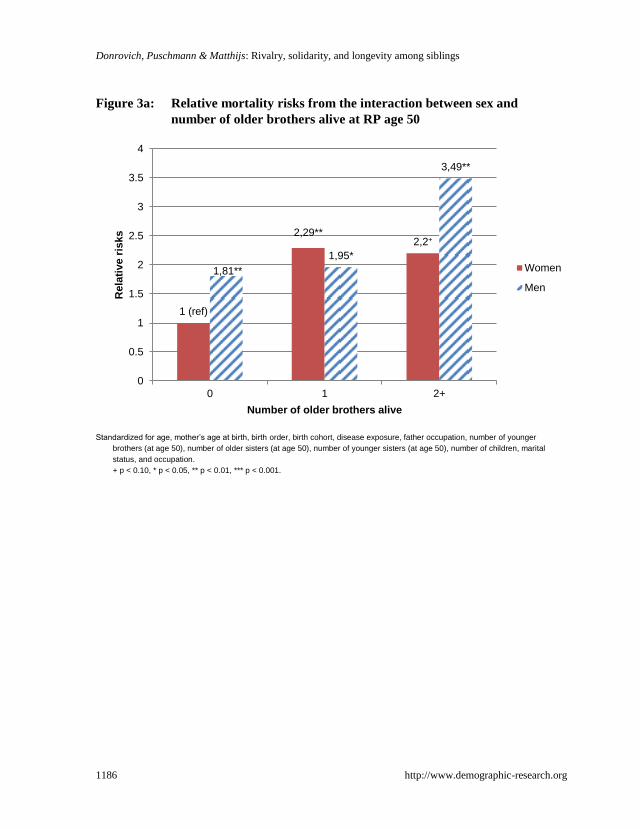
In Figure 3a, relative to women with no older brothers, all other categories have
higher mortality risk. Men with 2+ older brothers are the most vulnerable group with
3.5 times the mortality risk of the reference category. Compared to having no brothers,
women with older brothers have significantly higher mortality risk, at more than two-
fold, for those with 1 brother (RR=2.3) and those with 2 or more (RR=2.2). For both
men and women, having older brothers alive and residing in Antwerp in later life had a
strong, negative relationship with their survival chances after age 50 with all relative
risks significantly much higher than 1.
Donrovich, Puschmann & Matthijs: Rivalry, solidarity, and longevity among siblings
1186 http://www.demographic-research.org
Figure 3a: Relative mortality risks from the interaction between sex and
number of older brothers alive at RP age 50
Standardized for age, mother’s age at birth, birth order, birth cohort, disease exposure, father occupation, number of younger
brothers (at age 50), number of older sisters (at age 50), number of younger sisters (at age 50), number of children, marital
status, and occupation.
+ p < 0.10, * p < 0.05, ** p < 0.01, *** p < 0.001.
1 (ref)
2,29** 2,2+
1,81**
1,95*
3,49**
0
0.5
1
1.5
2
2.5
3
3.5
4
0 1 2+
Rela
tive r
isks
Number of older brothers alive
Women
Men
Demographic Research: Volume 31, Article 38
http://www.demographic-research.org 1187
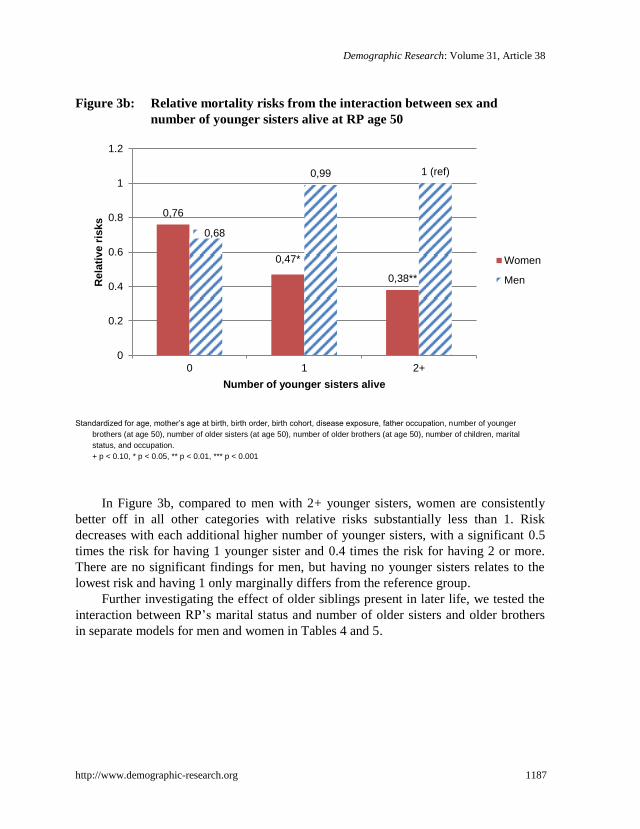
Figure 3b: Relative mortality risks from the interaction between sex and
number of younger sisters alive at RP age 50
Standardized for age, mother’s age at birth, birth order, birth cohort, disease exposure, father occupation, number of younger
brothers (at age 50), number of older sisters (at age 50), number of older brothers (at age 50), number of children, marital
status, and occupation.
+ p < 0.10, * p < 0.05, ** p < 0.01, *** p < 0.001
In Figure 3b, compared to men with 2+ younger sisters, women are consistently
better off in all other categories with relative risks substantially less than 1. Risk
decreases with each additional higher number of younger sisters, with a significant 0.5
times the risk for having 1 younger sister and 0.4 times the risk for having 2 or more.
There are no significant findings for men, but having no younger sisters relates to the
lowest risk and having 1 only marginally differs from the reference group.
Further investigating the effect of older siblings present in later life, we tested the
interaction between RP‘s marital status and number of older sisters and older brothers
in separate models for men and women in Tables 4 and 5.
0,76
0,47*
0,38**
0,68
0,99 1 (ref)
0
0.2
0.4
0.6
0.8
1
1.2
0 1 2+
Rela
tive r
isks
Number of younger sisters alive
Women
Men
Donrovich, Puschmann & Matthijs: Rivalry, solidarity, and longevity among siblings
1188 http://www.demographic-research.org
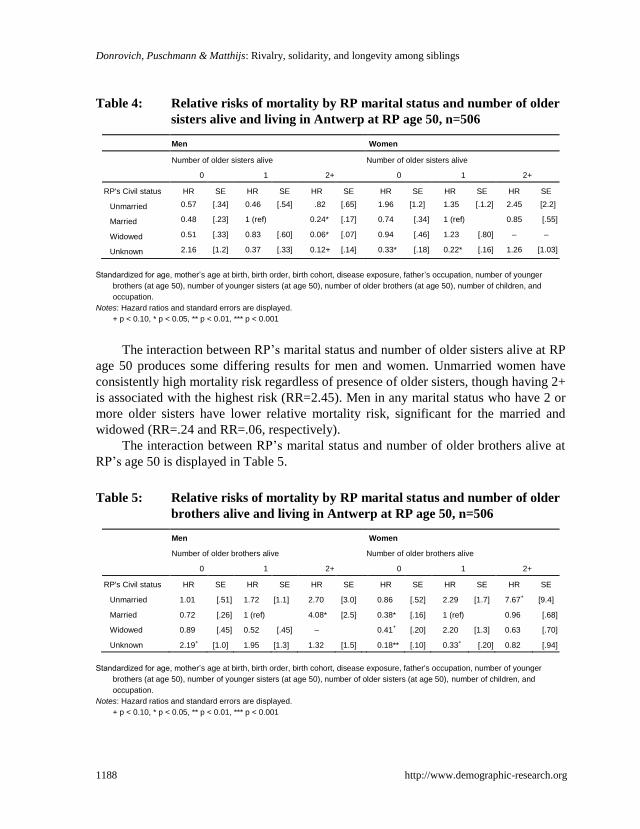
Table 4: Relative risks of mortality by RP marital status and number of older
sisters alive and living in Antwerp at RP age 50, n=506
Men Women
Number of older sisters alive Number of older sisters alive
0 1 2+ 0 1 2+
RP's Civil status HR SE HR SE HR SE HR SE HR SE HR SE
Unmarried 0.57 [.34] 0.46 [.54] .82 [.65] 1.96 [1.2] 1.35 [.1.2] 2.45 [2.2]
Married 0.48 [.23] 1 (ref) 0.24* [.17] 0.74 [.34] 1 (ref) 0.85 [.55]
Widowed 0.51 [.33] 0.83 [.60] 0.06* [.07] 0.94 [.46] 1.23 [.80] – –
Unknown 2.16 [1.2] 0.37 [.33] 0.12+ [.14] 0.33* [.18] 0.22* [.16] 1.26 [1.03]
Standardized for age, mother’s age at birth, birth order, birth cohort, disease exposure, father’s occupation, number of younger
brothers (at age 50), number of younger sisters (at age 50), number of older brothers (at age 50), number of children, and
occupation.
Notes: Hazard ratios and standard errors are displayed.
+ p < 0.10, * p < 0.05, ** p < 0.01, *** p < 0.001
The interaction between RP‘s marital status and number of older sisters alive at RP
age 50 produces some differing results for men and women. Unmarried women have
consistently high mortality risk regardless of presence of older sisters, though having 2+
is associated with the highest risk (RR=2.45). Men in any marital status who have 2 or
more older sisters have lower relative mortality risk, significant for the married and
widowed (RR=.24 and RR=.06, respectively).
The interaction between RP‘s marital status and number of older brothers alive at
RP‘s age 50 is displayed in Table 5.
Table 5: Relative risks of mortality by RP marital status and number of older
brothers alive and living in Antwerp at RP age 50, n=506
Men Women
Number of older brothers alive Number of older brothers alive
0 1 2+ 0 1 2+
RP's Civil status HR SE HR SE HR SE HR SE HR SE HR SE
Unmarried 1.01 [.51] 1.72 [1.1] 2.70 [3.0] 0.86 [.52] 2.29 [1.7] 7.67+ [9.4]
Married 0.72 [.26] 1 (ref) 4.08* [2.5] 0.38* [.16] 1 (ref) 0.96 [.68]
Widowed 0.89 [.45] 0.52 [.45] – 0.41+ [.20] 2.20 [1.3] 0.63 [.70]
Unknown 2.19+ [1.0] 1.95 [1.3] 1.32 [1.5] 0.18** [.10] 0.33
+ [.20] 0.82 [.94]
Standardized for age, mother’s age at birth, birth order, birth cohort, disease exposure, father's occupation, number of younger
brothers (at age 50), number of younger sisters (at age 50), number of older sisters (at age 50), number of children, and
occupation.
Notes: Hazard ratios and standard errors are displayed.
+ p < 0.10, * p < 0.05, ** p < 0.01, *** p < 0.001
Demographic Research: Volume 31, Article 38
http://www.demographic-research.org 1189
Across all marital statuses for women, having 0 older brothers alive residing in
Antwerp relates to lower mortality risk, with approximately a significant 0.4 times
lower mortality risk for both the married and widowed. Having 2+ older brothers varied
across marital statuses; there was minimal effect on married women (RR=.96), more
than a significant 7 times the risk for unmarried women (RR=7.67), and 0.6 times the
risk for the widowed (RR=.63). Having 2+ older brothers for men related to more than
2.5 times the risk for the unmarried (RR=2.70) and a significant 4 times the risk for
married (RR=4.08), compared to the reference category.
5.2.3 Part II: Discussion
Part II of our analysis focused on the impact of sibling composition in later life on
mortality past age 50. We believed that the presence of siblings in later life could lead
to better insights into the relationship between sibships and longevity, as siblings may
become close again in advancing ages. For our third hypothesis (H3), we expected that
having younger siblings would be beneficial to RP‘s survival chances. We did find that
having younger sisters, particularly 1, is beneficial to RP‘s survival. However, it
becomes clear in the interaction between RP sex and number of younger sisters that this
effect is not the same for both RP sexes; rather, it is very strong and positive for female
RPs‘ survival, but not for male RPs‘. If we believed that having younger siblings would
be positive, having older siblings in later life would indicate the opposite effect. In fact,
we do find that having older brothers (but not older sisters) in later life relates to very
high excess mortality risk, for both male and female RPs. Overall our results suggest
that both the sex of the sibling(s) and the sex of the RP matter, as having any number of
sisters (both older and younger) in later life is mostly beneficial to RP‘s longevity,
having any number of brothers elevates or has minimal effect on RP‘s mortality risk,
and results often vary by RP sex.
6. Conclusions
Our findings suggest that sibling competition does not end in childhood, but rather that
sibling competition carries on into later adulthood and has a strong relationship with
mortality risk in advancing ages. Competition for sibling resources (financial,
relationships, caretaking, etc.) may replace that of competition for parental resources
occurring in early life. The complexity between sibling and gender dynamics in a life
course perspective is also highlighted. In particular, we found that having any number
of older brothers is a strong disadvantage for an individual, regardless of the sex of the
Donrovich, Puschmann & Matthijs: Rivalry, solidarity, and longevity among siblings
1190 http://www.demographic-research.org
RP. This could suggest long-term effects of limited resources during developmental
years, the ‗burden‘ of caring for a dependent sibling later in life, or some combination
of the two. We also found that certain social groups were even more affected by sibling
composition than others. The interactions in Tables 4 and 5 (between sibling
compositions and RP‘s marital status) could help explain why having older siblings had
such a strong relationship with mortality risk. Unmarried women, for example, were
severely disadvantaged by having any number of older brothers, and men were also to a
somewhat lesser degree. Additionally, regardless of marital status, women who had no
older brothers in Antwerp in later life were almost always consistently better off.
However, the widowed represented a unique social group. Becoming widowed, in both
contemporary as well as historical times, is a very stressful, life-changing event that
could have profound, negative impact on health and longevity. Widows, in particular,
often faced very harsh circumstances after spousal death, leading to poorer economic
conditions and long-term effects on their health (Lillard and Waite 1995), particularly
for those with younger children (Alter, Dribe, and Van Poppel 2007). Our study
suggests that solidarity replaces competition among siblings when one becomes
widowed, as the only time it was greatly beneficial for a woman‘s longevity to have any
older siblings was in the case of widowhood, wherein having 2+ older brothers was
related to greatly reduced mortality risk (.63 times the risk) though this finding was not
significant. This finding was also mirrored for widowed men, to a far greater degree,
who had greatly reduced mortality risk when having 2+ older sisters (a significant .06
times the risk). We see that risk is completely mitigated in this vulnerable social group,
and even has positive effects on the widowed RP‘s longevity. This is interesting for
several reasons. The first is that this is found for mixed-sex siblings, as same-sex
siblings tend to have the strongest relationships, particularly for sister-sister pairings
(Cicirelli 1994). It is also interesting that having many older siblings is beneficial when
one is widowed, but certainly not when he or she is unmarried (both vulnerable social
groups compared to the married). We believe this may suggest the inclination to protect
a sibling in times of grief, but not when they were unmarried due to the inability to find
a marriage partner. Widowhood represents a change in the status quo (from marriage to
widowhood) while never marrying is simply a long-term unchanging status. It also
suggests that being society‘s outcasts, and accordingly, undesirable on the marriage
market, led to a harder life and very high excess mortality, which was particularly
detrimental to unmarried women. It may also relate to the idea that singles (especially
sisters) would be expected to care for their older or elderly siblings, since they did not
have a family of their own and it would be practical for single women to assume this
responsibility. The negative impact on singles could be twofold: an increased risk due
to the stress of caretaking responsibility and also the negative effect of not having a
partner. Being single was a burden in its own right, since there was no one to take care
Demographic Research: Volume 31, Article 38
http://www.demographic-research.org 1191
of you or with whom to share caretaking responsibilities. We suspect this may have
become burdensome, leading to increased mortality risk. We believe, in turn, that men
were also negatively affected by having many older siblings, but perhaps this was due
more to an increased competition for the support of their sister(s), since older siblings
may have taken up most of the time and attention of these sister caretakers. Another
issue could relate to the financial implications of supporting additional family members,
since the welfare system was only in its initial phase of construction until the very end
of the study period (Lamberts 2006).
In relation to life course studies on health, we find no direct evidence of a critical
period effect during development (using our two proxies for health), as there was no
negative effect from disease exposure in early life (actually a strong, positive effect)
and no strong relationship to maternal age at birth. The positive effect of being born
during the time of an epidemic could be explained in that these individuals were healthy
enough to survive the epidemic. This could suggest that the exposure to epidemics
during critical times did not leave them more susceptible in the long run, but rather,
perhaps, strengthened their immune system, leading to lower mortality in later
adulthood. There was some evidence of an accumulation of risks during the life course,
in terms of sibling composition, as overall, the negative effects on longevity of having
older brothers, and a higher birth order, carries on into late adulthood. We do, however,
find some evidence of a critical period in later life, as having many older siblings
present in later life relates to a much lower mortality risk for the widowed.
7. Acknowledgements
We would like to thank Hilde Bras, Isabelle Devos, Angelique Janssens, Jan Kok, Ward
Neyrinck, Jan Van Bavel, and Mattijs Vandezande for their comments on an earlier
version of this manuscript. We also greatly appreciate the valuable feedback that we
received from the Editor and three anonymous reviewers.
Donrovich, Puschmann & Matthijs: Rivalry, solidarity, and longevity among siblings
1192 http://www.demographic-research.org
References
Alter, G., Dribe, M., and Van Poppel, F. (2007). Widowhood, family size, and post-
reproductive mortality: a comparative analysis of three populations in
nineteenth-century Europe. Demography 44(4): 785–806. doi:10.1353/dem.
2007.0037.
Alter, G. and Oris, M. (2005). Childhood conditions, migration, and mortality: Migrants
and natives in 19th-century cities. Biodemography and Social Biology 52(3–4):
178–191. doi:10.1080/19485565.2005.9989108.
Barker, D.J.P. (1994). Mothers, babies and health in later life. Edinburgh, UK:
Churchill Livingston.
Belmont, L. and Marolla, F.A. (1973). Birth order, family size, and intelligence.
Science 182(4117): 1096–1101. doi:10.1126/science.182.4117.1096.
Bengtsson, T. and Lindström, M. (2000). Childhood misery and disease in later life:
The effects on mortality in old age of hazards experienced in early life, southern
Sweden, 1760–1894. Population Studies 54(3): 263–277. doi:10.1080/71377
9096.
Bengtsson, T. and Lindström, M. (2003). Airborne infectious diseases during infancy
and mortality in later life in southern Sweden, 1766–1894. International Journal
of Epidemiology 32(2): 286–294. doi:10.1093/ije/dyg061.
Bengtsson, T. and Mineau, G.P. (2009). Early-life effects on socio-economic
performance and mortality in later life: A full life-course approach using
contemporary and historical sources. Social Science & Medicine 68(9): 1561–
1564. doi:10.1016/j.socscimed.2009.02.012.
Ben-Shlomo, Y. and Kuh, D. (2002). A life course approach to chronic disease
epidemiology: Conceptual models, empirical challenges and interdisciplinary
perspectives. International Journal of Epidemiology 31(2): 285–293.
doi:10.1093/ije/31.2.285.
Blake, J. (1981). Family size and quality of children. Demography 18(4): 421–442.
doi:10.2307/2060941.
Blake, J. (1987). Differential parental investment: Its effects on child quality and status
attainment. In: Lancaster, J.B., Altmann, J., Rossi, A.S., and Sherrod, L.R.
(eds.). Parenting across the life span. New York: Aldine de Gruyter: 351–375.
Demographic Research: Volume 31, Article 38
http://www.demographic-research.org 1193
Bras, H. (2011). Intensification of family relations? Changes in the choice of marriage
witnesses in the Netherlands, 1830–1950. Tijdschrift voor Sociale en
Economische Geschiedenis 8(4): 102–135.
Cicirelli, V.G. (1994). Sibling relationships in cross-cultural perspective. Journal of
Marriage and the Family 56(1): 7–20. doi:10.2307/352697.
Cleves, M., Gould, W., Gutierrez, R., and Marchenko, Y. (2008). An introduction to
survival analysis using Stata. 2nd ed. College Station, TX: Stata Press.
Coall, D.A., Meier, M., Hertwig, R., Wanke, M., and Hopflinger, F. (2009)
Grandparental investment: The influence of reproductive timing and family size.
American Journal of Human Biology 21(4): 455–63. doi:10.1002/ajhb.20894.
Coontz, S. (2005). Marriage, a history: How love conquered marriage. New York:
Penguin Books.
Cumming, E. and Schneider, D. (1961). Sibling solidarity: A property of American
kinship. American Anthropologist 63(3): 498–507. doi:10.1525/aa.1961.63.3.
02a00030.
Devos, I. (2000). Te jong om te sterven. De levenskansen van meisjes in België
omstreeks 1900. Tijdschrift voor Geschiedenis 1: 55–75.
Eggerickx, T. and Tabutin, D. (1994). La surmortalité des filles vers 1890 en Belgique:
Une approche régionale. Population 49(3): 657–684. doi:10.2307/1533962.
Elo, I.T. and Preston, S.H. (1996). Educational differentials in mortality: United States,
1979–85. Social Science & Medicine 42(1): 47–57. doi10.1016/0277-9536(95)
00062-3.
Forsdahl, A. (1978). Living conditions in childhood and subsequent development of
risk factors for arteriosclerotic heart disease. The cardiovascular survey in
Finnmark 1974-75. Journal of Epidemiology and Community Health 32(1): 34–
37. doi:10.1136/jech.32.1.34.
Gillis, J. (1996). Making time for the family: The invention of family time(s) and the
reinvention of family history. Journal of Family History 21(1): 4–Y 21.
doi:10.1177/036319909602100102.
Hanushek, E.A. (1992). The trade-off between child quantity and quality. Journal of
Political Economy 100(1): 84–117. doi:10.1086/261808.
Donrovich, Puschmann & Matthijs: Rivalry, solidarity, and longevity among siblings
1194 http://www.demographic-research.org
Hauser, R.M. and Sewell, W. (1986). Family effects in a simple model of education,
occupation status, and earnings: findings from Wisconsin and Kalamazoo
studies. Journal of Labor Economics 4(3): S83–S120. doi:10.1086/298122.
Hayward, M.D. and Gorman, B.K. (2004). The long arm of childhood: the influence of
early-life social conditions on men‘s mortality. Demography 41(1): 87–107.
doi:10.1353/dem.2004.0005.
Hertwig, R., Davis, J.N., and Sulloway, F.J. (2002). Parental investment: How an equity
motive can produce inequality. Psychological Bulletin 128(5): 728–745.
doi:10.1037/0033-2909.128.5.728.
Hill, M. and O‘Neill, J. (1994). Family endowments and the achievement of young
children with special reference to the underclass. The Journal of Human
Resources 29(4): 1064–1100. doi:10.2307/146134.
House, J.S., Landis, K.R., and Umberson, D. (1988). Social relationships and health.
Science 241(4865): 540–545. doi:10.1126/science.3399889.
Humphries, J. (1991). ‗Bread and a pennyworth of treacle‘: excess female mortality in
England in the 1840s. Cambridge Journal of Economics 15(4): 451–473.
Kemkes-Grottenthaler, A. (2004). Parental effects on offspring longevity—evidence
from 17th to 19th century reproductive histories. Annals of Human Biology
31(2): 139–158. doi:10.1080/03014460410001663407.
Kennedy, R.E. (1973). The Irish: emigration, marriage, and fertility. Berkeley, CA:
University of California Press.
Klasen, S. (1998). Marriage, bargaining, and intrahousehold resource allocation: Excess
female mortality among adults during early German development, 1740–1860.
Journal of Economic History 58(2): 432–67. doi:10.1017/S002205070002057X.
Kruithof, J. (1964). De demografische ontwikkeling in de XIXde eeuw. In:
Genootschap voor Antwerpse Geschiedenis (ed.). Bouwstoffen voor de
geschiedenis van Antwerpen in de XIXde eeuw. Antwerpen: Algemene
Drukkerijen LLoyd Anversois: 508–543.
Kuh, D. and Ben-Shlomo, Y. (1997). A life course approach to chronic disease
epidemiology. Oxford: Oxford University Press.
Lamberts, E. (2006). Belgium since 1830. In: Blom, J. and Lamberts, E. (eds.). History
of the Low Countries. Oxford: Berghahn: 319–392.
Demographic Research: Volume 31, Article 38
http://www.demographic-research.org 1195
Lee, C. (1997). Socioeconomic background, disease, and mortality among Union Army
recruits: Implications for economic and demographic history. Explorations in
Economic History 34(1): 27–55. doi:10.1006/exeh.1996.0661.
Lillard, L. and Waite, L. (1995). ‘Till death do us part: Marital disruption and mortality.
American Journal of Sociology 100(5): 1131–1156. doi:10.1086/230634.
Lloyd, C.B. and Gage-Brandon, A.J. (1994). High fertility and children‘s schooling in
Ghana: Sex differences in parental contributions and educational outcomes.
Population Studies 48(2): 293–306. doi:10.1080/0032472031000147806.
Lundberg, O. (1993). The impact of childhood living conditions on illness and mortality
in adulthood. Social Science & Medicine 36(8): 1047–1052. doi:10.1016/0277-
9536(93)90122-K.
Marks, G.N. (2006). Family size, family type and student achievement: Crossnational
differences and the role of socioeconomic and school factors. Journal of
Comparative Family Studies 37: 1–24.
Matthijs, K. (2002). Mimetic appetite for marriage in nineteenth-century Flanders:
Gender disadvantage as an incentive for social change. Journal of Family
History: Studies in Family, Kinship and Demography 27(2): 101–127.
doi:10.1177/036319900202700203.
Matthijs, K. (2003). Demographic and sociological indicators of privatisation of
marriage in the 19th century in Flanders. European Journal of Population 19(4):
375–412. doi:10.1023/A:1026361006200.
Matthijs, K. (2006). Changing patterns of familial sociability: Family members as
witnesses to (re)marriage in nineteenth-century Flanders. Journal of Family
History: Studies in Family, Kinship and Demography 31(2): 115–143.
doi:10.1177/0363199005284871.
Matthijs, K. and Moreels, S. (2010). The Antwerp COR*-database: A unique Flemish
source for historical-demographic research. The History of the Family 15(1):
109–115. doi:10.1016/j.hisfam.2010.01.002.
Preston, S.H., Hill, M.E., and Drevenstedt, G.L. (1998). Childhood conditions that
predict survival to advanced ages among African–Americans. Social Science &
Medicine 47(9): 1231–1246. doi:10.1016/S0277-9536(98)00180-4.
Quaranta, L. (2013). Scarred for Life. How conditions in early life affect socioeconomic
status, reproduction and mortality in Southern Sweden, 1813–1968. [Ph.D.
Thesis]. Lund: Lund University.
Donrovich, Puschmann & Matthijs: Rivalry, solidarity, and longevity among siblings
1196 http://www.demographic-research.org
Rosenzweig, M.R. and Wolpin, K.I. (1980). Testing the quantity-quality fertility model:
the use of twins as a natural experiment. Econometrica 48(1): 227–240.
doi:10.2307/1912026.
Sanders, V. (2002). The brother-sister culture in nineteenth century literature. From
Austen to Woolf. Basingstoke and New York: Palgrave.
Smith, K.R., Gagnon, A., Cawthon, R.M., Mineau, G.P., Mazan, R., and Desjardins, B.
(2009). Familial aggregation of survival and late female reproduction. Journal of
Gerontology: Biological Sciences 64A(7): 740–744. doi:10.1093/gerona/glp055.
Sulloway, F.J. (1996). Born to rebel: Birth order, family dynamics, and revolutionary
genius. New York: Pantheon.
Sulloway, F.J. (2001). Birth order, sibling competition, and human behavior. In:
Holcomb, H.R. (ed.) Conceptual Challenges in Evolutionary Psychology:
Innovative Research Strategies. Dordrecht and Boston: Kluwer Academic
Publishers: 39–83.
Van Bavel, J. (2006) The effect of fertility limitation on intergenerational social
mobility: The quality-quantity trade-off during the demographic transition.
Journal of Biosocial Science 38(4): 553–69. doi:10.1017/S0021932005026994.
Van de Putte, B. and Matthijs, K. (2001). Romantic love and marriage: A study of age
homogamy in 19th century Leuven (Belgium). Belgisch tijdschrift voor nieuwste
geschiedenis-revue belge d histoire contemporaine 31(3–4): 579–619.
https://biblio.ugent.be/publication/443657/file/1038487.pdf.
Van Leeuwen, M.H. and Maas, I. (2005). A short note on HISCLASS. History of Work
Information System. Amsterdam: International Institute of Social History.
http://historyofwork.iisg.nl/docs/hisclass-brief.doc.
Van Poppel, F. (2000). Long-term trends in relative health differences between men and
women. European Journal of Obstetrics, Gynecology, and Reproductive biology
93(2): 119–122. doi:10.1016/S0301-2115(00)00277-3.
Wolf, M. (1982). The word-retrieval process and reading in children and aphasics. In:
Nelson, K. (ed.). Children’s language (Vol. III). Hillsdale, NJ: Erlbaum.
Demographic Research: Volume 31, Article 38
http://www.demographic-research.org 1197
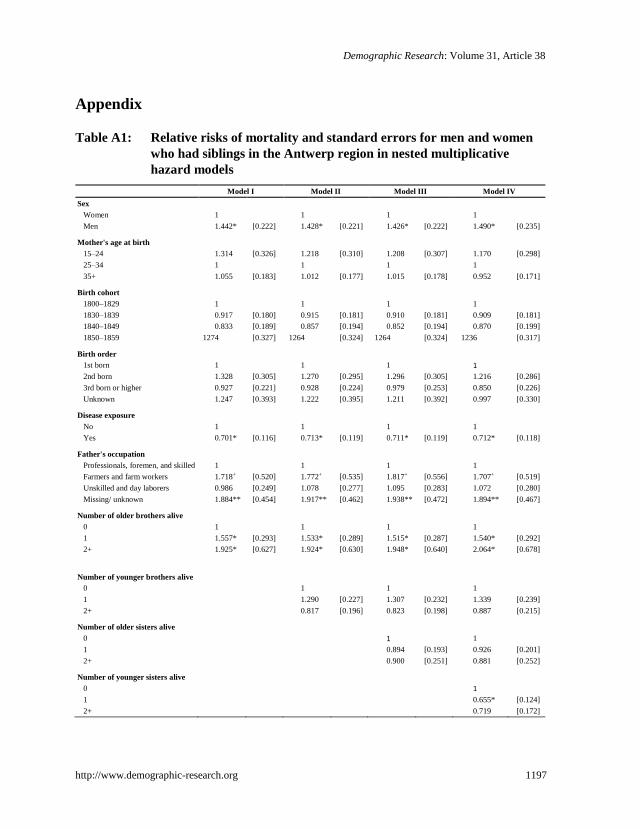
Appendix
Table A1: Relative risks of mortality and standard errors for men and women
who had siblings in the Antwerp region in nested multiplicative
hazard models
Model I Model II Model III Model IV
Sex
Women 1 1 1 1
Men 1.442* [0.222] 1.428* [0.221] 1.426* [0.222] 1.490* [0.235]
Mother's age at birth
15–24 1.314 [0.326] 1.218 [0.310] 1.208 [0.307] 1.170 [0.298]
25–34 1 1 1 1
35+ 1.055 [0.183] 1.012 [0.177] 1.015 [0.178] 0.952 [0.171]
Birth cohort
1800–1829 1 1 1 1
1830–1839 0.917 [0.180] 0.915 [0.181] 0.910 [0.181] 0.909 [0.181]
1840–1849 0.833 [0.189] 0.857 [0.194] 0.852 [0.194] 0.870 [0.199]
1850–1859 1274 [0.327] 1264 [0.324] 1264 [0.324] 1236 [0.317]
Birth order
1st born 1 1 1 1
2nd born 1.328 [0.305] 1.270 [0.295] 1.296 [0.305] 1.216 [0.286]
3rd born or higher 0.927 [0.221] 0.928 [0.224] 0.979 [0.253] 0.850 [0.226]
Unknown 1.247 [0.393] 1.222 [0.395] 1.211 [0.392] 0.997 [0.330]
Disease exposure
No 1 1 1 1
Yes 0.701* [0.116] 0.713* [0.119] 0.711* [0.119] 0.712* [0.118]
Father's occupation
Professionals, foremen, and skilled 1 1 1 1
Farmers and farm workers 1.718+ [0.520] 1.772+ [0.535] 1.817+ [0.556] 1.707+ [0.519]
Unskilled and day laborers 0.986 [0.249] 1.078 [0.277] 1.095 [0.283] 1.072 [0.280]
Missing/ unknown 1.884** [0.454] 1.917** [0.462] 1.938** [0.472] 1.894** [0.467]
Number of older brothers alive
0 1 1 1 1
1 1.557* [0.293] 1.533* [0.289] 1.515* [0.287] 1.540* [0.292]
2+ 1.925* [0.627] 1.924* [0.630] 1.948* [0.640] 2.064* [0.678]
Number of younger brothers alive
0 1 1 1
1 1.290 [0.227] 1.307 [0.232] 1.339 [0.239]
2+ 0.817 [0.196] 0.823 [0.198] 0.887 [0.215]
Number of older sisters alive
0 1 1
1 0.894 [0.193] 0.926 [0.201]
2+ 0.900 [0.251] 0.881 [0.252]
Number of younger sisters alive
0 1
1 0.655* [0.124]
2+ 0.719 [0.172]
Donrovich, Puschmann & Matthijs: Rivalry, solidarity, and longevity among siblings
1198 http://www.demographic-research.org
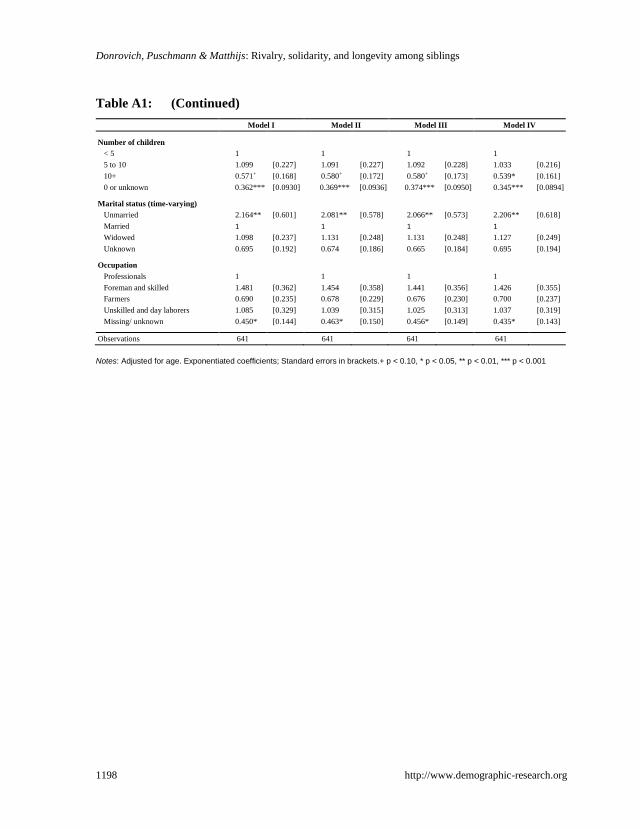
Table A1: (Continued)
Model I Model II Model III Model IV
Number of children
< 5 1 1 1 1
5 to 10 1.099 [0.227] 1.091 [0.227] 1.092 [0.228] 1.033 [0.216]
10+ 0.571+ [0.168] 0.580+ [0.172] 0.580+ [0.173] 0.539* [0.161]
0 or unknown 0.362*** [0.0930] 0.369*** [0.0936] 0.374*** [0.0950] 0.345*** [0.0894]
Marital status (time-varying)
Unmarried 2.164** [0.601] 2.081** [0.578] 2.066** [0.573] 2.206** [0.618]
Married 1 1 1 1
Widowed 1.098 [0.237] 1.131 [0.248] 1.131 [0.248] 1.127 [0.249]
Unknown 0.695 [0.192] 0.674 [0.186] 0.665 [0.184] 0.695 [0.194]
Occupation
Professionals 1 1 1 1
Foreman and skilled 1.481 [0.362] 1.454 [0.358] 1.441 [0.356] 1.426 [0.355]
Farmers 0.690 [0.235] 0.678 [0.229] 0.676 [0.230] 0.700 [0.237]
Unskilled and day laborers 1.085 [0.329] 1.039 [0.315] 1.025 [0.313] 1.037 [0.319]
Missing/ unknown 0.450* [0.144] 0.463* [0.150] 0.456* [0.149] 0.435* [0.143]
Observations 641
641
641
641
Notes: Adjusted for age. Exponentiated coefficients; Standard errors in brackets.+ p < 0.10, * p < 0.05, ** p < 0.01, *** p < 0.001