risks and returns of cryptocurrency - yale university · risks and returns of cryptocurrency yukun...
TRANSCRIPT

Risks and Returns of Cryptocurrency
Yukun Liu and Aleh Tsyvinski∗
July 25, 2018
Abstract
We establish that the risk-return tradeoff of cryptocurrencies (Bitcoin, Ripple, and Ethereum) isdistinct from those of stocks, currencies, and precious metals. Cryptocurrencies have no exposure tomost common stock market and macroeconomic factors. They also have no exposure to the returns ofcurrencies and commodities. In contrast, we show that the cryptocurrency returns can be predicted byfactors which are specific to cryptocurrency markets. Specifically, we determine that there is a strongtime-series momentum effect and that proxies for investor attention strongly forecast cryptocurrencyreturns. Finally, we create an index of exposures to cryptocurrencies of 354 industries in the US and 137industries in China.
∗Yale University. We thank Andrew Atkeson, Nicola Borri, Eduardo Davila, Stefano Giglio, William Goetzmann, StephenRoach, and Robert Shiller for their comments.
1
1 Introduction
Cryptocurrency is a recent phenomenon that is receiving significant attention. On the one hand it is basedon a fundamentally new technology, the potential of which is not fully understood. On the other hand, at leastin the current form, it fullfils similar functions as other, more traditional assets. Is cryptocurrency a form ofa currency, a commodity, a stake in a technology breakthrough, or a completely different instrument? Cancryptocurrency be priced by the factors available for other asset classes? Which industries may be affectedby the development of blockchain technology?
One way to understand what cryptocurrencies represent is to investigate whether their returns behavesimilarly to other asset classes. In other words, we assess how investors and markets value current and futureprospects of cryptocurrencies. We use standard tools of empirical asset pricing to comprehensively analyzecryptocurrency risks and returns. Specifically, we study whether major cryptocurrencies comove with stocks,currencies, commodities, macroeconomic factors, and the cryptocurrency market specific factors. Our mainconclusion is that only cryptocurrency market specific factors – momentum and the proxies for investorattention – consistently explain the variations of cryptocurrency returns. This suggests, in contrast topopular explanations, that markets do not view cryptocurrencies similarly to standard asset classes.
We focus on three of the five major cryptocurrencies – Bitcoin, Ripple, and Ethereum1 – and start bydocumenting the characteristics of cryptocurrency returns. We observe that the mean and the standarddeviation of returns are an order of magnitude higher than those for the traditional asset classes. Forexample, the weekly mean return on Bitcoin is 3.79 percent with a standard deviation of 16.64 percent. TheSharpe ratios at the daily and weekly levels are about 50 percent and 75 percent higher, and at the monthlylevel are comparable to those of stocks. The returns have positive skewness increasing with the frequenciesfrom daily to monthly. The returns experience high probabilities of “disasters” and “miracles”. For example,a “disaster” of the daily 20 percent negative return on Bitcoin happens with the probability of 0.5 percentwhile a “miracle” of the same size happens with the probability of almost 1 percent.
We first investigate whether the cryptocurrency market behaves similarly to the stock market. We testthis by studying whether the returns on the cryptocurrency market are compensated by the risk factorsderived from the stock market. We show that the CAPM betas are sizable but the alphas remain largeand statistically significant. The exposures to other common risk factors in the stock market are verysmall. Specifically, the exposures to Fama French five risk factors are low and not statistically significant.Compared to Bitcoin, Ripple and Ethereum have higher unconditional alphas, a smaller CAPM beta, and astrong exposure to the HML factor. We also explore 155 other factors documented in the finance literatureand find no discernible patterns of loadings.
Second, we study the exposure of cryptocurrency returns to major currencies (Australian Dollar, Cana-dian Dollar, Euro, Singaporean Dollar, and UK Pound). This aims to test a popular view that cryptocurrencymay serve as another medium of exchange. Although these major currenices strongly comove, we find thatthe exposures of all cryptocurrencies to these currencies are small and not statistically significant.
Third, we study the exposure of cryptocurrency returns to precious metals commodities (gold, platinum,and silver). This aims to test a popular narrative that cryptocurrency may serve as an alternative to preciousmetals as a store of value. With the exception of the exposure of Ethereum to gold, the exposures of allother cryptocurrencies to these commodities are not statistically significant.
Fourth, we study the exposure of cryptocurrency returns to macroeconomic factors. For Bitcoin and
1The other two largest cryptocurrencies by market capitalization are BitcoinCash and Litecoin which are derived from, andthus behave similarly to, Bitcoin.
2

Ripple, the exposures to common macroeconomic factors (the non-durable consumption growth, durableconsumption growth, industrial production growth, and personal income growth) are low and not statisticallysignificant, while for Ethereum there is some loading on the durable consumption growth factor.
Summarizing, we established that the risk-return tradeoff of cryptocurrencies is distinct from those ofstocks, currencies and precious metals. Hence, there is little evidence, in the view of the markets, behindthe popular narratives that there are similarities between cryptocurrencies and these traditional assets.
We now turn to cryptocurrency specific factors. We formulate and investigate potential predictors forcryptocurrency returns that mirror those of traditional asset classes. Specifically, we construct cryptocur-rency momentum, proxies for average and negative investor attention, a proxy for price-to-“dividend” ratio,2
realized volatility, and proxies for the supply conditions.First, we show that there is significant time-series cryptocurrency momentum at the daily and weekly
frequencies for all three cryptocurrencies. For example, a one-standard-deviation increase in the current day’sBitcoin return predicts a 0.33 percent increase in the daily return over the next day. Grouping weekly returnsby quintiles, we find that the top quintiles outperform the bottom quintiles over the 1-4 week horizons. Forexample, at the 1-week horizon, the average return of the top quintile is 11.22 percent per week with theSharpe ratio of 0.45 while the average return of the bottom quintile is 2.60 percent per week with the Sharperatio of 0.19. However, for Ethereum, the momentum effect is less significant than for Bitcoin and Ripple.
Second, we construct proxies for investor attention and show that high investor attention predicts highfuture returns over 1-2 week horizons for Bitcoin, a 1-week horizon for Ripple, and 1-, 3-, and 6-week horizonsfor Ethereum. For example, a one-standard-deviation increase in the Google search for the word “Bitcoin”yields a 2.3 percent increase in the 2-week ahead Bitcoin returns. At the 1-week horizon, the average returnof the top quintile is 11.20 percent per week with the Sharpe ratio of 0.48 while the average return of thebottom quintile is 1.07 percent per week with the Sharpe ratio of 0.08. Another proxy for investor attentionwe construct is Twitter post counts. A one-standard-deviation increase in the Twitter post count for theword “Bitcoin” yields a 2.50 percent increase in the 1-week ahead Bitcoin returns. Finally, we construct aproxy for negative investor attention and show that relatively high negative investor attention negativelypredicts future Bitcoin returns. We construct a ratio between Google searches for the phrase “Bitcoin hack”and searches for the word “Bitcoin,” and show that a one-standard-devation increase of the ratio leads to a2.75 percent decrease in Bitcoin returns the following week.
Third, we construct a proxy for the the price-to-“dividend” ratios for Bitcoin and find that it has nopredictive power. Realized volatility also does not predict returns of Bitcoin and Ethereum but predictsRipple returns at 4-, 5-, and 7-day ahead frequencies.
Finally, we construct proxies for the cost of mining to capture the supply factors, and find that thosehave low loadings for Bitcoin and Ripple. For Ethereum, there is some evidence that returns are exposedto the stock returns of Advanced Micro Devices, Inc. (AMD), one of the main manufacturers of specializedmining hardware.
Our main conclusion is that indeed cryptocurrency represents an asset class that can be assessed usingsimple finance tools. At the same time, cryptocurrencies comprise an asset class which is radically differentfrom traditional asset classes.
Our last group of results determines the exposures of various industries to cryptocurrencies. Theseresults indicate which industries may benefit or may be disrupted by the blockchain technology. We startwith 30 Fama French industries and find that Consumer Goods and Healthcare have significant and positive
2We use Bitcoin Wallet user count to measure the fundamental value of Bitcoin or “dividend.”
3

exposures to Bitcoin returns and that Fabricated Products and Metal Mining industries have significant andnegative exposures to Bitcoin returns. Finance, Retail, and Wholesale industries have no exposure. We thenestimate the exposures of 354 U.S. SIC 3-digit industries’ on cryptocurrency returns and 137 Chinese CICindustries exposures on Bitcoin returns, controlling for the excess market returns, and create an index ofindustry exposures.
We now briefly discuss the relationship to the literature. Our paper uses standard textbook empiricalasset pricing tools and methods, the discussion of which we mostly omit for conciseness. Our findings onmomentum are related to a series of papers such as Jegadeesh and Titman (1993), Moskowitz and Grinblatt(1999). Moskowitz, Ooi, and Pedersen (2012), and Asness, Moskowitz, and Pedersen (2013). Da, Engelberg,and Gao (2011) uses Google searches to proxy for investor attention. Yermack (2015) is one of the first papersthat brought academic attention to the field of cryptocurrency. Several recent papers (e.g., Stoffels, 2017,Borri, 2018, Borri and Shakhnov, 2018, Foley, Karlsen, and Putninš (2018), and Hu, Parlour, and Rajan,2018) document individual facts related to cryptocurrency investment. A number of recent papers developmodels of cryptocurrencies (see, e.g., Weber (2016), Huberman, Leshno, and Moallemi (2017), Biais et al.(2018), Chiu and Koeppl (2017), Cong and He, 2018, Cong, Li, and Wang, 2018, Cong, He, and Li, 2018,Sockin and Xiong, 2018, Saleh, 2018, Schilling and Uhlig, 2018, Abadi and Brunnermeier (2018), Routledgeand Zetlin-Jones (2018), and Makarov and Schoar (2018)).
2 Data and Basic Characteristics
Cryptocurrency price data series are from the CoinDesk website. For Bitcoin, we use data from 01/01/2011to 05/31/2018 because there was not much liquidity and trading in earlier years. The data series for Rip-ple ranges from 08/04/2013 to 05/31/2018, and the data series for Ethereum ranges from 08/07/2015 to05/31/2018. We construct cryptocurrency return data using the corresponding price data. Google searchdata series are downloaded from Google. Twitter post counts for the word “Bitcoin” are downloaded fromCrimson Hexagon.3 The data series for the number of Bitcoin Wallet users is from blockchain.info. The Bit-coin price-to-“dividend” ratio is constructed from the ratio between Bitcoin price and the number of Bitcoinwallet users. The cryptocurrency realized volatility is measured as the sum of daily squared log returns fromthe previous month.
The spot exchange rates in units of US dollar per foreign currency are from the Federal Reserve Bank ofSt. Louis. We focus on five major currencies: Australian Dollar, Canadian Dollar, Euro, Singaporean Dollar,and UK Pound. The spot price of precious metals are from several sources. The gold and silver prices arefrom the London Bullion Market Association (LBMA). Platinum prices are from the London Platinum andPalladium Market (LPPM).
Aggregate and individual stock return data is from CRSP. Detailed SIC 3-digit industry return data seriesare constructed using individual stock returns. Chinese stock return data is from CSMAR. We construct thevalue-weighted aggregate Chinese stock returns and detailed CIC (China Industry Classification) industryreturn data series from the individual stocks. The data series of Chinese stock returns lasts until 2016/12.
Corporate bond return data series is constructed by Asvanunt and Richardson (2016) and is available ontheir website.4 For the housing market, we use the Case-Shiller housing index from Robert Shiller’s website.The return series of the 155 anomalies are downloaded from Andrew Chen’s website.5
3We thank William Goetzmann for kindly sharing the Twitter post count data with us.4https://www.aqr.com/Insights/Datasets/Credit-Risk-Premium-Preliminary-Paper-Data. The data series ends at 2014/12.5One of the 156 anomalies does not exist during the sample period. The database ends at 2016/12.
4

We obtain the Fama French 3-factor, Carhart 4-factor, Fama French 5-factor, and Fama French 6-factormodels dataseries from Kenneth French’s website. We also obtain the return series of Fama French 30industries, Europe, Japan, AsiaExJapan, and North America from Kenneth French’s website.
The macroeconomic data series are from the website of the Federal Reserve Bank of St. Louis. Non-durable consumption is defined as the sum of personal consumption expenditures: non-durable goods, andpersonal consumption expenditures: services.
Stock market prices, dividends, and earnings, as well as the three-month Treasury bill rates, are fromRobert Shiller’s website. Using these data series, we construct the stock market price-to-dividend ratio (pd),price-to-earning ratio (pe), and the relative bill rate (tbill). The relative bill rate is defined as the three-month Treasury bill rate minus its twelve-month backward moving average. Credit spread (credit) is definedas the yield spread between BAA corporate bonds and AAA corporate bonds. Term spread (term) is definedas the yield spread between the 10-year treasury and 3-month treasury. Data series on the BAA corporateyield, AAA corporate yield, 10-year treasury yield, and 3-month treasury yield are from the Federal ReserveBank of St. Louis’ website.
We now document main statistical properties of the time series for the returns of Bitcoin, Ripple, andEthereum. Figure 1 plots the price movements for each of the three cryptocurrencies.
Figure 1: Price Movements
(a) Bitcoin (b) Ripple (c) Ethereum
Figure 2: Bitcoin Return Distributions
5

Figure 3: Ripple Return Distributions
Figure 4: Ethereum Return Distributions
Table 1 and Figure 2 show the statistics of Bitcoin at the daily, weekly, and monthly frequencies comparedto those of stocks, corporate bonds, and housing. Both the returns and their volatility are very high. At thedaily frequency, the mean return is 0.52 percent and the standard deviation is 5.55 percent; at the weeklyfrequency, the mean return is 3.79 percent and the standard deviation is 16.64 percent; at the monthlyfrequency, the mean return is 21.60 percent and the standard deviation is 69.46 percent. Both the meansand the standard deviations are an order of magnitude higher than those for traditional asset classes. Thesefacts are broadly known.
The Sharpe ratios of bitcoin returns are 0.09 at the daily frequency, 0.23 at the weekly frequency, and0.31 at the monthly frequency. At the monthly frequency, the Sharpe ratios are similar to those of stocksfor the comparable time period, although higher than the historical Sharpe ratios for stocks. At the dailyand weekly frequencies, the Sharpe ratios are about 50 percent and 75 percent higher than those of stocksfor the comparable time period.
In Tables 2, and 3 and Figures 3 and 4, we document the main characteristics of the Ripple and Ethereum
6

returns. Note that since the Ripple return series starts on 08/04/2013 and the Ethereum return series startson 08/07/2015, in the tables we present the statistics for Bitcoin for the corresponding periods. For theRipple returns, the Sharpe ratios are 0.06 at the daily frequency, 0.13 at the weekly frequency, and 0.25 atthe monthly frequency. The Ripple returns have a markedly higher mean and standard deviation comparedto the Bitcoin returns of the period. However, during this period the Sharpe ratios of Ripple returns arecomparable to the Sharpe ratios of Bitcoin returns. For Ethereum, the Sharpe ratios are 0.11 at the dailyfrequency, 0.28 at the weekly frequency, and 0.53 at the monthly frequency. The Ethereum returns also havehigher mean and standard deviation than Bitcoin returns during the same period. However, during thisperiod the Sharpe ratios of Ethereum returns are comparable to the Sharpe ratios of Bitcoin returns.
The Bitcoin returns are positively skewed at all frequencies in contrast to the stock returns which arenegatively skewed. The skewness increases from 0.80 at the daily frequency to 1.76 at the weekly frequency,and to 4.32 at the monthly frequency. The corresponding kurtosis is 15.21 at the daily frequency, 10.25 atthe weekly frequency, and 25.38 at the monthly frequency. The bitcoin returns have high probabilities ofexceptional negative and positive daily returns. For example, the probability of a -20 percent daily return“disaster” is almost 0.5 percent; the probability of a 20 percent daily return “miracle” is almost 1 percent.The Ripple and Ethereum returns have similar characteristics: (1) positively skewed at all frequencies andhaving high kurtosis; and (2) high probabilities of exceptional negative and positive daily returns.
Table 1: Bitcoin Returns Summary Statistics and Comparison with Traditional Asset Classes
Panel A
Daily Mean SD T-Statistics Sharpe Skewness Kurtosis % Return >0Bitcoin 0.52% 5.55% 4.88 0.09 0.80 15.21 53.69Stock 0.05% 0.94% 2.44 0.06 -0.51 7.95 54.91Stock* 0.04% 1.06% 6.10 0.03 -0.13 19.72 55.07
Weekly Mean SD T-Statistics Sharpe Skewness Kurtosis % Return >0Bitcoin 3.79% 16.64% 4.49 0.23 1.76 10.25 58.72Stock 0.26% 1.93% 2.59 0.13 -0.38 5.17 59.95Stock* 0.21% 2.45% 6.02 0.06 -0.27 10.14 58.40
Monthly Mean SD T-Statistics Sharpe Skewness Kurtosis % Return >0Bitcoin 21.60% 69.46% 2.95 0.31 4.32 25.38 60.00Stock 1.08% 3.24% 3.12 0.33 -0.10 3.78 68.89Stock* 0.91% 4.27% 5.36 0.12 -0.51 5.02 62.16Bond 0.95% 3.00% 2.18 0.32 -0.10 2.73 64.58Housing 0.40% 0.72% 5.15 0.55 -0.01 3.17 73.56
Note: Stock* shows results for the whole sample between 1953/07 and 2018/04.
Panel B: Extreme Events of Daily Bitcoin Returns
Disasters Counts Percentage Miracles Counts Percentage
<-5% 225 8.26% >5% 304 11.16%<-10% 78 2.86% >10% 104 3.82%<-20% 13 0.48% >20% 26 0.95%<-30% 3 0.11% >30% 9 0.33%
7

Table 2: Ripple Returns Summary Statistics
Panel A: Return Summary
Ripple ReturnsMean SD T-Statistics Sharpe Skewness Kurtosis % Return >0
Daily 0.59% 9.11% 2.74 0.06 6.11 99.05 46.09Weekly 6.26% 47.39% 2.11 0.13 7.62 76.26 46.27Monthly 36.20% 143.31% 1.94 0.25 3.82 18.69 40.68
Same Period Bitcoin ReturnsMean SD T-Statistics Sharpe Skewness Kurtosis % Return >0
Daily 0.34% 4.47% 3.17 0.08 0.54 13.08 54.58Weekly 2.42% 12.68% 3.04 0.19 0.88 5.72 56.86Monthly 14.93% 64.87% 1.77 0.23 5.88 41.58 55.93
Panel B: Extreme Events of Daily Ripple Returns
Disasters Counts Percentage Miracles Counts Percentage
<-5% 224 12.59% >5% 247 13.88%<-10% 75 4.22% >10% 119 6.69%<-20% 11 0.62% >20% 44 2.47%<-30% 3 0.17% >30% 21 1.18%
Table 3: Ethereum Returns Summary StatisticsPanel A: Returns Summary Statistics
Ethereum ReturnsMean SD T-Statistics Sharpe Skewness Kurtosis % Return >0
Daily 0.81% 7.71% 3.41 0.11 0.24 15.71 49.33Weekly 6.88% 24.51% 3.43 0.28 1.71 7.24 54.00Monthly 30.26% 67.56% 2.65 0.53 1.24 3.95 54.29
Same Period Bitcoin ReturnMean SD T-Statistics Sharpe Skewness Kurtosis % Return >0
Daily 0.38% 4.07% 3.04 0.09 0.19 7.54 56.88Weekly 2.84% 11.80% 2.94 0.24 0.26 4.05 62.00Monthly 12.05% 25.10% 2.84 0.48 0.51 2.88 65.71
Panel B: Extreme Events of Daily Ethereum Returns
Disasters Counts Percentage Miracles Counts Percentage
<-5% 134 12.81% >5% 198 18.93%<-10% 39 3.73% >10% 96 9.20%<-20% 6 0.57% >20% 23 2.20%<-30% 1 0.10% >30% 8 0.76%
8

Table 4: Return Summary Statistics by Day of the Week
Bitcoin Mean SD T-Statistics Sharpe Ripple Mean SD T-Statistics Sharpe
Monday 0.67% 5.48% 2.43 0.12 Monday 0.05% 7.70% 0.11 0.01Tuesday 1.01% 6.09% 3.25 0.17 Tuesday 0.75% 9.04% 1.32 0.08Wednesday 0.46% 5.62% 1.62 0.08 Wednesday 0.45% 6.86% 1.03 0.06Thursday 0.66% 5.95% 2.18 0.11 Thursday 1.45% 10.90% 2.13 0.13Friday 0.32% 5.71% 1.09 0.06 Friday 0.97% 7.71% 2.01 0.13Saturday 0.33% 5.32% 1.24 0.06 Saturday -0.14% 7.32% -0.29 -0.02Sunday 0.18% 4.52% 0.80 0.04 Sunday 0.61% 12.72% 0.76 0.05
Ethereum Mean SD T-Statistics Sharpe Stock Mean SD T-Statistics Sharpe
Monday 0.38% 7.39% 0.62 0.05 Monday -0.03% 1.00% -0.47 -0.03Tuesday 1.53% 8.86% 2.11 0.17 Tuesday 0.12% 0.90% 2.55 0.13Wednesday 0.86% 6.83% 1.53 0.13 Wednesday 0.04% 0.93% 0.94 0.05Thursday 1.72% 8.72% 2.41 0.20 Thursday 0.06% 0.97% 1.23 0.06Friday 0.21% 6.75% 0.39 0.03 Friday 0.06% 0.88% 1.31 0.07Saturday 0.26% 8.83% 0.36 0.03Sunday 0.74% 6.15% 1.47 0.12
Table 4 shows the mean, standard deviation, and Sharpe ratios of the returns on different days of theweek. In contrast to the stocks, there is no pronounced Monday effect. However, the returns are lower onSaturdays: Bitcoin – 0.33 percent with the Sharpe ratio of 0.06 compared to 0.52 percent daily average withthe Sharpe ratio of 0.09; Ripple – -0.14 percent with the Sharpe ratio of -0.02 compared to 0.59 percent dailyaverage with the Sharpe ratio of 0.06; and Ethereum – 0.26 percent with the Sharpe ratio of 0.03 comparedto 0.81 percent daily average with the Sharpe ratio of 0.03. While Bitcoin returns are somewhat lower onSundays, the returns on Saturday is consistently lower across all three cryptocurrencies.
In this paper, we report two types of t-statistics: (1) based on regular standard error, and (2) based onbootstrapped standard error. The first type is reported in parentheses and the second type is reported inbrackets.
3 Risk Exposures
In this section, we establish facts on factor loadings and on exposures to stocks, currencies, and preciousmetals commodities. Throughout this section, t-statistics in parentheses and brackets are based on regularand bootstrapped standard errors.
3.1 Stock Factors Loadings
Table 5 documents the common stock factor exposures of the Bitcoin returns. For the risk factors, wechoose the CAPM, Fama French 3-factor, Carhart 4-factor, Fama French 5-factor, and Fama French 6-factormodels. The alphas for all of the considered models are statistically significant. The unconditional alpha ofthe period is 22.45 percent per month. The CAPM adjusted alpha decreases to 18.91 percent per month – areduction of about 16 percent. The CAPM beta is large at 3.34 but not statistically significant. The beta isstatistically significant at the 10-percent level only for the 5-factor and 6-factor models. The correspondingalphas are 16.72 and 15.98 percent per month. The exposures to the other factors are not statisticallysignificant. The exposures to the SMB factor is not stable across the specifications: both the magnitude
9

and the signs change when 5-factor and 6-factor models are considered. The exposures to the HML factorare negative and have consistent magnitudes and signs; this suggests that Bitcoin returns may comove morewith growth rather than with value firms. The exposures to the RMW factor are positive and are estimatedslightly more accurately than other statistically not significant factors; this suggests that Bitcoin returnscomove more with high profit rather than low profit firms. The point estimates on the MOM and CMAfactors are very inaccurate.6
Table 5: Bitcoin Returns Factor Loadings
(Percentage) CAPM 3-Fac 4-Fac 5-Fac 6-Fac
ALPHA 18.91∗∗ 18.20∗∗ 17.66∗∗ 16.72∗∗ 15.98∗
(2.42) (2.30) (2.18) (2.07) (1.94)[2.55] [2.34] [2.28] [2.61] [2.54]
MKTRF 3.34 3.79 4.00 4.57∗ 4.85∗
(1.45) (1.56) (1.60) (1.81) (1.86)[1.94] [2.08] [1.94] [2.14] [2.06]
SMB −1.29 −1.26 0.45 0.55(-0.36) (-0.35) (0.12) (0.14)[-0.55] [-0.54] [0.15] [0.16]
HML −3.02 −2.41 −3.80 −3.01(-0.81) (-0.59) (-0.79) (-0.58)[-1.22] [-0.84] [-0.97] [-0.67]
MOM 1.08 1.35(0.38) (0.47)[0.48] [0.59]
RMW 6.16 6.39(1.07) (1.10)[1.35] [1.41]
CMA 2.47 2.40(0.35) (0.33)[0.27] [0.24]
R-Squared 0.02 0.04 0.04 0.05 0.05
Table 6 documents the common stock factor exposures of the Ripple returns and compares them to theBitcoin returns for the same time period. The Bitcoin returns for this time period have similar risk exposuresas those in the full sample but have smaller and mostly insignificant alphas. We now turn to the analysisof Ripple. The alphas for all of the considered models are statistically significant. The unconditional alphaof the period is 38.15 percent per month and is more than twice as large as that for Bitcoin. The CAPMadjusted alpha is about the same as the unadjusted alpha. The CAPM beta is about half the size of Bitcoinand is not significant. In contrast to Bitcoin, there are statistically significant large negative loadings on theHML factor within the 5-factor and 6-factor models. The exposures to the other factors are not statisticallysignificant. Summarizing, Ripple has performed better than Bitcoin for the corresponding time period, andits returns comove with growth rather than value firms.
6Stoffels (2017) and Gilbert and Loi (2018) examine cryptocurrency loadings on the CAPM and Fama French 3-factormodels.
10

Table 6: Ripple Return Factor Loadings
Ripple Return
(Percentage) CAPM 3-Fac 4-Fac 5-Fac 6-Fac
ALPHA 36.61∗ 35.30∗ 38.46∗ 39.92∗ 41.33∗
(1.78) (1.70) (1.82) (1.90) (1.93)[2.43] [2.24] [2.18] [2.06] [1.97]
MKTRF 1.56 1.59 −0.06 2.73 1.81(0.23) (0.23) (-0.01) (0.40) (0.25)[0.45] [0.42] [-0.01] [0.70] [0.43]
SMB 0.82 0.57 2.95 2.57(0.10) (0.07) (0.32) (0.27)[0.15] [0.10] [0.42] [0.33]
HML −8.88 −13.48 −22.27∗ −23.80∗
(-1.01) (-1.33) (-1.94) (-1.98)[-1.99] [-2.02] [-2.10] [-2.03]
MOM −6.88 −3.54(-0.92) (-0.46)[-1.08] [-0.59]
RMW 6.90 6.10(0.47) (0.41)[0.78] [0.67]
CMA 30.92 29.05(1.67) (1.52)[1.29] [1.24]
R-Squared 0.00 0.02 0.04 0.08 0.09
Same Period Bitcoin Return
(Percentage) CAPM 3-Fac 4-Fac 5-Fac 6-Fac
ALPHA 12.72 12.49 11.87 11.43 10.75(1.39) (1.33) (1.24) (1.17) (1.08)[2.03] [1.81] [1.85] [1.64] [1.69]
MKTRF 3.30 3.37 3.69 3.27 3.71(1.10) (1.09) (1.14) (1.03) (1.12)[1.28] [1.35] [1.31] [1.26] [1.23]
SMB −0.43 −0.38 1.05 1.23(-0.12) (-0.10) (0.24) (0.28)[-0.20] [-0.18] [0.32] [0.37]
HML −0.86 0.03 −0.64 0.10(-0.22) (0.01) (-0.12) (0.02)[-0.59] [0.00] [-0.37] [0.05]
MOM 1.33 1.71(0.39) (0.48)[0.78] [0.84]
RMW 4.77 5.15(0.71) (0.75)[1.21] [1.21]
CMA −1.46 −0.55(-0.17) (-0.06)[-0.50] [-0.18]
R-Squared 0.02 0.02 0.03 0.03 0.04
11

Table 7: Ethereum Return Factor Loadings
Ethereum Return
(Percentage) CAPM 3-Fac 4-Fac 5-Fac 6-Fac
ALPHA 31.42∗∗ 33.04∗∗∗ 35.69∗∗∗ 31.55∗∗∗ 33.28∗∗∗
(2.49) (2.82) (3.19) (2.80) (2.99)[2.54] [2.93] [2.93] [2.57] [2.70]
MKTRF 1.61 2.04 −0.86 2.86 0.50(0.41) (0.55) (-0.23) (0.81) (0.13)[0.44] [0.62] [-0.19] [0.85] [0.11]
SMB −3.47 −6.71 −1.35 −3.66(-0.69) (-1.33) (-0.26) (-0.68)[-0.58] [-1.35] [-0.21] [-0.62]
HML −10.25∗∗ −13.65∗∗ −15.15∗∗ −16.05∗∗∗
(-2.07) (-2.74) (-2.69) (-2.89)[-1.66] [-1.83] [-2.10] [-2.38]
MOM −9.46∗∗ −6.77(-2.06) (-1.41)[-2.02] [-1.30]
RMW 11.46 10.41(1.50) (1.38)[1.57] [1.35]
CMA 13.62 9.43(1.60) (1.06)[1.51] [1.14]
R-Squared 0.01 0.21 0.31 0.34 0.39
Same Period Bitcoin Return
(Percentage) CAPM 3-Fac 4-Fac 5-Fac 6-Fac
ALPHA 12.25∗∗ 12.26∗∗∗ 11.87∗∗ 11.67∗∗ 11.32∗∗
(2.73) (2.84) (2.72) (2.59) (2.47)[2.99] [2.98] [3.01] [2.81] [2.85]
MKTRF 1.61 2.01 2.44 1.85 2.34(1.15) (1.47) (1.65) (1.30) (1.47)[1.35] [1.43] [1.25] [1.29] [1.09]
SMB −2.94 −2.45 −2.38 −1.91(-1.59) (-1.25) (-1.14) (-0.86)[-1.55] [-1.59] [-0.95] [-0.88]
HML −1.28 −0.77 −0.58 −0.39(-0.70) (-0.40) (-0.26) (-0.17)[-0.70] [-0.34] [-0.26] [-0.15]
MOM 1.42 1.39(0.79) (0.70)[0.64] [0.58]
RMW 1.61 1.82(0.52) (0.58)[0.54] [0.60]
CMA −1.88 −1.02(-0.55) (-0.28)[-0.53] [-0.31]
R-Squared 0.04 0.18 0.20 0.19 0.21
Table 7 documents the common stock factor exposures of the Ethereum returns and compares them to the
12

Bitcoin returns for the same time period. The Bitcoin returns for this time period have a smaller exposureto the market and also have smaller alphas compared to the full sample. We now turn to the analysis ofEthereum. The alphas for all the considered models are statistically significant. The unconditional alpha ofthe period is 32.87 percent per month, comparable to Ripple and more than two times larger than that ofBitcoin. The CAPM adjusted alpha is about the same as the unadjusted alpha. The CAPM beta is aboutthe same size as Bitcoin and is not significant. In contrast to Bitcoin, there is significant large negativeloadings on the HML factor for 3-factor, 4-factor, 5-factor and 6-factor models. The exposures to the otherfactors are not statistically significant. Summarizing, Ethereum has performed better than Bitcoin for thecorresponding time period, and its returns comove with the growth rather than the value firms for all of thespecifications of the multi-factor models.
3.2 Currency
Table 8 shows currency exposures of Bitcoin, Ripple, and Ethereum returns. For currency returns, weconsider five major currencies: Australian Dollar, Canadian Dollar, Euro, Singaporean Dollar, and UKPound. The exposures of all other cryptocurrencies to these commodities are not statistically significantand the alpha estimates barely change. In Table 9, we investigate the currency exposures of Bitcoin returnsover shorter periods corresponding to those of Ripple and Ethereum. Again, the currency exposures ofBitcoin returns over the shorter periods are small and statistically insignificant. We conclude that there isno consistent evidence of systematic currency exposures in cryptocurrencies.
Table 8: Currency Loadings of Cryptocurrency Returns
Panel A: Bitcoin (1) (2) (3) (4) (5)
APLHA 23.79∗∗∗ 24.27∗∗∗ 23.68∗∗∗ 23.41∗∗∗ 23.95∗∗∗
(3.23) (3.28) (3.23) (3.20) (3.27)[2.82] [2.86] [2.75] [2.71] [2.69]
AUSTRALIA 1.46(0.66)[0.56]
CANADA 3.51(0.84)[0.92]
EURO 2.45(0.90)[1.08]
SINGAPORE 4.09(0.99)[0.96]
UK 3.27(1.13)[1.04]
R-Squared 0.00 0.01 0.01 0.01 0.01
13

Panel B: Ripple (1) (2) (3) (4) (5)
APLHA 38.38∗ 36.46∗ 40.54∗∗ 38.54∗ 39.11∗∗
(1.96) (1.85) (2.11) (1.98) (2.01)[2.35] [2.45] [2.63] [2.48] [2.51]
AUSTRALIA 0.62(0.09)[0.07]
CANADA -4.69(-0.48)[-0.88]
EURO 10.90(1.28)[2.07]
SINGAPORE 3.69(0.27)[0.32]
UK 4.13(0.55)[1.18]
R-Squared 0.00 0.00 0.03 0.00 0.01
Panel C: Ethereum (1) (2) (3) (4) (5)
APLHA 32.86∗∗ 32.87∗∗ 31.34∗∗ 32.34∗∗∗ 33.36∗∗
(2.71) (2.70) (2.63) (2.77) (2.71)[2.75] [2.88] [2.69] [2.76] [2.71]
AUSTRALIA 1.77(0.39)[0.52]
CANADA -0.07(-0.01)[-0.01]
EURO 7.35(1.29)[1.40]
SINGAPORE 12.32(1.63)[1.80]
UK 1.02(0.24)[0.25]
R-Squared 0.00 0.00 0.05 0.08 0.00
14

Table 9: Currency Loadings of Bitcoin Returns – Different Period
Panel A: Ripple Period (1) (2) (3) (4) (5)
APLHA 14.91∗ 15.93∗ 16.25∗ 15.76∗ 16.29∗
(1.70) (1.78) (1.84) (1.79) (1.85)[2.21] [2.15] [1.98] [2.07] [1.85]
AUSTRALIA -2.90(-0.93)[-0.77]
CANADA -0.11(-0.02)[-0.03]
EURO 1.28(0.33)[0.70]
SINGAPORE -1.99(-0.33)[-0.42]
UK 1.35(0.40)[0.48]
R-Squared 0.02 0.00 0.00 0.00 0.00
Panel B: Ethereum Period (1) (2) (3) (4) (5)
APLHA 13.70∗∗∗ 13.69∗∗∗ 13.93∗∗∗ 13.66∗∗∗ 12.82∗∗∗
(3.12) (3.11) (3.17) (3.11) (2.95)[3.31] [3.39] [3.59] [3.36] [3.26]
AUSTRALIA -0.60(-0.36)[-0.47]
CANADA -0.04(-0.02)[-0.02]
EURO -1.15(-0.55)[-0.65]
SINGAPORE 0.77(0.27)[0.33]
UK -1.84(-1.23)[-1.91]
R-Squared 0.00 0.00 0.01 0.00 0.05
We further test cryptocurrency exposures on currency factors as in Lustig, Roussanov, and Verdelhan(2011) instead of individual currency returns.7 Table 10 reports the results for each of the three cryp-tocurrencies. Consistent with the results on individual currency returns, we find that none of the threecryptocurrencies has significant exposures to the currency factors.
7We thank Nicola Borri for providing us with the up-to-date currency factors.
15

Table 10: Currency Loadings of Cryptocurrency Factors
Panel A: Bitcoin (1) (2) (3)
APLHA 0.23*** 0.21*** 0.21***(3.04) (2.75) (2.78)[3.14] [2.77] [2.76]
DOLLAR 3.18 2.56(0.75) (0.59)[0.56] [0.43]
CARRY 3.88 3.41(0.92) (0.79)[1.53] [1.23]
R-Squared 0.01 0.01 0.01
Panel B: Ripple (1) (2) (3)APLHA 0.40** 0.42** 0.43**
(2.04) (2.01) (2.04)[2.50] [2.60] [2.53]
DOLLAR 9.01 8.65(0.72) (0.68)[0.70] [0.67]
CARRY -5.70 -5.14(-0.47) (-0.42)[-1.13] [-1.01]
R-Squared 0.01 0.00 0.01
Panel C: Ethereum (1) (2) (3)APLHA 0.32** 0.32** 0.30**
(2.71) (2.47) (2.37)[2.62] [2.43] [2.30]
DOLLAR 10.81 11.09(1.43) (1.43)[1.46] [1.45]
CARRY 1.15 2.24(0.17) (0.33)[0.22] [0.46]
R-Squared 0.06 0.00 0.06
3.3 Precious Metals Commodities
Table 11 shows commodity exposures of Bitcoin, Ripple, and Ethereum returns. For commodity returns,we consider gold, platinum, and crude oil. With the exception of the exposure of Ethereum to gold, the ex-posures of all other cryptocurrencies to these commodities are not statistically significant. At the same time,note that the alphas of Bitcoin and Ripple decrease, respectively, when gold and platinum are considered. InTable 12, we investigate the commodity exposures of Bitcoin returns over shorter periods corresponding tothose of Ripple and Ethereum. During the Ripple period, Bitcoin negatively covaries with gold and platinumreturns, similar to Ripple. For the Ethereum period, Bitcoin negatively covariates with platinum returns,in contrast with the behavior of Ethereum. We conclude that there is no consistent evidence of systematiccommodity exposures in cryptocurrencies.
16

Table 11: Commodity Loadings of Cryptocurrency Returns
Panel A: Bitcoin (1) (2) (3)
APLHA 22.32∗∗∗ 22.53∗∗∗ 22.54∗∗∗
(2.97) (2.75) (2.98)[3.01] [3.49] [3.01]
GOLD -0.59(-0.39)[-0.26]
PLATINUM 24.05(0.22)[0.29]
SILVER 0.08(0.10)[0.05]
R-Squared 0.00 0.00 0.00
Panel B: Ripple (1) (2) (3)
APLHA 40.88∗ 21.44 36.78∗
(1.97) (0.98) (1.89)[2.27] [2.47] [2.41]
GOLD -2.45(-0.47)[-0.48]
PLATINUM -466.74(-1.57)[-1.93]
SILVER -2.43(-0.78)[-0.89]
R-Squared 0.00 0.04 0.01
Panel C: Ethereum (1) (2) (3)
APLHA 37.82∗∗∗ 35.93∗∗ 32.75∗∗
(3.11) (2.46) (2.70)[3.20] [2.38] [2.76]
GOLD 5.45*(1.77)[1.83]
PLATINUM 61.65(0.37)[0.37]
SILVER 0.86(0.41)[0.48]
R-Squared 0.10 0.00 0.01
17

Table 12: Commodity Loadings of Bitcoin Returns – Different Period
Panel A: Ripple Period (1) (2) (3) Panel B: Ethereum Period (1) (2) (3)
APLHA 15.55∗ 13.13 14.96∗ APLHA 13.79∗∗∗ 13.53∗∗ 13.72∗∗∗
(1.81) (1.31) (1.72) (3.12) (2.56) (3.13)[2.22] [2.28] [2.42] [3.49] [3.10] [3.40]
GOLD −3.74∗ GOLD -0.11(-1.68) (-0.10)[-1.03] [-0.14]
PLATINUM -80.21 PLATINUM -4.16(-0.59) (-0.07)[-0.77] [-0.09]
SILVER -1.85 SILVER 0.11(-1.32) (0.15)[-0.83] [0.24]
R-Squared 0.05 0.01 0.03 R-Squared 0.00 0.00 0.00
3.4 Exploring the Factor Zoo
Finance literature has documented more than a hundred factors for predicting the cross-section of stockreturns (see, e.g., summarizes in Feng, Giglio, and Xiu, 2017 and Chen and Velikov, 2017). To investigatewhether any of those factors may be important in pricing cryptocurrencies, we estimate the loadings of the155 common factors from Andrew Chen’s website. One caveat is that this dataset ends at the end of 2016and thus does not cover the most recent return experiences. Therefore, it can only be meaningfully usedfor the analysis of Bitcoin. We report the results in the Appendix, due to the large number of factors. Wefind that only four out of the 155 factors are significant, but those four factors do not form any discerniblepatterns.
3.5 Macroeconomic Factors
Table 13 shows macroeconomic factor exposures of Bitcoin, Ripple, and Ethereum returns. For macroe-conomic factors, we consider the non-durable consumption growth, durable consumption growth, industrialproduction growth, and personal income growth. For Bitcoin and Ripple, all of the exposures are notstatistically significant.8 For Ethereum, notably, the durable consumption growth factor has a significantloading.
8In the Appendix, we also report the results for Bitcoin for the time periods corresponding to those of Ripple and Ethereum.The results are the same as for the full sample.
18

Table 13: Macro Factor Loadings of Cryptocurrency Returns
Panel A: Bitcoin (1) (2) (3) (4) (5) (6) (7) (8)
α 0.08 0.25∗∗∗ 0.24∗∗∗ 0.25∗∗∗ 0.06 0.21∗∗ 0.20∗∗ 0.20∗∗
(0.57) (3.12) (3.17) (3.02) (0.40) (2.57) (2.51) (2.39)[0.57] [3.18] [2.68] [2.79] [0.41] [2.99] [2.48] [2.64]
∆cnd 47.21 43.36(1.30) (1.20)[0.79] [0.75]
∆cd −2.80 −4.12(-0.38) (-0.56)[-0.33] [-0.50]
∆indpro −6.12 −5.15(-0.38) (-0.32)[-0.44] [-0.38]
∆pi −3.15 −2.52(-0.30) (-0.24)[-0.52] [-0.48]
MKTRF 2.98 3.31 3.14 3.15(1.39) (1.54) (1.46) (1.47)[2.05] [2.18] [1.92] [1.85]
R-Squared 0.02 0.00 0.00 0.00 0.04 0.03 0.02 0.02
Panel B: Ripple (1) (2) (3) (4) (5) (6) (7) (8)
α −0.11 0.39∗ 0.33∗ 0.32 −0.11 0.37∗ 0.31 0.32(-0.26) (1.90) (1.69) (0.96) (-0.26) (1.73) (1.49) (0.96)[-0.39] [2.49] [2.57] [1.89] [-0.40] [2.34] [2.39] [1.91]
∆cnd 137.57 138.82(1.31) (1.27)[1.48] [1.54]
∆cd −1.96 −2.37(-0.11) (-0.13)[-0.21] [-0.26]
∆indpro 50.99 51.72(1.33) (1.34)[1.78] [1.77]
∆pi 18.53 14.13(0.22) (0.16)[0.38] [0.28]
MKTRF −0.36 1.64 2.10 1.25(-0.05) (0.24) (0.31) (0.18)[-0.13] [0.47] [0.62] [0.35]
R-Squared 0.03 0.00 0.03 0.00 0.03 0.00 0.03 0.00
19

Panel C: Ethereum (1) (2) (3) (4) (6) (7) (8) (9)
α 0.19 0.22∗∗ 0.17∗ 0.22∗ 0.17 0.19∗∗ 0.13 0.24∗
(1.03) (2.59) (1.88) (1.70) (0.94) (2.16) (1.41) (1.86)[1.58] [3.40] [2.86] [2.51] [1.46] [2.97] [2.48] [2.54]
∆cnd −7.52 −11.22(-0.16) (-0.24)[-0.24] [-0.27]
∆cd −17.59∗∗ −16.91∗
(-2.11) (-2.04)[-2.71] [-2.27]
∆indpro 0.05 4.54(0.00) (0.27)[0.04] [0.12]
∆pi −21.26 −44.19(-0.56) (-1.10)[-0.99] [-1.12]
MKTRF 3.47 3.04 3.59 4.62(1.24) (1.16) (1.25) (1.57)[0.45] [0.32] [0.47] [0.79]
R-Squared 0.00 0.13 0.00 0.01 0.05 0.16 0.05 0.08
4 Cryptocurrency Specific Factors
In this section, we first develop and investigate cryptocurrency specific predictors. We consider momen-tum, proxies for investor attention, proxies for the price-to-“dividend” ratio, and the volatility – all of whichare specific to the individual cryptocurrency markets. Finally, we construct proxies for cryptocurrency sup-ply conditions. Throughout this section, t-statistics in parentheses and brackets are based on regular andbootstrapped standard errors.
4.1 Cryptocurrency Momentum
We first establish that there is very strong evidence of momentum at various time horizons. Table 14documents the time-series momentum results. For Bitcoin daily returns, the current return positively andstatistically significantly predicts 1-day, 3-day, 5-day, and 6-day ahead returns. A one standard deviationincrease in today’s return leads to increases in daily returns by 0.33 percent,9 0.17 percent, 0.39 percent,and 0.50 percent increases at the 1-day, 3-day, 5-day, and 6-day ahead returns, respectively. Specifically, the1-day ahead daily return is that of buying a Bitcoin at 11:59:59 UTD today and selling at 11:59:59 UTDone day later.
For Bitcoin weekly returns, the current return positively and statistically significantly predicts 1-week,2-week, 3-week, and 4-week ahead returns. A one-standard-deviation increase in this week’s return leads toincreases in weekly returns of 3.16 percent,10 3.66 percent, 3.49 percent, and 1.50 percent increases at the1-week, 2-week, 3-week, and 4-week ahead returns, respectively. Specifically, the 1-week ahead weekly returnis that of buying a Bitcoin at 11:59:59 UTD Sunday and selling at 11:59:59 UTD one week later.
9The 0.33 percent daily return is calculated by multiplying a one-standard-deviation increase of today’s return (5.55 percent)and the coefficient estimate (0.06).
10The 3.16 percent weekly return is calculated by multiplying one-standard-deviation increase of today’s return (16.64percent) and the coefficient estimate (0.19).
20

In Table 15, we estimate the time-series momentum by grouping weekly returns into quintiles and eval-uating their performance going forward. We find that the top quintiles outperform the bottom quintiles at1-4 week ahead horizons. For example, at the 1-week horizon, the average return of the top quintile is 11.22percent per week with the Sharpe ratio of 0.45 while the average return of the bottom quintile is 2.60 percentper week with the Sharpe ratio of 0.19. In Table 16, we restrict our sample to 2013 onward. Again, wefind a strong and statistically significant momentum effect of somewhat smaller magnitude.11 In Table 17,we use the first two years of data to determine the quintile cutoffs and study the out-of-sample momentumperformance, and we find strong momentum effect as well.
Table 14: Time-Series Momentum
Panel ADaily Rt+1 Rt+2 Rt+3 Rt+4 Rt+5 Rt+6 Rt+7
(1) (2) (3) (4) (5) (6) (7)
Rt 0.06∗∗∗ −0.02 0.03∗ 0.02 0.07∗∗∗ 0.08∗∗∗ −0.03(2.96) (-1.14) (1.71) (1.22) (3.51) (4.14) (-1.58)[1.22] [-0.71] [0.80] [0.95] [2.00] [2.97] [-0.97]
R-Squared 0.00 0.00 0.00 0.00 0.01 0.01 0.00
Panel BWeekly Rt+1 Rt+2 Rt+3 Rt+4
(1) (2) (3) (4)
Rt 0.19∗∗∗ 0.22∗∗∗ 0.21∗∗∗ 0.09∗(3.73) (4.52) (4.26) (1.72)[2.17] [2.73] [2.47] [1.40]
R-Squared 0.03 0.05 0.05 0.01
11Stoffels (2017) documents that a cross-sectional momentum strategy based on 15 cryptocurrencies generate abnormalreturns during the period between 2016 and 2017.
21

Table 15: Time-Series Momentum by Groups
Weekly Level (Percentage)Rank Formation Return Rt+1 T-Statistics Sharpe Rt+2 T-Statistics SharpeLow −14.95 2.60∗ (1.69) 0.19 −1.23 (-0.89) -0.102 −2.56 0.27 (0.19) 0.02 4.40∗∗ (2.32) 0.263 1.84 1.15 (0.87) 0.10 2.92∗∗ (2.52) 0.294 7.59 3.75∗ (2.20) 0.25 2.62∗ (1.71) 0.195 27.44 11.22∗∗∗ (3.95) 0.45 10.05∗∗∗ (3.52) 0.40Difference 8.62 11.28
Rank Formation Return Rt+3 T-Statistics Sharpe Rt+4 T-Statistics SharpeLow −14.95 −0.50 (-0.38) -0.04 1.73 (1.03) 0.122 −2.56 2.40 (1.35) 0.15 2.13 (1.29) 0.153 1.84 3.62∗∗ (2.24) 0.26 2.42∗ (1.81) 0.214 7.59 3.04∗ (1.83) 0.21 5.31∗∗∗ (2.81) 0.325 27.44 10.07∗∗∗ (3.76) 0.43 6.92∗∗ (2.59) 0.30Difference 10.57 5.18
Table 16: Time-Series Momentum by Groups Since 2013
Weekly Level (Percentage)Rank Formation Return Rt+1 T-Statistics Sharpe Rt+2 T-Statistics SharpeLow −14.38 2.83 (1.62) 0.22 −0.01 (-0.01) -0.002 −2.40 0.64 (0.49) 0.07 1.31 (1.00) 0.133 1.75 0.91 (0.56) 0.07 3.38∗∗ (2.41) 0.324 7.57 4.04∗∗ (2.66) 0.35 2.95 (1.69) 0.235 23.53 7.18∗∗ (2.57) 0.34 7.8∗∗∗ (2.80) 0.37Difference 4.35 7.87
Rank Formation Return Rt+3 T-Statistics Sharpe Rt+4 T-Statistics SharpeLow −14.38 0.81 (0.56) 0.07 1.97 (1.10) 0.152 −2.40 0.80 (0.52) 0.07 1.88 (1.41) 0.193 1.75 4.06∗∗ (2.03) 0.27 0.76 (0.48) 0.064 7.57 2.70 (1.49) 0.20 5.41∗∗∗ (3.02) 0.405 23.53 6.90∗∗∗ (2.83) 0.38 5.00∗ (1.86) 0.25Difference 6.09 3.03
22

Table 17: Time-Series Momentum by Groups – No Lookahead
Weekly Level (Percentage)Rank Formation Return Rt+1 T-Statistics Sharpe Rt+2 T-Statistics SharpeLow −14.97 3.35∗ (1.82) 0.25 0.09 (0.05) 0.012 −2.88 0.39 (0.31) 0.04 0.78 (0.65) 0.093 1.77 1.33 (0.91) 0.11 3.52∗∗∗ (2.75) 0.334 8.12 3.25∗∗ (2.10) 0.28 2.87 (1.60) 0.225 24.14 7.88∗∗ (2.70) 0.37 8.32∗∗∗ (2.83) 0.39Difference 4.53 8.23
Rank Formation Return Rt+3 T-Statistics Sharpe Rt+4 T-Statistics SharpeLow −14.97 1.37 (0.90) 0.12 2.60 (1.36) 0.192 −2.88 0.00 (-0.00) 0.00 1.21 (0.90) 0.123 1.77 3.99∗∗ (2.33) 0.28 1.68 (1.20) 0.154 8.12 2.58 (1.36) 0.18 5.36∗∗∗ (2.95) 0.405 24.14 7.53∗∗∗ (2.98) 0.41 5.02∗ (1.77) 0.24Difference 6.16 2.42
Table 18 summarizes evidence for Ripple and Ethereum. For Ripple, the momentum effect is statisticallysignificant at the 1-5 day horizon. For Ethereum, the momentum effect is statistically significant at the 1-dayand 5-day horizons, with the 5-day horizon coefficient having a negative sign.
Table 18: Time-Series Momentum of Ripple and Ethereum
Panel A: RippleDaily Rt+1 Rt+2 Rt+3 Rt+4 Rt+5 Rt+6 Rt+7
(1) (2) (3) (4) (5) (6) (7)
Rt 0.06∗∗ 0.08∗∗∗ 0.05∗ 0.04∗ 0.06∗∗ 0.03 0.03(2.49) (3.59) (1.94) (1.83) (2.53) (1.35) (1.27)[0.61] [1.73] [0.88] [1.32] [2.02] [1.23] [0.63]
R-Squared 0.00 0.01 0.00 0.00 0.00 0.00 0.00
Panel B: EthereumDaily Rt+1 Rt+2 Rt+3 Rt+4 Rt+5 Rt+6 Rt+7
(1) (2) (3) (4) (5) (6) (7)
Rt 0.08∗∗ 0.04 −0.01 −0.04 −0.08∗∗ 0.01 0.04(2.58) (1.41) (-0.20) (-1.48) (-2.63) (0.23) (1.46)[1.67] [0.73] [-0.10] [-1.07] [-1.10] [0.14] [1.06]
R-Squared 0.01 0.00 0.00 0.00 0.01 0.00 0.00
4.2 Cryptocurrency Investor Attention
In this section, we investigate the role of investor attention for the cryptocurrency returns. Specifically,we construct the deviation of Google searches for the words “Bitcoin”, “Ripple”, and “Ethereum” in a given
23

week compared to the average of those in the preceding four weeks. We match Google searches for the word“Bitcoin” with Bitcoin data, searches for the word “Ripple” with Ripple data, and searches for the word“Ethereum” with Ethereum data.
Table 19 reports the results for Bitcoin. For weekly returns, the Google search proxy statistically signifi-cantly predicts 1-week and 2-week ahead returns. A one-standard-deviation increase in this week’s searchesleads to increases in weekly returns of 1.84 percent and 2.30 percent at the 1-week and 2-week ahead returns.12
In Table 20, we investigate the Google search proxy by grouping the weekly Google search deviationsinto quintiles and evaluating their performance going forward. We find that the top quintile outperforms thebottom quintile at 1-4 week ahead horizons. For example, at the 1-week horizon, the average return of thetop quintile is 11.20 percent per week with the Sharpe ratio of 0.48 while the average return of the bottomquintile is 1.07 percent per week with the Sharpe ratio of 0.08.
Table 21 reports the same calculation for the more recent period since 2013. The results are similar tothat of the full sample. The top quintile outperforms the bottom quintile at the 1-4 week ahead horizons.For example, at the 2-week horizon, the average return of the top quintile is 8.90 percent with the Sharperatio of 0.40 while the average return of the bottom quintile is 0.57 percent per week with the Sharpe ratioof 0.04. In Table 22, we use the first two years of data to determine the quintile cutoffs and study theout-of-sample effect of investor attention, and we find strong positive investor attention effect as well.
Table 19: Google Searches – Bitcoin
Google search data for “Bitcoin” minus the average of previous four weeks, normalized.Weekly Rt+1 Rt+2 Rt+3 Rt+4 Rt+5 Rt+6 Rt+7
(1) (2) (3) (4) (5) (6) (7)
Googlet 1.84∗∗ 2.30∗∗∗ 1.04 0.59 1.03 −0.01 −1.30(2.17) (2.81) (1.25) (0.72) (1.25) (-0.01) (-1.39)[1.76] [2.07] [0.76] [0.54] [1.00] [-0.01] [-1.34]
R-Squared 0.01 0.02 0.00 0.00 0.00 0.00 0.01
12Wang and Vergne (2017) use the level of newspaper mentions of Bitcoin to proxy for the “buzz” of Bitcoin. They documentthat high “buzz” predicts low Bitcoin returns in the future. Mai et al. (2016) use the level of Twitter post counts to predictBitcoin returns.
24

Table 20: Google Searches by Groups
Weekly Level (Percentage)Rank Google Rt+1 T-Statistics Sharpe Rt+2 T-Statistics SharpeLow −0.71 1.07 (0.74) 0.08 0.34 (0.23) 0.032 −0.05 −1.20 (-1.06) -0.11 0.24 (0.20) 0.023 −0.01 3.92∗∗ (2.26) 0.24 4.23∗∗∗ (2.75) 0.294 0.04 6.03∗∗ (2.65) 0.35 5.21∗∗ (2.36) 0.315 0.87 11.20∗∗∗ (3.95) 0.48 8.99∗∗∗ (3.17) 0.39Difference 10.13 8.66Rank Google Rt+3 T-Statistics Sharpe Rt+4 T-Statistics SharpeLow −0.71 −0.29 (-0.19) -0.02 0.62 (0.39) 0.052 −0.05 1.65 (1.47) 0.15 1.31 (1.03) 0.113 −0.01 4.35∗∗ (2.39) 0.25 4.49∗∗ (2.57) 0.274 0.04 6.19∗∗∗ (3.06) 0.40 9.13∗∗∗ (3.33) 0.445 0.87 6.54∗∗ (2.39) 0.29 3.51 (1.67) 0.20Difference 6.82 2.89
Table 21: Google Searches by Groups Since 2013
Weekly Level (Percentage)Rank Google Rt+1 T-Statistics Sharpe Rt+2 T-Statistics SharpeLow −0.77 0.21 (0.12) 0.02 0.57 (0.30) 0.042 −0.08 0.51 (0.42) 0.05 0.62 (0.58) 0.073 −0.01 1.26 (1.63) 0.20 1.91∗∗ (2.04) 0.254 0.05 3.65∗ (1.94) 0.28 4.93∗∗ (2.51) 0.365 0.94 11.60∗∗∗ (3.67) 0.51 8.90∗∗∗ (2.84) 0.40Difference 11.39 8.33Rank Google Rt+3 T-Statistics Sharpe Rt+4 T-Statistics SharpeLow −0.77 0.78 (0.43) 0.06 0.24 (0.14) 0.022 −0.08 1.10 (0.89) 0.11 1.86 (1.35) 0.173 −0.01 1.85∗ (1.74) 0.22 1.93∗∗ (2.02) 0.254 0.05 6.26∗∗∗ (2.85) 0.41 7.79∗∗∗ (2.96) 0.435 0.94 6.83∗∗ (2.29) 0.32 4.75∗ (1.78) 0.25Difference 6.05 4.51
25

Table 22: Google Searches by Groups – No Lookahead
Weekly Level (Percentage)Rank Google Rt+1 T-Statistics Sharpe Rt+2 T-Statistics SharpeLow -3.31 0.70 (0.54) 0.06 0.32 (0.24) 0.032 -0.25 −0.29 (-0.21) -0.04 1.96 (1.23) 0.223 0.00 1.10 (1.44) 0.18 1.68∗ (1.77) 0.224 0.21 5.44∗ (1.64) 0.39 5.70 (1.72) 0.415 4.08 8.10∗∗∗ (3.70) 0.41 7.25∗∗∗ (3.33) 0.37Difference 7.39 6.94Rank Google Rt+3 T-Statistics Sharpe Rt+4 T-Statistics SharpeLow -3.31 0.61 (0.47) 0.05 0.81 (0.64) 0.072 -0.25 2.71 (1.64) 0.29 2.78 (1.26) 0.233 0.00 1.48 (1.39) 0.18 1.51 (1.61) 0.204 0.21 7.50∗∗ (2.13) 0.50 10.33∗∗ (2.59) 0.615 4.08 6.34∗∗∗ (2.96) 0.33 5.31∗∗ (2.52) 0.28Difference 5.72 4.49
Table 23 reports the results for Ripple. For weekly returns, the Google search proxy statistically signif-icantly predicts 1-week ahead returns. A one-standard-deviation increase in this week’s searches leads toincreases in weekly returns of 10.86 percent at the 1-week ahead returns. The results for Bitcoin for thesame period are comparable to those for other samples and to those for Ripple.
Table 23: Google Searches – Ripple
Google search data for “Ripple” minus the average of previous four weeks, normalized.Ripple
Rt+1 Rt+2 Rt+3 Rt+4 Rt+5 Rt+6 Rt+7Weekly (1) (2) (3) (4) (5) (6) (7)
Googlet 10.86∗∗∗ 4.44 3.03 0.22 −1.39 0.26 0.58(3.74) (1.50) (1.02) (0.07) (-0.47) (0.09) (0.19)[2.62] [1.32] [0.67] [0.11] [-0.63] [0.15] [0.31]
R-Squared 0.05 0.01 0.00 0.00 0.00 0.00 0.00Panel B: Same Period Bitcoin Result
Rt+1 Rt+2 Rt+3 Rt+4 Rt+5 Rt+6 Rt+7Weekly (1) (2) (3) (4) (5) (6) (7)
Googlet 2.16∗∗∗ 2.59∗∗∗ 1.09 0.73 1.25 −0.07 −1.47∗(2.74) (3.32) (1.36) (0.91) (1.56) (-0.09) (-1.84)[1.67] [2.08] [0.77] [0.51] [1.30] [-0.06] [-1.21]
R-Squared 0.06 0.04 0.01 0.00 0.01 0.00 0.01
Table 24 reports the results for Ethereum. For weekly returns, the Google search proxy statisticallysignificantly predicts 1-week, 3-week, and 6-week ahead returns. A one-standard-deviation increase in thisweek’s searches leads to increases in weekly returns of 4.36 percent, 3.45 percent, and 3.65 percent at the1-week, 3-week and 6-week ahead returns. The results for Bitcoin for the same period are comparable tothose for other samples and to those for Ripple.
26

Table 24: Google Searches – Ethereum
Google search data for the word “Ethereum” is minus the average of past four weeks and normalized.Panel A: Ethereum
Rt+1 Rt+2 Rt+3 Rt+4 Rt+5 Rt+6 Rt+7Weekly (1) (2) (3) (4) (5) (6) (7)
Googlet 4.36∗∗ 1.92 3.45∗ 2.29 0.86 3.65∗ 0.95(2.36) (1.02) (1.84) (1.22) (0.46) (1.96) (0.50)[2.54] [0.75] [1.88] [1.21] [0.39] [1.66] [0.59]
R-Squared 0.04 0.01 0.02 0.01 0.00 0.03 0.00Panel B: Same Period Bitcoin Result
Rt+1 Rt+2 Rt+3 Rt+4 Rt+5 Rt+6 Rt+7Weekly (1) (2) (3) (4) (5) (6) (7)
Googlet 2.28∗∗ 3.03∗∗∗ 1.31 0.88 1.47 −0.39 −2.22(2.38) (3.22) (1.35) (0.90) (1.52) (-0.40) (-2.29)[1.32] [1.95] [0.67] [0.56] [1.07] [-0.24] [-1.27]
R-Squared 0.04 0.07 0.01 0.01 0.02 0.00 0.03
We are also interested in the question of whether past returns are associated with increases in investorattention. We regress this week’s deviation in the Google searches on the contemporaneous and the previousfour weeks Bitcoin returns. Table 25 documents the results. We find that the deviations in Google searchesare significantly associated with the contemporaneous and previous weeks Bitcoin returns.
Table 25: Google Searches and Past Returns
Weekly Googlet Googlet Googlet Googlet Googlet(1) (2) (3) (4) (5)
Rt 0.01∗∗∗ 0.01∗∗∗ 0.01∗∗∗ 0.01∗∗∗ 0.01∗∗∗(3.64) (2.91) (2.73) (2.94) (2.93)
Rt−1 0.01∗∗∗ 0.01∗∗∗ 0.01∗∗∗ 0.01∗∗∗(4.04) (3.90) (4.12) (4.17)
Rt−2 0.00 0.00 0.00(0.63) (0.82) (0.93)
Rt−3 −0.00 −0.00(-1.59) (-1.50)
Rt−4 −0.00(-0.68)
R-Squared 0.03 0.07 0.07 0.08 0.098
27

Table 26: Twitter
Twitter post count for “Bitcoin” minus the average of previous four weeks, normalized.Weekly Rt+1 Rt+2 Rt+3 Rt+4 Rt+5 Rt+6 Rt+7
(1) (2) (3) (4) (5) (6) (7)
Twittert 2.50∗∗∗ 0.56 1.91∗∗ 0.75 −0.51 −0.37 −1.42∗(2.96) (0.56) (2.33) (0.91) (-0.62) (-0.45) (-1.71)[4.07] [0.38] [2.22] [0.74] [-0.46] [-0.44] [-2.83]
R-Squared 0.02 0.00 0.01 0.00 0.00 0.00 0.01
Table 27: Twitter by Groups
Weekly Level (Percentage)Rank Twitter Rt+1 T-Statistics Sharpe Rt+2 T-Statistics SharpeLow -0.80 -1.20 -1.07 -0.12 -0.39 -0.34 -0.042 -0.10 0.96 0.71 0.08 2.39∗∗ 2.07 0.243 -0.04 6.72∗∗ 2.42 0.28 4.87∗∗ 2.03 0.234 0.05 6.83∗∗∗ 4.17 0.48 8.37∗∗∗ 3.66 0.425 0.91 5.33∗∗ 2.60 0.30 2.15 1.25 0.14Difference 6.53 2.54Rank Twitter Rt+3 T-Statistics Sharpe Rt+4 T-Statistics SharpeLow -0.80 -1.24 -0.95 -0.11 -0.29 -0.25 -0.032 -0.10 1.92 1.20 0.14 3.15∗ 1.78 0.203 -0.04 6.92∗∗∗ 2.90 0.33 6.79∗∗ 2.54 0.294 0.05 6.52∗∗∗ 3.19 0.36 5.53∗∗∗ 3.47 0.405 0.91 3.05∗ 1.97 0.23 2.28 1.42 0.16Difference 4.29 2.57
4.3 Negative Investor Attention
We have shown that unconditionally investor attention positively predicts cryptocurrency returns. Inthis section, we further investigate whether negative investor attention predicts cryptocurrency returns. Weconstruct a ratio between Google searches for the phrase “Bitcoin hack” and searches for the word “Bitcoin”to proxy for negative investor attention. Table 28 shows the results of the predictive regressions. The rationegatively and significantly predicts 1-5 week Bitcoin retruns. For example, a one-standard-devation increaseof the ratio leads to a 2.75 percent decrease of Bitcoin returns in next week.
28

Table 28: Bitcoin Hack
The ratio between google searches for the phrase “Bitcoin hack” and searches for the word “Bitcoin”, nor-malized.
Weekly Rt+1 Rt+2 Rt+3 Rt+4 Rt+5 Rt+6 Rt+7(1) (2) (3) (4) (5) (6) (7)
Hackt −2.75∗∗∗ −2.26∗∗∗ −1.86∗∗ −1.54∗ −2.18∗∗ -1.18 -0.96(-3.30) (-2.70) (-2.20) (-1.82) (-2.58) (-1.43) (-1.16)[-3.53] [-2.52] [-2.01] [-1.85] [-2.58] [-1.38] [-0.88]
R-Squared 0.03 0.02 0.01 0.01 0.02 0.01 0.00
Table 29: Bitcoin Hack by Groups
Weekly Level (Percentage)Rank Hack Rt+1 T-Statistics Sharpe Rt+2 T-Statistics SharpeLow -1.21 8.62∗∗∗ 2.91 0.33 8.18∗∗∗ 3.17 0.362 -0.65 5.59∗∗∗ 2.69 0.30 4.23∗ 1.76 0.203 -0.11 2.36 1.54 0.18 2.16 1.26 0.154 0.49 1.14 1.28 0.14 3.09∗∗∗ 3.13 0.355 1.54 1.09 1.11 0.13 1.09 1.11 0.13Difference -7.52 -7.09Rank Hack Rt+3 T-Statistics Sharpe Rt+4 T-Statistics SharpeLow -1.21 7.64∗∗∗ 2.95 0.33 6.08∗∗ 2.10 0.242 -0.65 3.49 1.60 0.18 4.85∗∗ 2.55 0.293 -0.11 4.00∗ 1.93 0.22 4.00∗∗ 2.19 0.254 0.49 1.86∗ 1.76 0.20 1.86 1.43 0.165 1.54 1.70∗ 1.85 0.21 1.75∗ 1.86 0.21Difference -5.95 -4.33
4.4 Crypto Price-to-“Dividend” and Crypto Volatility
Obviously, there is no direct measure of dividend for the cryptocurrencies. However, in its essence, theprice-to-dividend ratio is a measure of the gap between the market value and the fundamental value of anasset. The market value of cryptocurrency is just the observed price. We proxy the fundamental value byusing the number of Bitcoin Wallet users. We regress the Bitcoin returns on the lagged Bitcoin price-to-“dividend” ratio and the results are reported in Table 30. Overall, there is very weak relation between thefuture Bitcoin returns and the current price-to-”dividend” ratio. For Ripple and Ethereum, the data on thenumber of users is not immediately available.
Table 30: Bitcoin Market Price-to-“Dividend” Ratio
Predictive regression at the daily levelBitcoin Rt+1 Rt+2 Rt+3 Rt+4 Rt+5 Rt+6 Rt+7
(1) (2) (3) (4) (5) (6) (7)
Bitcoin PD 0.13 0.05 −0.13 −0.12 0.05 0.09 0.05(1.34) (0.49) (-1.36) (-1.25) (0.57) (0.99) (0.55)
R-Squared 0.00 0.00 0.00 0.00 0.00 0.00 0.00
29

We also investigate whether realized volatility predicts cryptocurrency returns. We regress cryptocurrencyreturns for the past month realized return volatility and the results are reported in Table 31. Overall, thereis very weak relation between future cryptocurrency returns and the realized volatility for Bitcoin andEthereum. For Ripple, there is some evidence that realized volatility positively predicts 4-day, 5-day, and7-day ahead Ripple returns.
Table 31: Market Volatility as Predictor
Predictive regressions are at the daily level.
Bitcoin Rt+1 Rt+2 Rt+3 Rt+4 Rt+5 Rt+6 Rt+7(1) (2) (3) (4) (5) (6) (7)
Bitcoin Volatility 1.27 0.79 0.57 0.03 0.02 −0.21 −0.15(1.52) (0.95) (0.69) (0.03) (0.03) (-0.25) (-0.18)[0.79] [0.50] [0.38] [0.02] [0.01] [-0.18] [-0.11]
R-Squared 0.00 0.00 0.00 0.00 0.00 0.00 0.00Ripple Rt+1 Rt+2 Rt+3 Rt+4 Rt+5 Rt+6 Rt+7
(1) (2) (3) (4) (5) (6) (7)
Ripple Volatility 0.62 0.97 0.87 1.14∗ 1.05∗ 0.99 1.22∗∗(1.03) (1.61) (1.45) (1.90) (1.75) (1.65) (2.03)[0.61] [1.43] [1.37] [1.37] [1.13] [1.13] [1.63]
R-Squared 0.00 0.00 0.00 0.00 0.00 0.00 0.00Ethereum Rt+1 Rt+2 Rt+3 Rt+4 Rt+5 Rt+6 Rt+7
(1) (2) (3) (4) (5) (6) (7)
Ethereum Volatility 1.89 1.51 0.58 0.20 −0.08 0.22 −0.30(0.94) (0.75) (0.29) (0.10) (-0.04) (0.11) (-0.15)[0.89] [0.76] [0.26] [0.09] [-0.04] [0.14] [-0.15]
R-Squared 0.00 0.00 0.00 0.00 0.00 0.00 0.00
4.5 Supply Factors
We now construct proxies for the supply factors. To the first approximation, mining a cryptocurrencyrequires two inputs: electricity and computer power. For electricity, we consider three proxies: (1) the value-weighted stock returns of the U.S.-listed electricity industries, (2) the value-weighted stock returns of theChina-listed electricity industries, and (3) the Sinopec (SNP) stock returns. The reason why we include theChina proxies is because electricity supply is location specific and because China is considered to have thelargest coin mining operation among all countries.13 For proxies of computer power, we consider the stockreturns of the companies that are major manufacturers of either GPU mining chips (Nvidia Corporationand Advanced Micro Devices, Inc) or ASIC mining chips (Taiwan Semiconductor Manufacturing Company,Limited and Advanced Semiconductor Engineering, Inc).14 Table 32 presents the results for the three
13See http://www.businessinsider.com/why-china-mines-more-bitcoin-than-any-other-country-2017-12.14See https://www.benzinga.com/markets/cryptocurrency/18/02/11117719/the-companies-behind-the-chips-that-power-
cryptocurrency-minin.
30
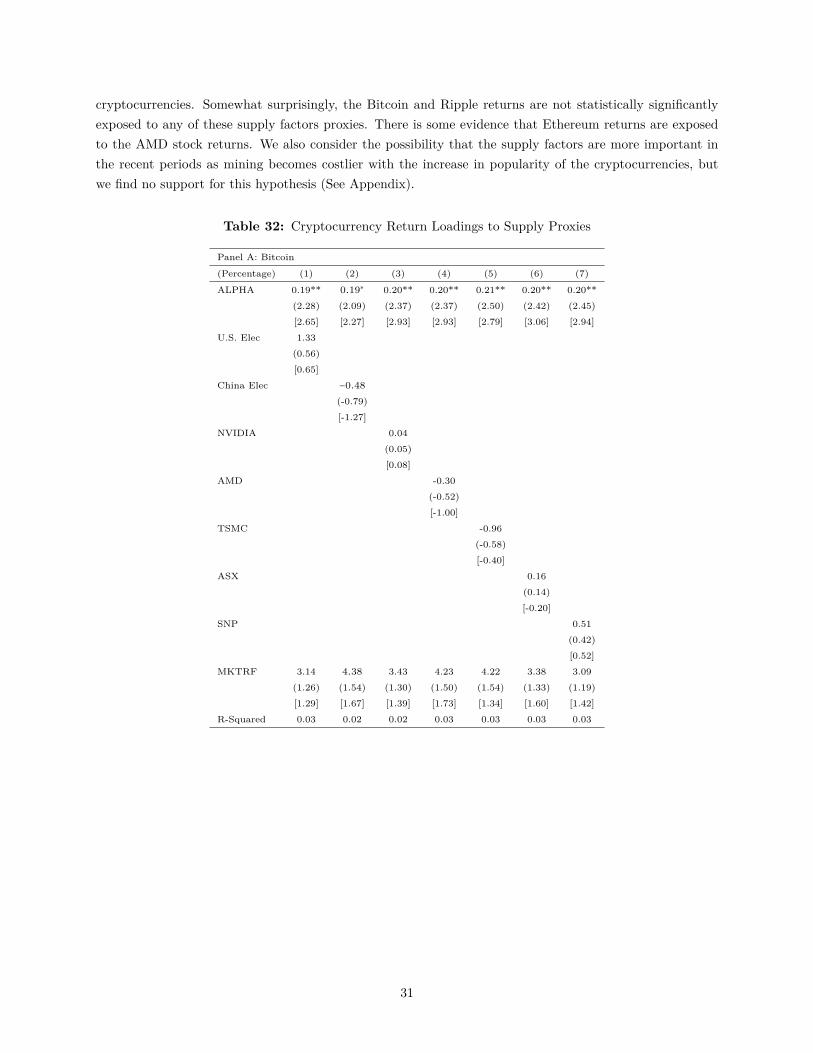
cryptocurrencies. Somewhat surprisingly, the Bitcoin and Ripple returns are not statistically significantlyexposed to any of these supply factors proxies. There is some evidence that Ethereum returns are exposedto the AMD stock returns. We also consider the possibility that the supply factors are more important inthe recent periods as mining becomes costlier with the increase in popularity of the cryptocurrencies, butwe find no support for this hypothesis (See Appendix).
Table 32: Cryptocurrency Return Loadings to Supply Proxies
Panel A: Bitcoin
(Percentage) (1) (2) (3) (4) (5) (6) (7)
ALPHA 0.19** 0.19∗ 0.20** 0.20** 0.21** 0.20** 0.20**(2.28) (2.09) (2.37) (2.37) (2.50) (2.42) (2.45)[2.65] [2.27] [2.93] [2.93] [2.79] [3.06] [2.94]
U.S. Elec 1.33(0.56)[0.65]
China Elec −0.48(-0.79)[-1.27]
NVIDIA 0.04(0.05)[0.08]
AMD -0.30(-0.52)[-1.00]
TSMC -0.96(-0.58)[-0.40]
ASX 0.16(0.14)[-0.20]
SNP 0.51(0.42)[0.52]
MKTRF 3.14 4.38 3.43 4.23 4.22 3.38 3.09(1.26) (1.54) (1.30) (1.50) (1.54) (1.33) (1.19)[1.29] [1.67] [1.39] [1.73] [1.34] [1.60] [1.42]
R-Squared 0.03 0.02 0.02 0.03 0.03 0.03 0.03
31

Panel B: Ripple Panel C: Ethereum
(Percentage) (1) (2) (3) (4) (5) (6) (7) (Percentage) (1) (2) (3) (4) (5) (6) (7)
ALPHA 0.47∗∗ 0.12 0.41 0.41∗ 0.44∗ 0.41∗ 0.43∗ ALPHA 0.32∗∗ 0.12 0.36∗∗ 0.44∗∗∗ 0.30∗∗ 0.35∗∗ 0.39∗∗
(2.11) (0.78) (1.68) (1.84) (1.91) (1.84) (1.91) (2.23) (0.73) (2.11) (3.15) (2.08) (2.46) (2.76)[2.19] [0.95] [1.69] [2.19] [2.24] [2.28] [2.29] [2.38] [0.88] [2.22] [3.32] [2.41] [2.80] [2.64]
U.S. Elec −9.27 U.S. Elec 5.09(-1.60) (1.37)[-1.17] [1.38]
China Elec 0.23 China Elec −4.12(0.13) (-1.51)[0.25] [-1.17]
NVIDIA −0.02 NVIDIA −0.00(-0.01) (-0.00)[-0.01] [-0.00]
AMD −1.76 AMD −1.80∗
(-1.10) (-1.96)[-1.62] [-2.00]
TSMC −2.84 TSMC 3.49(-0.64) (1.36)[-0.62] [1.56]
ASX −1.20 ASX 1.77(-0.36) (0.80)[-0.73] [0.84]
SNP 3.00 SNP 2.88(0.86) (1.18)[1.38] [1.04]
MKTRF 4.08 2.28 1.45 6.20 3.70 2.18 −2.33 MKTRF −1.46 9.52 −0.36 5.09 −2.45 −1.07 −4.15(0.55) (0.44) (0.18) (0.73) (0.45) (0.28) (-0.27) (-0.33) (1.31) (-0.08) (1.01) (-0.53) (-0.23) (-0.76)[0.77] [0.79] [0.23] [1.40] [0.56] [0.52] [-0.55] [-0.40] [1.56] [-0.08] [1.01] [-0.58] [-0.24] [-0.82]
R-Squared 0.05 0.01 0.00 0.02 0.01 0.00 0.02 R-Squared 0.07 0.14 0.00 0.13 0.07 0.02 0.05
32

5 Industry Exposures to Bitcoin Risk
In this section, we first estimate the exposures of the Fama French 30 industry groups to the cryptocur-rency risk. Second, we continue with a finer industry classification and investigate the cryptocurrency riskexposures of 354 SIC industries in the US and 137 CIC industries in China. These exposures which can bethought of as an index indicating the potential winners and losers from the current and future developmentof blockchain. Throughout this section, t-statistics in parentheses and brackets are based on regular andbootstrapped standard errors.
5.1 Estimating Broad Industry Exposures
Table 33: Industry Exposure to Bitcoin Return
x100 food beer smoke games books hshld clths hlth chems txtlsBITCOIN 0.56 0.52 -0.27 -0.03 -0.61 0.71* 0.69 0.64* -0.40 0.20
(1.63) (1.23) (-0.39) (-0.06) (-1.35) (1.87) (1.16) (1.81) (-1.06) (0.36)[1.23] [0.98] [-0.38] [-0.08] [-1.49] [2.29] [1.17] [2.03] [-1.08] [0.51]
MKTRF 0.59*** 0.39*** 0.59*** 1.36*** 1.26*** 0.56*** 0.74*** 0.84*** 1.39*** 1.20***(8.04) (4.32) (3.96) (10.62) (12.85) (6.85) (5.79) (11.07) (17.01) (10.09)[8.60] [4.41] [4.38] [11.52] [14.35] [5.65] [4.97] [9.15] [14.33] [9.29]
ALPHA 0.06 0.53* 0.59 0.11 -0.39 -0.12 0.25 0.21 -0.33 0.11(0.24) (1.69) (1.14) (0.25) (-1.16) (-0.42) (0.56) (0.81) (-1.15) (0.28)[0.22] [1.52] [1.14] [0.20] [-1.31] [-0.44] [0.58] [0.65] [-1.01] [0.26]
R-Squared 0.46 0.21 0.16 0.58 0.66 0.40 0.32 0.61 0.77 0.55
x100 cnstr steel fabpr elceq autos carry mines coal oil utilBITCOIN -0.62 -0.67 -0.95** -0.61 -0.77 0.26 -1.65* -1.53 -0.45 0.18
(-1.39) (-0.95) (-2.02) (-1.46) (-1.42) (0.72) (-1.69) (-0.85) (-0.71) (0.37)[-1.50] [-1.72] [-2.34] [-1.43] [-1.51] [1.02] [-2.10] [-1.87] [-1.18] [0.30]
MKTRF 1.47*** 1.64*** 1.46*** 1.31*** 1.50*** 1.03*** 1.28*** 1.72*** 1.22*** 0.31***(15.37) (10.75) (14.47) (14.48) (12.73) (12.97) (6.03) (4.43) (9.02) (3.04)[12.17] [12.00] [11.09] [14.75] [9.62] [12.12] [5.92] [3.54] [11.11] [3.12]
ALPHA -0.37 -1.17** -0.35 -0.65** -0.73* 0.34 -1.06 -3.19** -0.76 0.48(-1.11) (-2.22) (-1.00) (-2.08) (-1.80) (1.23) (-1.44) (-2.37) (-1.63) (1.35)[-0.99] [-2.49] [-0.81] [-2.13] [-1.79] [1.17] [-1.24] [-2.04] [-1.47] [1.48]
R-Squared 0.74 0.58 0.71 0.71 0.66 0.67 0.30 0.19 0.49 0.10
x100 telcm servs buseq paper trans whlsl rtail meals fin otherBITCOIN 0.19 -0.18 -0.05 0.22 0.29 0.14 0.18 0.30 -0.11 -0.16
(0.51) (-0.61) (-0.13) (0.84) (0.70) (0.46) (0.54) (0.89) (-0.34) (-0.50)[0.43] [-1.08] [-0.19] [0.81] [1.05] [0.66] [0.62] [0.87] [-0.28] [-0.87]
MKTRF 0.85*** 1.02*** 1.10*** 1.08*** 1.00*** 1.02*** 0.85*** 0.69*** 1.24*** 0.86***(10.71) (16.15) (13.08) (18.76) (10.98) (15.93) (11.98) (9.46) (17.65) (12.54)[10.88] [16.31] [14.15] [25.57] [9.79] [14.14] [13.24] [9.79] [21.63] [13.75]
ALPHA 0.00 0.27 0.07 -0.18 0.03 -0.16 0.37 0.44* -0.06 0.10(0.01) (1.26) (0.26) (-0.91) (0.09) (-0.73) (1.50) (1.75) (-0.23) (0.43)[-0.07] [1.16] [0.18] [-0.88] [0.03] [-0.69] [1.20] [1.49] [-0.28] [0.36]
R-Squared 0.58 0.76 0.67 0.81 0.60 0.76 0.64 0.53 0.79 0.65
Table 33 reports the Fama French 30 industries’ exposures on Bitcoin returns controlling for the excessmarket returns. Specifically, we regress each industry’s stock returns on the contemporaneous Bitcoin returns
33

and the excess stock market returns. The Consumer Goods (Hshld) and Healthcare (Hlth) industries arepositively and statistically significantly affected while the Fabricated Products (FabPr) and Metal Mining(Mines) industries are negatively and statistically significantly affected. These point estimates state thata one-standard-deviation increase in Bitcoin returns is associated with the 0.49 percent increase in thereturn of the Consumer Goods industry, 0.44 percent increase in the return of the Healthcare industry, 0.66percent decrease in the return of the Fabricated Products industry, and 1.15 percent decrease in the returnof the Metal Mining. Surprisingly, the often mentioned Finance, Retail, and Wholesale industries have nostatistically significant exposure, and the magnitude of the point estimates is very small.
Table 34: Industry Exposure to Ripple Returns
Panel A: Ripple Return
x100 food beer smoke games books hshld clths hlth chems txtlsRIPPLE -0.06 0.26 0.13 -0.02 -0.24 0.30 0.41 -0.07 -0.14 -0.03
(-0.28) (1.01) (0.30) (-0.07) (-0.90) (1.30) (1.29) (-0.33) (-0.60) (-0.09)[-0.45] [0.86] [0.24] [-0.06] [-1.00] [1.33] [1.31] [-0.43] [-0.53] [-0.07]
MKTRF 0.70*** 0.54*** 0.59*** 1.19*** 1.38*** 0.62*** 0.64*** 0.99*** 1.31*** 1.08***(6.59) (4.26) (2.77) (6.79) (10.50) (5.33) (4.10) (8.99) (11.42) (6.55)[5.91] [3.93] [2.66] [5.90] [10.76] [4.04] [5.29] [7.47] [12.26] [6.58]
ALPHA -0.09 0.31 0.19 0.49 -0.78* -0.41 0.19 -0.01 -0.20 -0.20(-0.27) (0.78) (0.28) (0.88) (-1.89) (-1.10) (0.39) (-0.03) (-0.56) (-0.39)[-0.38] [0.65] [0.25] [0.85] [-2.60] [-1.14] [0.29] [-0.09] [-0.63] [-0.44]
R-Squared 0.4456 0.2653 0.1262 0.4606 0.6718 0.3614 0.2588 0.5993 0.7074 0.4427
x100 cnstr steel fabpr elceq autos carry mines coal oil utilRIPPLE -0.01 0.32 0.06 0.14 -0.14 0.20 0.12 0.49 -0.06 -0.50*
(-0.06) (0.69) (0.22) (0.65) (-0.54) (0.87) (0.20) (0.42) (-0.13) (-1.69)[-0.06] [0.38] [0.21] [0.74] [-0.37] [0.99] [0.12] [0.38] [-0.10] [-1.84]
MKTRF 1.32*** 1.50*** 1.26*** 1.24*** 1.33*** 1.12*** 1.04*** 1.29** 1.07*** 0.31**(10.43) (6.51) (9.33) (11.69) (10.61) (9.80) (3.48) (2.20) (5.03) (2.13)[7.88] [6.15] [7.97] [15.43] [9.68] [9.40] [4.56] [1.56] [5.25] [1.81]
ALPHA -0.40 -0.70 -0.22 -0.80** -0.73* 0.28 -0.39 -2.39 -0.88 0.50(-1.01) (-0.96) (-0.53) (-2.41) (-1.85) (0.77) (-0.41) (-1.30) (-1.31) (1.10)[-1.00] [-1.14] [-0.60] [-2.60] [-1.62] [0.73] [-0.43] [-1.30] [-1.45] [1.05]
R-Squared 0.6683 0.4441 0.6178 0.7183 0.6758 0.6435 0.1841 0.0860 0.3191 0.1177
x100 telcm servs buseq paper trans whlsl rtail meals fin otherRIPPLE 0.12 0.02 -0.05 -0.01 0.26 0.26 0.24 0.35* -0.06 -0.11
(0.52) (0.12) (-0.24) (-0.05) (1.01) (1.39) (1.13) (1.86) (-0.31) (-0.61)[0.37] [0.09] [-0.23] [-0.05] [1.04] [0.92] [0.73] [0.97] [-0.23] [-0.60]
MKTRF 0.95*** 1.01*** 1.08*** 1.13*** 1.05*** 1.06*** 1.01*** 0.77*** 1.17*** 0.88***(8.60) (10.40) (9.75) (13.65) (8.24) (11.39) (9.61) (8.18) (11.23) (9.43)[8.77] [9.55] [11.96] [18.60] [6.28] [10.42] [11.12] [8.27] [11.09] [10.06]
ALPHA -0.47 0.43 0.46 -0.27 0.02 -0.47 0.03 0.27 0.08 -0.11(-1.36) (1.42) (1.31) (-1.03) (0.05) (-1.60) (0.09) (0.91) (0.23) (-0.36)[-1.33] [1.58] [1.19] [-1.31] [-0.01] [-1.81] [0.02] [0.78] [0.19] [-0.50]
R-Squared 0.5801 0.6675 0.6379 0.7753 0.5628 0.7109 0.6362 0.5692 0.7003 0.6222
34

Panel B: Same Period Bitcoin Return
x100 food beer smoke games books hshld clths hlth chems txtlsBITCOIN -0.01 0.16 -0.97 -0.35 -1.06* 0.57 0.54 0.12 -0.48 -0.05
(-0.01) (0.28) (-1.02) (-0.44) (-1.83) (1.08) (0.76) (0.24) (-0.94) (-0.06)[-0.01] [0.11] [-0.75] [-0.23] [-0.60] [0.64] [0.30] [0.14] [-0.56] [-0.03]
MKTRF 0.70*** 0.54*** 0.62*** 1.20*** 1.41*** 0.61*** 0.63*** 0.98*** 1.33*** 1.08***(6.51) (4.17) (2.92) (6.79) (10.87) (5.13) (3.95) (8.84) (11.48) (6.49)[5.77] [3.96] [2.83] [5.74] [10.56] [3.85] [4.91] [7.13] [12.17] [6.25]
ALPHA -0.11 0.39 0.36 0.52 -0.73* -0.37 0.27 -0.05 -0.19 -0.21(-0.34) (0.97) (0.55) (0.96) (-1.83) (-1.00) (0.55) (-0.16) (-0.54) (-0.41)[-0.46] [0.79] [0.53] [0.88] [-2.77] [-1.06] [0.44] [-0.23] [-0.58] [-0.46]
R-Squared 0.4448 0.2525 0.1413 0.4625 0.6863 0.3556 0.2442 0.5989 0.7102 0.4426
x100 cnstr steel fabpr elceq autos carry mines coal oil utilBITCOIN -0.12 -0.48 -0.59 -0.15 -0.43 0.33 -1.50 -1.05 -0.47 -0.57
(-0.21) (-0.46) (-0.99) (-0.31) (-0.77) (0.64) (-1.13) (-0.40) (-0.49) (-0.85)[-0.10] [-0.29] [-0.60] [-0.12] [-0.39] [0.38] [-0.72] [-0.31] [-0.29] [-0.55]
MKTRF 1.33*** 1.52*** 1.28*** 1.25*** 1.35*** 1.12*** 1.09*** 1.33** 1.09*** 0.32**(10.35) (6.51) (9.46) (11.60) (10.62) (9.60) (3.65) (2.25) (5.06) (2.14)[7.92] [6.11] [8.21] [15.32] [9.67] [9.29] [4.72] [1.62] [4.91] [1.86]
ALPHA -0.39 -0.52 -0.13 -0.73** -0.73* 0.31 -0.15 -2.08 -0.84 0.39(-0.99) (-0.72) (-0.30) (-2.21) (-1.86) (0.86) (-0.16) (-1.14) (-1.26) (0.85)[-0.95] [-0.89] [-0.37] [-2.28] [-1.64] [0.81] [-0.19] [-1.13] [-1.36] [0.78]
R-Squared 0.6686 0.4414 0.6242 0.7166 0.6776 0.6411 0.2024 0.0858 0.3220 0.0831
x100 telcm servs buseq paper trans whlsl rtail meals fin otherBITCOIN -0.37 0.05 0.19 0.17 0.46 0.10 0.03 0.36 0.36 -0.32
(-0.75) (0.12) (0.38) (0.45) (0.81) (0.24) (0.07) (0.84) (0.78) (-0.76)[-0.51] [0.06] [0.17] [0.27] [0.71] [0.10] [0.05] [0.35] [0.40] [-0.40]
MKTRF 0.96*** 1.01*** 1.08*** 1.13*** 1.04*** 1.06*** 1.02*** 0.76*** 1.15*** 0.89***(8.66) (10.28) (9.60) (13.46) (8.04) (11.09) (9.43) (7.83) (11.05) (9.44)[9.02] [9.24] [11.61] [18.37] [6.18] [9.95] [10.98] [8.48] [11.00] [9.79]
ALPHA -0.38 0.43 0.41 -0.29 0.05 -0.39 0.11 0.35 0.01 -0.11(-1.11) (1.44) (1.20) (-1.14) (0.14) (-1.31) (0.34) (1.17) (0.02) (-0.37)[-1.14] [1.55] [1.11] [-1.46] [0.07] [-1.62] [0.29] [1.10] [-0.07] [-0.51]
R-Squared 0.5824 0.6675 0.6385 0.7762 0.5598 0.7010 0.6277 0.5474 0.7031 0.6237
Table 34 reports the Fama French 30 industries’ exposures on the Ripple returns controlling for the excessmarket returns. The Restaurant, Hotels, Motels (meals) industry is positively and statistically significantlyaffected while the Utility (util) industry is negatively and statistically significantly affected. We report theFama French 30 industry exposures to Bitcoin returns for the same time period as well. The only statisticallysignificant point estimate comes from the Printing and Publishing (books, negative) industry. Although thepoint estimates are not significant, the directions of the estimates are similar to those in the full sample. Forexample, Consumer Goods and Healthcare industries are positively exposed while Fabricated Products andMetal Mining industries are negatively exposed.
Table 35 reports the Fama French 30 industries’ exposures on Ethereum return controlling for the excessmarket returns. The Restaurant, Hotels, Motels (meals) industry is positively and statistically significantlyaffected while the Banking, Insurance, Real Estate, Trading (fin) industry is negatively and statisticallysignificantly affected. We report the Fama French 30 industry exposures to Bitcoin returns for the sametime period as well. The statistically significant point estimates are the Beer and Liquor (beer, positive)
35

and the Restaurant, Hotels, Motels (meals, positive) industries. Again, the signs of the point estimates aresimilar to those of the full sample.
Table 35: Industry Exposure to Ethereum Returns
Panel A: Ethereum Return
x100 food beer smoke games books hshld clths hlth chems txtlsETHEREUM 0.62 0.69 1.74 1.36 -0.61 0.72 0.23 0.05 0.13 0.69
(1.02) (0.86) (1.39) (1.34) (-0.81) (1.00) (0.25) (0.08) (0.19) (0.81)[1.54) [0.85) [1.31) [1.48) [-1.05) [1.06) [0.42) [0.13) [0.15) [1.11)
MKTRF 0.51*** 0.44** 0.34 1.32*** 1.35*** 0.47*** 0.47** 1.11*** 1.43*** 0.95***(3.79) (2.46) (1.22) (5.95) (8.14) (2.97) (2.29) (8.08) (9.12) (5.09)[3.40) [2.06) [1.00) [6.35) [7.88) [2.48) [2.74) [8.00) [7.15) [6.54)
ALPHA -0.42 0.06 -0.43 0.28 -0.83 -0.49 -0.03 -0.79 -0.17 -1.38**(-0.90) (0.10) (-0.45) (0.36) (-1.44) (-0.88) (-0.05) (-1.64) (-0.32) (-2.11)[-1.27) [0.04) [-0.65) [0.30) [-1.61) [-1.04) [-0.13) [-1.67) [-0.62) [-2.23)
R-Squared 0.3491 0.1919 0.1094 0.5626 0.6884 0.2560 0.1531 0.6869 0.7367 0.4767
x100 cnstr steel fabpr elceq autos carry mines coal oil utilETHEREUM -0.37 -0.92 0.17 -0.09 -0.33 -0.67 -0.28 0.10 -1.48 1.25
(-0.45) (-0.62) (0.21) (-0.14) (-0.43) (-0.99) (-0.16) (0.03) (-1.22) (1.52)[-0.47) [-0.56) [0.25) [-0.15) [-0.35) [-0.96) [-0.17) [0.04) [-1.62) [1.71)
MKTRF 1.22*** 1.64*** 1.25*** 1.27*** 1.33*** 1.17*** 1.00** 0.72 1.19*** 0.21(6.79) (5.06) (7.20) (8.67) (7.93) (7.85) (2.72) (0.91) (4.47) (1.15)[5.43) [4.82) [6.18) [10.78) [7.14) [8.74) [3.61) [0.55) [4.95) [1.18)
ALPHA 0.01 0.33 0.45 -0.63 -0.65 0.95* 0.79 0.64 0.16 0.01(0.01) (0.29) (0.74) (-1.23) (-1.11) (1.82) (0.61) (0.23) (0.17) (0.01)[-0.06) [0.35) [0.68) [-1.51) [-1.16) [1.92) [0.58) [0.23) [0.13) [-0.06)
R-Squared 0.6057 0.4612 0.6358 0.7155 0.6770 0.6730 0.1980 0.0273 0.4097 0.1154
x100 telcm servs buseq paper trans whlsl rtail meals fin otherETHEREUM 0.57 0.43 0.75 0.72 0.14 0.13 0.52 1.67*** -1.76*** -0.12
(0.78) (0.71) (1.03) (1.43) (0.18) (0.20) (0.89) (2.94) (-2.95) (-0.22)[0.94) [0.89) [1.45) [1.64) [0.14) [0.20) [1.68) [3.11) [-4.48) [-0.30)
MKTRF 0.91*** 1.03*** 1.06*** 1.09*** 1.08*** 1.08*** 0.95*** 0.68*** 1.22*** 0.82***(5.67) (7.81) (6.58) (9.80) (5.93) (7.49) (7.35) (5.45) (9.28) (6.87)[6.25) [8.86) [9.79) [12.95) [5.70) [7.58) [7.19) [6.25) [9.85) [9.06)
ALPHA -0.86 0.41 0.24 -0.54 -0.08 -0.66 -0.06 -0.18 0.64 -0.12(-1.54) (0.89) (0.42) (-1.39) (-0.12) (-1.30) (-0.13) (-0.42) (1.40) (-0.29)[-1.71) [0.82) [0.38) [-1.63) [-0.21) [-1.36) [-0.34) [-0.64) [1.36) [-0.46)
R-Squared 0.5282 0.6761 0.6034 0.7705 0.5425 0.6539 0.6511 0.5769 0.7528 0.6115
36

Panel B: Same Period Bitcoin Return
x100 food beer smoke games books hshld clths hlth chems txtlsBITCOIN 2.02 3.89* 2.74 -4.23 -3.32 1.36 -2.18 0.08 0.56 -1.03
(1.18) (1.77) (0.76) (-1.50) (-1.61) (0.67) (-0.83) (0.05) (0.28) (-0.43)[1.17) [1.84) [0.73) [-2.12) [-1.37) [0.54) [-0.87) [0.04) [0.25) [-0.42)
MKTRF 0.49*** 0.39** 0.32 1.41*** 1.39*** 0.46*** 0.51** 1.11*** 1.43*** 0.98***(3.59) (2.22) (1.12) (6.28) (8.50) (2.83) (2.46) (7.94) (8.93) (5.11)[3.09) [1.72) [0.90) [6.84) [8.81) [2.22) [3.08) [7.38) [6.59) [5.62)
ALPHA -0.48 -0.20 -0.22 1.23 -0.62 -0.43 0.31 -0.79 -0.20 -1.04(-1.00) (-0.32) (-0.22) (1.56) (-1.08) (-0.75) (0.42) (-1.60) (-0.36) (-1.54)[-2.12) [-0.48) [-0.47) [1.66) [-1.38) [-0.93) [0.51) [-1.68) [-0.50) [-1.80)
R-Squared 0.3564 0.2505 0.0699 0.5685 0.7069 0.2425 0.1705 0.6869 0.7371 0.4686
x100 cnstr steel fabpr elceq autos carry mines coal oil utilBITCOIN -1.97 -1.88 -2.98 -3.20* -1.31 1.20 -1.89 -8.50 -3.48 2.75
(-0.86) (-0.45) (-1.38) (-1.80) (-0.61) (0.62) (-0.40) (-0.85) (-1.01) (1.17)[-0.78) [-0.41) [-1.13) [-1.57) [-0.68) [0.63) [-0.52) [-1.03) [-0.96) [1.26)
MKTRF 1.25*** 1.66*** 1.30*** 1.32*** 1.35*** 1.14*** 1.03** 0.86 1.22*** 0.18(6.87) (5.00) (7.58) (9.31) (7.90) (7.44) (2.75) (1.08) (4.48) (0.99)[4.98) [4.36) [6.27) [9.08) [7.05) [7.20) [3.50) [0.64) [4.41) [0.91)
ALPHA 0.13 0.28 0.87 -0.26 -0.60 0.59 0.94 1.72 0.12 0.06(0.21) (0.24) (1.44) (-0.53) (-1.00) (1.10) (0.71) (0.62) (0.13) (0.09)[0.17) [0.24) [1.47) [-0.72) [-1.12) [1.01) [0.75) [0.69) [0.09) [0.04)
R-Squared 0.6126 0.4579 0.6570 0.7429 0.6790 0.6667 0.2015 0.0500 0.4006 0.0886
x100 telcm servs buseq paper trans whlsl rtail meals fin otherBITCOIN -0.83 -0.11 2.16 1.02 0.05 -0.80 0.31 3.58** -1.65 -0.09
(-0.40) (-0.06) (1.04) (0.70) (0.02) (-0.44) (0.19) (2.11) (-0.87) (-0.06)[-0.39) [-0.08) [1.07) [0.71) [0.02) [-0.45) [0.13) [2.20) [-1.23) [-0.09)
MKTRF 0.93*** 1.04*** 1.04*** 1.09*** 1.08*** 1.10*** 0.95*** 0.65*** 1.21*** 0.82***(5.67) (7.67) (6.34) (9.36) (5.83) (7.48) (7.15) (4.84) (8.12) (6.74)[6.77) [8.58) [8.88) [12.18) [6.14) [7.22) [6.22) [6.08) [7.99) [7.95)
ALPHA -0.58 0.56 0.21 -0.44 -0.04 -0.52 0.06 -0.10 0.29 -0.15(-1.01) (1.18) (0.37) (-1.08) (-0.06) (-1.01) (0.14) (-0.21) (0.56) (-0.35)[-1.35) [1.24) [0.35) [-1.66) [-0.15) [-1.24) [0.06) [-0.34) [0.59) [-0.52)
R-Squared 0.5211 0.6706 0.6038 0.7588 0.5420 0.6556 0.6424 0.5259 0.6890 0.6109
Furthermore, we examine the exposures of different regions to Bitcoin risk. Table 36 documents ourfindings. We obtain the return series of the different regions from Kenneth French’s website. U.S., Europe,Japan, and Canada have similar exposures to Bitcoin risk – all positive but not statistically significant. Notethat the point estimate for Europe is somewhat higher and for AsiaExJapan is significantly lower than therest.
37

Table 36: Country Exposure to Bitcoin Returns
x100 U.S. Europe Japan AsiaExJapan North America
BITCOIN 0.72 0.95 0.77 0.33 0.68(1.45) (1.42) (1.40) (0.46) (1.35)
ALPHA 0.90** 0.43 0.55 0.36 0.82**(2.49) (0.89) (1.37) (0.69) (2.24)
R-squared 0.02 0.02 0.02 0.00 0.02
5.2 Potential Winners and Losers: Index of Cryptocurrency Exposures
In this section, we estimate the 354 U.S. SIC 3-digit industries’ on cryptocurrency returns and 137 ofChina’s CIC industries exposures on Bitcoin returns, controlling for the excess market returns. Specifically,we regress each industry’s stock returns on the contemporaneous Bitcoin returns and the excess stock marketreturns. Each industry’s stock return is calculated as value-weighted returns from individual publicly listedcompanies in the industry. The complete results are reported in the Appendix for conciseness. We thenstandardize the exposure estimates to have mean zero and standard deviation of one to create an index ofthe exposures of the industries to the cryptocurrencies. Figure 5 reports the histogram of the values of theindex for each cryptocurrency for the 354 US industries and Figure 6 reports the same for the 137 Chineseindustries.
Figure 5: Industry Distribution of Cryptocurrency Exposure Index
38

Figure 6: Industry Distribution of Cryptocurrency Exposure Index – China
6 Conclusion
We conclude that cryptocurrency returns have low exposures to traditional asset classes – stocks, curren-cies, and commodities. Our findings cast doubt on popular explanations that the behavior of cryptocurrenciesis driven by its functions as a stake in the future of blockhain technology similar to stocks, as a unit of accountsimilar to currencies, or as a store of value similar to precious metal commodities. At the same time, thereturns of cryptocurrency can be predicted by two factors specific to its markets – momentum and investorsattention. Our findings call into question popular explanations that supply factors such as mining costs,price-to-”dividend” ratio, or realized volatitility are useful for predicting the behavior of cryptocurrencyreturns. Finally, we document that the blockchain technology embodied in cryptocurrencies has a potentialto affect a number of important industries.
39

References
Abadi, Joseph and Markus Brunnermeier. 2018. “Blockchain economics.” Tech. rep., mimeo PrincetonUniversity.
Asness, Clifford S, Tobias J Moskowitz, and Lasse Heje Pedersen. 2013. “Value and momentum everywhere.”The Journal of Finance 68 (3):929–985.
Asvanunt, Attakrit and Scott Richardson. 2016. “The credit risk premium.” Working Paper .
Barro, Robert J. 2006. “Rare disasters and asset markets in the twentieth century.” The Quarterly Journalof Economics 121 (3):823–866.
Biais, Bruno, Christophe Bisiere, Matthieu Bouvard, and Catherine Casamatta. 2018. “The blockchain folktheorem.” Working Paper .
Bianchi, Daniele. 2017. “Cryptocurrencies as an asset class: An empirical assessment.” Working Paper .
Black, Fischer and Robert Litterman. 1990. “Asset allocation: combining investor views with market equi-librium.” Tech. rep., Discussion paper, Goldman, Sachs & Co.
———. 1992. “Global portfolio optimization.” Financial analysts journal 48 (5):28–43.
Borri, Nicola. 2018. “Conditional tail-risk in cryptocurrency markets.” Working Paper .
Borri, Nicola and Kirill Shakhnov. 2018. “Cryptomarket discounts.” Working Paper .
Campbell, John Y and Robert J Shiller. 1988. “The dividend-price ratio and expectations of future dividendsand discount factors.” The Review of Financial Studies 1 (3):195–228.
———. 1991. “Yield spreads and interest rate movements: A bird’s eye view.” The Review of EconomicStudies 58 (3):495–514.
Carhart, Mark M. 1997. “On persistence in mutual fund performance.” The Journal of finance 52 (1):57–82.
Chen, Andrew and Mihail Velikov. 2017. “Accounting for the anomaly zoo: A trading cost perspective.”Working Paper .
Chen, Andrew Y and Tom Zimmermann. 2018. “Publication bias and the cross-section of stock returns.”Working Paper .
Chiu, Jonathan and Thorsten V Koeppl. 2017. “The economics of cryptocurrencies–bitcoin and beyond.”Working Paper .
Cong, Lin William and Zhiguo He. 2018. “Blockchain disruption and smart contracts.” Tech. rep., NationalBureau of Economic Research.
Cong, Lin William, Zhiguo He, and Jiasun Li. 2018. “Decentralized mining in centralized pools.” WorkingPaper .
Cong, Lin William, Ye Li, and Neng Wang. 2018. “Tokenomics: Dynamic adoption and valuation.” WorkingPaper .
40

Da, Zhi, Joseph Engelberg, and Pengjie Gao. 2011. “In search of attention.” The Journal of Finance66 (5):1461–1499.
Daniel, Kent and Tobias J Moskowitz. 2016. “Momentum crashes.” Journal of Financial Economics122 (2):221–247.
Fama, Eugene F and Kenneth R French. 1993. “Common risk factors in the returns on stocks and bonds.”Journal of financial economics 33 (1):3–56.
———. 1996. “Multifactor explanations of asset pricing anomalies.” The journal of finance 51 (1):55–84.
———. 1997. “Industry costs of equity.” Journal of financial economics 43 (2):153–193.
———. 2016a. “Choosing factors.” Working Paper .
———. 2016b. “Dissecting anomalies with a five-factor model.” The Review of Financial Studies 29 (1):69–103.
Feng, Guanhao, Stefano Giglio, and Dacheng Xiu. 2017. “Taming the factor zoo.” Working Paper .
Foley, Sean, Jonathan Karlsen, and Talis J Putninš. 2018. “Sex, drugs, and bitcoin: How much illegalactivity is financed through cryptocurrencies?” Working Paper .
Gilbert, Scott and Hio Loi. 2018. “Digital currency risk.” International Journal of Economics and Finance10 (2):108.
He, Guangliang and Robert Litterman. 1999. “The intuition behind Black-Litterman model portfolios.”Working Paper .
Hou, Kewei, Chen Xue, and Lu Zhang. 2015. “Digesting anomalies: An investment approach.” The Reviewof Financial Studies 28 (3):650–705.
Hu, Albert, Christine A Parlour, and Uday Rajan. 2018. “Cryptocurrencies: Stylized facts on a new investibleinstrument.” Working Paper .
Huberman, Gur, Jacob D Leshno, and Ciamac C Moallemi. 2017. “Monopoly without a monopolist: Aneconomic analysis of the bitcoin payment system.” Working Paper .
Jegadeesh, Narasimhan and Sheridan Titman. 1993. “Returns to buying winners and selling losers: Impli-cations for stock market efficiency.” The Journal of finance 48 (1):65–91.
Lustig, Hanno, Nikolai Roussanov, and Adrien Verdelhan. 2011. “Common risk factors in currency markets.”The Review of Financial Studies 24 (11):3731–3777.
Mai, Feng, Qing Bai, Zhe Shan, Xin Shane Wang, and Roger Chiang. 2016. “The impacts of social mediaon Bitcoin performance.” Working Paper .
Makarov, Igor and Antoinette Schoar. 2018. “Trading and arbitrage in cryptocurrency markets.” WorkingPaper .
Moskowitz, Tobias J and Mark Grinblatt. 1999. “Do industries explain momentum?” The Journal of Finance54 (4):1249–1290.
41

Moskowitz, Tobias J, Yao Hua Ooi, and Lasse Heje Pedersen. 2012. “Time series momentum.” Journal offinancial economics 104 (2):228–250.
Routledge, Bryan and Ariel Zetlin-Jones. 2018. “Currency stability using blockchain technology.” WorkingPaper .
Saleh, Fahad. 2018. “Blockchain without waste: Proof-of-stake.” Working Paper .
Schilling, Linda and Harald Uhlig. 2018. “Some simple bitcoin economics.” Tech. rep., National Bureau ofEconomic Research.
Sockin, Michael and Wei Xiong. 2018. “A model of cryptocurrencies.” Tech. rep., Working paper.
Stoffels, Jaron. 2017. “Asset pricing of cryptocurrencies and momentum based patterns.” Working Paper .
Urquhart, Andrew. 2018. “What causes the attention of bitcoin?” Working Paper .
Wang, Sha and Jean-Philippe Vergne. 2017. “Buzz factor or innovation potential: What explains cryptocur-rencies’ returns?” PloS one 12 (1):e0169556.
Weber, Warren E. 2016. “A Bitcoin standard: Lessons from the gold standard.” Tech. rep., Bank of CanadaStaff Working Paper.
Yermack, David. 2015. “Is Bitcoin a real currency? An economic appraisal.” In Handbook of digital currency.Elsevier, 31–43.
42

Appendix A: Graphs & Tables
Figure A.1: Cryptocurrency Returns
1

Figure A.2: Bitcoin Wallet Users
2

Table A.1: Additional Summary Statistics
Top 10 Extreme Gains and LossesDisasters Month Gains Miracles Month Losses
1 2013/11 173.59% 1 2011/08 -48.74%2 2011/04 150.12% 2 2011/09 -46.71%3 2013/03 102.50% 3 2011/10 -45.84%4 2011/05 91.51% 4 2014/02 -44.44%5 2011/06 61.09% 5 2018/03 -39.78%6 2011/01 55.00% 6 2013/12 -39.53%7 2017/05 54.74% 7 2015/01 -38.79%8 2017/08 50.56% 8 2018/01 -30.99%9 2011/02 50.31% 9 2013/06 -27.85%10 2013/02 49.19% 10 2014/09 -21.32%
CorrelationBitcoin
Bitcoin 1.00Stock 0.16Bond -0.04House 0.11
Bitcoin Log Return
Mean SD T-Statistics Skewness KurtosisDaily 0.37% 5.51% 3.47 -0.31 14.84Weekly 2.56% 14.99% 3.37 0.53 6.64Monthly 11.08% 36.74% 2.86 1.67 8.04
Ripple Log Return
Mean SD T-Statistics Skewness KurtosisDaily 0.25% 7.94% 1.34 2.01 29.97Weekly 1.77% 25.22% 1.12 2.88 19.63Monthly 7.62% 57.50% 1.02 1.81 6.54
Ethereum Log Return
Mean SD T-Statistics Skewness KurtosisDaily 0.50% 8.19% 1.96 -3.52 66.46Weekly 4.41% 20.64% 2.61 0.82 4.44Monthly 14.85% 48.18% 1.82 0.24 2.57
3

Table A.2: Characteristics of Predictors
Summary Statistics of Predictors(Weekly) Mean SD AR(1) AR(2) AR(4) AR(8)Google (Bitcoin) 0.00 1.00 0.66 0.31 -0.18 -0.04Google (Ripple) 0.00 1.00 0.76 0.42 -0.24 -0.18Google (Ethereum) 0.00 1.00 0.64 0.32 0.13 -0.27Twitter 0.00 1.00 0.34 0.04 -0.27 0.29Hack 0.00 1.00 0.44 0.44 0.37 0.38Price-to-“Dividend” 0.00 1.00 0.99 0.98 0.97 0.95
Stationarity Tests of PredictorsADF t-statistics Critical Values
(Weekly) 1 2 3 4 1% 5%Google (Bitcoin) -10.10 -10.67 -10.13 -7.46 -3.99 -3.43Google (Ripple) -8.17 -9.07 -9.68 -6.66 -3.99 -3.43Google (Ethereum) -5.91 -4.23 -4.82 -4.13 -4.03 -3.44Twitter -12.13 -11.37 -12.37 -10.34 -3.99 -3.43Hack -7.82 -6.28 -5.22 -4.43 -3.99 -3.43Price-to-“Dividend” -7.30 -4.46 -4.57 -3.81 -3.99 -3.43
4

Table A.3: Bitcoin Return Exposures to the Factor Zoo
(Percentage) (1) (2) (3) (4) (5) (6) (7) (8) (9) (10) (11) (12) (13) (14) (15)VARIABLES Return Return Return Return Return Return Return Return Return Return Return Return Return Return Return
mktrf 4.12 4.26 3.70 3.53 4.14 3.43 3.54 3.68 3.47 3.49 3.50 3.71 3.69 3.20 3.52(1.56) (1.57) (1.39) (1.33) (1.34) (1.28) (1.33) (1.39) (1.31) (1.32) (1.32) (1.40) (0.93) (1.16) (1.33)
abnormalaccruals 9.65(1.33)
accruals 9.95(1.06)
accrualsbm 1.30(0.46)
adexp 0.11(0.02)
announcementreturn -1.18(-0.30)
assetgrowth 1.09(0.24)
assetturnover 0.07(0.02)
bm -1.67(-0.61)
bpebm 1.76(0.31)
beta 1.05(0.51)
betasquared 1.04(0.51)
betatailrisk 2.04(0.83)
bidaskspread 2.04(0.65)
cboperprof -1.49(-0.45)
cf 0.32(0.09)
5

(Percentage) (16) (17) (18) (19) (20) (21) (22) (23) (24) (25) (26) (27) (28) (29) (30)VARIABLES Return Return Return Return Return Return Return Return Return Return Return Return Return Return Return
mktrf 3.43 3.55 3.50 3.79 3.53 3.93 4.00 3.54 3.60 3.49 3.48 3.55 3.59 3.49 3.81(1.30) (1.32) (1.31) (1.44) (1.34) (1.48) (1.52) (1.34) (1.35) (1.31) (1.31) (1.34) (1.35) (1.32) (1.44)
cash 1.72(0.58)
chassetturnover 0.23(0.03)
cheq 0.47(0.10)
chforecastaccrual -7.27(-1.08)
chinv 1.74(0.23)
chinvia -6.77(-1.09)
chnanalyst -14.72(-1.44)
chncoa 2.08(0.23)
chnwc 1.76(0.18)
chpm -1.66(-0.21)
chtax -2.27(-0.40)
changeinrecommendation -2.70(-0.46)
compositedebtissuance -1.20(-0.20)
consrecomm -2.90(-0.86)
convdebt -4.84(-0.88)
6

(Percentage) (31) (32) (33) (34) (35) (36) (37) (38) (39) (40) (41) (42) (43) (44) (45)VARIABLES Return Return Return Return Return Return Return Return Return Return Return Return Return Return Return
mktrf 3.57 3.52 4.21 3.54 3.88 3.66 3.37 3.65 3.58 3.09 3.56 2.61 3.26 4.05 3.70(1.30) (1.33) (1.34) (1.34) (1.44) (1.38) (1.25) (1.40) (1.36) (1.17) (1.35) (0.96) (1.23) (1.46) (1.39)
credratdg -0.51(-0.30)
debtissuance -0.87(-0.11)
delbreadth -2.20(-0.45)
delcoa -0.88(-0.13)
delcol -3.65(-0.62)
deldrc 2.39(0.45)
delequ 1.80(0.32)
delfinl -11.86(-1.30)
dellti 8.57(0.77)
divind -6.06(-1.11)
divinit 2.53(0.50)
divomit -6.76(-1.28)
divyield -3.32(-0.96)
dolvol -1.99(-0.61)
downforecast -3.85(-0.58)
7

(Percentage) (46) (47) (48) (49) (50) (51) (52) (53) (54) (55) (56) (57) (58) (59) (60)VARIABLES Return Return Return Return Return Return Return Return Return Return Return Return Return Return Return
mktrf 3.53 3.56 3.43 3.43 3.42 3.50 3.45 3.36 4.01 4.14 3.57 3.20 3.57 4.38 3.74(1.34) (1.35) (1.29) (1.29) (1.29) (1.33) (1.30) (1.25) (1.49) (1.34) (1.31) (1.19) (1.35) (1.64) (1.44)
ebm -4.49(-0.66)
ep -1.47(-0.30)
earnsupbig 1.88(0.43)
earningsconsistency -2.42(-0.48)
earningssurprise 2.36(0.39)
entmult -3.53(-0.80)
exchswitch 1.26(0.56)
exclexp 2.15(0.36)
fr -5.20(-0.84)
failureprobability 0.50(0.10)
firmagemom -0.12(-0.06)
forecastdispersion -1.98(-0.66)
frontier -0.52(-0.18)
gp 6.24(1.45)
gradexp -15.19*(-1.74)
8

(Percentage) (61) (62) (63) (64) (65) (66) (67) (68) (69) (70) (71) (72) (73) (74) (75)VARIABLES Return Return Return Return Return Return Return Return Return Return Return Return Return Return Return
mktrf 3.62 3.48 3.86 3.78 3.98 3.53 4.04 3.60 4.54 2.97 3.35 3.57 3.68 3.69 3.54(1.37) (1.31) (1.44) (1.42) (1.47) (1.33) (1.31) (1.16) (1.43) (1.08) (1.25) (1.35) (1.38) (1.39) (1.34)
grgmtogrsales -3.12(-0.57)
grltnoa 3.36(0.41)
grsaletogrinv 4.98(0.67)
grsaletogroverhead 3.83(0.78)
herf -3.87(-0.70)
high52 0.05(0.03)
io_shortinterest -11.03(-1.44)
idiorisk -2.58(-1.00)
illiquidity -3.36(-0.56)
indipo -2.72(-0.75)
indmom 1.54(0.49)
indretbig 0.72(0.26)
intmom 1.12(0.41)
intanbm -2.02(-0.71)
intancfp -3.50(-0.81)
9

(Percentage) (76) (77) (78) (79) (80) (81) (82) (83) (84) (85) (86) (87) (88) (89) (90)VARIABLES Return Return Return Return Return Return Return Return Return Return Return Return Return Return Return
mktrf 3.44 3.53 3.70 3.08 3.83 3.23 3.80 3.50 3.51 3.59 3.49 3.42 3.70 3.88 3.44(1.32) (1.33) (1.38) (1.18) (1.44) (1.19) (1.23) (1.32) (1.33) (1.35) (1.31) (1.29) (1.39) (1.38) (1.30)
intanep -6.79(-1.33)
intansp -0.04(-0.01)
investment -2.91(-0.34)
kz -9.78*(-1.72)
leverage -2.82(-0.92)
ms 1.83(0.52)
maxret -2.37(-0.83)
meanrankrevgrowth 1.25(0.24)
mom12m 0.86(0.42)
mom18m13m -0.74(-0.22)
mom1m -0.49(-0.18)
mom36m 1.02(0.40)
mom6m -1.48(-0.50)
mom6mjunk -0.80(-0.29)
momrev -1.30(-0.70)
10

(Percentage) (91) (92) (93) (94) (95) (96) (97) (98) (99) (100) (101) (102) (103) (104) (105)VARIABLES Return Return Return Return Return Return Return Return Return Return Return Return Return Return Return
mktrf 3.77 3.55 3.67 3.53 3.73 3.31 3.34 3.50 4.50* 2.97 3.33 4.11 3.83 2.88 3.56(1.36) (1.34) (1.37) (1.33) (1.40) (1.24) (1.25) (1.32) (1.72) (1.10) (1.25) (1.45) (1.35) (1.08) (1.37)
momseas -1.34(-0.30)
momvol -0.59(-0.35)
noa -1.46(-0.37)
netdebtfinance -1.76(-0.20)
netdebtprice -1.40(-0.51)
netequityfinance -1.92(-0.56)
netpayoutyield -1.62(-0.58)
numearnincrease -0.87(-0.13)
opleverage 9.28*(1.97)
oscore -3.90(-0.97)
operprof -2.58(-0.68)
optionvolume1 -5.14(-0.91)
optionvolume2 0.54(0.05)
orderbacklog -7.08(-1.28)
orgcap 2.99(1.53)
11

(Percentage) (106) (107) (108) (109) (110) (111) (112) (113) (114) (115) (116) (117) (118) (119) (120)VARIABLES Return Return Return Return Return Return Return Return Return Return Return Return Return Return Return
mktrf 3.18 3.55 3.58 3.47 3.59 3.48 4.17 3.20 3.54 3.08 3.18 3.60 3.45 3.45 4.42(1.20) (1.34) (1.36) (1.31) (1.39) (1.30) (1.37) (1.19) (1.34) (1.15) (1.19) (1.36) (1.31) (1.30) (1.43)
pm -3.20(-0.90)
ps -0.68(-0.27)
payoutyield -3.27(-0.64)
pctacc 2.24(0.30)
pcttotacc 14.32*(1.90)
price 0.30(0.14)
pricedelay -1.41(-0.11)
profitability -1.88(-0.72)
rd 2.85(0.89)
rdipo -5.19(-1.01)
rds 2.76(0.76)
rev6 -1.69(-0.34)
rio_bm 3.70(0.95)
rio_disp 1.44(0.41)
rio_idiorisk -3.24(-0.72)
12

(Percentage) (121) (122) (123) (124) (125) (126) (127) (128) (129) (130) (131) (132) (133) (134) (135)VARIABLES Return Return Return Return Return Return Return Return Return Return Return Return Return Return Return
mktrf 3.56 3.54 3.53 3.33 3.53 3.34 3.58 3.24 3.36 3.91 3.48 3.69 3.55 3.46 3.55(1.33) (1.34) (1.28) (1.27) (1.33) (1.25) (1.36) (1.21) (1.28) (1.45) (1.27) (1.31) (1.26) (1.30) (1.34)
rio_turnover -0.21(-0.08)
revenuesurprise 0.89(0.13)
roe 0.02(0.00)
seo -5.36(-1.39)
sp -0.03(-0.01)
shareiss1y -2.08(-0.54)
shareiss5y 4.16(0.64)
sharerepurchase -3.34(-0.57)
sharevol -3.55(-1.28)
shortinterest -1.79(-0.68)
size 0.19(0.07)
skew1 -8.17(-0.86)
smileslope -4.39(-1.09)
spinoff 0.96(0.27)
surpriserd 3.13(0.54)
13

(Percentage) (136) (137) (138) (139) (140) (141) (142) (143) (144) (145) (146) (147) (148) (149) (150)VARIABLES Return Return Return Return Return Return Return Return Return Return Return Return Return Return Return
mktrf 3.48 3.23 3.17 3.74 3.51 3.35 3.37 3.48 3.37 3.52 3.67 3.49 3.49 3.64 3.47(1.29) (1.23) (1.19) (1.41) (1.33) (1.26) (1.26) (1.31) (1.28) (1.31) (1.39) (1.32) (1.32) (1.35) (1.31)
tax -0.52(-0.09)
upforecast -11.59(-1.10)
varcf 2.17(0.87)
volmkt -1.82(-0.71)
volsd -1.07(-0.31)
volumetrend -3.18(-0.56)
xfin -1.47(-0.48)
zscore 1.05(0.32)
cfp -3.45(-1.07)
fgr5yrlag -0.12(-0.02)
grcapx -6.36(-0.88)
hire -2.72(-0.49)
pchdepr -3.38(-0.42)
realestate 1.80(0.21)
retconglomerate 1.14(0.35)
14

(Percentage) (151) (152) (153) (154) (155)VARIABLES Return Return Return Return Return
mktrf 2.71 3.49 3.58 3.41 4.37(1.02) (1.32) (1.36) (1.29) (1.40)
sfe 4.03(1.60)
sinalgo 1.35(0.40)
std_turn -2.15(-0.91)
tang 0.90(0.68)
zerotrade -1.65(-0.56)
Constant 24.18** 19.34** 22.21** 19.49** 23.17**(2.47) (2.04) (2.24) (2.06) (2.05)
Observations 71 71 71 71 60R-squared 0.0608 0.0279 0.0372 0.0320 0.0357
15

Table A.4: Other Predictors
Panel A: Bitcoin (1) (2) (3) (4) (5) (6)
pd 0.03 0.01(0.97) (0.24)
pe −0.02 −0.02(-0.98) (-0.67)
credit −0.14 −0.06(-0.47) (-0.15)
term 0.24∗ 0.11(1.92) (0.55)
tbill 0.31 0.35(1.18) (1.16)
R-squared 0.00 0.00 0.00 0.01 0.04 0.06
Panel B: Ripple (1) (2) (3) (4) (5) (6)
pd 0.07 0.09(0.87) (0.62)
pe 0.04 −0.15(0.48) (-0.57)
credit −0.94 −0.07(-1.15) (-0.04)
term −0.26 −1.08(-0.74) (-1.00)
tbill 0.12 0.83(0.14) (0.70)
R-squared 0.01 0.00 0.02 0.01 0.0 0.07
Panel C: Ethereum (1) (2) (3) (4) (5) (6)
pd −0.02 0.05(-0.48) (0.51)
pe −0.08 −0.02(-0.45) (-0.09)
credit 0.19 −0.13(0.44) (-0.12)
term 0.43 0.60(1.28) (0.82)
tbill −0.10 −0.24(-0.21) (-0.28)
R-squared 0.01 0.01 0.01 0.05 0.00 0.05
16

Table A.5: Detailed U.S. SIC 3-digit Industry Exposures to Bitcoin Returns
SIC CODE 0 11 17 18 19 20 25 70 72 74 76 78 83 91 99BITCOIN -2.16 -0.70 -1.12 -0.97 1.53 0.85 -1.61 -0.37 -0.65 -1.20 1.28 -3.04 -5.57* 0.01 -2.50
(-1.50) (-0.55) (-0.83) (-0.87) (0.97) (0.13) (-1.45) (-0.33) (-0.67) (-1.23) (0.59) (-0.53) (-2.07) (0.00) (-1.21)MKTRF 1.89*** 1.05*** 1.39*** 1.01*** 1.46*** 2.31** 0.64** 0.77*** 1.16*** 1.41*** 2.07*** 1.01** 1.59** 0.21 2.32***
(5.68) (3.74) (4.68) (4.05) (4.22) (2.10) (2.62) (3.12) (5.46) (6.56) (4.29) (2.22) (2.29) (0.54) (4.10)
SIC CODE 100 101 102 103 104 106 107 108 109 122 124 131 132 138 140BITCOIN -0.76 -1.30 -2.61* -3.32** -1.40 -6.47** -0.03 1.69 -0.87 -1.21 1.81 -1.06 -0.75 -1.39 1.65
(-0.52) (-0.85) (-1.89) (-2.61) (-0.85) (-2.18) (-0.01) (0.76) (-0.69) (-0.85) (0.38) (-1.34) (-0.62) (-1.55) (0.66)MKTRF 1.57*** 1.61*** 1.73*** 1.67*** 0.53 2.34*** 2.80*** 1.56*** 2.06*** 1.58*** 2.87*** 1.50*** 1.71*** 1.61*** 0.97*
(4.90) (4.77) (5.66) (5.96) (1.45) (3.56) (3.95) (3.17) (7.36) (5.03) (3.03) (8.59) (6.38) (8.10) (1.77)
SIC CODE 141 142 144 147 148 149 152 153 154 160 161 162 170 171 173BITCOIN 2.02 -2.39 -0.42 -0.14 5.09 -1.24 -0.94 -0.04 -0.99 -0.81 -2.14 -1.11 -4.21 -1.22 -0.69
(1.08) (-1.35) (-0.41) (-0.14) (0.49) (-0.82) (-0.83) (-0.06) (-0.75) (-0.57) (-0.49) (-1.56) (-0.95) (-1.02) (-1.20)MKTRF 1.06** 1.45*** 1.13*** 0.88*** 1.42* 1.13*** 1.73*** 1.42*** 2.46*** 1.36*** 4.01*** 1.71*** 1.76* 1.58*** 0.92***
(2.55) (4.05) (5.87) (3.79) (1.76) (3.37) (6.95) (8.20) (8.40) (4.35) (4.18) (10.80) (1.80) (5.98) (7.21)
SIC CODE 174 175 178 179 200 201 202 203 204 205 206 207 208 209 210BITCOIN -1.78 -4.55 -3.45* 1.35 0.44 0.73 0.83 -0.30 0.32 -0.19 1.09 -0.20 0.43 1.48 232.74
(-0.29) (-0.71) (-1.93) (0.79) (0.46) (1.07) (0.96) (-0.53) (0.67) (-0.27) (1.51) (-0.34) (0.96) (1.09) (1.36)MKTRF 0.82 4.73*** 0.82** 1.67*** 0.55*** 0.49*** 0.95*** 0.41*** 0.50*** 0.64*** 0.41** 0.78*** 0.53*** 0.47 -12.55
(1.65) (4.73) (2.07) (4.22) (2.65) (3.23) (4.98) (3.30) (4.72) (4.06) (2.58) (6.08) (5.37) (1.55) (-1.63)
SIC CODE 211 213 220 221 222 225 227 228 229 230 231 232 233 234 238BITCOIN -0.20 -0.68 2.97 0.08 -0.83 -0.02 -0.34 1.39 0.45 0.57 11.30** 0.21 1.73* -0.53 1.52
(-0.32) (-0.26) (0.27) (0.08) (-1.01) (-0.02) (-0.46) (1.01) (0.26) (0.36) (2.16) (0.35) (1.75) (-0.55) (0.84)MKTRF 0.54*** 0.24 -0.53 0.62*** 1.82*** 1.08*** 1.39*** 1.00*** 1.28*** 0.20 2.37** 0.76*** 1.12*** 0.66*** 1.24***
(3.84) (0.20) (-0.21) (3.07) (10.06) (5.08) (8.46) (3.29) (3.37) (0.56) (2.31) (5.83) (5.15) (3.09) (3.08)
17

SIC CODE 241 242 243 245 249 250 251 252 253 254 261 262 263 265 267BITCOIN -1.82 -1.91* 0.14 0.45 0.08 -1.56 1.89* -0.69 0.62 -0.09 -0.57 -0.37 -0.17 -1.14* 0.31
(-0.70) (-1.97) (0.13) (0.14) (0.10) (-0.92) (1.80) (-0.71) (0.82) (-0.07) (-0.32) (-0.73) (-0.27) (-1.71) (0.50)MKTRF 1.24** 0.97*** 1.78*** 1.51** 1.70*** 0.97** 1.34*** 1.46*** 1.41*** 1.70*** 1.42*** 1.41*** 1.32*** 1.34*** 0.43***
(2.37) (4.56) (7.92) (2.05) (9.55) (2.59) (5.80) (6.85) (8.50) (5.87) (3.99) (12.43) (9.47) (9.10) (3.14)
SIC CODE 271 272 273 274 275 276 277 278 279 280 281 282 283 284 285BITCOIN -0.56 -0.09 0.32 0.07 -0.48 -0.26 2.22** -0.42 -1.13 1.27 -0.36 -0.37 0.86** 0.76* -1.24**
(-0.74) (-0.09) (0.52) (0.14) (-0.68) (-0.26) (2.24) (-0.52) (-1.05) (1.46) (-1.01) (-0.64) (2.19) (1.83) (-2.41)MKTRF 1.28*** 1.60*** 0.93*** 0.94*** 1.37*** 1.08*** 0.76*** 1.46*** 1.03*** 1.06*** 1.20*** 1.66*** 0.76*** 0.44*** 1.45***
(7.62) (7.15) (6.70) (8.14) (8.81) (4.81) (3.48) (8.26) (4.35) (5.49) (15.11) (12.90) (8.71) (4.76) (12.69)
SIC CODE 286 287 289 291 295 299 301 302 305 306 308 310 311 314 316BITCOIN -0.39 -0.46 0.23 0.13 -0.02 -0.45 -0.70 1.06 1.83 -0.31 -0.64 -0.23 -2.94 0.99 0.06
(-0.68) (-0.70) (0.25) (0.26) (-0.02) (-0.52) (-0.62) (1.28) (0.82) (-0.44) (-1.43) (-0.29) (-0.37) (1.00) (0.03)MKTRF 1.52*** 1.37*** 1.23*** 1.06*** 1.58*** 0.74*** 1.77*** 0.56*** 1.11** 1.27*** 1.15*** 0.78*** 1.60 0.75*** 1.47***
(12.01) (9.54) (6.17) (9.95) (6.38) (3.88) (7.10) (3.03) (2.46) (8.06) (11.59) (4.41) (0.85) (3.45) (3.74)
SIC CODE 317 319 322 323 324 325 326 327 329 331 332 333 334 335 336BITCOIN -3.52 2.19 -0.39 0.75 -0.40 -3.80 7.97 -2.48** -0.47 -0.93 0.29 -0.89 -0.83 -0.51 0.05
(-1.08) (0.40) (-0.41) (0.62) (-0.39) (-1.28) (0.71) (-2.21) (-0.50) (-0.96) (0.41) (-0.76) (-0.42) (-0.77) (0.06)MKTRF 1.65* 0.12 1.88*** 1.65*** 1.92*** 2.19*** 0.41 2.01*** 1.44*** 2.01*** 0.68*** 1.44*** 2.07*** 1.52*** 1.07***
(1.85) (0.30) (8.83) (6.22) (8.32) (3.31) (0.49) (8.10) (6.93) (9.37) (4.38) (5.55) (4.55) (10.30) (6.05)
SIC CODE 339 341 342 343 344 345 346 347 348 349 351 352 353 354 355BITCOIN 1.71 0.24 -1.20* 0.04 -0.01 0.65 1.74 0.46 0.82 -1.61*** -0.35 -1.12 -0.82 -0.38 -1.91***
(0.32) (0.48) (-1.96) (0.03) (-0.02) (0.55) (1.25) (0.43) (0.78) (-2.65) (-0.57) (-1.50) (-1.02) (-0.67) (-2.96)MKTRF 0.91 1.14*** 1.46*** 0.69* 1.29*** 0.86*** 2.14*** 1.19*** 0.60** 1.63*** 1.11*** 1.19*** 1.44*** 1.44*** 1.54***
(0.78) (10.34) (10.84) (1.87) (13.68) (3.24) (6.96) (4.99) (2.63) (12.09) (8.20) (7.24) (8.11) (11.44) (10.78)
18

SIC CODE 356 357 358 359 360 361 362 363 364 365 366 367 369 371 372BITCOIN -0.64 0.12 -0.53 -1.12 0.57 0.98 -0.82 -0.67 -0.65 -1.22 0.61 -0.60 0.37 -0.64 0.33
(-1.32) (0.18) (-0.90) (-1.38) (0.50) (1.64) (-1.62) (-0.79) (-1.10) (-1.38) (0.89) (-1.29) (0.93) (-1.15) (0.87)MKTRF 1.40*** 1.05*** 1.33*** 1.70*** 1.57*** 1.23*** 1.39*** 1.49*** 1.20*** 1.75*** 1.19*** 1.22*** 1.13*** 1.50*** 1.06***
(13.04) (7.21) (10.20) (9.45) (6.25) (9.32) (12.52) (7.91) (9.12) (8.92) (7.92) (11.85) (13.03) (12.29) (12.51)
SIC CODE 373 374 375 376 379 381 382 384 385 386 387 391 393 394 395BITCOIN -0.45 -0.83 -1.15 0.72 0.03 0.15 -0.00 0.31 0.57 0.35 -0.84 2.70 1.70 0.31 0.59
(-0.51) (-0.90) (-1.17) (0.86) (0.02) (0.35) (-0.01) (0.89) (0.78) (0.46) (-0.46) (1.62) (1.33) (0.46) (0.34)MKTRF 0.98*** 1.72*** 1.01*** 0.36* 1.37*** 0.85*** 1.18*** 0.89*** 0.35** 0.98*** 1.68*** 0.82** 1.43*** 0.88*** 0.59
(4.99) (8.43) (4.62) (1.97) (5.30) (8.97) (13.38) (11.45) (2.14) (5.85) (4.16) (2.23) (5.06) (5.78) (1.21)
SIC CODE 396 397 399 401 421 422 440 441 442 444 448 449 451 452 458BITCOIN 0.69 -0.14 -0.20 0.31 0.05 -0.76 -0.73 -0.83 2.44 0.07 -0.51 -1.34 0.45 0.15 0.31
(0.18) (-0.07) (-0.33) (0.55) (0.09) (-0.40) (-0.37) (-1.19) (0.58) (0.08) (-0.63) (-0.94) (0.67) (0.15) (0.36)MKTRF -0.50 1.87*** 1.46*** 1.12*** 0.98*** 0.90 1.76*** 1.53*** 2.66*** 1.08*** 0.75*** 1.92*** 0.99*** 1.61*** 0.63***
(-0.60) (4.34) (10.67) (9.13) (8.55) (1.17) (4.07) (9.90) (4.03) (5.24) (4.14) (6.09) (6.63) (7.50) (3.35)
SIC CODE 461 472 473 474 478 481 482 483 484 489 491 492 493 494 495BITCOIN 0.19 -3.65 -0.17 -0.58 -5.48*** 0.01 -1.77* 0.12 0.55 0.47 0.29 -0.08 -0.04 -0.27 0.44
(0.31) (-1.52) (-0.27) (-0.57) (-2.74) (0.01) (-1.78) (0.25) (1.26) (1.00) (0.56) (-0.15) (-0.08) (-0.48) (1.06)MKTRF 0.80*** 0.44 0.88*** 1.18*** 1.71*** 0.56*** 0.92*** 1.33*** 1.05*** 0.63*** 0.25** 0.88*** 0.22* 0.40*** 0.47***
(5.84) (0.74) (6.24) (4.14) (4.32) (5.65) (4.17) (13.09) (10.92) (6.08) (2.15) (7.28) (1.85) (3.19) (5.20)
SIC CODE 501 502 503 504 505 506 507 508 509 511 512 513 514 515 516BITCOIN -0.18 -1.39 -0.73 0.20 -1.25 -0.43 -0.67 -0.59 0.75 -1.32 0.95 -0.30 0.64 -0.60 -0.29
(-0.41) (-0.73) (-1.07) (0.45) (-1.63) (-1.06) (-0.89) (-0.88) (1.07) (-0.93) (1.45) (-0.27) (1.40) (-0.74) (-0.42)MKTRF 1.05*** 1.35*** 1.50*** 1.01*** 1.71*** 1.23*** 1.00*** 0.92*** 1.08*** 1.33*** 0.88*** 1.03*** 0.63*** 1.20*** 1.48***
(10.50) (3.19) (9.85) (10.45) (10.05) (13.86) (5.95) (6.22) (7.01) (4.25) (6.05) (4.16) (6.19) (6.79) (9.73)
19

SIC CODE 517 518 519 520 521 523 531 533 539 541 544 546 549 551 552BITCOIN -0.48 0.52 -1.37 -1.42 -1.40** -1.02 0.31 0.45 -1.25 -0.79 0.29 -0.15 3.32** -0.26 0.22
(-0.72) (0.81) (-1.32) (-1.55) (-2.53) (-1.24) (0.35) (0.85) (-0.46) (-0.98) (0.45) (-0.07) (2.59) (-0.27) (0.19)MKTRF 1.21*** 0.58*** 1.41*** 0.99*** 1.08*** 0.91*** 0.83*** 0.46*** 0.98 0.79*** 0.67*** 0.84* 0.86*** 1.38*** 1.55***
(8.27) (3.21) (6.17) (4.89) (8.82) (4.75) (4.19) (3.96) (1.34) (4.45) (4.71) (1.77) (3.04) (6.56) (6.08)
SIC CODE 553 554 555 560 561 562 563 564 565 566 569 570 571 572 573BITCOIN -0.52 0.32 -0.37 -0.17 0.83 0.88 0.67 -0.95 0.22 -0.74 -1.92 1.07 0.27 3.38 0.18
(-0.69) (0.47) (-0.28) (-0.11) (0.52) (0.80) (0.36) (-0.65) (0.29) (-0.70) (-1.17) (1.01) (0.28) (0.89) (0.13)MKTRF 0.58*** 0.68*** 1.31*** 0.86** 0.89** 0.96*** 1.42*** 1.10*** 0.94*** 0.92*** 0.45 0.68*** 1.31*** 1.39 1.10***
(3.51) (4.47) (4.52) (2.62) (2.54) (3.95) (3.44) (3.38) (5.67) (3.90) (1.36) (2.89) (6.07) (1.65) (3.64)
SIC CODE 581 590 591 593 594 596 598 599 600 601 602 603 608 609 611BITCOIN 0.33 1.83 0.87 0.06 -0.35 -0.35 0.43 -0.27 -1.24 -0.27 -0.36 -0.34 -2.12 -0.90 -2.44*
(0.86) (1.49) (1.36) (0.06) (-0.53) (-0.39) (0.23) (-0.45) (-1.27) (-0.26) (-0.85) (-0.74) (-1.65) (-1.22) (-1.70)MKTRF 0.57*** 0.87*** 0.87*** 0.73*** 1.48*** 0.88*** 1.76*** 0.76*** 1.04*** 0.28 1.29*** 0.98*** 1.20*** 1.09*** 1.22***
(6.67) (3.19) (6.20) (3.27) (10.19) (4.41) (4.15) (5.83) (4.83) (1.24) (13.71) (9.57) (3.87) (6.71) (3.84)
SIC CODE 614 615 616 619 620 621 622 623 628 630 631 632 633 635 636BITCOIN 0.51 0.77 0.18 -1.25 0.15 -0.75 0.31 1.33 0.16 -0.30 0.19 0.78 -0.52* 0.25 0.22
(0.82) (1.44) (0.12) (-1.11) (0.22) (-1.18) (0.33) (1.28) (0.54) (-0.30) (0.34) (1.52) (-1.75) (0.44) (0.38)MKTRF 1.11*** 0.96*** 1.16*** 0.99*** 0.88*** 1.69*** 0.80*** 1.08*** 1.60*** 0.85*** 1.65*** 0.88*** 0.88*** 1.47*** 0.66***
(8.14) (8.19) (3.55) (3.83) (5.84) (12.00) (3.81) (4.73) (25.22) (3.84) (13.26) (7.73) (13.48) (11.81) (5.29)
SIC CODE 637 639 641 650 651 653 655 670 671 672 673 677 679 701 720BITCOIN -0.15 1.24 -0.04 -0.38 0.14 -0.20 -0.70 0.31 -0.36 -0.13 -2.85** -0.71 -0.26 -0.29 -0.01
(-0.19) (1.34) (-0.10) (-0.33) (0.26) (-0.45) (-0.86) (0.09) (-0.69) (-0.87) (-2.37) (-0.43) (-0.56) (-0.52) (-0.01)MKTRF 0.82*** 0.98*** 0.95*** 0.49* 1.08*** 1.45*** 0.94*** 0.93 1.33*** 0.76*** 1.66*** 1.24*** 0.81*** 1.59*** 0.86***
(3.64) (4.82) (11.87) (1.90) (9.08) (14.74) (5.23) (1.27) (11.48) (23.03) (6.19) (3.35) (7.83) (12.87) (2.96)
20

SIC CODE 721 723 726 728 729 731 732 733 734 735 736 737 738 751 753BITCOIN -0.96 0.24 -0.48 -1.06 1.28 -0.45 -0.27 -1.67 -0.53 -0.62 -0.84 0.01 0.08 0.67 0.69
(-1.45) (0.25) (-0.77) (-0.76) (0.92) (-0.88) (-0.56) (-1.26) (-1.14) (-0.89) (-1.57) (0.03) (0.21) (0.66) (0.61)MKTRF 1.07*** 0.86*** 1.05*** 1.22*** 1.68*** 1.57*** 1.10*** 1.56*** 0.72*** 1.77*** 1.61*** 1.04*** 1.05*** 1.85*** 0.75***
(7.28) (4.09) (7.54) (3.38) (5.42) (13.96) (10.41) (5.31) (7.03) (11.50) (13.61) (13.46) (12.46) (8.23) (2.99)
SIC CODE 781 782 783 784 790 792 793 794 799 800 801 802 805 806 807BITCOIN -0.56 0.43 -0.47 2.33 -0.57 -0.03 0.14 0.76 0.18 -5.45* 0.31 1.31 -0.35 -0.58 0.09
(-0.67) (0.24) (-0.55) (0.82) (-0.26) (-0.03) (0.28) (1.50) (0.27) (-1.81) (0.35) (0.72) (-0.40) (-0.61) (0.15)MKTRF 1.14*** 0.91** 1.06*** 1.44** 0.58 1.17*** 0.23** 0.89*** 1.21*** 0.59 0.62*** -0.06 1.61*** 1.11*** 0.82***
(6.09) (2.27) (5.56) (2.30) (1.15) (5.19) (2.05) (7.89) (8.24) (0.78) (3.22) (-0.15) (8.41) (5.32) (6.06)
SIC CODE 808 809 820 821 822 823 824 829 830 832 835 836 869 870 871BITCOIN 1.56* 0.53 -1.04 1.39 -0.33 6.64 -0.12 1.07 -2.17 -1.57 -0.10 0.84 -1.31 0.51 -0.87*
(1.81) (0.83) (-0.61) (0.76) (-0.25) (1.02) (-0.08) (0.75) (-0.42) (-0.95) (-0.12) (0.54) (-0.65) (0.99) (-1.73)MKTRF 0.79*** 1.23*** 1.38*** 1.35*** 1.31*** 1.82*** 1.29*** 1.30*** 0.39 1.13*** 0.16 1.44*** 1.57*** 0.87*** 1.39***
(4.16) (8.79) (3.68) (3.34) (4.46) (3.34) (4.01) (4.12) (0.39) (3.11) (0.68) (4.22) (3.81) (7.59) (12.44)
SIC CODE 872 873 874 891 899 943 951 961 999BITCOIN 0.48 0.81 -0.13 -0.21 0.48 1.21 -2.93 -3.30** -0.42
(0.49) (0.98) (-0.36) (-0.13) (0.32) (0.57) (-0.55) (-2.05) (-0.94)MKTRF 1.10*** 1.18*** 0.98*** 0.83** 1.22*** 1.10** 2.83** 1.35*** 1.16***
(5.06) (6.48) (12.11) (2.35) (3.68) (2.22) (2.61) (4.54) (11.54)
21

Appendix B: Implied Risk Neutral Disaster Probability
In this section, we calculate the risk neutral disaster probability that can justify the realized high averagecryptocurrency returns. We define a disaster as an event where the cryptocurrency price drops to zero in oneday. We further calculate the average cryptocurrency return as the trailing one year average daily return.When the implied risk neutral disaster probability is negative, we modify it to zero. Figure A.3 plots thetime-varying implied risk neutral disaster probability of Bitcoin, Ripple, and Ethereum, respectively. Theimplied disaster probability ranges from 0 to 1.3 percent for Bitcoin, 0 to 2.5 percent for Ripple, and 0.4 to1.6 percent for Ethereum. The current implied daily disaster probability is about 0.4 percent for Bitcoin,0.6 percent for Ripple, and 0.3 percent for Ethereum.
Figure A.3: Implied Risk Neutral Disaster Probability
Appendix C: Portfolio Choice with Cryptocurrency
In this section, we ask the question: how much cryptocurrency an investor should hold in her portfolio? Toanswer this question, we use the Black-Litterman model (Black and Litterman (1990, 1992)) and evaluate theoptimal portfolio problem. The variable notations used in this section are the same as in He and Litterman(1999). We separately investigate incorporating Bitcoin into a portfolio with only stocks, a portfolio withstocks and corporate bonds, and a portfolio with stocks, bonds and currency. Following He and Litterman(1999), we assume a risk aversion parameter of 2.5. The coefficient of uncertainty in the prior estimate ofthe mean, τ, is assumed to be 0.30 or 30% – a very conservative estimate reflecting the high volatility ofBitcoin returns.
Table A.6 shows the correlation structure of Bitoin and other assets including stocks, coprorate bonds,and currency. Table A.7 reports the standard deviations of the returns of the assets, market capitalizationshares, and CAPM implied equilibrium risk premiums.
The Black-Litterman model allows us to incorporate different investor views into the portfolio allocationproblem. We investigate a range of investor views and their effect on the allocation of Bitcoin. The differentinvestor views we examine are (1) Bitcoin will outperform the rest of the assets by 30 percent a year, (2)Bitcoin will outperform the rest of the assets by 50 percent a year, (3) Bitcoin will outperform the rest of theassets by 100 percent per year, and (4) Bitcoin will outperform the rest of the assets by 200 percent a year.Historically, Bitcoin has been outperforming the rest of the assets by about 200 percent a year. Across thedifferent portfolios we considered, the shares of Bitcoin under the different investor views are similar. The
22

investor should have about 1 percent, 1.6 percent, 3.1 percent, and 6.1 percent share of Bitcoin under views(1), (2), (3), and (4), respectively. That is, if the investor believes Bitcoin will continue to do as well as thepast seven years, she should hold about 6.1 percent share of Bitcoin in her portfolio. Even if the investorbelieves Bitcoin will only have half of its historical performance going forward, she should still hold about3.1 percent share of Bitcoin in her portfolio.
Table A.6: Correlations of Different Asset Classes
Bitcoin Stock Corporate CurrencyBitcoin 1.00Stock 0.16 1.00Corporate -0.04 -0.30 1.00Currency 0.08 0.55 -0.08 1.00
Table A.7: Annualized Volatility, Market Cap Weights, and Equilibrium Risk Premiums
Panel A σ weq Π
Bitcoin 2.41 0.61% 19.57%Stock 0.11 99.39% 3.20%
Panel B σ weq Π
Bitcoin 2.41 0.45% 13.65%Stock 0.11 72.39% 2.09%Corporate 0.10 27.16% 0.09%
Panel C σ weq Π
Bitcoin 2.41 0.39% 12.21%Stock 0.11 62.40% 1.93%Corproate 0.10 23.41% 0.06%Currency 0.06 13.80% 0.71%
23

Table A.8: Optimal Portfolio Weights under Different Investor Views
Panel A: Two AssetsOutperform Other Assets by 30% p µ w∗ w∗ −
weq
1+τ
Bitcoin 100 26.42% 1.00 0.53Stock -100 3.23% 75.92 -0.53
Outperform Other Assets by 50% p µ w∗ w∗ −weq
1+τ
Bitcoin 100 36.47% 1.61 1.14Stock -100 3.29% 75.32 -1.14
Outperform Other Assets by 100% p µ w∗ w∗ −weq
1+τ
Bitcoin 100 61.6% 3.13 2.66Stock -100 3.42% 73.79 -2.66
Outperform Other Assets by 200% p µ w∗ w∗ −weq
1+τ
Bitcoin 100 111.9% 6.12 5.70Stock -100 3.69% 70.75 -5.70
Panel B: Three AssetsOutperform Other Assets by 30% p µ w∗ w∗ −
weq
1+τ
Bitcoin 100 22.63% 0.97 0.63Stock -72.71 2.15% 55.23 -0.46Corporate -27.29 0.07% 20.72 -0.17
Outperform Other Assets by 50% p µ w∗ w∗ −weq
1+τ
Bitcoin 100 32.67% 1.58 1.23Stock -72.71 2.21% 54.79 -0.90Corporate -27.29 0.05% 20.56 -0.34
Outperform Other Assets by 100% p µ w∗ w∗ −weq
1+τ
Bitcoin 100 57.55% 3.10 2.75Stock -72.71 2.36% 53.69 -2.00Corporate -27.29 0.01% 20.14 -0.75
Outperform Other Assets by 200% p µ w∗ w∗ −weq
1+τ
Bitcoin 100 108.00% 6.13 5.78Stock -72.71 2.66% 51.48 -4.20Corporate -27.29 -0.08% 19.32 -1.58
24

Panel C: Four AssetsOutperform Other Assets by 30% p µ w∗ w∗ −
weq
1+τ
Bitcoin 100 21.80% 0.96 0.66Stock -62.64 1.99% 47.59 -0.41Corporate -23.50 0.04% 17.85 -0.15Currency -13.86 0.72% 10.52 -0.09
Outperform Other Assets by 50% p µ w∗ w∗ −weq
1+τ
Bitcoin 100 31.84% 1.56 1.26Stock -62.64 2.06% 47.21 -0.79Corporate -23.50 0.02% 17.71 -0.30Currency -13.86 0.74% 10.44 -0.17
Outperform Other Assets by 100% p µ w∗ w∗ −weq
1+τ
Bitcoin 100 56.93 3.08 2.78Stock -62.64 2.21 46.26 -1.74Corporate -23.50 -0.02 17.36 -0.65Currency -13.86 0.78 10.23 -0.38
Outperform Other Assets by 200% p µ w∗ w∗ −weq
1+τ
Bitcoin 100 107.10% 6.10 5.804Stock -62.64 2.52% 44.36 -3.64Corporate -23.50 -0.11% 16.64 -1.36Currency -13.86 0.86% 9.81 -0.80
25