risk taking: a corporate governance perspective
TRANSCRIPT

Risk Taking: A Corporate Governance Perspective


Risk Taking: a CoRpoRaTe goveRnanCe peRspeCTive 1
ACKNOWLEDGEMENTS
The genesis of this book lies in the teaching materials prepared for IFC’s Risk Governance Workshops conducted in 20 developing countries during the 2010–2012 time period by the book’s authors. The book and workshops also benefited from the contributions of Torben Andersen of Copenhagen Business School and Zur Shapira of New York University’s Stern School of Business. The contents of the book reflect this team’s years of risk management and governance practice as managers, directors as well as their academic scholarship.
More than 1,000 corporate directors and senior managers participated in the workshop series. The handbook has been shaped by their views, experiences and other feedback and reflects the richness of wide and varied collective experience. The authors have shared specific examples from the participants’ experiences in the handbook—as much as confidentiality constraints allow.
Numerous stock exchanges, regulators, central banks, schools and other institutions partnered with us in hosting the events. The workshops would not have been possible without their administrative support. They also provided key intelligence on local conditions and helped us frame materials to specific emerging market conditions.
IFC staff in local offices and in Washington, D.C. gave their time to help to make these workshops happen. These extended team members are valuable contributors to this
final product in as much as their efforts, contacts, and knowledge contributed to the workshops and to the shaping of the consulting teams’ views on risk-taking challenges in emerging markets.
The workshops were funded by contributions from the governments of the Netherlands and Austria, and from IFC. Without their commitment to development, these workshops and this handbook would not have been possible.
Oliviero Roggi (Lead Faculty)Chairperson, International Risk Management ConferenceCorporate Finance Professor, University of FlorenceVisiting Professor, New York University Stern Salomon Center
Maxine Garvey (Program Leader)Corporate Governance UnitInternational Finance Corporation
Aswath Damodaran (Program Lead Faculty)Kerschner Family Chair in Finance EducationProfessor of Finance at New York University Stern School of Business
June 2012


Risk Taking: a CoRpoRaTe goveRnanCe peRspeCTive 3
I. Introduction ....................................................................................................................5
II. What is Risk? ..................................................................................................................7
III. Risk Governance, Risk Management, and Value Creation ......................................11
IV. Measuring Value: Risk-Adjusted Value .....................................................................17
V. Managing Risk: Enterprise Approaches ....................................................................27
VI. Tools for Better Risk Decision Making: Probabilistic Approaches .........................35
VII. Creating Value from Risk Taking ................................................................................39
VIII. Exploiting the Risk Upside: Strategic Risk Taking and Building a Risk-Taking Organization ..................................................................43
IX. Conclusions ...................................................................................................................51
Appendix................................................................................................................................53
TAbLE Of CONTENTS

Risk Taking: a CoRpoRaTe goveRnanCe peRspeCTive4

5inTRoduCTion
I. INTRODuCTION
Objectives Of IFC’s Risk Governance Program
In February 2008, the board of the French bank Société Générale learned that one of its traders had lost $7.2 billion dollars. Jerome Kerviel, the trader in question, had approval to risk up to $183 million. Since 2005, however, Kerviel had apparently ignored his limits and took on exposures as high as $73 billion—more than the market value of the entire firm. Société Générale’s board, managers, risk management systems, and internal controls failed to detect, much less halt, the reckless bets. When finally discovered, the failure in risk governance and management had cost Société Générale and its shareholders clients, money, and reputation. Similar failures of risk governance feature in scandals at UBS and Baring, with the latter failing to survive.
In the 2008 economic crisis, several firms in emerging markets also suffered major losses due to failed risk management and governance. Brazilian pulp producer Aracruz, and meat processor Sadia, had extensive losses on foreign exchange derivative contracts. Ceylon Petroleum Corporation (CPC) in Sri Lanka stood to lose hundreds of millions on commodity derivatives. In all of these cases, the chagrined boards (and, in the case of CPC, the state as the main shareholder) asserted that managers had acted without proper authorization.
Losses and the collapse of firms due to failures in risk handling and risk governance hurt the wider community through loss of jobs, goods and services. These losses are felt particularly severely in emerging markets where the economies are vulnerable and jobs are scarce.
Risk Taking as an Essential Activity of Enterprises
Taking risks and dealing with uncertainty are essential parts of doing business. Effective oversight of risk taking is a key responsibility of the board. Directors must protect profitable activities (“the golden goose”) in the face of routine risks and improbable disasters (“the black swans”).
The word “enterprise” derives from the Latin “impresum,” meaning “taking upon oneself,” and describes the act of carrying out actions with the intent to attain a preset objective. The purpose of the enterprise is the satisfaction of individual customer needs. This objective can be attained only if the enterprise prepares itself with the productive factors required for producing and delivering the products and services that can satisfy these needs. This circumstance, in which entrepreneurs must anticipate the needs of consumers, leads to a pervasive aspect of enterprise management: dealing with the risks incurred as the entrepreneur organizes production. Hence, the enterprise is characterized by uncertainty in conducting its operations: uncertainty is an inherent element of enterprise risk. The enterprise and the risk generated in operating it are inseparable. There is no enterprise without risk. Rewards earned by an enterprise compensate for such risk taking.
IFC’s Risk Governance Program
As part of IFC’s response to the financial crisis of 2008, IFC’s Corporate Governance Unit launched a risk governance program. The program was intended to enhance the capability of boards of directors in emerging markets for improved risk management oversight. The aim was to provide directors with tools to enhance each board’s risk oversight structures, processes, and competence. The program consisted of two elements: a series of training events across emerging markets and this handbook.

Risk Taking: a CoRpoRaTe goveRnanCe peRspeCTive6
By the end of 2011, the training team had conducted workshops in 18 countries worldwide, working with directors and others in numerous emerging markets, drawing from multiple industries, public and private sectors, real and financial sectors, small and large firms, and rich and poor countries. The discussions covered many topics on risk management, risk hedging, risk governance and strategic risk taking. This book reflects not only the content prepared by the core teaching faculty for these workshops but also the feedback and lessons shared by participants in these engagements.
Target Reader: A Director’s Perspective on Risk Taking
The materials target decision makers, chiefly corporate directors to help them make sense of an increasingly complex and chaotic risk universe. Experienced directors with some finance training are the main audience for this book.
The approach takes the view that a director’s chief responsibility is to attend to the stakeholders’ value, particularly shareholders’ value. Thus, the risk-taking issues are discussed in terms of their impact on value. The approach also takes the view that decision makers/directors should understand the analytical tools used in the “typical” corporation. Understanding these tools makes oversight
more effective because directors can use their judgment to decide when to act and what tools to apply in their enterprise. The contents are written with a broad scope to apply to as many industries as possible. The material covers traditional corporate finance concepts and enterprise approaches. Bankers, actuaries, and risk managers (particularly those with a quantitative bent), will need resources beyond the coverage of this book as they execute their specific tasks.
Section Outlines
In the first two sections the book lays out the scope of risk management by defining risk and exploring risk governance. The next few sections look at measuring and dealing with risk and the different tools used to incorporate risk into decision making. The final portion of the manual advocates for a broader view of risk management, demonstrates its impact on the value of a business and suggests a template for building a good risk-taking organization. Sections are tied to simple steps in the generalized risk management process.
Sections start with a theme, followed by an examination of the key issues relating to the theme. Sections conclude with a set of tasks that can be used to convert the abstractions and theories proposed to real world corporate governance tests/measures for any organization.
Risk Management Steps Sections in Book
Step 1 Make an inventory of all of the risks that the firm is faced with – firm specific, sector, and market.
Section II: What is Risk?Section III: Risk Governance, Risk Management,and Value Creation
Step 2 Measure and decide which risks to hedge, avoid, or retain based on impact on the value of the enterprise.
Section IV: Measuring Value: Risk-Adjusted Value Section V: Managing Risk: Enterprise ApproachesSection VI: Tools for Better Risk Decision Making: Probabilistic Approaches
Step 3 For the risks being hedged, select the risk-hedging products and decide how to manage and monitor retained risks.
Section VII: Creating Value From Risk Taking
Step 4 Determine the risk dimensions in which you have an advantage over your competitors and select an organizational structure suitable for risktaking.
Section VIII: Exploiting the Risk Upside: Strategic Risk Taking and Building a Risk-Taking Organization

7WhaT is Risk?
II. WhAT IS RISK?
Speaking of Risk
There is no consensus on a single formal definition of risk. Given this lack of consensus, a definition from common usage serves to start our discussion:
“Risk is a concept linked to human expectations. It indicates a potential negative effect on an asset that may derive from given processes in progress or given future events. In the common language, risk is often used as a synonym of probability of a loss or of a danger. In the assessment of professional risk, the concept of risk combines the probability of an event occurring with the impact that event may have and with its various circumstances of happening.”1
However useful this layman’s start, it does not fully lay out the risk concept. For example, this definition does not clearly distinguish between the concepts of risk and uncertainty. It focuses only on negative implications of risk taking.
A Better Definition of Risk
Risk, in traditional terms, is viewed as a negative. The dictionary defines risk as “exposing to danger or hazard.” The Chinese symbol for “crisis,” reproduced in Figure 1.1, offers a better description of risk.
The first symbol is the symbol for “danger,” while the second is the symbol for “opportunity,” making risk a mix of danger and opportunity. By linking the two, the definition emphasizes that you cannot have one (opportunity) without the other and that offers that look too good to be true (offering opportunity with little or no risk) are generally not true. By emphasizing the upside potential as well as the downside dangers, this definition also serves the useful purpose of reminding us of an important truth about risk.
Where There is Upside, There is Downside and the Opposite is True!
It should come as no surprise that managers become interested in risk management during or just after a crisis and pay it little heed in good times. The Chinese definition of risk/crisis points to the fact that good risk-taking organizations not only approach risk with equanimity, but also manage risk actively in good times and in bad times. Thus, they plan for coming crises, which are inevitable, in good times and look for opportunities during bad times.
ThemeTo manage risk, we first have to define risk. In this section, we look at how risk has been defined in both theory and practice. The section explores different risk classifications and introduces the use of a risk profile for enterprises as a starting point for analyzing their risk-taking activities.
Figure 1.1: The Chinese Symbol for “Crisis”
危机
1 Source: http:www.wikipedia.com.

Risk Taking: a CoRpoRaTe goveRnanCe peRspeCTive8
Classifying Risks Faced by Organizations
Identifying risk (making it tangible) can help managers or directors in their decision making. The two lists of risks provided here are not intended to be exhaustive, because it is not possible to cover the full gamut of potential risks. Instead, the idea is to help organizational decision makers (managers or directors) begin to think more clearly about the risks faced by their organization.
Note that there are many equally valid classifications, and firms can develop their own lists suitable to their particular circumstances. The most important thing is that decision makers must understand the risks relevant to their enterprises as they are making decisions.
ClassifiCation ExamplE 1
Using the the Basel II framework and adapting the classifications to non-financial firms, this example divides organizational risks into three categories: operational, financial, and market-based.
1. Operating Riska. Operating and verification (accuracy)b. Business risk
2. Financial Riska. Internal risks
i. Insolvencyii. Counterparty iii. Financial structure planning
b. External risksi. Interest rateii. Currency exchange rateiii. Inflation
3. Market-Based Risk
ClassifiCation ExamplE 2
1. Financial Riska. Credit (default, downgrade)b. Price (commodity, interest rate, exchange rate)c. Liquidity (cash flow)
2. Operational Riska. Business operations (efficiency, supply chain, business
cycles)b. Information technology
3. Strategic Riska. Reputational (i.e., bad publicity)b. Demographic and social/cultural trendsc. Regulatory and political trends
4. Hazard Riska. Fire and other property damageb. Theft and other crime, personal injuryc. Diseases
What is a Risk Profile?
A major step in appropriate oversight of risk taking by a firm is listing out all of the risks that a firm is potentially exposed to and categorizing these risks into groups. This list is called a risk profile.
Do most firms create risk profiles? Not necessarily. In many firms, it is taken for granted that most everyone in the firm (particularly those with experience) is already aware of the risks that the firm faces. This can be a mistake and more so with risks that are uncommon, since many managers may never have experienced that risk. For boards and across firms as a whole it is useful to be clear and explicit about the risk faced. Instead of assuming awareness, make sure that everyone understands by spelling out the potential risks.
Emerging Market Example: Risk Profile of an Airline Company in Brazil**Developed by risk workshop participant
Operational RisksAircraft crash and aircraft
breakdownsStrikesTelephone, IT failure, utility
outagesFailure of sub-contractors Employee turnover
Changes in code-share agreements
Crime and social unrestFirePollutionTheft and fraudDamage to the brand
Financial and Market RisksOil prices changesInflationInterest rate changesExchange rate fluctuationsTax changes in BrazilChanges in world’s aviation
laws
New trade agreementsCash flow difficultiesBankruptcyStock price collapseDebt covenant violations

9WhaT is Risk?
Once you have created your risk profile, acknowledging the risk that your company is facing, the next step is to divide the various risks into three groups:
• Riskthatshouldbeallowedtopassthroughthefirmtoits owners
• Riskthatshouldbehedged• Riskthatshouldbeexploited
This phase is part of the broader process, known as risk treatment. Later in this manual, we will present various ways to conduct a risk treatment process.
Implications for Decision Makers
To manage risk correctly, we must acknowledge its positive and negative effects. Risk management has to look at both the downside of risk and the potential upside. In other words, risk management is not just about minimizing exposure to the wrong risks. It also is about increasing exposure to good risks.
It is important that a firm’s decision makers build a common understanding of the risks they face by developing a risk profile, an explicit listing of potential risks. While classifications and categorizations as suggested above are useful, the discussion itself is more important, because it helps establish a common language and understanding of the risks faced by the enterprise.
Risk profiles are an enterprise’s starting point for risk analysis. Most firms will need to go beyond risk profiles, and conduct risk assessments, treatment, and monitoring. However, for small, simple firms without the interest or capacity to deepen the risk management process, a well-developed, thoroughly-discussed, and strongly-internalized risk profile is a good start. This is a better option than completely ignoring the risk situation.
SECTION TASK: DEFINE RISK
1. How would you define risk?2. Ask a fellow director or manager to list the top five risks
facing your enterprise. Is this list different from the one you would make? How and why?

Risk Taking: a CoRpoRaTe goveRnanCe peRspeCTive10

11Risk goveRnanCe, Risk ManageMenT, and value CReaTion
III. RISK GOvERNANCE, RISK MANAGEMENT, AND vALuE CREATION
Corporate Governance
IFC’s Corporate Governance Unit defines corporate governance as the structures and processes for the direction and control of companies. Corporate governance concerns the relationships among the management, board of directors, controlling shareholders, minority shareholders, and other stakeholders. Good corporate governance contributes to sustainable economic development by enhancing the performance of companies and increasing their access to outside capital.
Risk GovERnanCE
Risk governance is a relatively new term. In the corporate governance arena, there is no consensus definition, although in the information technology field, risk governance is a more developed concept. However, for the purposes of discussion in this book, we define risk governance in firms as the ways in which directors authorize, optimize, and monitor risk taking in an enterprise. It includes the skills, infrastructure (i.e., organization structure, controls and information systems), and culture deployed as directors exercise their oversight. Good risk governance provides clearly defined accountability, authority, and communication/reporting mechanisms.
Risk oversight is the responsibility of the entire board. However, some boards use risk committees to help fulfill responsibilities. The risk committee might be independent, or the work might be combined with audit tasks and
assigned to an audit and risk committee. For further detail on proposed structure and functioning of risk committees, see the appendix.
Risk Management
Risk takinG and valuE CREation: Risk-adjustEd valuation
Ultimately, the objective of managing risk is to make the firm more valuable. For directors and managers, this is the primary objective, regardless of whether they view this as value to shareholders or value to a wider group of stakeholders. Fortunately, classical finance provides robust techniques for valuing enterprises. The most frequently used method is the discounting of future cash flow to the firm at a risk-adjusted cost of capital. For risk management purposes, many would point out that using the capital asset pricing model (CAPM) for calculating risk-adjusted capital has a double benefit of already accounting for all the risk that a firm’s decision makers need concern themselves about—the market risk. All other risks are firm risks and can be diversified away by the individual investor in the firm’s shares. As the shareholders can handle firm risk by their own portfolio diversification, it does not add value for the board or managers to concern themselves with these types of risks. From this viewpoint, using CAPM in assessing projects, investments, and in valuation provides a ready-to-use approach for guiding risk-taking in firms. Firms without any formal risk management
ThemeThe section addresses the fiduciary duties of a board member focusing on risk oversight. It starts by defining corporate governance, draws on the Organization for Economic Coopera-tion and Development’s Principles of Corporate Governance in discussing the role of direc-tors, and presents ideas on the role and structure of risk committees. It closes by linking the value of the enterprise to risk management.

Corporate Governance Perspectives
There are a number of predominant theoretical perspectives on corporate governance:
• Agency theory—align the interests of internal agents (executives/managers) who display strong self-interest with those of the shareholders (owners). In effect this represents a double agency dilemma (see figure)
• Transaction cost theory—reduce costs of transactional hazards through internal corporate governance mechanisms, which cannot be handled by external market mechanisms
• Stewardship theory—general human motives of achievement, altruism and meaningfulness should be managed and guided in the most opportune manner
• Resource dependence theory—highlights corporate dependence on external relations and sees governance as a vehicle to ensure continued access to essential resources
• Stakeholder theory—acknowledges agreements with multiple stakeholders that can create incremental value and/or lead to subsequent risk events if neglected or abused
Shareholders(public company)
Board of directors
Managers
Risk Taking: a CoRpoRaTe goveRnanCe peRspeCTive12

13Risk goveRnanCe, Risk ManageMenT, and value CReaTion
functions are well served by using the capital asset pricing models in guiding their investment decisions as they reap its double benefit—valuation and risk management.
Enterprise approaches also use valuation techniques at various points in the process to ensure that any decisions taken will maximize value. These valuation efforts also deploy the discounted cash flows, often using the capital asset pricing models as well. Whatever the valuation method used, the risk analyst needs to estimate the effect of each risk on firm value and determine the cost of reducing each risk. If risk reduction is costly, the decision makers must decide whether the benefit to firm value justifies the costs. Each firm must seek a value-maximizing risk management strategy.
Enterprise Risk Management
Enterprise Risk Management (ERM) emphasizes a comprehensive, holistic approach to managing risk, shifting away from a “silo-ed” approach of separately handling each organizational risk. ERM also views risk management as a value-creating activity, and not just a mitigation activity.
ERM is still an evolving concept. Before its emergence, organizations tended to isolate the management of risks. For example, the treasurer managed currency exposures, the sales or credit manager managed credit risk, and commodity traders and purchasing officers managed commodity price risks. Insurance risk managers handled the hazard risks. The personnel department managed the human resources risks. Quality and production managers were responsible for containing production risk. Marketing and strategy
Responsibilities of Board Members
The OECD Principles of Corporate Governance provide guidance on the responsibilities of directors:
A. Board members should act on a fully informed basis, in good faith, with due diligence and care, and in the best interest of the company and the shareholders.
B. Where board decisions may affect different shareholder groups differently, the board should treat all shareholders fairly.
C. The board should apply high ethical standards. It should take into account the interests of stakeholders.
D. The board should fulfill certain key functions, including:1. Reviewing and guiding corporate strategy, major plans
of action, risk policy, annual budgets and business plans; setting performance objectives; monitoring implementation and corporate performance; and overseeing major capital expenditures, acquisitions and divestitures.
2. Monitoring the effectiveness of the company’s governance practices and making changes as needed.
3. Selecting, compensating, monitoring and, when necessary, replacing key executives and overseeing succession planning.
4. Aligning key executive and board remuneration with the longer term interests of the company and its shareholders.
5. Ensuring a formal and transparent board nomination and election process.
6. Monitoring and managing potential conflicts of interest of management, board members and shareholders, including misuse of corporate assets and abuse in related party transactions.
7. Ensuring the integrity of the corporation’s accounting and financial reporting systems, including the independent audit, and that appropriate systems of control are in place, in particular, systems for risk management, financial and operational control, and compliance with the law and relevant standards.
8. Overseeing the process of disclosure and communications.
E. The board should be able to exercise objective independent judgment on corporate affairs.1. Boards should consider assigning a sufficient number
of non-executive board members capable of exercising independent judgment to tasks where there is a potential for conflict of interest. Examples of such key responsibilities are ensuring the integrity of financial and non-financial reporting, the review of related party transactions, nomination of board members and key executives, and board remuneration.
2. When committees of the board are established, their mandate, composition and working procedures should be well defined and disclosed by the board.
3. Board members should be able to commit themselves effectively to their responsibilities.
F. In order to fulfil their responsibilities, board members should have access to accurate, relevant and timely information
Source: OECD Principles of Corporate Governance, 2004

Risk Taking: a CoRpoRaTe goveRnanCe peRspeCTive14
departments attended to the competitive risks. There was limited effort to coordinate across the enterprise, to understand where risks could multiply, where they cancel each other out, or where they could be exploited for profit.
ERM addresses these issues, focusing on coordination and value addition. For example, in a conglomerate in which one division is long in currency A and another division is short in the same sum in the same currency, responsible division managers might decide to purchase separate currency hedges. This represents a silo-ed approach, which does not enhance value. Taking an enterprise-wide approach instead, using ERM, renders such actions unnecessary, because the conglomerate already has a natural hedge.
ERM’s coordinated function is often vested in a chief risk officer and in increased risk governance, including board oversight. This evolving portfolio approach is aided by improved tools for risk measurement, pricing and trading.
Today, there are two widely-disseminated ERM approaches:
• COSOIIERM:RiskframeworkfromtheCommitteeofSponsoring Organizations of the Tread way Commission that is geared to achieving strategic, operational, reporting, and compliance objectives.
• CAS ERM Framework: Developed by the CasualtyActuarial Society, the framework focuses on hazard, financial, strategic, and operational risks.
Regardless of the framework used it is important that risk decisions always tie in to the value of the enterprise to its stakeholders, particularly to its shareholders.
Risk avERsion, Risk poliCy, Risk tolERanCE and Risk appEtitE
The development of a risk policy is an importance task for boards. This activity is related to the board’s corporate strategy work, and involves specifying the types and degree of risk that a company is willing to accept in pursuit of its goals. It is a crucial management guideline in managing risks to meet the company’s desired risk profile.
An enterprise’s risk policy reflects the aggregate risk aversion of its decision makers. In the enterprise approach detailed later in the book, we will look at various managerial decision points, when decision makers’ attitudes toward risk will drive action. This attitude toward risk may or may not be codified in a formal risk policy.
Risk appetite and risk tolerance are newer terms in the risk management lexicon. In recent years, these terms have been used with increased frequency, particularly in the corporate governance and accounting community. The precise meaning and metrics of the two terms are still evolving and considerable inconsistency in their use remains. In contrast, the term risk aversion has the benefit of long use in the corporate finance community, with consensus on the concept, its measurement, and its implications for behavior. Fortunately, risk appetite and risk tolerance concepts appear to be rooted in the more robust concepts of risk aversion and risk policy.
Recently, the Institute of Risk Management attempted to produce a clear definition of the terms “risk appetite” and “risk tolerance” as follows:
Emerging Market Example: Tea and Coffee Plantation in Kenya
A commercial Kenyan farm producing tea and coffee for the European, Asian, and American markets faces a range of risks. These risks include the vagaries of weather, particularly drought, changes in government policy, ethnic strife affecting the workforce, commodity price fluctuations, and exchange rate fluctuations. The farm is owned and operated by the second generation of the founding family. The board consists of the three siblings running the business, their accountant, and the export sales manager. The directors have made a decision that they will not retain any foreign exchange risks, because the siblings believe that they lack the expertise to cope with
foreign exchange fluctuations. They are confident that their knowledge of Kenya enables them to assess, evaluate, and treat the weather and political risks. As a result of their aversion to foreign currency risk, their risk policy is to avoid or hedge this risk almost completely. They sell their produce to a middleman, a trading company that sets the contracts in Kenyan shillings. In addition, non-deliverable forwards and forwards are used to limit exposure on any inputs that need to be purchased in foreign currency and on the occasional sales that are not sold through the trading company.

15Risk goveRnanCe, Risk ManageMenT, and value CReaTion
• Risk appetite: The amount of risk an organization is willing to seek or accept in pursuit of its long term objectives.
• Risk tolerance: The boundaries of risk taking outside of which the organization is not prepared to venture in the pursuit of long-term objectives. Risk tolerance can be stated in absolutes, for example: “We will not deal with a certain type of customer” or “We will not expose more that X percent of our capital to losses in a certain line of business.”
• Risk universe: The full range of risks that could impact either positively or negatively on the ability of the organization to achieve its long term objectives.
SECTION TASK: Risk Governance, Risk Management, and Value Creation
1. How does your board define its responsibilities on risk-taking?
2. How often does your board discuss risk issues?

Risk Taking: a CoRpoRaTe goveRnanCe peRspeCTive16

17MeasuRing value: Risk-adjusTed value
Iv. MEASuRING vALuE: RISK-ADjuSTED vALuE
Approaches for Adjusting Value for Risk
ThemePursuing value-maximizing risk strategies requires that decision makers assess risk-taking within the context of a valuation methodology. For the discussion in this section, we use discounted cash flows methodology, and two practical ways of adjusting risky asset values. In the first, we adjust the discount rates upwards for risky assets and reduce the present value of expected cash flows. In the second, we replace the expected cash flows with “certainty equivalent” cash flows, which, when discounted back at the risk-free rate, yields a risk-adjusted value.
Risk-Adjusted Value
Definition: The value of a risky asset can be estimated by discounting the expected cash flows on the asset over its life at a risk-adjusted discount rate:
where the asset has a n-year life, E(CFt) is the expected cash flow in period t and r is a discount rate that reflects the risk of the cash flows.
PROCESS TO ESTIMATE RaV
Step 1: Estimate the expected cash flows from a project/asset/business. For a risky asset, consider/estimate cash flows under different scenarios, attach probabilities to these scenarios and estimate an expected value across scenarios.
Step 2: Estimate a risk-adjusted discount rate, comprised of two components, the risk-free rate and the risk premium.Risk-adjusted rate = Risk-free rate + Risk premium= Rf+ Beta (Rm-Rf)
Step 3: Take the present value of the cash flows at the risk-adjusted discount rate.
Value of asset=
T
t=0∑ E(CFt)
(1+r)t

The value of an asset that generates cash flows can be written as the present value of the expected cash flows from that asset, discounted back at a discount rate that reflects the risk. The value of a risky asset can be estimated by discounting the expected cash flows on the asset over its life at a risk-adjusted discount rate:
where the asset has a n-year life, E(CFt) is the expected cash flow in period t and r is a discount rate that reflects the risk of the cash flows. In this approach, the numerator is the expected cash flow, with no adjustment paid for risk, whereas the discount rate bears the burden of risk adjustments.
Alternatively, we can replace the expected cash flows with the guaranteed cash flows we would have accepted as an alternative (certainty equivalents) and discount these at the risk-free rate:
where CE(CFt) is the certainty equivalent of E(CFt) and rf is the risk-free rate.
Note that the key sets of inputs are the certainty equivalent cash flows, which bear the burden of risk adjustment. The discount rate is the risk-free rate.
With both approaches, the present value of the cash flows will be the risk- adjusted value for the asset.
Risk-Adjusted Discount Rate
To adjust discount rates for risk, we must use a risk and return model. In this section, we will examine how best to estimate the inputs for the simplest of these models (the CAPM) but much of what we say about these inputs can be replicated for more complex risk and return models.
thREE stEps in EstimatinG valuE
There are three steps in estimating value, using risk-adjusted discount rates:
1. Estimate the expected cash flows from a project/asset/business. If there is risk in the asset, this will require us to consider/estimate cash flows under different scenarios, attach probabilities to these scenarios, and estimate an expected value across scenarios. In most cases, though, it takes the form of a base case set of estimates that captures the range of possible outcomes.
2. Estimate a risk-adjusted discount rate. While there are a number of details that go into this estimate, consider that a risk-adjusted discount rate has two components:
Risk-Adjusted Rate = Risk-Free Rate + Risk Premium3. Take the present value of the cash flows at the risk-
adjusted discount rate. The resulting value will be the risk-adjusted rate.
In the sections that follow, we focus on Step 2, and then use an example to illustrate all three steps.
Value of asset= + + ...+E(CF1) E(CF2) E(CF3) E(CFn)
(1+r) (1+r)2 (1+r)3 (1+r)n
Value of asset= + + ...+CE(CF1) CE(CF2) CE(CF3) CE(CFn)
(1+rf) (1+rf)2 (1+rf)
3 (1+rf)n
Risk Taking: a CoRpoRaTe goveRnanCe peRspeCTive18

19MeasuRing value: Risk-adjusTed value
adjustinG disCount RatEs foR Risk
If we start with the presumption that a business can raise funds for investments from one of two sources (borrowed money (debt) or owners’ money (equity)) we can boil down the process for adjusting discount rates for risk into several inputs, as shown in Figure 4.1.
With cost of equity, we need three inputs to estimate the risk-adjusted rate: a risk- free rate, an equity risk premium, and a beta. With the cost of debt, we need three inputs as well: the risk-free rate, a default spread for the debt, and a tax rate to use in adjusting the cost of debt for its tax advantages.
input 1: the Risk-free Rate
On a risk-free asset, the actual return is equal to the expected return. Therefore, there is no variance around the expected return. For an investment to be risk free, it must come with:
• Nodefaultrisk:Sincetherecanbenouncertaintyaboutthe return on the investment, the entity promising the cash flows can have no default risk.
• Noreinvestmentrisk:Asix-monthTreasurybillrateisnot risk free for an investor looking at a ten-year time horizon, even if we assume that there is no default risk in the U.S. government. This is because the returns are guaranteed only for six months and there is uncertainty about the rate at which you can invest beyond that period.
With these two criteria in place, two propositions follow about risk-free rates.
Proposition 1: Time horizon matters. The risk-free rates in valuation will depend upon when the cash flow is expected to occur and will vary across time. Thus, a six-month risk-free rate can be very different from a ten-year risk-free rate in the same currency at the same point in time.
Figure 4.1: Cost of Equity: Rate of Return Demanded by Equity Investors
has to be default free, in the same currency as cash flows, and defined in same terms (real of nominal) as the cash flow
Cost of equity based upon bottom-up beta
Weights should be market value weights
Cost of borrowing should be based upon 1. synthetic or actual bond rating2. default spreadCost of Borrowing = Riskfree + default spread
marginal tax rate, reflecting tax benefits of debt
Historical Premium1. mature Equity market premium:average premium earned by stocks over t.Bonds in u.s.2. Country risk premium= Country default spread* (Equity/Country bond)
Implied PremiumBased on how equity is priced today and a simple valuation model
Cost of Equity: Rate of Return demanded by equity invstors
Cost of Capital: Weighted rate of return demanded by all investors
Cost of Equity = Risk free Rate + Beta x (Risk premium)
Cost of Capital = Cost of Equity (equity/(debt + Equity)) + Cost of Borrowing (1-t) (debt/(debt + Equity))
or

Risk Taking: a CoRpoRaTe goveRnanCe peRspeCTive20
Proposition 2: Not all government securities are risk free. Most practitioners use government security rates as risk-free rates, making the implicit assumption that governments do not default on local currency bonds. Some governments face default risk, so the rates on the bonds they issue will not be risk free.
In Figure 4.2, we illustrate this principle by estimating risk-free rates in various currencies. While we assume that the government bond rates in Japan, Switzerland, and the United States are the risk-free rates for the currencies in these countries (the Japanese yen, the Swiss franc and the U.S. dollar), we adjust the government bond rates in Colombia and Peru for the default risk embedded in them. With the euro, we use the German euro bond rate as the risk-free rate, since it is the lowest of the ten-year euro-denominated government bond rates.
It also is worth noting that risk-free rates vary across currencies because of differences in expected inflation; currencies with high expected inflation will exhibit high risk-free rates.
input 2: Beta(s)
Given that beta is a measure of relative risk, what is the best way to estimate it? In conventional corporate finance and valuation, the answer is to run a regression of returns on the stock of the company in question against the market index.
The slope of the regression is the beta. This is illustrated for a Peruvian construction company, Grana Montero, in Figure 4.3.
Regressing weekly returns on Grana Montero from August 2008 to July 2010 against the Peruvian Lima General Index, the beta for the company is 0.349. We should be skeptical about this number for three reasons:
• Itlooksbackward.Sincearegressionisbasedonreturnsearned by owning the stock, it has to be historical and does not reflect the current business mix and financial leverage of the company. Thus, the regression above, run in August 2010, uses data from 2008 to 2010 to estimate the beta for the company. Even if it is accurate, it gives you a beta for that period rather than for the future.
• Itisestimatedwitherror.Thestandarderrorofthebetais 0.083, suggesting that the true beta for Grana Montero can be much higher or lower than the reported value; the range on the beta from this regression, with 99 percent confidence, would be 0.09–0.60.2
• Itisdependentonhowtheregressionisstructuredandwhether the stock is publicly traded in the first place. The beta we would obtain for Grana Montero would be very different if we used a different time period (five years instead of two), a different return interval (daily instead of weekly) or a different market index (a different Peruvian Index or a broader Latin American or global index).
0%
1%
2%
3%
4%
5%
6%
7%
Default Spread
Riskfree Rate
PeruvianSul
Colombian Peso
US dollar
EuroSwiss Francs
Japanese Yen
1.10
%
2.2
5%
2.7
5%
3.0
0%
4.7
5%
2.0
0%
2.0
0%
4.0
0%
Figure 4.2: Estimating Risk-Free Currency Rates
Figure 4.3: Measuring Relative Risk for Grana Montero
2 Coefficients on regressions are normally distributed. A 99 percent confidence interval is plus or minus three standard deviations.

21MeasuRing value: Risk-adjusTed value
As an alternative, it is worth thinking about the determinants of betas, the fundamental factors that cause some companies to have high betas and others to have low betas. The beta for a company measures its exposure to macroeconomic risk and should reflect:
– Products and services it provides and how discretionary these goods and services are: Firms that produce products or services that customers can live without or can hold off on purchasing should have higher betas than firms that produce products and services that are necessities.
– Fixed cost structure: Firms that have high fixed costs (high operating leverage) should have more volatile income and higher betas than firms with low fixed costs.
– Financial leverage: As firms borrow money, they create fixed costs (interest expenses) that make their equity earnings more volatile and their equity betas higher. In fact, the beta for equity in a firm can be written as a function of the beta of the businesses that the firm operates in and the debt to equity ratio for the firm:
Levered (Equity) Beta = Unlevered Beta (1 + (1- tax rate) (Debt/Equity))
A better estimate of beta for a firm can be obtained by looking at the average betas for the businesses that the firm operates in, corrected for financial leverage.
For example, Grana Montero, the Peruvian company, is in three businesses: software and software consulting, construction, and oil extraction. Using estimated betas for each of these businesses and the revenues that Grana Montero derives from each one as weights, we obtain the unlevered beta for the firm:
Revenues % of
FirmUnlevered Beta
for business
Construction 1453 77.58% 0.75
Oil Extraction 225 12.01% 0.90
Software Consulting 195 10.41% 1.20
1873 0.81
In August 2008, the firm had outstanding debt of 433 million Peruvian soles and equity market value of 2.4 billion soles. Using Peru’s 30 percent corporate tax rate, we can estimate the beta for the equity in the company:
Levered Beta = 0.81 (1+ (1-.30) (433/2400)) = 0.92
Given such a situation, when a firm is in multiple businesses with differing risk profiles, it should hold each business up to a different standard, or hurdle rate. In the case of Grana Montero, for instance, the hurdle rates for investments will be much higher in software consulting than in construction.
input 3: Equity Risk premiums
The equity risk premium is the collective additional premium that investors demand for investing in any equities or risky assets. Two approaches can be used to estimate the number. The first approach looks at the past and estimates how much of a premium you would have earned investing in stocks as opposed to treasury bonds or bills over long time periods. In Table 4.1 we estimate for premiums ranging from 10 to 80 years.
The problem with using historical risk premiums is illustrated in the numbers in brackets in the table; these are standard errors in the risk premium estimates. Thus, even with an 80-year period (1928–2009), the estimated risk premium for stocks over treasury bonds comes with a standard error of 2.4 percent. With ten years of data, the standard errors drown out the estimates.
Table 4.1: Estimated Equity Risk Premiums
Arithmetic Average Geometric Average
Stocks – T. Bills
Stocks – T. Bonds
Stocks – T. Bills
Stocks – T. Bonds
1928–2009 7.53%(2.28%)
6.03%(2.40%)
5.56% 4.29%
1960–2009 5.48%(2.42%)
3.78%(2.71%)
4.09% 2.74%
2000–2009 -1.59%(6.73%)
-5.47%(9.22%)
-3.68% -7.22%

Risk Taking: a CoRpoRaTe goveRnanCe peRspeCTive22
An alternative is to estimate a forward-looking premium, using current stock prices and expected future cash flows. In Figure 4.4, for instance, we estimate an implied equity risk premium for the Standard & Poor’s 500 stock index on January 1, 2010.
In January 2010, the equity risk premium for the United States, and, by extension, other mature equity markets, was 4.36 percent. This number has been volatile, particularly in the last few years, going from 4.37 percent at the start of 2008 to 6.43 percent in January 2009, and back to 4.36 percent in 2010. Based on the previous number, it seems reasonable to use a 4.5 percent equity risk premium for mature markets, at least for 2010.
an adjustment for Country Risk
When a company operates in an emerging market, it is exposed to significantly more economic risk, arising from both political instability and the nature of the underlying economy. Even if we accept the proposition that an equity risk premium of about 4.5 percent is reasonable for a mature market, one might expect a larger risk premium when investing in an emerging market.
One simple way to adjust for this additional risk is to add on the default spread for the country in question to the mature market premium. Thus, the total equity risk premium for Peru, which has a sovereign rating of Baa3 and a default spread of 2 percent, would be 6.5 percent. A slightly more involved way of adjusting for country risk is to start with the default spread and adjust this default spread for the higher risk borne by equities in that market. Using Peru as the example again, the standard deviation in weekly returns over the last two years for Peruvian equities is 26 percent and the standard deviation in the bond is 13 percent.
Additional risk premium for Peru = 2% (26/13) = 4% Total equity risk premium for Peru = 4.5% + 4% = 8.5%
While neither one of these measures is perfect, they offer simple solutions to the country risk issue.
input 4: default spreads
To calculate to the cost of borrowing for a firm, we must assess the amount banks will charge to lend, over and above the risk-free rate. This “default spread” can be assessed in several ways:
Figure 4.4: Estimated Equity Risk Premium for the Standard & Poor’s 500, January 2010
1115.10= + + + + +43.29 46.40 49.74 53.32 57.16 57.16(1.0384)
(1+r) (1+r)2 (1+r)3 (1+r)4 (1+r)5 (r-.0384) (1+r)5
43.29 46.40 49.74 53.32 57.16
In 2010, the actual cash returned to stockholders was 40.38. That was down about 40% from 2008 levels.
Analysts expect earnings to grow 21% in 2010, resulting in a compounded annual growth rate of 7.2% over the next 5 years. We will assume that dividends & buybacks will keep pace.
Expected Return on Stocks (1/1/10) =8.20%T.Bond rate on 1/1/10 =3.84%Equity Risk Premium=8.20%-3.84% =4.36%
After 5, we will assume that earnings on the index will grow at 3.84%, the same rate at the entire economy (=riskfree rate).
January 1, 2010 S&P 500 is at 1115.10 Adjusted Dividends & Buybacks for 2008 =40.38

23MeasuRing value: Risk-adjusTed value
• For the fewcompanies thathavebonds ratedbya ratingagency, we can use the bond rating as a measure of default risk and estimate the spread based upon the rating. For example, the Walt Disney Company, the large American entertainment conglomerate, has an A rating from rating agency Standard & Poor’s. Based on this rating, the default spread in September 2010 was roughly 0.85 percent. Adding this to the ten-year bond rate at the time (2.5 percent) would have yielded a 3.35 percent pre-tax cost to borrow.
• For firms with no bonds and no ratings, estimate theinterest rate that they likely would have to pay on a long-
term bank loan today. This rate would be the pre-tax cost to borrow debt.
• Insomecases, it ispossibletoestimateasyntheticbondrating for a company, based on its financial ratios. This rating can be used to estimate a pre-tax cost of borrowing.
Default spreads change over time and reflect both economic uncertainty and investor risk aversion. Table 4.3 shows September 2010 default spreads for bonds in different ratings classes.
Australia 4.50%New Zealand 4.50%
Argentina 14.25%Belize 14.25%Bolivia 12.75%Brazil 7.50%Chile 5.85%Colombia 7.50%Costa Rica 8.25%Ecuador 19.50%El Salvador 19.50%Guatemala 8.25%Honduras 12.75%Nicaragua 14.25%Panama 8.25%Paraguay 14.25%Peru 7.50%Uruguay 9.75%Venezuela 11.25%
Albania 11.25%Armenia 9.00%Azerbaijan 8.25%Belarus 11.25%Bosnia and Herzegovina 12.75%Bulgaria 7.50%Croatia 7.50%Czech Republic 5.85%Estonia 5.85%Hungary 6.90%Kazakhstan 7.20%Latvia 7.50%Lithuania 6.90%Moldova 15.75%Montenegro 9.75%Poland 6.08%Romania 7.50%Russia 6.90%Slovakia 5.85%Slovenia [1] 5.40%Turkmenistan 12.75%Ukraine 12.75%
Bahrain 6.08%Israel 5.85%Jordan 7.50%Kuwait 5.40%Lebanon 12.75%Oman 6.08%Qatar 5.40%Saudi Arabia 5.85%United Arab Emirates 5.40%
Canada 4.50%Mexico 6.90%United States of America 4.50%
Austria [1] 4.50%Belgium [1] 4.95%Cyprus [1] 5.63%Denmark 4.50%Finland [1] 4.50%France [1] 4.50%Germany [1] 4.50%Greece [1] 6.08%Iceland 7.50%Ireland [1] 4.95%Italy [1] 5.40%Malta [1] 5.85%Netherlands [1] 4.50%Norway 4.50%Portugal [1] 5.40%Spain [1] 4.50%Sweden 4.50%Switzerland 4.50%United Kingdom 4.50%
Equity Risk Premiums January 2010
Table 4.2: Equity Risk Premiums, January 2010

Risk Taking: a CoRpoRaTe goveRnanCe peRspeCTive24
Table 4.3: Default Spreads, September 2010
Rating Moody’s/S&P Default Spread on Ten-Year Bond
Aaa/AAA 0.45%
Aa1/AA+ 0.50%
Aa2/AA 0.55%
Aa3/AA- 0.60%
A1/A+ 0.75%
A2/A 0.85%
A3/A- 1.05%
Baa1/BBB+ 1.50%
Baa2/BBB 1.75%
Baa3/BBB- 2.25%
Ba1/BB+ 3.50%
Ba2/BB 4.50%
Ba3/BB- 4.75%
B1/B+ 5.00%
B2/B 5.75%
B3/B- 6.25%
Caa/CCC+ 7.75%
Since default spreads can and often do change over time, such information must be updated on a frequent basis to reflect current levels.
input 5: tax Rates and Weights for debt and Equity
Two additional inputs are needed to calculate the cost of capital. The first is a tax rate to use in computing the after-tax cost of borrowing:
After-tax cost of borrowing = Pre-tax cost of debt (1- tax rate)
Since interest expenses save taxes on last dollars of income, the tax rate that should be used is a marginal tax rate. The best source for this rate is the tax code (and not the financial statements of the firm). To illustrate, the marginal tax rate in the United States is a cumulative value, based on a 35 percent federal corporate tax rate plus various state and local taxes. In 2010, the cumulative rate was estimated at approximately 40 percent.
The weights for computing the risk-adjusted cost of capital should be market value weights, since the business has to raise debt and equity in the market to fund its projects at market rates. It also is worth noting that the risk-adjusted discount rate for an individual project may be based on target weights for the entire business, instead of a reflection of the actual funding mix for the project.
Calculating Risk-Adjusted Rates: A Hypothetical Disney Theme Park in Rio
In this example, we conduct an analysis for a hypothetical theme park that The Walt Disney Company would build in Rio De Janeiro, Brazil in early 2009. Table 4.4 estimates expected cash flows from the theme park to the company, based on projections of revenues, operating expenses and taxes.
To calculate risk-adjusted discount rates, we follow these steps:
1. Since the cash flows were estimated in dollars, the risk-free rate is the U.S. treasury bond rate at the time, 3.5 percent.
Table 4.4: Expected Theme Park Cash Flows
0 1 2 3 4 5 6 7 8 9 10
Operating Income $0 -$50 -$150 -$84 $106 $315 $389 $467 $551 $641 $658
Taxes $0 -$19 -$57 -$32 $40 $120 $148 $178 $209 $244 $250
Operating Income after Taxes $0 -$31 -$93 -$52 $66 $196 $241 $290 $341 $397 $408
+Depreciation & Amortization $0 $50 $425 $469 $444 $372 $367 $364 $364 $366 $368
-Capital Expenditures $2,500 $1,000 $1,188 $752 $276 $258 $285 $314 $330 $347 $350
-Change in Working Capital $0 $0 $63 $25 $38 $31 $16 $17 $19 $21 $5
Cash flow to Firm -$2,500 -$981 -$918 -$360 $196 $279 $307 $323 $357 $395 $422
+Pre-Project Investment $500 $0 $0 $0 $0 $0 $0 $0 $0 $0 $0
-Pre-project Depreciation $0 $19 $19 $19 $19 $19 $19 $19 $19 $19 $19
+Fixed G&A (1-t) $0 $0 $78 $109 $155 $194 $213 $234 $258 $284 $289
Incremental Cash flow to Firm -$2,000 -$1,000 -$859 -$270 $332 $454 $501 $538 $596 $660 $692

25MeasuRing value: Risk-adjusTed value
2. The beta for the theme park business is 0.7829. This was estimated by looking at publicly-traded theme park companies.
3. The risk premium was composed of two parts, a 6 percent mature market premium (the premium used in 2009) and an additional 3.9 percent risk premium for Brazil.
Country risk premium for Brazil = 3.95% Cost of equity in US$= 3.5% + 0.7829 (6%+3.95%) =
11.29%
4. In early 2009, the company had a 6 percent pre-tax cost of debt, based on its A rating, a 2.5 percent default spread, and a 38 percent marginal tax rate:
After-tax cost of debt = (3.5% + 2.5%) (1-.38) = 3.72%
5. The company uses a mix of 35.32 percent debt and 64.68 percent equity to fund its existing theme parks. Using these inputs, we can estimate the cost of capital for the hypothetical Rio project:
Cost of capital in US$ = 11.29% (0.6468) + 3.72% (0.3532) = 8.62%
6. We discount the expected cash flows back at the 8.62 percent risk-adjusted discount rate to arrive at a value for the theme park, net of costs, shown in Table 4.5.
The risk-adjusted value for the Rio theme park is $2.877 billion.
Certainty Equivalents
In the certainty equivalent approach, we adjust the expected cash flows for risk, rather than the discount rate, and use the risk-free rate as the discount rate. Adjusting the risk of expected cash flows is the most important aspect of this approach. This adjustment can be calculated using several methodologies, including: • Computecertaintyequivalents,usingutilityfunctions.
This is very difficult to do and not worth exploring in most cases.
• Subjectively estimate a “haircut”—decrease—to theexpected cash flows. This is arbitrary and can lead to different analysts making different judgments of value, based on their risk aversion.
• Convert expected cash flow to a certainty equivalent.This approach is the most straightforward, but it requires an estimate of the risk-adjusted cash flows as a first step.
Once we have determined the risk-adjusted cash flows, we can discount them at the risk-free rate.
Certainty Equivalent Value: Rio Theme Park Example
To estimate the certainty equivalent cash flows, we used the 8.62 percent risk-adjusted discount rate that we obtained for the company’s Rio project in conjunction with the 3.5 percent risk-free rate to adjust each cash flow. To illustrate, the certainty equivalent for the $332 million expected cash flow in Year 4 can be computed as follows:
Certainty Equivalent for Year 4 = $332 =$274
Repeating this process with each cash flow yields the certainty equivalent cash flows for each year. Discounting all of the cash flows back at the risk-free rate of 3.5 percent yields a risk-adjusted value for the theme park, as shown in Table 4.6.
Table 4.5: Values for Hypothetical Rio Theme Park
Year Annual Cash Flow
Terminal Value
Present Value
0 -$2,000 -$2,000
1 -$1,000 -$921
2 -$860 -$729
3 -$270 -$211
4 $332 $239
5 $453 $300
6 $502 $305
7 $538 $302
8 $596 $307
9 $660 $313
10 $692 $10,669 $4,970
Net Present Value $2,877
1.0354
1.0862

Risk Taking: a CoRpoRaTe goveRnanCe peRspeCTive26
The risk-adjusted value for the theme park is $2,877 million, identical to the value that we obtained with the risk-adjusted discount rate approach.
Implications for Decision Makers
Any firm involved in risky activities has to make a good faith effort to estimate the amount of risk exposure for every part of the business, as well as how this exposure translates into a risk-adjusted discount rate. Thus, different components of the same business, with different risk exposures, can have different risk-adjusted rates. These rates can be used in
risk-adjusting value, either as discount rates for expected cash flows, or as adjustment factors in deriving certainty equivalents.
While managers might believe that that risk and return models are flawed or that the estimates used in the models are incorrect, this skepticism cannot be viewed as a reason for not estimating risk-adjusted discount rates or using arbitrary numbers.
SECTION TASK: RISK-ADJUSTED VALUE
Risk-Adjusted Discount Rates
1. Does your firm have a hurdle rate for assessing investments? If so, do you know (roughly) what it is right now?
2. Has this hurdle rate changed over time? Why?3. Is there only one hurdle rate for all investments or do you
have different hurdle rates for different investments? If you use different hurdle rates for different investments, what is the reason?
Risk-Adjusted Cash Flows
Do you adjust your cash flows for risk?If so, how are they adjusted for risk?
• “Haircut”cashflowsonriskyinvestments• No established approach but it gets done by individual
decision-makers• IthappensandIhavenoideahowithappens• Other(pleasedescribe)
Table 4.6: Risk-Adjusted Value for Hypothetical Rio Theme Park (in millions of U.S. dollars)
Year Annual Cash Flow
Terminal Value
Certainty Equivalent
Present Value
0 -$2,000 -$2,000 -$2,000
1 -$1,000 -$953 -$921
2 -$860 -$780 -$729
3 -$270 -$234 -$211
4 $332 $274 $239
5 $453 $356 $300
6 $502 $375 $305
7 $538 $384 $302
8 $596 $405 $307
9 $660 $427 $313
10 $692 $10,669 $7,011 $4,970
Net Present Value $2,877

27Managing Risk: enTeRpRise appRoaChes
v. MANAGING RISK: ENTERPRISE APPROAChES
Risk Management and Enterprise Value
ERM (or Corporate Risk Management) is a strategic support activity. It creates business value through an integrated process of identification, estimation, assessment, handling, and controlling of risk.
Classical finance assumes market efficiency when assessing the value of the firm. It only focuses on the “beta” to estimate the risk embedded in the company, as we saw in the discussion of the CAPM. In contrast, ERM recognizes the imperfection of markets, imperfect diversification of the investment portfolio, and bankruptcy costs. It allows an enterprise to create value by managing risks. ERM takes a much broader perspective on risk. It introduces a way to think about the enterprise processes that involves a proactive approach to management by directors, managers and employees. Despite differences in view about the beta, ERM techniques use discontinued cash flow valuations to aid decision making on risk treatment.
ThemeIn this section we link enterprise approaches, also known as ERM, with the more established, classical risk-adjusted value approach covered in the previous section and explain how this new approach can contribute to value creation. The section details the steps of a typical ERM process, with specific directions on how to apply these techniques.
Enterprise Risk Management (ERM)
“A comprehensive and integrated framework for managing credit risk, market risk, operational risk and economic capital and risk transfer in order to maximize firm value” (Lam 2003)
“Dealing with uncertainty for the organization.” (Monhanan 2008)
“RM is the identification, assessment, and handling of risks enacted through (coordinated) corporate actions to monitor, control, and minimize the adverse effect of unfortunate events or maximize the realization of opportunities.” (Andersen 2010)
“Risk management is a central part of any organization’s strategic management. It is the process whereby organizations methodically address the risks attaching to their activities with the goal of achieving sustained benefit within each activity and across the portfolio of all activities.” AIRMIC 2010 (Risk Management Standard)

Risk Taking: a CoRpoRaTe goveRnanCe peRspeCTive28
The corporate decisions targeted by ERM analysts are all relevant in terms of value generation. ERM is an active approach to risk governance that leads to better investments (maximization of cash flow generated by investments) and aims to reduce the cost of capital. In doing so it helps maximize the company value.
As with the definition of risk there is no universal agreement on the process to be followed in the implementation of ERM. For the purposes of this section we use the AIRMIC3 approach as a starting point and add a few refinements of our own. Others may wish to use frameworks such as COSO.4
Regardless of the approach taken, whether AIRMIC, COSO or another emerging standard, a good risk management process must help the enterprise to:
• Definerisksacceptabletotheenterpriseasawhole—riskpolicy
• Developalistofactualandpotentialrisks• Assessbothlikelihoodandconsequences(impact)ofthe
previously identified risks• Buildavalue-basedmodelthatcanestimatetheimpact
of risks on firm value through impacts on cash flows and/or cost of capital
• Determinerisksthecompanyshouldretain,transfer,oravoid
The process certified by AIRMIC requires the analysis to be carried out in four sequential stages:
1. Identification of risk management and enterprise objectives
2. Risk assessment3. Risk treatment4. Risk monitoring
Corporate Finance and ERM Objectives Converge
SHAREHOLDER VALUE MAXIMIZATION
ACTIVE RM AIMS TO MAXIMIZE SHAREHOLDERS’ VALUE
Value of asset=
T
t=0∑ CFt
(1+r)t
MAXIMIZE EXPECTED CASH FLOWS through ACTIVE RM to generate incremental positive cash flow, mainly through tax optimization and smoothing of earnings
MINIMIZE RISKS through ACTIVE RM lowering cost of capital and default risk default spread
The AIRMIC Enterprise Risk Management Process
Source: AIRMIC
The Organization’s Strategic Objectives
Risk AnalysisRisk IdentificationRisk DescriptionRisk Estimation
Risk Evaluation
Formal Audit
Risk ReportingThreats and Opportunities
3 Association of Insurance and Risk Managers. http://www. airmic.com 4 Committee of Sponsoring Organizations of the Treadway Commission
Risk Assessment
Decision
Risk Treatment
Residual Risk Reporting
Monitoring
Mod
ifica
tion

29Managing Risk: enTeRpRise appRoaChes
STEP 1: Identification of Risk and Enterprise Management Objectives
This is primarily a managerial phase. It begins with determining the enterprise’s approach to risks, including planning for the resources made available for risk management and selecting the general criteria for treating risks. The enterprise selects a risk strategy compatible with the degree of risk aversion that prevails. The directors and managers define strategic objectives and operational goals compatible with the risk aversion of the shareholders who are looking to maximize enterprise value. In this context, all ERM decisions should be made after responding to this simple question: “What impact do top managers’ decisions (hedging or retention action) have on the value of the enterprise for its shareholders?”
STEP 2: Risk Assessment
The second, largely technical, phase of the ERM process is divided into two sub-phases:
• Riskanalysis• Riskevaluation
The risk analysis consists of risk identification and estimation. In the identification of enterprise risks we must identify the potential sources of negative events that are capable of compromising achievement of strategic and operational objectives. Due to the potential losses that might arise, the emphasis will be on identifying downside risk, but the process should also elicit the upside risk and its beneficial effects on enterprise performance.
The Risk Management Process
1Setting firm’s risk
management goals and implementation on the CG structure
2Risk assessment
3Risk treatment
4Risk monitoring
2A. Risk Analysis 2B. Risk Evaluation
Risk Identification/Description Risk Estimation

Risk Taking: a CoRpoRaTe goveRnanCe peRspeCTive30
Useful qualitative analytical tools for risk identification include brainstorming, questionnaires and risk assessment workshops. Additional tools include review of publicly available documents for industry benchmarks, as well as investigation of previous incidents and auditing and inspection documents. Business studies focused on internal and external procedures and scenario analysis also can be useful in gaining a better understanding of the potential risk factors.
Once the risks are identified, they need to be described. In this second part of the identification phase, the ERM team creates risk maps in which the failure events are described using the following characteristics:
• Name• Qualitativedescriptionofrisk• Principalup/downsidescenarios• Probabilityofoccurrence• Identityofpersoninchargeofmanagingidentifiedrisks• Measurementtechniquestomonitoridentifiedrisks• Preliminary evaluation of the economic impact of the
scenarios presented
Risk Identification: Definition and Tools
Risk identification sets out to identify an organization’s exposure to uncertainty.
Risk identification requires intimate knowledge of the firm, the market in which it operates, the legal, social, political, and cultural environment, and sound understanding of its strategic and operational objectives, including factors critical to its success and the threats and opportunities related to achieving of its objectives.
AVAILABLE TECHNIQUES INCLUDE:
• Brainstorming• Questionnaires• Business studies on business processes describing
both the internal processes and external factor determinants
• Industry benchmarking• Scenario analysis• Risk assessment workshops• Incident investigation• Auditing and inspection• HAZOP (Hazard & Operability Studies)
Emerging Market Participants Example: Major Risks (Risk identification contributed by workshop participants)
NigeriaGovernment policy changesPhysical securityExchange rate fluctuationsIT breakdownElectrical power fluctuationsCustomer receivablesReceivables from stateTheft
VietnamInflationForeign exchange changesRegulatory changesFloodingOperational disruptions
IndiaRegulatory changesTax ratesProject failureUnionsEnvironmental issuesAccess to resourcesCorruption
NepalRebel insurgencyPolitical instabilityElectrical power fluctuationsSkilled labor
ZambiaElectrical power fluctuationsCopper price changesIT FailuresFloodingRegulatory changesCompetitionReputation
UzbekistanEarthquakesRegional political instabilityRegulatory changesCotton price changesGold pricesPolitical restrictions

31Managing Risk: enTeRpRise appRoaChes
Such a risk map is more detailed than the risk profile. However, it should be noted that there is no single best practice for mapping risks. Many firms can simply list risks related strategic and operational objectives as part of a risk profile.
Risk Estimation
Once the risk map is known, the enterprise must quantify the probability of the event as well as its impact on cash flows, estimating expected and unexpected losses and/or upsides. Based on the nature of tools used, the estimation methods are divided into three main groups:
• Purelyqualitativeestimates• Semi-quantitativeestimates• Purelyquantitativeestimates
Purely Qualitative Estimates
Qualitative methods use descriptive words or scales of value to illustrate the impact and the probabilities of an event. Among the various methods used for qualitative estimates, the Probability-Impact Matrix is among the most common.
Using the P-I Matrix for risk management involves creating a matrix in which risks are identified and classifying the identified risks.
Creating a P-I Matrix requires defining the following:
• Aqualitative scale that indicates theprobabilityof theoccurrence of a given event. Generally, these observations are grouped into five probability classes: almost certain, very frequent, moderate, improbable, and rare.
• Aqualitativescalerepresentingthe impact, that is, thepossible economic consequences from the occurrence of the event. Generally, there are five impact classes: insignificant, low, moderate, severe, and catastrophic.
• A qualitative scale that assigns a risk rating to everycombination of elements (probability-impact). This can take on four different values: extreme, high, moderate, and low.
• Appropriatecriteriaforariskratingassessment.
In Table 5.1, we provide an example of a P-I Matrix.
The Estimation Phase
Risk estimation can be quantitative, semi-quantitative or qualitative in terms of the probability of occurrence and the possible consequence.
• Qualitative methods: Probabilities and consequences of events (catastrophic to insignificant) are estimated according to qualitative scaling (analysts’ bias).
• Semi-quantitative methods: Qualitative scaling is weigthed and transformed into a quantitive scale and a P-I risk synthetic score is computed.
• Quantitive methods: Risk is estimated through quantitive methods as such Scenario Analysis, Decision Tree, Monte Carlo Simulation or according to the Value-at-Risk Models. These methods rely on causal distribution estimation (subjective and/or objective methods).
Table 5.1: Probability-Impact Matrix Structure
Probability Impact
Insignificant Low Moderate Severe Catastrophic
Almost certain (>50%) High High Extreme Extreme Extreme
Very frequent (20%–50%) Moderate High High Extreme Extreme
Moderate (5%–20%) Low Moderate High Extreme Extreme
Improbable (1%–5%) Low Low Moderate High Extreme
Rare (<1%) Low Low Moderate High High
Legend: Insignificant: Very low impact events of marginal consequenceLow: Management of event risks using routine procedures and controlsModerate: Requires the identification of an individual responsible for its management and monitoringSevere: Careful risk evaluation by the officer at the highest hierarchical levelExtreme: Requires a maximum level of attention and an immediate intervention for risk treatment

Risk Taking: a CoRpoRaTe goveRnanCe peRspeCTive32
The next step is to assign all previously identified risks to one class of probability and impact. The quality of the results depends on how carefully this step is carried out. It is important to note that the outcome will be affected by the subjective approach of the analyst.
The P-I Matrix is simple to prepare and use. However, it is a screening tool only for pure downside risks. This method overlooks potential beneficial upside effects.
Semi-Quantitative Estimates
The semi-quantitative estimate method transforms a series of qualitative judgments into quantitative variables, using numerical scoring systems to arrive at a risk score—a numerical synthetic risk judgment. The transformation takes place when the analyst attaches a score to each qualitative probability and impact class on the P-I Matrix. This yields two set of scores: one for probability and one for impact. The risk severity is determined but multiplying the probability score by the impact score. For example, an event that is probable and would have severe impact on the corporation will score 50x200=1000. The sum of all risk scores yields the company’s cumulative risk score. This cumulative risk score is called the Severity Risk Index— or Risk Score—as shown in Table 5.2.
Table 5.2: Calculating the Risk Score
Probability Score
Almost certain 100
Probable 50
Moderate 25
Improbable 5
Rare 1
Impact Score
Catastrophic 1000
Severe 200
Moderate 50
Low 10
Insignificant 1
Pure Quantitative Estimates
The principal goal of quantitative methodologies is to estimate the distribution of probability of risky events. The most frequently used quantitative methods are “probabilistic approaches” such as sensitivity analysis, scenario analysis, decision tree methodology, and simulation. In addition, the Value at Risk (VaR) technique is typically based on the Monte Carlo simulation that is often used in financial calculations. The VaR technique is mainly used in the financial industry.
A quantitative estimation process involves estimating the potential losses from a particular risk. There are four steps required to perform this analysis.
1. Build a causal model on event probability.2. Estimate individual input distributions using historical
data or simulations.3. Estimate the outcome distribution according to the
inputs.4. Validate the model.
In the first step the analyst builds a causal model linking event and loss. The second step involves estimating the individual components of the model using historical data, such as the historical probability of fire in a particular neighborhood. In the third phase the analyst estimates the consequence of the event once the causal model is known and the distribution of probability of the individual model components is determined. The final step tests the model.
Risk Evaluation and Enterprise Value: The Value-Based Model
In this managerial phase, the analyst compares the output from the previous risk estimation phase to the risk policy limits that the board establishes. The objective is to determine whether the hedging decisions generate or destroy enterprise value based on the assumption that only decisions that affect cash flows or cost of capital are relevant.
Active risk management can increase the firm value if the costs generated in hedging a risk are lower than the loss suffered by the company in case of an incident. In Figure 5.1 we suggest an analytical approach to value generated by a hedging decision.
Risk Score
Extreme >5000
High 5000 500
Moderate 500 50
Low <50

33Managing Risk: enTeRpRise appRoaChes
STEP 3: Risk Treatment: Principal Strategies and Methods
All risks that are identified, estimated, and evaluated are subject to a risk treatment decision. There are four potential outcomes of the decision:
1. Risk avoidance2. Risk transfer3. Risk reduction4. Risk retention
The risks are alternatively avoided or accepted. If accepted, they can be retained by the firm, reduced through diversification (risk reduction) or transferred to third parties (risk transfer). The risk treatment decision should be consistent with the guidance criteria of value maximization.
Risk Avoidance
Whenever a risk generated by a project is not consistent with the company risk policy, the decision maker should avoid this particular risk. The enterprises should avoid investing in projects if the cost of hedging is greater than the value generated by the project, resulting in destruction of value.
Risk Transfer, Also Known as Risk Hedging
Instead of avoiding risk altogether, management may decide to assume the risk generated by a project and pass along this
risk to a third party through risk hedging. Typically, this is done through purchase of insurance policies or financial derivatives that can reduce variability of cash flows and/or lower the cost of capital.
Useful tools to transfer risks to third parties include futures and options, swaps, insurance, and other more innovative financial products, such as risk-linked securities and contingent capital.
Risk Retention
Retention is the decision to maintain the risk in the enterprise. Typically, risks are retained in two different ways. Either they can be expressly retained according to the firm’s risk strategy or they are retained simply because they have not been identified and evaluated in the ERM process. Hence, as Shimpi notes, “A risk neglected is a risk retained.”5 The size and relevance of risk retained should guide the decision on how much equity to raise to sustain potential losses generated by the projects. The capital raised on the market should be proportionate to the risk retained by the firm. Inadequate capital can bring the firm into financial distress and might end in bankruptcy.
The Risk Evaluation Phase
• Managerialriskmanagementphase• Comparesestimatedrisksagainstriskcriteriaidentifiedby
the organization upon completion of risk analysis phase• Risk criteria include associated costs and benefits, legal
requirements, socioeconomic and environmental factors, stakeholders’ concerns among others
• Evaluationused tomakedecisions about the significanceof risks to the organization, whether to accept each risk, or whether to treat according to DCF model
Figure 5.1: The Individual Hedging Decision Value
The DCF framework is useful to rank preferences and to select risks to avoid, mitigate, or retain.
Where:• E(IHCFt
+) are the expected incremental positive cash flows generated by the hedging decision (i.e., tax advantage, greater efficiency in investing)
• Rj is the cost of equity =risk free + B*equity premium (if Beta =1, Rj = Rm)
• HC- are the negative cash flows associated with the hedging decision (i.e., cost of insurance)
• +/- ∆MI market imperfections (i.e., asymmetry of information, regulation, risk specific assets)
Hedging decision value= + ∆MI
T
t=0∑ E(IHCft
+)-CH-
(1+ri)t
5 Shimpi, P.A., Integrating Corporate Risk Management, Texere, New York, New York, 2001

Risk Taking: a CoRpoRaTe goveRnanCe peRspeCTive34
Risk Reduction, Diversification and Other Policies
The risk manager also can pursue a risk reduction behavior by engaging in a policy of investment portfolio diversification.
Diversification is a useful tool for risk reduction when the decision maker can split investments into diversified activities. In emerging markets, where conglomerates are a common organizational structure, conglomerate firms operating in these markets can reduce risk by investing in assets with uncorrelated returns.
STEP 4: Monitoring Incurred Risks
The last phase of the integrated risk management process is monitoring. This phase is both technical and managerial. Senior decision makers, including board members, must identify the risks to be monitored and middle managers need to ensure that these risks are reported. Regardless of who is responsible for which tasks, it should be noted that retained risks require monitoring. This monitoring is a check on the business variables identified as potential sources of risk that management has voluntarily decided to assume. Many boards review their P-I Matrix regularly or review their risk score as a way to monitor such risks. Among the considerations:
• Obsolescence of outcomes from the risk analysis:Decision makers must be aware of when key assumptions in their risk analyses no longer apply and when the environment changes drastically. In the 2008 crisis, many risk models failed because the normal distribution embedded in many models to estimate market risks was no longer applicable.
• Qualityandeffectivenessoftheriskprocess:Firmsmustmonitor and audit the risk management process itself. Board members and senior managers need to ensure the process remains appropriate and updated.
Implications for Decision Makers
This section provides a series of useful steps that can guide a decision maker in implementing ERM. Not all firms are able to implement a comprehensive ERM framework due to lack of resources. Still, it is important for all companies to identify and map their risks, including small- and medium-sized companies and early stage start-ups. As firms gain confidence and develop their risk management capacity, the full ERM process can be deployed.
Section Task: Implementing ERM
What are the five main risks faced by companies in your country?What are the five risks that affect your company the most?Work with another director/manager to design a P-I Matrix.
Tools for Risk Retention and Risk Transfer
• Capital structure: a mix of financers is important to mitigate both market and firm-specific risks
• Insurance-linked securities issued by the firm
• Insurance is good for almost all types of risk but insurance cannot protect against core business risk. No risk, no return!
• Forwards, futures, and options are important primarily to mitigate commodities and currency risk
• Swaps, such as interest rate swap, credit default swap, and currency swap address market risks
• Contingent capital
Risk Monitoring
Risk monitoring and control includes the following:
• Identify, analyze, and plan for new risks• Track identified risks and monitor trigger conditions• Review project performance information such as
progress/status reports, issues, and corrective actions• Re-analyze existing risks to see if the probability, impact,
or proper response plan has changed• Review the execution of risk responses and analyze their
effectiveness• Ensure proper risk management policies and procedures
are being utilized
In-B
alan
ce
Shee
t To
ols
Out
-Bal
ance
Sh
eet
tool
s

35Tools foR BeTTeR Risk deCision Making: pRoBaBilisTiC appRoaChes
vI. TOOLS fOR bETTER RISK DECISION MAKING: PRObAbILISTIC APPROAChES
Probabilistic Approaches
There are many ways to make uncertainty explicit in an analysis. The simplest way is to ask “what if?” questions about key inputs and look at the impact on value. This is called sensitivity analysis. It allows analysts to examine extreme outcomes and evaluate the sensitivity of the outcome to changes in individual assumptions.
Another approach is to estimate the outcomes and value under viable scenarios in the future, ranging from very good scenarios to very bad ones. Attaching probabilities to these scenarios yields a result.
A third approach—and arguably the most robust—is to use probability distributions for key inputs rather than expected values and run simulations in which a single outcome from each distribution is selected and the value is calculated. This simulation process is repeated many times and the resulting outcomes for the investment are presented to decision makers.
Sensitivity Analysis
The value of an investment and its outcome will change as the values ascribed to different variables change. One way of analyzing uncertainty is to assess the sensitivity of decision outcomes to changes in key assumptions. With
the advent of more powerful computers and more data this process has become easier. The analysis should focus on the two or three most important variables. The sensitivity analysis output should be presented succinctly, in a way that helps decision makers.
Scenario Analysis
Scenario analysis is best employed when the outcomes of a project are a function of the macroeconomic environment and/or competitive responses. As an example, suppose that Boeing, a leading global aircraft manufacturer, is considering the introduction of a new, large capacity airplane, capable of carrying 650 passengers, called the Super Jumbo, to replace the Boeing 747. Cash flows will depend on two major, uncontrollable factors:
• The growth in the long-haul, international market,relative to the domestic market. Arguably, a strong Asian economy will play a significant role in fueling this growth, since a large proportion of it will have to come from an increase in flights from Europe and North America to Asia.
• Thelikelihoodthatthecompany’sprimarycompetitor—Airbus—will come out with a larger version of its largest capacity airplane over the period of the analysis.
ThemeOne problem with risk-adjusted value approaches is that analysts are required to condense their uncertainty about future outcomes into a set of expected cash flows. Probabilistic ap-proaches take a richer and more data-intensive view of uncertainty, allowing for extreme outcomes, both good and bad. In the process, a better sense of how risk can affect a venture is developed, and enables consideration of appropriate ways to manage this risk. This section looks at such tools.
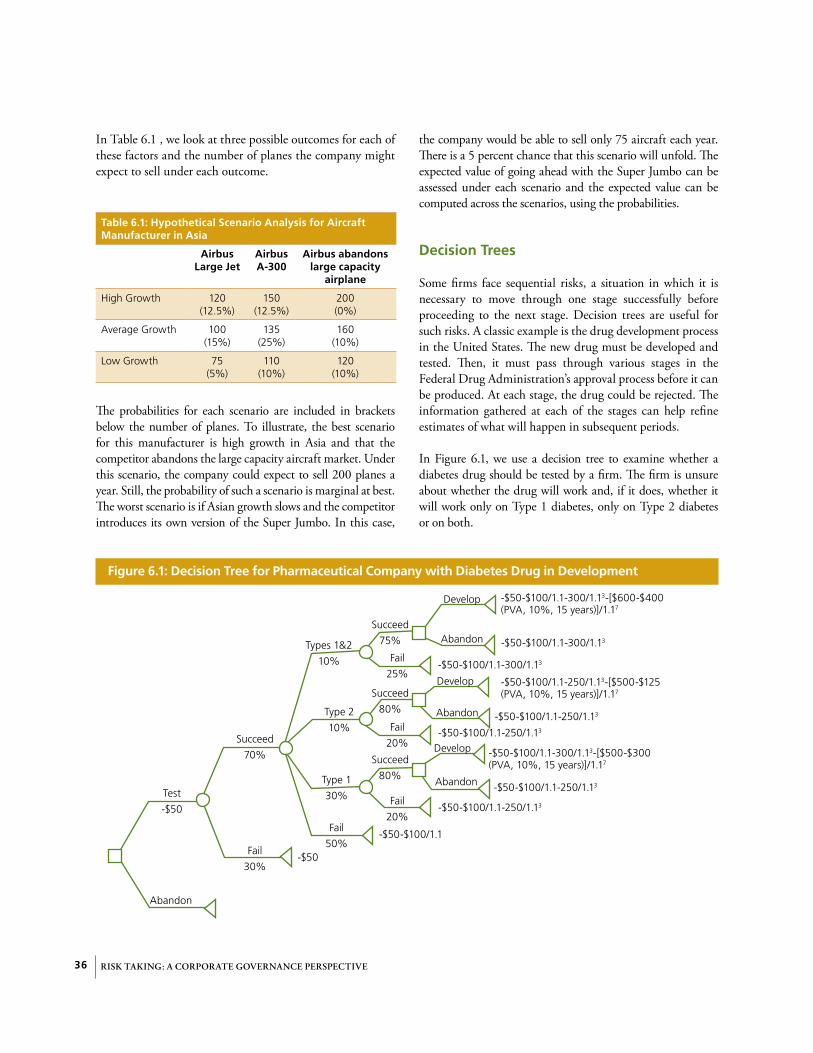
Risk Taking: a CoRpoRaTe goveRnanCe peRspeCTive36
In Table 6.1 , we look at three possible outcomes for each of these factors and the number of planes the company might expect to sell under each outcome.
Table 6.1: Hypothetical Scenario Analysis for Aircraft Manufacturer in Asia
Airbus Large Jet
Airbus A-300
Airbus abandons large capacity
airplane
High Growth 120 (12.5%)
150 (12.5%)
200 (0%)
Average Growth 100 (15%)
135 (25%)
160 (10%)
Low Growth 75 (5%)
110 (10%)
120 (10%)
The probabilities for each scenario are included in brackets below the number of planes. To illustrate, the best scenario for this manufacturer is high growth in Asia and that the competitor abandons the large capacity aircraft market. Under this scenario, the company could expect to sell 200 planes a year. Still, the probability of such a scenario is marginal at best. The worst scenario is if Asian growth slows and the competitor introduces its own version of the Super Jumbo. In this case,
the company would be able to sell only 75 aircraft each year. There is a 5 percent chance that this scenario will unfold. The expected value of going ahead with the Super Jumbo can be assessed under each scenario and the expected value can be computed across the scenarios, using the probabilities.
Decision Trees
Some firms face sequential risks, a situation in which it is necessary to move through one stage successfully before proceeding to the next stage. Decision trees are useful for such risks. A classic example is the drug development process in the United States. The new drug must be developed and tested. Then, it must pass through various stages in the Federal Drug Administration’s approval process before it can be produced. At each stage, the drug could be rejected. The information gathered at each of the stages can help refine estimates of what will happen in subsequent periods.
In Figure 6.1, we use a decision tree to examine whether a diabetes drug should be tested by a firm. The firm is unsure about whether the drug will work and, if it does, whether it will work only on Type 1 diabetes, only on Type 2 diabetes or on both.
Figure 6.1: Decision Tree for Pharmaceutical Company with Diabetes Drug in Development
Test
-$50
-$50
-$50-$100/1.1
-$50-$100/1.1-250/1.13
-$50-$100/1.1-250/1.13
-$50-$100/1.1-250/1.13
-$50-$100/1.1-250/1.13
-$50-$100/1.1-300/1.13
-$50-$100/1.1-300/1.13
-$50-$100/1.1-300/1.13-[$600-$400 (PVA, 10%, 15 years)]/1.17
-$50-$100/1.1-300/1.13-[$500-$300 (PVA, 10%, 15 years)]/1.17
-$50-$100/1.1-250/1.13-[$500-$125 (PVA, 10%, 15 years)]/1.17
Fail
30%
Fail
50%
Fail
25%
Fail
20%
Fail
20%
Succeed
70%
Succeed
75%
Succeed
80%
Succeed
80%
Types 1&2
10%
Type 2
10%
Type 1
30%
Abandon
Abandon
Develop
Develop
Develop
Abandon
Abandon

Thus, the firm will have to spend $50 million to test the drug. If the initial drug test is successful, with an estimated 70 percent probability, more extensive tests will help determine the type of diabetes it can treat. Probability estimates suggest a 10 percent chance that the drug will treat both diabetes types, a 10 percent chance that it will treat only Type 2, a 30 percent chance that it will treat only Type 1, and a 50 percent chance that it will not work at all. We then estimate how much value the firm is expected to extract from the drug in each of the paths.
Simulations
A simulation allows for the deepest assessment of uncertainty because it lets analysts specify distributions of values rather than a single expected value for each input about which they feel uncertain. Thus, if you are uncertain about operating margins, you can allow the margins to be normally distributed, for example, with an 8 percent expected value and a 2 percent standard deviation. After specifying distributions and parameters for the key inputs, a value picked from each distribution is extracted and the
outcomes are computed. This single simulation is repeated multiple times and the computed values are plotted as a distribution of possible outcomes.
Value at Risk (VAR)
Value at Risk, or VaR, measures the potential loss in value of a risky asset or portfolio over a defined period for a given confidence interval. Thus, if the VaR on an asset is $100 million in a one-week period at the 95 percent confidence level, there is a 5 percent chance that the value of the asset will drop more than $100 million over a given week.
VaR is comprised of:• Specifiedleveloflossinvalue• Fixedtimeperiodoverwhichriskisassessed• Confidenceinterval
The VaR can be specified for an individual asset, portfolio of assets, or for an entire firm. For an individual asset, the VaR is a simple extension of the probabilistic approaches.
Tools foR BeTTeR Risk deCision Making: pRoBaBilisTiC appRoaChes 37

Risk Taking: a CoRpoRaTe goveRnanCe peRspeCTive38
VaR has been used most widely at financial service firms, where the risk profile is constantly shifting and a big loss over a short period can be catastrophic. This is partly because these firms have comparatively small amounts of equity, relative to the bets that they make. It also is due, in part, to regulatory constraints. Thus, an investment bank will compute the VaR at the end of each trading period by aggregating the risks of all of the open positions in which the bank has capital at risk, including long and short positions.
To manage risk and keep it at levels that do not imperil survival, the investment bank will set a limit on the VaR. Typically, this limit is set by looking at the amount of the bank’s capital and how close the bank is operating to regulatory limits. Other things remaining equal, the more capital reserves a bank has, the greater its capital buffer in excess of the regulatory limit. If the internal VaR limit is exceeded, trading positions should be closed or modified to bring the VaR back within prudent limits.
The collapse of Bear Stearns and Lehman Brothers in 2008, as well as the near-death experiences of many other investment banks, is clear evidence that VaR, at least as practiced today, fails to do an adequate job in measuring risk in crisis periods. In fact, focusing on VaR as the central risk measure in a firm comes with several limitations:
• Focus is too narrow and the VaR can be wrong:Regardless of approach used to estimate VaR, it remains an estimate and can be wrong. In statistical terms, this means that the VaR estimate contains a large standard error.
• The “Black Swan”: No matter how they are framed,VaR approaches have their roots in the past. As long as markets are mean-reverting and stay close to historical norms, VaR will work. If there is a structural break, VaR may provide little or no protection against calamity. This is the “black swan” event that Nassim Nicholas Taleb popularized in his books Fooled by Randomness and The Black Swan. In his books, Taleb suggests that the focus on normal distributions and historical data leaves firms exposed to new risks that can potentially wipe them out.
SECTION TASK: PROBABILISTIC APPROACHES
1. Do you use probabilistic approaches in your firm?2. If yes, which approach do you use?
a. “What if?” analysisb. Scenario analysisc. Decision treesd. Simulation
3. If no, do you think that there is potential for a probabilistic approach? Do you use the Value at Risk approach in your firm?
4. If it is used, how often it is computed? 5. How is it computed?
a. Variance Covariance Matrixb. Historical simulationc. Monte Carlo simulation
6. If your firm uses VaR, does it also use other risk measures? Which ones?

39CReaTing value fRoM Risk Taking
vII. CREATING vALuE fROM RISK TAKING
How Risk Management Affects Value
ThemeWhen managing a firm’s risk, the ultimate objective is to make the firm more valuable. Thus, it is important to consider how risk management affects the value of a firm. The most straight-forward way to do this is to start with the conventional drivers of firm value and look at how individual risk management actions affect these drivers.
In this section, we also look at the costs and benefits of hedging and whether the firm should hedge, even if the benefits exceed the costs. What is the rationale for hedging? How can it increase the value of a business? We examine choices on hedging risk and address how to identify optimal hedging approaches.
Creating Value from Risk Management The Value of Risk Management
Exploit upside potential – reduce downside risk Does it pay to avoid potential losses and take advantage of new opportunities?
analyses of corporate data show positive relationships between effective risk management and average performance, after controlling for industry and size effects
The low performers are often unable to handle any exposures
The high performers can handle all types of risk including hazards, economic risks, operational risks, and strategic risks
Effective risk management can increase the average return and reduce the variance in return.
1. Pursue the potential of new opportunities
2. Cover against the potential for downside losses
3. Improve the risk-return profile
Perf
orm
ance
(R
OA
)
Effective risk management (ERM)1
So, the empirical evidence is favorable!
1ERM = the ability to handle external market volatilities and generate smooth net cash inflows or earnings over time
Source: Andersen, T. J., 2008, The Performance Relationship of Effective Risk Management: Exploring the Firm-Specific Investment Rationale, Long Range Planning, 41(2).

Risk Taking: a CoRpoRaTe goveRnanCe peRspeCTive40
Four sets of inputs determine the value of a business. These include:
• Cash flow generation from assets in place and investments already made
• Expected growth rate in the cash flows during periods of high growth and excess returns, when the firm earns more than its cost of capital on its investments
• Time period elapsing before the firm becomes a stable growth firm
• Discount rate that reflects the risk of the investments made by the firm and the financing mix used to fund them
These factors are illustrated in Figure 7.1.
valuE fRom Risk hEdGinG
Given that the value of the firm is a function of the cash flows from existing assets, the growth rates, the length of the competitive advantage period, and the cost of capital, a risk management action can affect the value of the firm if it alters one or more of these inputs.
Since our definition of risk encompasses both the upside and the downside, we can categorize risk management actions into those that are designed primarily to reduce
exposure to downside risk (risk-hedging actions) and those that are more generally focused on increasing exposure to upside risk (risk-taking actions). Thus, buying insurance or entering into forward or options contracts to cover foreign exchange exposure in the future would be classified as risk-hedging actions whereas introducing a new product or service or entering a new market would be categorized as risk-taking action.
The Costs of Hedging
The benefits of hedging must be weighed against the cost to do so. Costs can range from small to large, depending on the type of risk being hedged and the product used to hedge the risk. In general, the costs of hedging can be broken down into explicit costs, which show up as expenses in financial statements and implicit costs, which may not show up as expenses but can affect earnings in dramatic ways.
• Explicit costs: When companies hedge against risk by purchasing insurance or put options, the cost of hedging is the cost of buying the protection against risk. It increases costs and reduces income.
• Implicit costs: When buying or selling futures or forward contracts, there is no upfront explicit cost. However, there is an implicit cost. This process means
Cash flows from existing assets Operating income (1-tax rate)+ Depreciation-Maintenance Cap Ex= Cashflow from existing assetsFunction of both quality of past investments and efficiency with which they are managed
Growth Rate during Excess Return Phase Reinvestment Rate * Return on Capital on new investments Depends upon competitive advantages & constraints on growth
Length of period of excess returns: Reflects sustainability of competitive advantages
Discount Rate Weighted average of the cost of equity and cost of debt. Reflects the riskiness of investments and funding mix used
Figure 7.1: Factors Influencing the Value of a Business

41CReaTing value fRoM Risk Taking
forfeiting upside for downside protection. Thus, a gold mining company that buys futures contracts to lock in the price of gold might not face explicit costs at the time it enters into these agreements. In the future, though, the company could report sharply lower earnings in future periods, if gold prices exceed the futures price.
A Framework For Risk Hedging
Fundamentally, it makes sense for firms to hedge a risk if both of the following conditions hold:
• Thebenefitsofhedgingtheriskexceedthecosts:Bringingtogether the tax benefits, the reduced distress costs, and improved investment decisions, do the benefits exceed the costs? If the answer is no, the firm should not hedge that risk.
• Itislessexpensiveforthefirmtotakeresponsibilityforhedging the risk: Even if the benefits exceed the costs, the firm has to follow up by examining whether it is less expensive for the firm to hedge this risk or whether it makes more sense for investors to hedge on their own.
For example, firms facing exchange rate risk can choose to hedge this risk, but it might be less expensive for institutional investors to do so on their own, since some portion of the risk could be eliminated by the portfolio.
Figure 7.2 provides a flow chart for determining when it makes sense to hedge risk and when it does not.
Approaches to Hedging
Assuming that a firm has reached the conclusion that hedging risk makes sense, there are several ways in which it can reduce or eliminate its exposure to a specific risk.
• Investment choices: A firm might achieve a partial hedge against some types of risk by investing in many projects across geographical regions or businesses.
• Financing choices: Matching the cash flows on financing to the cash flows on assets can also mitigate exposure to risk. Thus, using peso debt to fund peso assets can reduce peso risk exposure.
Figure 7.2: When Is It Appropriate to Hedge Risk?
What is the cost to the firm of hedging this risk?
Negligible High
YES
YES
YES
YES
NO NO
NO
NO
Is there a significant benefit in terms of higher cash flows or a lower discount rate?
Is there a significant benefit in terms of higher cash flows or a lower discount rate?
Can investors hedge this risk at lower cost than the firm?
Will the benefits persist if investors hedge the risk instead of the firm?
Hedge this risk. The benefits to thefirm will exceed the costs
Hedge this risk. The benefits to thefirm will exceed the costs
Hedge this risk. The benefits to the firm will exceed the costs
Indifferent to hedging risk
Do not hedge this risk. The benefits are small relative to costs
Let the risk pass through to investors and let them hedge the risk.

Risk Taking: a CoRpoRaTe goveRnanCe peRspeCTive42
• Insurance: Buying insurance can provide protection against some types of risk. In effect, the firm shifts the risk to the insurance company in return for a payment.
• Derivatives: In the last few decades, options, futures, forward contracts, and swaps have all been used to good effect to reduce risk exposure.
Which choice is best? The answer will depend on the type of risk being hedged and on what the firm wants to accomplish through the hedge. • For complete, customized risk exposure, forward
contracts can be designed to a firm’s specific needs, but only if the firm knows these needs. The costs are likely to be higher and this could increase exposure to credit risk from the other party to the contract.
• Futures contracts offer a lower cost alternative to forward contracts, since they are traded on the exchanges and not customized. Plus, there is no credit risk. However, they may not provide complete protection against risk.
• Options contracts provide protection only against downside risk while preserving upside potential. This benefit has to be weighed against the cost of buying the options, which will vary depending on the amount of protection desired.
• lncombatingeventrisk,afirmcaneither self insure or use a third party insurance product. Self insurance makes sense if the firm can achieve the benefits of risk pooling on its own, does not need the services or support offered by insurance companies, and can provide the insurance more economically than the third party.
Implications for Decision Makers
The objective in risk management is to increase the value of a business. To accomplish this objective, it is important to consider the way in which a given risk management action will translate into one of the business value inputs: cash flows from existing assets, value-adding growth, length of the competitive advantage period, and cost of capital. Actions that do not affect any of these inputs are value neutral, so time spent on them is time wasted. Actions that reduce value are perverse and should be eliminated from the risk management list.
Hedging decisions should not be based on inertia (we have always hedged that risk) or on fear. They have to be based on an assessment of the risks the firm faces and whether it makes economic sense to hedge some or all of these risks. Hedging risks can create more stable earnings and cash flows while at the same time reduce the value of the firm, because the costs exceed the benefits.
Section Task: Value and Risk at Your Firm
Do you have a risk manager or someone responsible for risk management at your firm?
• Ifyes,whatisthejobdescription?Isittomeasureriskandreport to top management, monitor risk taking, hedge risks or something else?
• Ifno,howisriskmanagedinyourorganization?
Do you hedge risks at your firm?a. Yesb. Noc. Notsure
If you hedge risk, what types of risks do you hedge?a. Input cost risk: cost of raw materials used for operationsb. Outputpricerisk:priceofproductssoldc. Exchange rate risk
TYPES OF DERIVATIVES
Over-the-Counter (OTC) DerivativesForward foreign exchangeNon-deliverable forwardsCurrency swapsInterest rate swaps
Exchange-Traded DerivativesCurrency optionsInterest rate futuresCommodity futuresOptions on futures
SecuritizationsCollateralized debt obligationsMortgage-backed securities
Exotic Options, Structured Products and Non-Traditional DerivativesWeather, oil, natural gas and electricity derivativesAsian options, barrier options, basket options, compound
options, look back options, binary options

43exploiTing The Risk upside: sTRaTegiC Risk Taking and Building a Risk-Taking oRganizaTion
vIII. ExPLOITING ThE RISK uPSIDE: STRATEGIC RISK TAKING AND buILDING A RISK-TAKING ORGANIzATION
Strategic Risk Taking and Value Returning to the framework that related value to fundamental inputs, there are four basic inputs that drive value: cash flows from existing assets, the expected growth rate during the high growth period, the length of the competitive advantage period, and the cost of capital. Exploiting risk well can affect each of these inputs:
• Cashflows fromexistingassets:Better risk takingcanlead to more efficient operations and higher cash flows from existing assets.
• Higherexpectedgrowthrate:Moreefficientrisktakingcan lead to more reinvestment and higher returns on capital, both of which can translate into higher value-adding growth.
• Lengthofcompetitiveadvantagegrowthperiod:Goodrisk taking can be a significant competitive advantage by itself, but exploiting risks better than the rest of your competitors requires bringing something to the table that is unique and different.
• Discount rate: Risk taking that increases potentialupside, while minimizing or reducing downside risk, can provide the best of both worlds—higher cash flows and lower discount rates.
The impact of risk taking on each of the valuation inputs is captured in Figure 8.1.
ThemeRisk management is more than just risk hedging. In fact, successful firms, over time, can attribute their successes not to avoiding risk but to seeking out and taking the “right risks.” Success in risk taking is as much a result of design as of luck. A key choice for firms is the design of the organi-zation to optimize the benefits from risk taking. Risk taking occurs within a context that includes the firm’s leadership and culture, systems, and capabilities. In this section, we examine risks to exploit and organizational designs to help convert these risks into value increases.
Strategic Risks Within the Risk Profile
Risk categories Risk factors
Competitor movesNew regulationsPolicial eventsSocial changesChanging tasteNew technologies
Malfunction Process disruptionsAdminstrative errorsTechnology breakdown Compliance failureLegal exposures
General demandPrice relations Foreign exchange Interest ratesCommodity prices
Natural catastrophes Man-made disastersTerrorism eventsCasualties
Strategic risks:
Operational risks:
Economic risks:
Hazards:
SRM
Exo
gen
ou
sEn
do
gen
ou
sM
ost
ly E
xog
eno
us
ERM
RM
Source: Andersen, T. J. and P. W. Schrøder, 2010, Strategic Risk Management Practice, Cambridge University Press.

Risk Taking: a CoRpoRaTe goveRnanCe peRspeCTive44
Taking Advantage of Taking Risks
To exploit risk better than your competitors, you need to bring something to the table. Successful risk-taking firms can exploit several advantages, including:
• Information advantage: In a crisis, getting betterinformation and getting it early can be a huge benefit.
• Speed advantage: Being able to act quickly andappropriately can allow a firm to exploit opportunities that open up in the midst of risk.
• Experience/knowledge advantage: Firms and theirmanagers that have been through similar crises in the past can use what they have learned.
• Flexibility: Building in the capacity to change coursequickly can be an advantage when faced with risk.
• Resource advantage: Having superior resources canallow a firm to withstand a crisis that devastates its competition.
All crises put firms to the test, and while it is not fair, firms that have access to more resources, such as capital and personnel, are better positioned to survive than firms lacking these resources. Firms can gain a resource advantage through:
• Capital access: Being able to access capital markets allows firms to raise funds in the midst of a crisis. Firms that operate in more accessible capital markets should have an advantage over firms that operate in less accessible capital markets.
• Debt capacity: Preserving debt capacity is an advantage because this capacity can be accessed in times of crisis. Firms that operate in risky businesses should hold less debt than they can afford. In some cases, this debt capacity can be made explicit by arranging lines of credit in advance of a crisis.
Value today can be higher as a result of risk taking
Figure 8.1: Impact of Risk Taking on Valuation Inputs
Emerging Market Example: An Indian Conglomer-ate Exploits its Superior Access to Capital*
During the international economic crisis of 2008, Tata, an Indian conglomerate, was flush with cash. Prior to the crisis, the conglomerate had been building its cash resources as it foresaw future market instability. Once the crisis was fully upon the international financial market, Tata found that its sterling reputation and strong balance sheet allowed it to access capital despite the severe credit squeeze. Due to this foresight, Tata gained a liquidity advantage over its rivals. In this period, the conglomerate was able exploit this competitive advantage by negotiating several acquisitions at favorable prices. In fact, Tata was frequently the only buyer during such negotiations, because potential rivals could not finance the deal, due to lack of comparable access to cash.
* This example was provided by a workshop participant.
Cash Flows from existing assets Focused risk taking can lead to better resource allocation and more efficient operations, thus higher cashflow from existing assets.
Excess returns during high growth period: The competitive edge you have on some types of risk can be exploited to generate higher excess returns on investments during high growth period.
Length of period of excess returns: Exploiting risks better than your competitor can give you a longer high growth period.
Discount Rate While risk taking is generally viewed as pushing up discount rates, selective risk taking can minimize this impact.

45exploiTing The Risk upside: sTRaTegiC Risk Taking and Building a Risk-Taking oRganizaTion
Organizing for Risk Taking
There are several keys to becoming a strong risk-taking firm, including:
• Hiringtherightpeople• Creatingincentivesforgoodrisktaking• Aligning organizational size and structure with risk
taking• Understandingthedecision-makingcontext• Integratingriskanalysiswiththestrategyprocess• Monitoringandresponsiveness• Ensuringadequatecapitalforrisksretained• Preservingtheenterprise’soptions• Buildingtheoptimalriskgovernanceandmanagement
structures• Balancingquantitativeandqualitativedecisionmaking
Here, we discuss each of these factors in turn.
Hiring the Right People
Good risk taking requires good risk-taking personnel, but what are the characteristics of a good risk taker? Research in the last few decades suggests that good risk takers have the following characteristics:
• Theyarerealistswhostillmanagetobeupbeat.• They allow for the possibility of losses but are not
overwhelmed or scared by the potential for losses.• Theykeeptheirperspectiveandseethebigpicture,even
in the midst of a crisis.• Theymakedecisionswithlimitedandoftenincomplete
information. How can a firm hire and retain good risk takers?
• Haveahiringprocessthatlooksbeyondtechnicalskillsto consider crisis management skills. The hiring process should look at how people react when exposed to change and instability, in addition to considering background and technical skills.
• Acceptthatgoodrisktakerswillnotbemodelemployeesin stable environments. People who seem most attuned to risk can be disruptive in more placid times.
• Keep risk takers challenged, interested, and involved.Boredom will drive them away.
• Surroundthemwithkindredspirits.
Creating Incentives for Good Risk Taking
Self interest is the strongest force driving the way in which individuals make decisions. In risk management terms, the biggest factor determining risk taking and whether it is good or bad is the incentive system in place. In a perfect world, we would reward managers who expose the firm to the right risks and punish those who expose it to the wrong risks. In practice, though, we often reward or punish decision makers based on outcome rather than process. Thus, a trader who takes an imprudent risk but succeeds might earn millions of dollars in compensation, while one who takes a prudent risk and fails might lose his job.
In recent years, firms have started to offer mangers equity options as compensation, or they have instituted bonus systems or compensation tied to profits earned based on decisions these managers made. It can be argued that both systems are asymmetric—they reward upside risk taking too much while punishing downside risk taking too little—leading to too much risk taking.
Risk Analyses
Risk Evaluation
Risk Responses
Risk Identification
Monitor and Review
Corporate Objectives
Leadership and Culture
Syst
ems
Capabilities
Org
aniz
ing
Enterprise-wide risk management is affected by a multitude of structural, organizational, and managerial conditions
There are a number of formal ERM standards, including AIRMIC, AS/NZS 4360, COSO, FERMA, IRM, ISO 31000
Enterprise Risk Management Framework
Source: Andersen, T. J. and P. W. Schrøder, 2010, Strategic Risk Management Practice, Cambridge University Press.

Risk Taking: a CoRpoRaTe goveRnanCe peRspeCTive46
Finding the appropriate compensation system is not a simple task. Key to success here is balance, for a symmetrical system that punishes downsides about as much as it rewards upsides, and rewards process as much as outcome.
Aligning Organizational Size and Culture with Risk Taking
Organizations can encourage or discourage risk based on how big they are and how they are structured. Large, layered organizations tend to be better at avoiding risk whereas smaller, flatter organizations tend to be better at risk taking. Each type of organization has to be kept from its own excesses. Bureaucratic, multi-level organizations err on the side of too little risk and have a difficult time dealing with change and risk. Flatter organizations tend to be much more agile and flexible in the face of change, but the absence of checks and balances also makes them more susceptible to lone rangers undercutting their objectives.
The culture of a firm also can act as an engine for or as a brake on sensible risk taking. Some firms are more open to risk taking and its positive and negative consequences. How the firm deals with failure is another indicator of the company’s risk culture: risk takers are seldom punished for succeeding.
Understanding the Decision-Making Context
Directors often are required to make high-stakes decisions under less than ideal conditions. They often have inadequate information and time to engage in exhaustive analysis. Even if they had time, the cost of collecting information could be a deterrent. And even with sufficient information and enough time, managers are hindered by their own cognitive limitations, including bounded rationality. Not only do directors have to face individual constraints, they act in a group and are subject to the dysfunction inherent in group decision making.
An average decision process can be divided into several steps, including:
• Settingobjectives• Searchingforalternatives• Evaluatingalternatives• Choosingalternatives• Implementingdecisions
Figure 8.2: Finding the Balance: Rewarding Risk Takers
Fixed Compensation
(Salary)
Too little risk taking, since you do not share the upside
Too little risk taking, if managers end up over invested in company
Risk taking focused on investments with short-term earnings payoffs
Too much risk taking, because risk increases option value
Equity in
company
A Reasonable
compromise?
Equity
Options
Bonsues tied
to profitability

47exploiTing The Risk upside: sTRaTegiC Risk Taking and Building a Risk-Taking oRganizaTion
Cognitive biases can distort the outcomes by acting at various points in this flow. These cognitive biases lead to bad decisions as alternatives are not properly defined, the appropriate information is not collected, and costs and benefits are not weighted accurately. Awareness of these decision-making dysfunctions will help alert directors and their risk managers to these potential failures. Directors can try to alleviate the problems by viewing a problem from different perspectives, seeking opinions from different sources, and thinking through their positions clearly before negotiating.
Integrating Risk Analysis with the Strategy Process
The strategy planning process and the risk management process can be combined into a single framework. If they are not combined, at minimum the two should be linked and opportunities taken to exploit efficiencies by undertaking joint data collection and analysis. Further, risks can be defined in terms of their potential influence on the ability of the enterprise to meet its strategic objectives.
During the strategy planning process, risk analysis is an implicit part of the process, even if it is not addressed specifically, as the desirability of various strategic alternatives are assessed for their risk and reward offering. Additional effective risk mitigation might be needed to realize the benefits of strategic initiatives pursued.
Risk analysis is also implicit in many standard strategy planning tools. For example, analysis of the strengths, weaknesses, threats, and opportunities imply discussions about risks. Internal and external analyses are inherently environmental risk assessments at the strategic level and strategic planning generally proposes ways to deal with the identified strategic risks.
Cognitive Biases
Decision makers may repress uncertainty and act on simplified models they construct.
1. Formulate goals and identify problems Prior hypothesis: problem identification is affected by erroneous beliefsAdjustment and anchoring: influence of previous judgments and valuesReasoning by analogy: impose simpler analogies to complex situations Escalating commitment: increase commitment when a project is failing
2. Generate alternativesSingle outcome: focus on a single goal or preferred alternativeImpossibility: discard non-preferred alternatives by inferring that it is impossible to implementDenying value trade offs: over-valuation of a preferred alternativeProblem sets: imposing an often-used problem solution
3. Evaluate alternatives and choice Insensitivity to predictability: ignoring the reliability of informationIllusion of validity: observations may reflect a different concept or data can be confoundedInsensitivity to sample size: generalizing from a small data sample or a limited set of examples Devaluation of partial description: discounting alternatives that are only partially described
Cognitive biases can arise at all stages of the decision-making processThey can all lead to bad decision outcomes!
Source: Charles Schwenk, Cognitive Simplifications Processes in Strategic Decision-Making, 1984.

Risk Taking: a CoRpoRaTe goveRnanCe peRspeCTive48
Monitoring and Responsiveness
Great risk-taking firms also have mastered the monitoring and responsiveness phases. Organizationally, this means each risk is “owned” by specific managers who are accountable for their monitoring and for initiating responses where needed. Prioritization of risks helps the board decide at which level the risk will be “owned” and the frequency of follow-up and reporting. Adequate resources, including information technology and personnel, are needed to ensure that the required level of monitoring and responsiveness is achieved.
Ensuring Adequate Capital for Risks Retained
The 2008 crisis highlighted the importance of capital adequacy to preserve the business continuity of firms. Long an issue for financial firms, capital adequacy has become important for non-financial firms as well, because of the Basel II regulations aimed at maintaining financial stability. Risk management tools and techniques allow for expansion of potential financing sources with the intent of minimizing the cost of capital and maximizing the value of the enterprise.
Preserving the Enterprise’s Options
Even if you are a sensible risk taker and measure risks well, you will be wrong a substantial portion of the time. Sometimes, you will be wrong on the upside—you under- estimate the potential for profit—and sometimes, you will be wrong on the downside.
Successful firms preserve their options to take advantage of both scenarios:
• Toexpandaninvestment,iffacedwiththepotentialformore upside than expected
• Toabandonaninvestment,iffacedwithmoredownsidethan expected
Real options give firms flexibility to take advantage of scenarios such as these.
Building the Optimal Risk Governance and Management Structure
Directors who take the time to understand risks, risk tools, and modern approaches to risk taking have taken a critical step towards providing appropriate risk oversight for their firm. Some boards delegate detailed risk-taking tasks to a risk committee or audit and risk committee. Some firms have a risk committee and an audit committee. Firms with both committees might want to ensure a membership overlap, perhaps at the chairperson level, with the chair of one committee sitting as a member of the other.
There is no single correct way to organize a risk function to suit every firm. Financial sector firms, particularly those engaged in trading, are challenged to have risk managers who are independent from trading but who have sufficient market focus to understand the trades. The essential issue here is the balance of power and know-how between the back office and the front office. Some financial firms use a decentralized or distributed model in which risk managers
Example: LEGO Group
Active Risk and Opportunity Planning (AROP)The process applies to all new corporate projects
Searching (direction) Identification (assessment) Handling (mitigation) Managing (monitor)
Robust plan and realistic goals
Aims and aspirations
Risks/threats …Worst situations and possible
responses?
Opportunities…What is the best that can happen
from this initiative
How to reduce:• Likelihood• Effect
How to increase:• Likelihood• Effect
Source: LEGO Systems A/S

49exploiTing The Risk upside: sTRaTegiC Risk Taking and Building a Risk-Taking oRganizaTion
report to the business head or chief financial officer of the trading business unit. In this structure, the risk manager is embedded in the business.
Other firms prefer a centralized model, with a risk department headed by a chief risk officer reporting directly to the chief executive officer. The structure tends to elevate the authority of the risk officers within the enterprise.
Some firms use hybrid structures, balancing between centralized and decentralized models depending on the complexity of the business. Regardless of the structure used, financial institutions must recruit individuals with significant business/trading experience who hold advanced degrees to assume positions as senior risk managers.
In the real sector, the issues focus more heavily on the relationships between chief risk officer, internal auditor, and the board. Here, too, there is no consensus on a right or a wrong approach. Increasingly, however, the chief risk officer has a matrix reporting relationship to the board or risk committee as well as a daily administrative reporting line to the chief financial officer or the chief executive. Some firms have combined their risk and internal audit functions; the most senior officer assumes the dual reporting position.
Balancing Quantitative and Qualitative Decision Making
Recent increased interest in behavioral finance has reminded us that despite the numbers, understanding the human element is an important part of risk decision making. Becoming too dependent on numerical risk measures can also lead managers to ignore risks that do not have a quantitative basis. Good risk takers are the managers who can balance quantitative and qualitative factors in their decision making.
Implications for Decision Makers
Building a successful risk-taking organization requires several components. To become a better risk taker than the competition, a firm has to have competitive advantages. It has to act faster than everyone else, with better information, and to better effect.
Good risk takers gain their status by design, both in strategy and organization structure. First, the right people are required; good risk takers are not always good organizational people. Second, they must have a stake in the outcome that makes them think like the owner. Compensation systems should reward the right processes for dealing with risk, rather than outcomes. Third, a corporate structure and culture compatible with good risk taking must be built.
SECTION TASK: ASSESS THE RISK-TAKING CAPABILITIES IN YOUR ORGANIZATION/FIRM
Dimension Your organization’s standing
1. Are the interests of man-agers aligned with the inter-ests of capital providers?
Aligned with stockholdersAligned with bondholdersAligned with their own interests
2. Do you have the right people in place to deal with risk?
Too many risk takersToo many risk avoidersRight balance
3. Is the incentive process designed to encourage good risk taking?
Discourages all risk takingEncourages too much risk takingRight balance
4. What is the risk culture in your organization?
Risk seekingRisk avoidingNo risk culture
5. How much flexibility do you have to exploit upside risk and protect against downside risk?
Good on exploiting upside riskGood in protecting against downsideGood on both
Emerging Market Example: Bank in Colombia
At a retail commercial bank in Colombia, the board has a joint audit and risk committee chaired by an independent director— a qualified economist formerly employed in the supervision unit of the central bank. The board committee is supported by a risk committee with a membership of senior executives including the CEO and chief risk officer—CRO. The CRO reports to the CEO and meets monthly with the chair of the joint audit and risk committee. The risk committee coordinates the work of its three supporting committees: credit risk, operating and security risk, and asset and liability management committee. In keeping with Basel II requirements, capital adequacy is monitored daily using VaR and stress testing. However, most of the bank’s risk policy focuses on credit risk. There are detailed approval limits, credit scoring, and credit concentration limits by client and sector. The bank also prioritizes security issues, relying on external consultants for assistance.

Risk Taking: a CoRpoRaTe goveRnanCe peRspeCTive50

Risk Taking: a CoRpoRaTe goveRnanCe peRspeCTive 51
Ix. CONCLuSIONS
Basic Steps in Building a Good Risk Management System The steps in building a good risk management system are outlined below: 1. Make an inventory of possible risks. The process has to begin with an inventory of all the potential risks to which a firm could be exposed. This will include firm-specific risks, risks that affect the entire sector, and macroeconomic risks that have an influence on the value.
2. Measure and decide which risks to hedge, avoid, or retain based on impact on enterprise value. Risk hedging is not always optimal and can reduce value in many cases. Having made an inventory of risks, the firm has to decide which risks it will attempt to hedge and which ones it will allow to
flow through to its investors. The size of the firm, the type of stockholders that it has and its financial leverage (exposure to distress) will all play a role in making this decision. In addition, the firm has to consider whether investors can buy protection against the risks in the market on their own.
3. For the risk to be hedged, select appropriate risk-hedging products and decide how to manage and monitor retained risks. If a firm decides to hedge risk, it has a number of choices. Some of these choices are market traded, such as currency and interest rate derivatives; some are customized solutions, such as those prepared by investment banks to hedge against risk that may be unique to the firm; and some are insurance products. The firm has to consider the effectiveness of each of the choices as well as the costs.
4. Determine the risk dimensions that provide an advantage over the competitors and select an organizational structure suitable for risk taking. Here, the firm moves from risk hedging to risk management and from viewing risk as a threat to risk as a potential opportunity. Why would one firm be better at dealing with certain kinds of risk than its competitors? It might have to do with past experience. A firm that has operated in emerging markets for decades clearly has a better sense of what to expect in a market meltdown and how to deal with it. It also might come from the control of a resource—physical or human—that gives the company an advantage when exposed to the risk. Having access to low cost oil reserves might give an oil company an advantage if oil prices drop. A superior legal team might give a tobacco company a competitive advantage when it comes to litigation risk. Firms also must recognize that risk taking happens within an organizational context, and the appropriate risk systems, processes, and culture must be built.
Main Propositions About Risk
1. Risk is everywhere.2. Risk is threat and opportunity.3. People are ambivalent about risk and not always rational
in the way they deal with it.4. Not all risk is created equal: small/large, symmetric/
asymmetric, continuous/discrete, macro/micro.5. Risk can be measured.6. Risk measurement and assessment should lead to better
decisions.7. The key to risk management is deciding which risks to
hedge, which risks to pass through and which risks to take.
GOOD RISK MANAGEMENT = GOOD MANAGEMENT

Risk Taking: a CoRpoRaTe goveRnanCe peRspeCTive52
GUIDANCE ON RISK OVERSIGHT FROM NATIONAL ASSOCIATION OF CORPORATE DIRECTORS
Mitigating Risk The goal of a risk program is mitigation of risks in strategy implementation. The board should encourage through written policies and actions a “tone at the top” that shows ethical integrity, legal compliance, strong controls and strong financial reporting.
Strategy and Risk AppetiteTo fully assess an enterprise’s risk appetite, the board must engage in reviewing the enterprises strengths, weaknesses, opportunities, and threats. A fully developed risk profile encompasses the impact on stakeholders including employees, customers, and suppliers.
Risk IdentificationDirectors should probe the legitimacy and scope of management’s risk assessments. They must help identify
potential risks and provide scenarios that the managers may not have considered. Unforeseen risks cause the most problems for companies.
Monitoring RiskThe board should continually monitor the financial health of the firm, ensuring accurate accounting and safekeeping of corporate assets. An important element of risk identification and monitoring is ensuring the information relied upon is high quality, dependable, and timely.
Crisis ResponseThe board is responsible for ensuring that sound crisis planning has occurred. During a crisis it should remain informed and the board or a committee of the board should remain in contact during the period in which the situation is most critical.
The most important ingredient in risk management is luck!
There is so much noise in this process that the dominant variable explaining success in any given period is luck and not skill.
Proposition 1: Today’s hero will be tomorrow’s goat. The opposite is true as well. There are no experts. Let your common sense guide you.
Proposition 2: Don’t mistake luck for skill. Do not over react either to success or to failure.
Proposition 3: Life is not fair. You can do everything right and go bankrupt. You can do everything wrong and make millions.

Risk Taking: a CoRpoRaTe goveRnanCe peRspeCTive 53
APPENDIx
Risk Policy Committee1 Charter Assessment Tool2
ACCEPTABLE BETTER DESIRABLE BEST PRACTICE
I. Establishment3 1. Any written docu-ment, including board resolution.
1. Incorporated in by-laws4 or corporate governance guidelines.
1. Incorporated in corporate charter or articles of as-sociation.
1. Same5
II. Purpose 1. Establishing the firm’s risk policies, including risk toler-ances, consistent with the risk man-agement program (see also Section XIII).
1. Same, and ensuring that senior manage-ment takes steps necessary to identify, measure, monitor and control risks.
1. Same.2. Reviewing the adequacy
of the firm’s capital and allocations to various business units consider-ing the types and sizes of risks at those business units.
1. Same.2. Same3. Establishing an
enterprise-wide risk management framework for all companies in the group.
III. Composition 1. At least three board members.
1. Same2. Material presence of
non-executive board members.6
1. Same, but no more than seven members.
2. Majority non-executive board members.
1. Same.2. Majority indepen-
dent members.3. Rotation of
members.4. Limit on number of
memberships on other board com-mittees.
5. No more than one committee member serves on both the Risk Policy and Audit and Compliance Committees.
IV. Individual Committee Membership Qualifications
1. Committee overall has requisite skills and knowledge adequate to oversee the firm’s risk management program.
2. Time and desire to fulfill obligations.
1. All committee members have requi-site skills and knowl-edge adequate to oversee the firm’s risk management program.
2. Same.3. Introductory briefing
for all new committee members.
1. Same.2. Same.3. Same.4. Periodic professional
education/training for all committee members.
1. Same.2. Same.3. Same.4. Same.5. Less than 75 percent
attendance at com-mittee meetings in one year automatic threshold for non-reappointment.
1 Overall risk management is generally considered to be primarily the responsibility of executive management. Risk governance is the responsibility of the board. The board’s role is to establish the firm’s general risk philosophy and risk tolerances in each mate-rial business area, and to provide oversight of the company’s risk policies and procedures so as to ensure that management imple-ments a robust risk management program.2 Base document prepared by Sinclair Capital, a g3 affiliate.3 It may be acceptable in case of relatively small or simple firms that the board of directors has no formal “risk” committee, but that the full board regularly discusses risk philosophy and tolerance issues, and reviews the adequacy of risk management as a rou-tine part of its strategic and operational review. Alternately, the functions of the risk policy committee are sometimes combined with those of the Audit and Compliance Committee. However, given the centrality of risk management to financial institutions, and the requirements of Basel II, it is a function that should be assumed either by the full board of directors, or, in what is increasingly con-sidered best practice, the board should establish a separate Risk Policy Committee.4 Bylaws refer to internal corporate documents that do not have to be filed externally (with corporations’ registry or the regu-lator).5 “Same” indicates that the recommendation of the identical number in the column immediately to the left is carried over into the column. Should the recommendation be only partially identical, any differences are italicized.6 In jurisdiction with the so called two-tiered board systems, the non-executive directors refer to members of the supervisory board.

Risk Taking: a CoRpoRaTe goveRnanCe peRspeCTive54
Risk Policy Committee1 Charter Assessment Tool2
ACCEPTABLE BETTER DESIRABLE BEST PRACTICE
V. Committee Chair
1. Appointed by non-executive board chair, board as a whole, or the com-mittee.
2. Has requisite skills and knowledge adequate to oversee the firm’s risk management program.
1. Same.2. Same.
1. Same.2. Same.3. Is an independent board
member.
1. Same.
VI. Appointment 1. Appointed by board chair, board as a whole or Corporate Gover-nance/Nominations Committee.
2. Fixed terms, preferably annual, but not exceeding Board terms.
1. Same, with full board ratification of commit-tee members where nomination is by chair or Corporate Gover-nance/Nominations Committee.
2. Fixed terms, prefer-ably annual, but not exceeding Board terms.
1. Same. 2. One-year renewable
terms.
1. Same.2. Same.
VII. Remuneration (in addition to compensation for work as a Member of the full Board)7
1. Is solely related to fulfilling the obligations of a committee member (no form of payment which would compromise independence (e.g., salary, consulting, finders’ fees, etc.).
1. Same, payment as committee fees and/or meeting fees is the preferred form.
2. Adequate level of payment so as to create expectation of responsibility.
1. Annual committee fees.2. Same.3. Additional per meeting
fees.4. Additional fee for chair.
1. Same.2. Same.3. Same. 4. Same.
7 Executive director-members of the Risk Policy Committee do not get additional remuneration for their services on the committee.8 In addition to regular committee meetings, extraordinary meetings may be held whenever needed and appropriate with agenda set in advance.

Risk Taking: a CoRpoRaTe goveRnanCe peRspeCTive 55
Risk Policy Committee1 Charter Assessment Tool2
ACCEPTABLE BETTER DESIRABLE BEST PRACTICE
VIII. Meetings 1. May be called by the committee chair.
2. Approved annual calendar of regular meetings.8
3. At least semiannu-ally
1. Same.2. Same.3. At least quarterly.4. Meetings may be re-
quested by the board chair, CEO, CFO and Chief Risk Officer.
1. Same, and by any two committee members.
2. Same.3. Same.4. Same.5. Meetings may be in
person, by telephone, web, or other electronic communication means agreeable to committee.
6. Ability to act by unani-mous written consent.
1. Same.2. Same.3. Same.4. Same.5. Same.6. Same.
IX. Attendance and Notice
1. Quorum required.2. Advance notice
required; may be waived with unanimous written consent.
3. Approved annual calendar of regular meetings.
1. Same, and simple ma-jority as a minimum.
2. Same. 3. Same.4. Minutes to be prepared
and distributed to committee members. The board has access to review them.
5. Agenda and related materials to be provided in advance unless the chair (or other convener) believes confidential-ity requires otherwise, in which case general description of subject of the meeting to be circulated, with a statement from the chair as to reasons for confidentiality.
6. Chief Risk Officer and other executive officers attend the meetings.9
1. Same.2. Same, and with
minimum 48 hour notice.3. Same. 4. Same.5. Same.6. Same.7. The Chief of Internal
Audit, the External Auditor and Chief Compliance Officer sent notices of all meetings.
1. Same.2. Same, and with
minimum 1 week notice.
3. Same.4. Same.5. Same.6. Same.7. Same.8. Independent
members of the committee meet without executive officers present at each Committee meeting.
9 In addition to regular committee meetings, extraordinary meetings may be held when needed and appropriate with agenda set in advance.

Risk Taking: a CoRpoRaTe goveRnanCe peRspeCTive56
Risk Policy Committee1 Charter Assessment Tool2
ACCEPTABLE BETTER DESIRABLE BEST PRACTICE
X. Reporting to the Board and Shareholders
1. Verbal or written reports to the board as needed.
2. Annual written report to the board.
1. Written reports or minutes to the board following each com-mittee meeting.
2. Same.
1. Same.2. Same.3. General report on com-
mittee activities included in the firm’s annual report.
1. Same.2. Same.3. Same, and includes
qualitative and quantitative data en-abling shareholders and general public to understand the firm’s risk profile and policies.
XI. Evaluation10 1. Annual evaluation of work the committee has performed over the previous year.
2. Annual evaluation of committee effectiveness, including processes and procedures.
1. Same.2. Same. 3. Periodic evaluation
of the Commit-tee Charter, with written report to the board suggesting improvements, if any.
4. Periodic indepen-dent evaluation of committee effective-ness.
XII. Authority and Resources
1. Having access to all internal resources.
1. Same. 2. Recommending hiring
of outside resources (e.g. risk management consultants, counsel), as needed.
1. Same, without neces-sarily going through the hierarchy (though the hierarchy should be respected absent com-pelling reasons to avoid it).
2. Having the right to hire outside resources without executive ap-proval.
3. Authorizing, or con-ducting, any investiga-tions within its area of responsibility; having the right to hire indepen-dent experts for such investigations, approve terms of such engage-ments, and having such investigations paid for by the firm.
1. Same.2. Same.3. Same.4. Receiving an annual
budget sufficient to achieve committee needs, and having the right to access additional funds in unforeseen circum-stances.
10. The Corporate Governance/Nominations Committee may coordinate evaluation of the board and all committees at some com-panies.

Risk Taking: a CoRpoRaTe goveRnanCe peRspeCTive 57
Risk Policy Committee1 Charter Assessment Tool2
ACCEPTABLE BETTER DESIRABLE BEST PRACTICE
XIII. Responsibilities – Policies and Procedures
1. Reviewing and rec-ommending to the board, in conjunc-tion with executive officers, proposed aggregate loss limit targets for various risk categories (e.g. loan losses, market losses, operational risk).
2. Reviewing the Firm’s risk manage-ment infrastructure and control systems to ensure adequacy to enforce Firm’s risk policies.
3. Ensuring that management (e.g., CEO and Chief Risk Officer) develops a comprehensive risk management program.
4. Reviewing manage-ment’s determi-nation of what constitutes key balance sheet and offbalance sheet risks.
5. Overseeing the Chief Risk Officer and the annual plan of his activi-ties.
1. Same, and approv-ing management’s recommendations for overall credit and market risk limits, as well as country risk limits for non-domestic exposures.
2. Same.3. Same, and overseeing
the implementation of the risk management program and review-ing its quality and soundness.
4. Same.5. Same.6. Receiving exception
reports.7. Ensuring that risk
measurement/man-agement function is independent of any line business function.
8. Being consulted by the CEO on the appoint-ment of the Chief Risk Officer.
1. Same, and approving maximum credit expo-sures for top clients and counterparties, so as to insure diversification.
2. Same.3. Same.4. Same. 5. Same.6. Same.7. Same, and ensuring
that risk measurement/management function has adequate expertise and resources to fulfill its responsibilities.
8. Same.9. Reviewing and recom-
mending to the board approval of risk mea-surements and rating methodologies including any to be reported to regulators.
10. Reviewing assumptions used in risk measurement models. Insuring that model risk issues have been properly considered.
11. For banks in particular, reviewing stress tests on credit, liquidity, market and operational risks; approving contingency planning.
12. Reviewing the level of delegated authority.
13. For banks, monitoring the firm’s preparations and implementation of Basel II with respect to risk management and measurement issues.
1. Same.2. Same. 3. Same.4. Same.5. Same.6. Same.7. Same.8. Same.9. Same. 10. Same.11. Same.12. Same.13. Same.14. Proactively monitor-
ing “best practice” risk management developments.
XIV. Responsibilities – Specific Risk Reviews
1. Regularly receiving summary risk data and comparing data to adopted risk policies from responsible manag-ers (CEO, Chief Risk Officer).
1. Same.2. Regularly receiving
disaggregated data of major risk categories from responsible man-agers (CEO, Chief Risk Officer).
3. For banks, receiving regular reports from the asset liability committee and/or the management risk committee.
4. Receiving and acting on compliance and internal audit reports that are relevant to the risk function.
1. Same.2. Same.3. Same.4. Same.5. Receiving copy of the
executive evaluation of the Chief Risk Officer.
6. Reviewing exposures to major clients, counter-parties, countries, and economic sectors.
1. Same.2. Same.3. Same.4. Same.5. Same.6. Same.7. Reviewing reports
on financial compli-ance issues such as compliance risk and for banks, mon-eylaundering risks (unless specifically reserved for the Audit and Compli-ance Committee).

Risk Taking: a CoRpoRaTe goveRnanCe peRspeCTive58
AbOuT ThE AuThORS
Oliviero Roggi is the chairperson of the International Risk Management Conference, a professor of corporate finance at the University of Florence, and a visiting professor at New York University’s Stern Salomon Center.
Roggi earned his PhD in Management and Finance at University of Bologna and City University Business School European Joint PhD program in 1998 and his BA in banking from the University of Florence. He was a visiting researcher at City University Business School from 1998 to 2000 and was appointed assistant professor in corporate finance in 2000. He has been a professor of corporate finance at the University of Florence since 2004.
Roggi served as board director, consultant and certified auditor for several publicly- listed companies. In 2008, he founded the NYU Stern Salomon Center, the International Risk Management Conference, together with Edward Altman. The conference is Europe’s leading interdisciplinary conference on risk management. In 2008–2009 he served as a visiting professor for the Accounting Masters Program at Brazil’s Universidade de Fortaleza. He is a consultant for the European Commission, Regione Toscana (Italy) and for publicly-owned entities, and has been conducting research in the area of Enterprise Risk Management since 2004. He is a member of the Scientific Committee of the Country Risk Forum of Associazione Bancaria Italiana (ABI, the Italian Bankers Association). Roggi has published papers and books on SME ratings and on rating models. His book, Risk Value and Company Default was published in 2009. He co-authored the third Italian edition of Applied Corporate Finance with his colleague Aswath Damodaran. He has worked as a consultant for IFC since 2010.
Maxine Garvey specializes in strategic and financial analysis for enhancing the effectiveness and efficiency of enterprises. She currently is a senior corporate governance officer at IFC and the project lead for the SME Integrity Program. She has worked in Latin America, Asia, Africa, and Europe on World Bank Group projects. She leads the risk management, reporting, and internal control work for the Corporate Governance Unit.
Prior to joining IFC, Dr. Garvey worked as a management consultant with Analysis Group (New York), AT Kearney
(Toronto) and PriceWaterhouseCoopers (Kingston). She provided advisory services in strategy and financial management, working with firms in a wide range of industries, including financial services, telecommunications, and retail. Dr. Garvey has taught strategy, finance, and international business at New York University and the Mona School of Business (MSB), University of the West Indies. In addition, she has worked as a manager in industry and consulting firms. She has authored several publications and has served as a board member in the financial services industry. She started her career as an auditor at KPMG and is a member of the American Institute of Certified Public Accountants, the Strategic Management Society and the Academy of Management.
Aswath Damodaran holds the Kerschner Family Chair in Finance Education and is a professor of finance at New York University Stern School of Business.
Professor Damodaran holds MBA. and PhD degrees from the University of California, Los Angeles, as well as a BCom in accounting from Madras University and a PGDM from the Indian Institute of Management Bangalore.
Before taking his position at NYU, he served as visiting lecturer at the University of California, Berkeley, from 1984 to 1986. He has received awards for excellence in teaching from both universities and was profiled in Business Week magazine as one of the top 12 business school professors in the United States.
He has written several books on equity valuation, as well on corporate finance, and is widely quoted on the subject of valuation. He is widely published in leading journals of finance, including The Journal of Financial and Quantitative Analysis, The Journal of Finance, The Journal of Financial Economics, and the Review of Financial Studies.
He teaches for the TRIUM Global Executive MBA Program, an alliance of NYU Stern, the London School of Economics and HEC School of Management. Damodaran also teaches for the Master of Science in Global Finance, a joint program between Stern and the Hong Kong University of Science and Technology.

Risk Taking: a CoRpoRaTe goveRnanCe peRspeCTive 59
SELECTED REfERENCES
AIRMIC, IRM. “A Risk Management Standard.” Association of Insurance and Risk Managers, Institute of Risk Management, 2002.
Allen S. , Financial Risk Management: A Practitioner’s Guide to Managing Market and Credit Risk. Hoboken: John Wiley & Sons,2003.
Altman E.I. “Financial Ratios, Discriminant Analysis and the Prediction of Corporate Bankruptcy.” Journal of Finance, vol. 23. n. 4 (1968):589–609.
Altman E.I. “A Further Empirical Investigation of the Bankruptcy Cost Question,” Journal of Finance, vol. 39, n. 4(1984): 1067–1089.
Associazione Bancaria Italiana. Loss given default: aspetti metodologici e proposta di una struttura dati per la stima. Roma: Bancaria editrice, 2002.
. Commissione Tecnica Per Gli Studi. Metodi avanzatiperlagestionedelrischiodicredito. Roma: Bancaria, 1995.
AS/NZS 436°. Risk Management Standards Australia and Standards New Zealand, 1999.
Banks E. Alternative Risk Transfer Integrated Risk Management through Insurance, Reinsurance, and the Capital Market. Cambridge: Wiley Finance, 2004.
Basel Committee on Banking Supervision. “The Internal Ratings-Based Approach,” consultative document. Basilea: Bank for International Settlements, 2003.
. “International Convergence of Capital Measurement and Capital Standards: a Revised Framework.” Basilea: Bank for International Settlements, 2004.
Beder, T.S.(“VAR: Seductive but Dangerous.” Financial Analysts Journal, September–October 1995.
Cattaneo, M. Analisi Finanziaria e di bilancio. Milan: ETAS libri, 1976.
. FinanzaAziendale. Bologna: Il Mulino, 1998.
Copeland, T.E. and V. Antikarov. Real Options: APractitioner’s Guide. New York: Texere, 2003.
Damodaran, A. Investment Valuation, Second Edition. New York: John Wiley & Sons, 2005.
Damodaran, A. The Dark Side of Valuation, Second Edition. New York: Prentice Hall, 2008.
. Applied Corporate Finance, Third Edition. New York: John Wiley & Sons, 2009.
DeMarzo, P.M. and D. Duffie. “Corporate Incentives for Hedging and Hedge
Accounting.” The Review of Financial Studies, v8 (1995): 743–771.
Dolde, W. “The Trajectory of Corporate Financial Risk Management.” Journal of Applied Corporate Finance, v6 (1993): 33–41.
Hertz, D. “Risk Analysis in Capital Investment,” Harvard Business Review, 1964.
Kahneman, D. and A. Tversky. “Prospect Theory: An Analysis of Decision under Risk.” Econometrica, v47 (1979): 263–292.
Kahneman D., P. Slovic, and A. Tversky. Judgement under Uncertainty: Heuristics and Biases. Cambridge: Cambridge University Press, 1982.
Kaplan, M. and E. Kaplan. Adventures in Probability. New York: Viking Books, 2006.
Knight, F.H. Risk, Uncertainty and Profit. New York: Hart, Schaffner and Marx, 1921.

Risk Taking: a CoRpoRaTe goveRnanCe peRspeCTive60
Lewent, J. and J. Kearney. “Identifying Measuring and Hedging Currency Risk at Merck.” Journal of Applied Corporate Finance, vol. 2 (1990): 19–28.
Lintner, J. “The Valuation of Risk Assets and the Selection of Risky Investments in Stock Portfolios and Capital Budgets.” Review of Economics and Statistics, 47 (1965): 13–37
Markowitz, H.M. “Portfolio Selection.” The Journal of Finance, 7: l (1952): 77–91.
Meulbroek, L. “Integrated Risk Management for the Firm: A Senior Manager’s Guide.” Journal of Applied Corporate Finance, vol. 14 (2002):56–70.
Mian, S.I. “Evidence on Corporate Hedging Policy.” Journal of Financial and Quantitative Analysis, vol. 31(1996): 419–439.
Miccolis J., and S. Shah S. Enterprise Risk Management: An Analytic Approach. Tillighast-Towers Perrin, 2000.
PricewaterhouseCoopers. “Enhancing Shareholder Wealth by Better Managing Business Risk.” International Federation of Accountants, 1996.
Rappaport A. CreatingShareholderValue:theNewStandardfor Business Performance. New York: Free Press, 1986.Reen J. “Three Decades of Risk Research: Accomplishment and New Challenges.” Journal of Risk Research, United Kingdom, 1998.
Roggi O. Valoreintrinsecoeprezzodimercatonelleoperazionidifinanzastraordinaria. Milan: Franco Angeli, 2003.
Roggi O. “Basel II and Default Risk Estimation,” Conference proceedings, 2007.
.“Small Business Banking and Financing: a Global Perspective.” Cagliari, 2007.
Sharpe, William F. “Capital asset prices: A theory of market equilibrium under conditions of risk,” Journal of Finance, 19: 3 (1961): 425–442.
Smithson, C. “Does Risk Management Work?” Risk (July 1999): 44–45.
Taleb, N.N. Fooled by Randomness. New York: Texere, 2004.
Tufano, P. “Who Manages Risk? An Empirical Examination of Risk Management Practices in the Gold Mining Industry.” Journal of Finance, vol. 51 (1996):1097–1137.


the material in this publication is copyrighted. ifC encourages the dissemination of the content for education-al purposes. Content from this publication may be used freely without prior permission, provided that clear attribution is given to ifC and that content is not used for commercial purposes.
the findings, interpretations, views, and conclusions expressed herein are those of the authors and do not necessarily reflect the views of the Executive directors of the international finance Corporation or of the international Bank for Reconstruction and development (the World Bank) or the governments they represent, or those of the individuals and institutions that contributed to this publication.
international finance Corporation2121 pennsylvania ave. nWWashington, dC 20433tel. 1-202-473-1000