risk parity portfolio vs. other asset allocation heuristic portfolios
TRANSCRIPT
108 RISK PARITY PORTFOLIO VS. OTHER ASSET ALLOCATION HEURISTIC PORTFOLIOS SPRING 2011
Risk Parity Portfolio vs. Other Asset Allocation Heuristic PortfoliosDENIS CHAVES, JASON HSU, FEIFEI LI, AND OMID SHAKERNIA
DENIS CHAVES
is a senior researcher at Research Affiliates, LLC, in Newport Beach, [email protected]
JASON HSU
is CIO at Research Affiliates, LLC, in New-port Beach, CA, and pro-fessor of finance at UCLA Anderson Business School in Los Angeles, [email protected]
FEIFEI LI
is a director of research at Research Affiliates, LLC, in Newport Beach, [email protected]
OMID SHAKERNIA
is a senior researcher at Research Affiliates, LLC, in Newport Beach, [email protected]
Traditional strategic asset alloca-tion theory is deeply rooted in the mean–variance portfolio optimi-zation framework developed by
Markowitz [1952] for constructing equity portfolios. However, the mean–variance optimization methodology is diff icult to implement due to the challenges associated with estimating the expected returns and covariances for asset classes with accuracy. Subjective estimates on forward returns and risks can often be inf luenced by behavioral biases of the investor, such as over-estimating expected returns due to the recent strong per-formance of an asset class or under-estimating risk due to personal familiarity with an asset class. Empirical estimates based on historical data are often far too noisy to be useful, espe-cially if risk premia and correlations for asset classes are time varying.1 Additionally, the possibility of “paradigm shift” in the capital market makes historical data far less relevant for forecasting the future evolution of asset returns. This last concern is especially rel-evant today given the hypothesis on a “new normal” for the global economy postulated by Gross [2009].
The challenges in the implementation of Markowitz’s portfolio optimization have led to a wide gap between the theory of the prac-tice and the practice of the theory.2 In prac-tice, institutional pension portfolios largely take on a 60/40 equity/bond allocation,
with alternative asset classes, at the margin, garnering only modest weights. It is unlikely that this portfolio posture falls out of an exer-cise in constrained portfolio mean–variance optimization;3 rather it is a hybrid child of legacy portfolio practice and return tar-geting. Using historical realized risk premia to guide our capital market return expecta-tions, assuming a 9.0% equity return and a 6.5% bond returns, the 60/40 portfolio con-veniently achieves the 8% portfolio return target that is common to most pension funds. As more asset classes, such as real estate, com-modities, and emerging market securities, are added to the investment universe, weights are reallocated from stocks and bonds modestly to these alternative assets. Most pension funds hold a 60/40 equity/bond variant portfolio despite the significantly larger universe of investable asset classes. Undoubtedly, these incremental allocations improve portfolio mean–variance eff iciency by improving diversification; however, it is also likely that more-optimal asset allocation methods or heuristics can be created.
RISK PARITY ARGUMENT
Empirically, the risk (variance) of the traditional 60/40 equity/bond portfolio variants is dominated by the equity market risk, since stock market volatility is signifi-cantly greater than bond market volatility.
JOI-CHAVES 108JOI-CHAVES 108 2/16/11 12:27:07 AM2/16/11 12:27:07 AM
The
Jou
rnal
of
Inve
stin
g 20
11.2
0.1:
108-
118.
Dow
nloa
ded
from
ww
w.ii
jour
nals
.com
by
Joel
Che
rnof
f on
12/
13/1
1.It
is il
lega
l to
mak
e un
auth
oriz
ed c
opie
s of
this
art
icle
, for
war
d to
an
unau
thor
ized
use
r or
to p
ost e
lect
roni
cally
with
out P
ublis
her
perm
issi
on.

THE JOURNAL OF INVESTING 109SPRING 2011
Additionally, at the margin, the allocations to alternative asset classes are too small to contribute meaningfully to the portfolio risk. In this sense, a 60/40 portfolio variant earns much of its return from exposure to equity risk and little from other sources of risk, making this portfolio approach under-diversified in its risk exposure.
Proponents of the risk parity approach argue that a more efficient approach to asset allocation is to equally weigh the asset class by its risk (volatility) contribution to the portfolio. This essentially allocates the same volatility risk budget to each asset class; that is, under the risk parity weighting scheme, each asset class contributes approxi-mately the same expected f luctuation in the dollar value of the portfolio. Theoretically, if all asset classes have roughly the same Sharpe ratios and same correlations, risk parity weighting could be interpreted as optimal under the Markowitz framework.4 There is no official definition for the risk parity methodology; product pro-viders use varying definitions of “risk contribution” and different assumptions on the joint distributions for asset classes; many even model the joint distributions as time varying. In the two-asset case, all interpretation would roughly lead to the same portfolio, which is one that is simply weighted by the inverse of the portfolio volatility. In the multi-asset case, the portfolio constructions can differ very significantly and (time-varying) correlation assumptions between assets can play a critical role. A sim-plified risk parity approach that has anchored the practice of some of the biggest players in this space is weighting by inverse asset class volatility.5 Regardless of the exact approach, the risk parity portfolio generally is fixed-in-come heavy, which results in lower portfolio volatility and returns. Investors can then target the desired port-folio expected return by levering up the portfolio.
The strategy, of course, has its critics. Inker [2010] questions whether asset classes like commodi-ties and government bonds provide a positive risk premium over cash in the long run; in the absence of a risk premium for a number of the asset classes included for investment, the risk parity approach would result in very a suboptimal portfolio. Lovell [2010] and Foresti and Rush [2010] point out that leveraging introduces new risks into the investor portfolio, such as variability in financing costs and availability of financing; it also amplifies the impact of tail events (like a liquidity crisis) on the investor portfolio.6
In Exhibit 1, we show the historical return of the 60/40 S&P 500 Index/Barclays Capital Aggregate Bond Index (BarCap Agg) portfolio versus a risk parity portfolio constructed from the same two assets. From a Sharpe ratio perspective, the risk parity construction does appear to be superior. While the unlevered risk parity portfolio has a lower return, it can be levered up to the same volatility as the 60/40 portfolio to provide a better return than 60/40.7
A major benefit of risk parity weighting over mean–variance optimization is that investors do not need to formulate expected return assumptions to form port-folios. The only input that needs to be supplied is asset class covariances, which usually can be estimated more accurately than expected returns using historical data (Merton [1980]). Certainly, the covariance estimates can have an impact on portfolio allocation; however, it is unclear whether poor quality covariance estimates would bias the resulting portfolio returns downward.
When compared with asset allocation products (whether tactical or strategic, qualitative or quantita-tive), which are heavily focused on forecasting capital market returns, the risk parity portfolio heuristic may be considered more transparent and mechanical, which mitigates the risk of behavioral biases inf luencing asset allocation decisions. However, we do note that the com-mercial products generally can and do involve some (if not significant) manager discretion and that the exact method for measuring risk contribution and allocating the risk budget may not be fully disclosed. A recent report by Hammond Associates concludes, with regard to the managed commercial products, that “… there appears to be a lot of art involved.”
E X H I B I T 160/40 vs. Risk Parity Portfolio Heuristic for Stock and Bond, January 1980–June 2010
Notes: The risk-free rate is the three-month Treasury bill from St. Louis FED (http://research.stlouisfed.org/fred2/series/TB3MS). S&P 500 Total Returns are from Global Financial Data (http://www.globalfinancialdata.com). BarCap Agg Total Returns are from Barclays Capital Live (http://live.barcap.com).
JOI-CHAVES 109JOI-CHAVES 109 2/16/11 12:27:07 AM2/16/11 12:27:07 AM
The
Jou
rnal
of
Inve
stin
g 20
11.2
0.1:
108-
118.
Dow
nloa
ded
from
ww
w.ii
jour
nals
.com
by
Joel
Che
rnof
f on
12/
13/1
1.It
is il
lega
l to
mak
e un
auth
oriz
ed c
opie
s of
this
art
icle
, for
war
d to
an
unau
thor
ized
use
r or
to p
ost e
lect
roni
cally
with
out P
ublis
her
perm
issi
on.
110 RISK PARITY PORTFOLIO VS. OTHER ASSET ALLOCATION HEURISTIC PORTFOLIOS SPRING 2011
OTHER COMPELLING PORTFOLIO HEURISTICS
Risk parity weighting is, of course, not the only alternative asset allocation heuristic to the 60/40 equity/bond portfolio. In this article, we also consider two addi-tional asset allocation strategies which are more trac-table than the Markowitz mean–variance optimization strategy and offer better risk premium diversif ication than the 60/40 equity/bond strategy.8
Equal weighting. One of the most naive portfolio heuristics is equal weighting. Investors do not need to assume any knowledge regarding the distribution of the asset class returns. The equal-weighted portfolio is mean–variance optimal only if asset classes have the same expected returns and covariances. This strategy, empiri-cally, provides superior portfolio returns when applied to the U.S. and global equity portfolio construction.9
Minimum variance. Another popular approach for constructing equity portfolios without using expected stock return information is the minimum variance approach. The approach utilizes the covariance infor-mation but ignores expected returns information. Cova-riances can also be estimated with a higher degree of accuracy using historical data (Merton [1980]) than expected returns; the minimum variance methodology therefore focuses on extracting information that can be extracted with some accuracy from the historical asset return data. Note that the minimum variance portfolio is mean–variance optimal only if asset classes have the same expected returns. Again, the minimum variance strategy has demonstrated success when applied to equity portfolio construction.10 Chopra and Ziemba [1993] show that, for stocks, the stark assumption that all stock returns are equal can actually result in a better portfolio than formulating an optimal portfolio based on noisy stock return forecasts.
A HORSE RACE BETWEEN RISK PARITY AND OTHER ASSET ALLOCATION STRATEGIES
In this section, we compare the risk parity strategy against other asset allocation strategies. In this horse race, we consider equal weighting, minimum variance, and a naïve mean–variance optimization, in addition to two variants of the 60/40 portfolio. The universe of investible asset classes includes long-term U.S. Treasury,
U.S. investment-grade bonds, global bonds, U.S. high-yield bonds, U.S. equities, international equities, emerging market equities, commodities, and listed real estates. These asset classes are represented by the fol-lowing investable indexes, respectively: Barclays Capital U.S Long Treasury Index, Barclays Capital U.S. Invest-ment Grade Corporate Bond Index, JP Morgan Global Government Bond Index, Barclays Capital U.S. High Yield Corporate Bond Index, S&P 500 Index, MSCI EAFE Index, MSCI Emerging Market Index, Dow Jones UBS Commodity Index, and FTSE NAREIT US Real Estate Index.
For the mean–variance optimized strategy, we use the average return from the past f ive years as a forecast for future asset class returns. We also use the monthly data from the past f ive years in conjunction with a standard shrinkage technique to estimate the covariance matrix.11 The same covariance matrix is also used to construct the minimum variance portfolio. We also construct a model U.S. pension portfolio with a 60/40 anchor, consisting of 55% stocks (80% U.S. and 20% international), 35% bonds (60% U.S. Long Trea-sury, 20% investment-grade corporate, and 20% global bonds) and 10% alternative investments (2.5% each commodities, REITs, emerging market equities, and high-yield bonds). All strategies are rebalanced annu-ally and are long-only portfolios.12 The weights in the mean–variance optimal strategy are constrained to less than 33% to avoid extreme allocations.
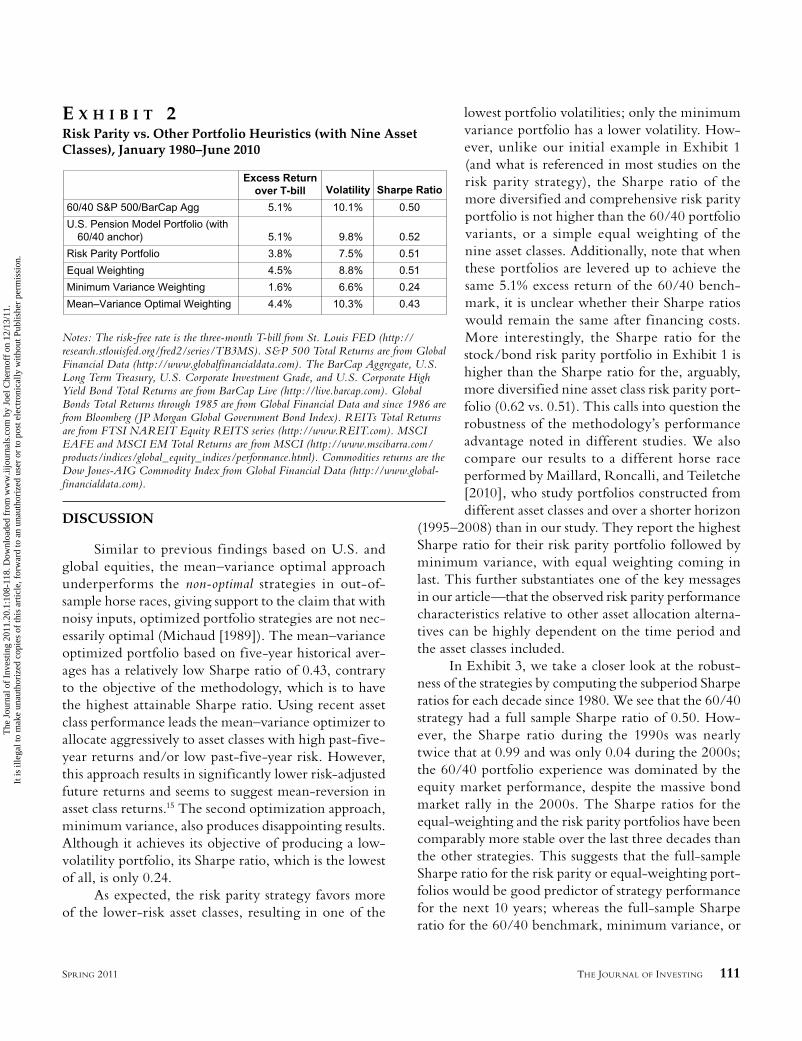
We simulate portfolio returns using asset class return data from 1980 through June 2010. The con-structions are such that there are no look-ahead and sur-vivorship biases. Note that prior to 1989, the high-yield index does not exist; prior to 1993, the emerging market equity index does not exist. We simply omit those asset classes in the portfolio construction prior to their exis-tence. We report the performance of the asset allocation strategies in Exhibit 2. Admittedly, our choice of annual rebalancing is an arbitrary one—we would expect the Sharpe ratios to decrease slightly with more frequent rebalancing due to asset class momentum effect.13 By comparing strategies according to their respective Sharpe ratios, we are implicitly assuming that investors will use leverage to achieve a required rate of return.14 The time series of portfolio weights are reported in the Appendix.
JOI-CHAVES 110JOI-CHAVES 110 2/16/11 12:27:08 AM2/16/11 12:27:08 AM
The
Jou
rnal
of
Inve
stin
g 20
11.2
0.1:
108-
118.
Dow
nloa
ded
from
ww
w.ii
jour
nals
.com
by
Joel
Che
rnof
f on
12/
13/1
1.It
is il
lega
l to
mak
e un
auth
oriz
ed c
opie
s of
this
art
icle
, for
war
d to
an
unau
thor
ized
use
r or
to p
ost e
lect
roni
cally
with
out P
ublis
her
perm
issi
on.
THE JOURNAL OF INVESTING 111SPRING 2011
DISCUSSION
Similar to previous f indings based on U.S. and global equities, the mean–variance optimal approach underperforms the non-optimal strategies in out-of-sample horse races, giving support to the claim that with noisy inputs, optimized portfolio strategies are not nec-essarily optimal (Michaud [1989]). The mean–variance optimized portfolio based on five-year historical aver-ages has a relatively low Sharpe ratio of 0.43, contrary to the objective of the methodology, which is to have the highest attainable Sharpe ratio. Using recent asset class performance leads the mean–variance optimizer to allocate aggressively to asset classes with high past-five-year returns and/or low past-five-year risk. However, this approach results in significantly lower risk-adjusted future returns and seems to suggest mean-reversion in asset class returns.15 The second optimization approach, minimum variance, also produces disappointing results. Although it achieves its objective of producing a low-volatility portfolio, its Sharpe ratio, which is the lowest of all, is only 0.24.
As expected, the risk parity strategy favors more of the lower-risk asset classes, resulting in one of the
lowest portfolio volatilities; only the minimum variance portfolio has a lower volatility. How-ever, unlike our initial example in Exhibit 1 (and what is referenced in most studies on the risk parity strategy), the Sharpe ratio of the more diversified and comprehensive risk parity portfolio is not higher than the 60/40 portfolio variants, or a simple equal weighting of the nine asset classes. Additionally, note that when these portfolios are levered up to achieve the same 5.1% excess return of the 60/40 bench-mark, it is unclear whether their Sharpe ratios would remain the same after f inancing costs. More interestingly, the Sharpe ratio for the stock/bond risk parity portfolio in Exhibit 1 is higher than the Sharpe ratio for the, arguably, more diversified nine asset class risk parity port-folio (0.62 vs. 0.51). This calls into question the robustness of the methodology’s performance advantage noted in different studies. We also compare our results to a different horse race performed by Maillard, Roncalli, and Teiletche [2010], who study portfolios constructed from different asset classes and over a shorter horizon
(1995–2008) than in our study. They report the highest Sharpe ratio for their risk parity portfolio followed by minimum variance, with equal weighting coming in last. This further substantiates one of the key messages in our article—that the observed risk parity performance characteristics relative to other asset allocation alterna-tives can be highly dependent on the time period and the asset classes included.
In Exhibit 3, we take a closer look at the robust-ness of the strategies by computing the subperiod Sharpe ratios for each decade since 1980. We see that the 60/40 strategy had a full sample Sharpe ratio of 0.50. How-ever, the Sharpe ratio during the 1990s was nearly twice that at 0.99 and was only 0.04 during the 2000s; the 60/40 portfolio experience was dominated by the equity market performance, despite the massive bond market rally in the 2000s. The Sharpe ratios for the equal-weighting and the risk parity portfolios have been comparably more stable over the last three decades than the other strategies. This suggests that the full-sample Sharpe ratio for the risk parity or equal-weighting port-folios would be good predictor of strategy performance for the next 10 years; whereas the full-sample Sharpe ratio for the 60/40 benchmark, minimum variance, or
E X H I B I T 2Risk Parity vs. Other Portfolio Heuristics (with Nine Asset Classes), January 1980–June 2010
Notes: The risk-free rate is the three-month T-bill from St. Louis FED (http://research.stlouisfed.org/fred2/series/TB3MS). S&P 500 Total Returns are from Global Financial Data (http://www.globalfinancialdata.com). The BarCap Aggregate, U.S. Long Term Treasury, U.S. Corporate Investment Grade, and U.S. Corporate High Yield Bond Total Returns are from BarCap Live (http://live.barcap.com). Global Bonds Total Returns through 1985 are from Global Financial Data and since 1986 are from Bloomberg ( JP Morgan Global Government Bond Index). REITs Total Returns are from FTSI NAREIT Equity REITS series (http://www.REIT.com). MSCI EAFE and MSCI EM Total Returns are from MSCI (http://www.mscibarra.com/products/indices/global_equity_indices/performance.html). Commodities returns are the Dow Jones-AIG Commodity Index from Global Financial Data (http://www.global-financialdata.com).
JOI-CHAVES 111JOI-CHAVES 111 2/16/11 12:27:08 AM2/16/11 12:27:08 AM
The
Jou
rnal
of
Inve
stin
g 20
11.2
0.1:
108-
118.
Dow
nloa
ded
from
ww
w.ii
jour
nals
.com
by
Joel
Che
rnof
f on
12/
13/1
1.It
is il
lega
l to
mak
e un
auth
oriz
ed c
opie
s of
this
art
icle
, for
war
d to
an
unau
thor
ized
use
r or
to p
ost e
lect
roni
cally
with
out P
ublis
her
perm
issi
on.

112 RISK PARITY PORTFOLIO VS. OTHER ASSET ALLOCATION HEURISTIC PORTFOLIOS SPRING 2011
the mean–variance optimal portfolios would not predict future strategy performance with high accuracy.
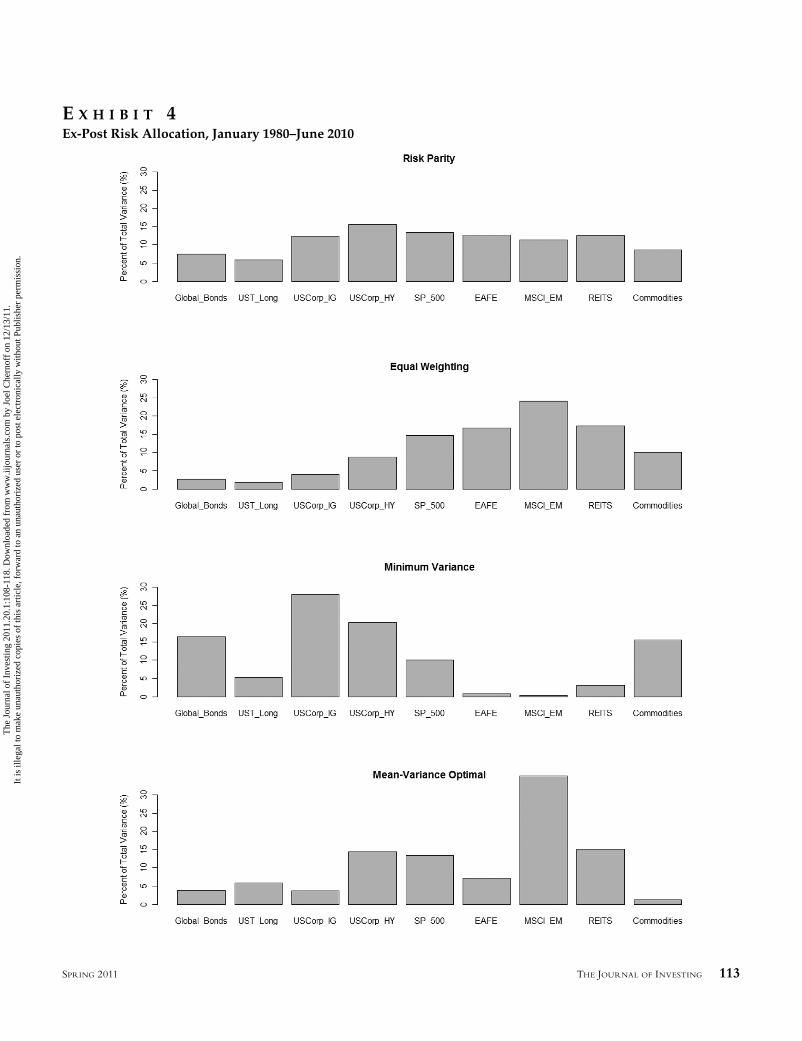
We now turn our attention to one of the claims by risk parity proponents, which is that the strategy provides true diversification by allocating risk equally across asset classes. To evaluate whether that is indeed the case, for each strategy we compute the percentage of the ex-post total portfolio variance attributed to each asset class. Since the portfolio return can be decomposed to the weighted asset class returns, r w rp ir i irr=Σ 1
N , the port-folio’s total variance can be decomposed into sums of covariances of the weighted returns. Thus, the ex-post risk allocation for each asset class is
Risk AlloAA cation to Assetcov( )
=
i
i i j jjw ri i w rj j
=,
1
NN
var ( )
∑rp
Exhibit 4 shows the percentage of ex-post total variance attributed to each asset class for the portfolio strategies under consideration. Although the risk allo-cation for the risk parity portfolio is not exactly equal across asset classes, ex post, it is indeed much more bal-anced than the other strategies. Notice that the equal-weighting portfolio has a higher risk allocation to the riskiest asset classes. Since those risky assets typically demand a higher risk premium, the mean–variance optimal strategy also tends to have more risk alloca-tion to the riskiest assets; hence the equal-weighting and the mean–variance optimal portfolios look quite
similar in terms of risk allocation. At the other extreme, we see that the minimum variance portfolio puts the bulk of its risk allocation in less volatile bonds.
SENSITIVITY TO ASSET CLASS UNIVERSE
Comparing the performance of the risk parity portfolios in Exhibits 1 and 2, we find that the performance of the strategy can be highly dependent on the universe of asset classes we include. Which asset classes and how many to include can be an art with the risk parity strategy (as would be the case with equal weighting). The sensitivity to asset class inclusion can also bring to ques-tion the validity of the documented superior
empirical performance. The very act of selecting asset classes for the risk parity portfolio construction can add elements of data mining and look-ahead bias into the empirical research.
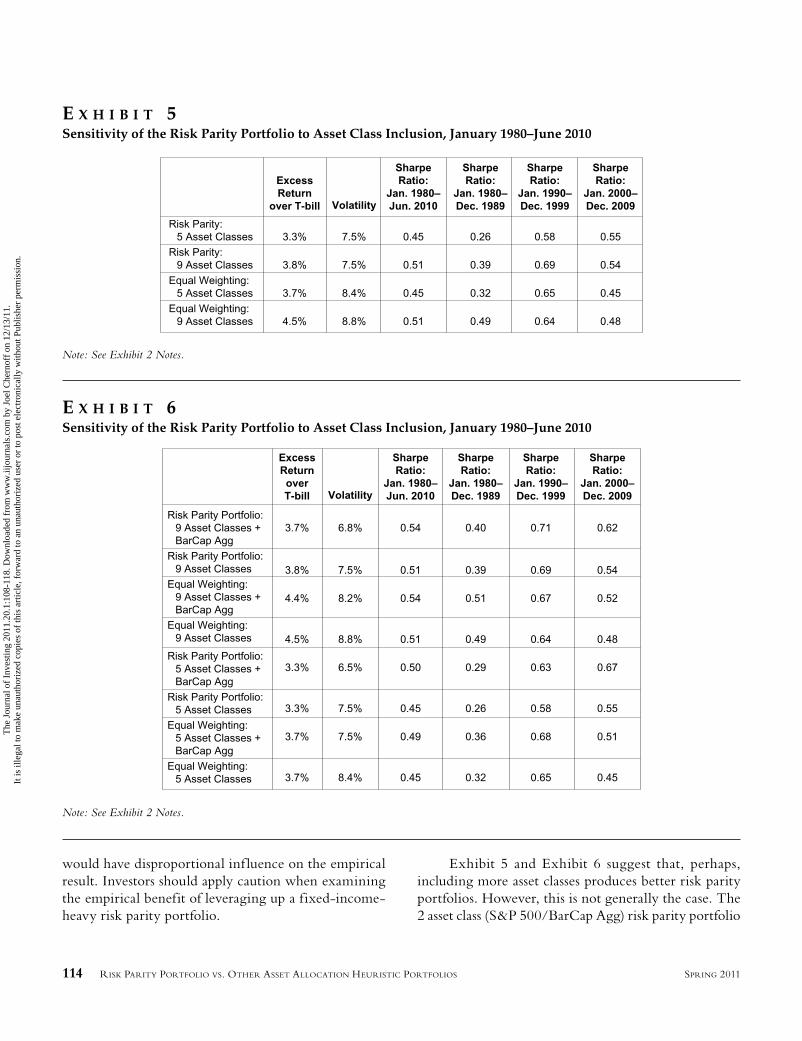
We illustrate the sensitivity to the asset class inclu-sion decision in Exhibit 5 and Exhibit 6. Specifically, in Exhibit 5 we reduce the number of asset classes from nine down to five, keeping only U.S. long Treasury, U.S. investment-grade corporate, S&P 500, commodi-ties, and REITs. For the five asset class scenario, the Sharpe ratios for both the risk parity and the equal-weighting strategies drop from 0.51 to 0.45 in the full sample. In Exhibit 6, we add one new index into the original nine asset class and the five asset class universes of investments—the BarCap Aggregate Bond Index, an index that is largely invested in intermediate-term U.S. Treasuries. This is not a special asset, except that it has had one of the best historical Sharpe ratios (0.82), pro-ducing 7.3% return with 4% volatility in the last 30 years. The BarCap Aggregate is also the driver of the impres-sive Sharpe ratio (0.62) for the stock/bond risk parity portfolio reported in Exhibit 1; the S&P 500/BarCap Agg risk parity portfolio, on average, invests 80% of the portfolio in the BarCap Agg index. The inclusion of this low-risk bond index results in an improvement in Sharpe ratios for both the equal-weighting and risk parity meth-odology (from 0.51 to 0.54 for the nine asset class case and from 0.45 to 0.50 for the five asset class case). Fur-thermore, this difference is especially pronounced in the last decade. For shorter-horizon studies, the last decade
E X H I B I T 3Subsample Analysis of Sharpe Ratios: Risk Parity vs. Other Portfolio Heuristics (with Nine Asset Classes), January 1980–June 2010
Note: See Exhibit 2 Notes.
JOI-CHAVES 112JOI-CHAVES 112 2/16/11 12:27:08 AM2/16/11 12:27:08 AM
The
Jou
rnal
of
Inve
stin
g 20
11.2
0.1:
108-
118.
Dow
nloa
ded
from
ww
w.ii
jour
nals
.com
by
Joel
Che
rnof
f on
12/
13/1
1.It
is il
lega
l to
mak
e un
auth
oriz
ed c
opie
s of
this
art
icle
, for
war
d to
an
unau
thor
ized
use
r or
to p
ost e
lect
roni
cally
with
out P
ublis
her
perm
issi
on.
THE JOURNAL OF INVESTING 113SPRING 2011
E X H I B I T 4Ex-Post Risk Allocation, January 1980–June 2010
JOI-CHAVES 113JOI-CHAVES 113 2/16/11 12:27:09 AM2/16/11 12:27:09 AM
The
Jou
rnal
of
Inve
stin
g 20
11.2
0.1:
108-
118.
Dow
nloa
ded
from
ww
w.ii
jour
nals
.com
by
Joel
Che
rnof
f on
12/
13/1
1.It
is il
lega
l to
mak
e un
auth
oriz
ed c
opie
s of
this
art
icle
, for
war
d to
an
unau
thor
ized
use
r or
to p
ost e
lect
roni
cally
with
out P
ublis
her
perm
issi
on.
114 RISK PARITY PORTFOLIO VS. OTHER ASSET ALLOCATION HEURISTIC PORTFOLIOS SPRING 2011
would have disproportional inf luence on the empirical result. Investors should apply caution when examining the empirical benefit of leveraging up a fixed-income-heavy risk parity portfolio.
Exhibit 5 and Exhibit 6 suggest that, perhaps, including more asset classes produces better risk parity portfolios. However, this is not generally the case. The 2 asset class (S&P 500/BarCap Agg) risk parity portfolio
E X H I B I T 5Sensitivity of the Risk Parity Portfolio to Asset Class Inclusion, January 1980–June 2010
E X H I B I T 6Sensitivity of the Risk Parity Portfolio to Asset Class Inclusion, January 1980–June 2010
Note: See Exhibit 2 Notes.
Note: See Exhibit 2 Notes.
JOI-CHAVES 114JOI-CHAVES 114 2/16/11 12:27:12 AM2/16/11 12:27:12 AM
The
Jou
rnal
of
Inve
stin
g 20
11.2
0.1:
108-
118.
Dow
nloa
ded
from
ww
w.ii
jour
nals
.com
by
Joel
Che
rnof
f on
12/
13/1
1.It
is il
lega
l to
mak
e un
auth
oriz
ed c
opie
s of
this
art
icle
, for
war
d to
an
unau
thor
ized
use
r or
to p
ost e
lect
roni
cally
with
out P
ublis
her
perm
issi
on.

THE JOURNAL OF INVESTING 115SPRING 2011
has a significantly better Sharpe ratio than the 10 asset class (9 + BarCap Agg) risk parity portfolio (0.62 vs. 0.54). Also the nine asset class risk parity portfolio has only an insignificant performance advantage over the six asset class (5 + BarCap Agg) risk parity portfolio (0.51 vs. 0.50). Further research is required to deduce a general relationship between the number of asset classes included and the resulting risk parity portfolio performance.
CONCLUSION
Risk parity is an investment strategy that has attracted significant attention in recent years. We show that this strategy has a higher Sharpe ratio than well established approaches like minimum variance or mean–variance optimization, but it does not consistently out-perform a simple equal-weighted portfolio or even a 60/40 equity/bond portfolio. It does have some inter-esting characteristics such as a balanced risk allocation and less volatile performance characteristics (Sharpe ratios) over time. However, we also find that risk parity is very sensitive to the inclusion decision for assets. The meth-odology is mute on how many asset classes and what asset classes to include. This last point is particularly
problematic because there is little in the way of theory to guide the asset inclusion decision. It is not the case that including more asset classes leads to better portfolio results. Empirically, we also know that including low-volatility fixed-income asset classes, which tend to have high Sharpe ratios historically, can lead to better back-tested results. However, this is unlikely to be a sound rule for investment; there may be reasons to question whether the high historical Sharpe ratio for bonds can persist into the future. We believe that more research on methods for evaluating asset classes for inclusion into a risk parity portfolio would provide tremendous value to the industry.
A P P E N D I X
PORTFOLIO WEIGHTS
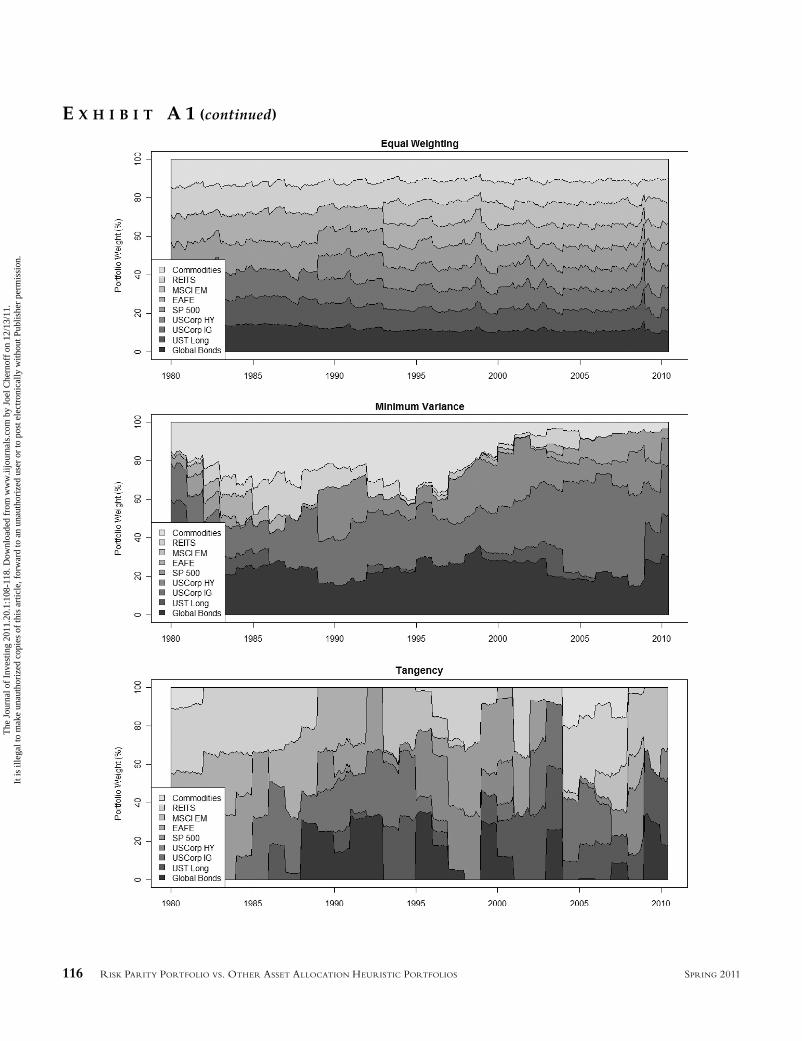
These charts compare the time series of portfolio weights for the different strategies. Mean–variance optimi-zation clearly has the highest turnover, followed by minimum variance. Risk parity and equal weighting have similarly low turnover. Not only do these two strategies have the best ex-post performance, but the lower turnover also implies lower rebalancing costs.
E X H I B I T A 1Time Series of Portfolio Weights
JOI-CHAVES 115JOI-CHAVES 115 2/16/11 12:27:13 AM2/16/11 12:27:13 AM
The
Jou
rnal
of
Inve
stin
g 20
11.2
0.1:
108-
118.
Dow
nloa
ded
from
ww
w.ii
jour
nals
.com
by
Joel
Che
rnof
f on
12/
13/1
1.It
is il
lega
l to
mak
e un
auth
oriz
ed c
opie
s of
this
art
icle
, for
war
d to
an
unau
thor
ized
use
r or
to p
ost e
lect
roni
cally
with
out P
ublis
her
perm
issi
on.
116 RISK PARITY PORTFOLIO VS. OTHER ASSET ALLOCATION HEURISTIC PORTFOLIOS SPRING 2011
E X H I B I T A 1 (continued)
JOI-CHAVES 116JOI-CHAVES 116 2/16/11 12:27:15 AM2/16/11 12:27:15 AM
The
Jou
rnal
of
Inve
stin
g 20
11.2
0.1:
108-
118.
Dow
nloa
ded
from
ww
w.ii
jour
nals
.com
by
Joel
Che
rnof
f on
12/
13/1
1.It
is il
lega
l to
mak
e un
auth
oriz
ed c
opie
s of
this
art
icle
, for
war
d to
an
unau
thor
ized
use
r or
to p
ost e
lect
roni
cally
with
out P
ublis
her
perm
issi
on.
THE JOURNAL OF INVESTING 117SPRING 2011
ENDNOTES
1See Merton [1980] for a discussion on the impact of time-varying volatility on the estimate for expected returns. See Cochrane [2005] for a survey discussion on the time-varying equity premium and models for forecasting equity returns. See Campbell [1995] for a survey on the time-varying bond premium. See Hansen and Hodrick [1980] and Fama [1984] for evidence on time-varying currency returns. See Bollerslev, Engle, and Wooldridge [1987] and Engle, Lilien, and Robins [1987] for evidence on time-varying vola-tility in equity and bond markets.
2See Michaud [1989] and Chopra and Ziemba [1993] for discussions on problems with using the mean–variance optimization methodology for constructing portfolios.
3Using 9.0% and 6.5% as expected stock and bond returns, respectively, the mean–variance optimal portfolio would invest 9.3% in stocks and 90.7% in bonds; which would produce a portfolio with a Sharpe ratio of 0.67. The 60/40 equity/bond portfolio, by comparison, has a Sharpe ratio of 0.41.
4For an exact mathematical proof for this statement, see Maillard, Roncalli, and Teiletche [2010].
5See Maillard, Roncalli, and Teiletche [2010] for details on one reasonable execution of the risk parity portfolio con-cept—an equal-weighted risk contribution portfolio; this methodology includes as a special case the inverse volatility-weighted risk parity portfolio. Also see the research papers by Qian [2005, 2009] and Peters [2009], which are product provider white papers that provide discussions on their respec-tive risk parity strategies. Bridgewater promotes a version of risk parity that only focuses on the volatility and ignores the correlation information (or assumes a special case of constant correlation for assets), which produces one of the simplest risk parity methodologies. In our article, we adopt this simpler portfolio construction. We believe that the qualitative con-clusions are robust to the exact specification of the risk parity methodology.
6In a recent research report, Meketa Investment Group, a U.S.-based institutional asset consultant, highlights these very same risks to its clients.
7We note that our data sample (1980–2010) coincides with a period of declining interest rates that is favorable to the risk parity portfolio. We’d expect that the performance of the risk parity strategy would be somewhat degraded during rising interest rates. Furthermore, by performing subsample analysis, we see that the results can be highly dependent on sample period.
8Maillard, Roncalli, and Teiletche [2010] also consider a horse race between risk parity, equal weighting, and min-imum variance. They use a different universe of assets and a shorter time period (1995–2008) whereas our data cover 1980 to 2010 and find different performance order ranking.
We reference their results in a later section to arrive at a conclusion regarding the robustness of the risk parity in-sample outperformance.
9See DeMiguel, Garlappi, and Uppal [2009] and Chow, Hsu, Kalesnik, and Little [2010].
10See Chopra and Ziemba [1993], Clarke, de Silva, and Thorley [2006], and Chow, Hsu, Kalesnik, and Little [2010].
11See Clarke, de Silva, and Thorley [2006].12The no-shorting constraint on the minimum vari-
ance and mean–variance optimal strategies is necessary for an apples-to-apples comparison, since both equal weighting and risk parity weighting implicitly start with no shorting.
13With monthly rebalancing, the Sharpe ratios for the 60/40, U.S. pension, risk parity, equal-weighting, minimum variance, and mean–variance optimal portfolio strategies are 0.52, 0.50, 0.50, 0.47, 0.24, and 0.46, respectively.
14We used bootstrap resampling to compute standard errors and compute t-tests of the differences of Sharpe ratios. As one would expect given the similarity of the Sharpe ratios, none of the strategies’ Sharpe ratios were statistically signifi-cantly different from each other.
15See De Bondt and Thaler [1985] for evidence on equity market mean-reversion and Asness, Moskowitz, and Pedersen [2009] for evidence on mean-reversion for various asset classes.
REFERENCES
Asness, Clifford S., Tobias J. Moskowitz, and Lasse Heje Pedersen. “Value and Momentum Everywhere.” Working paper, 2009.
Bollerslev, Tim, Robert F. Engle, and Jeffrey M. Wooldridge. “A Capital Asset Model with Time-Varying Covariances.” Journal of Political Economy, 96 (1987), pp. 116-131.
Campbell, John Y. “Some Lessons from the Yield Curve.” Journal of Economic Perspectives, 9 (1995), pp. 129-152.
Chopra, V.K., and W.T. Ziemba. “The Effect of Errors in Means, Variances and Covariances on Optimal Portfolio Choice.” Journal of Portfolio Management, Vol. 19, No. 2 (Winter 1993), pp. 6-11.
Chow, Tzee-man, Jason C. Hsu, Vitali Kalesnik, and Bryce Little. “A Survey of Alternative Equity Index Strategies.” Working paper, 2010.
Clarke, Roger G., Harindra de Silva, and Steven Thorley. “Minimum-Variance Portfolios in the U.S. Equity Market.” Journal of Portfolio Management, Vol. 33, No. 1 (Fall 2006), pp. 10-24.
JOI-CHAVES 117JOI-CHAVES 117 2/16/11 12:27:17 AM2/16/11 12:27:17 AM
The
Jou
rnal
of
Inve
stin
g 20
11.2
0.1:
108-
118.
Dow
nloa
ded
from
ww
w.ii
jour
nals
.com
by
Joel
Che
rnof
f on
12/
13/1
1.It
is il
lega
l to
mak
e un
auth
oriz
ed c
opie
s of
this
art
icle
, for
war
d to
an
unau
thor
ized
use
r or
to p
ost e
lect
roni
cally
with
out P
ublis
her
perm
issi
on.

118 RISK PARITY PORTFOLIO VS. OTHER ASSET ALLOCATION HEURISTIC PORTFOLIOS SPRING 2011
Cochrane, John H. Asset Pricing. Princeton, New Jersey, 2005.
De Bondt, Werner F.M., and Richard Thaler. “Does the Stock Market Overreact?” Journal of Finance, 40 (1985), pp. 793-805.
DeMiguel, Victor, Lorenzo Garlappi, and Raman Uppal. “Optimal Versus Naïve Diversification: How Inefficient Is the 1/N Portfolio Strategy?” Review of Financial Studies, Vol. 22, No. 5 (2009), pp. 1915-1953.
Engle, Robert F., David M. Lilien, and Russel P. Robins. “Estimating Time Varying Risk Premia in the Term Struc-ture: The ARCH-M Model,” Econometrica, 55 (1987), pp. 391-407.
Fama, Eugene F. “Forward and Spot Exchange Rates.” Journal of Monetary Economics, 14 (1984), pp. 319-338.
Foresti, Steven J., and Michael E. Rush. “Risk-Focused Diversification: Utilizing Leverage within Asset Allocation.” Wilshire Consulting, February 11, 2010.
Gross, William H. “On the ‘Course’ to a New Normal.” PIMCO Investment Outlook, September 2009.
Hansen, Lars Peter, and Robert J. Hodrick. “Forward Exchange Rates as Optimal Predictors of Future Spot Rates: An Econometric Analysis.” Journal of Political Economy, 88 (1980), pp. 829-853.
Inker, Ben. “The Hidden Risk of Risk Parity Portfolios.” GMO White Paper, March 2010.
Little, Pat. “Risk Parity 101.” Research Note, Hammond Associates, July 2010.
Lovell, Christopher A. “Risk Parity: In the Spotlight after 50 Years.” NEPC, March 2010.
Maillard, Sebastien, Thierry Roncalli, and Jerome Teiletche. “The Properties of Equally Weighted Risk Contribution Portfolios.” Journal of Portfolio Management, Vol. 36, No. 4 (2010), pp. 60-70.
Markowitz, Harry. “Portfolio Selection.” Journal of Finance, Vol. 7, No. 1 (1952), pp. 77-91.
Merton, Robert C. “On Estimating the Expected Return on the Market: An Exploratory Investigation.” Journal of Financial Economics, Vol. 8, No. 4 (1980), pp. 323-361.
Michaud, Richard. “The Markowitz Optimization Enigma: Is Optimized Optimal?” Financial Analysts Journal, Vol. 45, No. 1 ( January/February 1989), pp. 31-42.
Peters, Ed. “Balancing Betas: Essential Risk Diversification.” First Quadrant Perspective, Vol. 6, No. 2 (February 2009).
“Portable Beta.” Presentation, AQR Capital Management.
Qian, Edward. “Risk Parity Portfolios: Efficient Portfolios through True Diversif ication,” Research Paper, Panagora, September 2005.
——. “Risk Parity Portfolios: The Next Generation,” Research Paper, Panagora, November 2009.
“Risk Parity.” White Paper, Meketa Investment Group, 2010: http://meketa.com/documents/RiskParityWP_000.pdf.
To order reprints of this article, please contact Dewey Palmieri at [email protected] or 212-224-3675.
JOI-CHAVES 118JOI-CHAVES 118 2/16/11 12:27:17 AM2/16/11 12:27:17 AM
The
Jou
rnal
of
Inve
stin
g 20
11.2
0.1:
108-
118.
Dow
nloa
ded
from
ww
w.ii
jour
nals
.com
by
Joel
Che
rnof
f on
12/
13/1
1.It
is il
lega
l to
mak
e un
auth
oriz
ed c
opie
s of
this
art
icle
, for
war
d to
an
unau
thor
ized
use
r or
to p
ost e
lect
roni
cally
with
out P
ublis
her
perm
issi
on.