ring spun yarn parameters impact on composite yarn ... … · ring spun yarn parameters impact on...
TRANSCRIPT

Ring Spun Yarn Parameters Impact on Composite Yarn Quality Model
Hajer Souid Textile Engineering Laboratory LGTex of Iset of ksar Hellal, B.P 68, Avenue Hadj Ali SOUA,
5070 Ksar Hellal, Tunisia E-mail: [email protected]
Mehdi Sahnoun Textile Engineering Laboratory LGTex of Iset of ksar Hellal, B.P 68, Avenue Hadj Ali SOUA,
5070 Ksar Hellal, Tunisia E-mail:
Morched Cheikhrouhou The Beaux Arts School of ISET of Sfax, 34 Avenue 5 août, Sfax 3069, Tunisia
E-mail: [email protected]
Abstract
In the present study, we investigate the effect of fibers and construction parameters on the overall ring spun yarn quality. We develop for the case a global quality index for the ring spun yarn. This part of the study was achieved by using Derringer and Suich desirability functions. Then, we have applied an artificial neural networks model to these parameters. We base our research work on a prediction model to represent global ring spun yarn quality. This model is developed by optimizing fibers parameters, yarn count and twist. Finally, we tried to search the impact of all these parameters on the neural networks model while aligning a confidence interval.
Keywords: ring spun yarn; quality; desirability functions; neural networks; confidence interval.
1. Introduction In spite of the fast-fashion movement, denim
clothes are usually found in the major wardrobes. The competition that denim jeans are facing from other product categories is intensified by shoppers being disappointed about recent changes in the quality of fabric and fiber content of apparel products. Hence, to satisfy customers, the fabric should respond to an optimal global quality. To
reach this goal, different fibers criteria should consequently be satisfied at the same time. For this case, we have firstly developed an index generalizing ring spun yarn global quality by studying nine yarn principal parameters.
In the second stage, we developed a model for predicting the overall quality of the present cotton yarn by combining major fibers parameters. This study has been achieved by using a back propagation neural networks.
The last part of the present work studies the impact of fibers factors and yarn structural parameter on the neural network model.
2. Materials and methods
In order to study ring spun yarn overall quality, we have used the international standards using the Uster Tester 3 and Uster Tensiorapid 3 testing systems by considering the major known yarn characteristics (Table 1). In this survey, we study the following yarn aspects (Table 1):
The statistical summary of ring spun properties measurements is given in table 2 as follow:
For fiber properties, we have used a large database with the following statistical summary measurements (Table 3).
Hajer Souid et al, Int.J.Computer Technology & Applications,Vol 7(2),261-267
IJCTA | March-April 2016 Available [email protected]
261
ISSN:2229-6093

Table 1: Yarn properties
Yarn properties Instrument Symbol
Tenacity (CN/ Tex) Uster tensiorapid 3 RKM
Tenacity evenness Uster tensiorapid 3 CVRKM
Breaking elongation Uster tensiorapid 3 E%
Work Uster tensiorapid 3 TR
Regularity Uster tester 3 U%
Number of thick points Uster tester 3 THIK
Number of thin points Uster tester 3 THIN
Number of neps Uster tester 3 BOUT
Hairiness Uster tensiorapid 3 PILO
Table 2: Summary statistics for ring spun yarn properties
RKM CVRKM E% TR U% THIK THIN BOUT PILO
Minimum value 14.64 0.00 6.27 1.27 7.37 2.75 0.00 0.45 0.00
Maximum value 22.12 18.96 9.72 6.58 12.32 300.50 19.43 350.2
0 58.65
Standard deviation 1.23 3.17 0.77 0.85 0.96 64.59 3.76 76.37 6.11
Mean 17.32 6.85 7.87 2.83 9.92 64.29 1.46 64.09 9.74
Table 3: Summary statistics for fibers properties
Yarn characteristics are combined to provide a measure of the composite or overall desirability D of the multi-response system (equation (1)). The composite desirability D represents the weighted geometric mean of the individual desirabilities ( id ) for ring spun yarn responses [1]; [2].
w wnn
ww dddD ×××= ...2121
(1)
iww ∑= ; iw are the weight of ith response.
id : Derringer and Suich individual desirability function ( id ) by using the provided
goals and boundaries for each response [3]. The goal of each response can be one of the three following choices:
Fiber property Symbol Mean value
Standard deviation
Minimum value
Maximum value
Micronaire index(µg/inch) Mic 4.30 0.13 4.00 4.70 Upper Half Mean Length
(UHML) (10-3 m) Len 28.44 0.68 27.40 30.60
Short Fiber index (%) Sfi 7.92 1.82 4.10 10.90 Strength (CN/tex) Str 29.32 1.56 26.00 34.90
Elongation (%) Elg 6.53 0.80 4.90 8.20 Trash count Tr cnt 11.52 4.47 2.00 24.00
Greyness (color reflectance) Rd 75.43 1.13 72.3 80.00
Hajer Souid et al, Int.J.Computer Technology & Applications,Vol 7(2),261-267
IJCTA | March-April 2016 Available [email protected]
262
ISSN:2229-6093

• Minimizing a response. • Targeting a response. • Maximizing a response.
3. Results and discussion 3.1. Neural network modelling In this study, we implemented a back-propagation neural network [4]. The network structure is composed of one single hidden layer connected to an input layer and an output layer. The input units constitute fiber properties summarized in table3. Since we have studied nine yarn responses (table 1), we should have one neural networks model for
each response. In our case, we have reduced these models into one single network model. The output of the model is the geometric mean of the individual desirabilities of yarn responses (or composite yarn quality; equation 1).
We have tried the back-propagation neural network with one hidden layer and different hidden nodes and epochs until having a correlation coefficient near to one and small and comparable errors test and train. These 3 conditions determine the good performance of the model [5], [12].
Table 4: Input and output parameters of the neural network model
Inputs
Fiber properties
Micronaire index(µg/inch) Mic
Upper Half Mean Length (UHML) (10-3 m) Len
Short Fiber index (%) Sfi
Strength (CN/tex) Str
Elongation (%) Elg
Trash count Tr cnt
Greyness (color reflectance) Rd
Construction parameter Yarn count Nm
Twist value TORS
Output Ring spun yarn global
quality DG Ring
Figure 1: Learning curve of the artificial neural network model.
As shown in the learning curve in Figure 1, the right number of epochs reached is 100. In fact, after 100 iterations, the algorithm has converged to a mean square error generated by the training data trainRMSE = 0.013 and a root mean square
error generated by the test data testRMSE =
0.019 as follow:
o trainRMSE : The root mean square error
generated by the training data (Equation 2).
Hajer Souid et al, Int.J.Computer Technology & Applications,Vol 7(2),261-267
IJCTA | March-April 2016 Available [email protected]
263
ISSN:2229-6093
21
12
),((
∑ −
=N
NbixgiD
trainRMSE (2)
N : Number which represents 80% of database.
iD : Yarn quality index calculated from the
training database corresponding to the input ix .
),( bixg : Yarn quality index calculated by the
neural network corresponding to the input ix for a
weight value b .
),( bixgiy − : The individual error
o testRMSE : The root mean square error generated by the test data in Equation 3:
21
12
),((
∑ −
=P
PbixgiD
testRMSE (3)
P : Number of test data places = 236 = 20% of input-output data pairs were used as the test set.
3.2. Input variables impact on neural network model 3.2.1. Twist and yarn count effects
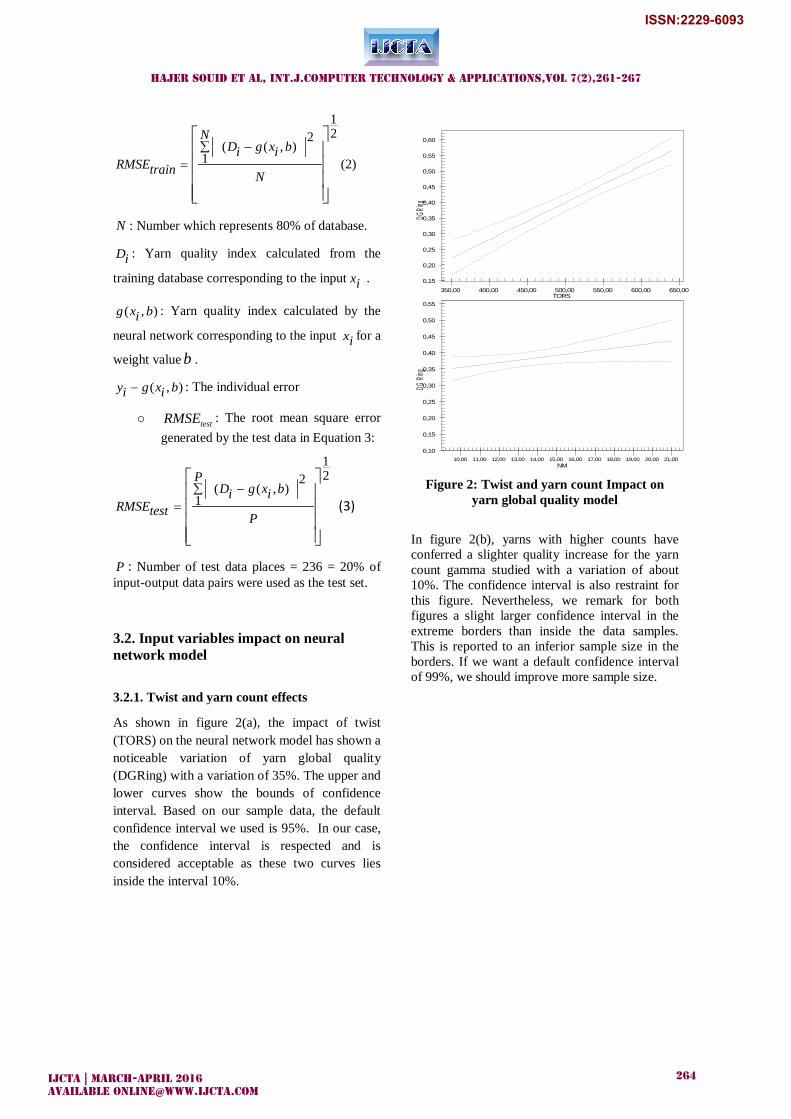
As shown in figure 2(a), the impact of twist (TORS) on the neural network model has shown a noticeable variation of yarn global quality (DGRing) with a variation of 35%. The upper and lower curves show the bounds of confidence interval. Based on our sample data, the default confidence interval we used is 95%. In our case, the confidence interval is respected and is considered acceptable as these two curves lies inside the interval 10%.
Figure 2: Twist and yarn count Impact on
yarn global quality model
In figure 2(b), yarns with higher counts have conferred a slighter quality increase for the yarn count gamma studied with a variation of about 10%. The confidence interval is also restraint for this figure. Nevertheless, we remark for both figures a slight larger confidence interval in the extreme borders than inside the data samples. This is reported to an inferior sample size in the borders. If we want a default confidence interval of 99%, we should improve more sample size.
0,15
0,20
0,25
0,30
0,35
0,40
0,45
0,50
0,55
0,60
350,00 400,00 450,00 500,00 550,00 600,00 650,00
DGRin
g
TORS
0,10
0,15
0,20
0,25
0,30
0,35
0,40
0,45
0,50
0,55
10,00 11,00 12,00 13,00 14,00 15,00 16,00 17,00 18,00 19,00 20,00 21,00
DG Ri
ng
NM
Hajer Souid et al, Int.J.Computer Technology & Applications,Vol 7(2),261-267
IJCTA | March-April 2016 Available [email protected]
264
ISSN:2229-6093

3.2.2. Fibers parameters impact on the neural model
3.2.2.1. Length and micronaire impact on yarn global quality model
Figure 3: Length and micronaire impact on
yarn global quality model
The impact of fiber length (figure 3 a) and micronaire index ( figure 3 b)on the neural network model show a monotone increase of the overall yarn quality (central curve). Yarns with higher length and micronaire index have generated a better global quality of ring spun yarn. For Micronaire index, which is a combinaision of fiber finess and maturity [6];[11], the abscissa data varies between 4 and 4.7. This variation covers a large gamma of different origins of cotton fibers used in the manufacture where the present research was achieved (Indian cotton, Egyptian cotton, Madagascar cotton, Chinese cotton, Bangladesh cotton). In spite of the restraint interval of variation of this parameter, its impact on yarn quality model is relatively significant. The confidence interval is superior of 95%. For both figures, the confidence interval is larger in the limit borders which are reported to an inferior sample size.
3.2.2.2. Short fiber index and trash count impact on yarn global quality model
Figure 4: Short fiber index and trash count
impact on yarn global quality model
The impact of short fiber index ‘sfi’ and trash count ‘trcnt’ on the neural network model have shown for both curves a slight decrease variation (about 4%) in the all interval of variation of these two fibers parameters (figure 4). This impact agrees the statistical results of Ben Ammar S. and Halleb N. [13] and El Moghazy [14]. The confidence interval is tolerable for both figures as it is superior of 94%. 3.2.2.3. Elongation and greyness impact on yarn global quality model
0,20
0,25
0,30
0,35
0,40
0,45
27,00 27,50 28,00 28,50 29,00 29,50
DG Ri
ng
len
0,34
0,35
0,36
0,37
0,38
0,39
0,40
0,41
0,42
0,43
0,44
0,45
0,46
4,00 4,10 4,20 4,30 4,40 4,50 4,60 4,70
DGRin
g
mic
0,325
0,350
0,375
0,400
0,425
0,450
0,475
4,00 5,00 6,00 7,00 8,00 9,00 10,00
DGRin
g
sfi
0,25
0,30
0,35
0,40
0,45
0,50
0,55
2,50 5,00 7,50 10,00 12,50 15,00 17,50 20,00 22,50
DG Ri
ng
tr cnt
0,300
0,325
0,350
0,375
0,400
0,425
0,450
0,475
73,00 74,00 75,00 76,00 77,00 78,00 79,00 80,00
DG Ri
ng
rd
Hajer Souid et al, Int.J.Computer Technology & Applications,Vol 7(2),261-267
IJCTA | March-April 2016 Available [email protected]
265
ISSN:2229-6093

Figure 5: Elongation and greyness impact on yarn global quality model
The neural network model shows a slight increase effect of color reflectance on yarn global quality (figure 5) (0,38 to 0,425). Generally, cotton color reflectance defines fiber selling to get a better yarn or fabric whiteness degree or to facilitate dyeing. Through this result, cotton reflectance has also an influence on composite yarn quality. This result agrees El Moghazy statistical study of ring and open end yarns [14].
For fiber elongation impact (figure 5 b), the global yarn desirability index reveals a similar variation as color reflectance of about 5%. For both figures, the confidence interval is respected and is superior in the central of the curves.
3.2.2.4. Fiber Strength impact on yarn global quality model The neural network model developed has conferred to a yarn global quality variation of ≈ 8% (figure 6). This result coincides with the real database. Hence, yarns with higher fiber strength present a better yarn strength so a better yarn global quality. The confidence interval is acceptable in the mean of the interval of fiber strength ([25; 35]). For higher fiber strength, the confidence interval is about 90%. To get a better confidence interval, data samples needs a little more improvement.
Figure 6: Fiber strength impact on yarn global quality model
4. Conclusion
To study the quality of ring spun yarns, while considering fiber and construction parameters, we have used a combination of two approaches: the desirability functions and neural networks. The first approach has contributed to one global yarn quality index. The second approach has allowed to predict this index. In a third stage of this study, we tried to show how the neural network model works against these parameters. In fact, we have not studied the effect of a number of fiber and construction parameters on global ring spun yarn quality, but rather we tried to view the impacts of these factors on the neural network model. In addition to confidence interval, this has showed, somehow, a manner of the model efficiency.
5. References
[1] Souid H., Babay A., Sahnoun M., Cheikrouhou M., “Ring spun and slub yarns quality optimisation by using the desirability function”, Autex Research Journal, Vol. 8, No3, 72-76; September 2008
[2] Souid H., Sahnoun M., Babay A., Cheikrouhou M., “Slub Yarn Quality Optimization by Using Desirability function and Neural Networks”, Journal Of Applied Sciences , ISSN 1812-5654 / DOI: 10.3923/jas. © 2011 Asian Network for Scientific Information. 2011
[3]Derringer GC, Suich R., “Simultaneous optimization of several response variables”, Journal of Quality Technology, 12(4):p. 214–219;1980
[4] Dreyfus G., Martinez M., Samuelides M., M.B. Gordan, F. Badran, S. Thiria, L. Hérault. Réseaux de Neurones: Méthodologie et Application, Editions Eyrolles, Paris, vol. 1. (2002)
[5] Msahli S., Hadj Taieb A. et Sakli F. "A new approach for predicting the knit global quality by using the desirability function and neural networks" Journal of Textile Institute; vol. 97; N° 1; pp: 17-23; 2006
[6] Harrington EC., The desirability function, Industrial Quality Control, pp: 494–498; (1965)
[7] El Mogahzy Y., Broughton R., Lynch JR. and W.K.. “A statistical approach for determining the technological value of cotton using HVI fiber properties”, Textile Research Journal, vol 60 n°9; pp 495-500; September 1990.
[8] Derringer GC, Suich R., “Simultaneous optimization of several response variables”, Journal of Quality Technology; vol 12; n°4; pp 214–219; 1980
0,325
0,350
0,375
0,400
0,425
0,450
5,00 5,50 6,00 6,50 7,00 7,50 8,00 8,50
DGRin
g
elg
0,325
0,350
0,375
0,400
0,425
0,450
0,475
25,00 26,00 27,00 28,00 29,00 30,00 31,00 32,00 33,00 34,00 35,00
DGRin
g
str
Hajer Souid et al, Int.J.Computer Technology & Applications,Vol 7(2),261-267
IJCTA | March-April 2016 Available [email protected]
266
ISSN:2229-6093

[9] Abd Jelil R., Zeng X., Koel L. and Erwuelz A., “Prediction of plasma surface modification of woven fabrics using neural networks, IJARTEX
[10] Chattopadhyay R., “Application of neural network in manufacture”, Indian journal of fibre & textile research, vol 31 pp160-169, march 2006
[11] El Mogahzy Y., Roy M. Broughton Jr. and W. S. Perkins,Clemson: M.S. Eiiison, C. D. Rogers, H. Behery , S.R. Matic-Leigh,NCSU: Moon W. Suh, Wiiiiam Oxenhaum, Jon P. “Cotton Fiber Quality: Characterization, Selection, and Optimization” File: A92Cl PI(s): Auburn: RustAnnual Report Ending, 1993
[12] Ramesh Mc, Rajamaniachan R. et Jayaraman; “The prediction of yarn tensile properties by using artificial neural networks”, Textile Research Journal; vol 86; n°3; pp 459-468; 1995.
[13] Ben Ammar S., Halleb. N., “Prediction of the mechanical behaviour of open end and ring spun yarns”, Journal of Applied Sciences; vol 9; n°8; pp1466-1473; 2009.
[14] El Mogahzy Y., Broughton R., Lynch JR. and W.K.. “A statistical approach for determining the technological value of cotton using HVI fiber properties”, Textile Research Journal, vol 60 n°9; pp 495-500; September 1990.
[15]P.J Morris, J. H. Merkin and R.W. Rennell, “Modelling of yarn properties from fibre properties”, Journal of Textile Institute 90 part 1 No3; 323-335: 1999
Hajer Souid et al, Int.J.Computer Technology & Applications,Vol 7(2),261-267
IJCTA | March-April 2016 Available [email protected]
267
ISSN:2229-6093