rhamnolipid biosurfactant mixtures for environmental remediation
TRANSCRIPT
ARTICLE IN PRESS
Available at www.sciencedirect.com
WAT E R R E S E A R C H 4 2 ( 2 0 0 8 ) 1 7 3 5 – 1 7 4 3
0043-1354/$ - see frodoi:10.1016/j.watres
�Corresponding autOK 73019-1024, USA
E-mail address:
journal homepage: www.elsevier.com/locate/watres
Rhamnolipid biosurfactant mixtures forenvironmental remediation
Thu T. Nguyena,d, Noha H. Youssefb, Michael J. McInerneyb, David A. Sabatinic,d,�
aChemical, Biological and Materials Engineering, 100 East Boyd Street, Norman, OK 73019, USAbBotany and Microbiology, 770 Van Vleet Oval, Norman, OK 73019, USAcCivil Engineering and Environmental Science, University of Oklahoma, 202 West Boyd Street, Room 334, Norman, OK 73019-1024, USAdInstitute for Applied Surfactant Research, University of Oklahoma, Norman, OK, USA
a r t i c l e i n f o
Article history:
Received 9 March 2007
Received in revised form
18 October 2007
Accepted 23 October 2007
Available online 4 November 2007
Keywords:
Biosurfactant
Alkyl propoxylated sulfate
surfactants
Hydrophobicity
Interfacial tension
Petroleum hydrocarbons
Environmental remediation
nt matter & 2007 Elsevie.2007.10.038
hor. Civil Engineering and. Tel.: +1 405 325 4273; fa
[email protected] (D.A. Sa
a b s t r a c t
This study investigated the efficiency of rhamnolipid biosurfactant and synthetic
surfactant mixtures for improving the interfacial activity of the surfactant system against
several light non-aqueous-phase liquids (LNAPLs). Since the rhamnolipid biosurfactant
proved to be relatively hydrophilic, we hypothesized that mixtures of rhamnolipid
biosurfactants with more hydrophobic synthetic surfactants would produce lower
interfacial tensions (IFTs) than an individual rhamnolipid biosurfactant. The minimum
IFT observed for rhamnolipid alone and toluene (0.03 mN/m) was one order of magnitude
lower than for hexane, decane, and hexadecane, demonstrating the relatively hydrophilic
nature of the rhamnolipid. The low IFTs even at the low surfactant concentration used
suggest mobilization as the dominant oil-removal mechanism versus supersolubilization.
The critical micelle concentration (CMC) and critical microemulsion concentration (CmC) of
the rhamnolipid were found to be 0.001 w/w% (0.019 mM) and 0.01 w/w% (0.19 mM),
respectively. Three alkyl propoxylated (PO) sulfate synthetic surfactants were individually
mixed with the rhamnolipid. As the hydrophobicity of the surfactant mixture approached
that of the hydrocarbon, IFT values decreased by one to two orders of magnitude below that
achieved with individual surfactants. This work shows that the rhamnolipid has excellent
phase behavior at low concentrations and can be used in surfactant mixtures to achieve the
low IFT values needed for environmental remediation, enhanced oil recovery (EOR), and
other applications.
& 2007 Elsevier Ltd. All rights reserved.
1. Introduction
Surfactants are amphiphilic molecules having both hydro-
philic and hydrophobic moieties, which causes them to
accumulate at the interface between immiscible fluid phases
(e.g., oil/water or air/water interfaces) (Rosen, 1989) and
reduce the interfacial tension (IFT) (Desai and Banat, 1997).
Surfactants are categorized by their head groups as nonionic,
r Ltd. All rights reserved.
Environmental Science,x: +1 405 325 4217.batini).
anionic or cationic (negatively or positively charge), or
amphoteric (both positive and negative charges) (Georgiou
et al., 1992; Urum and Pekdemir, 2004).
Whereas synthetic surfactants are produced from petro-
leum feedstock, biosurfactants are produced from renewable
resources. There are several types of substrates used for
biosurfactant production such as water-soluble carbon
sources (glycerol, glucose, and ethanol), water-immiscible
University of Oklahoma, 202 West Boyd Street, Room 334, Norman,
ARTICLE IN PRESS
WAT E R R E S E A R C H 4 2 ( 2 0 0 8 ) 1 7 3 5 – 1 7 4 31736
substrates (n-alkanes and olive oil), and nitrogen sources
(ammonium salts and urea) (Desai and Banat, 1997; Youssef
et al., 2007). Microorganisms produce biosurfactants with
diverse structures including glycolipids, phospholipids, poly-
saccharide–lipid complexes, lipopeptides, and hydroxylated
and cross-linked fatty acids (Lin et al., 1994; Urum and
Pekdemir, 2004). While nonionic and anionic biosurfactants
have been reported, cationic biosurfactants have not been
found (Bognolo, 1999). Biosurfactant head groups usually
consist of mono-, di-, or polysaccharides, carboxylic acids,
amino acids, or peptides. The hydrophobic tail can be
saturated, unsaturated, or hydroxylated fatty acids. Biosur-
factants are readily biodegradable, making them well suited
for environmental and industrial applications (Lin et al., 1994;
Maier and Soberon-Chavez, 2000). In addition, biosurfactant-
based systems are biorenewable as compared with petro-
leum-based surfactants. However, to date, biosurfactants are
more expensive with production costs of about 3–10 times
higher than that of the chemical counterparts (Mulligan and
Gibbs, 1993), making it critical to maximize the performance
of biosurfactant-based systems.
Above the critical micelle concentration (CMC), surfactant
monomers aggregate to form micelles (Rosen, 1989). Many
system properties remain unchanged above the CMC since
additional surfactant forms micelles rather than increasing
the surfactant aqueous activity (Rosen, 1989; Urum and
Pekdemir, 2004). Depending on system properties, micellar
configurations can be spherical; elongated, cylindrical, rod-
like micelles; large, flat, lamellar micelles; and large vesicles.
Micelle formation also plays an important role in under-
standing microemulsions. Microemulsions are thermodyna-
mically stable emulsions that contain water and oil domains
separated by surfactant films (Rosen, 1989). Microemulsions
are used in enhanced oil recovery (EOR), drug delivery,
cosmetic and pharmaceutical applications, and enhanced
aquifer remediation (Desai and Banat, 1997; McCray et al.,
2001; Acosta et al., 2002). These applications take advantage
of a microemulsion’s ability to produce ultralow IFT values
(o0.1 mN/m) (Acosta et al., 2003).
The concentration at which a microemulsion first forms is
called the critical microemulsion concentration (Rosen, 1989).
Microemulsions can exist in four forms. While Type I
microemulsions solubilize oil into spherical, normal micelles
within the water phase, Type II microemulsions solubilize
water in reverse micelles, which occur in the oil phase. Type
III microemulsions exhibit three phases, excess oil and water
phases and a bicontinuous phase. Type III (middle-phase)
microemulsions occur when lamellar micelles are formed in
the system (Bourrel and Schechter, 1988). In the presence of a
low level of electrolyte (NaCl), ionic surfactant monomers
aggregate and form spherical micelles (Type I microemul-
sions). As more electrolyte is added, the electrical double
layer surrounding the ionic head group compresses and the
micelle curvature decreases. With sufficient electrolyte,
bilayer, lamellar micelles form with a net curvature of zero
(Type III microemulsions). With additional electrolyte, the
curvature becomes negative and reverse micelles are formed
(Type II microemulsions) (Acosta et al., 2003). Conversely, for a
middle-phase microemulsion, increasing surfactant concen-
tration causes the volume of the middle phase to increase
until all the oil and water coexists in a Winsor Type IV single-
phase microemulsion (Rosen, 1989).
Non-aqueous phase liquids are trapped in porous media by
capillary forces due to high oil–water IFT. While micelles can
enhance contaminant ‘‘solubility’’ (solubilization), this pro-
cess is not nearly as efficient as mobilization, which results
from greatly reducing the IFT, as possible with microemul-
sions, and thus release the trapped oil. This is why mobiliza-
tion is the only technology evaluated in EOR, and is the
preferred environmental technology for light non-aqueous-
phase liquids (LNAPLs) such as petroleum hydrocarbons
(Sabatini et al., 1995, 2000; Wu et al., 2001; Childs et al.,
2005). Thus, interfacial properties of the surfactant systems
used play an important role in petroleum hydrocarbon
remediation.
Biosurfactant research has focused on the properties and
behavior of individual biosurfactants (e.g., rhamnolipid) in
the aqueous phase (Helvaci et al., 2004; Ozdemir and
Malayoglu, 2004; Ozdemir et al., 2004). The current research
has two main objectives: (1) to study the interfacial properties
of the rhamnolipid biosurfactant against several hydrocar-
bons and (2) to determine the efficiency of using mixtures of
rhamnolipid biosurfactant with synthetic surfactants to
improve the interfacial properties of the surfactant system.
Since rhamnolipid proves to be relatively hydrophilic, we
hypothesize that mixtures of rhamnolipid biosurfactants
with more hydrophobic synthetic surfactants will produce
lower IFT, and that the hydrophobicity of the surfactant
mixture needs to be tailored to that of the target hydrocarbon
in order to achieve ultralow IFTs. By maximizing the
effectiveness of biosurfactant-based systems in lowering
oil–water IFT, and thus oil recovery, sustainable technologies
can be developed using biorenewable materials, an ultimate
goal of this research effort.
2. Materials and methods
2.1. Materials
The rhamnolipid biosurfactant JBR 515 (15 w/v%) was pur-
chased from Jeneil Biosurfactant Co. (Saukville, Wisconsin).
JBR 515 was originally received as a blend of 50 w/v%
monorhamnolipid (C26H48O9, MW ¼ 504, CMC ¼ 10�4 M at
neutral pH) and 50 w/v% dirhamnolipid (C32H58O13,
MW ¼ 650, CMC ¼ 1.5�10�4 M at neutral pH) (Helvaci et al.,
2004; Ozdemir and Malayoglu, 2004; Ozdemir et al., 2004; Xie
et al., 2005) with no further alteration. It should be noted that
these CMC values were reported at no added salt. JBR 515 has
an average molecular weight of 577. Both rhamnolipids
present in JBR 515 are anionic and are produced by
Pseudomonas aeruginosa. Rhamnolipid biosurfactants have
two head groups and two identical hydrocarbon tails, as seen
in Fig. 1. The carboxylate group gives rhamnolipids their
anionic character while the rhamnosyl groups (one and two
groups for mono- and di-rhamnolipid, respectively) contri-
bute to the bulky hydrophilic component of their structure.
The hydrophobic tails are C8 alkyl chains. JBR 515 has been
reported to have an HLB of 22–24 (Xie et al., 2005).
Rhamnolipids have been reported to be biologically and
ARTICLE IN PRESS
WA T E R R E S E A R C H 4 2 ( 2 0 0 8 ) 1 7 3 5 – 1 7 4 3 1737
environmentally compatible (Ozdemir et al., 2004). Through-
out this paper we will refer to JBR 515 as rhamnolipid or
rhamnolipid biosurfactant.
The synthetic surfactants used were anionic alkyl propoxy-
lated (PO) and alkyl propoxyl ethoxylated (EO) sulfate
surfactants. These surfactants have intermediate polarity
groups located between conventional hydrophilic (sulfate)
and lipophilic (alkyl) groups (Minana-Perez, 1995). The C12,13
alcohol PO sulfate surfactant with eight PO groups
(C12,13–8PO–SO4Na, average MW ¼ 713) and the C16 polypro-
pylene oxide ether sulfate (C16–10.7PO–SO4Na, average
MW ¼ 1072, and C16–18PO–2EO–SO4Na, average MW ¼
1590.7) were donated by Sasol Chemical Co. and Huntsman
Chemical Co., respectively. The HLB values of these synthetic
surfactants are in the range of 36–40. The CMCs of these
synthetic surfactants were as low as the order of 10�6–10�4 M
(Witthayapanyanon et al., 2006).
Four hydrocarbons were used in this research: toluene,
hexane, decane, and hexadecane. These hydrocarbons were
chosen because they represent a range of properties (e.g.,
solubility, volatility) reflective of environmental contami-
nants (Table 1). Toluene was obtained from J.T. Baker Analyzer
Co. with 99.9% purity. Hexane, decane, and hexadecane were
purchased from Sigma-Aldrich and each had 99.5% purity.
These four hydrocarbons are constituents of petroleum
hydrocarbons and represent a wide range of hydrophobicity
or equivalent alkane carbon number (EACN), which is
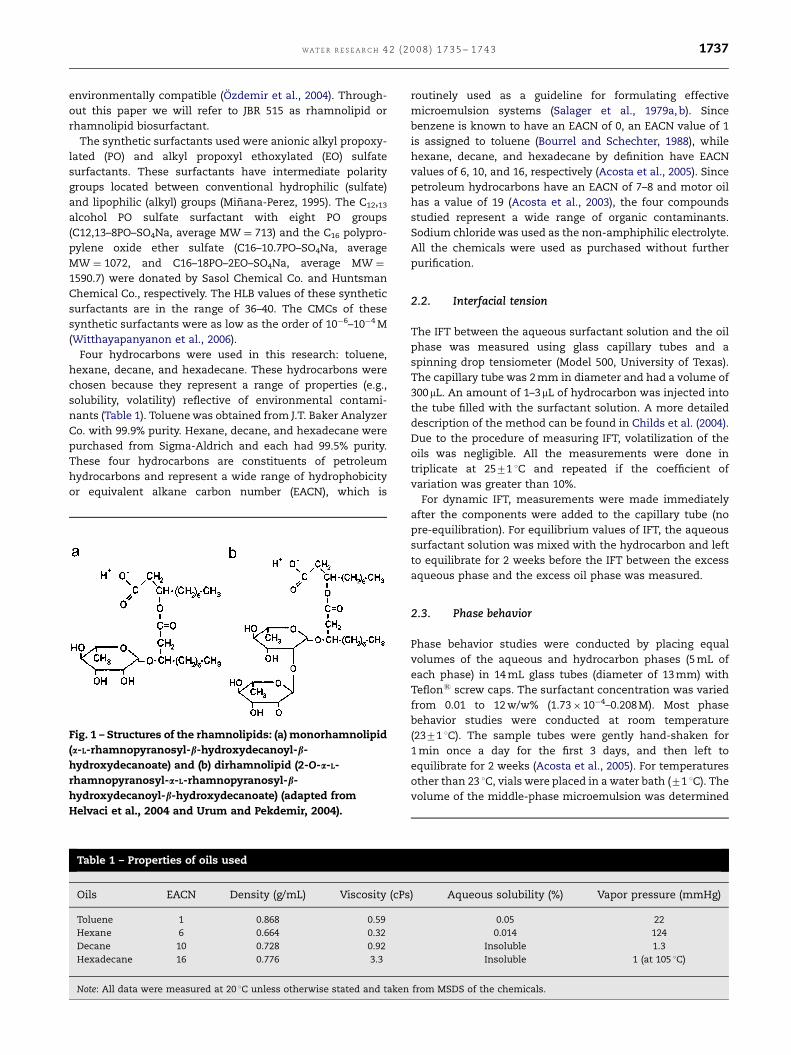
Fig. 1 – Structures of the rhamnolipids: (a) monorhamnolipid
(a-L-rhamnopyranosyl-b-hydroxydecanoyl-b-
hydroxydecanoate) and (b) dirhamnolipid (2-O-a-L-
rhamnopyranosyl-a-L-rhamnopyranosyl-b-
hydroxydecanoyl-b-hydroxydecanoate) (adapted from
Helvaci et al., 2004 and Urum and Pekdemir, 2004).
Table 1 – Properties of oils used
Oils EACN Density (g/mL) Viscosity (cPs
Toluene 1 0.868 0.59
Hexane 6 0.664 0.32
Decane 10 0.728 0.92
Hexadecane 16 0.776 3.3
Note: All data were measured at 20 1C unless otherwise stated and taken
routinely used as a guideline for formulating effective
microemulsion systems (Salager et al., 1979a, b). Since
benzene is known to have an EACN of 0, an EACN value of 1
is assigned to toluene (Bourrel and Schechter, 1988), while
hexane, decane, and hexadecane by definition have EACN
values of 6, 10, and 16, respectively (Acosta et al., 2005). Since
petroleum hydrocarbons have an EACN of 7–8 and motor oil
has a value of 19 (Acosta et al., 2003), the four compounds
studied represent a wide range of organic contaminants.
Sodium chloride was used as the non-amphiphilic electrolyte.
All the chemicals were used as purchased without further
purification.
2.2. Interfacial tension
The IFT between the aqueous surfactant solution and the oil
phase was measured using glass capillary tubes and a
spinning drop tensiometer (Model 500, University of Texas).
The capillary tube was 2 mm in diameter and had a volume of
300mL. An amount of 1–3mL of hydrocarbon was injected into
the tube filled with the surfactant solution. A more detailed
description of the method can be found in Childs et al. (2004).
Due to the procedure of measuring IFT, volatilization of the
oils was negligible. All the measurements were done in
triplicate at 2571 1C and repeated if the coefficient of
variation was greater than 10%.
For dynamic IFT, measurements were made immediately
after the components were added to the capillary tube (no
pre-equilibration). For equilibrium values of IFT, the aqueous
surfactant solution was mixed with the hydrocarbon and left
to equilibrate for 2 weeks before the IFT between the excess
aqueous phase and the excess oil phase was measured.
2.3. Phase behavior
Phase behavior studies were conducted by placing equal
volumes of the aqueous and hydrocarbon phases (5 mL of
each phase) in 14 mL glass tubes (diameter of 13 mm) with
Teflons screw caps. The surfactant concentration was varied
from 0.01 to 12 w/w% (1.73�10�4–0.208 M). Most phase
behavior studies were conducted at room temperature
(2371 1C). The sample tubes were gently hand-shaken for
1 min once a day for the first 3 days, and then left to
equilibrate for 2 weeks (Acosta et al., 2005). For temperatures
other than 23 1C, vials were placed in a water bath (71 1C). The
volume of the middle-phase microemulsion was determined
) Aqueous solubility (%) Vapor pressure (mmHg)
0.05 22
0.014 124
Insoluble 1.3
Insoluble 1 (at 105 1C)
from MSDS of the chemicals.
ARTICLE IN PRESS
0
5
10
15
20
25
30
0 10 15 20
S* , w/w
%
0.01
0.10
1.00
IFT
* , mN
/m
EACN
5
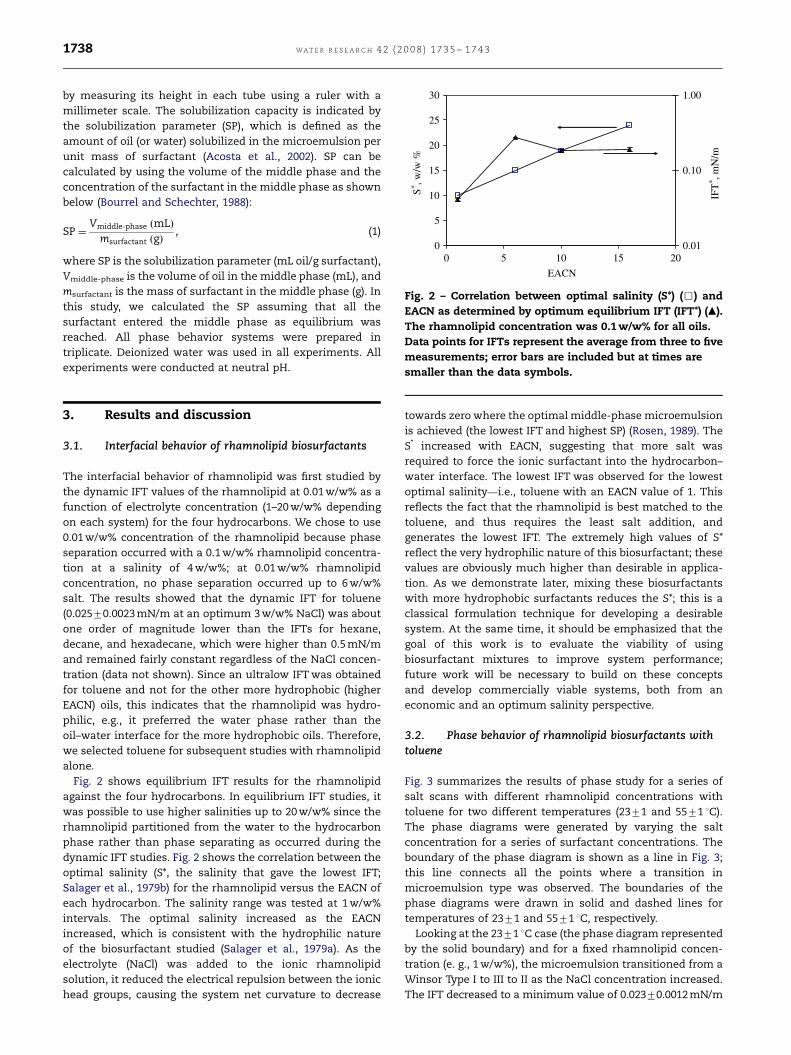
Fig. 2 – Correlation between optimal salinity (S*) (&) and
EACN as determined by optimum equilibrium IFT (IFT*) (m).
The rhamnolipid concentration was 0.1 w/w% for all oils.
Data points for IFTs represent the average from three to five
measurements; error bars are included but at times are
smaller than the data symbols.
WAT E R R E S E A R C H 4 2 ( 2 0 0 8 ) 1 7 3 5 – 1 7 4 31738
by measuring its height in each tube using a ruler with a
millimeter scale. The solubilization capacity is indicated by
the solubilization parameter (SP), which is defined as the
amount of oil (or water) solubilized in the microemulsion per
unit mass of surfactant (Acosta et al., 2002). SP can be
calculated by using the volume of the middle phase and the
concentration of the surfactant in the middle phase as shown
below (Bourrel and Schechter, 1988):
SP ¼Vmiddle�phase ðmLÞ
msurfactant ðgÞ, (1)
where SP is the solubilization parameter (mL oil/g surfactant),
Vmiddle-phase is the volume of oil in the middle phase (mL), and
msurfactant is the mass of surfactant in the middle phase (g). In
this study, we calculated the SP assuming that all the
surfactant entered the middle phase as equilibrium was
reached. All phase behavior systems were prepared in
triplicate. Deionized water was used in all experiments. All
experiments were conducted at neutral pH.
3. Results and discussion
3.1. Interfacial behavior of rhamnolipid biosurfactants
The interfacial behavior of rhamnolipid was first studied by
the dynamic IFT values of the rhamnolipid at 0.01 w/w% as a
function of electrolyte concentration (1–20 w/w% depending
on each system) for the four hydrocarbons. We chose to use
0.01 w/w% concentration of the rhamnolipid because phase
separation occurred with a 0.1 w/w% rhamnolipid concentra-
tion at a salinity of 4 w/w%; at 0.01 w/w% rhamnolipid
concentration, no phase separation occurred up to 6 w/w%
salt. The results showed that the dynamic IFT for toluene
(0.02570.0023 mN/m at an optimum 3 w/w% NaCl) was about
one order of magnitude lower than the IFTs for hexane,
decane, and hexadecane, which were higher than 0.5 mN/m
and remained fairly constant regardless of the NaCl concen-
tration (data not shown). Since an ultralow IFT was obtained
for toluene and not for the other more hydrophobic (higher
EACN) oils, this indicates that the rhamnolipid was hydro-
philic, e.g., it preferred the water phase rather than the
oil–water interface for the more hydrophobic oils. Therefore,
we selected toluene for subsequent studies with rhamnolipid
alone.
Fig. 2 shows equilibrium IFT results for the rhamnolipid
against the four hydrocarbons. In equilibrium IFT studies, it
was possible to use higher salinities up to 20 w/w% since the
rhamnolipid partitioned from the water to the hydrocarbon
phase rather than phase separating as occurred during the
dynamic IFT studies. Fig. 2 shows the correlation between the
optimal salinity (S*, the salinity that gave the lowest IFT;
Salager et al., 1979b) for the rhamnolipid versus the EACN of
each hydrocarbon. The salinity range was tested at 1 w/w%
intervals. The optimal salinity increased as the EACN
increased, which is consistent with the hydrophilic nature
of the biosurfactant studied (Salager et al., 1979a). As the
electrolyte (NaCl) was added to the ionic rhamnolipid
solution, it reduced the electrical repulsion between the ionic
head groups, causing the system net curvature to decrease
towards zero where the optimal middle-phase microemulsion
is achieved (the lowest IFT and highest SP) (Rosen, 1989). The
S* increased with EACN, suggesting that more salt was
required to force the ionic surfactant into the hydrocarbon–
water interface. The lowest IFT was observed for the lowest
optimal salinity—i.e., toluene with an EACN value of 1. This
reflects the fact that the rhamnolipid is best matched to the
toluene, and thus requires the least salt addition, and
generates the lowest IFT. The extremely high values of S*
reflect the very hydrophilic nature of this biosurfactant; these
values are obviously much higher than desirable in applica-
tion. As we demonstrate later, mixing these biosurfactants
with more hydrophobic surfactants reduces the S*; this is a
classical formulation technique for developing a desirable
system. At the same time, it should be emphasized that the
goal of this work is to evaluate the viability of using
biosurfactant mixtures to improve system performance;
future work will be necessary to build on these concepts
and develop commercially viable systems, both from an
economic and an optimum salinity perspective.
3.2. Phase behavior of rhamnolipid biosurfactants withtoluene
Fig. 3 summarizes the results of phase study for a series of
salt scans with different rhamnolipid concentrations with
toluene for two different temperatures (2371 and 5571 1C).
The phase diagrams were generated by varying the salt
concentration for a series of surfactant concentrations. The
boundary of the phase diagram is shown as a line in Fig. 3;
this line connects all the points where a transition in
microemulsion type was observed. The boundaries of the
phase diagrams were drawn in solid and dashed lines for
temperatures of 2371 and 5571 1C, respectively.
Looking at the 2371 1C case (the phase diagram represented
by the solid boundary) and for a fixed rhamnolipid concen-
tration (e. g., 1 w/w%), the microemulsion transitioned from a
Winsor Type I to III to II as the NaCl concentration increased.
The IFT decreased to a minimum value of 0.02370.0012 mN/m
ARTICLE IN PRESS
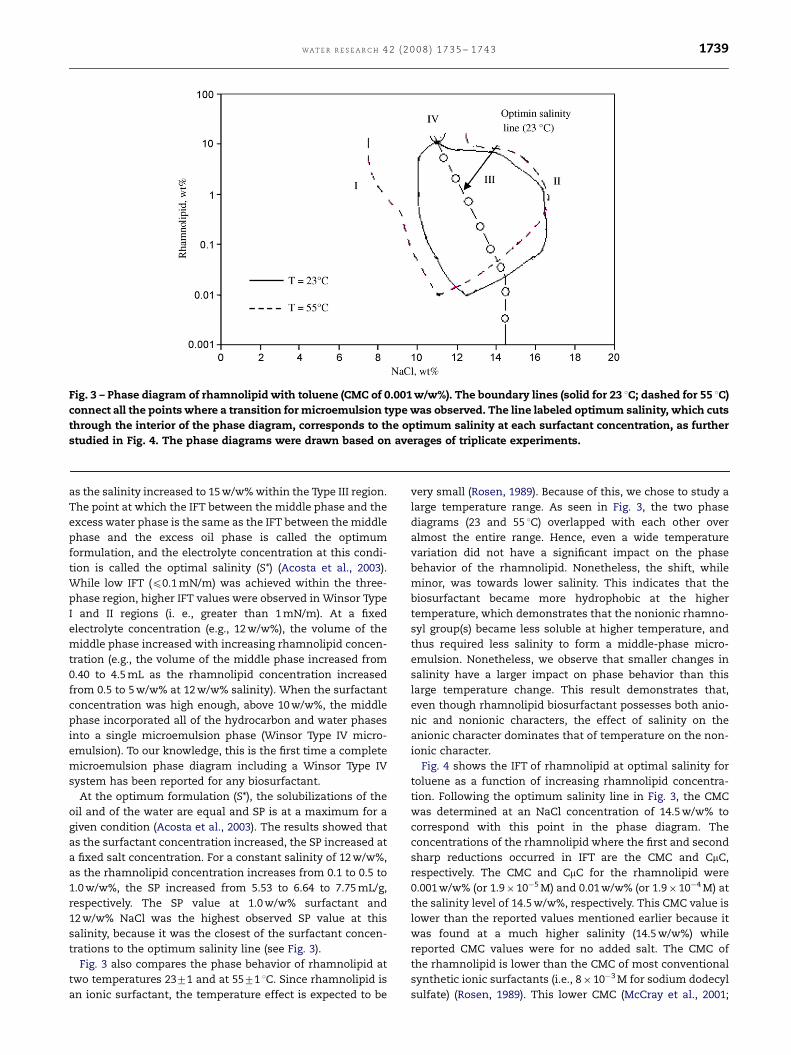
Fig. 3 – Phase diagram of rhamnolipid with toluene (CMC of 0.001 w/w%). The boundary lines (solid for 23 1C; dashed for 55 1C)
connect all the points where a transition for microemulsion type was observed. The line labeled optimum salinity, which cuts
through the interior of the phase diagram, corresponds to the optimum salinity at each surfactant concentration, as further
studied in Fig. 4. The phase diagrams were drawn based on averages of triplicate experiments.
WA T E R R E S E A R C H 4 2 ( 2 0 0 8 ) 1 7 3 5 – 1 7 4 3 1739
as the salinity increased to 15 w/w% within the Type III region.
The point at which the IFT between the middle phase and the
excess water phase is the same as the IFT between the middle
phase and the excess oil phase is called the optimum
formulation, and the electrolyte concentration at this condi-
tion is called the optimal salinity (S*) (Acosta et al., 2003).
While low IFT (p0.1 mN/m) was achieved within the three-
phase region, higher IFT values were observed in Winsor Type
I and II regions (i. e., greater than 1 mN/m). At a fixed
electrolyte concentration (e.g., 12 w/w%), the volume of the
middle phase increased with increasing rhamnolipid concen-
tration (e.g., the volume of the middle phase increased from
0.40 to 4.5 mL as the rhamnolipid concentration increased
from 0.5 to 5 w/w% at 12 w/w% salinity). When the surfactant
concentration was high enough, above 10 w/w%, the middle
phase incorporated all of the hydrocarbon and water phases
into a single microemulsion phase (Winsor Type IV micro-
emulsion). To our knowledge, this is the first time a complete
microemulsion phase diagram including a Winsor Type IV
system has been reported for any biosurfactant.
At the optimum formulation (S*), the solubilizations of the
oil and of the water are equal and SP is at a maximum for a
given condition (Acosta et al., 2003). The results showed that
as the surfactant concentration increased, the SP increased at
a fixed salt concentration. For a constant salinity of 12 w/w%,
as the rhamnolipid concentration increases from 0.1 to 0.5 to
1.0 w/w%, the SP increased from 5.53 to 6.64 to 7.75 mL/g,
respectively. The SP value at 1.0 w/w% surfactant and
12 w/w% NaCl was the highest observed SP value at this
salinity, because it was the closest of the surfactant concen-
trations to the optimum salinity line (see Fig. 3).
Fig. 3 also compares the phase behavior of rhamnolipid at
two temperatures 2371 and at 5571 1C. Since rhamnolipid is
an ionic surfactant, the temperature effect is expected to be
very small (Rosen, 1989). Because of this, we chose to study a
large temperature range. As seen in Fig. 3, the two phase
diagrams (23 and 55 1C) overlapped with each other over
almost the entire range. Hence, even a wide temperature
variation did not have a significant impact on the phase
behavior of the rhamnolipid. Nonetheless, the shift, while
minor, was towards lower salinity. This indicates that the
biosurfactant became more hydrophobic at the higher
temperature, which demonstrates that the nonionic rhamno-
syl group(s) became less soluble at higher temperature, and
thus required less salinity to form a middle-phase micro-
emulsion. Nonetheless, we observe that smaller changes in
salinity have a larger impact on phase behavior than this
large temperature change. This result demonstrates that,
even though rhamnolipid biosurfactant possesses both anio-
nic and nonionic characters, the effect of salinity on the
anionic character dominates that of temperature on the non-
ionic character.
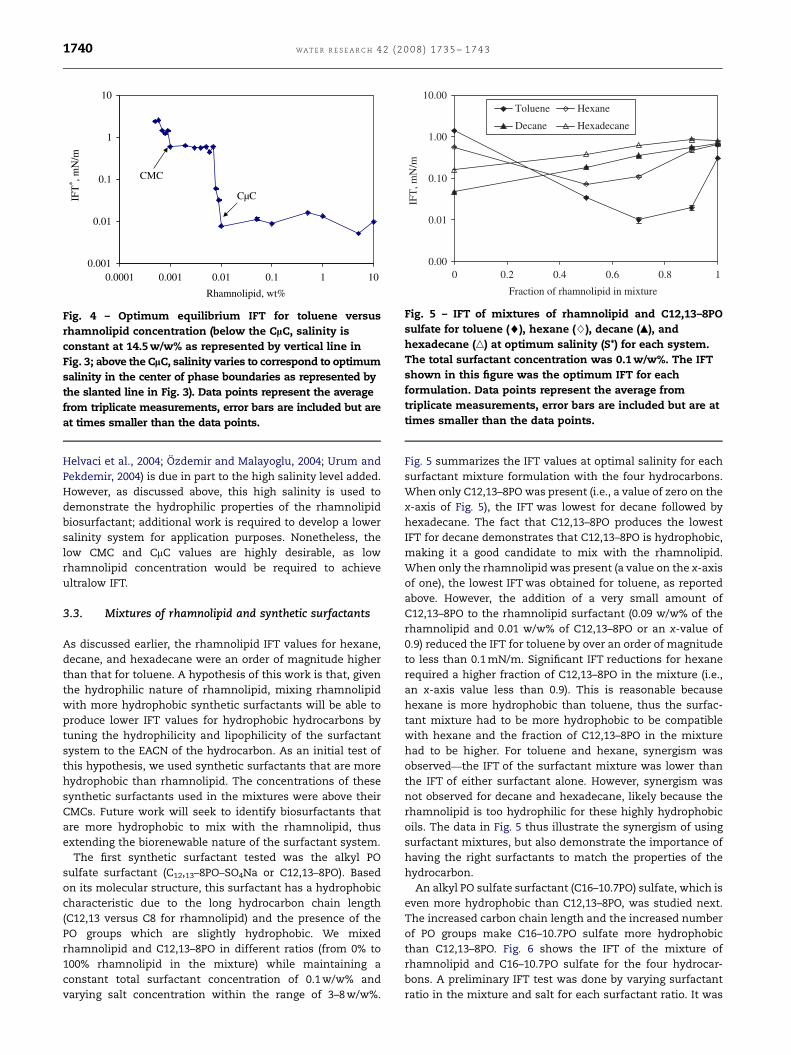
Fig. 4 shows the IFT of rhamnolipid at optimal salinity for
toluene as a function of increasing rhamnolipid concentra-
tion. Following the optimum salinity line in Fig. 3, the CMC
was determined at an NaCl concentration of 14.5 w/w% to
correspond with this point in the phase diagram. The
concentrations of the rhamnolipid where the first and second
sharp reductions occurred in IFT are the CMC and CmC,
respectively. The CMC and CmC for the rhamnolipid were
0.001 w/w% (or 1.9�10�5 M) and 0.01 w/w% (or 1.9�10�4 M) at
the salinity level of 14.5 w/w%, respectively. This CMC value is
lower than the reported values mentioned earlier because it
was found at a much higher salinity (14.5 w/w%) while
reported CMC values were for no added salt. The CMC of
the rhamnolipid is lower than the CMC of most conventional
synthetic ionic surfactants (i.e., 8�10�3 M for sodium dodecyl
sulfate) (Rosen, 1989). This lower CMC (McCray et al., 2001;
ARTICLE IN PRESS
0.000 0.2 0.6
IFT
, mN
/m
Toluene Hexane
Decane Hexadecane
10.00
1.00
0.10
0.01
Fraction of rhamnolipid in mixture
0.4 0.8 1
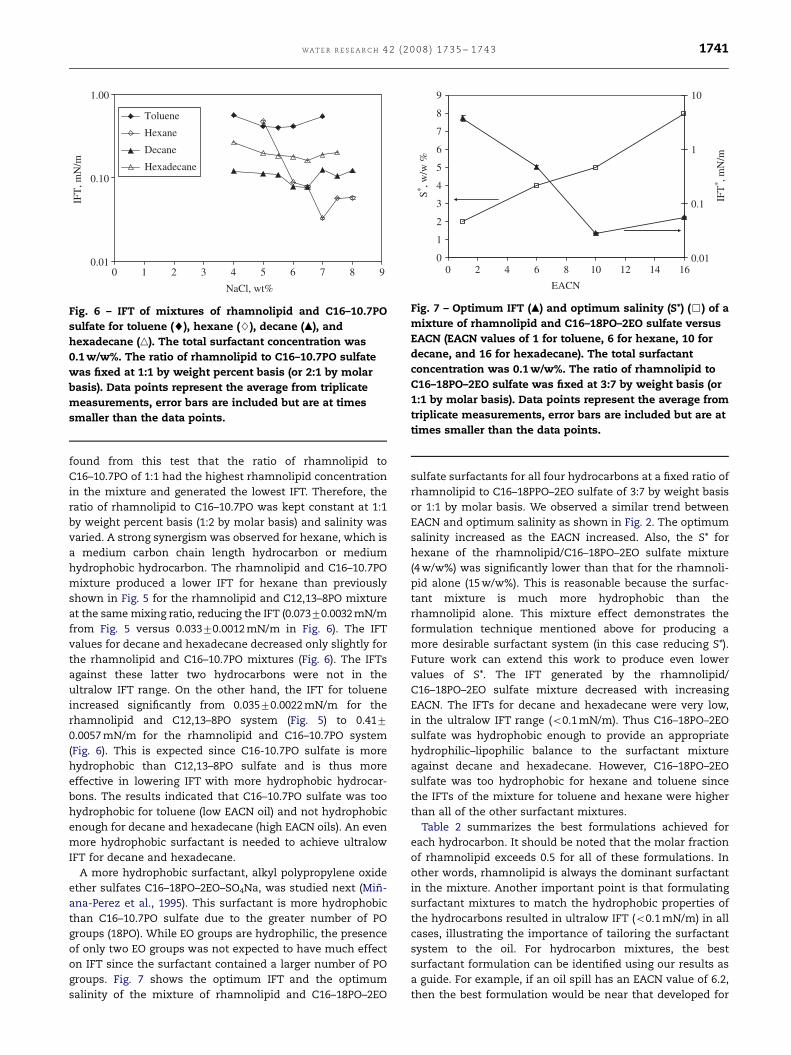
Fig. 5 – IFT of mixtures of rhamnolipid and C12,13–8PO
sulfate for toluene (~), hexane (}), decane (m), and
hexadecane (n) at optimum salinity (S*) for each system.
The total surfactant concentration was 0.1 w/w%. The IFT
shown in this figure was the optimum IFT for each
formulation. Data points represent the average from
triplicate measurements, error bars are included but are at
times smaller than the data points.
0.001
0.01
0.1
1
10
0.0001 0.001 0.01 0.1 1 10
IFT
* , mN
/m
CMC
CµC
Rhamnolipid, wt%
Fig. 4 – Optimum equilibrium IFT for toluene versus
rhamnolipid concentration (below the ClC, salinity is
constant at 14.5 w/w% as represented by vertical line in
Fig. 3; above the ClC, salinity varies to correspond to optimum
salinity in the center of phase boundaries as represented by
the slanted line in Fig. 3). Data points represent the average
from triplicate measurements, error bars are included but are
at times smaller than the data points.
WAT E R R E S E A R C H 4 2 ( 2 0 0 8 ) 1 7 3 5 – 1 7 4 31740
Helvaci et al., 2004; Ozdemir and Malayoglu, 2004; Urum and
Pekdemir, 2004) is due in part to the high salinity level added.
However, as discussed above, this high salinity is used to
demonstrate the hydrophilic properties of the rhamnolipid
biosurfactant; additional work is required to develop a lower
salinity system for application purposes. Nonetheless, the
low CMC and CmC values are highly desirable, as low
rhamnolipid concentration would be required to achieve
ultralow IFT.
3.3. Mixtures of rhamnolipid and synthetic surfactants
As discussed earlier, the rhamnolipid IFT values for hexane,
decane, and hexadecane were an order of magnitude higher
than that for toluene. A hypothesis of this work is that, given
the hydrophilic nature of rhamnolipid, mixing rhamnolipid
with more hydrophobic synthetic surfactants will be able to
produce lower IFT values for hydrophobic hydrocarbons by
tuning the hydrophilicity and lipophilicity of the surfactant
system to the EACN of the hydrocarbon. As an initial test of
this hypothesis, we used synthetic surfactants that are more
hydrophobic than rhamnolipid. The concentrations of these
synthetic surfactants used in the mixtures were above their
CMCs. Future work will seek to identify biosurfactants that
are more hydrophobic to mix with the rhamnolipid, thus
extending the biorenewable nature of the surfactant system.
The first synthetic surfactant tested was the alkyl PO
sulfate surfactant (C12,13–8PO–SO4Na or C12,13–8PO). Based
on its molecular structure, this surfactant has a hydrophobic
characteristic due to the long hydrocarbon chain length
(C12,13 versus C8 for rhamnolipid) and the presence of the
PO groups which are slightly hydrophobic. We mixed
rhamnolipid and C12,13–8PO in different ratios (from 0% to
100% rhamnolipid in the mixture) while maintaining a
constant total surfactant concentration of 0.1 w/w% and
varying salt concentration within the range of 3–8 w/w%.
Fig. 5 summarizes the IFT values at optimal salinity for each
surfactant mixture formulation with the four hydrocarbons.
When only C12,13–8PO was present (i.e., a value of zero on the
x-axis of Fig. 5), the IFT was lowest for decane followed by
hexadecane. The fact that C12,13–8PO produces the lowest
IFT for decane demonstrates that C12,13–8PO is hydrophobic,
making it a good candidate to mix with the rhamnolipid.
When only the rhamnolipid was present (a value on the x-axis
of one), the lowest IFT was obtained for toluene, as reported
above. However, the addition of a very small amount of
C12,13–8PO to the rhamnolipid surfactant (0.09 w/w% of the
rhamnolipid and 0.01 w/w% of C12,13–8PO or an x-value of
0.9) reduced the IFT for toluene by over an order of magnitude
to less than 0.1 mN/m. Significant IFT reductions for hexane
required a higher fraction of C12,13–8PO in the mixture (i.e.,
an x-axis value less than 0.9). This is reasonable because
hexane is more hydrophobic than toluene, thus the surfac-
tant mixture had to be more hydrophobic to be compatible
with hexane and the fraction of C12,13–8PO in the mixture
had to be higher. For toluene and hexane, synergism was
observed—the IFT of the surfactant mixture was lower than
the IFT of either surfactant alone. However, synergism was
not observed for decane and hexadecane, likely because the
rhamnolipid is too hydrophilic for these highly hydrophobic
oils. The data in Fig. 5 thus illustrate the synergism of using
surfactant mixtures, but also demonstrate the importance of
having the right surfactants to match the properties of the
hydrocarbon.
An alkyl PO sulfate surfactant (C16–10.7PO) sulfate, which is
even more hydrophobic than C12,13–8PO, was studied next.
The increased carbon chain length and the increased number
of PO groups make C16–10.7PO sulfate more hydrophobic
than C12,13–8PO. Fig. 6 shows the IFT of the mixture of
rhamnolipid and C16–10.7PO sulfate for the four hydrocar-
bons. A preliminary IFT test was done by varying surfactant
ratio in the mixture and salt for each surfactant ratio. It was
ARTICLE IN PRESS
0
1
2
3
4
5
6
7
8
9
0 2 4 6 8 16
S* , w/w
%
0.1
1
IFT
* , mN
/m
EACN
1412100.01
10
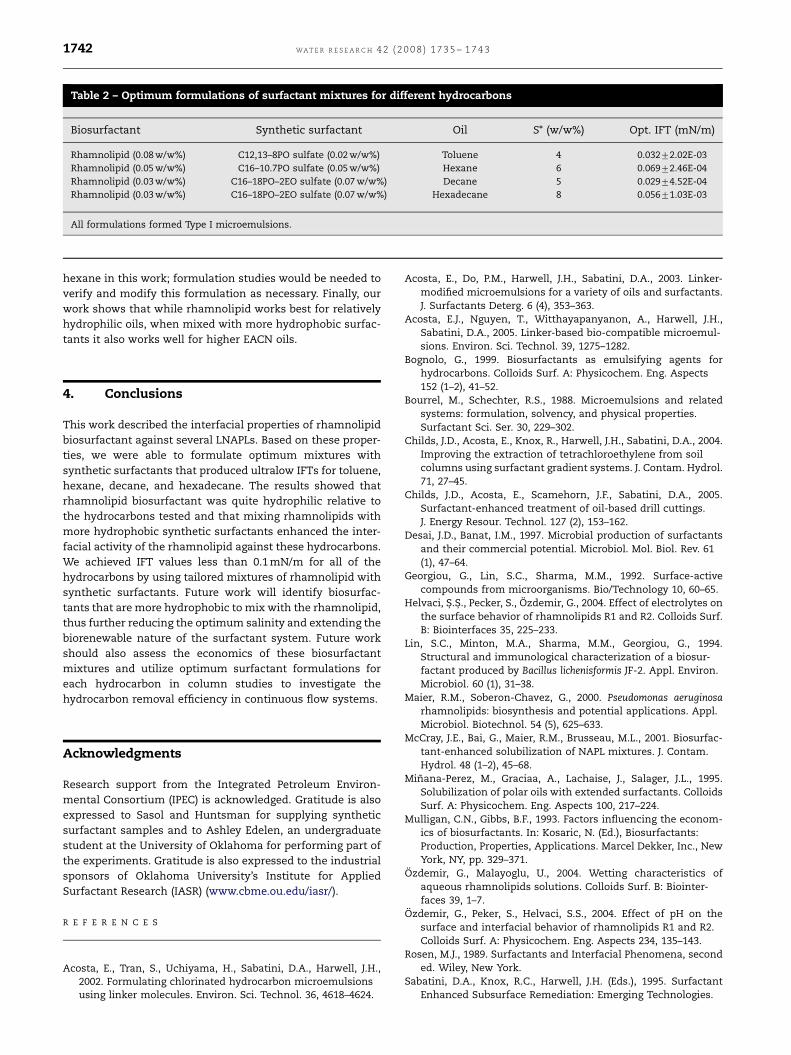
Fig. 7 – Optimum IFT (m) and optimum salinity (S*) (&) of a
mixture of rhamnolipid and C16–18PO–2EO sulfate versus
EACN (EACN values of 1 for toluene, 6 for hexane, 10 for
decane, and 16 for hexadecane). The total surfactant
concentration was 0.1 w/w%. The ratio of rhamnolipid to
C16–18PO–2EO sulfate was fixed at 3:7 by weight basis (or
1:1 by molar basis). Data points represent the average from
triplicate measurements, error bars are included but are at
times smaller than the data points.
0 1 2 3 4 5 6 7 8 9
IFT
, mN
/m
Toluene
Hexane
Decane
Hexadecane
1.00
0.10
0.01
NaCl, wt%
Fig. 6 – IFT of mixtures of rhamnolipid and C16–10.7PO
sulfate for toluene (~), hexane (}), decane (m), and
hexadecane (n). The total surfactant concentration was
0.1 w/w%. The ratio of rhamnolipid to C16–10.7PO sulfate
was fixed at 1:1 by weight percent basis (or 2:1 by molar
basis). Data points represent the average from triplicate
measurements, error bars are included but are at times
smaller than the data points.
WA T E R R E S E A R C H 4 2 ( 2 0 0 8 ) 1 7 3 5 – 1 7 4 3 1741
found from this test that the ratio of rhamnolipid to
C16–10.7PO of 1:1 had the highest rhamnolipid concentration
in the mixture and generated the lowest IFT. Therefore, the
ratio of rhamnolipid to C16–10.7PO was kept constant at 1:1
by weight percent basis (1:2 by molar basis) and salinity was
varied. A strong synergism was observed for hexane, which is
a medium carbon chain length hydrocarbon or medium
hydrophobic hydrocarbon. The rhamnolipid and C16–10.7PO
mixture produced a lower IFT for hexane than previously
shown in Fig. 5 for the rhamnolipid and C12,13–8PO mixture
at the same mixing ratio, reducing the IFT (0.07370.0032 mN/m
from Fig. 5 versus 0.03370.0012 mN/m in Fig. 6). The IFT
values for decane and hexadecane decreased only slightly for
the rhamnolipid and C16–10.7PO mixtures (Fig. 6). The IFTs
against these latter two hydrocarbons were not in the
ultralow IFT range. On the other hand, the IFT for toluene
increased significantly from 0.03570.0022 mN/m for the
rhamnolipid and C12,13–8PO system (Fig. 5) to 0.417
0.0057 mN/m for the rhamnolipid and C16–10.7PO system
(Fig. 6). This is expected since C16-10.7PO sulfate is more
hydrophobic than C12,13–8PO sulfate and is thus more
effective in lowering IFT with more hydrophobic hydrocar-
bons. The results indicated that C16–10.7PO sulfate was too
hydrophobic for toluene (low EACN oil) and not hydrophobic
enough for decane and hexadecane (high EACN oils). An even
more hydrophobic surfactant is needed to achieve ultralow
IFT for decane and hexadecane.
A more hydrophobic surfactant, alkyl polypropylene oxide
ether sulfates C16–18PO–2EO–SO4Na, was studied next (Min-
ana-Perez et al., 1995). This surfactant is more hydrophobic
than C16–10.7PO sulfate due to the greater number of PO
groups (18PO). While EO groups are hydrophilic, the presence
of only two EO groups was not expected to have much effect
on IFT since the surfactant contained a larger number of PO
groups. Fig. 7 shows the optimum IFT and the optimum
salinity of the mixture of rhamnolipid and C16–18PO–2EO
sulfate surfactants for all four hydrocarbons at a fixed ratio of
rhamnolipid to C16–18PPO–2EO sulfate of 3:7 by weight basis
or 1:1 by molar basis. We observed a similar trend between
EACN and optimum salinity as shown in Fig. 2. The optimum
salinity increased as the EACN increased. Also, the S* for
hexane of the rhamnolipid/C16–18PO–2EO sulfate mixture
(4 w/w%) was significantly lower than that for the rhamnoli-
pid alone (15 w/w%). This is reasonable because the surfac-
tant mixture is much more hydrophobic than the
rhamnolipid alone. This mixture effect demonstrates the
formulation technique mentioned above for producing a
more desirable surfactant system (in this case reducing S*).
Future work can extend this work to produce even lower
values of S*. The IFT generated by the rhamnolipid/
C16–18PO–2EO sulfate mixture decreased with increasing
EACN. The IFTs for decane and hexadecane were very low,
in the ultralow IFT range (o0.1 mN/m). Thus C16–18PO–2EO
sulfate was hydrophobic enough to provide an appropriate
hydrophilic–lipophilic balance to the surfactant mixture
against decane and hexadecane. However, C16–18PO–2EO
sulfate was too hydrophobic for hexane and toluene since
the IFTs of the mixture for toluene and hexane were higher
than all of the other surfactant mixtures.
Table 2 summarizes the best formulations achieved for
each hydrocarbon. It should be noted that the molar fraction
of rhamnolipid exceeds 0.5 for all of these formulations. In
other words, rhamnolipid is always the dominant surfactant
in the mixture. Another important point is that formulating
surfactant mixtures to match the hydrophobic properties of
the hydrocarbons resulted in ultralow IFT (o0.1 mN/m) in all
cases, illustrating the importance of tailoring the surfactant
system to the oil. For hydrocarbon mixtures, the best
surfactant formulation can be identified using our results as
a guide. For example, if an oil spill has an EACN value of 6.2,
then the best formulation would be near that developed for
ARTICLE IN PRESS
Table 2 – Optimum formulations of surfactant mixtures for different hydrocarbons
Biosurfactant Synthetic surfactant Oil S* (w/w%) Opt. IFT (mN/m)
Rhamnolipid (0.08 w/w%) C12,13–8PO sulfate (0.02 w/w%) Toluene 4 0.03272.02E-03
Rhamnolipid (0.05 w/w%) C16–10.7PO sulfate (0.05 w/w%) Hexane 6 0.06972.46E-04
Rhamnolipid (0.03 w/w%) C16–18PO–2EO sulfate (0.07 w/w%) Decane 5 0.02974.52E-04
Rhamnolipid (0.03 w/w%) C16–18PO–2EO sulfate (0.07 w/w%) Hexadecane 8 0.05671.03E-03
All formulations formed Type I microemulsions.
WAT E R R E S E A R C H 4 2 ( 2 0 0 8 ) 1 7 3 5 – 1 7 4 31742
hexane in this work; formulation studies would be needed to
verify and modify this formulation as necessary. Finally, our
work shows that while rhamnolipid works best for relatively
hydrophilic oils, when mixed with more hydrophobic surfac-
tants it also works well for higher EACN oils.
4. Conclusions
This work described the interfacial properties of rhamnolipid
biosurfactant against several LNAPLs. Based on these proper-
ties, we were able to formulate optimum mixtures with
synthetic surfactants that produced ultralow IFTs for toluene,
hexane, decane, and hexadecane. The results showed that
rhamnolipid biosurfactant was quite hydrophilic relative to
the hydrocarbons tested and that mixing rhamnolipids with
more hydrophobic synthetic surfactants enhanced the inter-
facial activity of the rhamnolipid against these hydrocarbons.
We achieved IFT values less than 0.1 mN/m for all of the
hydrocarbons by using tailored mixtures of rhamnolipid with
synthetic surfactants. Future work will identify biosurfac-
tants that are more hydrophobic to mix with the rhamnolipid,
thus further reducing the optimum salinity and extending the
biorenewable nature of the surfactant system. Future work
should also assess the economics of these biosurfactant
mixtures and utilize optimum surfactant formulations for
each hydrocarbon in column studies to investigate the
hydrocarbon removal efficiency in continuous flow systems.
Acknowledgments
Research support from the Integrated Petroleum Environ-
mental Consortium (IPEC) is acknowledged. Gratitude is also
expressed to Sasol and Huntsman for supplying synthetic
surfactant samples and to Ashley Edelen, an undergraduate
student at the University of Oklahoma for performing part of
the experiments. Gratitude is also expressed to the industrial
sponsors of Oklahoma University’s Institute for Applied
Surfactant Research (IASR) (www.cbme.ou.edu/iasr/).
R E F E R E N C E S
Acosta, E., Tran, S., Uchiyama, H., Sabatini, D.A., Harwell, J.H.,2002. Formulating chlorinated hydrocarbon microemulsionsusing linker molecules. Environ. Sci. Technol. 36, 4618–4624.
Acosta, E., Do, P.M., Harwell, J.H., Sabatini, D.A., 2003. Linker-modified microemulsions for a variety of oils and surfactants.J. Surfactants Deterg. 6 (4), 353–363.
Acosta, E.J., Nguyen, T., Witthayapanyanon, A., Harwell, J.H.,Sabatini, D.A., 2005. Linker-based bio-compatible microemul-sions. Environ. Sci. Technol. 39, 1275–1282.
Bognolo, G., 1999. Biosurfactants as emulsifying agents forhydrocarbons. Colloids Surf. A: Physicochem. Eng. Aspects152 (1–2), 41–52.
Bourrel, M., Schechter, R.S., 1988. Microemulsions and relatedsystems: formulation, solvency, and physical properties.Surfactant Sci. Ser. 30, 229–302.
Childs, J.D., Acosta, E., Knox, R., Harwell, J.H., Sabatini, D.A., 2004.Improving the extraction of tetrachloroethylene from soilcolumns using surfactant gradient systems. J. Contam. Hydrol.71, 27–45.
Childs, J.D., Acosta, E., Scamehorn, J.F., Sabatini, D.A., 2005.Surfactant-enhanced treatment of oil-based drill cuttings.J. Energy Resour. Technol. 127 (2), 153–162.
Desai, J.D., Banat, I.M., 1997. Microbial production of surfactantsand their commercial potential. Microbiol. Mol. Biol. Rev. 61(1), 47–64.
Georgiou, G., Lin, S.C., Sharma, M.M., 1992. Surface-activecompounds from microorganisms. Bio/Technology 10, 60–65.
Helvaci, S- .S- ., Pecker, S., Ozdemir, G., 2004. Effect of electrolytes onthe surface behavior of rhamnolipids R1 and R2. Colloids Surf.B: Biointerfaces 35, 225–233.
Lin, S.C., Minton, M.A., Sharma, M.M., Georgiou, G., 1994.Structural and immunological characterization of a biosur-factant produced by Bacillus lichenisformis JF-2. Appl. Environ.Microbiol. 60 (1), 31–38.
Maier, R.M., Soberon-Chavez, G., 2000. Pseudomonas aeruginosarhamnolipids: biosynthesis and potential applications. Appl.Microbiol. Biotechnol. 54 (5), 625–633.
McCray, J.E., Bai, G., Maier, R.M., Brusseau, M.L., 2001. Biosurfac-tant-enhanced solubilization of NAPL mixtures. J. Contam.Hydrol. 48 (1–2), 45–68.
Minana-Perez, M., Graciaa, A., Lachaise, J., Salager, J.L., 1995.Solubilization of polar oils with extended surfactants. ColloidsSurf. A: Physicochem. Eng. Aspects 100, 217–224.
Mulligan, C.N., Gibbs, B.F., 1993. Factors influencing the econom-ics of biosurfactants. In: Kosaric, N. (Ed.), Biosurfactants:Production, Properties, Applications. Marcel Dekker, Inc., NewYork, NY, pp. 329–371.
Ozdemir, G., Malayoglu, U., 2004. Wetting characteristics ofaqueous rhamnolipids solutions. Colloids Surf. B: Biointer-faces 39, 1–7.
Ozdemir, G., Peker, S., Helvaci, S.S., 2004. Effect of pH on thesurface and interfacial behavior of rhamnolipids R1 and R2.Colloids Surf. A: Physicochem. Eng. Aspects 234, 135–143.
Rosen, M.J., 1989. Surfactants and Interfacial Phenomena, seconded. Wiley, New York.
Sabatini, D.A., Knox, R.C., Harwell, J.H. (Eds.), 1995. SurfactantEnhanced Subsurface Remediation: Emerging Technologies.
ARTICLE IN PRESS
WA T E R R E S E A R C H 4 2 ( 2 0 0 8 ) 1 7 3 5 – 1 7 4 3 1743
ACS Symposium Series 594. American Chemical Society,Washington, DC, 312pp.
Sabatini, D.A., Knox, R.C., Harwell, J.H., Wu, B., 2000. Integrateddesign of surfactant enhanced DNAPL remediation: effectivesupersolubilization and gradient systems. J. Contam. Hydrol.45 (1), 99–121.
Salager, J.L., Morgan, J.C., Schechter, R.S., Wade, W.H., Vasquez, E.,1979a. Optimum formulation of surfactant/water/oil systemsfor minimum interfacial tension or phase behavior. Soc.Petrol. Eng. J. 19, 107–115.
Salager, J.L., Bourrel, M., Schechter, R.S., Wade, W.H., 1979b.Mixing rules for optimum phase—behavior formulations ofsurfactant/oil/water systems. Soc. Petrol. Eng. J. 19, 271–278.
Urum, K., Pekdemir, T., 2004. Evaluation of biosurfactants forcrude oil contaminated soil washing. Chemosphere 57,1139–1150.
Witthayapanyanon, A., Acosta, E.J., Harwell, J.H., Sabatini, D.A.,2006. Formulation of ultralow interfacial tension systemsusing extended surfactants. J. Surfactants Deterg. 9,331–339.
Wu, B., Cheng, H., Childs, J., Sabatini, D.A., 2001. Surfactant-enhanced removal of hydrophobic oils from source zones.In: Smith, J.A., Burns, S.E. (Eds.), Physicochemical Ground-water Remediation. Kluwer Publishing, New York, NY,pp. 245–269.
Xie, Y., Li, Y., Ye, R., 2005. Effect of alcohols on the phase behaviorof microemulsions formed by a biosurfactant—rhamnolipid.J. Dispersion Sci. Technol. 26, 455–461.
Youssef, N.H., Nguyen, T.T., Sabatini, D.A., McInerney, M.J., 2007.Basis for formulating biosurfactant mixtures to achieve ultralow interfacial tension values against hydrocarbons. J. Ind.Microbiol. Biotechnol. 34 (7), 497–507.