rezime prethodno saop[tenje - mašinski fakultet u...
TRANSCRIPT

Ma{instvo, 4(6), 207 – 214, (2002) T.Vasiu: TRIBOLO[KI ASPEKTI VALJA^KE ARMATURE...
TRIBOLO[KI ASPEKTI VALJA^KE ARMATURE @I^NIH VALJAONICA
Dr. es SC. Teodor Vasiu, lecturer, Faculty of Engineering of Hunedoara, 5 Revolutiei Str., 2750 Hunedoara, Romania
REZIME PRETHODNO SAOP[TENJE
Ovaj ~lanak predstavlja ure|aj kojim se mjere radijalne sile i sile trenja u uvodnim cijevima `i~nih valjaonica. Princip funkcioniranja ure|aja se zasniva na pretvaranju mehani~kih sila u elektri~ne impulse, te njihovo hvatanje pomo}u magnetnog modulatora. Eksperimentalni rezultati pokazuju da na sile trenja koje uzrokuju habanje posmatrane cijevi, malo utje~e kvalitet valjanog materijala. Odlu~uju}i elementi su krutost materijala (koja je rezultat njihovog popre~nog presjeka), savijanje `ice i udar izme|u `ica i vo|ica.
Klju~ne rije~i: `i~na valjaonica, valja~ka armatura, sile trenja
TRIBOLOGICAL ASPECTS OF THE WIRE ROLLING TRAIN GUARDS
Dr. es SC. Teodor Vasiu, lecturer, Faculty of Engineering of Hunedoara, 5 Revolutiei Str., 2750 Hunedoara, Romania
SUMMARY
The article could be included in the category of "professional articles", as it represents a practical study on the wear of the wire rolling train guards at a certain company, without pretending that the experimental installation itself includes absolutely original construction principles. Yet, the way of putting into practice the known principles represents an original solution, which proved useful in practice.
PRELIMINARY NOTES
The conclusions resulting from the processing of the experimental data are also interesting. They refer mainly to the influence of the radial, respectively friction forces at the contact point between the wire and the guard upon the tribological process in the respective coupling. The article justifies the influence of the technological and material parameters upon the magnitude of the radial and friction forces, as well as the steps to be taken in order to improve the rolling process, in terms of reducing the consumption of guards.
Key words: Rolling trains, guards, friction forces
1. UVOD Va`nost industrije ~eli~ne `ice je o~igledna, s obzirom na to da njeni proizvodi imaju jedno od naj{irih polja upotrebe: od metalne robe u doma}instvima do kablova ili armiranih betonskih konstrukcija. Uloga valja~ke armature je dvostruka: prvo, ona mora voditi valjani proizvod u i iz valja~kih valjaka ili izme|u valja~kih pruga, i drugo, ne bi trebala imati negativan uticaj na dimenzije i strukturu povr{ine valjanog proizvoda. Dio valja~ke armature, koji treba da vodi valjane proizvode izme|u valja~kih stanova i izme|u posljednjeg stana i izlazne rolne, se zove uvodna cijev. Ovaj dio valja~ke armature predstavlja predmet na{eg izu~avanja.
1. INTRODUCTION The importance of steel wire industry is obvious, as its products have one of the largest fields of use: from household hardware to cables or reinforced concrete constructions. The role of rolling train guards is double: first they have to guide the rolled product into and out of the train rolls or between rolling trains and secondly, they should not have a negative influence upon the dimensions and structure of the surface of the rolled product. The guards meant to guide the rolled products between the train stands and between the last stand and the pay-out reel are called drawing nozzles. These types of guards represent the object of our study.
- 207 -
Ma{instvo, 4(6), 207 – 214, (2002) T.Vasiu: TRIBOLO[KI ASPEKTI VALJA^KE ARMATURE...
Uvodne cijevi se izra|uju od livenog sirovog gvo`|a (Fe20). One se ne hlade i zato su posebno zanimljive za izu~avanje pojave habanja usljed trenja s obzirom na to da relativna brzina izme|u cijevi i valjanog proizvoda i temperatura na dodirnoj povr{ini imaju visoke vrijednosti. Istovremeno ovu vrstu valja~ke armature je lako izu~avati u industrijskim uslovima.
The drawing nozzles are made of cast pig iron (Fe20). They are not cooled and that is why they are particularly interesting for the study of the friction wear phenomena as the relative velocity guard-rolled product and the temperature in the contact area have high values. At the same time, this type of guards is easy to study in industrial conditions.
2. URE\AJ ZA MJERENJE RADIJALNE SILE I SILE TRENJA U UVODNIM CIJEVIMA
Uzimaju}i u obzir prethodno navedeno, da bi se mjerila radijalna sila i sila trenja u valja~koj armaturi po~eli smo od ideje da bi rezultate trebalo prikupiti na valja~koj pruzi u toku industrijskog rada. Laboratorijski ure|aji ne bi mogli uzeti u obzir stvarne radne uslove: savijanja valjanog proizvoda, brzina valjanja, plasti~nost materijala, itd.
2. INSTALLATION FOR THE MEASURE-MENT OF RADIAL AND FRICTION FORCES IN THE DRAWING NOZZLES
Taking into account what has been mentioned above, in order to measure the radial and friction forces in the guards we started from the idea that the results should be collected on the rolling train during its industrial functioning. Laboratory installations would not have taken into consideration the real work conditions: the looping of the rolled product, the rolling rate, the plasticity of the material, etc.
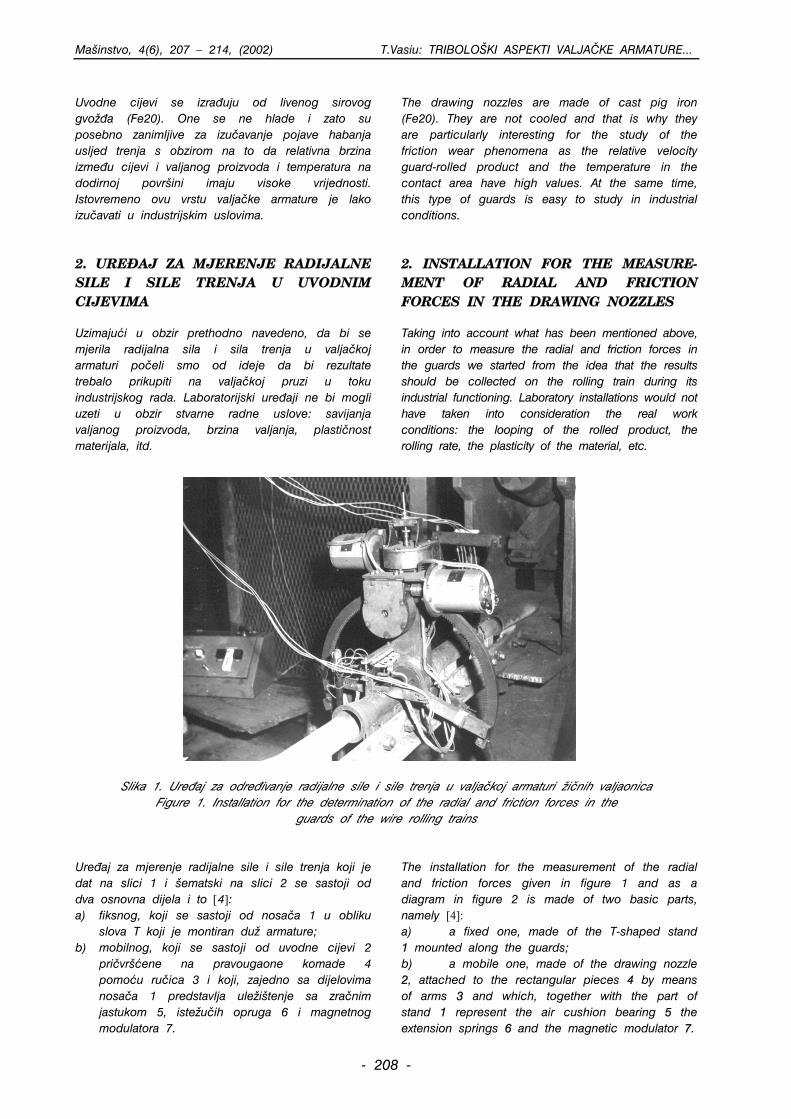
Slika 1. Ure|aj za odre|ivanje radijalne sile i sile trenja u valja~koj armaturi `i~nih valjaonica
Figure 1. Installation for the determination of the radial and friction forces in the guards of the wire rolling trains
Ure|aj za mjerenje radijalne sile i sile trenja koji je dat na slici 1 i {ematski na slici 2 se sastoji od dva osnovna dijela i to [4]: a) fiksnog, koji se sastoji od nosa~a 1 u obliku
slova T koji je montiran du` armature; b) mobilnog, koji se sastoji od uvodne cijevi 2
pri~vr{}ene na pravougaone komade 4 pomo}u ru~ica 3 i koji, zajedno sa dijelovima nosa~a 1 predstavlja ule`i{tenje sa zra~nim jastukom 5, iste`u~ih opruga 6 i magnetnog modulatora 7.
The installation for the measurement of the radial and friction forces given in figure 1 and as a diagram in figure 2 is made of two basic parts, namely [4]: a) a fixed one, made of the T-shaped stand 1 mounted along the guards; b) a mobile one, made of the drawing nozzle 2, attached to the rectangular pieces 4 by means of arms 3 and which, together with the part of stand 1 represent the air cushion bearing 5 the extension springs 6 and the magnetic modulator 7.
- 208 -

Ma{instvo, 4(6), 207 – 214, (2002) T.Vasiu: TRIBOLO[KI ASPEKTI VALJA^KE ARMATURE...
1. Nosa~-Stand 2. Uvodna cijev-Drawing nozzle 3. Ru~ice-Arms 4. Pravougaoni komadi-Rectangular pieces 5. Ule`i{tenje sa zra~nim jastukom-Air
cushion bearing 6. Iste`u}e opruge-Extension springs 7. Magnetni modulator-Magnetic modulator
Pra ac `ice vWire direction
Zrak - Air
Slika 2. [ema ure|aja za mjerenje radijalne sile i sile trenja
Figure 2. Diagram of the installation for the measurement of the radial and friction forces
Pomo}u magnetnog modulatora, pomjeranja uvodne cijevi 2 pri~vr{}ene na 4 se pretvaraju u elektri~ne impulse koji se {alju u transducer, te dalje u oscilograf, koji direktno bilje`i aksijalne sile. Uloga standardiziranih iste`u}ih opruga 6 je da se izmjere aksijalne sile, kao i da se vrati mobilni dio u svoj po~etni polo`aj nakon {to `ica pro|e kroz armaturu. Standardizacija opruga omogu}ava bilje`enje sila trenja pomo}u oscilografa na posebnoj skali. Precizno postavljanje ure|aja omogu}ava da se sva aksijalna sila transformi{e u silu otpora dviju opruga, {to se mo`e o~itavati uz pomo} sistema modulator-transducer-oscilograf. Ure|aj je montiran u @eljezari S.C. "Siderwgica" S.A. Hunedoara izme|u 18. i 19. stana `i~ne valjaonice. Mjerenja su izvr{ena za sve tipove `ice, ali smo za analizu koristili one koje odgovaraju kona~nim dimenzijama pre~nika Ø6 mm, Ø10 mm i Ø15,5 mm. Ostale su bile dimenzija izme|u ovih navedenih.
By means of the magnetic modulator, the movements of the drawing nozzle 2 attached to 4 are turned into electric impulses that are sent to a transducer and further on to an oscillograph, which directly records the axial forces. The role of the standardized extension springs 6 is to measure the axial forces, as well as to bring back the mobile part in its initial position after the wire has passed through the guard. The standardization of the springs allows the recording of the friction forces by means of the oscillograph, at the respective scale. A correct positioning of the installation allows that the entire axial force be transformed in a resistive force of the two springs, which can be read by means of the modulator-transducer-oscillograph system. The installation was mounted at S.C. “Siderurgica” S.A. Hunedoara between stands 18 and 19 of the wire rolling train. The measurements were carried out for all the types of wire, but for the analysis we used the ones corresponding to the final dimensions Ø6mm, Ø10mm, and Ø15.5mm, the others ranking within these dimensions.
3. EKSPERIMENTALNI REZULTATI Dijagrami radijalnih sila su dati na slikama 3, 4 i 5 u ovisnosti od ugaonog polo`aja `ice (stepeni), odnosno polo`aja valja~kog ure|aja.
3. THE EXPERIMENTAL RESULTS The diagrams of the radial forces are given in figures 3, 4 and 5 according the angle position of the wire [degrees], respectively the position of the rolling device.
- 209 -

Ma{instvo, 4(6), 207 – 214, (2002) T.Vasiu: TRIBOLO[KI ASPEKTI VALJA^KE ARMATURE...
0
0,05
0,1
0,15
0,2
0,25
0,3
0,35
90
0
180
270
The radial force[daN]Radijalna sila [daN]
Slika 3. Dijagram radijalnih sila za `icu pre~nika Ø6 mm
Figure 3. The diagram of the radial forces for the Ø6mm wire
The radial force[daN]
0
0,1
0,2
0,3
0,4
0,5
0,60
90270
180
Radijalna sila [daN]
Slika 4. Dijagram radijalnih sila za `icu pe~nika Ø10 mm
Figure 4. The diagram of the radial forces for the Ø10mm wire
- 210 -

Ma{instvo, 4(6), 207 – 214, (2002) T.Vasiu: TRIBOLO[KI ASPEKTI VALJA^KE ARMATURE...
The radial force[daN]
0
0,5
1
1,5
2
2,5
30
90
180
270
Radijalna sila [daN]
Slika 5. Dijagram radijalnih sila za `icu pe~nika Ø15,5 mm Figure 5. The diagram of the radial forces for the Ø15.5mm wire
0
0,5
1
1,5
2
2,5
0 5 10 15 20 25 30 35 40 45
Passage time [s]
The
fric
tion
forc
e [d
aN]
The diameter of wire 6 mm
The diameter of wire 10 mm
The diameter of wire 15,5 mm
Sila
tren
ja [d
aN]
Vrijeme prolaza [s]
Slika 6. Zavisnost vremena i sila trenja
Figure 6. The time dependand friction forces
- 211 -

Ma{instvo, 4(6), 207 – 214, (2002) T.Vasiu: TRIBOLO[KI ASPEKTI VALJA^KE ARMATURE...
4. ZAKLJU^CI Na vrijednosti radijalnih sila i njihove polo`aje po obimu kontaktne povr{ine uvodne cijevi utje~e niz faktora: brzina valjanja, temperatura, plasti~nost, masa materijala, ekscentri~nost armature kod monta`e, parametri savijanja, itd. Brzina valjanja se ne mo`e mijenjati jer je ona odre|ena tehnolo{kim parametrima. Temperatura, a tako|er i neke karakteristike materijala, su izmjenjene du` nekih dijelova `ice hla|enjem vodom unutar tehnolo{kih prihvatljivih granica, bez ikakvog primjetnog utjecaja na radijalne sile. Na{a ra~unanja su dovela do zaklju~ka da te`ina valjanog proizvoda predstavlja do 17,2 % radijalne sile. Ta vrijednost ukazuje da najve}i utjecaj na veli~inu i raspored radijalnih sila imaju tehnolo{ki parametri procesa valjanja, posebno oni koji su vezani za pojavu savijanja `ice. Mo`e se prihvatiti hipoteza da, u slu~aju kad su stanovi postavljeni jedan do drugog, mogu}e je eliminirati armaturu izme|u stanova, pa bismo tako imali samo jednu uvodnu i jednu ispusnu armaturu. S obzirom na sile trenja izme|u armature i valjanog proizvoda nismo primijetili nikakvu zna~ajnu razliku u vezi s razli~itim vrstama ~elika. Veli~ina tih sila uglavnom zavisi od dimenzija valjanog proizvoda. Razlog tome bi mogla biti ~injenica da su brzina valjanja i temperatura generalno identi~ne, a parametri savijanja, kao i plasti~nost materijala ostaju nepromijenjeni. Aksijalne vrijednosti (vrijednosti trenja) date na slici 5 ukazuju na neke specif~ne ta~ke, to jest: maksimalne vrijednosti sile pri po~etnom kontaktu `ice i armature iza kojih dolaze niske i osciliraju}e vrijednosti sile skoro za sve vrijeme kontakta, i na kraju novi skok kada `ica napu{ta kontakt (ni`i od vrijednosti na po~etku). Valja~ka armatura se mo`e posmatrati kao element koji ograni~ava kretanje, a `ica kao ~vrsto tijelo u pokretu, sa stepenima slobode odre|enim polo`ajem aramture kod monta`e i razlike izme|u dimenzija valjanog prizvoda i dimenzija otvora armature. [to se ti~e mehani~kih karakteristika, vo|ene `ice su druga~ije, uglavnom sa stanovi{ta krutosti i mase saglasno njihovom popre~nom presjeku.
4. CONCLUSIONS The values of the radial forces and their positions on the circumference of the contact surface of the drawing nozzle are influenced by a series of factors: the rolling rate, temperature, plasticity, mass of the material, the mounting eccentricity of the guards, the looping parameters, etc. The rolling rate cannot be modified as it is imposed by the technological parameters. The temperature and also some properties of the material were modified along some portions of the wire by water-cooling, within the technological acceptable limits, without any noticeable influence upon the radial forces. Our calculation lead to the conclusion that the weight of the rolled product represents up to 17.2% of the radial force. This value shows that the highest influence upon the magnitude and distribution of the radial forces is due to the technological parameters of the rolling process, particularly those connected with the looping. One can admit the hypothesis that in the case of placing the rolling stands side by side, the elimination of the intermediary guards is possible and therefore we would only have the introduction and the pay-out ones. With respect to the friction forces between the guard and the rolled product, we noticed no significant differences related to the different steel grades. The magnitude of these forces mainly depends on the dimensions of the rolled product. This could be due to the fact that the rolling rate and temperature are generally identical and the looping parameters, as well as the plasticity of the materials stay unchanged. The axial (friction) values given in figure 5 point out to some characteristic points, namely: maximum values at the initial contact between the wire and the guard, followed by low and oscillating values for most of the duration of the contact and, finally, a new apex at the wire leaving the contact (lower than the value in the beginning). The guards can be considered as elements of movement restriction and the wire as the moving solid, with degrees of liberty determined by the mounting position of the guards and the difference between the dimension of the rolled product and those of the guide reaming.
- 212 -

Ma{instvo, 4(6), 207 – 214, (2002) T.Vasiu: TRIBOLO[KI ASPEKTI VALJA^KE ARMATURE...
Po{to nema jednostavne veze izme|u zategnutosti i specifi~ne deformacije `ica s plasti~nim deformacijama, kao {to je to slu~aj sa elasti~nim deformacijama, te{ko je odrediti krutosti `ica koje imaju razli~ite pre~nike. Bez obzira na to, mo`e se prihvatiti da krutost i te`ina valjanih proizvoda temperature iznad 800 0C zavise od popre~nog presjeka, odnosno od du`ine (mase materijala). U tom kontekstu bismo trebali ista}i da {to je kru}i materijal (na istoj temperaturi) i {to je ve}a te`ina po jedinici du`ine, to je te`e izvoditi njegovo vo|enje. Ovo obja{njava ~injenicu da su sile trenja u valja~koj armaturi direktno povezane s popre~nim presjekom vo|enog valjanog proizvoda. Oscilacije sile trenja u toku kontakta izme|u valjanog proizvoda i armature se de{avaju usljed pojave savijanja i njihove amplitude u odnosu na karakteristike krutosti. Mo`e se shvatiti da je za manje presjeke amplituda sila trenja manja zbog manje krutosti. To nas upu}uje na zaklju~ak da je amplituda sila trenja obrnuto proporcionalna fleksibilnoti valjanog proizvoda, a direktno proporcionalna njegovoj krutosti. Izgleda da se ekstremne vrijednosti na po~etku, odnosno na kraju kontakta javljaju zbog udara. Jedan od razloga tome je ~injenica da je stepen slobode prednjeg i zadnjeg kraja valjanog proizvoda ve}i od stepena slobode ostalog dijela proizvoda. Izmjerena aksijalna sila (uzeta kao sila trenja) predstavlja radnju kojom valjani proizvod nastoji pomjeriti postolje mjernog ure|aja. Sila trenja izmjerena na taj na~in ima globalni karakter i odre|uje je tehnolo{ki i kinematski parametri, kao i priroda materijala u kontaktu.
As to the mechanical properties, the guided wires are different mainly from the point of view of their rigidity and mass, according to their cross-section. Since there is no simple relation between the tension and the specific deformation of the wires with plastic deformations, such as in the case of elastic deformations, it is hard to determine the rigidity of the wires having different diameters. Nevertheless, one can admit that the rigidity and weight of the rolled products over 8000C depend on the cross-section, respectively on the length (the mass of the material). In the same context we should point out that the more rigid (at the same temperature) the material is and the higher the weight per unit of length, the more difficult to guide it is. This explains the fact that the fiction forces in the guards are directly correlated with the cross-section of the guided rolled product. The oscillations of the friction force during the contact between the rolled product and the guard are due to the looping phenomenon and their amplitude to the rigidity characteristics. One can understand that for smaller sections, the amplitude of the friction forces is lower because of a lower rigidity. This leads to the conclusion that the amplitude of the friction forces is inversely proportional to the flexibility of the rolled product and directly proportional to its rigidity. The extreme values at the beginning, respectively at the end of the contact seem to be due to the phenomenon of impact, caused among other things by the fact that the degrees of freedom of the beginning and of the end of the rolled product are higher that those of the whole product. The measured axial force (taken as friction force) represents the action by which the rolled product tends to move the stand of the measuring device. The friction force measured in this way has a global character and is determined by the technological and cinematic parameters, as well as by the nature of the materials in contact.
- 213 -

Ma{instvo, 4(6), 207 – 214, (2002) T.Vasiu: TRIBOLO[KI ASPEKTI VALJA^KE ARMATURE...
5. LITERATURA - REFERENCES
[1] T., VASIU, Ş., MAKSAY, “Estimation of the Wear of Friction Coupling Disc-Cylinder for Constant Contact Forces”, Buletinul ştiinţific şi tehnic al Universităţii “Politehnica” din Timişoara, Tom 46 (60), 2001 fasc.2, pp. 117 – 120.
[2] T., VASIU, Metodă şi instalaţie pentru măsurarea forţelor de frecare ale sârmelor în ghidajele laminoarelor, Revista Metalurgia, nr.3(54)/2002, pag.17-20.
[3] T., VASIU, Studiul experimental al procesului de frecare-uzare al utilajului de laminare, Revista Metalurgia, nr.5(53)/2001, pag. 32-34.
[4] T., VASIU, Study On the Radial Forces in the Side Guards of the Rolling Mills, Buletinul ştiinţific şi tehnic al Universităţii “Politehnica” din Timişoara, Tom 46 (60), 2001, fasc.1, pp. 181 – 186.
[5] Gh., VASIU, Contribuţii la investigarea şi reducerea uzării mecanice la utilajul metalurgic, Teză de doctorat, Institutul de Mine Petroşani, 1975.
- 214 -

Ma{instvo 4(6), 215 – 226, (2002) N.Hara~i}: BOR I NISKOLEGIRANI ^ELICI ZA...
BOR I NISKOLEGIRANI ^ELICI ZA CEMENTACIJU I DIREKTNO KALJENJE
Doc.dr Na|ija Hara~i}, Ma{inski fakultet u Zenici, Univerzitet u Sarajevu, Fakultetska 1, 72 000 Zenica, Bosna i Hercegovina
REZIME
U ovom radu dat je opis bora kao va`nog mikrolegirnogispitivanja krivih gradijenta ugljika i mikrostrukture cementiranomikrolegiranog borom, kao i ~elika za cementaciju 16MnCr5 b
Klju~ne rije~i: bor, borom legirani ~elici, prokaljivost, mik
BOR AND BORON LOW ALLOYCARBURISATION AND DIRE
Na|ija Hara~i}, Ph.D., Asiss. professor, Faculty ofUniversity of Sarajevo, Fakultetska 1, 72000 Zenica
SUMMARY
The paper describes boron as a very important microalloyed eleresearch of the carbon layer gradient curves, such as microsquenched steel 20MnCrB5 microalloyed with boron and 16MnCr5
Key words: boron, boron alloyed steels, hardenability, m
1. UVOD Pove}avanje zahtjeva kod zup~anika za prijenos sve ve}e snage preko manjih, lak{ih, ti{ih, jeftinijih i pouzdanih mjenja~a koji moraju raditi pri veoma razli~itim uslovima eksploatacije dovelo je do razvoja vi{e vrsta ~elika za cementaciju. U Americi se ovi ~elici klasificiraju prema prokaljivosti, u Engleskoj prema mehani~kim osobinama jezgra, a prema EN 10083 od 1997. prema hemijskom sastavu. ^elici za cementaciju mikrolegirani borom prvi puta su proizvedeni izme|u 1950. i 1952. godine u Americi i oni su posljednjih godina pobudili interesovanje naro~ito zbog utjecaja bora na pove}anje prokaljivosti. Bor je va`an legiraju}i elemenat u ~eliku, koji naro~ito utje~e na njegovu prokaljivost. Potrebne koncentracije bora su veoma niske, a tako|e je veoma te{ko dodati odre|enu koli~inu bora, zbog mogu}ih varijacija za vrijeme proizvodnje ~elika. Precizno poznavanje utjecaja bora i tehnike njegovog legiranja mo`e doprinijeti optimizaciji osobina ~elika, njihovom maksimalnom iskori{}enju i {to ekonomi~nijoj proizvodnji [1,2].
1. INTR
Increasedthrough packagesservice manufacturisation. Inchemical properties10083/199containingindustrial USA, andof the boBoron isenhancingThe requand it isboron bproductioand techsteel promore eco
- 215 -
PRETHODNO SAOP[TENJE
elementa u `eljezu, prikaz rezultata g i direktno kaljenjog ~elika 20MnCrB5 ez bora.
rostruktura
ED STEELS FOR CT QUENCHING
Mechanical Engineering Zenica, , Bosnia and Herzegovina
mentruc w
icr
O
desma thconre thcom o7, mpro noron a inired soecan. Pniqpernom
PRELIMINARY NOTES
t. It also presents the results of the tures of the carburised and directly ithout boron.
ostructure
DUCTION
mand for gears to transmit more power ller, lighter, quieter, and more reliable at must operate over a wide range of ditions has lead to the design and of more types of the steel for carbu-e USA these steels are classified by their positions, in England by the mechanical
f their core, and according to the EN by their chemical composition. Boron-icro-alloyed steels reached large scale duction between 1950 i 1952 year in the wadays they are vary interesting because effect on the hardenabillity increase. n important alloying element in steels, particular to enhance their hardenability. concentrations of the bor are very low, difficult to add definite amount of the use of possible variations over the recise knowledge of the boron influence ues of his alloying can contribute the ties optimization, maximum utilization and ical production [1,2].

Ma{instvo 4(6), 215 – 226, (2002) N.Hara~i}: BOR I NISKOLEGIRANI ^ELICI ZA...
Postoje}i podaci o boru i njegovom utjecaju na osobine ~elika su veoma razasuti u literaturi. Kompletniji podaci o postoje}oj literaturi koja se odnosi na borom legirane ~elike mogu se prona}i u bazama podataka, uglavnom TI - Telesystems Questel: WPIL (Derwent) i STN International: PATDPA [3]. U ovom radu dat je prikaz nekih, najva`nijih osobina bora i ~elika mikrolegiranih borom, na osnovu pregleda relevantnih svjetskih literaturnih izvora kao i prikaz rezultata vlastith ispitivanja mikrostrukture ~elika za cementaciju i direktno kaljenje 20MnCrB5 sa borom i ~elika za cementaciju 16MnCr5 [1].
The existing data about boron and its influence on the steel properties are very dispersed in literature. A more complete survey of the existing literature concerning boron-containing alloys is to be found in data banks, mainly TI-Telesystems Questel: WPIL (Derwent) and STN International: PATDPA [3]. The paper describes some of the most important properties of the boron and the boron microalloyed steels based on reliable world literature data bases and personal results of the microstructure examinations of the steel for carburisation and direct quenching 20MnCrB5 and low alloyed steel for carburisation 16MnCrB. [1]
2. BOR I ^ELICI LEGIRANI BOROM
2.1 Osnovne osobine bora
Naziv bor potje~e iz armenijsko-perzijske lingvisti~ke grupe: burok ili burak za “borax”, jedan od najpoznatijih spojeva bora - natrij tetroborat dekahidrat. U srednjem vijeku borax se vadio iz slanih jezera u centralnoj Aziji i izvozio u Evropu pod imenom “Tincal”, gdje se koristio kao dodatak pri mehkom lemljenju i topljenju. Udio bora u Zemljinoj kori procjenjuje se na oko 3 do 10 ppm i nikada se ne javlja u elementarnom stanju nego uvijek u spojevima sa kisikom. Tehni~ki najva`niji minerali bora su: boraks (tinkal) Na2O x 2B2O3 x 10H2O; tinkalkonit Na2O x 2B2O3 x 5H2O; kernit (rasorit) Na2O x 2B2O3 x 4H2O; boracit 5 MgO x MgCl2 x 7B2O3; kolemanit: 2CaO x 3B2O3 x 5H2O; sasolin B2O3 x 3H2O i drugi. Najve}a nalazi{ta bora nalaze se u Kazahstanu, Kaliforniji, Argentini i Turskoj. Bor je prvi puta proizveden u amorfnom stanju, daleke 1808. godine (H.Davy) [3]. Bor je jedini nemetal u tre}oj glavnoj grupi periodnog sistema elemenata. Pri atmosferskom pritisku i temperaturi 0°C nalazi se u ~vrstom stanju. Bor ima 6 izotopa od kojih su neki radioaktivni sa veoma kratkim vremenima poluraspada, reda veli~ine ispod 1 sekunde. Neke od va`nijih osobina bora prikazane su u tabelama 1, 2 i 3.
2. BORON AND BORON ALLOYED STEELS
2.1. The basic properties of the boron The name "boron" originates from the Armenian - Persian linguistic area: buraq or burah for borax, one of the most widely-known boron compounds, namely sodium sodium tetraboratedecahydrate. As long ago as the Middle ages borax was exported under the name "Tincal" from the salt lakes of Central Asia to Europe, where it was used as an aid in soldering and melting.The proportion of boron in the earth′s outer crust is estimated to be to 10ppm and in nature boron does not occur in the elementar state, but always combined with oxigen. The technically most important boron- containing minerals are: Borax(Tinkal) Na2O x 2B2O3 x 10H2O; Tinkalconit Na2O x 2B2O3 x 5H2O; Kernit (Rasorit) Na2O x 2B2O3 x 4H2O; Boracit 5 MgO x MgCl2 x 7B2O3; Colemanit: 2CaO x 3B2O3 x 5H2O; Sassolin B2O3 x 3H2Oat and others. The greatests deposites of the bor are located in Kazakhstan, California, Argentina and Turkey. Boron was first successfully produced as ago as 1808 by H. Davy, as amorphous. Boron is the only nonmetal of the third main group of the periodic table. At the atmospheric pressure and temperature of 00 C boron is a solid material. It has six isotopes, some of which are radioactive with very short time of semi decay, with range scale below 1 second. Some of the most important properties of the boron are listed in the tables 1, 2 and 3.
Tabela 1. Podaci o kristalnoj gra|i bora [3] Table 1. Boron structural data [3]
Modifikacija – Modification Amorfna - Amorphous Kristalna - Crystaline
Boja – Colour sme|a - Brown crno-siva – black-grey Faze – Phase α β γ Temperatura nastajanja, 0C Temperature of occurence 0C
800-1100 ≥1300 1100-1300
Tip re{etke – Lattice type romboedarska - rhombohedral tetragonalna - tetragonal
a = 1,789 nm b = 0,895 nm c = 1,015 nm
- 216 -

Ma{instvo 4(6), 215 – 226, (2002) N.Hara~i}: BOR I NISKOLEGIRANI ^ELICI ZA...
Tabela 2. Mehani~ke osobine bora [3] Table 2. Boron mechanical properties [3]
Amorfno stanje - Amorphous Kristalno stanje - Crystaline
Gusto}a – Density 1,73 g/cm3 α mod. 2,46 g/cm3 β mod. 2,35 g/cm3 γ mod. 2,37 g/cm3
Tvrdo}a po Mohsu- Hardness 9,3
Zatezna ~vrsto}a Tensile strength
amorfno stanje 1,6 – 2,4 MPa amorphous u vlaknima 2,6 – 3,1 MPa fibres
Pritisna ~vrsto}a – Compressive strength 0,5 MPa Modul elasti~nosti – Elesticity modul 440 MPa
Tabela 3. Termodinami~ki podaci [3] Table 3. Thermodynamic data [3]
Ta~ka paljenja – Flame point 700C Ta~ka topljenja – Melting point 2300°C Ta~ka klju~anja – Boiling point 2550°C Koeficijent toplotnog {irenja - Coefficient of thermal expansion 20-750°C 1,1 – 8,3 nm/m.k Latentna toplota isparavanja - Latent heat of vaporisation 34 900 kJ/kg Latentna toplota topljenja - Latent heat of fusion 22 000 kJ/kg Latentna toplota izgaranja - Latent heat of combustion 5,4 kJ/kg
Koeficijent difuzije u γ – Fe - Diffusion coefficient in γ – Fe D = 0,002 . e –21000RT za (for) t = 1000°C : D = 0,002
Prema P.E. Brushby i njegovim saradnicima [3] brzina difuzije bora je ista kao brzina difuzije ugljika (koeficijent difuzije D=0,002.e-21000/RT). Kod sadr`aja ugljika do 0,43%, rastvorivost bora u austenitnoj re{etki ne zavisi od sadr`aja ugljika. Do sadr`aja bora od 0,009%, bor ne utje~e na difuziju ugljika.
According to P.E. Brushby and his colleagues [3] boron diffusion velocity is the same as carbon diffusion velocity (Diffusion coefficient D=0,002e-21000/RT). With carbon content of up to 0,43% solubility of boron in the austenite lattice is non dependent of the carbon content. Carbon diffusion is not affected up to boron contents of 0,009%.
2.2. Rastvorivost bora u `eljezu Postoje razli~ita mi{ljenja o polo`aju atoma bora u kristalnoj re{etki `eljeza. Neki smatraju da su atomi bora rastvoreni intersticijalno. Pore|enjem koeficijenata difuzije bora, ugljika i du{ika, W.F. Jandeska i J.E. Morral zaklju~ili su da su atomi bora intersticijalno rastvoreni u re{etki ϒ-Fe. Isti rezultat su postigli C.C. McBride, J.W. Spretnok i R. Speiser, na osnovu teoretskih razmatranja pore|enja radijusa atoma bora sa me|uatomskim rastojanjima u re{etki ϒ-Fe. Me|utim, ova geometrijska razmatranja zanemaruju mehanizme fizi~kih i hemijskih spajanja. Mjerenjem otklona x-zraka, R.M. Goldhoff i J.W. Spretnok prona{li su da je parametar re{etke ϒ-Fe smanjen u prisustvu bora. Oni su ovo uzeli kao dokaz supstitucionog rastvaranja atoma bora u `eljezu, po{to oni smatraju da je polo`aj atoma bora u mre`nim mjestima mnogo pogodniji nego u intersticijalima.
2. 2 Boron solubility in pure iron There are different opinions about the positions of boron atoms in the iron crystal lattice. Based on comparison of the diffusion coefficients of carbon and boron, Jandeska and I.J.Morral have concluded that the boron atoms are intersticially disolved in the γ-Fe lattice. C.C. McBride, J.W. Spretnak, R.Speiser have reached the same results based on comparison of the theoretical cosideration of the boron atoms radius and interatomic distances in the γ-Fe lattice. Howeever, these geometric considerations ignore the mechanisms of physical and chemical bonding. R.M.Goldhoff and J.W.Spretnak [3] found by X-ray deflection measurements that the lattice parameter in gamma iron is reduced in the presence of boron. They took this as a proof of a substitutional dissolution of the boron atoms in the austenite lattice. In view of the atomic radii of boron and iron, they considered the position of the boron atoms at the laticce locations to be more favourable than at intermediate lattice locations.
- 217 -

Ma{instvo 4(6), 215 – 226, (2002) N.Hara~i}: BOR I NISKOLEGIRANI ^ELICI ZA...
Oni su tako|e otkrili da razlika izme|u parametara re{etke ~istog `eljeza i onog koje sadr`i rastvorene atome bora brzo opada sa povi{enjem temperature. Na osnovu ovoga zaklju~ili su da sa porastom temperature vi{e atoma bora migrira iz re{etke prema granicama zrna, gdje je stvarno prona|eno izdvajanje bora. Me|utim, ovi autori nisu isklju~ili mogu}nost da male koli~ine atoma bora mogu tako|e zaposjesti polo`aje me|u prostorima re{etke. Postoji vi{e razli~itih radova o binarnom sistemu Fe-B. Na slici 1. prikazan je dijagram Fe-B prema O. Kubaschewskom. On pokazuje dva eutektikuma jedan kod 17 atomskih procenata bora, a drugi kod 63,5% atomskih procenata bora.
They also discoverd that the difference between the latice parameters of pure iron and boron-containing iron decreases with increasing temperature. From this they concluded that with increasing temperature more boron atoms migrate from the lattice to the grain boundaries, where boron separations have actually been found. However, these authors did not exlude the possibility that a smaller number of boron atoms may also occupy intermediate lattice locations [3]. There is several different works on the Fe-B binary sistem. The figure 1 shows a diagram prepared by O.Kubaschevsky. It shows two eutectics, one at 17 atomic percent of boron, the other at 63,5% of boron.
atomski The presence of boron, atomic (%)
Sl.1. Fazni dijagram Fe-B prema Kubaschewskom [3] Fig.1. Kubaschewsky Fe-B phase diagram [3]
Unutar oblasti izme|u ova dva eutektikuma likvidus temperatura varira izme|u 1149°C - eutekti~ka temperatura legure sa 17 atomskih procenata bora i 1590°C kod legure sa 50 atomskih procenata bora. Saglasno tome, temperatura topljenja `eljeza mo`e biti sni`ena vi{e od 150°C do maksimalno 350°C (kod 17 atomskih procenata bora) dodavanjem 5 do 30 atomskih procenata bora. Sa rastu}im sadr`ajem bora u fero boru, od drugog eutektikuma likvidus temperatura stalno i gotovo linearno raste do temperature topljenja ~istog bora [3]. Prema navedenom dijagramu, `eljezni borid (FeB) sadr`i 16,23% te`inskih procenata bora kristalizira u obliku rompske kristalne re{etke i vrlo je tvrd ( 2300 HV0,2 ).
Within the range between these two eutectics, the liquidus temperature varies between 11490 C, the eutectic temperature at 17 atomic percent of boron, and 15900 C for the allow with 50 atomic percent of boron. Accordingly, the melting temperature of iron can be lowered by more than 1500 C to the maximum of 350 0C (at 17 atomic percent of boron) by the adding of 5 to 30 atomic percent of bor. With an increasing proportion of a boron in the ferroboron from the second eutectic, the liquidus temperature rises steadily and almost linearly up to the melting temperature of pure boron [3]. Accordingly, in the above diagram, iron boride (FeB) has 16,23 weight percent of boron, a rhombic latice and extreme hardness of 2300 HV0,2.
- 218 -

Ma{instvo 4(6), 215 – 226, (2002) N.Hara~i}: BOR I NISKOLEGIRANI ^ELICI ZA...
@eljezni dvovalentni borid (Fe2B) sadr`i 8,83 te`inskih procenata bora i kristalizira u obliku povr{inski centrirane tetragonalne re{etke, a tvrdo}a mu je 1800 do 2000 HV0,2 (po`eljan je, dok se FeB izbjegava). Naro~ito su precizna istra`ivanja izvr{ena za oblast niskih koncentracija bora prema raznim autorima [4,5]. Prema binarnom dijagramu Fe-B (sl.2) autora Houdremona za oblast niskih koncentracija bora, maksimalna rastvorivost bora u γ-Fe je 0,021% na 11490 C. Me|utim, sa padom temperature njegova rastvorljivost opada u γ-Fe i to ~ak na 0,0021% na 906°C. Ova temperatura je ujedno peritektoidna za peritektoidnu reakciju pri 0,0082%B. Rastvorivost bora u γ-Fe naglo opada i na 710°C u njemu je supstituciono rastvoreno samo oko 0,0004% bora [6].
Iron- II- boride (Fe2B) has 8,83 weight percent of boron, a tetragonal lattice and hardness of 1800 to 2000 HV0,2 (preferable as long as FeB is being avoided). Many authors have made more precise investigations of the iron/boron binary system in the iron rich corner [4,5]. According to Houndremon's binar phase diagram Fe-B (Fig.2), in the low concenration region of boron the maximum sollubility of boron is 0,021% at 11490C. In the meantime, with the temperature decrease its sollubulity decreses too, as far as down to 0,0021% at 9060C. At the same time this temperature is perytectoide for perytectoide reaction at 0,0082%B. Boron solubillity in γ - Fe suddenly decreases and at 710 0C only about 0,0004% of boron substitionally dissolved [6].
Sl.2. Ravnote`ni dijagram Fe-B za oblast niskih sadr`aja bora [8] Fig.2. Equilibrium phase Fe-B diagram for the low boron concentration regions [8]
J.W. Spretnak i R.Speiser [3] su istra`ivali da li bor formira film oko austenitnog zrna u ~eliku i zaklju~ili na osnovu geometrijskih razmatranja da je to nemogu}e. Umjesto toga otkrili su ta~kastu precipitaciju Fe2B po granicama zrna. Bor se u ~eliku javlja u obliku borida Fe2B, veli~ine 20 do 30x10-8 cm koji su dispergovani u matriksu i kao slobodan koji prete`no segregira po granicama primarnog, austenitnog zrna. Ova mala koli~ina rastvorivog bora raspore|enog po granicama zrna, zna~ajno usporava difuzionu γ-α transformaciju, tj. sprje~ava feritnu reakciju i tako pobolj{ava prokaljivost. Prema iskustvenim podacima, optimalna koli~ina bora koju treba dodati ~eliku za postizanje maksimalne prokaljivosti kre}e se od 0,0003 do 0,0030%B [7]. Dodatak bora iznad ove vrijednosti pogor{ava prokaljivost zbog toga {to vi{ak atoma bora precipitira kao povr{inski centrirani kubni Fe23(B,C)6 borkarbid, koji mo`e djelovati kao mjesto preferencijalne nukleacije ferita.
J.W.Spretnak investigated whether it is possible for boron to form a film surrounding austenitic grain in the steel and concluded on the basis of the geometrical cosi-derations that it is impossible. Instead, they discovered a point Fe2B precipitation at the grain boundaries. In the steel, boron can be dispersed in matrix in the form of Fe2B, boride with size of 20 to 30x10-8 cm and free, which segregates predominantly surrounding primary austenite grain boundaries. This small amount of the soluble boron arranged along grain boundaries, evidently retards γ-α transformations by diffusion, namely it prevents feritic reaction thus enhancing hardenability of the steel. Boron optimum quantity which have to be added in the steel to atchi-ve maximum hardenability, based on experiance is about 0,0003 to 0,0030% B [7]. Boron addition beyond the mentioned values deteriorates hardenability because the excess of boron atoms precipitates as the surface centered cube Fe23(B,C)6 borocarbide which can be a ferrite nucleation preffential place.
- 219 -
Ma{instvo 4(6), 215 – 226, (2002) N.Hara~i}: BOR I NISKOLEGIRANI ^ELICI ZA...
2.3. Utjecaj bora na svojstva ~elika
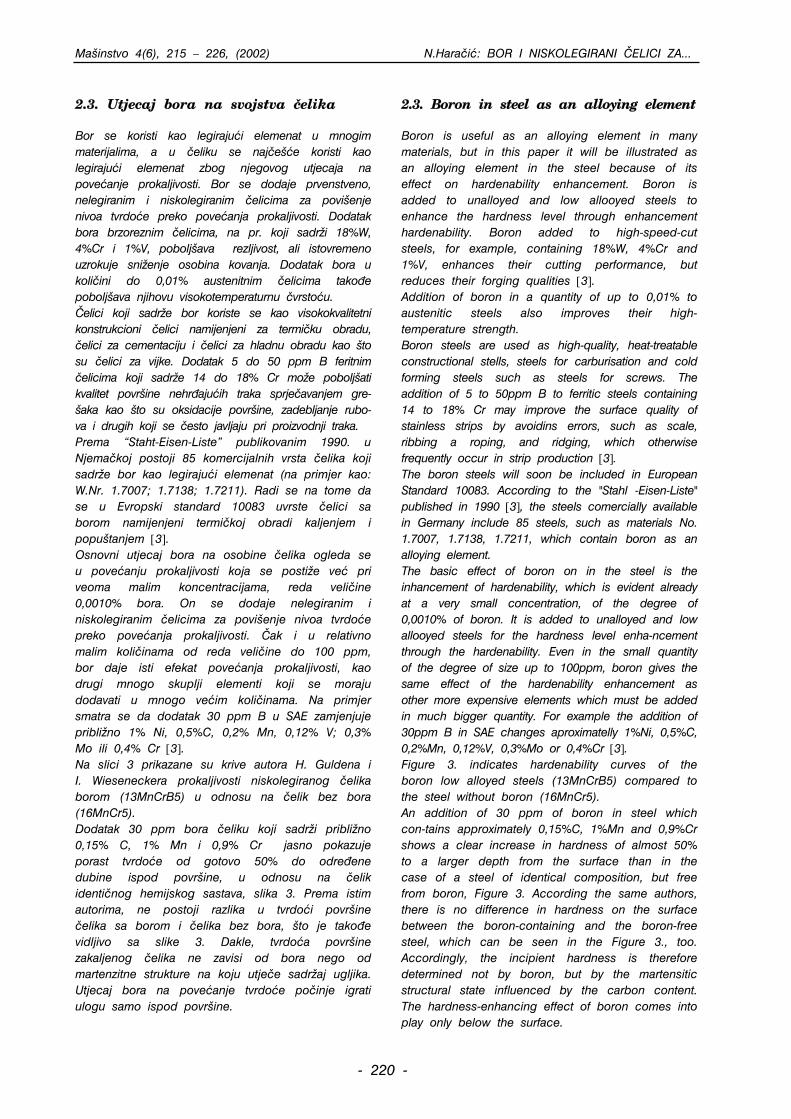
Bor se koristi kao legiraju}i elemenat u mnogim materijalima, a u ~eliku se naj~e{}e koristi kao legiraju}i elemenat zbog njegovog utjecaja na pove}anje prokaljivosti. Bor se dodaje prvenstveno, nelegiranim i niskolegiranim ~elicima za povi{enje nivoa tvrdo}e preko pove}anja prokaljivosti. Dodatak bora brzoreznim ~elicima, na pr. koji sadr`i 18%W, 4%Cr i 1%V, pobolj{ava rezljivost, ali istovremeno uzrokuje sni`enje osobina kovanja. Dodatak bora u koli~ini do 0,01% austenitnim ~elicima tako|e pobolj{ava njihovu visokotemperaturnu ~vrsto}u. ^elici koji sadr`e bor koriste se kao visokokvalitetni konstrukcioni ~elici namijenjeni za termi~ku obradu, ~elici za cementaciju i ~elici za hladnu obradu kao {to su ~elici za vijke. Dodatak 5 do 50 ppm B feritnim ~elicima koji sadr`e 14 do 18% Cr mo`e pobolj{ati kvalitet povr{ine nehr|aju}ih traka sprje~avanjem gre-{aka kao {to su oksidacije povr{ine, zadebljanje rubo-va i drugih koji se ~esto javljaju pri proizvodnji traka. Prema “Staht-Eisen-Liste” publikovanim 1990. u Njema~koj postoji 85 komercijalnih vrsta ~elika koji sadr`e bor kao legiraju}i elemenat (na primjer kao: W.Nr. 1.7007; 1.7138; 1.7211). Radi se na tome da se u Evropski standard 10083 uvrste ~elici sa borom namijenjeni termi~koj obradi kaljenjem i popu{tanjem [3]. Osnovni utjecaj bora na osobine ~elika ogleda se u pove}anju prokaljivosti koja se posti`e ve} pri veoma malim koncentracijama, reda veli~ine 0,0010% bora. On se dodaje nelegiranim i niskolegiranim ~elicima za povi{enje nivoa tvrdo}e preko pove}anja prokaljivosti. ^ak i u relativno malim koli~inama od reda veli~ine do 100 ppm, bor daje isti efekat pove}anja prokaljivosti, kao drugi mnogo skuplji elementi koji se moraju dodavati u mnogo ve}im koli~inama. Na primjer smatra se da dodatak 30 ppm B u SAE zamjenjuje pribli`no 1% Ni, 0,5%C, 0,2% Mn, 0,12% V; 0,3% Mo ili 0,4% Cr [3]. Na slici 3 prikazane su krive autora H. Guldena i I. Wieseneckera prokaljivosti niskolegiranog ~elika borom (13MnCrB5) u odnosu na ~elik bez bora (16MnCr5). Dodatak 30 ppm bora ~eliku koji sadr`i pribli`no 0,15% C, 1% Mn i 0,9% Cr jasno pokazuje porast tvrdo}e od gotovo 50% do odre|ene dubine ispod povr{ine, u odnosu na ~elik identi~nog hemijskog sastava, slika 3. Prema istim autorima, ne postoji razlika u tvrdo}i povr{ine ~elika sa borom i ~elika bez bora, {to je tako|e vidljivo sa slike 3. Dakle, tvrdo}a povr{ine zakaljenog ~elika ne zavisi od bora nego od martenzitne strukture na koju utje~e sadr`aj ugljika. Utjecaj bora na pove}anje tvrdo}e po~inje igrati ulogu samo ispod povr{ine.
2.3. Boron in steel as an alloying element
Boron is useful as an alloying element in many materials, but in this paper it will be illustrated as an alloying element in the steel because of its effect on hardenability enhancement. Boron is added to unalloyed and low allooyed steels to enhance the hardness level through enhancement hardenability. Boron added to high-speed-cut steels, for example, containing 18%W, 4%Cr and 1%V, enhances their cutting performance, but reduces their forging qualities [3]. Addition of boron in a quantity of up to 0,01% to austenitic steels also improves their high-temperature strength. Boron steels are used as high-quality, heat-treatable constructional stells, steels for carburisation and cold forming steels such as steels for screws. The addition of 5 to 50ppm B to ferritic steels containing 14 to 18% Cr may improve the surface quality of stainless strips by avoidins errors, such as scale, ribbing a roping, and ridging, which otherwise frequently occur in strip production [3]. The boron steels will soon be included in European Standard 10083. According to the "Stahl -Eisen-Liste" published in 1990 [3], the steels comercially available in Germany include 85 steels, such as materials No. 1.7007, 1.7138, 1.7211, which contain boron as an alloying element. The basic effect of boron on in the steel is the inhancement of hardenability, which is evident already at a very small concentration, of the degree of 0,0010% of boron. It is added to unalloyed and low allooyed steels for the hardness level enha-ncement through the hardenability. Even in the small quantity of the degree of size up to 100ppm, boron gives the same effect of the hardenability enhancement as other more expensive elements which must be added in much bigger quantity. For example the addition of 30ppm B in SAE changes aproximatelly 1%Ni, 0,5%C, 0,2%Mn, 0,12%V, 0,3%Mo or 0,4%Cr [3]. Figure 3. indicates hardenability curves of the boron low alloyed steels (13MnCrB5) compared to the steel without boron (16MnCr5). An addition of 30 ppm of boron in steel which con-tains approximately 0,15%C, 1%Mn and 0,9%Cr shows a clear increase in hardness of almost 50% to a larger depth from the surface than in the case of a steel of identical composition, but free from boron, Figure 3. According the same authors, there is no difference in hardness on the surface between the boron-containing and the boron-free steel, which can be seen in the Figure 3., too. Accordingly, the incipient hardness is therefore determined not by boron, but by the martensitic structural state influenced by the carbon content. The hardness-enhancing effect of boron comes into play only below the surface.
- 220 -

Ma{instvo 4(6), 215 – 226, (2002) N.Hara~i}: BOR I NISKOLEGIRANI ^ELICI ZA...
Presudni mehanizam djelovanja bora na pobolj{anje prokaljivosti je posljedica zaka{njenja transformacije u beinit, ferit i perlit, koji su mek{i od martenzita, a koji nastaju za vrijeme hla|enja sa temperature austenitizacije poslije `arenja ili vru}e prerade.
The operative mechanism which is decisive for the enhancement of hardenability by boron derives from from a delay in the transformation to the bainite, ferrite and pearlite structures, which are softer than martensite, taking place over cooling from the austenitisation temperature after annealing or from the hot working (temperature).
Slika 3. Utjecaj bora na prokaljivost ~elika [3] Fig.3. Boron effected hardenability of steel [3]
3. MATERIJAL I METODE U ovom radu je opisan mikrolegirani element bor i njegov utjecaj na svojstva ~elika, a ispitana je mikrostruktura i kriva gradijenta ugljika za ~elik 20MnCrB5 i 16 MnCr5. Planirane su i ostvarene dvije faze eksperimentalnih istra`ivanja. Prva faza je obuhvatala opita cementacije u cilju odre|ivanja krivih gradijenta ugljika. U drugoj fazi je planirano i izvr{eno ispitivanje utjecaja sulfidnih nemetalnih uklju~aka na osobine cementiranog sloja, primjenom savremenih metalografskih ispitivanja. Pri tome su izvr{ena ispitivanja ~elika 20 MnCrB5 za cementaciju i direktno kaljenje, uporedno sa ~elikom 16MnCr5. ^elik 20 MnCrB5 je veoma va`an ~elik za motornu industriju. Osim nekih uobi~ajenih faktora koji su potrebni za postizanje `eljene ~vrsto}e i `ilavosti, kod ovog kvaliteta ~elika se tako|e zahtijeva i odre|ena dubina cementiranog sloja, sadr`aj ugljika (%) na povr{ini cementiranog ~elika i specijalna udarna `ilavost (dinami~ka sila loma, ve}a ili jednaka 500 kN, ispitivanje po Bruggeru). U tabeli 4. prikazan je hemijski sastav ispitivanih ~elika.
3. MATERIAL AND METHODES The paper describes microalloyed element boron and its effect on the steel properties, and presents the results of the research on carbon layer gradient curves, such as the microstructures of the carburised and direct quenched steel 20MnCrB5 microalloyed with boron and 16MnCr5 without boron. Two phases of the experimental research have been planned and realised. The first phase consists of the experiments of pack carburisation with the aim to achive carbon layer gradient curves. In the second phase it was planned to carry out examination of sulphide non-metallic inclusions effect on the carburised layer properties, with applied up-to-date metallographic examinations methodes. At the same time examinations of the 20MnCrB5 steel for carburisatin and direct quenching are carried out, parallel with 16MnCr5 steel. The steel 20MnCrB5 is very important for the motor industry. Beside some usual factors that affect the strength and toughnes the following is also required the carbu-rized layer depth, carbon content (%) on the surface of carburized steel and special fracture toughnes (dynamic impact force, bigger or equivalent to 500kN, Brugger examination). The carbon layer gradient curves were made in the carbon content spectrographic analysis of the individual layers 0,01 mm in thicknees beginning with surface of the carburised specimens. Research and explanation of the carbon layer gradient curves was conducted in this work with the aim to achieve the required special fracture toughnes.
- 221 -

Ma{instvo 4(6), 215 – 226, (2002) N.Hara~i}: BOR I NISKOLEGIRANI ^ELICI ZA...
Tabela 4. Hemijska analiza ispitivanih ~elika Table 4. Chemical analisys of tested steels
Hemijski sastav - Chemical analisys (te`. %) ^elik- Steel
C Si Mn P S Cr Mo Al B
20 MnCrB 5 0,16 0,325 1,125 0,015 0,027 1,25 0,020 0,065 0,0035 16 MnCr 5 (^. 4320)
0,12 0,18 1,11 0,017 0,023 0,98 - - -
Kao osnovni ~elik u ovom radu je izabran ~elik 20MnCrB5koji sadr`i 0,0035%B za razliku od uobi~ajenih ~elika za cementaciju. Od kovanih {ipki φ 32mm izra|eni su uzorci veli~ine φ 25x5mm, za gradijent ugljika. Uzorci su cementirani na temperaturi 9400 C u trajanju od: 0,5; 1; 2; 4; 6 i 8 sati, kaljeni u ulju i popu{teni. Odre|ivanje krivih gradijenta ugljika izvr{eno je spektrografskim ispitivanjem sadr`aja C u pojedinim slojevima debljine 0,01mm, po~ev od povr{ine uzorka. Istra`ivanja i obja{njenja krivih gradijenta ugljika izvedena u ovom radu izvr{ena su u cilju postizanja specijalne udarne `ilavosti po Bruggeru.
The base steel, in this work is designated as type 20MnCrB5 which contains 0,0035%B as the difference from the commonly used carburizing steels. Samples for the carbon layer gradient, with size of φ 25x5 mm were machined from bar stock with diametar φ 32 mm. The specimens were carburized at 9400C over different periods: 0,5; 1; 2; 4; 6; and 8 hours, oil quenched and tempered. The carbon layer gradient curves were made by spectrographic carbon content analysis in the individual layers 0,01 mm in thicknees begining with surface of the specimens. The researchs and explanations of the carbon layer gradient curves are made in this work in the aim of achieving demanded special fracture toughnes ( Brugger).
4. REZULTATI I DISKUSIJA Rezultati ispitivanja krivih gradijenta ugljika prikazani su na slici 4 i 5. Na prikazanim krivama, naro~ito krivama nauglji~enja ~elika 20MnCrB5, zapa`aju se diskontinuiteti (slika 4) kao i na krivama mikrotvrdo}e cementiranog sloja [2]. Prikazani podaci o rasporedu sadr`aja ugljika kroz cementirane slojeve pri razli~itim vremenima cementacije - po~ev od povr{ine komada pokazuju, da se nakon dostizanja odre|enog povr{inskog sadr`aja ugljika, pri produ`enju vremena i povi{enjem temperatura cementacije, njegov sadr`aj sni`ava na ra~un pove}anja ukupne dubine prodiranja ugljika (slika 4 i 5). Rezultati ispitivanja mikrostrukture uzoraka ispitivanih ~elika prikazani su na slikama 6 do 8. Mikrostruktura cementiranog sloja sastoji se od martenzita, zaostalog austenita, nemetalnih uklju~aka i globularnih ~estica na i oko sulfidnih uklju~aka (slika 6).
4. RESULTS AND DISCUSSION Results of the carbon layer gradient examinations are shown on the Figure 4 and 5. Carbon layer gradient curves show discontinuations, such as the microhardness profiles of the carburized specimens. Represented data about the carbon arrangement through the carburised layers achieved over different periods of carburisation-begining with surface of the pieces show that upon reaching the determined carbon surface content, with the prolongation and temperature increase of the carburisation process, carbon content deminishes at the expense of increase of the total depth of the carbon penetration (Figure 4 and 5). Microstructure investigation results of the examineted steel specimens are shown in the Figure 6 and 7. The carbon layuer structure consists of the martensite, retained austenite, nonmetallic inclusions and globular particles around / on the sulfide inclusions (Figure 6.).
- 222 -

Ma{instvo 4(6), 215 – 226, (2002) N.Hara~i}: BOR I NISKOLEGIRANI ^ELICI ZA...
Slika 4. Krive gradijenta ugljika ~elika 20MnCrB5 Figure 4. Carbon gradient curves of the steel 20MnCrB5
Slika 4. Krive gradijenta ugljika ~elika 16MnCr5 Figure 4. Carbon gradient curves of the steel 16MnCr5
Slika 6. Mikrostruktura cementiranog ~elika 20 MnCrB5 Figure 6 Microstructure of the carburised steel 20MnCrB5
- 223 -

Ma{instvo 4(6), 215 – 226, (2002) N.Hara~i}: BOR I NISKOLEGIRANI ^ELICI ZA...
Na slikama 7 i 8 prikazani su rezultati Auger elektronskih ispitivanaja cementiranih uzoraka ~elika 20MnCrB5. Ova ispitivanja su pokazala prisustvo elementa kisika oko sulfidnih nemetalnih uklju~aka, u obliku bijelog oreola (slika 7). Uklju~ak prikazan na slika 8 pokazuje tako|e i oksidiranost velikog dijela njegove povr{ine. Oko navedenih uklju~aka uo~ava se zona sa velikom nakupinom globularnih ~estica (slika 8). Na pomenutoj slici tako|e se uo~ava i zona intenzivne oksidacije koja presijeca podru~je nakupine globularnih ~estica.
Figure 7. and 8 represent Auger electron spectroscopy examinations of the carburised specimens of the 20MnCrB5 steel. These examinations reveale the presence of oxigen around sulphide non-metallic inclusions, such as white oreol (Figure 7). Nonmetllic inclusion seen on the Figure 8 also shows oxidation of a big part of its surface, too. A zone with great accumulation of the globular particles around mentioned inclusions is viseable (Figure 8).
Slika 7. Auger - elektronska mikroskopija cementiranog ~elika 20MnCrB5
Figure 7. Auger - electron spectroscopy of the carburised steel 20MnCrB5
Slika 8. Auger - elektronska mikroskopija cementiranog ~elika 20MnCrB5
Figure 8. Auger - electron spectroscopy of the carburised steel 20MnCrB5
- 224 -

Ma{instvo 4(6), 215 – 226, (2002) N.Hara~i}: BOR I NISKOLEGIRANI ^ELICI ZA...
Izvr{ena Auger elektronska ispitivanja dala su veoma korisne i interesantne rezultate za osvjetljavanje mehanizma nastajanja nehomogenosti u cementiranom sloju. Postignuti rezultati i zaklju~ci izvedeni iz ovih istra`ivanja ukazuju na dejstvo sumpora u cementiranom sloju. Naime, prikazani rezultati Auger elektronskih ispitivanja pokazali su da prisutni sulfidni, nemetalni uklju~ci mogu biti uzrok nastajanju oksidacije za vrijeme procesa cementacije. Ova pojava ima za posljedicu stvaranje nehomogene mikrostrukture cementiranog sloja koja mo`e negativno utjecati na mehani~ke osobine cementiranog ~elika .
The auger-electron spectroscopy research has given a very useful and interesting results and explanation of the occurence of inhomogeneity mechanism in the carburised layer. The results reached and conclusions drawn from the research point to the effect of sulphure in the carburised layer. Namely, the results obtained in the research adress the topic of the effect of sulfur on the carbon layer gradient connected with oxidation around sulfide inclusions. This appearance can cause the formation of microstructure inhomogenity of the carburised layer, with negative effects on the mechanical properties of the carburised steel.
4. ZAKLJU^CI U radu je opisan mikrolegirni element bor i njegov utjecaj na svojstva ~elika, a ispitana je i mikrostruktura i krive gradijenta ugljika za ~elike 20MnCrB5 i 16 MnCr5. Planirane su i ostvarene dvije faze eksperimentalnih istra`ivanja. Prva faza je obuhvatala opita cementacije u cilju odre|ivanja krivih gradijenta ugljika. U drugoj fazi je planirano i izvr{eno ispitivanje utjecaja sulfidnih nemetalnih uklju~aka na osobine cementiranog sloja, primjenom savremenih metalografskih ispitivanja. Eksperimentalno dobijeni podaci o rasporedu sadr`aja ugljika kroz cementirane slojeve pri razli~itim vremenima cementacije pokazuju da se nakon dostizanja odre|enog povr{inskog sadr`aja ugljika, pri produ`enju vremena i povi{enjem temperatura cementacije sni`ava njegov sadr`aj, na ra~un pove}anja ukupne dubine prodiranja ugljika. Metalografska makro i mikrostruktura cementiranog sloja ispitivanih ~elika pokazala su postojanje nehomogenosti strukture u obliku mjestimi~nih zabjeljenja u cementiranom sloju. Ova nehomogenost je uglavnom locirana u oblastima sa pove}anim prisustvom nemetalnih uklju~aka. Smatra se da navedena nehomogenost sloja sni`ava mehani~ka svojstva cementiranog ~elika, {to bi trebalao provjeriti eksperimentalno. Prilikom cementacije dolazi i do ogrubljenja austenitnog zrna u ~eliku, ~iji se rast zaustavlja na prisutnim sulfidnim nemetalnim uklju~cima. Istovremeno, prisustvo uklju~aka blokira rast austenitnog zrna i remeti proces difuzije ugljika. Oko uklju~aka dolazi do intenzivnije difuzije kisika u odnosu na ostali dio zrna, {to pokazuju i auger slike.
4. CONCLUSIONS The paper describes boron as a very important microalloyed element and presents the results of the research on microstructures, such as carbon layer gradient curves of the carburised and direct quenched steel 20MnCrB5 microalloyed with boron and 16MnCr5 without boron. Two phases of the experimental research have been planned and realised. The first phase consists of the experiments of pack carburisation with the aim to achive carbon layer gradien curves. In the second phase it was planned and carry out examination of sulphide non-metallic inclusions effect on the carburised layer properties, with applied up-to-date metallographic examinations methodes. The results of the experiments, concerning the carbon arrangement through the carburised layers realised over differents periods of carburisation - begining with the surface of the pieces show that, upon reaching the determined carbon surface content, with the time prolongation and temperature increase of the carburisation process, the carbon content deminished at the expense of increase of increase of the total depth of the carbon penetration. Carburised layer metallographic macro and micro-structure of the examined steels shown structure inhomogeneity existence, in the form of sporadically white places in carburised layer. This inhomogeneity is situated mainly in the areas with increased quantity of nonmetallic inclusions. It is believed that the mentioned layer the inhomogeneity lowers mechanical properties of the carburised steel, which should be controlled experimentally. Austenitic grain size of the steel coarsened over the carburisation proces, and their growth stops on the present sulphide nonmetallic inclusions. Simultaneously, the presence nonmetallic inclusions blocks austenitic grains growth and dislocate process of carbon diffusion. More intensive oxigen diffusion occurs arround the nonmetallic inclusions compared with the other grain parts, which can be seen on the Auger figures.
- 225 -

Ma{instvo 4(6), 215 – 226, (2002) N.Hara~i}: BOR I NISKOLEGIRANI ^ELICI ZA...
6. LITERATURA - REFERENCES
[1] Hara~i} N.: Doprinos studiji prijenosa ugljika iz ~vrstog sredstva za nauglji~enje u ~elik pri njegovoj obradi cementacijom, doktorska disertacija, Ma{inski fakultet Zenica, 2000.
[2] Kapetanovi} K.: Osvajanje proizvodnje kvalitetnog ~elika za cementaciju ZF7 za potrebe motorne industrije, Metalur{ki institut Zenica, 1971.
[3] Dietrich H. Werner: Bor und borlegirte Stahle (Boron and Boron Containing Steels), Verlag Stahleisen mbh, Dusseldorf 1995., s.1-86
[4] Morral J.E., Comeron T.B.: Boron Hardenability Mechanisms in Steel/ Milwaaka , wis "18 Sept.", 1979., TMS/AIME, P.O. BOX430, 420 Commonwealth, Warendale, Pa 15 086, 1980.8101-72.005 (Photocopy)
[5] Ouchy C., Tanaka J., Osuka T.: Temper Embritlement of Low-Carbon Alloy Steels,
Toward Improved Ductility and Toughness, Kyoto International Conference Hall, October 25, 26 1971., s.67-82
[6] Ohmary J., Jamanaka K.: Hardenability of Boron treated Low Carbon, Low Alloy Steels/ Boron in Steel Milwaaka, wis "18 Sept.", 1979., Commonwealth, Warendale, P.A. 15 085, 1980 8101-72 005 (Photocopy)
[7] Pakrasi S., Just E.: How Boron affects the Hardenability of Low Carbon Alloy Steels/ Volkswagenwerk AG, Forschung und Entwicklung, 3/80 Wolfsburg, (Photocopy)
[8] Dudrova, M. Selecka, R. Bure{, M. Kabatova: Effect of Boron Addition on Microstructure and Properties of Sintered Fe-1,5Mo Powder Materials, ISIJ International, Vol. 37 (1997), No.1
- 226 -
Ma{instvo, 4 (6), 227 – 232, (2002) J.Gren~ik,...: PRIJEDLOG REKONSTRUKCIJE RUDARSKE...
PRIJEDLOG REKONSTRUKCIJE RUDARSKE LOKOMOTIVE ^IJI JE CILJ SMANJENJE ZAGA\ENJA OKOLINE
Doc. dr. Juraj Gren~ik, Univerzitet u @ilini, Ma{inski fakultet, Slova~ka Doc. dr. Stanislav Ku~era, Univerzitet u @ilini, Elektrotehni~ki fakultet
REZIME
Problemi za okoli{ koje uzrokuju transportna sredstva postaju sveona koriste. Specifi~no podru~je je transport u rudnicima, gdje Jedna od mogu}nosti da se smanji ekolo{ki teret u rudnicima ppredla`e rekonstrukciju izvorne dizel hidrauli~ne lokomotive DH 30 pogon. U toj rekonstrukciji, motor DC i asinhroni motor su prekonstrukcija pogona zna~i ne samo pobolj{anje ekolo{kih uslokori{tenja bio goriva koje se pravi od usjeva koji rastu na zaga|en
Klju~ne rije~i: rudarska lokomotiva, rekonstrukcija pogona, ok
PROPOSAL FOR RECONSTRUCTILOCOMOTIVE AIMED AT REDUC
ENVIRONMENTAL BUR
Juraj Gren~ík, PhD., Asiss. professor, University of @iliEngineering, Slovakia Stanislav Ku~era PhD., Asiss. professor, University of @Electrotechnical Engineering, Slovakia
SUMMARY
Environmental problems connected with transport means are bectheir utilisation. Very specific area is transport in mines where the One of the possibilities to reduce the ecological burden in msuggests a reconstruction of the original DH30 diesel-hydraulic loto a hybrid drive. In the reconstruction, a DC and an asynchronmotors. This reconstruction of drive means not only improvemenmine but also an ability of using bio-fuel made from crop that gre
Key words: mining locomotive, reconstruction of drive, environ
1. UVOD
U proteklih nekoliko godina pove}ali su se zahtjevi za kvalitetom okoli{a. Ova ~injenica je utjecala na kriterije aparata koji pretvaraju energiju iz uljnih proizvoda u vu~nu energiju. Rudarske lokomotive sa motorima sa sagorjevanjem, koji se mnogo koriste u rudarskoj kompaniji Hornonitrianske Bane, su tipi~an predstavnik proizvo|a~a pokretne emisije. Istra`ivanje i pra}enje ~estica dima u izduvnim gasovima, istra`ivanje mehani-zama njihovog nastajanja kao i njihov utjecaj na ljud-sko tijelo, te mogu}nosti njihovog smanjenja predsta-vljaju slo`en skup problema koje je neophodno rije{iti.
1. INTROD
Demands on increasing withimpact on critfrom oil produtives with comin The Hornontypical represeResearch and gases, researctheir influence for their reducis necessary to
- 227 -
IZVORNI NAU^NI RAD
ve}i u mnogim poljima gdje se su izduvni gasovi naro~ito {tetni. redstavljena je u ovom radu, koji u dvosistemski pogon i u hibridni redlo`eni kao vu~ni motori. Ova va u rudniku nego i sposobnost om tlu.
oli{
ON OF MINING TION OF THE DEN
na, Faculty of Mechanical
ilina, Faculty of
ORIGINAL SCIENTIFIC PAPERoming very urgent in many areas of exhaust gases are especially harmful. ines is presented in this paper that comotive into a two-system drive and ous motor are suggested as traction t of the ecological conditions in the w on contaminated soil.
ment
UCTION
the environmental quality have been in the last years. This fact evolved its eria of devices that convert the energy cts into traction energy. Mine locomo-bustion engines, which are widely used itrianske Bane (mining company), are a ntative of a moving emission producer. monitoring of smoke particles in exhaust h of mechanism of their creation and on human body as well as possibilities tion are a complex set of problems that solve.

Ma{instvo, 4 (6), 227 – 232, (2002) J.Gren~ik,...: PRIJEDLOG REKONSTRUKCIJE RUDARSKE...
To bi se moglo u~initi na dva na~ina: pove}avaju}i efikasnost i ventilacije i klimatizacije podzemnih prostora,
smanjuju}i emisiju.
Prva mogu}nost je ekonomski jako zahtijevna, te bi stoga trebalo razmotriti drugi prijedlog. Jedan na~in da se rije{i ovaj problem je upotreba dvosistemskog vu~nog pogona koji se napaja iz elektri~nog akumulatora.
In general these solutions could be made in two ways. by increasing the efficiency both ventilation and air conditioning of subterranean spaces
by decreasing the emissions.
The first possibility is highly economically demanding, therefore the second suggestion should be taken into consideration. One possible way of solution of this problem is using of a two-system traction drive powered from electric accumulator
2. PRIJEDLOG RJE[ENJA
2.1. Dvosistemski vu~ni pogon za lokomotivu DH 30
Uzimaju}i u obzir trenutnu ekonomsku situaciju, zaga|enje u rudnicima koje uzrokuju izduvni gasovi iz lokomotive DH 30 bi se u potpunosti mogli eliminirati samo rekonstrukcijom motora.
2. PROPOSED SOLUTION
2.1 Two-system traction drive for DH30 locomotive
Considering the present economic status, complete elimination of pollution in mining spaces caused by exhaust gases from the DH30 locomotive could only be done by reconstruction of its engine.
Slika 1. Osnovne dimenzije rudarske lokomotive DH 30 Figure 1. Basic dimensions of DH30 mining locomotive
Cilj rekonstrukcije je da se zamijeni motor sa sagorijevanjem i hidruali~kim prijenosom sa elektri~nim pogonom a da karakteristike zadr`e svoje vrijednosti. Slika 2 prikazuje {emu takve konstrukcije gdje je izvor energije elektri~na akumulatorska baterija. Baterije se ponovo pune dok motor radi na dijelu rute gdje je trola. Ko~enje upotrebom rekuperacije smanjuje potrebu za energijom i pove}ava kilometra`u vu~nih to~kova izme|u neophodnih profiliranja. Va`an parametar, koji su{tinski odre|uje dizajn vu~nih baterija, je vrijeme na tra~nicama bez role i potrebne energije. Za optimalniji dizajn vu~nog motora i drugih predlo`enih parametara lokomotive studije o radnom ciklusu, dinamici rada, radnoj otpornosti, profilu i nagibu tra~nice, optere}enju vozila, itd. bi se trebale raditi koriste}i kalkulacije vu~ne dinamike.
The aim of the reconstruction is to replace the combustion engine and hydraulic transmission with an electric drive while traction characteristics will remain at their values. Figure 2 shows a scheme of such reconstruction where the source of energy is an electric accumulator battery. The batteries are recharged while the motor operates on trolley section of a route. Braking with use of recuperation decreases demand for energy and extends the mileage of traction wheels between necessary reprofiling. An important parameter, which essentially determinates the actual design of traction batteries, is the time spent on tracks without trolley and their energy requirements. For more optimised design of traction motor and other proposed locomotive parameters, studies of working cycle, running dynamics, running resistance, track profile and its gradients, vehicle load, etc. should be done by using traction dynamics calculations.
- 228 -

Ma{instvo, 4 (6), 227 – 232, (2002) J.Gren~ik,...: PRIJEDLOG REKONSTRUKCIJE RUDARSKE...
Slika 2. [ema elektri~nih vu~nih kola rekonstruisane dvosistemske lokomotive DH 30
Figure 2. Scheme of electric traction circuits of the reconstructed, two-system DH30 locomotive
2.1.1. Pogon s vu~nim motorom DC Poznato je da se DC motori koriste u vu~nim aplikacijama. Koriste}i u~insku elektroniku mogu}e je osigurati potpunu funkcionalnost pogona, tako da se potpuna performanca elektri~nog motora postigne pri minimalnom energetskom optere}enju elektri~nih akumulatora. Visoko kvalitetni elektri~ni tranzistori (trenutno optere}enje 400 A, napon 120 V, galvanski odvojen upravlja~ki element uzbude u jednoj integrisanoj kutiji zajedno sa energetskim dijelom) i njihova sposobnost rada na frekvenciji od 20 kHz, koja je iznad ~ovjekovog ~ujnog nivoa, omogu}uje pouzdan rad i bez buke. Slika 3 prikazuje {emu spoja izme|u motora DC s nezavisnim pobu|ivanjem. Motor se pobu|uje iz ~etverokvadrantnog punja~a. Dvokvadrantni punja~ kontroli{e napon. Ova {ema se koristi u aplikacijama gdje je potrebna baza izmjene s pogonskog na ko~ni pogon.
2.1.1 Drive with DC traction motor Exploiting of DC motors in traction applications are well known. By using the power electronics it is possible to ensure a full functionality of a drive so that the full performance of an electric motor is obtained at a minimum energy loading of the electric accumulators. A high quality power transistors (current loading 400A, voltage 120V, galvanically separated control element excitement in one integrated box together with power part) and their ability of working at the frequency of 20 kHz, that is above a human hearing level, enable reliable and noiseless operation. Figure 3 shows a scheme of connection of the DC motor with independent exciter. Excitement of the motor is powered from a 4-quadrant changer. A 2-quadrant changer controls the voltage. This scheme is used in applications where quick changing from drive to braking regime is necessary.
Slika 3. [ema veze izme|u motora DC sa nezavisnim pobu|iva~em Figure 3. Scheme of connection of the DC motor with independent exciter
2.1.2. Pogon sa asinhronim vu~nim motorom Jednomotorni vu~ni pogon sa asinhronim motorom s rotorom kratkog strujnog kola se smatra jednim od najperspektivnijih za opseg izlaza od nekoliko W do MW.
2.1.2 Drive with an asynchronous traction motor A one-motor traction drive with an asynchronous motor with short circuit armature is regarded as one of the most perspective for an output range from several W up to MW.
- 229 -

Ma{instvo, 4 (6), 227 – 232, (2002) J.Gren~ik,...: PRIJEDLOG REKONSTRUKCIJE RUDARSKE...
Na osnovu izlaza, opsega regulacije, vrste optre}enja, karakteristikama kvadranta, dinami~kim zahtjevima itd. broj mogu}ih rje{enja raste. Svako rje{enje se od drugog razlikuje po vrsti konvertora frekvencije, na~inu kontrole i tehni~kim ure|ajima. U re`imu motora, konvertor modificira izlaz vrijednosti DC u vrijednosti AC druga~ije stope, fekvencije i broja faza. U slu~aju elektri~nih ko~nica motor postaje generator. [ema elektri~nih kola i kontrola asinhronog motora je na slici 4.
According to its output, regulation range, kind of loading, quadrant characteristics, dynamical requirements, etc., number of possible solutions arises. Each solution differs from one another with a kind of frequency converter, way of control and technical devices. In the motor regime the converter modifies input DC values to AC values of different rate, frequency and number of phases. In case of electric braking the motor changes to generator. A scheme of electric circuits and control of the asynchronous motor is in Figure 4.
Slika 4. Slika elektri~nih strujnih kola i kontrole asinhronog motora
Figure 4. Scheme of electric circuits and control of the asynchronous motor
2.2. Hibridni vu~ni pogon Elektropetrol i elektrodizel lokomotive se koriste ve} vi{e od 70 godina. Prva elektropetrol lokomotiva u Slova~koj uvedena je u rudniku Hodrusa 1928. godine. Izlaz ~etverotaktnog motora na petrol je bio 5,85 kW, a spojnog generatora 6,2 kW i proizvodio je napon od 380 V. Elektrodizel lokomotiva se prvi put upotrijebila u Slova~koj 1934. godine. Ovaj sistem vu~nog pogona se koristio do danas prema potebama transporta u rudniku. Predlo`ena rekonstrukcija rudarske lokomotive DH 30 se zasniva na sli~nom principu (prikazanom na slici 1). Princip ove rekonstrukcije je zamjena izvorne dizel hidrauli~ne pogonske jedinice sa elektro dizel akumulatorskom jedinicom gdje asinhroni motor ima ulogu vu~nog motora. Blok dijagram elektri~nog dijela ove rekonstrukcije prikazan je na slici 5. Ve}ina motora sa sagorijevanjem koji se ve} primjenjuju koriste te~no gorivo. Neki primjeri goriva koji se mogu koristiti kod motora sa sagorijevanjem su predstavljeni u tabeli 1.
2.2 Hybrid traction drive Using of electro-petrol and electro-diesel locomotives in mines has been used for more than 70 years. The first electro-petrol locomotive in Slovakia was introduced in The Mine Hodru{a in 1928. Output of a 4-stroke petrol engine was 5.85kW and a clutched dynamo had an output of 6.2kW that produced voltage of 380V. An Electro-diesel locomotive was used in Slovakia for the first time in the year of 1934. This system of traction drive has been used until present time according to the transport requirements in the mine. On the similar principle the proposed reconstruction of the DH30 mining locomotive is based (shown in Figure 1). The principle of this reconstruction is replacing of the original diesel-hydraulic drive unit with electro-diesel-accumulator unit where the asynchronous motor acts as the traction motor. A block diagram of the electrical part of this reconstruction is shown on Figure 5. Most of already applied combustion engines use liquid fuel. Some examples of fuels that can be used for combustion engines shows Table 1
- 230 -

Ma{instvo, 4 (6), 227 – 232, (2002) J.Gren~ik,...: PRIJEDLOG REKONSTRUKCIJE RUDARSKE...
Slika 5. Blok dijagram elektri~nog dijela rekonstrukcije Figure 5. Block diagram of the electrical part of this reconstruction
Tabela 1. Specifi~na energija razli~itih vrsti goriva Table 1. Specific energy of different types of fuel
Engine - Motor Fuel - Gorivo Energy - Energija [MJ.liter-1]
Efficiency - Efikasnost [%]
Elsbett- vegetable oil-ulje od povr}a 34.3 31.0 Diesel- MERO 31.1 28.1 Diesel- diesel 35.1 28.0 Alcohol- methanol 18.0 31.0 Alcohol- ethanol 21.1 30.0
3. DISTRIBUCIJA VU^NOG IZLAZA
Distribucija vu~nog izlaza bi se djelimi~no mogla uraditi u skladu sa individualnim potrebama korisnika ili u skladu sa programom kojeg proizvo|a~ prethodno definira. Autonomna kontrola mikroprocesorske jedinice za distribuciju vu~nog izlaza je opisana na slici 6.
3. DISTRIBUTION OF TRACTION OUTPUT Distribution of traction output could be done partially according to a user's individual requirements or according to predefined program defined by the manufacturer. An antonomous control of a microprocessor unit for the distribution of traction output is depicted in Figure 6.
Slika 6. a – normalan rad, b – pogon sa nedovoljnim kapacitetom akumulatora, c – pogon koji koristi sve energetske izvore, d – o`ivljavanje vu~nog izlaza
Figure 6. a- normal operation,, b- drive with insufficient accumulator capacity, c- drive using all energy sources, d- recuperation of traction output
U sistemu kontrole, informacija operatora se obra|uje zajedno sa informacijama o stanju zalihe izlaza, kovertoru impulsa, izmjenjiva~u i vu~nom motoru. Kontrola mora ispunjavati uslove koje iziskuju vu~ni motor i tehnologija transporta, {to uglavnom podrazumijeva kontrolu magnetnog toka u motoru i obrtni momenat. Za pogone koji se koriste u op}e svrhe obi~no se nalazi neko jeftino rje{enje bez senzora za brzinu i sa samo nekoliko ostalih senzora za elektri~ne vrijednosti.
In system of control, information from operator is processed together with information about a state of input supply, impulse converter, inverter and traction motor. The control must fulfil the specific requirements derived from a traction motor and from technology of transport. It means mainly the control of a magnetic flow in the motor and torque. Drives for general purposes are often dealt with a cheap solution without speed sensors and only with small number of other sensors for electrical values.
- 231 -

Ma{instvo, 4 (6), 210 – 216, (2002) J.Gren~ik,...: PRIJEDLOG REKONSTRUKCIJE RUDARSKE...
Za pogone sa dinami~kim uslovima vektorska kontrola je postala uobi~ajena. To daje mogu}nost kontrole magnetnog toka i obrtnog momenta u re`imu mirnog stanja kao i u prijelaznom stanju. Matemati~ka simulacija kontrolisanog vu~nog pogona sa asinhronim otkriva jako dobre dinami~ke karakteristike.
For drives with dynamic requirements a vector control has become common. This enables to control a magnetic flow and torque in steady-state regime as well as in transition state. Mathematical simulation of controlled traction drive with asynchronous motor reveals very good dynamical characteristics.
4. ZAKLJU^AK Sam rad rudarskih lokomotiva DH 30 i DH 100 uklju~uje velike tro{kove za adaptaciju radne sredine. Ovaj rad pokazuje da upotreba elektri~ne energije u vu~ne svrhe u mnogome elimini{e (hibridni sistem) ili gotovo u potpunosti smanjuje (dvosistemski pogon) {tetne utjecaje na radnu sredinu. Nekoliko opcija rekonstrukcije lokomotive DH 30 za dvosistemsku ili hibridnu elektri~nu vu~u omogu}ava kori{tenje asinhronog motora ili DC motora kao vu~nog motora. Kori{tenjem asinhronog motora oja~anog poluprovodnim konvertorom, problem pulsiraju}ih dijelova obrtnog momenta se rje{ava regulacijom. Ovakva rekonstrukcija tako|er zna~i i u{tedu energije. Ovaj sistem tako|er unapre|uje skladi{tenja i rukovanje uljnim proizvodima u rudniku. Jo{ jedna prednost osim pobolj{anja ekolo{kih uslova i u{tede energije je to {to Elabett motor koristi ulje od povr}a koje se mo`e proizvesti na zaga|enom tlu.
4. CONCLUSION Actual operation of DH30 and DH100 mine locomotives involves high costs for adaptation of working environment. This article shows that using of electrical energy for traction purposes highly eliminates (hybrid system) or almost completely reduces (two-system drive) harmful influences on working environment. Several options of reconstruction of the DH30 locomotive for two-system or hybrid electric traction enables to use an asynchronous motor or DC motor as a traction motor. By using the asynchronous motor powered from semiconductor converter the problem of pulsing parts of torque is dealt with regulation. This reconstruction also means energy saving. This system also improves storing and handling of oil product in the mine. Another advantage apart from improvement of the ecological conditions and energy saving is that, that the Elsbett engine uses vegetable oil which can be produced on contaminated soil.
5. LITERATURA - REFERENCES
[1] Ku~era, S., [ály, V.: Distribution of Power Output in the Hybrid Passenger Automobile. 23rd International Spring Seminar on Electronics Technology. Budapest 2000.
[2] Ku~era, S. a kol.: Výskum mo`nosti zní`enia ekologického zaťa`enia `ivotného prostredia efektívnym vyu`itím elektrickej trakcie v aplikáciách konven~nej a nekonven~nej dopravy, Výskumná správa -V[DS- @ilina, 1996.
[3] Ku~era, S., Michalík, J.: Elektrische Traktion und ihre Einfluß an die Untertagebergbauumwelt. IWKM, 98 – Band B – Moderne Energiesysteme. November 1998, Mittweida-Germany
[4] Ku~era, S. a kol.: Návrh osobného hybridného elektromobilu.Výskumná správa 031/602/2001. @ilinská univerzita v @iline EF - KTAE, @ilina 2001.
[5] Hlava, V., Kuku~a, P., Stuchl, V., Zvolensk, P.: Dopravný prostriedok a `ivotné prostredie, (Transport means and the environment), monograph, ES V[DS, @ilina 1996
[6] Gren~ík, J., Stuchlý, V., Zvolenský, P. : ”System Parameters of Rail Vehicle”, proceedings from 11th international conference “Pojazdy szynowe", June 1995, Krakow, Poland
- 232 -

Ma{instvo 4(6), 233 – 250, (2002) S.Ibrahimefendi},….: UTICAJ PROCESA PROIZVODNJE CELULOZE...
- 233 -
UTICAJ PROCESA PROIZVODNJE CELULOZE I PAPIRA NA ZAGA\ENJE OKOLINE
Doc. dr. Ibrahimefendi} Salim, dipl.ing., Fakultet za metalurgiju i materijale, Zenica Stani} Mirko, dipl.ing., "Natron" Maglaj d.d.
REZIME Tehnolo{ki proces proizvodnje celuloze i papira spada me|u ve}e zaga|iva~e `ivotne sredine, jer se odvijanje procesa vr{i, pored tro{enja energije, tro{enjem drvne mase i kemikalija koje se u toku procesa izdvajaju u okolinu. Intenzitet izdvajanja sumpornih spojeva zavisi od vrste tehnolo{kog procesa dobijanja vlakna (sulfatni, sulfitni, NSSC i dr.) stepena zatvorenosti regeneracionog kruga, vrste papira, kao i vo|enja tehnolo{kog procesa. U analizi uzro~nika zaga|iva~a u procesu proizvodnje celuloze i papira posebno mjesto zauzima energetski kompleks, gdje se izdvajaju sumporni spojevi u dimnim gasovima u {ljaki i ugljena pra{ina. U pogledu strategijskih Opredjeljenja za smanjenje emisije sumpornih spojeva iz energetskih kompleksa (ugljeni kotlovi) celuloze i papira postoji rje{enje u odsumporavanju dimnih gasova koje je skupo i primjenjuje se za ve}e eneregetske jedinice. Za proces proizvodnje celuloze i papira prethodno se moraju ispuniti osnovni uslovi: za stvaranje krugova za lugove, vlakna, vode, energiju, a time se u osnovi vr{i zatvaranje jednog dijela i kruga za sumporne spojeve, a nakon toga vr{i se sakupljanje i spaljivanje sumpornih spojeva. Na{a istra`ivanja su imala za cilj utvr|ivanje mjesta i veli~ine emisije u tehnolo{kom procesu proizvodnje sulfatne celuloze i natron papira, kao i opredjeljenja za izbor rje{enja kompletne za{tite u Tvornici "Natron" Maglaj. Dobiveni rezultati pokazuju da je mogu}e uz zajedni~ki rad sa proizvo|a~ima procesne opreme za za{titu, posti}i rezultate koji zadovoljavaju tehni~ke normative i zakonske propise o ~isto}i zraka.
Klju~ne rije~i: ekologija, emisija, sumporni spojevi, ekstrakcija, spaljivanje, stepen otpra{ivanja.
THE IMPACT OF WOOD-PULP AND PAPER PRODUCTION ON ENVIRONMENT POLLUTION
Ibrahimefendi} Salim, PhD Asiss. professor, Faculty of Metallurgy and materials in Zenica Stani} Mirko, Engineer, "Natron" Maglaj
SUMMARY The technological process of Wood-pulp and paper production is one of the greatest enironment polluers because of energy consumption. The consumption of wood and chemicals, some of which products are let out into environment. The intensity of removal of sulphur compounds depends on the type of technological process of wood-pulp production (suplhate, sulphite, NSSC, etc.), the degree of closed regeneration cycle, the type of paper and technological process operation. In the analsys of the cause of environment pollution in the wood-pulp and paper production, energetic plant, where sulphur compounds in the form of waste gases and slag as well as coal dust are separated has a specific role. The solution to the considerations to decrease the emission of sulphur compounds from the energetic plants (coal boilers) for pulp and paper production lies in de-sulphuring of the smoke gases, which is very expensive and is applied in greater energetic units. For pulp and paper production, the folowing conditions must be preliminary fullfiled: Cycle of liquors, wood pulp, water and energy, Cycle of sulphur after closing of these cycles, sulphur compounds are collected and burned. The aim of our experiments was to find places and volume of emission in pulp and paper production and to select the solution fora complete protection in the "Natron" Maglaj, Paper Production Plant. The results show that the joint work with the producers of safety equipment can result in achieving the satisfactory technical norms and legal regulations on air cleanness.
Key words: Ecology, emission, sulphur compounds, extraction, burn, degree of dustout.
ORIGINALNI NAU^NI RAD
ORIGINAL SCIENTIFIC PAPER

Ma{instvo 4(6), 233 – 250, (2002) S.Ibrahimefendi},….: UTICAJ PROCESA PROIZVODNJE CELULOZE...
- 234 -
1. ^OVJEK JE PRODUKT I STVARALAC SVOJE OKOLINE
^ovjek je produkt i stvaralac svoje okoline koja ga izdr`ava te mu omogu}uje intelektualni, dru{tveni i duhovni razvoj. U dugoj evoluciji ljudske rase na ovoj planeti, ~ovjek je dostigao takav stepen, koji je brzim razvojem nauke i tehnologije postao sposoban izmijeniti svoju okolinu na bezbroj na~ina i u neslu}enom obimu. Obje strane ~ovjekove okoline, prirodna i one koju je sam stvorio su bistvene za njegovu blagodat i u`ivanje osnovnih ~ovjekovih prava, a ponekad i na pravo na `ivot. Za{tita i o~uvanje okoline je najzna~ajniji faktor koji uti~e na dobrobit ljudi i na ekonomski razvoj cijelog svijeta (Deklaracija Konferencije OUN o ~ovjekovoj okolini 1972. godine). Industrija celuloze i papira u BiH po zavr{etku drugog svjetskog rata zapo~inje razvoj i u periodu od 10 do 15 godina izgra|ena je ve}ina dana{njih tvornica. Istina ovdje se radi o manjim kapacitetima u odnosu na svjetske i evropske tvornice celuloze i papira sa razli~itim tehnolo{kim postupcima (alkalni, kiseli, drvenja~e i dr.) pri ~emu su isporu~ioci opreme bili iz cijelog svijeta. U sklopu ovih postrojenja bila su instalirana postrojenja za pre~i{}avanje otpadnih voda, tehnolo{kih gasova i gasova sa tehnologijama koje su u to vrijeme bile u kori{tenju. Istina, zbog nedostatka finansijskih sredstava nisu se mogla kupiti kompletna postrojenja za pre~i{}avanje, a ponekad iz istih razloga nisu se mogla instalirati i pustiti u rad ve} kupljena postrojenja {to je industriju celuloze i papira uvrstilo u grupu ve}ih zaga|iva~a `ivotne sredine. U kompleksu proizvodnje vlakna i regeneracije kemikalija postojali su ure|aji za izdvajanje terpentina i da su isparljvi spojevi kao {to su: metil merkaptan, dimetil sulfit, dimetil bisulfid, sumpor vodik i sumporni dioksid slobodno odlazili u atmosferu. Konstrukcija lu`nih kotlova je bila razli~ita {to je ovisilo od koje je firme kupljen, a uglavnom su bile tri vrste kotlova (lu`nih): kotao sa ciklonskim upariva~ima, kotao sa kaskadnim upariva~em, kotao sa ve}im lo`i{tem. Upariva~ke baterije su na barometarskoj kondenzaciji imale i apsorpcione kolone, a kao te~nost se koristio bijeli lug. Skoro sve sulfatne tvornice su imale instalirane ure|aje za oksidaciju crnog luga razli~itih tipova izrade ~iji je stepen djelovanja bio nizak i radni vijek kratak. Rotacione pe}i su imale instalirane skrubere sa vodenom zavjesom, za proizvodnju energije kao sirovina je slu`io ugalj, dok je kod manjeg broja tvornica bio zastupljen mazut i gas za pre~i{}avanje dimnih gasova sa ugljenih kotlova pored elektrofiltera, bili su zastupljeni i neulticikloni ~iniji je stepen djelovanja bio znatno ni`i u odnosu na elektrofiltere.
1. MAN IS A PRODUCT AND CREATOR OF HIS ENVIRONMENT
In the long evolution of human race, great science and technology development has enabled man to change his environment in many ways. Bath parts of his environment, the natural and the one he has areated for himself, are essential for his wellbeing and practicing of basic human rights, and somitimes for the right to life itself. Protection of enviroment is the main factor which influences benefit and economic development all over the world (Declaration of UNITED NATIONS on Human Environment 1972.) Pulp and paper industry in Bosnia and Herzegovina starts developing after the Second World War and in the period from (1945 - 1960). Most of the factories today were built at that time. Naturally, these capacities are smaller compared to the European ones, with different technological processes (alkali, acid, NSSC, wood pulp.....) and different equipment producers from all over the world. In these factories much of equipment for tretment of waste waters and gases from that time was installed. The fact is that many factories were not in a position to buy complete equipment because of money. For that same reason, the equipment that had already been bought could hot have been installed and put to operation, which caused the wood-pulp and paper industry to be one of the biggest polluters of environment. In pulp production and chemical regeneration there was equipment for separation of terpentine and evaporable compounds such as methyl mercaptane, two-methyl sulfite, twomethyl bisulphite, sulphur hydrogen, so that sulphur compounds went directly to atmosphere. The construction of recovery boilers depends on producer but there are three main types:
- Boiler with cyclone evaporators - Boiler with cascade evaporators and - Boiler with big fire - box
Evaporator batteries on the barometric condensation also had absorption columns, and the liquid used was white liquor. Almost all sulphate factories installed the equipment for oxidation of black liquor of different types with a small degree of work and short working life. Lime kilns had scrubbers with water curtain installed. For energy production they used coal and in a small number of factories masut and natural gas were used. Waste gas treatment from coal boilers had electric filters with bigger degree of work and multicyclons with smaller degree of work as well.

Ma{instvo 4(6), 233 – 250, (2002) S.Ibrahimefendi},….: UTICAJ PROCESA PROIZVODNJE CELULOZE...
- 235 -
Rje{avanje pre~i{}avanja otpadnih voda je bilo razli~ito zastupljeno kod tvornica, no, za ve}inu tvornica celuloze i papira se moglo konstatovati da uop{te nisu posjedovale ure|aje s tim ako su radila stepen pre~i{}avanja je bio nizak. Uskladi{tenje krutih materija iz procesa kao {to su kora, piljevina, {ljake sa ugljenih kotlova, anorganske materije iz kaustike i rotacione pe}i su se uskladi{tavale u blizini tvornica, uz obalu rijeka u neposrednoj blizini naselja i dr., {to je davalo karakteristi~no obilje`je regiona (mirisi, smanjenje profila, korita rijeke). Regeneracioni ciklus je kod sulfatnih tvornica u ve}em obimu bio zatvoren dok je kod sulfitnih tvornica bio otvoren. Me|utim, ubrzani razvoj celulozno-papirne industrije u svijetu, kao i pove}ani zahtjevi za kvalitet otpadne vode i tla su uvjetovali da se kod ve}ine tvornica celuloze i papira izvr{i modernizacija postrojenja i pro{irenje kapaciteta, ali uz rje{avanje za{tite `ivotne sredine. I u ovom slu~aju se ponovila prethodna situacija u poslovima rekonstrukcije u~estvovao je veliki broj firmi sa razli~itim rje{enjima u tehnologiji i za{titi `ivotne sredine. Stanje za{tite `ivotne sredine kod ve}eg broja tvornica celuloze i papira se pobolj{ava jer se najve}i dio investicionih zahvata ve} priveo kraju dok se drugi dio tvornica sprema da izvr{i modernizaciju ure|aja uklju~uju}i i ekonomsko kori{tenje otpadnih materja. Za industriju celuloze i papira, a posebno kraft celuloze, zaga|enje vazduha i vode predstavlja vrlo ozbiljan problem. Stvaranju neugodnih mirisa kod sulfatnog postupka doprinose slijede}e komponente sumpora: - metil merkaptan (CH3SH), dimetil sulfid (CH3)2S), dimetil disulfid (CH3)2S2 i hidrogen (H2S), koji izlaze u vidu gasova i kondenzata. Prva tri se stvaraju uglavnom za vrijeme kuhanja, dok hidrogen sulfid ulazi u proces sa lu`inom za kuhanje. Postoje dva razli~ita principa za smanjenje ovih emisija sa neugodnim mirisom, i to: 1) smanjenje koli~ine organskih sumpornih komponenata stvorenih u kuha~u, i 2) uni{tavanje gasova i kondenzata koji sadr`e sumpor procesom gorenja, oksidacije, apsorpcije i sl. Od ovih metoda u praksi se primjenjuje jedino posljednja. Prvi preduslov za smanjenje komponenata koje stvaraju neugodne mirise za vrijeme kuhanja je dobro poznavanje reakcije koje vode stvaranju pomenutih komponenata. Drugi preduslov je da se kraft proces modificira. Razli~iti na~ini kuhanja uti~u na stvaranje gore pomenutih sumpornih komponenata. Slijede}e ta~ke objedinjuju najva`nije rezultate: 1. Sulfidni ioni i metoksil grupe drveta su reaktanti za stvaranje organskih sumpornih komponenata. 2. Oko 15 – 25 % organskih sumpornih komponenata stvara se u periodu zagrijavanja do maksimalne temperature (170 o C).
Waste water tretment is different with different wood-pulp and paper factories, but in fact, a great number of factories did not have the equipment for treatment or if they did have it, it worked with a small degree of cleaning. Solid materials from process such as bark, saw-mill waste, slag from coil boilers, anorganic materials from causticizing and lime kiln storaged near factories, river coasts or citles, which gave a specific characterics to the region (odour, relief, river) bed. Most of the regeneration cycle in sulphate factories was closed,and in sulpite factories it was mostly opened. Fast develoment of pulp and paper production in the world also increases demands for quality of waste waters and ground. It conditioned modernization in many factories of pulp and paper with better protection of environment. In the reconstruction of factories, many companies with different plans and equipments were included. Enviroment protection in many pulp and paper factories increased and great number of investitment work is finished. Other factories make plans for modernisation and economic use of waste materials. For pulp and paper industry and specially kraft pulp, air and water pollution is a very serious problem. Unpleasant odour in sulphate pulp production to sulphur compounds contribute. These are: - methyl mercaptane (CH3SH), two methyl sulfite (CH3)2, two methyl two sulfite (CH3)2 S2 and sulphur hydrogen (H2S), which form gases and condensate. First three are produced during the cooking process whereas H2S enters in the process with alcalies. There are two different ways to reduce the emission of the unpleasant odour: 1. By decreasing of organic sulphur compounds in cooking. 2. By destruction of gases and condensate which contain sulphur through burning, oxidation, absorption and similar. Only the last method is applied in practice. The first precondition to decrease compaunds which have unpleasant odour in the cooking process is to known well the reactions which form sulphur compounds. The next precondition is modification of the process. The following items combine the most important results: 1. Sulphide jons and methoxil groups from wood form organic sulphur compounds 2. 15 - 25 % of organic sulphur compounds are formed in the heating process up to the max. temperature of (170° oC).

Ma{instvo 4(6), 233 – 250, (2002) S.Ibrahimefendi},….: UTICAJ PROCESA PROIZVODNJE CELULOZE...
- 236 -
3. Izme|u koli~ine stvorenih sumpornih komponenata i koncentracije sumpora postoji odre|en (ta~an) odnos. 4. Rastvoreni lignin je osjetljiviji na demetilaciju nego lignin u ~vrstom stanju. 5. Proces kraft kuhanja tvrdog drveta daje 80 – 100 % vi{e organskih sumpornih komponenata nego kraft kuhanje mekog drveta. 6. maksimalna temperatura ne uti~e mnogo na stvaranje ovih komponenata, ona je ~ak ne{to povoljnija.
3. The quantity of sulphur compounds and sulphur concentration have a fixed proportion 4. Dissolved lignin is more sensitive to demethylization than solid lignin 5. Kraft cooking of hardwood forms gives 80 - 100 % more sulphur compound than softwood 6. Max. temperature has no influence on forming of sulphur compounds
Smanjenje neugodnih mirisa Za redukciju ili uklanjanje neugodnih mirisa postoje razni postupci ~iji su efekti razli~iti. Jedan broj patentiranih rje{enja nije mogao na}i primjenu, dok su danas u kori{tenju slijede}i postupci: - oksidacija rijetkog ili gustog crnog luga - gorenje gasova sa sumpornim komponentama - apsorpcija i ekstrakcija i stripovanje
kondenzata. OKIDACIJA CRNOG LUGA Gubici sumpora za vrijeme uparavanja crnog luga su veliki i zapravo ovi spojevi zaga|uju okolinu. Kada se crni lug izlo`i uticaju kisika ili zraka za izvjesno vrijeme kod 20o C, sadr`aj sumporvodika i merkaptana se smanjuje kako slijedi: Od 1,180 gr H2S i 1,108 CH3SH na litra na 0,243 i 0,051 gr poslije 62 sata i 0,059 gr i 0,00 grama poslije 260 sati. Proces oksidacije se odvija br`e kod vi{e temperature (800 C), egsoterman je i mo`e se prikazati po slijede}oj jednakosti: 2Na2S+202+H2O=Na2S2O3+ 2 NaOH + 215,3 cal. Oslobo|ena toplota za vrijeme oksidacije crnog luga iznosi 2 % njegove kalori~ne vrijednosti i kod sadr`aja natrijum sulfida 1 gr na litra.
GORENJE - SAGORIJEVANJE Danas je poznato da se pomo}u sagorijevanja mogu uni{titi sumporne komponente u gasnim emisijama. Nedostatak ovog postupka je opasnost od eventualnih eksplozija. Reducirani sumporni spojevi i terpentin unutar {irokog koncentracionog podru~ja stvaraju se svakom eksplozivne mje{avine. Va`e slijede}e granice eksplozije:
REDUCTION OF UNPLEASANT ODOUR For reduction or elimination of unpleasant odour there are many different ways with different effects. Some pattents are not in function yet. Today, the followint methods are used: - oxidation of dilluted or dense black lye, - burning of gases with sulphur components and - absorption, extraction and stripping of
condensate Black lye oxidation Loss of sulphur in the course of euaporation of black lye is big and these compounds pollute environment. When black lye is in contact with oxygen and air on 20° o C, the content of H2S and mercaptane decreases as follows: 1.180 g/lit. → H2S 0.243 g after 62 hours →→ 0.0 after 260 hours 1.108 g/lit. CH3SH →→0.051 g after 62 hours →→ 0.059 after 260 hours The oxidation process is faster higher temperatures (80° oC). It is exothermic and can be presented by the following equation: 2Na2S+202+H20=Na2S203 + 2Na 0H + 215,3 cal. Free heat in the oxidation process of black lye is 2% of the total caloric value, ancl with the natrium sulphid it is 1 gr/lit. BURNING - COMBUSTION Today it is well known that with burning the sulphur componentsin gas emission can be destroyed. The disadventage of this process is a danger of explosion. Reduced sulphur components and terpentine create an explosion mixture. The following explosion limits are valid:

Ma{instvo 4(6), 233 – 250, (2002) S.Ibrahimefendi},….: UTICAJ PROCESA PROIZVODNJE CELULOZE...
- 237 -
Kind of material Eksplozivno podru~je u zraku, Explosion range in air
procent volumena %, % of volume
- H2S 4,3 - 45 ,5 - CH3SH 2,2 - 9,2 - (CH3) 2S 3,9 - 21,8 - (CH3) 2S2 - - terpentin 0,8
Unutar podru~ja eksplozije se mo`e javiti eksplozija, djelimi~no spontano, kada temperatura poraste iznad 220oC, djelimi~no putem varnice ili otvorenog plamena. U jednom sistemu za sakupljanje, sistemu za transportovanje gasova postoji latentna opasnost od eksplozije. To zna~i da se gasovi moraju zadr`ati u odnosima mje{anja sa zrakom, koje ne odgovaraju eksplozivnim smjesama. To se posti`e da se gasovi koncentri{u ili da se zadr`avaju preko gornje eksplozivne granice ili da se razrijede zrakom ispod donje granice eksplozije. Kod gasova iz kuhaone koli~ine gasova i spojeva su veoma promjenljive i upravo na ovim dijelovima mogu se dogoditi eksplozije. APSORPCIJA I EKSTRAKCIJA Metil merkaptan i sumporvodonik se lako apsorbuju u alkalijama, dok su organski sulfidi nepolarnog karaktera. Kisele komponenete u ispusnim gasovima apsorbiraju se u alkalijama, a komponente koje se ne rastvaraju u vodi, izdvajaju se sa pogodnim solventom kao {to u terpentin i pogonsko ulje. Organski sulfidi mogu se poslije regenerirati.
STRIPOVANJE KONDENZATA Stripovanje kondenzata zrakom i parom su poznate kao metode za otklanjanje sumpornih spojeva iz otpadnih voda. Za prvi postupak – stripovanje sa zrakom ocjenjuje se da ima prednost zbog teku}ih tro{kova, dok kod drugog postupka posti`e se ve}i stepen odvajanja sumpornih spojeva iz kondenzata ~ime se umanjuje BPK-i i KPK i pove}a stepen izdvajanja terpentina. Ukoliko se proces stripovanja vr{i u vakumu tada se smanjuje potro{nja pare. Na proces stripovanja dovode se kondenzati i upariva~ke baterije u petefektnom isparavanju za put luga 4-5-3-2-1 efekat 5 daje kondenzat za stripovanje, u ~etverostepenom efektnom isparavanju za put luga 3-4-1-2 obra|uje se kondenzat sa efekta 4) i kondenzat iz kuhaone. Sumporni spojevi se vode na sagorijevanju dok se pre~i{}ena voda vra}a u tehnolo{ki proces. Za proces je potrebno cca 0,2 t niskotla~ne pare za tonu kondenzata, da bi se reducirao sadr`aj metanola sa 90 %, terpentina sa 95 % i sumpornih spojeva sa 97 %.
Within the explosion range, an explosion can occur, partially sponteneously, when the temperature reaches above 2200C, partially because of sparks or open flame. In the system of collecting and transporting gases there is always a latent danger of explosion. That means that gases must be in mixture with air in a range which is not near explosion range. It is achieved by concentrating gases or keeping the gases beyond the explosion range, of by dissolving them with air bellow the lower explosion range. Gases and compounds from cooking plants are very dangeraus and it is these in this production parts that explosion can take place. ABSORPTION AND EXTRACTION Methyl mercaptane and sulphur hydrogen are easily absorbed in alkalies whereas organic sulphides are of unpolar character. Acid components from outlet gases are absorbed in alkalies but the componens which are not dissolved in water can be separated with suitable solvent in terpenting andfuel oil. If the process of stripping is in vacuum, the steam consumption is smaller. STRIPPING CONDENSATES In the stripping process condensates and evaporation batteries are introduced in five evaporation for the way of the lay 4-5-3-2-1. The effect 5 gives condensate for stripping, in the four step effect evaporation for the way of lay 3-4-1-2. The condensate from the effect 4 and the condensate from the cooking plants, are treated Sulphur compound are treated with burning and the cleaning water is put back in the technological process. For this process, cca 0,2 t low pressure steam per ton of condensate is needed to reduce the content of methanol for 90 %, terpentine for 95 % sulphur compounds for 97%.

Ma{instvo 4(6), 233 – 250, (2002) S.Ibrahimefendi},….: UTICAJ PROCESA PROIZVODNJE CELULOZE...
- 238 -
2. SITUACIJA U TVORNICI "NATRON" MAGLAJ
Instalirani kapacitet proizvodnje ~etinarske nebijeljene sulfatne celuloze iznosi 100.000 tona godi{nje, odnosno 117.000 tona natron papira uz finalizaciju natron papira u natron vre}e i proizvodnju valovite ljepenke i ambala`e od valovite ljepenke. Kao sirovina se koristi ~etinarsko drvo i u manjem obimu stari papir. Proces proizvodnje se odvija diskontinuirano u dvije neovisne tehnolo{ke linije. Izvori zaga|enja su: 1. Kompleks energetike 2. Tehnolo{ki proces U kompleksu Energane nalaze se tri ugljena kotla koji proizvode paru od 4.300 KPa i 4300 C. Kotlovi su opremljeni sa mlinovima tako da je lo`enje sa ugljenom pra{inom. Dimni gasovi po izlazu iz kotla se ~iste u multiciklonima, a zatim izbacuju u atmosferu kroz dimnjak visine 104 m. U tehnolo{kom procesu, izvori zaga|enja su: lu`ni kotlovi, kuha~i, upariva~ke baterije i roto pe}i. Instalirana su tri lu`na kotla slijede}ih kapaciteta proizvodnje pare: - LUKO – I ima proizvodnju 16 t/h pare - LUKO – II ima proizvodnju 32,4 t/h pare. Na tri kotla se proizvodi para od 4.300 KPa i 4300 C. Kao gorivo se upotrebljava ugu{}eni crni lug sa 55 – 65 %. Kao gorivo se upotrebljava ugu{}eni crni lug sa 55 – 65 suhe supstance. Ugu{}ivanje crnog luga se vr{i u vi{e stepenim upariva~kim baterijama, a ugu{}enom crnom lugu se dodaje natrijum sulfat kao nadoknada za izgubljene alkalije u sistemu. Dimni gasovi kotlovi se ~iste u elektrofilterima i izdvojena pra{ina se zajedno sa svje`im natrijum sulfatom dodaje u ugu{}eni crni lug prije sagorijevanja. U obje diskontinuirane linije za proizvodnju celuloze, vr{i se izdvajanje sirovog sulfatnog terpentina, a u regeneraciji alkalija vr{i se izdvajanje sirovog sulfatnog sapuna i oksidacija rijetkog crnog luga. Ure|aj je tipa "Achen Troebeck" dobro poznat po jednostavnosti rada i uz maksimalnu pa`nju postizan je stepen aksidacije do 70 %. Na tehnolo{koj {emi br.1. dana su mjesta nastajanja emisije krutih tvari i sumpornih spojeva, a u tabeli br. 1 i 2 pregled raspodjele emisije sumpornih spojeva i analiza mjesta emisije. Kao osnov izrade bilanse sumpora, uzeta je vrijednost da se za proizvodnju jedne takve celuloze tro{ki 80 kg natrijum sulfata i stehiometrijski izra~unat sumpor je pra}en kroz proces i mjerenja na mjestu emisija.
2. SITUATION IN THE "NATRON" MAGLAJ FACTORY
In the "Natron" Maglaj two pulp plants for production of unbleached softwood sulphate pulp are installed, with capacity of 100.000 tons/year. The paper production is about 140.000 tons/year with final sacks and corrugated boxes productions. Raw material is softwood and a small percent of waste paper.
The sources of pollution are: 1. Energetic plant and 2. Technological process
In an energetic plant, there are coal boilers which produce steam with 4.300 kPa and 430ºC. Every coal boiler has grinders and the burning is done with coal dust. The gases from boiler are cleaned in multicyclones and after that put into atmosphere through a 104 m long chimney (104 m). In a technological process, the sources of pollution are: recovery boiler, cookers, evaporation plant and lime kiln. The capacities of the recovery boilers are: - the recovery boiler 1 with the production of 16 tons/hour of steam and - the recovery boiler 2 with the production of 32.4 tons/hour of steam. The three boilers produce the steam of 4.300 kPa and 430ºC. Fuel is black lay with 55 - 65% dry content. The black lay densed in evaporation plant and the natrium sulphate put into the process as refund for lost alkalies from system. Gases are cleaned in electric filters and dust with fresh natrium sulphate is added to densed black lay before burning. In both lines of pulp plants, the separation of crude sulphate terpentine is done. In alkali regeneration crude sulphate is separated soap and oxidation dilluted black lay is oxidated. The equipment is of the "ACHEN TROEBECK" type which is known as simple and with maximum care the oxidation can reach 70%. Diagram 1 presents the locations of emission of solid materials and sulphur compounds. The table 1 and 2 present a is review distribution of sulphur compounds emission and analysis locations of emission. The basis of calculation of sulphur balance, was the value of 80 kg of natrium sulphate per tone production of wood-pulp. The basis of calculation of sulphur balance, was the value of 80 kg of natrium sulphate per tone production of wood-pulp. The stehometricy calculated sulphur was followed in process and measured on locations of emission.

Ma{instvo 4(6), 233 – 250, (2002) S.Ibrahimefendi},….: UTICAJ PROCESA PROIZVODNJE CELULOZE...
- 239 -
Otpadne vode iz kompleksa vlakna i papira se nisu pre~i{}avale, a {ljaka sa ugljenih kotlova zajedno sa ciklonskim pepelom se bacala u rijeku Bosnu.
Waste waters from wood-pulp and paper plants were not treated and the slag from coal boilers with cyclone dust was discharged put into the river Bosnia.
Tabela broj 1. Raspodjela emisije sumpornih spojeva (izra`eno kao kg s/t celuloze) iz tehnolo{kog procesa i lu`nih kotlova. Table 1. Location of emission
Lu`ni kotao br. 2. Recovery boiler 2
Lu`ni kotao br. 3. Recovery boiler 3
- Odlazi u vodu - Go in water 2.4 2.4 - Ve`e se na ~estice - Connect with particles 2.4 2.4 - Nekontrolisana H2S emisija - Uncontrolled H2S emission 1.7 1.7 - Nekontrilisana SO2 emisija - Uncontrolled S02 emission 1.5 1.5 - Emisija kroz dimnjak H2S - Emission by chimney H2S - 6.0
- Emisija kroz dimnjak SO2 - Emission by chimney S02 10 4.0
Analiza emisije - Annual value emission Tabela 2. Godi{nja vrijednost emisije iz Tvornice "Natron" prema visini emitovanja (t/god.) Table 2. Annual value emission from the "Natron" Maglaj according to the level of emission (tons/year).
POLUTANT Visina emitovanja high of emission SO2 H2S
^vrste ~estice Solid particles
104 m 6687 - 13.071 36 m 358 323 308
cca 20 m 339 200 -
UKUPNO - TOTAL 7.384 523 13.379
Podaci iz tabele upu}uju na zaklju~ak: - Misija ~vrstih ~estica je prekomjerna zbog
slabog rada multiciklona i radi se o 2 – 12 puta prekora~enja 375 mg/Nm3.
- Najve}i dio emisije SO2 se izbacuje na velikoj visini {to je ispravno rje{enje, ali je problemati~na emisija samo na izvorima manje visine.
- S obzirom da H2S ima toksi~nost 15 – 20 puta ve}u od SO2, a emituje se na malim visinama, zaklju~ak je da je ovaj polutant najzna~ajniji za uklanjanje iz gasova.
Program rekonstrukcije i modernizacije postrojenja u Tvornici "Natron" Maglaj je predvidio pred pove}anje proizvodnje ~etinarske sulfatne nebijeljene celulozna 120.000 tona godi{nje i natron papira na 165.000 t ve}i stepen finalizacije u natron vre}e, a u isto vrijeme ugradnja postrojenja za pre~i{}avanje dimnih gasova i tehnolo{kih gasova i otpadnih voda. Nova kontinuirana linija proizvodnje vlakna – "Kamyr" kuha~ sadr`i i dio postrojenja za izdvajanje sirivog terpentina.
From it the above table the following can be concluded: - The emission of solid particles is excessive because of bad work of multicyclons and the excessive hess is 2-12 times bigger than 375 mg/Nm³ . - The biggest part of emission of S02 is ejected of high altitude and that is a good solution but the problem is emission on the sources of low altitude. - H2S has 15-20 times bigger toxic value than S02. The emission is at low altitude. The conclusion is that this pollutant is the most interesting for elimination from gases. The Programme of reconstruction and modernisation of the factory "Natron" Maglaj has foreseen an increasing wood-pulp production of up to 120,000 tons/year and all types of papers, 165.000 tons/year, bigger finalisation in product sacks, corrugated board boxes and better treatment of waste waters and gases. The New "Kamyr" pulp line has the equipment for elimination of raw terpentine.

Ma{instvo 4(6), 233 – 250, (2002) S.Ibrahimefendi},….: UTICAJ PROCESA PROIZVODNJE CELULOZE...
- 240 -
Umjesto tri lu`na kotla, isplaniran je novi lu`ni kotao ve}eg kapaciteta – 80 t/h pare KPa ugljeni kotao 100 t/h pare – 6.100 KPa i 4600 C sa elektrofilterima, a na lu`nom kotlu je instaliran i skruber za pranje dimnih gasova. Na ugljenim kotlovima broj 1, 2 i 3 su instalirani elektrofilteri, a {ljake i elektrofilterski pepeo }e se hidrauli~ki transportovati na deponiju udaljenu nekoliko kilometara od Tvornice. Ra~una se da postoji cca 33.000 Nm3/h tehnolo{kih gasova od ~ega su gasovi iz kontinuirane kuhaone cca 670 Nm3/h i diskontinuirane kuhaone cca 351 Nm3/h = l.021 Nm3/h vode na posebnu pe} za spaljivanje. Preostali dio tehnolo{kih gasova se vodi na dvije rotacione pe}i gdje su ugra|eni posebni gorionici. Ure|aj za sakupljanje, pre~i{}avanje tehnolo{kih gasova je isporu~ila japanska firma "Hitachi", a pe} za spaljivanje gasova kanadska firma "AB Lundberg". Ranije nabavljeni ure|aji za biolo{ko pre~i{}avanje otpadnih voda od japanske firme "Ebara Infilco" }e pre~i{}avati cca 5.250 – 5.500 m3/h uz postizanje slijede}ih vrijednosti BPK5 25 – 30 mg/l suspendovane materije 15 – 20 mg/l, bez mirisa, boje i vidljivih materija u vodi. Dio vode }e se ponovo vra}ati u tehnolo{ki proces. Na tehnolo{koj {emi broj 2 data su mjesta nastajanja emisije krutih tvari i sumpornih spojeva nakon rekonstrukcije i modernizacije postrojenja, a na dijagramu broj 1 je dat prikaz veli~ine emisije prije i nakon rekonstrukcije. Ispitivanje sadr`aja sumpornih spojeva u tehnolo{kim i energetskim gasovima je izvr{io Institut – Savezni centar za za{titu i obrazovanje u Tuzli, a odre|ivanje efikasnosti stepena djelovanja elektrofiltera Ma{inski fakultet iz Sarajeva, Institut za elektroprivredu iz Zagreba.
Instead of three recovery boilers, new recovery boilers has been installed bigger capacity, of 80 tons/hour 6.100 kPa, coal boiler 100 tons/hour 6.100 kPa and 460ºC with electric filters. On the recovery boiler, we installed scruber for washing gases. On coal boilers 1,2 and 3, we installed electric filters. Slag and dust from the electric filter are transported to deposit site 2km alway from factory. It is calculated there is cca 33.000 Nm² /hour of technological gases. Out of that, there are cca 650 Nm3/h of gases from the continuing cooking plant, and cca 351 Nm3/h from the discontinning cooking plant, which is 1,021 Nm3/h of water for a special furnace for burning. The remaining parz of technological gases are put to lime kiln with special burn equipment. The equipment for collecting and cleaning of technological gases is "HITACHI" from Japan, the furnace for burning is "AB LUNDBERG" CANADA . The equipment for biological tretment of waste waters is "EBARA INFILICO" with the capacity of 5.250 - 5.500 Nm³ / hour with realization BPK5 25-30 mg/lit, of suspended material. 15-20 mg/lit. without odour, colour and visible material in water. A part of the cleaning water is returned into the technological process. Diagram 2 presents the places of emission of solid materials and sulphur compounds after the reconstruction and modernisation. Diagram 1 presents the value of emission before and after reconstruction. The research content of sulphur compounds in technological and energetic gases worked, Federal Center for Environmental and Education in Mining and Industry Tuzla and the Institute for Electricity Supply Zagreb.
2.1. Ispitivanje stepena efikasnosti elektrofiltera na ugljenim kotlovima UKO-1 i UKO-2
Ispitivanja su obuhvatila slijede}e vrijednosti: - volumni protok dimnih gasova kroz mjerne
presjeke - temperatura dimnih gasova - tlak dimnih gasova - sadr`aj O2 i CO2 u dimnim gasovima - koncentracija praha u dimnim gasovima. Na osnovu izmjerenih vrijednosti, odre|ene su vrijednosti: - uk=98,85% izmjereni stepen efikasnosti ure|aja - ukg = 98,71 % garantovani stepen efikasnosti u radnim uslovima - E = 0,051 gr/Nm3 izmjerena emisija praha - Eg = 0,098 gr/Nm3 garantovana maksimalna emisija praha u radnim uslovima. - Prema tome mo`e se dati slijede}i zaklju~ak:
2.1. Research a the percent of working effective of the eletric filters in the coal boilers 1 and 2
The Research consists of these values: - volume flow of waste gases by measured
diametars. - temperature of waste gases, - pressure of waste gases, - content of 02 and CO2 in waste gases and - concentration of dust in waste gaste . Based on the measured values, we determined following values: - uk = 98.85 %, the measured percent of the equipment efficiency, - ukg = 98.71 %, the guaranteed percent of the eqipment efficiency in working conditions, - E = 0.051 gr/Nm³, the measured emission of dust, - Eg = 0.098 gr/Nm³ , the guaranteed maximal emission of dust in working conditions. Based on this, we can conclude:

Ma{instvo 4(6), 233 – 250, (2002) S.Ibrahimefendi},….: UTICAJ PROCESA PROIZVODNJE CELULOZE...
- 241 -
a) Stepen efikasnosti Izmjereni stepen efikasnosti elektro filtera je ve}i nego je garancijski stepen efikasnosti, {to navodi na zaklju~ak da ugra|eni ure|aj ima tra`ene tehni~ke karakteristike. b) Emisija Izmjerena emisija praha je manja od garantovane vrijednosti za eksplotacione uslove GVE = 0,150 gr/Nm3 njema~ke norme GvE = 0,200 gr/Nm3 va`e}i propisi u BiH.
a) efficiency percentage The measured percent of the electric filters efficiency is bigger than the guaranteed value, which means that the equipment has possesses the reguired technical characteristics. b) Emission The measured emission of dust is smaller than the guaranteed value for working conditions GVE = 0.150 gr/Nm³ of the German norm GvE = 0.200 gr/Nm³ validity the norm currently in effect in Bosnia and Herzegovina
2.2. Ispitivanje stepena efikasnosti elektrofiltera na ugljenom kotlu broj 3 Ispitivanja su obuhvatila slijede}e vrijednosti:
- koli~ine dimnih gasova, - temperatura dimnih gasova, - pritisak dimnih gasova, - sastav dimnih gasova (CO2 i O2) i - koncentracija ~vrstih ~estica.
Na osnovu izmjerenih rezultata dobivene su slijede}e vrijednosti: - uk=99,615% izmjereni stepen efikasnosti ure|aja - ukg = 99,80 garantovani stepen efikasnosti
ure|aja u radnim uslovima - E = 0,110 gr/Nm3 izmjerena emisija praha - Eg=0,150 gr/Nm3 pri 6% O2 u radnim uslovima. Prema tome mo`e se dati slijede}i zaklju~ak: a) Stepen efikasnosti Izmjereni stepen efikasnosti elektro – filtera, ve}i je od garancijskog stepena efikasnosti, {to navodi na zaklju~ak da ugra|eni ure|aj ima tra`ene tehni~ke karakteristike. b) Emisija Izmjerena emisija praha je manja od garantovane vrijednosti za ekspolatacione uslove.
2.2. Research of the procentage of the electric filter efficiency on the coal boiler 3 The research consisted of these following values:
- quantity of waste gases, - temeperature of waste gases, - presure of waste gases, - structure of waste gases (C02 and 02), - concentration of solid particles.
Based on the measured results, we determined following values: - uk=99.615%, the measured percent of equipment, - ukg = 99.80 %, the guaranted percent of
equipment efficiency in working conditions, - E= .110 gr/Nm³, the measured emission of dust, - Eg = 0.150 gr/Nm³ , at 6% of 02 in working
conditions. Based on this, we can conclude: a) Efficiency percentage The measured electric filter efficiency is bigger than the guaranteed value, which means that the equipment possesses the required technical characteristics. b) Emission The measured emission of dust is smaller than the guaranteed value for working conditions.
2.3. Ispitivanje stepena efikasnosti elektro filtera na novom ugljenom kotlu br. 4
Osnovne karakteristike ugljenog kotla broj 4 su slijede}e: - Pritisak pare na izlazu iz kotla 6.100 KPa - Temperatura pare na izlazu iz kotla 4600 C - Sposobnost mljevenja OH > 60 - Dijelovi drveta % < 10 - Granulacija mm 0 - 50
2.3. Research on the percent of the electric filter working efficiency on the coal boiler 4
The main characteristics of a coal boiler 4 are: - pressure of steam (outlet) 6.100 kPa and - temperature of steam (outlet) 460ºC.
- Grinding ability OH>60 - Wood parts % < 10 - Granulation mm 0 - 50

Ma{instvo 4(6), 233 – 250, (2002) S.Ibrahimefendi},….: UTICAJ PROCESA PROIZVODNJE CELULOZE...
- 242 -
Tabela 3. Karakteristike lignita i mrkog uglja Table 3. Content of the lignite and brown cool
Gorivo - Fuel Lignit - Lignite Mrki ugalj – Brown coal
Donja ogrevna vrijednost - Low fuel value 2.200 kcal/kg 4.500 kcal:kg pepeo - Dust 15,12 13,45 voda - Water 44,17 18,28 ugljik - Carbon 25,82 49,47 vodik - Hidrogen 2,66 3,86 sumpor - Sulphur 0,32 0,79 kisik - Oxigen 10,91 13,22 du{ik - Nytrogen 1,00 0,93
Uz ugljeni kotao je instaliran elektro – filter sa slijede}im karakteristikama: - Stupanj otpra{ivanja 99,36 % - Sadr`aj pra{ine u ~istom gasu poslije
elektrofiltera uz 6 % sadr`aj kisika 150 mg/Nm3. Stupanj odpra{ivanja elektrofiltera je odre|en na bazi prora~unske koncentracije pra{ine na ulazu u elektrofilter te usmjerene koli~ine pra{ine u odsisnom uzorku gasa nakon elektrofiltera. Prora~un koncentracije pra{ine na ulazu u elektrofilter je odre|en iz bilanse kotla tj. indirektnom metodom preko poznatog sastava goriva {ljake i pepela. Prora~unske koli~ine dimnih gasova kao i prora~unske koli~ine lete}e pra{ine odre|uju koncentraciju pra{ine na ulazu u elektrofilter. Koncentracija pra{ine u dimnim gasovima iza elektrofiltera odre|ena je iz odnosa ukupne uhva}ene pra{ine i izmjerene koli~ine odsisnih dimnih gasova. Iz naprijed navedenih mjerenja mo`e se dati slijede}i zaklju~ak: Kod toplinskog optere}enja kotla 101,8 % i 101,0 izmjereni stepen odpra{ivanja je iznosio 99,9949 i 99,9929 %. Garantovani sadr`aj pra{ine u dimnim gasovima iznosi 150 mg/Nm3. Prema tome, postignute su vrjednosti znatno bolje od garantovanih veli~ina za elektrofilter i tre}e i zadovoljenje zakonskih propisa o ~isto}i zraka.
On the coal boiler 4 we installed the electric - filter with the following charasteristics: - % of dusting 99,36 and - content of dust in clean gas after electric - filter– with 6%, the content of oxygen 150 mg/Nm³ . The percentage dusting of the electric filter is calculated based of the concentration of dust at the inlet in to the electric filter and the quantity of dust in gas after the electric filter. The calculated concentration of dust at the inlet in to the electric - filter is determined from the boiler bilance, by indirect method based on the known content at fuel, slag and ashes. The calculation of the quantity of waste gases and calculation of the quantity of flying dust determine the concentration of dust at the inlet in to the electric - filter. The concentration of dust in waste gases after electric filter is determined from the relation of total dust and measured value of outlet waste gases. Based on this, we can conclude: At heat load of boiler 101.8 % and 101.0 %, the measured percente of dust was 99.9949 and 99.9929 %. The guaranted percente of dust in waste gases is 150 mg / Nm³ . That means that the measured values are better than the guaranted for electric filter and environment laws on clean air.
2.4. Ispitivanje stepena efikasnosti elektrofiltera na novom lu`nom kotlu br. 4
Osnovne krakteristike lu`nog kotla broj 4 su slijede}e. - Pritisak pare na izlazu iz kotla 6.100 KPa - Temperatura pare na izlazu iz kotla 4600 C. - Kao gorivo koristi crni lug koncentracija 60 %
~iji je sastav Uz lu`ni kotao je instaliran i elektrofilter isporu~en od firme "Fläkt" iz [vedske. Stepen efikasnosti otpra{ivanja garantovan od strane isporu~ioca opreme je 98,0 %.
2.4. Reserch on the percent of the electric filter working efficiency on the recovery boiler 4
The main characteristics of the recovery boiler 4 are: - pressure of steam (outlet) 6.100 kPa, - temperature of steam (outlet) 460º C and - fuel is black lye 60% concentration and the
following composition. On the recovery boiler 4 we installed the electric - filter by "FLAKT" SWEDEN. The percent of dusting guaranteed by the producer is 98%.

Ma{instvo 4(6), 233 – 250, (2002) S.Ibrahimefendi},….: UTICAJ PROCESA PROIZVODNJE CELULOZE...
- 243 -
Tabela 4. Sastav goriva Table 4. Fuel composition
Na2 21,31 %
C 38,07 %
H2 3,6 %
S 3,29 %
O2+N2 33,73 %
Korekcija stepena otpra{ivanja elektrofiltera je vi{a po slijede}oj jednakosti:
n=100 (1 – e-KT ) (%) Promjene stupnja otpra{ivanja uzrokuju promjene u koli~ini dimnih gasova, temperaturi dimnih gasova, vla`nosti i sadr`aja pra{ine u dimnim gasovima ispred elektrofiltera, a ovu promjenu definira faktor KT koji se odre|uje iz izraza kori{tenjem korekturnih krivulja.
KT=KD x CT gdje je -KD = projektna vrijednost koja odgovara garantovanom stupnju otpra{ivanja te iznosi 3,91202. CT = ukupni korekturni faktor koji predstavlja produkt pojedinih korektura danih korekturnim krivuljama. Rezultati ispitivanja su slijede}i: - Koncentracija pra{ine iza elektrofiltera je 0,0558
gr/Nm3, a ukupna koli~ina pra{ine iza elektrofiltera je 7,842 kg/h.
- Koli~ina izdvojena pra{ine ispod elektrofiltera je 1223.7 kg/h, a ukupna koli~ina pra{ine na ulazu u elektrofilter je l246,54 kg/h.
- Postignuti stepen odpra{ivanja je 99,371 %. Poslije elektrofiltera dimni gasovi dolaze do skruber "MoDo" sistem gdje se vr{i pranje sa bijelim lugom i vodom u svrhu smanjenja emisije SO2 i pra{ine. Ispitivanja su u toku i prvi rezultati pokazuju da je stepen smanjenja emisije sumpordioksida i pra{ine preko 80 %. Uhva}ene alkalije se ponovo vra}aju u proces, a tople vode koriste u daljnjem tehnolo{kom procesu.
The corection percent of dusting of the electric filter is calculated by the following equation
n=100 (1 – e-KT ) (%) The change of percent of dusting is cause the change in the quantity of waste gases, temperature of waste gases, humidity and content of dust in waste gases before electric filter. This change is defined by the factor KT which is determined from correction curves.
KT = KD x CT KD – The project value which responds to the guaranteed of dusting is 3.91202 percent CT - Total correcture factor, which is a product of individual correctures given by the correction curves The research results are: - concentration of dust after electric filter is
0.0558 gr/Nm³ , - total quantity of dust after electric filter is 7.842
kg/h, - quantity of separated dust under the electric
filter is 1223.7 kg/h., - total quantity of dust inlet in electric filter is
1.246 kg/h - % of dusting is 99,371 %. After the electric filter the waste gases are treated in the scruber system "MODO", where the cleaning with white lye and water decreasing emission of SO2 and dust is done. Researsches showed decreasing emission of S02 and dust for more than 80 %. All alkalies return into the process and hot waters are used in the technological process.
3. ZAKLJU^NA RAZMATRANJA - Sada{nji stepen razvoja tehnologija i procesne opreme za pre~i{}avanje dimnih gasova sa energetskih i tehnolo{kih postrojenja je na visokom nivou
3. FINAL REMARKS - Today level the of technology develoment and process equipment for cleaning of waste gases from energetic and technological equipment is on high level.

Ma{instvo 4(6), 233 – 250, (2002) S.Ibrahimefendi},….: UTICAJ PROCESA PROIZVODNJE CELULOZE...
- 244 -
- to omogu}uje postizanje zakonskih normativa emisija kod Tvornica celuloze i papira me|utim, postrojenja su realtivno skupa, tro{e energiju, sirovine, radnu snagu i zahtijevaju visok stepen znanja u opslu`ivanju i opravkama no intencija je dostizanje u ekonomske kategorije sa iskori{tavanjem izdvojenih supstanci i materijala. - Koncept za{tite ivotne sredine u d.d. Natron" Maglaj se zasniva na rje{enjima i saznanjima u istim ili sli~nim tvornicama u Evropi i svijetu i izabrana su postrojenja koja posti u pre~i{}avanje dimnih gasova i otpadnih voda u okviru vrijednosti evropskih standarda. Za potrebe uskladi{tenja elektrofilterskog pepela i {ljake sa ugljenih kotlova kao i otpada sa linije za pripremu starog papira izgra|ena je deponija sa mogu}nosti pove}anja kapaciteta sa podizanjem brane i recirkulacijom vode koja slu i za transport {ljake i pepela. - Za pre~i{}avanje tehnolo{kog kondenzata instalirana je destilaciona kolona koja odvaja terpentin i organo – sumporne spojeve koji imaju komercijalni zna~aj. - Za pre~i{}avanje otpadnih voda iz procesa proizvodnje celuloze i papira, koriste se postrojenja koja rade na principu aerobivog postupka. Izdvojena vlakna se ponovo vra}aju u proces proizvodnje ambala`nih papira ni`ih karakteristika, a ugu{}eni mulj se dijelom spaljivao na ugljenim kotlovima, a dijelom odlagao na deponiju. - U saradnji sa Poljoprivrednim fakultetom u Sarajevu, vr{ena su istra`ivanja u cilju dobivanja humusa od mulja i inicijalni rezultati su bili u okviru zadovoljavaju}ih o~ekivanja.
- The norms for emission in wood-pulp and paper factories are bigger than measured. - The equipment is relative the expensive, with big energy use, use of raw materials, workers and high level of skilled people in maintenance. - A good thing is that some substances return into process. - The concept environment protection in pulp and paper factory "Natron" Maglaj is similar to other such factories in Europe and the world. Equipment for cleaning of waste gases and waste the waters ara in according to European norms for the warehouse (deposit sites) of slag and dust is 2 km of distance from the factory and transport is by recycling water. - For condensate treatment destilation column is installed, which separates terpentine and organic - sulphur compounds, which have commercial character - For tretment of waste waters, equipment for air process is used Fines (small pulp and waste paper) return to process in papers with low quality and mud is partly burned in coal boilers and partly transported to deposit sites. - In cooperation with Faculty of agricultural Sarajevo, "Natron" has run a resecrch with the ain to get humus from mud. The initial results have been satisfactory.
4. LITERATURA - REFERENCES
[1] P. Lengyel – S. Morvay: Chemie Und Technologie der Zellstoffherstellung, Akademia Kiado, Budapest, 1973.
[2] Garancijsko ispitivanje elektroodvaja~a na kotlovima UKO-1 i UKO-2 Energana "Natron" Maglaj, Ma{inski fakultet Univerziteta u Sarajevu, 1983. godine, Institut za procesnu tehniku, energetiku i tehniku sredine
[3] Primopredajna ispitivanja lu`nog kotla u Energani "Natron" Maglaj, Institut za elektroprivredu, Zagreb, 1984.
[4] Studija o za{titi vazduha od zaga|ivanja za Tvornicu "Natron" i op{tinu Maglaj, Ma{inski fakultet Univerziteta Sarajevo, Institut za procesnu tehniku, energetiku i tehniku sredine
[5] Garancijsko ispitivanje elektroodvaja~a na Kotlu br. 3, Energane "Natron" Maglaj, Ma{inski fakultet Univerziteta u Sarajevu, Institut za procesnu tehniku, energetiku i tehniku sredine, Sarajevo, 1982.
[6] Primopredajna ispitivanja ugljenog kotla u Energani II "Natron" Maglaj, Institut za elektroprivredu, Zagreb, 1984.
[7] Advanced polution Abatement technology in the pulp and paper industry, Environmemt directorate, Organisation for economic Co-operation and devalopment, Paris, 1972.
[8] Zbornik referata [est jugoslovenskih simpozijuma o za{titi vazduha od zaga|iva~a, Beograd, septembra 1973.
[9] The world pulp and paper, Weck Stockholm, april 10-13.1984., Proccedinos of available techniques, the Svedisch Association of Pulp, - Paper Engineers and Adforum
[10] Klara Jandy: Smog nad gorodom, Moskva stroisdat, 1978., Ispitivanje u Tvornici "Natron" Maglaj, Savezni Centar za za{titu i obrazovanje u rudarstvu i industriji, Tuzla, 1976.

Ma{instvo 4(6), 233 – 250, (2002) S.Ibrahimefendi},….: UTICAJ PROCESA PROIZVODNJE CELULOZE...
- 245 -
DIMNJAK BR. 1
MJESTO EMISIJE KRUTIH TVARI I SUMPORNIH SPOJEVA PRIJE REKONSTRUKCIJE 1. STARA TVORNICA X 2. NOVA TVORNICA 3.
PRIPREMA DRVETA
KAUSTIKA REGENERATOR TOPLOTE
KUHAONA
SKRUBER
ROTO PEĆ
OTAPAČ TALINE
UPARIVAČKA BATERIJA
PRAONA
PROIZVODNJA TAL ULJA
SKLADIŠTE LUGA
OKSIDACIJSKI TORANJ
SKRUBER
ELEKTRO FILTER
LUKO BROJ 1.
ELEKTRO FILTER
LUKO BROJ 2.
PRIPREMA DRVETA
ROTO PEĆ
LUKO BR.3
KASKADNI UPARIVAČ
OTAPAČ TALINE
S. ENERGANA
x
x
x
X
XX
REGENERACIJA TOPLOTE
KAUSTIKA KUHAONA
PRAONA
UPARIVAČ
SKRUBER
OTAPAČ TALINE
ELEKTRO FILTER
MULTICIKLON 2
UKO - 1 MULTICIKLON 1
UKO - 2
UKO - 3 MULTICIKLON 3
X
x
DIM
NJA
K
ODŠLJAKIVANJE I TRANSPORT U RIJEKU
TEHNOLOŠKA ŠEMA BROJ 1

Ma{instvo 4(6), 233 – 250, (2002) S.Ibrahimefendi},….: UTICAJ PROCESA PROIZVODNJE CELULOZE...
- 246 -
CHIMNEY 1
PLACE OF EMISSION OF SOLID SUBSTANCES AND SULFUR COMPOUNDS BEFORE RECONSTRUCTION 1. OLD FACTORY X 2. NEW FACTORY 4.
WOODYARD
RECAUSTICIZER HEAT REGENERATOR
COOKING
SCRUBBER
LIME KILN
SMELTING FURNACE
EVAPORATOR
WASHING
PRODUSTION TAL OIL
WAREHOUSE FOR LIQUOR
OKSIDACION TOWER
SCRUBBER
ELECTRIC FILTER
RECOVERY BOILER 1
ELECTRIC FILTER
RECOVERY BOILER 2
WOODYARD
LIME KILN
RECOVERY BOILE
CASCADE EVAPORATOR
SMELTING FURNACE
OLD POWER PLANT
x
x
x
X
X X
HEAT
REGENERATION
RECAUSTICIZER COOKING
WASHING
EVAPORATOR
SCRUBBER
SMELTING FURNACE
ELECTRIC FILTER
MULTICYCLONE 2
COAL BOILER 1
MULTICYCLONE 1
COAL BOILER 2
COAL BOILER 3
MULTICYCLONE 3
X
x
CH
IMN
EY
SLAG AND TRANSPORT INTO RIVER
DIAGRAM No 1
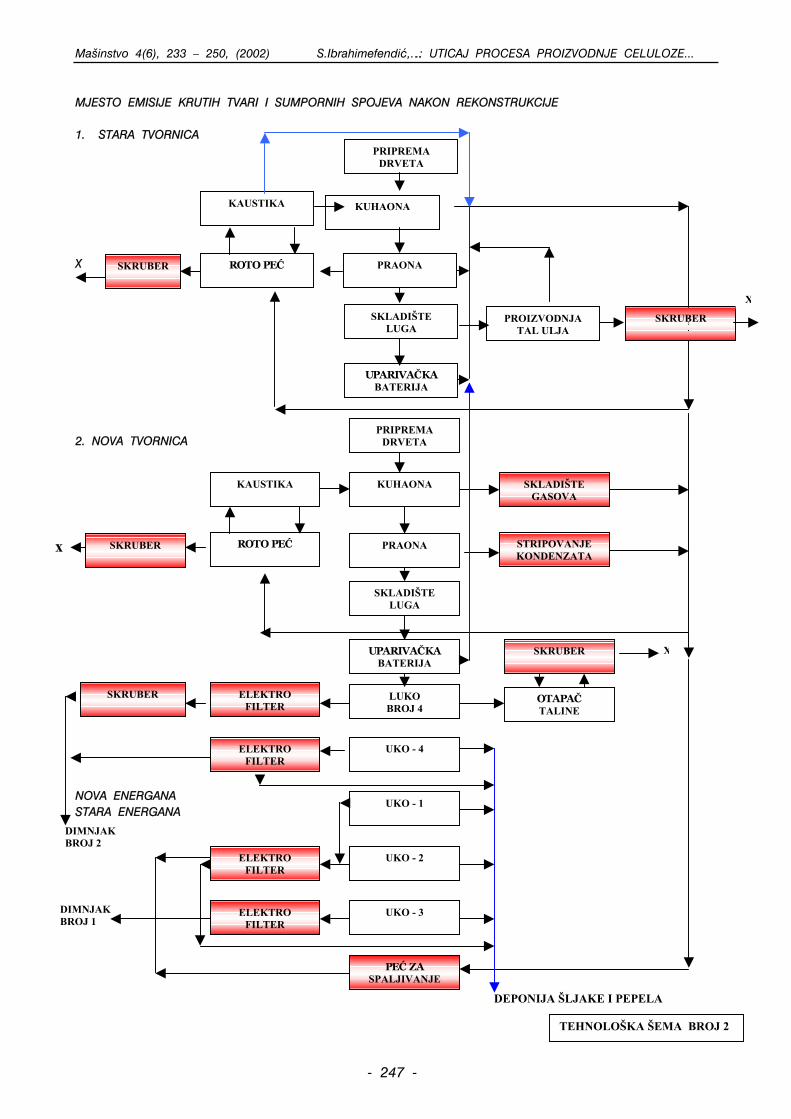
Ma{instvo 4(6), 233 – 250, (2002) S.Ibrahimefendi},….: UTICAJ PROCESA PROIZVODNJE CELULOZE...
- 247 -
DIMNJAK BROJ 2
x
X
DIMNJAK BROJ 1
MJESTO EMISIJE KRUTIH TVARI I SUMPORNIH SPOJEVA NAKON REKONSTRUKCIJE 1. STARA TVORNICA X 2. NOVA TVORNICA 5. NOVA ENERGANA STARA ENERGANA
PRIPREMA DRVETA
KAUSTIKA KUHAONA
SKRUBER
ROTO PEĆ
UPARIVAČKA BATERIJA
PRAONA
PROIZVODNJA TAL ULJA
SKLADIŠTE LUGA
SKRUBER
PRIPREMA DRVETA
ROTO PEĆ
LUKO BROJ 4
SKRUBER
X
SKLADIŠTE GASOVA
KAUSTIKA KUHAONA
PRAONA
SKRUBER
SKLADIŠTE LUGA
SKRUBER
OTAPAČ TALINE
ELEKTRO FILTER
UKO - 1
ELEKTRO FILTER
UKO - 2
UKO - 3
ELEKTRO FILTER
DEPONIJA ŠLJAKE I PEPELA
TEHNOLOŠKA ŠEMA BROJ 2
STRIPOVANJE KONDENZATA
UKO - 4
ELEKTRO FILTER
PEĆ ZA SPALJIVANJE
UPARIVAČKA BATERIJA
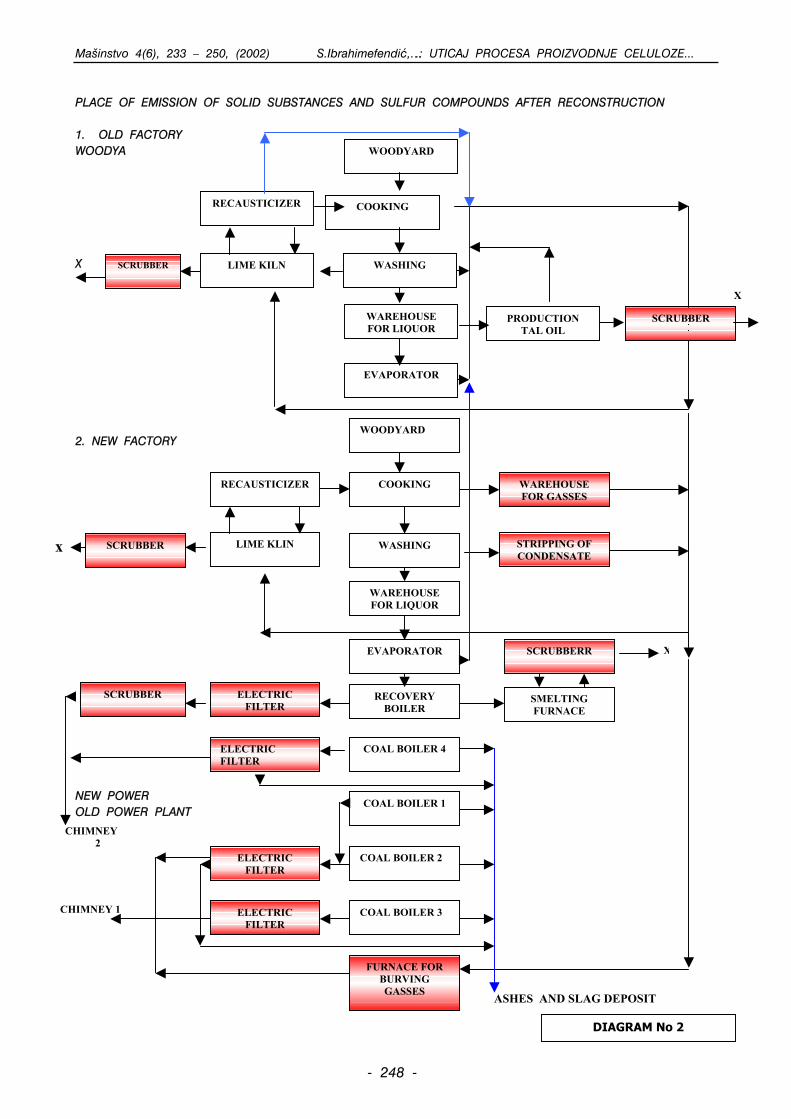
Ma{instvo 4(6), 233 – 250, (2002) S.Ibrahimefendi},….: UTICAJ PROCESA PROIZVODNJE CELULOZE...
- 248 -
CHIMNEY 2
x
X
CHIMNEY 1
PLACE OF EMISSION OF SOLID SUBSTANCES AND SULFUR COMPOUNDS AFTER RECONSTRUCTION 1. OLD FACTORY WOODYA X 2. NEW FACTORY 6. NEW POWER OLD POWER PLANT
WOODYARD
RECAUSTICIZER COOKING
SCRUBBER
LIME KILN
EVAPORATOR
WASHING
PRODUCTION TAL OIL
WAREHOUSE FOR LIQUOR
SCRUBBER
WOODYARD
LIME KLIN
RECOVERY BOILER
SCRUBBERR
X
WAREHOUSE FOR GASSES
RECAUSTICIZER COOKING
WASHING
SCRUBBER
WAREHOUSE FOR LIQUOR
SCRUBBER
SMELTING FURNACE
ELECTRIC FILTER
COAL BOILER 1
ELECTRIC FILTER
COAL BOILER 2
COAL BOILER 3
ELECTRIC FILTER
ASHES AND SLAG DEPOSIT
DIAGRAM No 2
STRIPPING OF CONDENSATE
COAL BOILER 4
ELECTRIC FILTER
FURNACE FOR BURVING GASSES
EVAPORATOR

Ma{instvo 4(6), 233 – 250, (2002) S.Ibrahimefendi},….: UTICAJ PROCESA PROIZVODNJE CELULOZE...
- 249 -
12 727
UKO I-III 5 579
323 308 339
200
UKO I-III 3 757
36
UKO IV 3 678
57
LUKO IV
36 47
SPALJIVANJE GASOVA
920
SO2 ČČ H2S
MJESTO EMISIJE KRUTIH TVARI I SUMPORNIH SPOJEVA PRIJE I NAKON REKONSTRUKCIJE
DIMNJAK 104 m DIMNJAK B 36 m
TEHNOLOGIJA povr. izvor E 20 m
UGLJENI KOTLOVI TEHNOLOGIJA LUŽNI KOTLOVI
PO
STO
JEĆ
E S
TA
NJE
EM
ISIJ
E
LUKO I-II
1108
LUKO III
358
NO
VO
ST
AN
JE E
MIS
IJE
t/a
DIMNJAK A 104 m
DIMNJAK B 110 m
TEHNOLOŠKA ŠEMA
DIJAGRAM BROJ 1

Ma{instvo 4(6), 233 – 250, (2002) S.Ibrahimefendi},….: UTICAJ PROCESA PROIZVODNJE CELULOZE...
- 250 -
12 727
COAL BOILERS I-III 5 579 323
308 339
200
COAL BOILERS I-III 3 757
36
COAL BOILER IV
3 678
57
RECOVERY BOILER IV
36 47
BURNING GASSES
920
SO2 SOLID PARTICLE
H2S
PLACE OR EMISSION OF SOLID SUBSTANCES AND SULFUR COMPOUNDS BEFORE AND AFTER RECONSTRUCTION
CHIMNEY 104 m CHIMNEY B 36 m TECHNOLOGY EMISSON´S AREA E 20
COAL BOILERS TECHNOLOGY RECOVERY BOILERS
EX
IST
ING
CO
ND
ITIO
N E
MIS
SIO
N
RECOVERY BOILERS I - I - II
1108
RECOVERY BOILER III
358
NE
W C
ON
DIT
ION
EM
ISSI
ON
t/y
ear CHIMNEY A
104 m
CHIMNEY B 110 m
DIAGRAM No 3

Ma{instvo 4(6), 251 – 264, (2002) S.Brdarevi},….: METODE MJERENJA ZADOVOLJSTVA...
METODE MJERENJA ZADOVOLJSTVA KUPCA PREMA ISO 9001:2000
Dr. Safet Brdarevi}, red. profesor, Ma{inski fakultet u Zenici, Fakultetska 1 D`emal Kula{in, dipl.in`., Ekonomska {kola Travnik
REZIME:
Standard ISO 9000:2000 obavezuje organizacije na uvo|enje programa mjerenja zadovoljstva kupca, ali ne propisuje na~ine i metodu koja bi se primjenila. Tako je zadatak svake organizacije da razvije i implementira sopstveni program mjerenja zadovoljstva kupca, u ~emu ovaj rad mo`e iznimno pomo}i. U ovom radu daje se pregled nekih metoda mjerenja zadovoljstva kupca te tipi~na metodologija mjerenja koja se primenjuje u svijetu. Nagla{ava se va`nost procesa mjerenja zadovoljstva kupca ali i te{ko}e jednog ovakvog mjerenja gdje ne postoji objektivno mjerno sredstvo.
PREGLEDNI RAD
Klju~ne rije~i: kupac, zadovoljstvo, mjerenje
CUSTOMER SATISFACTION MEASUREMENT METHODS ACCORDING TO ISO 9001:2000
Safet Brdarevi}, Ph. D. Prof., Faculty of Mechanical Engineering in Zenica D`emal Kula{in, B.Sc. Metalurgical Engineering, School of Economy in Travnik
SUMMARY:
Standard ISO 9000:2000 requires organisations to install such Customer satisfaction measurement programs without providing ways and methods possible. Therefore, it is the task of every organisation to develop and implement its own Customer satisfaction measurement program, in which this work can be extreamly halpful. The work ilustrates the world's methods of Customer satisfaction measurement (CSM) avaliable to the authors, which are used throughout the world. The work highlights the importance of the Costomer satisfaction measurement process, as well as the difficulties arising due to the lack of objective means for measurement.
SUBJECT REVIEW
Keywords: customer, satisfaction, measurement Kvalitet je zadovoljstvo kupca (Wayne) Quality is customer satisfaction (Wayne) Progres koji se ne mo`e mjeriti - ne postoji (Belonn) Inmeasurable quality does not exist (Bellonn
1. UVOD
Standard ISO 9001:2000 zasnovan je na procesnom pristupu upravljanju kvalitetom, ~iji je sastavni dio mjerenje zadovoljstva kupca. Posebno se ukazuje na odgovornost menad`menta organizacije da razumije zahtjeve kupaca, da projektuje i isporu~uje proizvod/ uslugu1 koji susre}u te zahtjeve, da prosu|uje svoj uspjeh kroz mjerenje zadovoljstva kupca te da rezultate tih mjerenja koriste kao vodilju za kontinualna pobolj{anja. [12]
1 Standard ISO 9000:2000 kona~no poistovje}uje proizvod i uslugu
1. INTRODUCTION
The 9001:2000 ISO Standard is based on the process approach to quality management, whose integral part is customer satisfaction. Responsibility of an organisation management board is very important, especially in respect to understanding customer demands, designing and delivering the product/ service1 meeting them, judging their own success by means of customer satisfaction measurement, and using those results as a guidline for constant improvement [12].
- 251 -
1 The 900:2000 ISO Standard finally regards product and service as identical

Ma{instvo 4(6), 251 – 264, (2002) S.Brdarevi},….: METODE MJERENJA ZADOVOLJSTVA...
Uz procesni pristup, karakteristika standarda ISO 9000:2000 je i osam principa upravljanja kvalitetom. Prvi princip upravljanja kvalitetom je orijentacija prema kupcu, gdje se navodi da dobavlja~ mora osigurati egzaktne pokazatelje o: [8] - razumijevanju postoje}ih i budu}ih potreba
kupca za konkretnim proizvodima i uslugama, - na~inima ispunjavanja zahtjeva kupaca (jasno}a
prilagodbe vlastitih procesa za stvaranje `eljene kvalitete proizvoda i usluga) i
- razvojnim te`njama da se udovolji o~ekivanjima kupaca.
Organizaciji koja ne razumije i ne ispunjava o~ekivanja i zahtjeve kupaca prijeti opasnost da izgubi svoj smisao i vrlo brzo mo`e postati irelevantna, sama sebi svrha. ISO 9001:2000 je zbog toga postavio kupce kao srce sistema upravljanja kvalitetom ~iji je cilj kontinualno pobolj{anje zadovoljstva kupca. (slika 1).
Along with the process approach, a characteristic of the 9000:2000 ISO is eight principies of quality management. The first principle of quality management is customer orientation stating that a supplier has to ensure exaet indicators of: [8]: - understanding of the current and future
customer needs for specific products and services,
- manners of meeting customer demands (adaptation of one's own processes to create the desired quality of products and services), and
- development goals to satisfy customer expectations.
The organisation that does not understand and meet customer expectations and demands is in danger of losing its purpose and can soon become irrelevant, the purpose to itself. ISO 9001:2000 has made customers the heart of the quality management system with the aim to constantly improve cutomer satisfaction (Figure 1).
- 252 -
Kontiunalno pobolj{anje sistema kvaliteta
Statistika pokazuje da je 65% kupaca nezadovoljno zbog indiferentnog odnosa ili pristupa dobavlja~a. Isto tako, istra`ivanja potvr|uju da je pet puta skuplje osvojiti novog kupca nego zadr`ati postoje}eg [5]. Zbog ove ~injenice lojalnost kupaca je sve ~e{}a tema, a posebno stoga {to se lojalnost direktno ve`e sa zadovoljstvom kupca. Tako, zadovoljstvo kupaca ocijenjeno sa 10/10 (odli~no) rezultira 95% lojalno{~u organizaciji, dok zadovoljstvo ocijenjeno sa 8/10 (dobro) rezultira tek sa 65% lojalno{}u. Koliko je va`an utjecaj zadovoljstva na lojalnost, potvr|uje podatak da zadovoljstvo ocijenjeno sa srednje donosi pad lojalnosti na svega 15% [1].
Statistics have shown that 65 % of customers are dissatisfied due to indifferent relationship or approach of the supplies. Research las also established that it is five times more expensive to win a new customer that to keep one [5]. Due to this fact, customer loyalty is becoming a frequent topic, especially because loyalty is directly related to customer satisfaction. Hence, customer satisfaction graded with 10/10 (excellent) results in 95 % of loyalty to an organisation, whereas that graded with 8/10 (good) results in fust 65 % of loyalty. The fact that the satisfaction graded as average leads to a drop of loyalty to just 15 % [1] confirms the great impact of satisfaction to loyalty.
Odgovornost rukovodstva
Upravljanje resursima Mjerenje, analiza
i pobolj{anje
Realizacija proizvoda
K
U
P
A
C
Zaht jev i
K
U
P
A
C
zadovo lj s t vo
Ulaz
Izlaz
Proizvod
Slika 1: Sistem kvaliteta prema novom standardu ISO 9000:2000
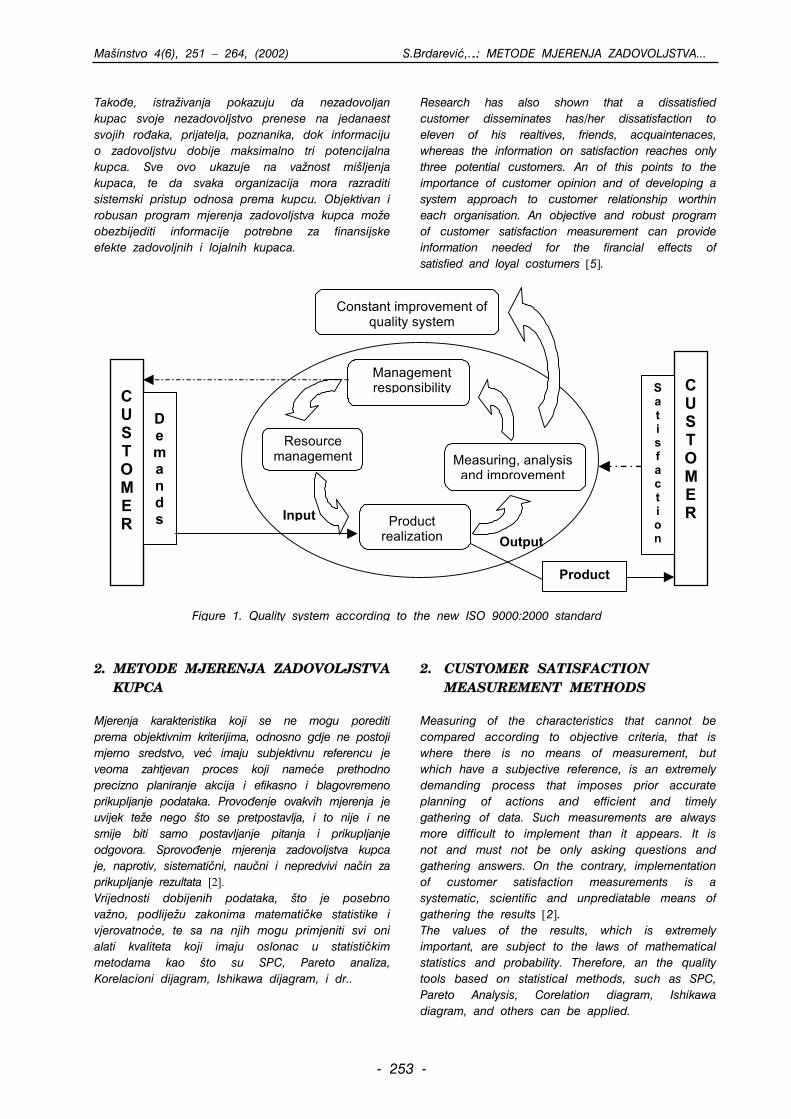
Ma{instvo 4(6), 251 – 264, (2002) S.Brdarevi},….: METODE MJERENJA ZADOVOLJSTVA...
Tako|e, istra`ivanja pokazuju da nezadovoljan kupac svoje nezadovoljstvo prenese na jedanaest svojih ro|aka, prijatelja, poznanika, dok informaciju o zadovoljstvu dobije maksimalno tri potencijalna kupca. Sve ovo ukazuje na va`nost mi{ljenja kupaca, te da svaka organizacija mora razraditi sistemski pristup odnosa prema kupcu. Objektivan i robusan program mjerenja zadovoljstva kupca mo`e obezbijediti informacije potrebne za finansijske efekte zadovoljnih i lojalnih kupaca.
Research has also shown that a dissatisfied customer disseminates has/her dissatisfaction to eleven of his realtives, friends, acquaintenaces, whereas the information on satisfaction reaches only three potential customers. An of this points to the importance of customer opinion and of developing a system approach to customer relationship worthin each organisation. An objective and robust program of customer satisfaction measurement can provide information needed for the firancial effects of satisfied and loyal costumers [5].
2. METODE MJERENJA ZADOVOLJSTVA KUPCA
Mjerenja karakteristika koji se ne mogu porediti prema objektivnim kriterijima, odnosno gdje ne postoji mjerno sredstvo, ve} imaju subjektivnu referencu je veoma zahtjevan proces koji name}e prethodno precizno planiranje akcija i efikasno i blagovremeno prikupljanje podataka. Provo|enje ovakvih mjerenja je uvijek te`e nego {to se pretpostavlja, i to nije i ne smije biti samo postavljanje pitanja i prikupljanje odgovora. Sprovo|enje mjerenja zadovoljstva kupca je, naprotiv, sistemati~ni, nau~ni i nepredvivi na~in za prikupljanje rezultata [2]. Vrijednosti dobijenih podataka, {to je posebno va`no, podlije`u zakonima matemati~ke statistike i vjerovatno}e, te sa na njih mogu primjeniti svi oni alati kvaliteta koji imaju oslonac u statisti~kim metodama kao {to su SPC, Pareto analiza, Korelacioni dijagram, Ishikawa dijagram, i dr..
2. CUSTOMER SATISFACTION MEASUREMENT METHODS
Measuring of the characteristics that cannot be compared according to objective criteria, that is where there is no means of measurement, but which have a subjective reference, is an extremely demanding process that imposes prior accurate planning of actions and efficient and timely gathering of data. Such measurements are always more difficult to implement than it appears. It is not and must not be only asking questions and gathering answers. On the contrary, implementation of customer satisfaction measurements is a systematic, scientific and unprediatable means of gathering the results [2]. The values of the results, which is extremely important, are subject to the laws of mathematical statistics and probability. Therefore, an the quality tools based on statistical methods, such as SPC, Pareto Analysis, Corelation diagram, Ishikawa diagram, and others can be applied.
Management responsibility
Resource management
n
Measuring, analysis and improvement
Product realization
CUSTOMER
Demands
CUSTOMER
Sa t i s f ac t i o
Constant improvement of quality system
Input
Output
Product
Figure 1. Quality system according to the new ISO 9000:2000 standard
- 253 -

Ma{instvo 4(6), 251 – 264, (2002) S.Brdarevi},….: METODE MJERENJA ZADOVOLJSTVA...
Zbog pomenutih specifi~nosti, u svijetu, u istoriji teorije i prakse realizacije procesa mjerenja zadovoljstva kupca postoji vi{e pristupa. Zadatak ovog rada je da prika`e, autorima dostupne, svjetske pristupe mjerenju zadovoljstva kupca usluge. U svom istra`ivanju autori ovog rada su uo~ili slijede}e metode:
Due to the above specific characteristics, there are several approaches in the history of theory and practice of the implementation of customer satisfaction measurements. The task of this paper is to present the approaches to customer satisfaction measurement in the world the authors are familiar with. In the course of this rescarch, the authors of the paper have noticed the following methods:
Tabela 1: Metode mjerenja zadovoljstva kupca, sa bitnim karakteristikama
Metoda Karakteristike
Metoda kompanije Leadership Factor - perspektiva kupca kao startna ta~ka - ocjenjivanje va`nosti zahtjeva paralelno sa zadovoljstvom kupca - odre|ivanje indeksa zadovoljstva kupca
Metoda kompanije CIM College - ta~no definirani koraci metode - kori{tenje alata kvaliteta za prezentiranje rezultata - povezivanje podataka sa vlastitim software-om
Metode kompanije SurveyValue - potpuna automatizacija prikupljanja i obrade podataka Metode kompanije AUTODATA - mogu}nost ONLINE mjerenja Metode kompanije PERSUES - mogu}nost ONLINE mjerenja Metode kompanije Walker Smartloyalty Inc. - ONLINE mjerenje zadovoljstva kupca
Metoda Univerziteta u Newcastle-u - mjerenja zadovoljstva kupca u edukaciji - ONLINE mjerenje zadovoljstva u~enika/studenata - kori{tenje statisti~kih software-skih paketa SPPS i SAS
Nacionalni indeks zadovoljstva - uklju~ivanje kupaca prema slu~ajnom uzorku - podaci su potpuno javni
Table 1: Customer satisfaction measurement methods, along with a few important characteristics
Method Characteristics
Method of the Leadership Factor company
- customer perspective as the starting point - evaluation of importance of the demands is parallel to the
customer satisfaction - customer satisfaction index established
CIM College Company Method - precisely defined method steps - quality tools for presentation of the results used - the data linked to personal software
Methods of the Survey Value Company - complete automatisation of the data gathering and processing AUTODATA company methods - ability to measure ON-LINE PERSUES company methods - ability to measure ON-LINE Wallear Smart loyalty Inc. Methods - ON-LINE customer satisfaction measurement
Newcastte University Method - customer satisfaction measurement in education - ON-LINE student satisfaction measurement - statistical software packages SPPS and SAS used
National satisfaction index - customers engaged according to random sample method - data are fully available to public
Imena ovih metoda definirana su onako kako su ih njihovi autori nazvali, ili prema organizaciji koja ih koristi, prema sistemu na koji se primjenjuje, ili prema osnovnoj su{tini postupka. Osnovna karakteristika ve}ine ovih metoda je da se metodom anketiranja do|e do stavova uzorka kupaca i zatim izvr{i ocjena zadovoljstva na osnovu prikupljenih podataka po nekom pristupu. U nastavku }e biti prikazana tipi~na metodologija mjerenja zadovoljstva kupaca, koja je rezultat istra`ivanja vi{e metoda.
The methods are named as their authors had named them, according to the organisation using them, the system applied, on their basic procedure. The main characteristic of a majority of the methods is that they learn about the attitude of a sample of cus-tomers in a survey and then they evaluate satisfaction on the basis of the data gathered by certain proce-dure. Further in the paper, a typical customer satis-faction measurement methodology with be prezented, which is the result of a rescard of several methods.
- 254 -

Ma{instvo 4(6), 251 – 264, (2002) S.Brdarevi},….: METODE MJERENJA ZADOVOLJSTVA...
3. TIPI^NA METODOLOGIJA MJERENJA ZADOVOLJSTVA KUPCA
S obzirom na slo`enost i va`nost mjerenja zadovoljstva kupca, mjerenje je utemeljeno na istra`ivanju kupaca kako bi bile dobijene validne i kvalitetne informacije. U svim metodama uo~avaju se izvjesni koraci, te }e i prezentirana tipi~na metodologija imati vi{e koraka.
3.1. Odre|ivanje ciljeva Da bi se odredio cilj, potrebno je postaviti pitanja, poput: za{to se provodi mjerenje zadovoljstva kupca, {ta se o~ekuje da se usavr{i, kakva vrsta odluke }e biti done{ena kao razultat istra`ivanja, i sl.. Ciljeve ili zahtjeve mjerenja zadovoljstva kupca trebalo bi sumirati u jednoj ili dvije re~enice. [to su ciljevi specifi~niji ili koncizniji, to je lak{e sprovesti efikasno istra`ivanje zadovoljstva kupca.
3.2. Utvr|ivanje zahtjeva kupaca Pri utvr|ivanju o~ekivanja kupaca mora se izbje}i gre{ka koju pravi veliki broj organizacija, a to je da sami kreiraju liste o~ekivanja i zahtjeva kupaca. To je tzv. pogled organizacije (lens of organisation), koji u ve}ini slu~ajeva ne donosi valjane informacije, jer kupci i organizacije nemaju isti pogled na proizvod/uslugu. Nasuprot ovakvog na~ina, ako se pri utvr|ivanju o~ekivanja kupaca po~inje od njih samih (lens of customer), rezultati istra`ivanja postaju daleko precizniji. U cilju ustanovljenja pogleda kupaca, moraju se identificirati faktori koji determiniraju kup~eve evaluacije organizacije. Tipi~ne tehnike kojima se posti`e identificiranje ovih faktora su dubinski intervjui (depth interviews) i fokusne grupe (focus group), ~iji izbor zavisi od djelatnosti organizacije i odnosa sa kupcima. Zajedni~ko za obje tehnike je da se pri intervjuiranju polazi od pretpostavke da organizacija nema dobavlja~a i kupac navodi {ta bi sve dobavlja~ trebao ispuniti. Kroz ovakvo opisivanje, indirektno se dobija lista od 20 do 50 kup~evih zahtjeva. U daljem toku intervjua, na skali od 1 do 10 kupci rangiraju sve zahtjeve, i najbolje ocijenjeni zahtjevi, obi~no 20, uklju~uju se u glavni dio istra`ivanja, anketu.
3.3. Dizajniranje ankete Dizajniranje ankete je ~esto najte`i dio u sprove|enju mjerenja zadovoljstva kupca. Va`nost anketnog upitnika ogleda se u tome da prikupljeni podaci obezbje|uju smjer akcija, poma`u da se odrede trendovi i modeli, i da se pravazi|u problemi i prije nego se krene sa proizvodnjom odnosno uslugom.
3. TYPICAL METHODOLOGY OF CUSTO-MER SATISFACTION MEASUREMENT
Considering the complexity and importance of customer satisfaction measurement, it is based by the research of customers, go that valid and quality information can be gained. An the methods lave certain steps, therofore the presented typical methodology wile be presented in that way.
3.1. Setting up the goals
In order to set up a goal, it is necessary to ask questions, such as: why customer satisfaction measurement is being conducted, what is expected to be improved, what decision will be made as a result of the research, etc. The goals or the demands of a customer satisfaction measurement should be summarised in one on two sentences. The more specific and concise the results are, the casier it is to conduct an efficient customer satisfaction research [2].
3.2. Estabilishing customer demands
When estabilishing customer expectations one has to avoid a mistake be made by a number of organisations, which is creating the list of customer demands and expectations by themselves. This is so colled lens of organisation, which in most cases does not provide relevant information, due to the fact that customers and organisations do not share the same view of a product/service. Contrary to this is to start estabilishing customer expectations from the customers themselves (lens of customer), when the results get for more precise. With the aim of estabilisning the lens of customer, the factors determming the customer evaluation of organisaiton need to be identifical. Typical techniques to identify the above factors are: in-depth interviews, focus gro0ups, whose choice depends on the type of work of the organisation and the realtionskip with the customers. A common thing to both of these techniques is to start in interviewing with the presumption that an organisation has no suppliers and customers are expected to list what the supplier should fulfil. This will provide a list of 20-50 customer demands. Further in interiew, customers range their demands on the scale from 1 to 10. The highest ranged demands, usually 20 of them, are included in the major part of the rescarch, a survey [1].
3.3. Survey design Designing a survey is often the most difficult part in conducting customer satisfaction measurement. The relevance of the survey is viewed in providing a direction for actions with the gathered data, which help decide on trends and models and overcome problems before starting the production on service itself.
- 255 -
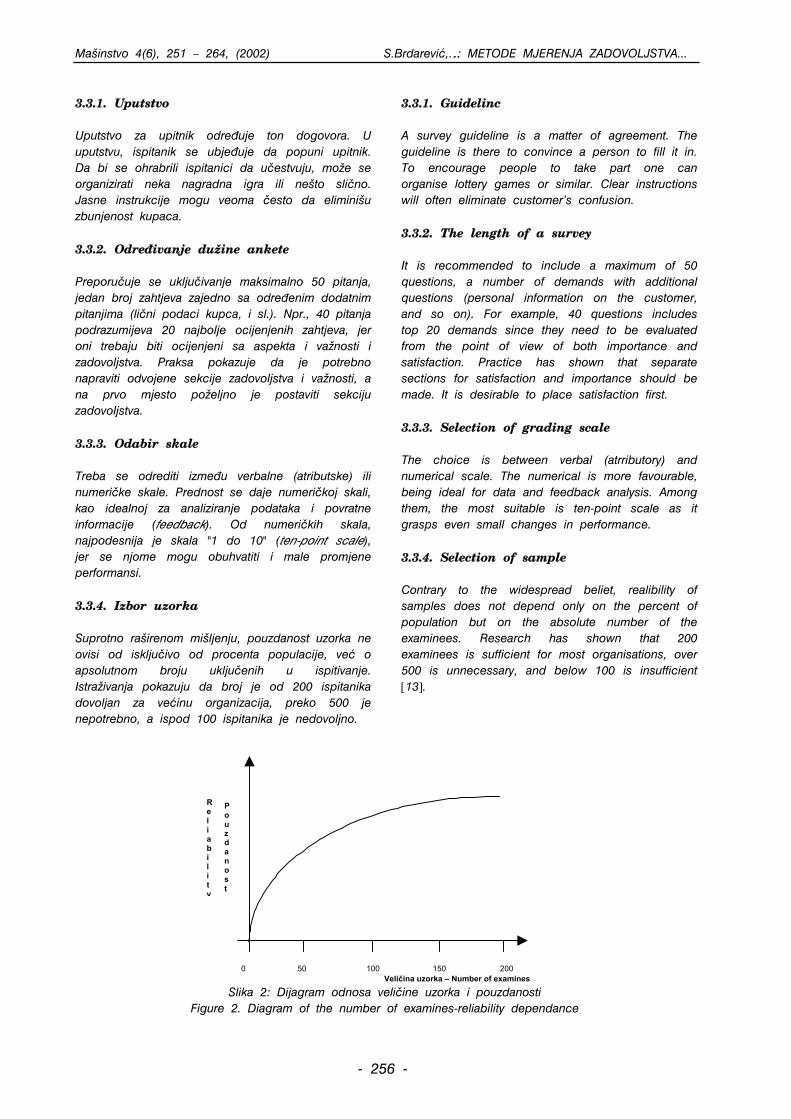
Ma{instvo 4(6), 251 – 264, (2002) S.Brdarevi},….: METODE MJERENJA ZADOVOLJSTVA...
3.3.1. Uputstvo Uputstvo za upitnik odre|uje ton dogovora. U uputstvu, ispitanik se ubje|uje da popuni upitnik. Da bi se ohrabrili ispitanici da u~estvuju, mo`e se organizirati neka nagradna igra ili ne{to sli~no. Jasne instrukcije mogu veoma ~esto da elimini{u zbunjenost kupaca. 3.3.2. Odre|ivanje du`ine ankete Preporu~uje se uklju~ivanje maksimalno 50 pitanja, jedan broj zahtjeva zajedno sa odre|enim dodatnim pitanjima (li~ni podaci kupca, i sl.). Npr., 40 pitanja podrazumijeva 20 najbolje ocijenjenih zahtjeva, jer oni trebaju biti ocijenjeni sa aspekta i va`nosti i zadovoljstva. Praksa pokazuje da je potrebno napraviti odvojene sekcije zadovoljstva i va`nosti, a na prvo mjesto po`eljno je postaviti sekciju zadovoljstva. 3.3.3. Odabir skale Treba se odrediti izme|u verbalne (atributske) ili numeri~ke skale. Prednost se daje numeri~koj skali, kao idealnoj za analiziranje podataka i povratne informacije (feedback). Od numeri~kih skala, najpodesnija je skala "1 do 10" (ten-point scale), jer se njome mogu obuhvatiti i male promjene performansi. 3.3.4. Izbor uzorka Suprotno ra{irenom mi{ljenju, pouzdanost uzorka ne ovisi od isklju~ivo od procenta populacije, ve} o apsolutnom broju uklju~enih u ispitivanje. Istra`ivanja pokazuju da broj je od 200 ispitanika dovoljan za ve}inu organizacija, preko 500 je nepotrebno, a ispod 100 ispitanika je nedovoljno.
3.3.1. Guidelinc A survey guideline is a matter of agreement. The guideline is there to convince a person to fill it in. To encourage people to take part one can organise lottery games or similar. Clear instructions will often eliminate customer's confusion. 3.3.2. The length of a survey It is recommended to include a maximum of 50 questions, a number of demands with additional questions (personal information on the customer, and so on). For example, 40 questions includes top 20 demands since they need to be evaluated from the point of view of both importance and satisfaction. Practice has shown that separate sections for satisfaction and importance should be made. It is desirable to place satisfaction first. 3.3.3. Selection of grading scale The choice is between verbal (atrributory) and numerical scale. The numerical is more favourable, being ideal for data and feedback analysis. Among them, the most suitable is ten-point scale as it grasps even small changes in performance. 3.3.4. Selection of sample Contrary to the widespread beliet, realibility of samples does not depend only on the percent of population but on the absolute number of the examinees. Research has shown that 200 examinees is sufficient for most organisations, over 500 is unnecessary, and below 100 is insufficient [13].
R
e l i a b i l i t y
P o u z d a n o s t
0 50 100 150 200 Veličina uzorka – Number of examines
Slika 2: Dijagram odnosa veli~ine uzorka i pouzdanosti Figure 2. Diagram of the number of examines-reliability dependance
- 256 -

Ma{instvo 4(6), 251 – 264, (2002) S.Brdarevi},….: METODE MJERENJA ZADOVOLJSTVA...
Uzorkovanje se mo`e vr{iti na dva na~ina: 1. slu~ajni uzorak (random sampling) i 2. reprezentativni uzorak (representative sampling). Za ve}inu organizacija najadekvatniji je specijalni vid slu~ajnog uzorkovanja, tzv. slojeviti slu~ajni uzorak (stratified random sampling), koje elimini{e nepristrasnost a ujedno je i reprezentativno. Slojeviti slu~ajni uzorak podrazumijeva dijeljenje baze kupaca, npr. prema ra~unima kojeg kupci prave, prema geografskom polo`aju, godinama itd.. Pretpostavimo da se podjela vr{i prema ra~unima, i da imamo 40 najvrijednih kupaca koji prave 40% prometa, 160 srednje vrijednih kupaca koji tako|e ~ine 40% prometa i 400 malih kupaca sa prometom od 20%. Uzorkovanje iz ovakve baze izgledalo bi ovako:
Sampling can be done in two ways: 1. random sampling, and 2. representative sampling. Most organisations find a special type of random sampling the most adequate. It is so called stratified random sempling, which eliminates bias and is at the same time representative. Stratified random sampling implies classification of the customer base for example according to the calculations customers make, geographical location, age, etc. Let us assume that customers are classified according to calculations and that we have 40 best customers making 40 % of the turnover, 160 average customers also making 40 % of the turnover and 400 small customers making the turnover of 20 %. Sampling from this base is as follows:
Tabela 2: Uzorkovanje kupaca slojevitim slu~ajnim uzorkom Table 2: Stratified random sampling
Vrijednost kupaca Customer
% prometa % of turnover
% uzorka % of sample
broj kupaca No of customers
frakcija fraction
velika – best 40 40 40 2:1 srednja- average 40 40 160 1:2 mala - small 20 20 400 1:10
U slu~aju uzorka veli~ine 200, to bi zna~ilo: 80 ispitanika iz baze kupaca velike vrijednosti, 80 ispitanika iz baze kupaca srednje vrijednosti i 40 ispitanika iz baze kupaca male vrijednosti. Izbor ovih kupaca je po slu~ajnom metodu, recimo svaki peti ~lan iz baze, itd..
In the case of a sample of 200 it would mean the following: 80 examinees from the base the best customer, 80 examinees from the average and 40 from the small customer base. Customers are chosen randomly, each fifth member of the base, etc.
3.3.5. Rije~nik ankete Rije~nik ankete mora biti jasan i koncizan, bez `argona i sinonima. Dvosmilena i pristrasna pitanja su dva naj~e{}a problema koji se prave pri kreiranju ankete. Npr. pitanje "Da li je osoblje ljubazno i korisno?". U ovom pitanju nije jasno koja se karakteristika mjeri, ljubaznost ili korisnost. Kako ove karakteristike nisu iste, za njihovo mjerenje potrebna su dva odvojena pitanja. Tako|e, pitanje: "Koliko ste zadovoljni brzinom tehni~ke podr{ke?", u sebi nosi gre{ku, jer navodi na zadovoljstvo. Kupcu se, dakle, sugerira da je zadovoljan, te ovakvo pitanje dovodi do rasipanja razultata mjerenja. Ovo se pitanje treba preformulirati u pitanje: "Koliko ste zadovoljni ili nezadovoljni brzinom tehni~ke podr{ke?".
3.3.5. Survey vocabulary Survey vocabulary has to be clear and concise, without slang or synonims. Ambiguons and biased questions are two biggest problems made in survey design. For example, "Is the staff kind and useful?" It is not clear which characteristic is measured in this question, kindness of usefulness. Since these characteristics are not the same, their measurement requires two separate questions. The question: "How satisfied are you with the speed of technical support?" also has a flow since it leads to satisfaction. A customer is, therefore, suggested to be satisfied and such question leads to a waste of the results of measurement. The question should be: "How satisfied or dissatisfied are you with the speed of technical support?" [1].
- 257 -

Ma{instvo 4(6), 251 – 264, (2002) S.Brdarevi},….: METODE MJERENJA ZADOVOLJSTVA...
3.4. Testiranje upitnika Dizajnirani upitnik po`eljno je testirati kako bi bili sigurni da }e se prikupiti valjani podaci. "Probni kupci" mogu dati povratne informacije o mnogim aspektima upitnika: o strukturi upitnika, o pitanjima, o du`ini upitnika, i o nekim drugim inicijativama koje mogu pomo}i da se privu~e vi{e kupaca. Generalno, postoje tri tipa testiranja upitnika:
- testiranje gdje u~estvuju kupci, - testiranje gdje kupci toga nisu svjesni, i - testiranje u obliku kratkog intervjua.
3.4.1. Testiranje gdje u~estvuju kupci Pri ovakvom testiranju, kupci se pitaju o svakoj fazi ispitivanja koje se sprovodi. Na ovaj na~in prikupljaju se podaci za svako pitanje ponaosob. Iako ovakav test ima smisla, pokazaju se da kupci nerado kritikuju neka pitanja, ukoliko nisu veoma lo{a. 3.4.2. Testiranje gdje kupci toga nisu svjesni U ovom slu~aju kupci ne znaju da, u stvari, u~estvuju u testiranju upitnika. Test se odr`ava kako {to bi se odr`alo i ispitivanja zadovoljstva kupca. Odgovori se bilje`e, ubacuju u tabele i analiziraju, da bi se vidjelo da li se gre{ke pojavljuju na svakom pitanju. 3.4.3. Testiranje u obliku kratkog intervjua U ovoj verziji testiranja, onaj ko vodi intervju bilje`i kako kupci shvataju svako pitanje, konkretne probleme koje mo`da imaju sa uputstvom upitnika, sa rije~ima u pitanju, sa na~inom postavljanja pitanja kao i sa opsegom pojedinih ocjena za pojedino pitanje. Intervju mo`e biti audio ili video zabilje`en, da bi se dobila objektivna slika testiranja.
3.5. Prikupljanje podataka Prikupljanje podataka, odnosno sprovo|enje ispitivanja zavisi od veli~ine prostora na kome su kupci. Ukoliko se ispituje grupa zaposlenih u velikoj kompaniji, mo`e se, recimo, koristiti Intranet. Ukoliko se, pak, provodi ispitivanje u nekom udaljenom ili nerazvijenom podru~ju, onda se pribjegava Internetu ili klasi~nim metodama ispitivanja, samostalnim popunjavanjem ankete, putem telefona ili po{tom. U su{tini, postoje tri na~ina za upravljanje sprovo|enjem ispitivanja: - ispitivanja kojim upravlja ispitiva~, - ispitivanje kojim upravlja kupac i - ispitivanja kojim upravlja ra~unar.
3.4. Survey testing It is desirable to test the designed survey to make sure valid data will be gathered. "Probation" customers can give feedback information on many aspects of the survey: on the survey structure, questions, length, and some other initiatives that can help attract more customers. Generally, there are there types of survey testing:
- testing where customers take part, - testing the customers are unaware of - testing in the form of a short interview.
3.4.1. Testing where customers take part With such testing, customers are asked on reach phase of the survey conducted. Data are gathered in this manner for each individual question. Although a test like this makes sense, customers rarely criticise some questions unless they are very bad. 3.4.2. Testing the customers are unaware of Here the customers do not actually know that they are a part of a survey. The test is conducted in the some way as a customer satisfaction survey. The answers are recorded, entered into tables, and analysed to see whether mistakes occur in each question. 3.4.3. Testing in the form of a short
interview With this type of testing, the interviewer records the customers understanding of each question, concrete problems they might be having with the survey guideline, words in the questions, the way the questions are asked, and the range of some grades for specific questions. An interview can be audio or video recorded to get an objective image of the testing.
3.5. Gathering of data Gathering of data, or realisation of survey depends on the size of the space where the customers are. If the examinees are a group of employees in a big company, Intranet can be used for example. How ever, if testing is conducted in a remote or under-developed area., Internet can be used, or classical survey methods with independent filling in, or surveys by phone of mail. Basically, there are there ways to conduct a survey - survey conducted by a moderator, - survey conducted by customer, and - survey conducted by computer.
- 258 -

Ma{instvo 4(6), 251 – 264, (2002) S.Brdarevi},….: METODE MJERENJA ZADOVOLJSTVA...
3.5.1. Ispitivanje kojim upravlja ispitiva~
Ovaj na~in ispitivanja koristi se kada se prikupljanju informacije specifi~nog sadr`aja. Nekoliko je metoda za sprovo|enje ispitivanja kojim upravlja ispitiva~:
- razgovor sa grupom kupaca, - posjeta kupcu i - razgovor sa kupcem putem telefona.
3.5.2. Ispitivanje kojim upravlja kupac Ovaj na~in ispitivanja koristi se kada se prikupljanju informacije od velikog broja kupaca, kako bi podaci bili reprezentativniji. Metode ovakvog na~ina ispitivanja su:
- slanje upitnika po{tom i - slanje upitnika faksom.
3.5.3. Ispitivanje kojim upravlja ra~unar
Tako|e, i ovaj na~in sprovo|enja ispitivanja omogu}ava prikupljanje informacija od velikog broja korisnika, i to veoma brzo i efikasno. Dvije naj~e{}e metode ovakvog ispitivanja su:
- preko Interneta i - slanje upitnika e-mail-om.
Pore|enje ovih metoda dato je tabeli 3:
3.5.1. Moderator-conducted survey
It is used when information of specific content is being gathered. There are several methods to direct such a survey:
- conversation with a group of customers, - visit to a customer, and - conversation with a customer by phone.
3.5.2. Customer-conducted survey It is used when information from a large number of customers are beng gathered in order to have more representative data. These methods are:
- sending a survey by mail and - sending a survey by fax.
3.5.3. Computer-conducted survey
It also enables gathering of information from a largenumber of users fast and efficiently. Two most common such methods are:
- via Internet and - sending a survey via e-mail.
These two methods are compared in the Table 3:
Tabela 3.: Pore|enje karakteristika metoda ispitivanja Table 3: Comparison of the survey method characteristics [2].
Ispitivanjem upravlja: - Conduced by Karakteristike- Characteristics
Ispitiva~ - Moderator Ra~unar – Computer Kupac – Customer
Stepen zadr`ane kontrole – Degree of control
veliki - large veliki – large mali - small
Uticaj – Effect veliki – large umjeren - average mali – small Kooperativnos - Cooperationt velika – large umjerena – average mala – small Cijena – Price velika – large srednja – average mala – small Prilagodljivost pitanja – Adaptability of questions
velika – large velika – large mala – small
Mogu}nost prekida – Possibility of interruption
ne - no da - yes da - yes
Mogu}nost prikupljanja podataka – Possibility of data gathering
da – yes da – yes ne – no
Minimiziranje nivoa intervjua – Minimization of interview level
ne - no da – yes da – yes
Minimiziranje redoslijeda pitanja – Minimization of question oreder
da – yes velika – large ne – no
Kompleksnost pitanja – Complexity of question
zavisi od moderatora – depends on the moderator
velika – large mala - small
Mogu}nost razumijevanja jezika kupca – Ability to understand customer language
da – yes da - yes nije lako – not
easy
3.6. Analiza podataka U zavisnosti od cilja mjerenja mogu se sprovesti neke od slijede}ih analiza rezultata mjerenje zadovoljstva kupca:
3.6. Data analysis Depending on the goal of measurement, some of the following analyses of the customer satisfaction measurement results can be made:
- 259 -

Ma{instvo 4(6), 251 – 264, (2002) S.Brdarevi},….: METODE MJERENJA ZADOVOLJSTVA...
- osnovne analize rezultata, - dodatne analize rezultata i - pra}enje stabilnosti zadovoljstva kupca.
Analiza podataka uglavnom se izvodi softverski. Manje napredne statisti~ke analize vr{e se softverskim paketom Microsoft Excel, dok su specijalisti~ki paketi kao STATISTICA, SAS ili SPSS jednostavniji za kori{tenje a analize se dobijaju br`e. 3.6.1. Osnovne analize rezultata Osnovne analize uklju~uje statisti~ke alate za ispitivanje samo jedne od dimenzija kvaliteta, i one ne mogu da daju uzajamne veze izme|u mjerenih dimenzija kvaliteta proizvoda/usluge i op}eg zadovoljstva. U osnovne analize rezultata mjerenja zadovoljstva kupca spadaju:
- odre|ivanje frekvencije raspodjele, - mjerenja glavne tendencije, - odre|ivanje vjerovatno}e i standardne devijacije.
3.6.2. Slo`ene analize rezultata ispitivanja Slo`ene analize se mogu podijeliti u dvije grupe: tehnike za ispitivanje veza i tehnike za odre|ivanje zavisnosti. Ve}ina ovih analiza se koristi za utvr|ivanje klju~nih atributa i povezanosti ovih atributa sa op}im zadovoljstvom kupca. U ovakve analize spadaju:
- Korelaciona analiza, - Pareto analiza, - Ishikawa dijagram, - Faktor analiza, - Grupna analiza, itd..
3.6.3. Srednje vrijednosti Izra~unavaju se tri tipa srednjih vrijednosti: aritmeti~ka sredina, mod i medijana. Aritmeti~ka sredina uvijek se navodi sa standardnom devijacijom, koja daje validne informacije o varijacijama odgovora. Tako, na skali 1-10 (ten-point-scale), standardna devijacija preko vrijednosti 2 indicira veliku raznovrsnost mi{ljenja i mora biti istra`ena.
- basic result analyses, - additional result analyses, and - monitoring of the customer satisfaction stability. Data are mostly analysed by software. Less advanced statistical analyses are made with the aid of the Microsoft Excel software package, whereas specialist padages, such as STATISTICA, SAS, or SPSS are less complex to use and data are analysed faster. 3.6.1. Basic result analyses Basic analyses include statistic tools for examining one dimension of quality, and they are unable to provide interrelations of the measured dimensions of the product/service quality and general satisfaction. Basic result analyses of the customer satisfaction measurement are:
- establishing distribution frequency, - major frequency measurement, - establishing probability and deviaiton standards.
3.6.2. Complex analyses of measurement results Complex analyses can be divided into two groups: co-relation measurement techniques and dependence measurement techniques. Most of these analyses is used to estabilish key attributes and their co-relations with the general customer satisfaction. These analyses are:
- Co-relation analysis, - Pareto analysis, - Ishikawa diagram, - Analysis factor, - Group analysis, etc [2].
3.6.3. Average values There types of average values are calculated: arthmetic mean, mode and median. Arithmetic mean is always expressed in standard deviation, which gives valid information on the reply deviations. Therefore on a ten-point scale, standard devation over 2 indicates great difference of option and has to be exavined.
3.6.4. Korelaciona analiza
Korelacija je mjera utjecaja dvije varijable jedna na drugu - ako jedna raste, da li raste i druga. U podacima zadovoljstva analizira se utjecaj svakog elementa zadovoljstva na ukupno zadovoljstvo i donosi se zaklju~ak koji element ima najve}i utjecaj na ukupno zadovoljstvo, odnosno kako varijacije u performansama svakog zahtjeva uti~u na ukupno zadovoljstvo.
3.6.4. Co-relation analysis
Co-relation is a measure of mutual effect of two variables; if one grows, with the other grow too? In the data on satisfaction, the impact of each element on general satisfaction is being analysed. Conclusion is then made on which element has the biggest impact on the general satisfaction, that is how variations in performance of each demand affect the general satisfaction.
- 260 -

Ma{instvo 4(6), 251 – 264, (2002) S.Brdarevi},….: METODE MJERENJA ZADOVOLJSTVA...
3.6.5. Komentari Komentari osiguravaju dublje razumijevanje rezultata mjerenja. Za bolje analiziranje komentara, grupi{u se u kategorije, ako je ih vi{e od dva ili tri. 3.6.6. Indeksi Kori{tenje indeksa je standardna praksa u postavkama modeliranja. Sva tzv. survey mjerenja sastoje se od dvije komponente: istinite informacije i gre{ke. Kombiniranje broja mjerenja u jedan indeks uve}ava proporciju istine u odnosu na gre{ku, i obezbje|uje bolju sliku rezultata ta~nog, glavnog elementa svakog mjerenja. 3.6.6.1. Indeks zadovoljstva kupca Indeks zadovoljstva kupca (Customer satisfaction index) je najbolja pojedina~na mjera koliko je op}enito zadovoljan va{ kupac. Za ra~unanje indeksa zadovoljstva mora se kombinovati rezultat va`nosti (Vi)i zadovoljstva za produciranje te`inskog srednjeg rezultata, koji ~esto predstavlja procenat teoretskog maksimuma. Prvo se mora izra~unati te`inski faktor (TFi) za svaki zahtjev tako {to se podijeli rezultat va`nosti sa ukupnom vrijednosti rezultata va`nosti.
TFi=Vi/ΣVi=V............................(1) Te`inski rezultat (TRi) je umno`ak rezultata zadovoljstva (Zi) i te`inskog faktora za svaki zahtjev.
TRi=ZixTFi.................................(2) Kona~no, Indeks zadovoljstva kupca (CSI) je zbir svih te`inskih rezultata.
CSI=ΣTRi..................................(3) Indeks zadovoljstva kupca CSI ne prelazi vrijednost 10, odnosno 100%. ^e{}e se izra`ava u procentima.
3.6.5. Comments
Comments enable deepor understanding of the measurement results. For better anolysis, results are elassified into groups, in case there are more than two of there of them.
3.6.6. Indexes Use of indexes is a standard practice in modeling setups. All so called survery measurements consist of two components: truethful information and error. Combination of a measurement number into an index increases the propostion of truth in relation to error and provides a better view of the result of the precise, main element of each measurement.
3.6.6.1. Customer satisfacton index Customer satisfaction index is the best individual measure of how generally satisfied you customer is. Calculation of satisfaction index consists of combining the rezult of importance and satisfaction to produce the mean weight result, which often reprezents a percentage of theoretical maximum. Waight factor (TFi) has to be calculated first for each demand by dividing the importance rezult (Vi) with the total value of the importance result.
TFi=Vi/ΣVi=V............................(1) The weight rezult (TFi) is reached by multiplying the satisfaction rezult (Zi) and the weight factor for each demand
TRi=ZixTFi.................................(2)
Finally, customer satisfaction index (CSI) is a sum of all weight rezults.
CSI=ΣTRi..................................(3) Customer satisfaction index never exceeds 10, that is 100 % . It is more often expressed in percent.
3.7. Prezentiranje rezultata 3.7.1. Analiza propusta Na~in za identificiranje tzv. "brzih pobjeda" (quick wins) je analiza propusta (Gap analysis). Naime, proces pobolj{anja ne mora uvijek polaziti od utvr|enog mjesta najmanjeg zadovoljstva, {to je ~est slu~aj nakon interpretacije rezultata. Efektivan na~in za ciljanje adekvatnog procesa pobolj{anja je otkrivanje podru~ja najve}ih razlika u odnosu va`nost - zadovoljstvo. Metodom Gap analysis, koja uporedo grafi~ki prikazuje rezultate va`nosti zahtjeva i njihovog ispunjenja, lako se adresiraju ova mjesta.
3.7. Prezentation of the results
3.7.1. Gap analysis
So called "quick wins" can be identified by gap analysis. Namely, improvement process does not necessarily have to start with an established spot of the least satisfaction, which is often the case upon interpretation of the results. An efficiont way to target an adequate improvement process is finding out the greatess differences in the importance – satisfaction relationship. The gap analysis method, which in parallel graphically prezents the rezults of the importance of demands and their fulfillment, easily addresses these spots.
- 261 -

Ma{instvo 4(6), 251 – 264, (2002) S.Brdarevi},….: METODE MJERENJA ZADOVOLJSTVA...
3.7.2. Put nezadovoljstva Va`no je, tako|e, sagledati i koja podru~ja su uzrokom posebnih nezadovoljstava kupaca. Jedan od indikatora je broj negativnih komentara datih za odre|eno podru~je. Za bolje razumijevanje ovih komentara mogu se grupisati u specifi~ne probleme.
3.7.3. Put zadovoljstva Kombiniranjem rezultata va`nosti sa koeficijentom dobijenim korelacijom elementa zadovoljstva sa ukupnim zadovoljstvom identificira se put zadovoljstva. Grafi~ki prikaz je kvadrant sa apscisom utjecaj i ordinatom va`nost. Pozicija puta zadovoljstva je gornji-desni prostor kvadranta.
3.7.4. Biznis utjecaj Na~in za identificiranje "brzih pobjeda" (quick wins) je i kori{tenje matri~nog grafikona uno{enjem vrijednosti propusta nasuprot tro{ka odnosno te`ine pobolj{anja. Figura tro{ak je tipi~no op}enita, izra`ena skalom od tri do pet od najni`eg ka najvi{em.
3.7.2. Dissatisfaction drivers It is also important to view areas which cause special customer dissatisfaction. One of the indicators is the number of negative commends for specific area. To better understand such comments, they can be grouped into specific problems.
3.7.3. Satisfaction drivers Satisfaction drivers are identified by combining the results of importance with the coefficient from the co-relation of the satisfaction drivers and the total satisfaction. The quadrant with the impact abscissa and the importcuce ordinate is graphically prezented in Figure 4. Satisfaction drivers is the upper right quadrant area.
3.7.4. Business impact A way to identify "quich wins" is using a matrix graph and Entering the value of gaps against costs, that is the degree of improvement. The figure cost is typically general, expressed in a seale from thoce to five starting from the lowest and increasing to the highest.
10.0
9.5
9.0
8.5
8.0
7.5
7.0
Pouzdanost isporuke Kvalitet proizvoda
Pouzdanost proizvoda
V A Ž N O S T
Vrijeme isporuke
Cijena Kvalitet servisa Ljubaznost osoblja
Držanje obećanja Stanje zaliha Ljubaznost osoblja 6.5
6.0 0.35 0.50 0.65
UTJECAJ
Slika 3: Kvadrant puta zadovoljstva
10.0
Accuracy of deliveries Product quality 9.5Product reliability
9.0 I M P O R T A
Delivery time 8.5
8.0 Price 7.5 Service quality Staff kindness
Keeping promises 7.0 Supplies Staff kindness 6.5
6.0 0.35 0.50 0.65
IMPACT
Figure 3. Cap analysis
Veliko Pouzdanost proizvoda
Cijena Imidž kompanije Kvalitet proizvoda
Dostupnost zalihama
TROŠAK POBOLJŠANJA
Brzina telefonskih odgovora Vođenje vremena Kvalitet servisa
Znanje osoblja
Dojam prvog kontakta
Držanje obećanja Pouzdanost isporuke
Ljubaznost osoblja
Malo -2.0 -1.00 1.00
PROPUSTI ZADOVOLJSTVA -0.00
Slika 4: Kvadrant utjecaja na biznis
- 262 -

Ma{instvo 4(6), 251 – 264, (2002) S.Brdarevi},….: METODE MJERENJA ZADOVOLJSTVA...
Large Product realiability
Price Company image Product quality
Availability supplies
Cost of
improvement
Speed of reply by phone Time management Service quality
Knowledge staff Effect first contact Keeping promises Accuracy of deliveries
Staff kindnes
Small -2.0 -1.00
Zahtjevi u prostoru kvadranta dole-desno su sekcija "brzih pobjeda". 3.7.5. Prioriteti za pobolj{anja Poku{avaju}i balansirati sve ove ~injenice sa svakom od njih u nastojanju fokusiranja pobolj{anja, mo`e do}i do konfuzije. Dobar na~in za izbjegavanje konfuzije je izlazna tablica, koja sumira sve klju~ne nalaze, kao na primjeru: Iz izlazne tablice lako je identificirati prioritete za pobolj{anje - PFIs. U ovom primjeri, prioriteti za pobolj{anje su:
- kvalitet proizvoda - vo|enje vremena.
Ne treba praviti gre{ku i poku{avati pobolj{ati previ{e stvari odjednom. Mnogo je efektivnije napraviti ve}a pobolj{anja u manjem broju podru~ja, nego vi{e neznatnih pobolj{anja.
The demands in the lower-right side of the quadrant represent the quick-wins section. 3.7.5. Priorities for improvements (PFIS) Trying to balance all these facts in order to focus improvements might lead to a confusion. A good way to avoid confusion is output table, which summarises all the key findings, as in the example below: Priorities for improvement (PFIS) are easy to identify in the table. In this example they are: - product quality - time management. A mistake should not be made by trying to improve too very things at once. It is much more efficient to make bigger improvements in a smalles range of areas rather than making many insignificant improvements.
Tabela 4.: Izlazna tablica mjerenja zadovoljstva kupaca - prioriteti za pobolj{anje Table 4: Output table of customer satisfaction measurement – priorities for improvement
Zahtjev - Demand
Analiza propusta –
Gap analysis
Pur zadovoljstva Satisfaction drivers
Put nezadovoljstva Dissatisfaction
drivers
Tro{ak – Dobit
Cost-Gain
Total – Total
kvalitet proizvoda/usluge product/service quality
pouzdanost isporuke realiability of delivery pouzdanost proizvoda realiability of product vo|enje vremena time management
cijena – price kvalitet usluge service quality
brzina odgovora telefonom speed of reply by phone
ljubaznost osoblja kindness of staff imid` organizacije organization image
1.00 PROPUSTI ZADOVOLJSTVA
-0.00
Slika 4: Business impact quadrant
- 263 -

Ma{instvo 4(6), 251 – 264, (2002) S.Brdarevi},….: METODE MJERENJA ZADOVOLJSTVA...
3.8. Kori{tenje Mjerenja zadovoljstva kupca (CSM) za pobolj{anje zadovoljstva kupca
Rezultati mjerenja zadovoljstva kupca mogu djelovati obeshrabruju}e. Klju~ je u brzom djelovanju, potpunoj predanosti ka postizanju cilja, bez o~ekivanja ~uda. Va`no je ne ciljati previsoko u pobolj{anju zadovoljstva, jer je to spor i dugotrajan proces. Najvi{i nivo zadovoljstva je prvo mjesto koje je najte`e pobolj{ati. Na primjer, vrlo je te{ko na~initi zna~ajno pobolj{anje ako je Indeks zadovoljstva iznad 90%. Suprotno, Indeks zadovoljstva ispod 60% sugerira da se nivo performansi mo`e i mora su{tinski pobolj{avati, mo`da 5% u prvoj godini. Srednji Indeks zadovoljstva, u rasponu 75-80%, mo`e se realno pobolj{avati od 1% do 1,5% po godini.
3.9. Povratna veza Nakon izvje{taja rezultata vrhu menad`menta, rezultati se trebaju publicirati i na svim nivoima organizacije. To ne mora biti kompletan report, ali je va`no da budu uklju~eni svi uposlenici. Jedna od mogu}nosti je organiziranje radionica u podru~jima adresiranim kao primarno zainteresovanim. Uposlenici ~esto imaju dobrih ideja kako rije{iti probleme, a osim toga, na ovaj na~in ih se uklju~uje u cjelokupan proces. Pored toga, povratna veza nakon obavljenog i analiziranog mjerenja zadovoljstva treba biti ostvarena i sa kupcima. Kupci trebaju biti informisani o dobijenim rezultatima, barem o dijelu njih, a na organizaciji je da osmisli na~in kako to realizirati u praksi.
3.8. Customer satisfaction measurement (CSM) used for customer satisfaction improvement
The results of the customer satisfaction measurement night seen discouraging. The key is to act promply, fully commit oneself to achieving the goal without expecting miracles. It is important not to am to high in improving customer satisfaction because it is a slow and long-term process. The highest level of satisfaction is the first place, which is the most difficult to achieve. For exa-mple, it is very difficult to make significent improvements if the satisfaction index is over 90 %. Contrary to that, the satisfaction index below 60 % suggests that the level of performance can and has to be essentially improved, perhaps 5 % in the first year. The average satisfaction index, in the range from 75-80 % can realistically be improved for 1 % to 1,5 % annually.
3.9. Feedback
After the results are presented to the top mangement, they should also be publicised at all the organisation levels. It does not necessarily have to be a complete report, however it is important that all the employees be included. One of the possibilities is to organise a workshop in the areas addressed as primary interested. Employees often have good ideas how to solve problems, and besides they are included in the overall process. Apart from that, the feedback link after publicising and analysing the satisfaction measurements, should be established with the customers too. Customers should be informed about the results, or at least a part of the results and it is up to the organisation to turnk of the way to realise it in practice.
3.10. Ponovljanja mjerenja Program za pra}enje zadovoljstva kupca vremenom postaje irelevantan, jer se aspekti proizvoda i usluga bitni za kupca mijenjaju. Zbog toga je potrebno da u procesu pra}enja zadovoljstva kupca postoji aktivnost koja prati promjene u zahtjevima kupaca i ugra|uje nove perspektive u teku}i program istra`ivanja zadovoljstva kupca. Jedno od rije{enja je kori{tenje softverskih alata i analiza (poput QFD analize), koji obezbje|uju da proces ispitivanja zadovoljstva kupaca ostane relevantan. Izme|u glavnih prikaza, organizacija koristi druge izvore informacija o kupcima, poput `albi, povratnih informacija od kupaca kroz kontakte sa osobljem ili internim mjerenjima. Tzv. Customer survey mora biti ponovljen jedanput godi{nje ili vi{e puta. Kompletno istra`ivanje treba biti vo|eno svake tri godine ako se zahtjevi kupaca sporije mijenjaju.
3.10. Remeasure The customer satisfaction measurement program becomes irrelevent with time because the aspects of products and services relevant to the customer change. That is why an activity following the changes in the customer demands and building in new perspectives in the current programme is necessary. One of the solutions is using software tools and analyses (such as QFD analysis), which enable the customer satisfaction measurement process to remain relevant. Besides main reviews, an organisation uses other sources of information on customers, such as complaints, fecdback information from customers through contacts with their staff and internal measurements. So called customer survey needs to be repeated one or several times a year. If the customer demands change more slowly, a complete rescarch should be done every three years [1].
- 264 -

Ma{instvo 4(6), 251 – 264, (2002) S.Brdarevi},….: METODE MJERENJA ZADOVOLJSTVA...
4. NACIONALNI INDEKSI MJERENJA ZADOVOLJSTVA KUPCA
Uvi|aju~i zna~aj mjerenja zadovoljstva kupca, pojedine dr`ave su definisale i uvele proces mjerenja zadovoljstva kupca na nivou dr`ava. [vedska je bila prva dr`ava koja je 1989. godine uvela "[vedski barometar zadovoljstva". Danas je takav vid mjerenja zadovoljstva kupca na nacionalnom nivou sve prisutniji u svijetu [10]. Arhitekta {vedskog "barometra zadovoljstva" kupca Profesor Class Fornell, u saradnji sa Nacionalnim istra`iva~kim centrom za kvalitet SAD, Poslovnom {kolom mi~igenskom univerziteta i Ameri~kog dru{tva za kvalitet (ASQ) razvio je 1994. godine ACSI - American Customer Satisfaction Index, odnosno indeks zadovoljstva ameri~kih kupaca. ACSI obuhvata mjerenje sedam ekonomskih sektora, 35 industrijskih (uklju~uju}i e-commerce), 190 kompanija i federalne ili lokalne vladine agencije. Metodom slu~ajnih telefonskih poziva (random-digit-dial RDD), godi{nje se identificira i intervjui{e vi{e od 70.000 kupaca. Rezultati ovih mjerenja su javni, predstavljaju pravi glas kupca i najbolji su vodi~ kompanijama za sagledavanje op}eg stanja i planiranje pobolj{anja sistema kvaliteta. Npr., kompanija IBM procjenjuje da porast indeksa zadovoljstva za 1%, rezultira sa 100 miliona dolara ekstra prodaje u narednih pet godina [13]. Metodologija ovakvog mjerenja zadovoljstva kupca razlikuje se od ostalih metodologija mjerenja i nije primjenjiva za organizacije, te stoga nije predmet detaljnije analize u ovom radu.
4. NATIONAL CUSTOMER SATISFA-CTION MEASUREMENT INDEXES
Realising the importance of customer satisfaction measurements, some countries have introduced it at the national level. Sweden was the first country to introduce the "Swedish satisfaction barometer" in 1985. Nowadays, such way of customer satisfaction measurement at the national level is increasingly present in the world [10]. The architect of the Swedish satisfaction barometer, professor Class Fornell, in co-operation with the National Emality Research Centre, USA, Michigan University Business School and the American Society for Quality (ASQ) developed in 1994 the ACSI – American Customer Satisfaction Index, that is the index of satisfaction of the American customers. ACSI encompasses measurements of seven economy sectors, 35 industrial fields (including e-commerce), 190 companies and Federal and Local Government agencies. The random – digital-dial (ROD) method annually identifies and interviews more than 70,000 customers. The results of the measurements are public, they represent the true voice of the customers, and are the best guide to companies in viewing the general situation and planning improvements of the quality system. For example, IBM estimates that a customer satisfaction index increase of 1 % results in $ 100 milion extra sales in the nexf five years [13]. The methodology of a measurement like this is different from others and is unapplicable in organisations. Therefore, it is not the subject of any furtner analysis in this paper.
5. ZAKLJU^AK Mjerenje zadovoljstva kupca je nau~ni i sistemati~ni na~in prikupljanja informacija koje su osnova ocjenjivanja uspje{nosti organizacije kao i osnova planiranja procesa pobolj{anja. Bez identificiranja zahtjeva kupaca i mjerenja njihova zadovoljstva, svaka inicijativa na pobolj{anju sistema kvaliteta je proizvoljna, a sudbina organizacije, u `estokim tr`i{nim borbama, potpuno neizvjesna. Zbog ovih razloga je novo izdanje standarda ISO 9000:2000 u prvi plan postavilo kupce, odnosno zahtjeve kupaca i zadovoljstvo kupca. Prema novom standardu ISO 9000:2000, proces mjerenja zadovoljstva kupca je jedan od pet procesa upravljanja kvalitetom, i obavezan je za sve organizacije koje su du`ne razviti i provoditi vlastiti program mjerenja zadovoljstva kupca.
5. CONCLUSION Customer satisfaction measurements is a scientific and a systematic way of gathering information that is the basis of evaluating success of an organisation and planning the improvement process. Without identifying customer demands and measuring their satisfaction any initiative for quality system improvement is arbitrary, and the faith of the organisation, in severe lights in the market, is totally uncertain. Due to the above, the new addition of the 9000:2000 ISO standard has set customers in the front row, along with their demands and satisfaction. According to the new 9000:2000 ISO standard, the process of customer satisfaction measurement is one of the five processes of quality management, it is obligatory for all organisations, which are responsible for developing and conducting their own customer satisfaction measurement programme.
- 265 -

Ma{instvo 4(6), 251 – 264, (2002) S.Brdarevi},….: METODE MJERENJA ZADOVOLJSTVA...
Kako se iz rada mo`e zaklju~iti, zbog specifi~nosti mjerenja gdje ne postoji objektivno mjerno sredstvo, metode mjerenja zadovoljstva kupca su vrlo zahtjevne i iziskuju istra`ivanje uz nau~ni, stru~ni i sistematski pristup. Istra`ivanja autora na svjetskim iskustvima potvr|uje da su postoje}e metode mjerenja zadovoljstva kupca prili~no sli~ne, i mahom se baziraju na anketnom principu. Razlike su ipak prisutne, kao u na~inu identificiranju kupaca i njihovih zahtjeva, u na~inu dizajniranja upitnika, analizi dobijenih rezultata, te akcijama nakon provedenih mjerenja. Tipi~na metodologija mjerenja zadovoljstva kupca, kao i nacionalni indeks zadovoljstva ameri~kih kupaca, ACSI, po mi{ljenju autora, dovoljno jasno ilustriraju problematiku mjerenja zadovoljstva kupca.
It can be concluded from the paper that, due to specific characteristics of measurement without any objective measurement tools, customer satisfaction methods are extremely demanding and require research with a scientific, professional and systematic approach. The autors' research of the world-wide experience has confirmed that the existing customer satisfaction measurement methods are very similar and are mostly based on the survey principle. Differences however exist, both in the way of identifying customers and their demands, in the survey design, analysis of the results, and actions after measurements. It is the opinion of the authors that a typical customer satisfaction measurement methodology and the national American Customer Satisfaction Index (ACSI) clearly enough ilustrate the problems related to customer satisfaction measurement.
6. LITERATURA - REFERENCES [1] Grupa autora: Guide to customer satisfaction
measurement (CSM) for ISO 9001:2000, Leadership Factor, SAD, mart 2002.
[2] Stoiljkovi} V.: Pobolj{anje procesa
obrazovanja, Quality Businnes management, Ni{, mart 2000.
[3] Stoiljkovi} V., Jovan~i} S., Stoiljkovi} P.:
Proces mjerenja zadovoljstva kupca, Quality Businnes management, CIM College, Ni{, juni 2001.
[4] Popovi} Lj.: Sistem kvaliteta u obrazovanju,
Quality Businnes management, Ni{, septembar 2000.
[5] Alispahi} N.: sistem kvaliteta prema novim
standardima ISO 9000:2000, Privredna komora BiH, Sarajevo, 2002.
[6] Be{ker M, [piljar M.: Principi izgradnje
sustava kvaliteta prema normi ISO 9000:2000, Me|unardni nau~no-stru~ni skup "KVALITET '99", Ma{inski fakultet Zenica, Zenica, 1999.
[7] Vavra T.: Customer satisfaction measurement simplified, ASQ, SAD, 2002.
[8] Grupa autora: Sistem kvaliteta - Unapre|enje,
metode i tehnike, IIS - Istra`iva~ki i tehnolo{ki centar Univerziteta u Novom Sadu, Novi Sad, 1995.
[9] Brdarevi} S.: Predavanja na postdiplomskom
studiju "Upravljanje kvalitetom", Ma{inski fakultet Zenica, Zenica, 1999.
[10] Materijali sa web site-a: www.theasci.org [11] Materijali sa web site-a:
www.leadershipfactor.com [12] Materijali sa web site-a: www.cet.co.yu [13] Jude Nottingham: Why measure Customer
satisfaction (Powerpoint presentation), Leadership Factor, SAD, 2002.
- 266 -