revisiting the relationship between soil moisture and n o ... · revisiting the relationship...
TRANSCRIPT

1
Revisiting the relationship between soil moisture and N2O production pathways by measuring 15N2O isotopomers Kate A. Congreves1, Trang Phan1, and Richard E. Farrell2 1Department of Plant Sciences, 2Department of Soil Science, University of Saskatchewan, Saskatoon, SK S7N 5A8
Correspondence to: Kate A. Congreves ([email protected]) 5
Abstract
Understanding the production pathways of potent greenhouse gases, such as nitrous oxide (N2O), is essential for
accurate flux prediction and for developing effective adaptation and mitigation strategies in response to climate
change. Yet, there remain surprising gaps in our understanding and precise quantification of the underlying production
pathways – such as the relationship between soil moisture and N2O production pathways. A powerful, but arguably 10
underutilized, approach for quantifying the relative contribution of nitrification and denitrification to N2O production
involves determining 15N2O isotopomers and 15N site preference (SP) via spectroscopic techniques. Using one such
technique we conducted a short-term incubation to precisely quantify the relationship between soil moisture and N2O
production pathways. For each of three soils, microcosms were arranged in a complete random design with four
replicates; each microcosm consisted of air-dried soil packed into plastic petri dishes wherein moisture treatments 15
were established for water contents equivalent to 45 to 105% water-filled pore space (WFPS). The microcosms were
placed in 1-L jars and sealed; headspace samples were collected after 24-h and analyzed for total N2O concentrations
using gas chromatography, and for 15N2O isotopomers using cavity ring-down spectroscopy. Relatively low N2O
fluxes and high SP values indicted nitrification during dry soil conditions, whereas at higher soil moisture, peak N2O
emissions coincided with a sharp decline in SP indicating denitrification. This pattern supports the classic N2O 20
production curves from nitrification and denitrification as inferred by earlier research; however, our isotopomer data
enabled the quantification of source partitioning for either pathway thereby providing clarity on N2O sources during
the transition from nitrification to denitrification. At soil moisture levels < 53% WFPS, the fraction of N2O emitted
was predominately attributed to nitrification but thereafter decreased rapidly, according to: 𝐹" = 3.19 − 0.041𝑥, until
a WFPS of 78%. Simultaneously, from WFPS of 53 to 78%, the fraction of N2O that was attributed to denitrification 25
was modelled as: 𝐹, = −2.19 + 0.041𝑥; at moisture levels of > 78%, denitrification completely dominated. Clearly,
the soil moisture levels during transition is a key regulation of N2O production pathways.
1. Introduction
Soils are the largest source of anthropogenic N2O emissions, representing up to 80% of total N2O emissions 30
(Environment Canada., 2015). Understanding the mechanisms leading to the emission of this potent greenhouse gas
is essential for accurate flux prediction and for developing effective adaptation and mitigation strategies in response
to climate change. Decades of research have strengthened our understanding of N2O fluxes—namely, how N2O
SOIL Discuss., https://doi.org/10.5194/soil-2019-27Manuscript under review for journal SOILDiscussion started: 13 May 2019c© Author(s) 2019. CC BY 4.0 License.
2
production is regulated by soil oxygen, substrate availability, and microbial activity (Butterbach-Bahl et al., 2013;
Chapuis-Lardy et al., 2007; Wagner-Riddle et al., 2017); how N2O emission is regulated by advection, solubility and
diffusion (Balaine et al., 2013; Clough et al., 2005). However, there remain surprising gaps in our understanding of
the underlying mechanisms, one such area being the relationship between soil moisture and N2O production pathways.
Nitrous oxide is a product of nitrification and denitrification—microbially driven processes that depend on the aeration 5
status of the soil (Banerjee et al., 2016; Barnard et al., 2005). As a result, the relative contributions of nitrification and
denitrification are often determined based on their relationship to soil water-filled-pore space (WFPS), which acts as
a proxy for aeration status. However, the widely cited relationship between soil N2O production and soil moisture
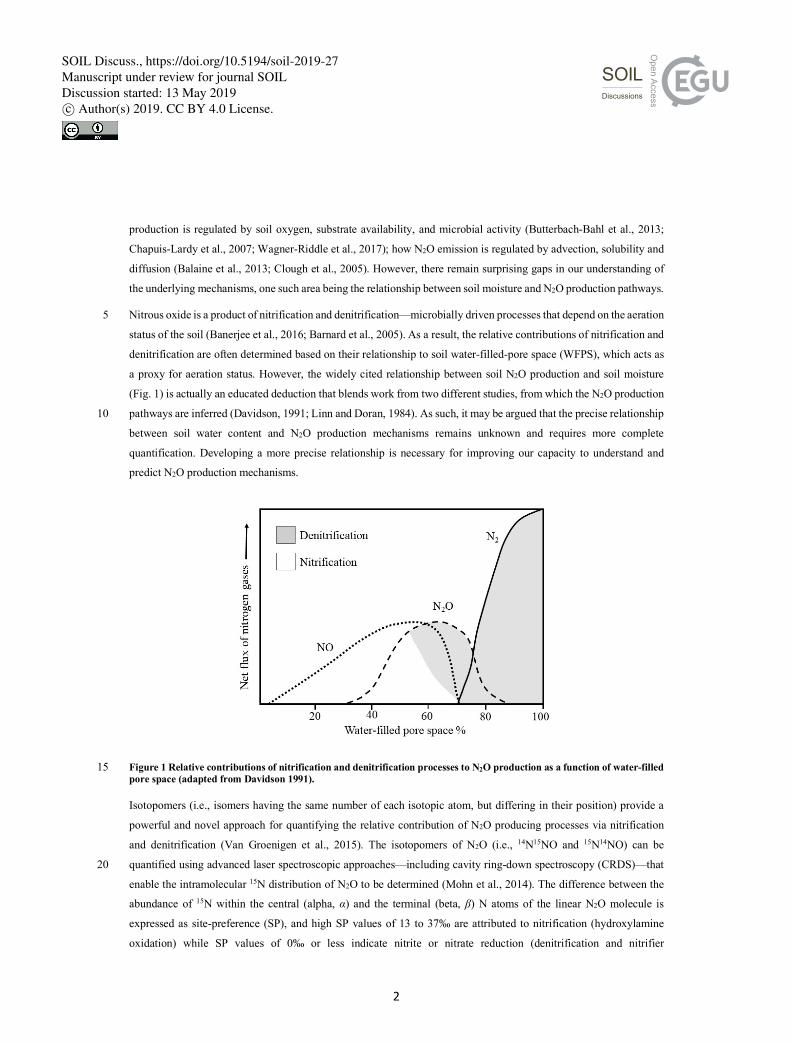
(Fig. 1) is actually an educated deduction that blends work from two different studies, from which the N2O production
pathways are inferred (Davidson, 1991; Linn and Doran, 1984). As such, it may be argued that the precise relationship 10
between soil water content and N2O production mechanisms remains unknown and requires more complete
quantification. Developing a more precise relationship is necessary for improving our capacity to understand and
predict N2O production mechanisms.
Figure 1 Relative contributions of nitrification and denitrification processes to N2O production as a function of water-filled 15 pore space (adapted from Davidson 1991).
Isotopomers (i.e., isomers having the same number of each isotopic atom, but differing in their position) provide a
powerful and novel approach for quantifying the relative contribution of N2O producing processes via nitrification
and denitrification (Van Groenigen et al., 2015). The isotopomers of N2O (i.e., 14N15NO and 15N14NO) can be
quantified using advanced laser spectroscopic approaches—including cavity ring-down spectroscopy (CRDS)—that 20
enable the intramolecular 15N distribution of N2O to be determined (Mohn et al., 2014). The difference between the
abundance of 15N within the central (alpha, α) and the terminal (beta, β) N atoms of the linear N2O molecule is
expressed as site-preference (SP), and high SP values of 13 to 37‰ are attributed to nitrification (hydroxylamine
oxidation) while SP values of 0‰ or less indicate nitrite or nitrate reduction (denitrification and nitrifier
SOIL Discuss., https://doi.org/10.5194/soil-2019-27Manuscript under review for journal SOILDiscussion started: 13 May 2019c© Author(s) 2019. CC BY 4.0 License.

3
denitrification) (Denk et al., 2017; Ostrom et al., 2010; Sutka et al., 2006; Toyoda et al., 2005). The underlying reason
for the distinct differences in SP values of N2O from either microbial pathway is due to primary kinetic isotope effects
when N2O is produced (Popp et al., 2002).
Our objectives were to precisely quantify the relationship between soil moisture and N2O production by measuring 15N2O isotopomers; and evaluate the variability in this relationship based on differences in soil nutrient levels, organic 5
matter, and texture. The term “isotopomer” is used herein to indicate molecules of the same mass in which the trace
isotopes are arranged differently. This differs from “isotopologue”, which is a more general term referring to
molecules that differ in isotopic composition.
2. Materials and Methods
2.1 Soil collection and characterization 10
Surface (0–10 cm) soils representing different nutrient levels and texture classes were collected from three locations
in the Dark Brown soil zone in Saskatchewan, Canada. The soils—classified as Dark Brown Chernozems of the
Sutherland, Asquith and Bradwell associations—were collected using a shovel, air dried and sub-samples were
shipped to A&L Laboratories Inc (London, ON) for analysis (Table 1). For additional characterization, sub-samples
were analyzed at the University of Saskatchewan for equilibrium soil water content, soil inorganic N levels, soil total 15
N concentration and 15N abundance (Table 1). The equilibrium soil water was determined via the long-column method
based on the average of four technical replicates (Reynolds and Topp, 2007). Initial soil NO3- and NH4+ concentrations
were determined in quadruplicate using the KCl extraction method of Maynard et al. (2007); briefly, 5 g soil was
mixed with 50 mL of 2 M KCl, shaken for 30-min, filtered through Whatman 42 filter paper, and the extracts frozen
at -20°C until they could be analyzed. For analysis, the extracts were thawed and allowed to equilibrate to room 20
temperature before being analyzed using air segmented (continuous) flow analysis with a SEAL AA3 HR chemistry
analyzer (SEAL Analytical; Kitchener, ON). Soil total N concentration (%) and 15N content (atom%) were determined
in duplicate using a Costech ECS4010 elemental analyzer (Costech Analytical Technologies Inc., Valencia CA)
coupled to a high-precision Delta V mass spectrometer (Bremen, Germany) with a precision of 0.06‰ for d15N.
Chickpea flour with an atom% 15N = 0.3691 was used as a lab reference. 25
2.2 Incubation experimental design
For the incubation study, soil microcosms were arranged in a randomized complete design with four replicates. For
each microcosm, air-dried soil was packed into a small (5.9 cm i.d. ´ 0.80 cm tall) plastic petri dish. The mass of soil
needed to fill the petri dish varied with texture—ranging from 22.0 g to 29.0 g—and yielded soil bulk densities of
1.01, 1.10, and 1.33 g cm-3 for the Sutherland, Asquith, and Bradwell soils, respectively. While the quantities and bulk 30
densities differed for each soil type, it was essential that the soil completely fill the petri dishes to avoid any differences
in soil surface boundary layer or gas diffusion that would alter N2O emission.
SOIL Discuss., https://doi.org/10.5194/soil-2019-27Manuscript under review for journal SOILDiscussion started: 13 May 2019c© Author(s) 2019. CC BY 4.0 License.

4
Soil moisture treatments were based on gravimetric soil water content (θg) established by adding deionized water to
the soil microcosms, using a fine mist of water applied from a manual spray bottle, to a predetermined weight.
Gravimetric soil moisture content was varied to yield a water-filled pore space (WFPS) between 45 and 105%.
The gravimetric water, volumetric water, and WFPS were determined according to Eq. (1-3):
5
𝐺𝑟𝑎𝑣𝑖𝑚𝑒𝑡𝑟𝑖𝑐𝑤𝑎𝑡𝑒𝑟𝜃;(𝑔𝐻?𝑂𝑔𝑠𝑜𝑖𝑙DE) =GHIJKHLLJL(;)
LKMNOPQ(;) (1)
𝑉𝑜𝑙𝑢𝑚𝑒𝑡𝑟𝑖𝑐𝑤𝑎𝑡𝑒𝑟𝜃T(𝑐𝑚U𝐻?𝑂𝑐𝑚U𝑠𝑜𝑖𝑙DE) = 𝜃; × 𝐵𝐷 (2)
%𝑊𝐹𝑃𝑆 = ] _̂
`EDabcbde × 100 (3) 10
where, BD denotes soil bulk density and PD denotes particle density (PD), which was assumed to be 2.65 g cm-3.
Immediately after moistening the soil microcosm, the petri dish was sealed inside a 1L wide-mouth mason jar fitted
with a gas sampling septum, and time of sealing was recorded. Blank jars containing an empty petri dish were set up 15
to account for background (atmospheric) gas concentrations. The microcosms were incubated at 22°C ± 1°C.
2.3 Sampling and analysis
After 24-hrs, a headspace gas sample was collected from each microcosm (with the time of sampling recorded) using
a 20-mL plastic syringe fitted with a 22-gauge needle, injected into an evacuated 12-mL Exetainer® tube (Labco
Limited, UK), and analyzed for N2O, CO2, and O2 concentration using gas chromatography (Bruker 450 GC, Bruker 20
Biosciences, Billerica, MA). A separate 30-mL gas sample was collected from each microcosm, injected into an
evacuated 12-mL Exetainer® tube, and analyzed for 15N2O concentration, d15Na, d15Nb, and d18O using a CRDS-based
Picarro G5131-i isotopic N2O analyzer (Picarro Inc.; Santa Clara, CA).
2.4 Isotopomer approach using 15N site preference and 𝛿 18O for N2O source identification
Site preference was calculated by subtracting the abundance of 15N from the terminal N atom (beta, β) from that of 25
the central (alpha, α) N atom. The fraction of N2O derived from hydroxylamine oxidation during nitrification (FN) or
the reduction of nitrate or nitrite during denitrification (FD) was estimated by adopting the isotopomer mixing approach
described by Deppe et al. (2017) and using the SP and 𝛿18O values of gas samples collected from the different soils.
As suggested by Well et al. (2012), and because SP was more closely correlated to 𝛿18O (r = 0.906) than 𝛿15N (r =
0.849), we used 𝛿18O instead of 𝛿15N. Equations (4) and (5) show the source partitioning calculations. 30
SOIL Discuss., https://doi.org/10.5194/soil-2019-27Manuscript under review for journal SOILDiscussion started: 13 May 2019c© Author(s) 2019. CC BY 4.0 License.
5
𝐹" = ghDghbghiDghb
(4)
𝐹, = 1 −𝐹" (5)
where FN and FD indicate the fraction of N2O derived from nitrification or denitrification, respectively, using SP 5
endmembers for nitrification (SPN) and denitrification (SPD).
Endmembers for SPD to SPN were set at: 2.0 to 23.7; 0.7 to 21.7; 14.4 to 23.3 for the Sutherland, Asquith, and Bradwell
soils, respectively. Endmembers for 𝛿18OD to 𝛿18ON were set at: 16.0 to 35.1; 18.8 to 39.5; 25.4 to 34.2 for the
Sutherland, Asquith, and Bradwell soils, respectively. The endmember ranges were based on our data where
SPN/𝛿18ON represented the average values before the transition zone from nitrification to denitrification-dominated 10
N2O production; SPD/𝛿18OD represented the lowest values during denitrification for each soil type.
For source partitioning, the influence of N2O reduction to N2 on SP was taken into account by using the reduction and
mixing line intercept approach – as described by Deppe et al., (2017). However, rather than using an estimated
reduction line derived from the literature, we calculated the slope and intercept for the reduction line based on our
data: the SP/𝛿18O plot for the soil moisture range after the transition zone for each soil type. The point of intersection 15
between the endmember mixing line and the reduction line gave the estimated initial isotope values (SP*, 18O) of
produced N2O before reduction to N2. In the soil moisture range after the transition from nitrification to denitrification,
if the SP* value was higher than the measured SP value of the gas sample, the measured SP value was used since N2O
reduction was assumed to be negligible. The FN and FD were then calculated from SP values (or SP*) and the SP
values of the nitrification and denitrification endmembers. This calculation was done for each soil type separately. 20
2.5 Statistical analysis
Correlation and linear regression analyses were conducted in CoStat (CoStat 6.451, CoHort.com) to determine
associations between soil moisture and SP.
3. Results and Discussion
3.1 Nitrous oxide fluxes 25
The three soil types resulted in dramatically different magnitudes of N2O fluxes. Maximum N2O fluxes were 100-fold
greater from the Sutherland soil (100 ng N2O-N g-1 d-1) compared to the Bradwell soil (1 ng N2O-N g-1 d-1), whereas
the Asquith soil had more moderate N2O emissions up to 24 ng N2O-N g-1 d-1 (Fig. 2). The differentiation follows the
same trend as soil inorganic N availability and soil organic matter, which decreased in the order: Sutherland > Asquith
> Bradwell (Table 1). 30
Regardless of the amount of N2O emitted, there were similarities in how soil moisture levels influenced the relative
amount of N2O produced. For all soil types, relatively low N2O fluxes were associated with drier soil treatments; N2O
SOIL Discuss., https://doi.org/10.5194/soil-2019-27Manuscript under review for journal SOILDiscussion started: 13 May 2019c© Author(s) 2019. CC BY 4.0 License.

6
fluxes were incrementally magnified as soil moisture levels increased from about 55 to 80% WFPS (Fig. 2, top panels).
Fluxes either remained relatively high as moisture levels exceeded ~ 80% WFPS, as was the case for the Sutherland
soil, or decreased slightly, as observed for the Asquith and Bradwell soils.
Figure 2 Top panels: N2O emissions as influenced by soil water filled pore space (WFPS), (black ink, left axis); 5 corresponding 15N2O isotopomer site preference (SP), (blue ink, right axis). Bottom panels: 𝛿 bulk 15N (black ink, left axis) and 𝛿 18O (blue ink, right axis) of emitted N2O as influenced by soil water filled pore space (WFPS). Note: N2O emissions were plotted on a log10 scale to accommodate the large range in emissions from the different soils.
3.2 Nitrous oxide 15N site preference, 𝛿 15N and 𝛿 18O
Not only total N2O concentration, but the 15N SP, 𝛿15N and 𝛿18O of N2O changed with soil moisture level, and in 10
parallel with each other (Fig. 2, bottom panels). We identified three moisture ranges—differing slightly for each soil
(Table 2)—that regulated N2O production pathways based on distinct SP, 𝛿15N and 𝛿18O values (Fig. 2).
For each soil, the 𝛿15N and 𝛿18O values decreased in the same soil moisture region in which the SP values decreased
(Fig. 2, bottom panels). Based on the patterns for N2O fluxes, SP, 𝛿15N and 𝛿18O values as related to soil moisture
(Fig. 2; Table 2), our results visually indicate there was a transition between nitrification-derived and denitrification-15
derived N2O production at between 64 and 83; 58 and 75; 63 and 75% WFPS for the Sutherland, Asquith, and Bradwell
soils, respectively.
0.01
0.1
1
10
100
N2O(ngg-1d-1 )
Sutherland
0
5
10
15
20
25
30
SitePreference
0 /00
BradwellAsquith
40 60 80 100
120
-15
-10
-5
0
5
10
15
WFPS (%)
15N-N
2O
40 60 80 100
120
WFPS (%)
10
20
30
40
50
18O-N
2O
40 60 80 100
120
WFPS (%)
SOIL Discuss., https://doi.org/10.5194/soil-2019-27Manuscript under review for journal SOILDiscussion started: 13 May 2019c© Author(s) 2019. CC BY 4.0 License.

7
Prior to the transition in N2O production pathway, when the soil was relatively dry, the SP values averaged 23.7, 23.3,
and 21.7‰ from the Sutherland, Asquith, and Bradwell soils, respectively. These values are in line with expected SP
values attributed to nitrification (Denk et al., 2017; Ostrom et al., 2010; Sutka et al., 2006; Toyoda et al., 2005).
Furthermore, the observed consistency among soil types – and the negligible (near 0) slopes between WFPS and 15N
SP – suggests that average SPs during nitrification are relatively insensitive to the rate of production or associated 5
N2O accumulation. It is known that isotopic fractionation governed by kinetic isotope effects occurs during the
reaction sequence NH4+ à NH2OH à NOH à NO à N2O and NH4+ à NO2 à NO à N2O; however, oxidation of
NOH does not involve a primary kinetic isotope effect and thus should not markedly affect SP (Popp et al., 2002).
During the transition from nitrification to denitrification, SP rapidly declined in all soils (Fig. 2, Table 2). The lowest
SP values were 2.0, 0.7, and 14.4‰ for the Sutherland, Asquith, and Bradwell soils, respectively. In general, sharp 10
slopes characterized the decline in SP values with increasing soil moisture during the transition; but the Sutherland
and Asquith soils had steeper slopes than the Bradwell soil (Table 2). This difference was likely related to differences
in soil inorganic or mineralizable N availability (Table 1) and possibly also to differences in the rates of denitrification.
After the transition to denitrification, the SP values increased slightly as soil moisture increased (Table 2) – but more
so for the Bradwell soil than the Sutherland and Asquith soils. This finding supports the sensitivity of SP values to the 15
degree of stepwise completion of denitrification (N2O reduction to N2). We hypothesize that the ratio of N2O produced
to N2O reduced was lowest from the Bradwell soil. Contrary to the large accrual of N2O from the Sutherland and
Asquith soils, the low concentration of N2O produced from the Bradwell soil likely favoured complete reduction (i.e.,
tighter ‘holes-in-the-pipe’) – causing the Bradwell soil SP values to be the most sensitive to reduction of N2O after
the transition to denitrification (Fig. 2, Table 2). Conversely, the greater amounts of N2O produced by the nutrient rich 20
Sutherland and Asquith soils may have overwhelmed any reduction effect on the SP of N2O. Our findings attribute
‘N2O leaky’ soils to excess inorganic N or mineralization potential.
3.3 The ‘hole-in-the-pipe’ influences site preference
As alluded to above, the Bradwell results were most dissimilar to the other soils. It is intriguing that the SP values for
the Bradwell soil N2O never dropped below 14.4‰. While it is clear from the pattern of N2O fluxes, SP, 𝛿15N and 25
𝛿18O values (Fig. 2) that N2O production transitioned to denitrification under moist soil conditions (Table 2), it is
curious that the SP values were not lower, closer to 0‰, as earlier work demonstrated for denitrification (Denk et al.,
2017; Ostrom et al., 2010; Sutka et al., 2006; Toyoda et al., 2005; Winther et al., 2018). Reasons for this discrepancy
are as yet unclear, but we are not alone in finding SP values above 0‰ that are attributed to denitrification (Winther
et al., 2018). Differences might be related to differences in microbial community structure and activity, though it is 30
also possible that N2O reduction to N2 played a larger than anticipated role for the Bradwell soil. Indeed, SP values
within the expected range for bacterial denitrification are known to be sensitive to the reduction of N2O to N2 (Deppe
et al., 2017; Jinuntuya-Nortman et al., 2008; Lewicka-Szczebak et al., 2014; Ostrom et al., 2007; Well and Flessa,
2009).
SOIL Discuss., https://doi.org/10.5194/soil-2019-27Manuscript under review for journal SOILDiscussion started: 13 May 2019c© Author(s) 2019. CC BY 4.0 License.

8
Denitrification results in cleavage of the covalent bond between the central N and O in N2O, and based on kinetic
isotope fractionation results in an increase in the 15N content of the α position of the residual N2O, thereby increasing
the SP (Popp et al., 2002; Ostrom et al., 2007). Thus, the increase in SP in response to N2O reduction results in a small
(but important) shift away from the SP values associated with the origins of denitrification (~ 0‰) towards those of
nitrification, i.e., 33‰ (Sutka et al., 2006). Ostrom et al. (2007) showed that the rate of reduction must be substantially 5
greater than 10% of that of production to impact the SP estimates of N2O from denitrification by more than a few
percent. Because it is likely that N2O consumption was greater than production for the Bradwell soil when soil
moisture exceeded 75% WFPS, our results indicate that the ‘size of the hole-in-the-pipe’ may influence denitrification
SP to a greater extent than previously documented.
For N2O source identification, we adopted an isotopomer mixing approach (Zou et al., 2014; Well et al., 2012) and 10
constructed isotopomer maps (i.e., plots of SP vs. d18O) following the procedure of Deppe et al. (2017). This approach
allowed us to estimate the impact of N2O reduction to N2 on SP. Reduction slopes for our three soils averaged 0.28,
which is similar to the average of 0.35 determined by Deppe et al. (2017), but varied over a wide range; i.e., from 0.16
to 0.52 (Fig. 3). A high reduction slope, such as observed for the Bradwell soil, might be associated with the magnitude
of N2O production relative to potential nitrous oxide reductase activity, or conditions that favour more complete 15
stepwise reduction of N2O to N2. Whereas the reduction effect on SP might be stronger than previously thought, it
may only be observable when conditions are favourable, as evidenced for the Bradwell soil. We echo earlier proposals
made by Ostrom et al. (2007), and suggest that the current knowledge and understanding of 15N2O isotopomers may
have inherent biases due to methodological focus on high flux scenarios – where the rates of N2O reduction are minor
and likely not of sufficient magnitude to alter isotopomer and SP data. Relatively few studies have focused on lower 20
flux scenarios when the rates of N2O reduction relative to production may exert more of an influence on SP. Our
findings support the hypothesis that N2O reduction is a minor process influencing SP during conditions of high soil
N2O flux, but may be more important for conditions with low N2O flux (Ostrom et al., 2007).
Figure 3 Isotopomer map to determine the source partitioning of N2O derived from nitrification versus denitrification using 25 15N site preference (SP) and 𝛿18O of N2O. The linear mixed model approach was based on Deppe et al. 2017, but with end-
10 20 30 40 50
-10
0
10
20
30
40
50
18O-N2O
15NSitePreference
0 /00
Reduction line (slope 0.16)Mixing lineSutherland
10 20 30 40 50
18O-N2O
Reduction line (slope 0.17)Mixing lineAsquith
10 20 30 40 50
18O-N2O
Reduction line (slope 0.52)Mixing lineBradwell
SOIL Discuss., https://doi.org/10.5194/soil-2019-27Manuscript under review for journal SOILDiscussion started: 13 May 2019c© Author(s) 2019. CC BY 4.0 License.

9
members derived from our data (mixing line). The reduction line was placed through the average SP value of gas samples derived from < 60% water-filled pore space range.
Due to the wide range of reduction slopes observed in our study – and the differences for how SP is influenced in
conditions with high flux vs low flux – we argue that using a single average reduction slope is insufficient to best 5
predict N2O reduction. It is recommended that further research better quantify the conditions that promote N2O
reduction for improved N2O source predictions. This could be particularly important for assessing microbial source
pathways of N2O production and consumption across seasonal and spatial scales, because sustained periods of low
flux are not uncommon.
3.4 Source pathway partitioning and modelling 10
Using data pooled from the isotopomer maps to model source partitions, linear models were developed that fit the
transitions for nitrification-derived N2O (R2 = 0.65, p < 0.001) and denitrification-derived N2O (R2 = 0.65, p < 0.001)
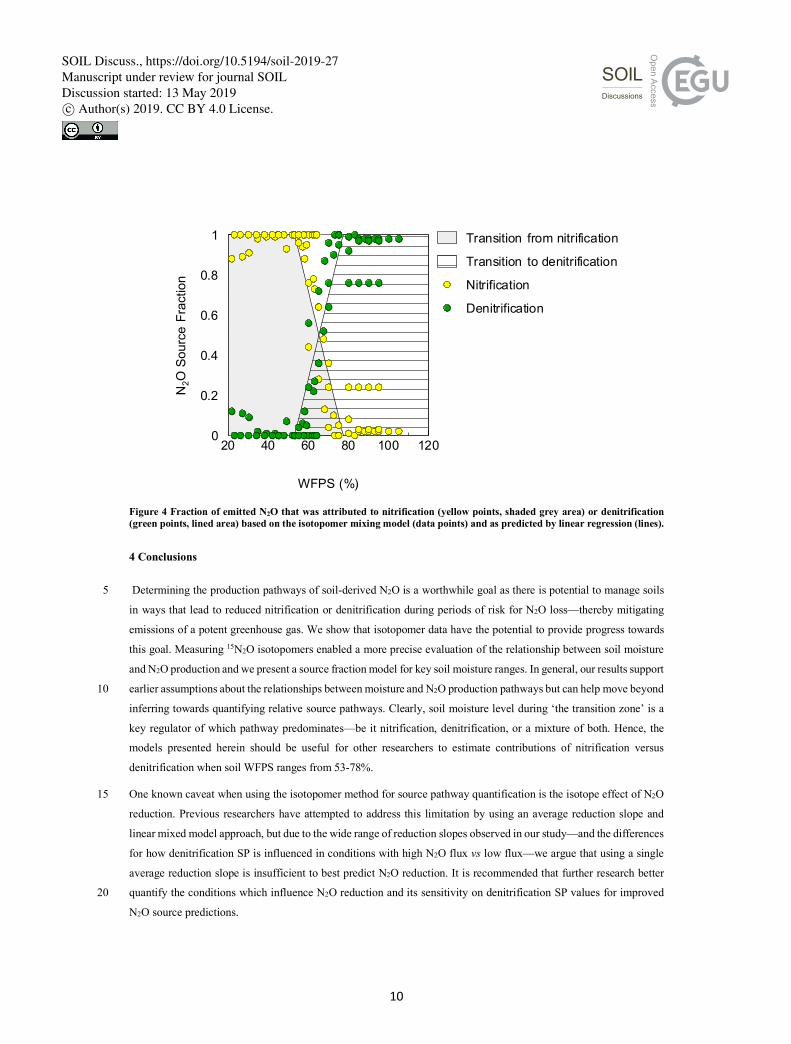
(Fig. 4) with coefficients of variation and root-mean-square errors of 0.10 and 0.20, respectively. The models predict
that over a soil moisture range of 53 to 78% WFPS, the source partitioning rapidly changed from nitrification- to
denitrification-dominated N2O production. At soil moisture levels < 53% WFPS, N2O was predominately attributed 15
to nitrification (FN = 1) but thereafter decreased rapidly, according to Eq. (6):
𝐹" = 3.19 − 0.041𝑥 (6)
until a WFPS of 78%. This result was mirrored by the increase in N2O attributed to denitrification at a WFPS of 53%
according to Eq. (7):
𝐹, = −2.19 + 0.041𝑥 (7) 20
until FD = 1 at 78% and higher WFPS. These relationships exemplify the sensitivity of N2O production pathways to
soil moisture changes. For instance, during the transition, a change in soil moisture as little as 10% (i.e., from 55 to
65% WFPS) is predicted to lower nitrification-derived N2O production by 56% but increase denitrification-derived
N2O by >7-fold (Fig. 4). Clearly, soil moisture change during the transition is a key regulator of which pathway
dominantly produces N2O—be it nitrification or denitrification, or a mixture of both. Our results largely support earlier 25
studies that evaluated the relationship between soil moisture and N2O emissions (Davidson, 1991; Linn and Doran,
1984); however, we provide a method that moves beyond just inferring N2O source pathways towards quantifying the
pathway contributions over a range of soil moisture.
30
SOIL Discuss., https://doi.org/10.5194/soil-2019-27Manuscript under review for journal SOILDiscussion started: 13 May 2019c© Author(s) 2019. CC BY 4.0 License.
10
Figure 4 Fraction of emitted N2O that was attributed to nitrification (yellow points, shaded grey area) or denitrification (green points, lined area) based on the isotopomer mixing model (data points) and as predicted by linear regression (lines).
4 Conclusions
Determining the production pathways of soil-derived N2O is a worthwhile goal as there is potential to manage soils 5
in ways that lead to reduced nitrification or denitrification during periods of risk for N2O loss—thereby mitigating
emissions of a potent greenhouse gas. We show that isotopomer data have the potential to provide progress towards
this goal. Measuring 15N2O isotopomers enabled a more precise evaluation of the relationship between soil moisture
and N2O production and we present a source fraction model for key soil moisture ranges. In general, our results support
earlier assumptions about the relationships between moisture and N2O production pathways but can help move beyond 10
inferring towards quantifying relative source pathways. Clearly, soil moisture level during ‘the transition zone’ is a
key regulator of which pathway predominates—be it nitrification, denitrification, or a mixture of both. Hence, the
models presented herein should be useful for other researchers to estimate contributions of nitrification versus
denitrification when soil WFPS ranges from 53-78%.
One known caveat when using the isotopomer method for source pathway quantification is the isotope effect of N2O 15
reduction. Previous researchers have attempted to address this limitation by using an average reduction slope and
linear mixed model approach, but due to the wide range of reduction slopes observed in our study—and the differences
for how denitrification SP is influenced in conditions with high N2O flux vs low flux—we argue that using a single
average reduction slope is insufficient to best predict N2O reduction. It is recommended that further research better
quantify the conditions which influence N2O reduction and its sensitivity on denitrification SP values for improved 20
N2O source predictions.
20 40 60 80 100 1200
0.2
0.4
0.6
0.8
1
WFPS (%)
N2OSourceFraction
Transition from nitrification
Transition to denitrification
Nitrification
Denitrification
SOIL Discuss., https://doi.org/10.5194/soil-2019-27Manuscript under review for journal SOILDiscussion started: 13 May 2019c© Author(s) 2019. CC BY 4.0 License.

11
5 Author Contributions
KAC and REF designed the experiment and TP carried it out. KAC prepared the manuscript with contributions from
REF and TP.
6 Competing Interests
The authors declare that they have no conflict of interest. 5
7 Acknowledgements
Financial support was provided by the University of Saskatchewan College of Agriculture and Bioresources via a
Martin Agricultural Trust Fund award to KAC and REF and by the Natural Sciences and Engineering Research
Council of Canada via a Discovery Grant award to KAC. The authors are grateful to Frank Krijnen and Darin Richman
for technical help in the lab. 10
SOIL Discuss., https://doi.org/10.5194/soil-2019-27Manuscript under review for journal SOILDiscussion started: 13 May 2019c© Author(s) 2019. CC BY 4.0 License.

12
8 References
Balaine, N., Clough, T. J., Beare, M. H., Thomas, S. M., Meenken, E. D. and Ross, J. G.: Changes in Relative Gas
Diffusivity Explain Soil Nitrous Oxide Flux Dynamics, Soil Sci. Soc. Am. J., 77(5), 1496–1505, doi:DOI
10.2136/sssaj2013.04.0141, 2013.
Banerjee, S., Helgason, B., Wang, L., Winsley, T., Ferrari, B. C. and Siciliano, S. D.: Legacy effects of soil moisture 5
on microbial community structure and N2O emissions, Soil Biol. Biochem., 95, 40–50,
doi:10.1016/J.SOILBIO.2015.12.004, 2016.
Barnard, R., Leadley, P. W. and Hungate, B. A.: Global change, nitrification, and denitrification: A review, Global
Biogeochem. Cycles, 19(1), doi:10.1029/2004GB002282, 2005.
Butterbach-Bahl, K., Baggs, E. M., Dannenmann, M., Kiese, R. and Zechmeister-Boltenstern, S.: Nitrous oxide 10
emissions from soils: how well do we understand the processes and their controls?, Philos. Trans. R. Soc. Lond. B.
Biol. Sci., 368(1621), 20130122, doi:10.1098/rstb.2013.0122, 2013.
Chapuis-Lardy, L., Wrage, N., Metay, A., Chotte, J.L. and Bernoux, M.: Soils, a sink for N2O? A review, Glob.
Chang. Biol., 13(1), 1–17, doi:10.1111/j.1365-2486.2006.01280.x, 2007.
Clough, T. J., Sherlock, R. R. and Rolston, D. E.: A Review of the Movement and Fate of N2O in the Subsoil, Nutr. 15
Cycl. Agroecosystems, 72(1), 3–11, doi:10.1007/s10705-004-7349-z, 2005.
Davidson, E. A.: Fluxes of nitrous oxide and nitric oxide from terrestrial ecosystems. Pp. 219–235 in Rogers J.E.,
Whitman, W.B. eds . Microbial Production and Consumption of Greenhouse Gases: Methane, Nitrogen Oxides and
Halomethanes, Am. Soc. Microbiol. Washington, DC., in Microbial Production and Consumption of Greenhouse
Gases: Methane, Nitrogen Oxides and Halomethanes, edited by J. E. Rogers and W. B. Whitman, pp. 219–235, Am. 20
Soc. Microbiol., Washington, DC., 1991.
Denk, T. R. A., Mohn, J., Decock, C., Lewicka-Szczebak, D., Harris, E., Butterbach-Bahl, K., Kiese, R. and Wolf,
B.: The nitrogen cycle: A review of isotope effects and isotope modeling approaches, Soil Biol. Biochem., 105,
121–137, doi:10.1016/J.SOILBIO.2016.11.015, 2017.
Deppe, M., Well, R., Giesemann, A., Spott, O. and Flessa, H.: Soil N2O fluxes and related processes in laboratory 25
incubations simulating ammonium fertilizer depots, Soil Biol. Biochem., 104, 68–80,
doi:10.1016/j.soilbio.2016.10.005, 2017.
Environment Canada.: Canadian national Inventory Report: Part 3 Greenhouse gas sources and sinks in Canada.,
2015.
Van Groenigen, J. W., Huygens, D., Boeckx, P., Kuyper, T. W., Lubbers, I. M., Rütting, T. and Groffman, P. M.: 30
The soil N cycle: new insights and key challenges, Soil, 1, 235–256, doi:10.5194/soil-1-235-2015, 2015.
Jinuntuya-Nortman, M., Sutka, R. L., Ostrom, P. H., Gandhi, H. and Ostrom, N. E.: Isotopologue fractionation
during microbial reduction of N2O within soil mesocosms as a function of water-filled pore space, Soil Biol.
SOIL Discuss., https://doi.org/10.5194/soil-2019-27Manuscript under review for journal SOILDiscussion started: 13 May 2019c© Author(s) 2019. CC BY 4.0 License.
13
Biochem., 40(9), 2273–2280, doi:10.1016/J.SOILBIO.2008.05.016, 2008.
Lewicka-Szczebak, D., Well, R., Köster, J. R., Fuß, R., Senbayram, M., Dittert, K. and Flessa, H.: Experimental
determinations of isotopic fractionation factors associated with N2O production and reduction during denitrification
in soils, Geochim. Cosmochim. Acta, 134, 55–73, doi:10.1016/J.GCA.2014.03.010, 2014.
Linn, D. M. and Doran, J. W.: Effect of water-filled pore space on carbon dioxide and nitrous oxide production in 5
tilled and nontilled soils, Soil Sci. Soc. Am. J., 48(6), 1267–1272, doi:10.2136/sssaj1984.03615995004800060013x,
1984.
Maynard, D., Kalra, Y. and Crumbaugh, J.: Nitrate and exchangeable ammonium nitrogen, in Soil Sampling and
Methods of Analysis, edited by M. R. Carter and E. G. Gregorich, pp. 71–80, CRC Press, Boca Raton, Florida,
2007. 10
Mohn, J., Wolf, B., Toyoda, S., Lin, C. T., Liang, M. C., Brüggemann, N., Wissel, H., Steiker, A. E., Dyckmans, J.,
Szwec, L., Ostrom, N. E., Casciotti, K. L., Forbes, M., Giesemann, A., Well, R., Doucett, R. R., Yarnes, C. T.,
Ridley, A. R., Kaiser, J. and Yoshida, N.: Interlaboratory assessment of nitrous oxide isotopomer analysis by isotope
ratio mass spectrometry and laser spectroscopy: current status and perspectives, Rapid Commun. Mass Spectrom.,
28(18), 1995–2007, doi:10.1002/rcm.6982, 2014. 15
Ostrom, N. E., Pitt, A., Sutka, R., Ostrom, P. H., Grandy, A. S., Huizinga, K. M. and Robertson, G. P.: Isotopologue
effects during N2O reduction in soils and in pure cultures of denitrifiers, J. Geophys. Res., 112, G02005,
doi:10.1029/2006JG000287, 2007.
Ostrom, N. E., Sutka, R., Ostrom, P. H., Grandy, A. S., Huizinga, K. M., Gandhi, H., von Fischer, J. C. and
Robertson, G. P.: Isotopologue data reveal bacterial denitrification as the primary source of N2O during a high flux 20
event following cultivation of a native temperate grassland, Soil Biol. Biochem., 42(3), 499–506,
doi:10.1016/J.SOILBIO.2009.12.003, 2010.
Popp, B. N., Westley, M. B., Toyoda, S., Miwa, T., Dore, J. E., Yoshida, N., Rust, T. M., Sansone, F. J., Russ, M.
E., Ostrom, N. E. and Ostrom, P. H.: Nitrogen and oxygen isotopomeric constraints on the origins and sea-to-air flux
of N2O in the oligotrophic subtropical North Pacific gyre, Global Biogeochem. Cycles, 16(4), 12-1-12–10, 25
doi:10.1029/2001GB001806, 2002.
Reynolds, W. D. and Topp, G. C.: Soil Water Desorption and Imbibition: Long Column, in Soil Sampling and
Methods of Analysis, edited by M. R. Carter and E. G. Gregorich, pp. 999–1006., 2007.
Sutka, R. L., Ostrom, N. E., Ostrom, P. H., Breznak, J. A., Gandhi, H., Pitt, A. J. and Li, F.: Distinguishing nitrous
oxide production from nitrification and denitrification on the basis of isotopomer abundances., Appl. Environ. 30
Microbiol., 72(1), 638–44, doi:10.1128/AEM.72.1.638-644.2006, 2006.
Toyoda, S., Mutobe, H., Yamagishi, H., Yoshida, N. and Tanji, Y.: Fractionation of N2O isotopomers during
production by denitrifier, Soil Biol. Biochem., 37(8), 1535–1545, doi:10.1016/j.soilbio.2005.01.009, 2005.
Wagner-Riddle, C., Congreves, K. A., Abalos, D., Berg, A. A., Brown, S. E., Ambadan, J. T., Gao, X. and Tenuta,
SOIL Discuss., https://doi.org/10.5194/soil-2019-27Manuscript under review for journal SOILDiscussion started: 13 May 2019c© Author(s) 2019. CC BY 4.0 License.

14
M.: Globally important nitrous oxide emissions from croplands induced by freeze-thaw cycles, Nat. Geosci., 10(4),
doi:10.1038/ngeo2907, 2017.
Well, R. and Flessa, H.: Isotopologue signatures of N2O produced by denitrification in soils, J. Geophys. Res.
Biogeosciences, 114, doi:10.1029/2008JG000804, 2009.
Winther, M., Balslev-Harder, D., Christensen, S., Priemé, A., Elberling, B., Crosson, E. and Blunier, T.: Continuous 5
measurements of nitrous oxide isotopomers during incubation experiments, Biogeosciences, 15, 767–780,
doi:10.5194/bg-15-767-2018, 2018.
SOIL Discuss., https://doi.org/10.5194/soil-2019-27Manuscript under review for journal SOILDiscussion started: 13 May 2019c© Author(s) 2019. CC BY 4.0 License.

15
Table 1 Soil physical and chemical characteristics.
Sutherland Asquith Bradwell
Previous cropping history Vegetable crops Fodder crops Field crops
Texture class Silty clay loam Sandy loam Loam
Organic matter (%) 5.9 3.9 2.7
Equilibrium soil water (θg) 0.46 0.40 0.33
pH 7.6 7.5 7.9
CEC cmolc kg-1 34.8 18.6 16.9
Total N (%) 0.42 0.21 0.16
Total 15N (atom %) 0.371 0.370 0.368
Nitrate (µg g-1) 194 35 10
Ammonium (µg g-1) 3.8 1.7 5.2
Bray-Phosphorus (ppm) 542 190 23
Potassium (ppm) 1415 544 329
Sulfur (ppm) 49 28 13
Magnesium (ppm) 925 448 432
Calcium (ppm) 4650 2670 2490
SOIL Discuss., https://doi.org/10.5194/soil-2019-27Manuscript under review for journal SOILDiscussion started: 13 May 2019c© Author(s) 2019. CC BY 4.0 License.

16
Table 2. Linear regressions between 15N site preference and soil water-filled pore space (%) during three soil moisture regions for each soil type: i) before the transition from nitrification, ii) during the transition from nitrification to denitrification, and iii) after the transition to denitrification.
Soil type WFPS (%) Slope Intercept Pearson r p-value
Before transition
Sutherland < 64 -0.049 26.69 -0.30 0.4660 ns
Asquith < 58 -0.004 22.04 -0.04 0.8973 ns
Bradwell < 63 0.010 22.69 0.14 0.6781 ns
During transition
Sutherland 64 – 83 -0.99 81.62 0.88 0.0214*
Asquith 58 – 73 -1.19 85.75 -0.89 0.0067**
Bradwell 63 – 75 -0.59 58.29 -0.99 0.0004*
After transition
Sutherland > 83 0.065 -3.01 0.86 0.0126*
Asquith > 73 0.072 -4.77 0.99 0.0064**
Bradwell > 75 0.262 -4.47 0.94 0.0154*
5
SOIL Discuss., https://doi.org/10.5194/soil-2019-27Manuscript under review for journal SOILDiscussion started: 13 May 2019c© Author(s) 2019. CC BY 4.0 License.