revisiting qrs detection methodologies for portable ...the accurate detection of qrs complexes is...
TRANSCRIPT
Revisiting QRS Detection Methodologies for Portable,Wearable, Battery-Operated, and Wireless ECG SystemsMohamed Elgendi1*, Bjorn Eskofier2, Socrates Dokos3, Derek Abbott4
1 Department of Computing Science, University of Alberta, Edmonton, Alberta, Canada, 2 Pattern Recognition Lab, Friedrich-Alexander-University Erlangen-Nuremberg,
Bavaria, Germany, 3 Graduate School of Biomedical Engineering, University of New South Wales, Sydney, New South Wales, Australia, 4 School of Electrical and Electronic
Engineering, University of Adelaide, Adelaide, South Australia, Australia
Abstract
Cardiovascular diseases are the number one cause of death worldwide. Currently, portable battery-operated systems suchas mobile phones with wireless ECG sensors have the potential to be used in continuous cardiac function assessment thatcan be easily integrated into daily life. These portable point-of-care diagnostic systems can therefore help unveil and treatcardiovascular diseases. The basis for ECG analysis is a robust detection of the prominent QRS complex, as well as other ECGsignal characteristics. However, it is not clear from the literature which ECG analysis algorithms are suited for animplementation on a mobile device. We investigate current QRS detection algorithms based on three assessment criteria: 1)robustness to noise, 2) parameter choice, and 3) numerical efficiency, in order to target a universal fast-robust detector.Furthermore, existing QRS detection algorithms may provide an acceptable solution only on small segments of ECG signals,within a certain amplitude range, or amid particular types of arrhythmia and/or noise. These issues are discussed in thecontext of a comparison with the most conventional algorithms, followed by future recommendations for developingreliable QRS detection schemes suitable for implementation on battery-operated mobile devices.
Citation: Elgendi M, Eskofier B, Dokos S, Abbott D (2014) Revisiting QRS Detection Methodologies for Portable, Wearable, Battery-Operated, and Wireless ECGSystems. PLoS ONE 9(1): e84018. doi:10.1371/journal.pone.0084018
Editor: Luıs A. Nunes Amaral, Northwestern University, United States of America
Received August 1, 2013; Accepted November 11, 2013; Published January 7, 2014
Copyright: � 2014 Elgendi et al. This is an open-access article distributed under the terms of the Creative Commons Attribution License, which permitsunrestricted use, distribution, and reproduction in any medium, provided the original author and source are credited.
Funding: The authors have no support or funding to report.
Competing Interests: Derek Abbott serves as an editor for PLOS ONE. This does not alter the authors’ adherence to all the PLOS ONE policies on sharing dataand materials.
* E-mail: [email protected]
Introduction
According to the World Health Organization, cardiovascular
diseases (CVDs) are the number one cause of death worldwide [1].
An estimated 17.3 million people died from CVDs in 2008,
representing 30% of all global deaths [1]. Moreover, it is expected
that the number of mortalities due to CVDs, mainly from heart
disease and stroke, will reach 23.3 million by 2030 and are
projected to remain the single leading cause of death for several
decades [2].
In 2010, the global direct and indirect cost of CVD was
approximately $863 billion and is estimated to rise by 22% to
$1,044 billion by 2030. Overall, the cost for CVD alone is
projected to be as high as $20 trillion over the next 20 year period
[3].
As a consequence of direct and indirect costs of CVD, medical
researchers have placed significant importance on cardiac health
research. This has led to a strong focus on technological advances
with respect to cardiac function assessment. One such research
pathway is the improvement of conventional cardiovascular-
diagnosis technologies used in hospitals/clinics.
The most common clinical cardiac test is electrocardiogram
(ECG) analysis. It represents a useful screening tool for a variety of
cardiac abnormalities because it is simple, risk-free, and inexpen-
sive [4]. Advances in technology have led to much change in the
way we collect, store and diagnose ECG signals, especially the use
of mobile phones to implement the clinical routine of ECG
analysis into everyday life [5–9]. Thus, in the near future, it is
expected that Holter devices, which are traditionally used for ECG
analysis in the clinic, will be replaced by portable, battery-operated
devices such as mobile phones in the near future [10]. The reason
is that Holter devices do not detect arrhythmias automatically in
real-time, and do not provide real-time information to the
hospital/doctor/patient when a critical heart condition occurs.
Moreover, the advances in memory/storage technology have
enabled us to store more ECG signals than ever before. Therefore,
researchers are collecting more information in order to understand
the mechanisms underlying CVDs, which is expected to ultimately
lead to effective treatments. The trend towards using mobile smart
phones for ECG assessment further speeds up this process, as the
conveniently collected data can potentially be added to databases
via the existing internet.
The analysis of ECG signals collected by a mobile phone needs
to be fast and feasible in real-time, despite the existing limitations
in terms of phone memory and processor capability. The same
holds for the ability to analyse large ECG recordings collected over
one or more days.
Recently, researchers have put an increased effort into
developing efficient ECG analysis algorithms to run within mobile
phones, including algorithms for determining the quality of
collected ECG signals [11]. This increased effort is also evidenced
in the 2011 PhysioNet/Computing in Cardiology Challenge [12],
which has been established to encourage the development of ECG
software that can run on a mobile phone, recording an ECG and
providing useful feedback about its quality.
PLOS ONE | www.plosone.org 1 January 2014 | Volume 9 | Issue 1 | e84018

PhysioNet provided a large set of ECG records for use in their
Cardiology Challenge, along with an open-source sample appli-
cation for an Android phone (Google Inc., USA), and that can
classify ECGs as acceptable or unacceptable. Therefore, the next
step is to analyse the acceptable ECG signal for diagnosis, without
relying on an expert for interpretation. If this possibility becomes a
reality, it will help developing nations and rural populations, by
benefitting from otherwise inaccessible expertise.
Note that ECG signals contain features that reflect the
underlying operation of the heart. These features represent
electrophysiological events that coincide with the sequence of
depolarisation and repolarisation of the atria and ventricles. The
signal of each heartbeat contains three main events: the P wave,
the QRS complex, and the T wave (as shown in Figure 1). Each
event (wave) has its corresponding peak. The analysis of ECG
signals for monitoring or diagnosis requires the detection of these
events. Once an event has been detected, the corresponding signal
can be extracted and analysed in terms of its amplitude (peak),
morphology, energy and entropy distribution, frequency content,
intervals between events and other more complex parameters. The
automatic detection of the P, QRS and T events is critical for
reliable cardiovascular assessment, such as diagnosing cardiac
arrhythmias [13–17], understanding autonomic regulation of the
cardiovascular system during sleep and hypertension [18,19],
detecting breathing disorders such as obstructive sleep apnea
syndrome [20,21], and monitoring other structural or functional
cardiac disorders. Once the QRS, P and T events are detected
accurately, a more detailed analysis of ECG signals can be
performed.
The detection of QRS complexes has been extensively
investigated over the past two decades. Many attempts have been
made to find a satisfying universal solution for QRS complex
detection. Difficulties arise mainly because of the diversity of the
QRS waveforms, abnormalities, low signal-to-noise ratio (SNR)
and as well as artefacts accompanying ECG signals. Conversely, P
and T event detection has not been investigated as much as QRS
detection, and the P and T event detection problem is still far from
being solved [22]. Reliable P and T wave detection is more
difficult than QRS complex detection for several reasons,
including low amplitudes, low SNR, amplitude and morphology
variability, and possible overlapping of the P wave and the T wave.
Any cardiac dysfunction associated with excitation from ectopic
centres in the myocardium may lead to premature complexes
(atrial or ventricular), which change the morphology of the
waveform and the duration of the RR interval. The occurrence of
multiple premature complexes is considered clinically important,
as it indicates disorders in the depolarisation process preceding the
critical cardiac arrhythmia. For all the above-mentioned reasons,
the accurate detection of QRS complexes is clinically important.
Prior to developing a fast-robust QRS detector that suits battery-
driven applications and continuous 24/7 ECG monitoring, it is
Figure 1. Main Events in ECG signals. A typical ECG trace of the cardiac cycle (heartbeat) consists of a P wave, a QRS complex, and a T wave.doi:10.1371/journal.pone.0084018.g001
Revisiting QRS Detection Methodologies
PLOS ONE | www.plosone.org 2 January 2014 | Volume 9 | Issue 1 | e84018
necessary to evaluate the performance of the current algorithms
against the following three assessment criteria:
1. Robustness to noise: there are several sources of noise (e.g.
power line interference, muscle noise and motion artefacts).
Therefore, the developed algorithms should be robust to these
noise sources.
2. Parameter choice: The choice of parameters must lead to
accurate detection. Parameters must not have to be manually
adjusted for different recordings.
3. Numerical efficiency: The developed algorithm may have a
large number of iterations, parameters to adjust, features
extracted, or classification steps. It is desirable to provide
numerically efficient (simple, fast, and fewer calculations)
algorithms. Of course, computers have become very fast, and
therefore numerical efficiency is less important than it used to
be. However, if a simple and fast algorithm can achieve good
results, there is no need for more complex algorithms. In
particular, when the algorithm is used online (in a slightly
modified form from the offline version) in a mobile phone
embedded system, numerical efficiency is still relevant.
In the remainder of this review article, these proposed
assessment criteria will be used to evaluate several well-known
QRS algorithms in two important stages: QRS enhancement and
QRS detection. The QRS enhancement stage is used to enlarge
the QRS complex relative to the other ECG features (P, T, and
noise). This stage is occasionally referred to as pre-processing or
feature extraction. The QRS detection stage is used to demarcate
the QRS complex by providing the onset and offset points of the
QRS complex, and especially the location of the prominent R
peak. The remainder of this paper is structured as follows: the next
section delineates several types of QRS enhancements techniques,
whilst Section 3 compares different QRS detection methods.
Finally a discussion and concluding remarks are presented in
Section 4.
In describing the algorithms for QRS enhancement and
detection in this article, note that X ½n� refers to the raw ECG
signal collected from any ECG monitoring system, including
battery-operated devices; while Y ½n� refers to the filtered X ½n�signal.
QRS Enhancement
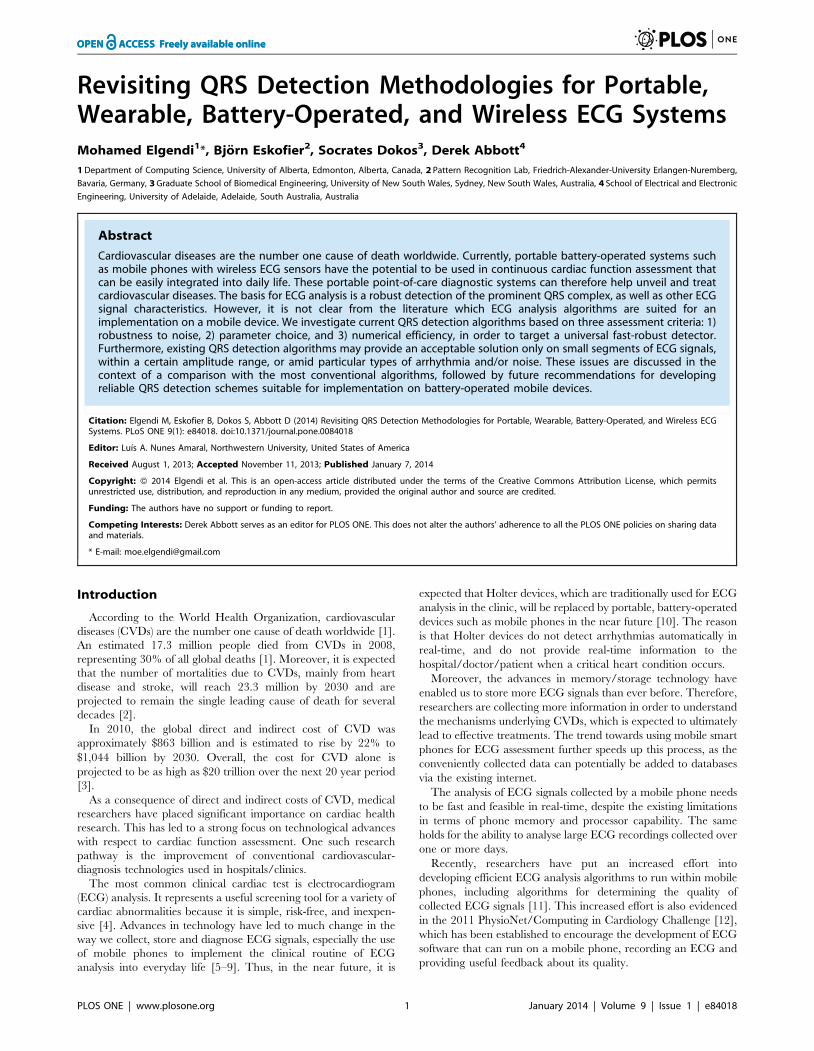
This section presents several signal processing techniques [23–
26] that have been used to emphasise the QRS segment in time,
frequency and time-frequency series, as shown in Table 1. Figure 2
demonstrates the importance of the QRS enhancement stage as a
prerequisite for detecting the QRS complex.
AmplitudeThis algorithm is considered the oldest for detecting R peaks in
ECG signals; however, for the last 30 years it is still useful and in
common use. Recently, Sufi et al. [63] used the algorithm for
detecting heart rate using mobile phone. In older algorithms,
amplitude threshold was not used alone as in the case of Sufi et al.
[63]; it was usually followed by a differentiation step to reduce the
P and T wave influence relative to the R wave. The first derivative
is applied after the amplitude threshold to accentuate the slope of
the QRS complex. The amplitude threshold is calculated as a
fraction of the measured ECG signal
Xth~b maxfX ½n�g, ð1Þ
where b is the percentage of the ECG signal required to be
removed and 1wbw0. Different amplitude thresholds have also
been used. Moriet-Mahoudeaux et al. [23] developed a QRS
detector using Xth~0:3 maxfX ½n�g, which means that X ½n�values below 30% of the maximum positive signal amplitude is
truncated from the signal, while Fraden and Neuman [24] used
Xth~0:4 maxfX ½n�g.
First Derivative OnlyIn this class of QRS enhancement algorithms, a first-order
differentiator is commonly used as a high-pass filter, to enhance
base-line wander and eliminate any undesired high frequency
noise, modify the phase of the ECG signals, and to create zero
crossings in the location of the R peaks. Many first derivative QRS
detection algorithms, introduced in literature [31] calculate the
first derivative of the measured ECG signal according to:
Y ½n�~{2X ½n{2�{X ½n{1�zX ½nz1�z2X ½nz2�: ð2Þ
In contrast, Holsinger [32] used a central finite-difference
approach as:
Y ½n�~X ½nz1�{X ½n{1�, ð3Þ
whilst Okada [30] used a backward difference scheme:
Y ½n�~X ½n�{X ½n{1�: ð4Þ
In these algorithms, a threshold criterion was subsequently
applied to Y ½n� for QRS detection, as summarized in Table 1.
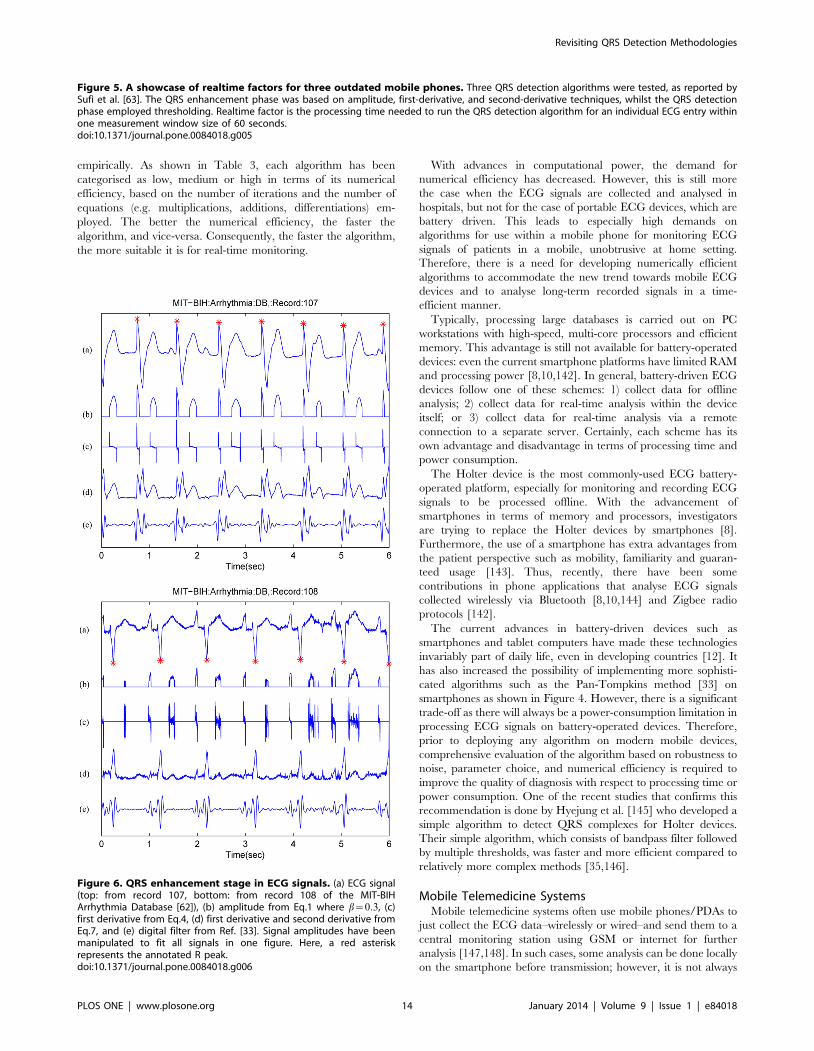
Figure 2. QRS enhancement stage in ECG signals. (a) ECG signal(top: from record 100 of the MIT-BIH Arrhythmia Database [62]), (b)amplitude from Eq.1 where b~0:3, (c) first derivative from Eq.4, (d) firstderivative and second derivative from Eq.7, and (e) digital filter fromRef. [33]. Signal amplitudes have been manipulated to fit all signals inone figure. Here, a red asterisk represents the annotated R peak.doi:10.1371/journal.pone.0084018.g002
Revisiting QRS Detection Methodologies
PLOS ONE | www.plosone.org 3 January 2014 | Volume 9 | Issue 1 | e84018

Table 1. Comparison of QRS enhancement techniques based on algorithm usage and assessment criteria.
Technique Algorithm Robustness to noise Parameter choice Numerical efficiency
Amplitude Amplitude threshold is applied tothe ECG signal, usually followed bythe first derivative of the ECGsignal [23,24] with a second threshold.
The signal noise is notremoved properly andis not considered bythe first- derivative-onlyclass of algorithms forfeature extraction.
The processed segments have equally fixedlengths [23,24,25,26,27,28].The value of the b ratio must be adjustedonce before ECG signal analysis takes place.The threshold remains fixed throughout theentire ECG signal analysis [23,24,25,26,27,28].Investigators have introduced severaldifferentiators without noting the reasonbehind their choices [23,24,25,26,27,28].The length of the processed ECG segment isdetermined experimentally [23,24,25,26,27,28].Friesen et al. [29] used ECG data with a fixedlength of 33 seconds. Their algorithm scoreda high accuracy because they processedsmall segments. It is expected that theperformanceof this algorithm on longer ECG trace will bepoor unless the long ECG signals areseparated into smaller segments. In this case,the performance will likely improve, howeverthere is a possibility of losing beats at thebeginning and end of each processed ECGsegment
Amplitude and first derivativeclass of algorithms is simple andusually contain a threshold andfirst derivative equation forfeature extraction. Thecomplexity mainly depends onthe threshold used andsegmentation if applied.
FirstDerivativeOnly
First derivative of ECG signal followedby threshold [30–32]. (thresholdingwill be discussed in Section 3)Amplitude threshold applied to ECGsignal followed by first derivative ofECG signal [23,24] (see Section 2.2),followed by another thresholdFirst derivative combined with secondderivative of ECG signal [26,27](see section 2.3), followed by thresholdFirst derivative of ECG signal followedby digital filtering [28] (see section 2.4),followed by thresholdDigital filter applied to ECG signalfollowed by first derivative [33],followed by thresholdMathematical morphology filteringapplied to ECG signal followed by firstderivative [34] (see section 2.5),followed by thresholdFirst derivative can be used beforeapplying Hilbert transform [35,36,37](see Section 3.1), followed by thresholdFirst derivative can be used beforeapplying Wavelet transform [38] (seesection 4.2), followed by threshold
The first derivative doesnot remove high-frequency noise;however, it helps toreduce motionartifacts and baseline drifts [38].
The processed ECG segments have equallyfixed lengths and thresholds [30,31,32].As mentioned above, researchers haveintroduced several differentiators withoutmentioning the reason behind their choices[30,31,32].
First derivative class ofalgorithms is simple and containsone equation for featureextraction. Most cases usedOkada’s equation [30]. Thecomplexity of this class willincrease if segmentation isapplied. The order of complexitydepends on the number ofprocessed segments for eachrecord.
First andSecondderivative
First derivative combined with secondderivative of ECG signal [26,27],followed by threshold.Second derivative can be used beforeapplying Hilbert transform [35,37] (seeSection 3.1), followed by threshold.
The signal noise is notremoved properly andis not considered bythe first- derivative-onlyclass of algorithms forfeature extraction.
The processed segments have equal andfixed lengths [23–28].The parameters used are fixed.The choice of the first and second derivativeequations is experimentally determined[26,27]. Moreover, authors do not justify theircombination of first and second derivatives.As mentioned above, investigators haveintroduced various differentiators withoutnoting the reason behind their choices[26,27].
First- and second-derivativeclasses of algorithms are simpleand contain only up to fourequations for feature extraction.The complexity of this classderives from the number ofequations used andsegmentation, if applied.
Digital Filter First derivative of ECG signal followedby digital filters followed by threshold[28].Bandpass filter applied to ECG signalfollowed by first derivative, followedby threshold [33].Bandpass filter applied before Hilberttransform, followed by threshold [39].Bandpass filter can be followed by firstderivative before applying Wavelettransform, followed by threshold [38].Bandpass filter applied to ECG signalfollowed by matching filter (see Section4.3), followed by threshold [40].
The digital filter canincrease the SNR ratiodepending on thenature of the filterand its order
The processed segments have equal andfixed lengths [23–28].The parameters used are fixed.The choice of differentiator in the digitalfilters functions as a notch filter.In the digital filter algorithms, the low-passfilter is usually a symmetrical amplification.The amplification values are determinedexperimentally.The mathematical operations (e.g. squaring,difference, multiplication) used are notjustified by the authors.
The digital filters class ofalgorithms is simple and containsup to only four equations forfeature extraction. Thecomplexity of this class willincrease if segmentation isapplied. The order of complexitydepends on the number ofprocessed segments for eachrecord.
Revisiting QRS Detection Methodologies
PLOS ONE | www.plosone.org 4 January 2014 | Volume 9 | Issue 1 | e84018
Table 1. Cont.
Technique Algorithm Robustness to noise Parameter choice Numerical efficiency
MathematicalMorphology
Mathematical morphology filteringapplied to ECG signal, followed bythreshold [41].Mathematical morphology filteringapplied to ECG signal, followed by firstderivative, followed by threshold [34].
The signal noise ispartially addressedby the mathematicalmorphology class ofalgorithms. The use of alow-pass filter improvesthe SNR.
The processed segments have equal andfixed lengths [23,24,25,26,27,28].The structuring element is fixed duringthe ECG analysis.The length of the structuring elementused is 3, which remains a fixed value.The length of the structuring element isdetermined experimentally. The length of theoperating structure element must be shorterthan the product of the length of the signalwave and the sampling frequency [41].Therefore, the length of the structuringelement can be different to 3.The authors do not justify the multiplicationoperations used [23,24,25,26,27,28].
The mathematical morphologyclass of algorithms is simple andcontains at least 15 equations forfeature extraction. Thecomplexity increases with thenumber of processed ECGsegments. The order ofcomplexity is higher than thederivative-based algorithms anddigital filter algorithms.
EmpiricalModeDecomposition(EMD)
EMD filtering applied to ECG signalfollowed by threshold [42].EMD filtering applied to ECG signalfollowed by singularity and threshold[43],[44].High-pass filter applied to ECG signal,followed by EMD filtering, followed bythreshold [44].
The first several IMFscan filter out the noiseand preserve the QRScontent compared tothe other ECG features[43].Therefore the firstseveral IMFs are mainlycaused by the QRScomplex and improvethe SNR.
The processed segments have equally fixedlengths [43].The number of IMFs depends on the lengthof the ECG segment. If the segment lengthis increased, the number of IMFs will increase.The length of the ECG segment is notdetermined experimentally.The choice of IMFs is determined bytrial-and-error.
The EMD class of algorithms issimple and contains at least ninesteps with several equations forfeature extraction. Thecomplexity increases with thenumber of processed ECGsegments. Certainly, the order ofcomplexity is higher than thederivative-based algorithms anddigital filter algorithms.
HilbertTransform
First derivative can be used beforeapplying Hilbert transform followed bythreshold [35,36,37].Bandpass filter applied before Hilberttransform, followed by threshold [39].Wavelet transform (WT), see Section 4.2,applied before Hilbert transform,followed by threshold [45].
The Hilbert transformdoes not improve theSNR itself. Therefore,some investigators filterthe signal beforeapplying the Hilberttransform. Benitez et al.[36] used a bandpassfilter 8–20 Hz to removemuscular noise andmaximise the QRS.
The processed segments have equally fixedlengths [36,46].When the FFT approach was implementedin calculating the Hilbert transform, nodependence of the envelope on the framewidth was detected for frames comprised of512–2,048 data points.The length of the ECG segment is notdetermined experimentally.The choice digital filters and moving averageare determined experimentally.
The Hilbert transform algorithmcontains at least nine steps withseveral equations for featuresextraction. However, the primarydisadvantage of this method isthe increased computationalburden required for FFTcalculations compared to thetime domain approaches. Hilberttransform techniques generallyhave a large computationoverhead [46]. Moreover, thecomplexity increases with thenumber of processed ECGsegments.
Filter Banks Filter banks applied to ECG signalfollowed by threshold [47,48].WT (see Section 4.2) applied to ECGsignal, followed by filter banks,followed by correlation [49].
The filter bankssignificantly improvethe SNR for Gaussiannoise compared to themean and medianaveraging methods [50].For muscle noise, thefilter banks improve theSNR more than themean and medianaveraging methods [50].
The length of the filter, number ofsub-bands, transition-band width andstop-band attenuation have fixed values [51].For example, the length of each of the finiteimpulse response (FIR) filters used by Afonsoet al. [50] was 32. The input noisy ECG isdecomposed by the analysis filters into eightuniform sub-band frequencies. The sub-bandsignal in the (0–12.5 Hz) range is notmodified. The sub-band signal in the (12.5–25 Hz) range is attenuated in the periodoutside the QRS complex. Anyhigh-frequency components outside the QRScomplex are modelled as noise. Thus, in theremaining six sub-bands (25–100 Hz), thesignal is nulled in periods outside the QRScomplex.The filter bank complexity depends on fourparameters [51]: length of filter, numberof sub- bands, transition-band width andstop-band attenuation. Theses parametersare determined experimentally.The main difficulty is choosing the optimalbank filters and their optimal combinationin order to emphasise the QRS complexes.
The drawback of using filterbanks is a relatively highcomputational cost due to theinvolvement of a large amount ofmultipliers in the FIR filters [48].
Revisiting QRS Detection Methodologies
PLOS ONE | www.plosone.org 5 January 2014 | Volume 9 | Issue 1 | e84018
First and Second DerivativeNote that, QRS enhancement algorithms compute the first and
second derivatives of the measured ECG signal independently. A
linear combination of the magnitudes of these derivatives then
used to emphasise the QRS complex area relative to the other
ECG features. In a seminal paper, Balda et al. [26] calculated the
first and second derivatives of the measured ECG signals
according to:
Y0½n�~jX ½nz1�{X ½n{1�j, ð5Þ
Y1½n�~jX ½nz2�{2X ½n�zX ½n{2�j: ð6Þ
They then formed a linear combination of both derivatives as
follows:
Y2½n�~1:3Y0½n�z1:1Y1½n�: ð7Þ
Ahlstrom and Tompkins [27] calculated the rectified first
derivative of the ECG as:
Y0½n�~jX ½nz1�{X ½n{1�j: ð8Þ
The rectified first derivative was then smoothed:
Y1½n�~1
4(Y0½n{1�z2Y0½n�zY0½nz1�): ð9Þ
A rectified second derivative was then calculated:
Y2½n�~jX ½nz2�{2X ½n�zX ½n{2�j: ð10Þ
Finally, the rectified smoothed first derivative was added to the
rectified second derivative:
Y3½n�~Y1½n�zY2½n�: ð11Þ
For all these algorithms, a threshold criterion for QRS detection
was applied to the linear combination of derivatives. A summary
of these threshold criteria is given in Table 1.
Digital FiltersThere have been many sophisticated digital filters for QRS
enhancement published in the literature [28,33,64–71], as
described briefly below. Algorithms utilizing more complex digital
filters [28–30,72–76] include Engelse and Zeelenberg [28], who
first passed the ECG signal through a differentiator:
Y0½n�~X ½n�{X ½n{4�: ð12Þ
This signal was then passed through a digital low-pass filter:
Y1½n�~
(Y0½n�z4Y0½n{1�z6Y0½n{2�z4Y0½n{3�zY0½n{4�):ð13Þ
A different digital filter algorithm was introduced by Okada
[30], who first smoothed using a three-point moving-average filter:
Table 1. Cont.
Technique Algorithm Robustness to noise Parameter choice Numerical efficiency
WaveletTransform(WT)
WT applied to ECG signal, followed bythreshold [52,53].first derivative can be used beforeapplying Wavelet transform followed byzero crossing (see section 5.6),followed by threshold [54].WT applied first before Hilbert transform,followed by threshold [55].WT applied to ECG signal, followedby filter banks, followed by correlation[56].WT applied to ECG signal, followed byneural networks (see Section 5.2) [54].Wavelet transform applied to ECGsignal, followed by singularity (see 5.7)and zero crossing (see Section 5.6),followed by threshold [55].
WT does not increasethe SNR, but the SNRcan be improved byselecting thecoefficients with thelargest amplitude [56].
Choosing the mother wavelet is usuallydetermined by the shape of the wavelet,which should be closer to the QRS complexshape, and it depends on the investigator’smethodology for detecting the QRS complex.One mother wavelet (i.e. Haar, Daubechies,Biorthogonal, Mexican hat must be chosenonce during the entire ECG analysis.Choosing the length of the processed ECGsegment does vary in literature. Ahmed et al.[57] split the ECG signals into 2.4-secondssegments while Xiuyu et al. [55] split thesignals into 11 seconds.Choosing the wavelet scale variesthroughout the literature. Szilagyi andSzilagyi [58] used scales 23 and 24, whichreflect the QRS complex, while Xu et al. [59]used scales from 22 to 24 to detect QRScomplexes.In regards to the sampling frequency of theprocessed ECG signal, Martinez et al. [60]recommended to resample the signal at250 Hz.
If the ECG is segmented (this isusually the case), the length ofthe segment reflects the tradeoffbetween accuracy andcomputational time-consumption of the algorithm[52]. In general, WT, similar tofilter banks, is relatively high incomputational cost [61].
doi:10.1371/journal.pone.0084018.t001
Revisiting QRS Detection Methodologies
PLOS ONE | www.plosone.org 6 January 2014 | Volume 9 | Issue 1 | e84018
Y0½n�~1
4(X ½n{1�z2X ½n�zX ½nz1�): ð14Þ
The output of this filter was then passed through a low-pass
filter:
Y1½n�~1
2mz1
Xnzm
k~n{m
Y0½k�: ð15Þ
The difference between the input and output of this low-pass
filter was then squared, in order to suppress low amplitude waves
relative to the R peak:
Y2½n�~(Y0½n�{Y1½n�)2: ð16Þ
This square difference was then filtered, in order to enlarge the
QRS area compared to the other ECG features:
Y3½n�~Y2½n�fXnzm
k~n{m
Y2½k�g2: ð17Þ
In addition to the above filters, a multiplication of backward
difference (MOBD) algorithm has also been proposed [77,78] for
QRS detection. In brief, this approach consists of an AND-
combination of adjacent magnitude values of the derivative. The
MOBD of order N is defined by
Z½n�~ PN{1
k~0(X ½n{k�{X ½n{k{1�), ð18Þ
where Z½n� contains the extracted QRS features, which can
subsequently be detected using an appropriate threshold. Another
algorithm proposed by Dokur et al. [65] uses two different
bandpass filters, subsequently multiplying the filter outputs W ½n�and F ½n� to form:
Z½n�~W ½n�:F ½n�, ð19Þ
where Z½n� contains the extracted QRS features. This procedure is
based on the assumption that each QRS complex is characterised
by simultaneously occurring frequency components within the
passbands of each filter. The multiplication operation performs the
AND-combination. In other words, the output of the AND-
combination (the feature output) is ‘true’, and therefore indicates a
QRS complex, only if both filter outputs are ‘high’. The location
of the maximum amplitude is taken as the location of the R wave.
Conversely, Pan and Tompkins [33] used a derivative after
applying a bandpass digital filter to the ECG signals. The
bandpass filter consisted of a low-pass filter (Y1½n�) followed by a
high-pass filter (Y2½n�) as:
Y1½n�~2Y1½n{1�{Y1½n{2�zX ½n�{2X ½n{6�zX ½n{12�,ð20Þ
Y2½n�~32Y1½n{16�{(Y2½n{1�zY1½n�{Y1½n{32�): ð21Þ
The first derivative (Y3½n�) used after the bandpass filter was
specified as:
Y3½n�~1
8({Y2½n{3�{2Y2½n{1�z2Y2½nz1�zY2½nz2�), ð22Þ
The bandpass filtered signal (Y2½n�) was differentiated to
emphasise high signal slopes, suppressing smooth ECG waves
and baseline wander.
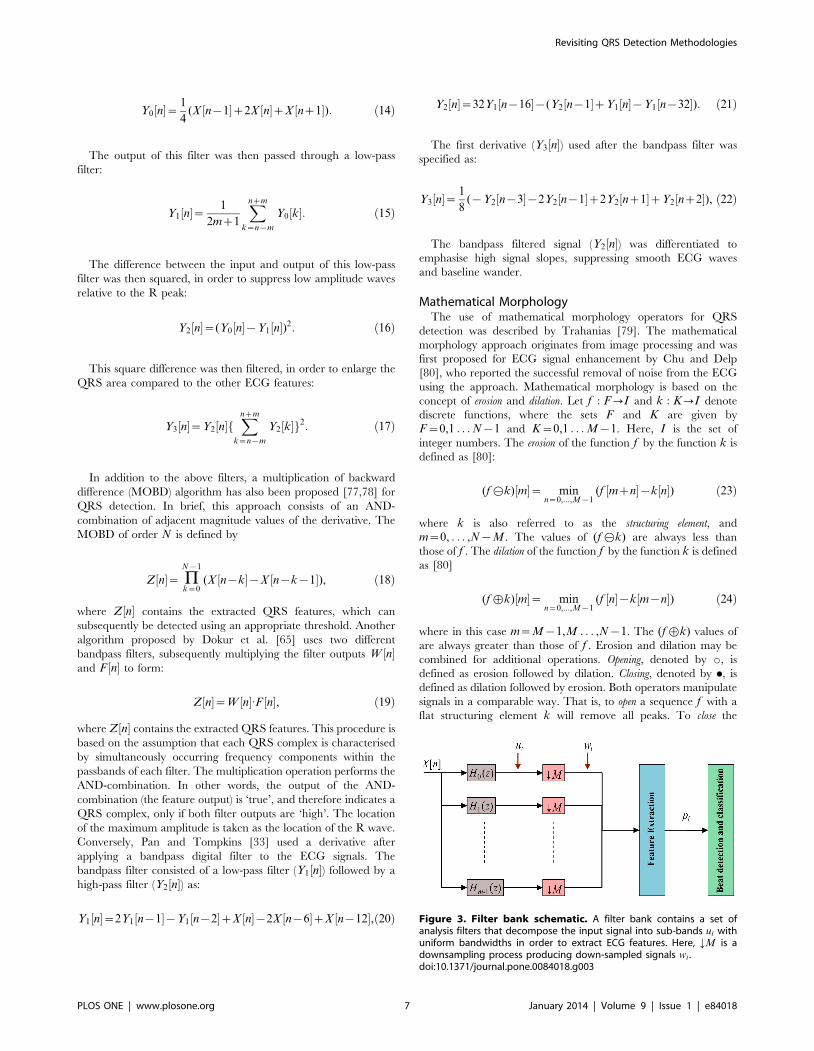
Mathematical MorphologyThe use of mathematical morphology operators for QRS
detection was described by Trahanias [79]. The mathematical
morphology approach originates from image processing and was
first proposed for ECG signal enhancement by Chu and Delp
[80], who reported the successful removal of noise from the ECG
using the approach. Mathematical morphology is based on the
concept of erosion and dilation. Let f : F?I and k : K?I denote
discrete functions, where the sets F and K are given by
F~0,1 . . . N{1 and K~0,1 . . . M{1. Here, I is the set of
integer numbers. The erosion of the function f by the function k is
defined as [80]:
(f7k)½m�~ minn~0,...,M{1
(f ½mzn�{k½n�) ð23Þ
where k is also referred to as the structuring element, and
m~0, . . . ,N{M. The values of (f7k) are always less than
those of f . The dilation of the function f by the function k is defined
as [80]
(f+k)½m�~ minn~0,...,M{1
(f ½n�{k½m{n�) ð24Þ
where in this case m~M{1,M . . . ,N{1. The (f+k) values of
are always greater than those of f . Erosion and dilation may be
combined for additional operations. Opening, denoted by 0, is
defined as erosion followed by dilation. Closing, denoted by ., is
defined as dilation followed by erosion. Both operators manipulate
signals in a comparable way. That is, to open a sequence f with a
flat structuring element k will remove all peaks. To close the
Figure 3. Filter bank schematic. A filter bank contains a set ofanalysis filters that decompose the input signal into sub-bands ui withuniform bandwidths in order to extract ECG features. Here, ;M is adownsampling process producing down-sampled signals wi .doi:10.1371/journal.pone.0084018.g003
Revisiting QRS Detection Methodologies
PLOS ONE | www.plosone.org 7 January 2014 | Volume 9 | Issue 1 | e84018
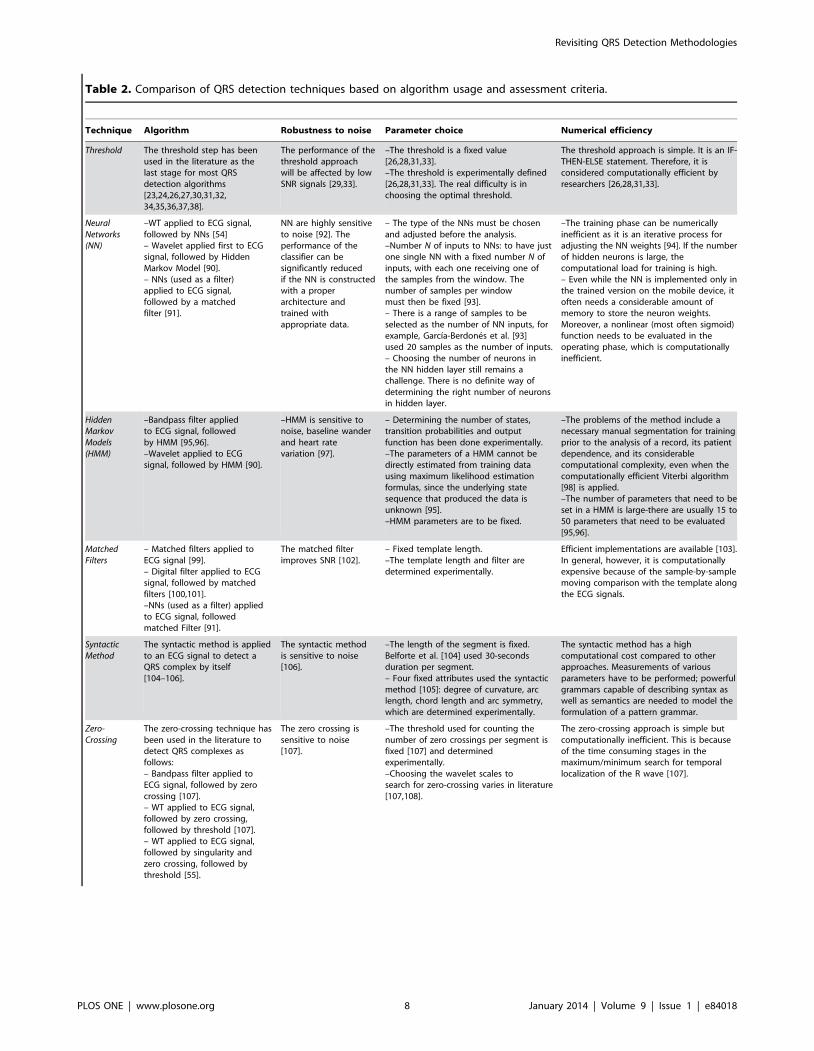
Table 2. Comparison of QRS detection techniques based on algorithm usage and assessment criteria.
Technique Algorithm Robustness to noise Parameter choice Numerical efficiency
Threshold The threshold step has beenused in the literature as thelast stage for most QRSdetection algorithms[23,24,26,27,30,31,32,34,35,36,37,38].
The performance of thethreshold approachwill be affected by lowSNR signals [29,33].
–The threshold is a fixed value[26,28,31,33].–The threshold is experimentally defined[26,28,31,33]. The real difficulty is inchoosing the optimal threshold.
The threshold approach is simple. It is an IF-THEN-ELSE statement. Therefore, it isconsidered computationally efficient byresearchers [26,28,31,33].
NeuralNetworks(NN)
–WT applied to ECG signal,followed by NNs [54]– Wavelet applied first to ECGsignal, followed by HiddenMarkov Model [90].– NNs (used as a filter)applied to ECG signal,followed by a matchedfilter [91].
NN are highly sensitiveto noise [92]. Theperformance of theclassifier can besignificantly reducedif the NN is constructedwith a properarchitecture andtrained withappropriate data.
– The type of the NNs must be chosenand adjusted before the analysis.–Number N of inputs to NNs: to have justone single NN with a fixed number N ofinputs, with each one receiving one ofthe samples from the window. Thenumber of samples per windowmust then be fixed [93].– There is a range of samples to beselected as the number of NN inputs, forexample, Garcıa-Berdones et al. [93]used 20 samples as the number of inputs.– Choosing the number of neurons inthe NN hidden layer still remains achallenge. There is no definite way ofdetermining the right number of neuronsin hidden layer.
–The training phase can be numericallyinefficient as it is an iterative process foradjusting the NN weights [94]. If the numberof hidden neurons is large, thecomputational load for training is high.– Even while the NN is implemented only inthe trained version on the mobile device, itoften needs a considerable amount ofmemory to store the neuron weights.Moreover, a nonlinear (most often sigmoid)function needs to be evaluated in theoperating phase, which is computationallyinefficient.
HiddenMarkovModels(HMM)
–Bandpass filter appliedto ECG signal, followedby HMM [95,96].–Wavelet applied to ECGsignal, followed by HMM [90].
–HMM is sensitive tonoise, baseline wanderand heart ratevariation [97].
– Determining the number of states,transition probabilities and outputfunction has been done experimentally.–The parameters of a HMM cannot bedirectly estimated from training datausing maximum likelihood estimationformulas, since the underlying statesequence that produced the data isunknown [95].–HMM parameters are to be fixed.
–The problems of the method include anecessary manual segmentation for trainingprior to the analysis of a record, its patientdependence, and its considerablecomputational complexity, even when thecomputationally efficient Viterbi algorithm[98] is applied.–The number of parameters that need to beset in a HMM is large-there are usually 15 to50 parameters that need to be evaluated[95,96].
MatchedFilters
– Matched filters applied toECG signal [99].– Digital filter applied to ECGsignal, followed by matchedfilters [100,101].–NNs (used as a filter) appliedto ECG signal, followedmatched Filter [91].
The matched filterimproves SNR [102].
– Fixed template length.–The template length and filter aredetermined experimentally.
Efficient implementations are available [103].In general, however, it is computationallyexpensive because of the sample-by-samplemoving comparison with the template alongthe ECG signals.
SyntacticMethod
The syntactic method is appliedto an ECG signal to detect aQRS complex by itself[104–106].
The syntactic methodis sensitive to noise[106].
–The length of the segment is fixed.Belforte et al. [104] used 30-secondsduration per segment.– Four fixed attributes used the syntacticmethod [105]: degree of curvature, arclength, chord length and arc symmetry,which are determined experimentally.
The syntactic method has a highcomputational cost compared to otherapproaches. Measurements of variousparameters have to be performed; powerfulgrammars capable of describing syntax aswell as semantics are needed to model theformulation of a pattern grammar.
Zero-Crossing
The zero-crossing technique hasbeen used in the literature todetect QRS complexes asfollows:– Bandpass filter applied toECG signal, followed by zerocrossing [107].– WT applied to ECG signal,followed by zero crossing,followed by threshold [107].– WT applied to ECG signal,followed by singularity andzero crossing, followed bythreshold [55].
The zero crossing issensitive to noise[107].
–The threshold used for counting thenumber of zero crossings per segment isfixed [107] and determinedexperimentally.–Choosing the wavelet scales tosearch for zero-crossing varies in literature[107,108].
The zero-crossing approach is simple butcomputationally inefficient. This is becauseof the time consuming stages in themaximum/minimum search for temporallocalization of the R wave [107].
Revisiting QRS Detection Methodologies
PLOS ONE | www.plosone.org 8 January 2014 | Volume 9 | Issue 1 | e84018
sequence with the same structuring element will remove all pits
(negative peaks). In Trahanias [79], opening and closing
operations are used for noise suppression as proposed by Chu
and Delp [80]; that is:
~xx~½(x0k).k�z½(x.k)0k�
2ð25Þ
where k is a flat structuring element (zero line). The generation of
a feature signal for the QRS complexes is accomplished by the
operation
z~~xx{(½(~xx0k).k�z½(~xx.k)0k�
2): ð26Þ
Zhang and Lian [34] used the first derivative after multiscale
mathematical morphology filtering to the ECG signal in order to
remove motion artifacts and base line drifts. They used Okada’s
first-order differential equation, as shown in Equation 4.
Empirical Mode DecompositionEmpirical mode decomposition (EMD) was introduced by
Huang et al. [81] for nonlinear and non-stationary signal analysis.
The key part of this method is that any complex data set can be
decomposed into a finite and often small number of intrinsic mode
functions (IMFs), which admit well-behaved Hilbert transforms.
Usually, when the raw ECG signals are decomposed into number
of IMFs, the combination of IMFs produces a resulting signal
where the QRS complex is more pronounced. This process can be
considered as adaptive filtering, similar to the use of wavelet
transform. The EMD is defined by a process called sifting. It
decomposes a given signal into a set of components, the IMFs. Kmodes dk½n� and a residual term r½n� [82,83] are obtained and
expressed by:
X ½n�~XK
k~1
dkzr½n�: ð27Þ
The EMD algorithm is summarised by the following steps:
1. Start with the signal dk~1½n�~x½n�; followed by the sifting
process hj ½n�~dk½n�, j~0.
2. Identify all local extrema of hj ½n�.3. Compute the upper (EnvMax) and lower envelopes (EnvMin)
by cubic spline interpolation of the maxima and minima.
4. Calculate the mean of the lower and upper envelopes,
m½n�~ 12
(EnvMax½n�zEnvMin½n�).
5. Extract the detail hjz1½n�~hj ½n�{m½n�.6. If hjz1½n� is an IMF, go to step 7; otherwise, iterate steps 2 to 5
on the signal hjz1½n�, j~jz1. (The definition of an IMF,
although somewhat vague, consists of two parts: (a) the number
of the extrema equals the number of zeros and (b) the upper
and lower envelopes should have the same bsolute value).
7. Extract the mode dk½n�~hjz1½n�.8. Calculate the residual rk½n�~x½n�{dk½n�.9. If rk½n� has less than two extrema, the extraction is finished
r½n�~rk½n�; otherwise, iterate the algorithm from step 1 on the
residual rk½n�, k~kz1.
Hilbert TransformThe use of the Hilbert transform for QRS detection is proposed
by Zhou et al. [84] and Nygards and Srnmo [85]. In the time
domain, the Hilbert transform of the ECG signal X is defined as:
XH(t)~HfXg~ 1
p
ð?
{?
X (t)
t{tdt ð28Þ
~1
p6X (t), ð29Þ
where 6 denotes the convolution operator. In the frequency
domain, the ECG signal can be transformed with a filter of
response:
XH(jv)~X (jv)6H(jv), ð30Þ
where the transfer function of the Hilbert transform H(jv) is given
by:
H(jv)~{j 0ƒvvp
j {pƒvv0
�: ð31Þ
Using the numerically efficient Fast Fourier Transform (FFT),
the Hilbert transform can easily be computed. The Hilbert
transform XH½n� of the ECG signal X ½n� is used for the
computation of the signal envelope [85], which is given for
band-limited signals by
Table 2. Cont.
Technique Algorithm Robustness to noise Parameter choice Numerical efficiency
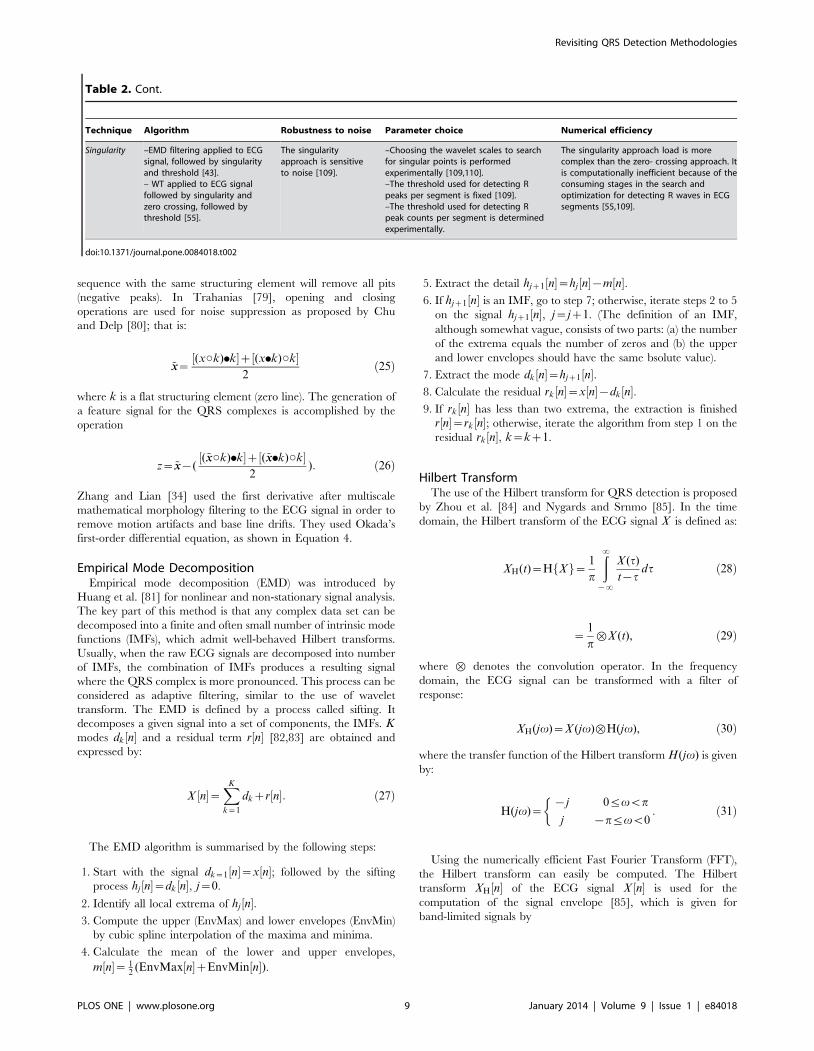
Singularity –EMD filtering applied to ECGsignal, followed by singularityand threshold [43].– WT applied to ECG signalfollowed by singularity andzero crossing, followed bythreshold [55].
The singularityapproach is sensitiveto noise [109].
–Choosing the wavelet scales to searchfor singular points is performedexperimentally [109,110].–The threshold used for detecting Rpeaks per segment is fixed [109].–The threshold used for detecting Rpeak counts per segment is determinedexperimentally.
The singularity approach load is morecomplex than the zero- crossing approach. Itis computationally inefficient because of theconsuming stages in the search andoptimization for detecting R waves in ECGsegments [55,109].
doi:10.1371/journal.pone.0084018.t002
Revisiting QRS Detection Methodologies
PLOS ONE | www.plosone.org 9 January 2014 | Volume 9 | Issue 1 | e84018
Ye½n�&ffiffiffiffiffiffiffiffiffiffiffiffiffiffiffiffiffiffiffiffiffiffiffiffiffiffiffiffiX 2½n�zX 2
H½n�q
: ð32Þ
A computationally less expensive approximation to the envelope
can be made by [85]
Ye½n�&jX ½n�jzjXH½n�j: ð33Þ
To remove ripples from the envelope and to avoid ambiguities
in the peak level detection, the envelope is low-pass filtered in
Nygards and Srnmo [85]. Additionally, they propose a waveform
adaptive scheme for the removal of low-frequency ECG compo-
nents is proposed. The method of Zhou et al. [84] is related to the
algorithms based on the Hilbert transform. In their study, the
envelope of the signal is approximated using
Ye½n�&jY1½n�jzjY2½n�j, ð34Þ
where and are the outputs of two orthogonal digital filters, namely:
Y1½n�~X ½n�{X ½n{6�, and ð35Þ
Y2½n�~X ½n�{X ½n{2�{X ½n{6�{X ½n{8�: ð36Þ
In order to remove noise, the envelope signal Ye½n� is smoothed
by a four-tap moving average filter. Some investigators use a first
derivative before applying the Hilbert transform [35–37]. Differ-
entiating the ECG modifies its phase, creating zero crossings at the
presumed location of the R peaks. Thus, a transformation is
required to rectify the phase in order to create a signal with
marked peaks at the true location of the R peaks.
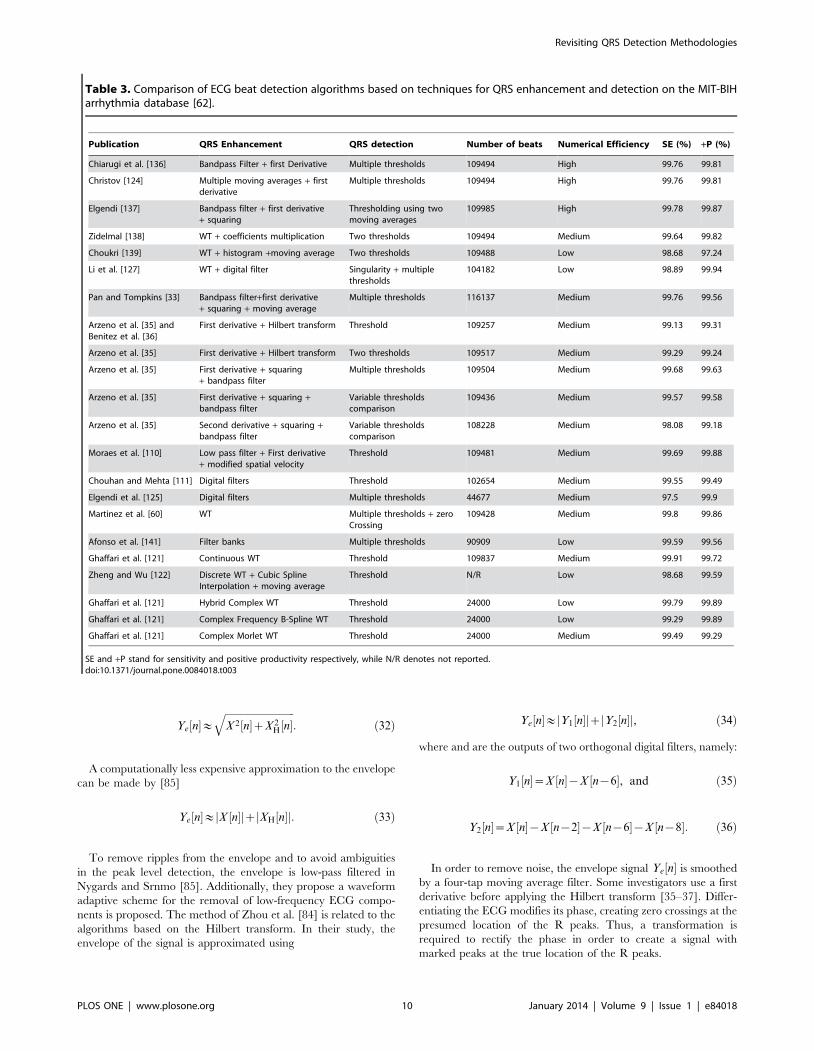
Table 3. Comparison of ECG beat detection algorithms based on techniques for QRS enhancement and detection on the MIT-BIHarrhythmia database [62].
Publication QRS Enhancement QRS detection Number of beats Numerical Efficiency SE (%) +P (%)
Chiarugi et al. [136] Bandpass Filter + first Derivative Multiple thresholds 109494 High 99.76 99.81
Christov [124] Multiple moving averages + firstderivative
Multiple thresholds 109494 High 99.76 99.81
Elgendi [137] Bandpass filter + first derivative+ squaring
Thresholding using twomoving averages
109985 High 99.78 99.87
Zidelmal [138] WT + coefficients multiplication Two thresholds 109494 Medium 99.64 99.82
Choukri [139] WT + histogram +moving average Two thresholds 109488 Low 98.68 97.24
Li et al. [127] WT + digital filter Singularity + multiplethresholds
104182 Low 98.89 99.94
Pan and Tompkins [33] Bandpass filter+first derivative+ squaring + moving average
Multiple thresholds 116137 Medium 99.76 99.56
Arzeno et al. [35] andBenitez et al. [36]
First derivative + Hilbert transform Threshold 109257 Medium 99.13 99.31
Arzeno et al. [35] First derivative + Hilbert transform Two thresholds 109517 Medium 99.29 99.24
Arzeno et al. [35] First derivative + squaring+ bandpass filter
Multiple thresholds 109504 Medium 99.68 99.63
Arzeno et al. [35] First derivative + squaring +bandpass filter
Variable thresholdscomparison
109436 Medium 99.57 99.58
Arzeno et al. [35] Second derivative + squaring +bandpass filter
Variable thresholdscomparison
108228 Medium 98.08 99.18
Moraes et al. [110] Low pass filter + First derivative+ modified spatial velocity
Threshold 109481 Medium 99.69 99.88
Chouhan and Mehta [111] Digital filters Threshold 102654 Medium 99.55 99.49
Elgendi et al. [125] Digital filters Multiple thresholds 44677 Medium 97.5 99.9
Martinez et al. [60] WT Multiple thresholds + zeroCrossing
109428 Medium 99.8 99.86
Afonso et al. [141] Filter banks Multiple thresholds 90909 Low 99.59 99.56
Ghaffari et al. [121] Continuous WT Threshold 109837 Medium 99.91 99.72
Zheng and Wu [122] Discrete WT + Cubic SplineInterpolation + moving average
Threshold N/R Low 98.68 99.59
Ghaffari et al. [121] Hybrid Complex WT Threshold 24000 Low 99.79 99.89
Ghaffari et al. [121] Complex Frequency B-Spline WT Threshold 24000 Low 99.29 99.89
Ghaffari et al. [121] Complex Morlet WT Threshold 24000 Medium 99.49 99.29
SE and +P stand for sensitivity and positive productivity respectively, while N/R denotes not reported.doi:10.1371/journal.pone.0084018.t003
Revisiting QRS Detection Methodologies
PLOS ONE | www.plosone.org 10 January 2014 | Volume 9 | Issue 1 | e84018

Filter BanksFilter banks decompose the bandwidth of the input ECG signal
into sub-band signals with uniform frequency bands. The sub-
bands can be downsampled, since the sub-band bandwidth is
much lower than the input signal. The sub-bands provide
information from various frequency ranges; thus, it is possible to
perform time- and frequency-dependent processing of the input
signal.
As shown in Figure 3, a filter bank contains analysis filters,
which decompose the input signal into sub-band signals with
uniform frequency bandwidths, each of constant length. The
analysis filters bandpass the input ECG signal to produce the sub-
band signals:
ui(z)~Hi(z)X (z): ð37Þ
The effective bandwidth of ui(z) is p=M and i~0,1, . . . ,M{1;
thus, they can be downsampled to reduce the total rate. The
downsampling process ;M (Fig. 3), keeps one sample out of all
samples. The downsampled signal wi(z) is
wi(z)~1
M
XM{1
k~0
ui(z(1=M)W k), ð38Þ
where W~e{j(2p=M). The sub-bands ui(z) and wi(z) are
bandpassed versions of the input, and wi(z) has a lower sample
rate than ui(z). The filtering process can be efficiently conducted
at 1=M the input rate by taking advantage of the downsampling.
This process is referred to as polyphase implementation and it
contributes to the computational efficiency of filter bank
algorithms [47]. A variety of features indicative of the QRS
complex can be designed by combining sub-bands of interest
reported in Afonso et al. [47]. For example, a sum-of-absolute
values feature can be computed using sub-bands, i~1:::4. From
these sub-bands six features (p1, p2, p3, p4, p5, and p6) can be
derived as follows:
p1½n�~X3
i~1
jwi(z)j, p2½n�~X4
i~1
jwi(z)j, p3½n�~X4
i~2
jwi(z)j, ð39Þ
p4½n�~X3
i~1
(wi(z))2, p5½n�~X4
i~1
(wi(z))2, p6½n�~X4
i~2
(wi(z))2:ð40Þ
These features have values that are proportional to the energy of
the QRS complex. Finally, heuristic beat-detection logic can be
used to incorporate some of the above features that are indicative
of the QRS complex.
Wavelet TransformWavelets are closely related to filter banks. The wavelet
transform (WT) [86] of a function f (t) is an integral transform
defined by
Wf (a,b)~
ð?
{?
f (t)y�a,b(t) dt, ð41Þ
where y�(t) denotes the complex conjugate of the wavelet function
y(t). The transform yields a time-scale representation similar to the
time-frequency representation of the short-time Fourier transform
(STFT). In contrast to the STFT, the WT uses a set of analysing
functions that allow a variable time and frequency resolution for
different frequency bands. The set of analysing functions—the
wavelet family ya,b(t)—is deduced from a mother wavelet y(t) by:
ya,b(t)~1ffiffiffi2p y(
t{b
a), ð42Þ
where a and b are the dilation (scale) and translation parameters
respectively. The scale parameter a of the WT is comparable to
the frequency parameter of the STFT. The mother wavelet is a
short oscillation with zero mean. The discrete wavelet transform
(DWT) results from discretised scale and translation parameters;
for example, a~2j and b~n(2j), where j and n are integers. This
choice of a and b leads to the dyadic WT (DyWT):
Wf (2j ,b)~
ð?
{?
f (t)y�2j ,b
(t) dt, ð43Þ
y2j ,b
(t)~1
2j=2y(
t{b
2j), ð44Þ
y2j ,b
(t)~1
2j=2y(
t
2j{n): ð45Þ
Although defined as an integral transform, the DyWT is usually
implemented using a dyadic filter bank where the filter coefficients
are directly derived from the wavelet function used in the analysis
[87–89].
QRS Detection
After enhancing the QRS features using the previous algo-
rithms, the next step is to detect the QRS complexes. Through the
previous enhancement step, QRS complexes are filtered and
magnified relative to other ECG features and noise. There are
many detection techniques used in the literature, as shown in
Table 2. This include thresholding, neural networks [91,112–114],
hidden Markov model [95], matched filters [115,116], syntactic
methods [104–106], zero-crossing [107], and singularity tech-
niques [117–119]. In the summary of Table 3, all these algorithms
are numerically inefficient except thresholding. As the main
purpose of this article is to highlight suitable algorithms for ECG
monitoring using battery-operated, portable devices, only thresh-
olding will be considered for the detection phase for simplicity and
efficiency. In this context, it has to be emphasised that threshold-
ing can be applied to time-domain [23,24,120] as well as time-
frequency [121–123] ECG signals. However, the use of a fixed
threshold to detect QRS complexes is simple and only efficient for
stationary ECG signals with similar beat-to-beat morphology. Due
to severe baseline drift and movement of patients, an ECG
waveform may vary drastically from one heartbeat to the next in
mobile applications. Therefore, the probability of not accurately
detecting QRS complexes is high. Using adaptive thresholding
[59,124–126], the probability of missing QRS complexes
decreases. However, the main drawback of these adaptive-
thresholding based algorithms is the setting of multiple thresholds
Revisiting QRS Detection Methodologies
PLOS ONE | www.plosone.org 11 January 2014 | Volume 9 | Issue 1 | e84018

empirically. Therefore, currently, these algorithms cannot provide
a universal solution to the QRS detection problem, since they may
work perfectly on some clean signals, but not those containing
arrhythmias or noisy QRS complexes.
Discussion
The performance of QRS detection algorithms are typically
assessed using two statistical measures: sensitivity SE~TP=(TPzFN) and positive predictivity zP~TP=(TPzFP), where
TP is the number of true positives (QRS complexes detected as
QRS complexes), FN is the number of false negatives (QRS
complexes which have not been detected), and FP is the number
of false positives (non-QRS complexes detected as QRS complex-
es). The sensitivity reports the percentage of true beats that were
correctly detected by the algorithm, whilst the positive predictivity
reports the percentage of beat detections that were true beats.
The performance of current QRS detection algorithms
described in the literature has not been completely assessed in
terms of robustness to noise, parameter choice, and numerical
efficiency. Moreover, many of the QRS algorithms have not been
tested against a standard database, or any database at all making
the results difficult to compare and evaluate. Furthermore, many
algorithms scored a high detection performance using the overall
number of detected beats (i.e. QRS complexes), as shown in
Table 3. It is worth noting that the algorithm of Li et al. [127]
scored high overall performance with a sensitivity of 99.89% and a
specificity of 99.94%. However, Li et al. excluded files 214 and
215 from the MIT-BIH arrhythmia database [62], and therefore
their algorithm may not superior in terms of performance. In
addition, their algorithm was based on wavelet feature extraction
and singularity for classification, which is considered numerically
inefficient.
As noted, some investigators have excluded records from the
MIT-BIH arrhythmia database [62] for the sake of reducing noise
in the processed ECG signals; consequently their algorithms
appeared to achieve improved performance. Other researchers
excluded segments with ventricular flutter [60] and signals from
patients with paced beats [110] from their investigations.
Therefore, a robust algorithm is required to analyse ECG signals
without excluding any records or particular segments, especially if
the main goal is to provide a robust algorithm for long-term ECG
signals recorded over a few days.
Robustness to NoiseRobustness to noise is effectively tested as we use signals from
the widely used MIT-BIH Arrhythmia Database [62] that
contains signals with different noise sources and non-sinus beats.
The MIT-BIH database is widely used to evaluate QRS detection
algorithms. As demonstrated in Table 1, there are many
algorithms used for denoising and enhancing the QRS complex
in ECG signals.
Usually, denoising ECG signal requires a bandpass filter, which
can be implemented on battery-driven devices and while
reasonably preserving the clinical features of ECG signals (P,
QRS, and T waves) at the same time. Perhaps, a more
sophisticated algorithm may filter the ECG more effectively, for
example Sameni et al. [128] proposed a Bayesian framework that
filters ECG better than the conventional bandpass filtering [129–
131], adaptive filtering [132], and wavelet denoising [133,134]
over different types of noise using highly realistic synthetic ECG.
Recently, Sharma et al. [135] proposed a wavelet-based denoising
method tested on real ECG data and synthetic ECG signals.
However, both algorithms are numerically inefficient.
Table 3 shows that the Chiarugi et al. [136] as well as Christov
[124], and Elgendi [137] algorithms are highly-numerically
efficient, and the use of a first derivative with or without moving
average in the QRS enhancement phase is promising, especially
when it is followed by a proper QRS detection phase such as
moving average and/or dynamic threshold. However, the only use
of derivative in the QRS enhancement phase without a proper
QRS detection phase is extremely sensitive to noise [29].
It is worth noting that Elgendi’s algorithm [137] tested on the
MIT-BIH Noise Stress Test Database and scored higher accuracy
in detecting R peaks compared to Pan-Tompkins [33] and Benitez
et al. [36].
Battery-Driven ECG DevicesMany QRS detection algorithms have been published, and a
comparison between them needs to be conducted. An algorithmic
comparison regarding numerical efficiency has been carried out
Figure 4. Screenshot showing the main interface of the ‘Hearty’ application implemented by Gradl et al. (2012) [8]. From top tobottom: Panel showing various clinically relevant parameters that are automatically detected including heart rate (HR) and RR interval; Panel showingthe detected ECG signal, which is wirelessly streamed to the application; Panel showing the QRS detection with filled circle markers for the Q, R and Swaves; Panel showing the detected beat-to-beat heart rate.doi:10.1371/journal.pone.0084018.g004
Revisiting QRS Detection Methodologies
PLOS ONE | www.plosone.org 12 January 2014 | Volume 9 | Issue 1 | e84018
Revisiting QRS Detection Methodologies
PLOS ONE | www.plosone.org 13 January 2014 | Volume 9 | Issue 1 | e84018
empirically. As shown in Table 3, each algorithm has been
categorised as low, medium or high in terms of its numerical
efficiency, based on the number of iterations and the number of
equations (e.g. multiplications, additions, differentiations) em-
ployed. The better the numerical efficiency, the faster the
algorithm, and vice-versa. Consequently, the faster the algorithm,
the more suitable it is for real-time monitoring.
With advances in computational power, the demand for
numerical efficiency has decreased. However, this is still more
the case when the ECG signals are collected and analysed in
hospitals, but not for the case of portable ECG devices, which are
battery driven. This leads to especially high demands on
algorithms for use within a mobile phone for monitoring ECG
signals of patients in a mobile, unobtrusive at home setting.
Therefore, there is a need for developing numerically efficient
algorithms to accommodate the new trend towards mobile ECG
devices and to analyse long-term recorded signals in a time-
efficient manner.
Typically, processing large databases is carried out on PC
workstations with high-speed, multi-core processors and efficient
memory. This advantage is still not available for battery-operated
devices: even the current smartphone platforms have limited RAM
and processing power [8,10,142]. In general, battery-driven ECG
devices follow one of these schemes: 1) collect data for offline
analysis; 2) collect data for real-time analysis within the device
itself; or 3) collect data for real-time analysis via a remote
connection to a separate server. Certainly, each scheme has its
own advantage and disadvantage in terms of processing time and
power consumption.
The Holter device is the most commonly-used ECG battery-
operated platform, especially for monitoring and recording ECG
signals to be processed offline. With the advancement of
smartphones in terms of memory and processors, investigators
are trying to replace the Holter devices by smartphones [8].
Furthermore, the use of a smartphone has extra advantages from
the patient perspective such as mobility, familiarity and guaran-
teed usage [143]. Thus, recently, there have been some
contributions in phone applications that analyse ECG signals
collected wirelessly via Bluetooth [8,10,144] and Zigbee radio
protocols [142].
The current advances in battery-driven devices such as
smartphones and tablet computers have made these technologies
invariably part of daily life, even in developing countries [12]. It
has also increased the possibility of implementing more sophisti-
cated algorithms such as the Pan-Tompkins method [33] on
smartphones as shown in Figure 4. However, there is a significant
trade-off as there will always be a power-consumption limitation in
processing ECG signals on battery-operated devices. Therefore,
prior to deploying any algorithm on modern mobile devices,
comprehensive evaluation of the algorithm based on robustness to
noise, parameter choice, and numerical efficiency is required to
improve the quality of diagnosis with respect to processing time or
power consumption. One of the recent studies that confirms this
recommendation is done by Hyejung et al. [145] who developed a
simple algorithm to detect QRS complexes for Holter devices.
Their simple algorithm, which consists of bandpass filter followed
by multiple thresholds, was faster and more efficient compared to
relatively more complex methods [35,146].
Mobile Telemedicine SystemsMobile telemedicine systems often use mobile phones/PDAs to
just collect the ECG data–wirelessly or wired–and send them to a
central monitoring station using GSM or internet for further
analysis [147,148]. In such cases, some analysis can be done locally
on the smartphone before transmission; however, it is not always
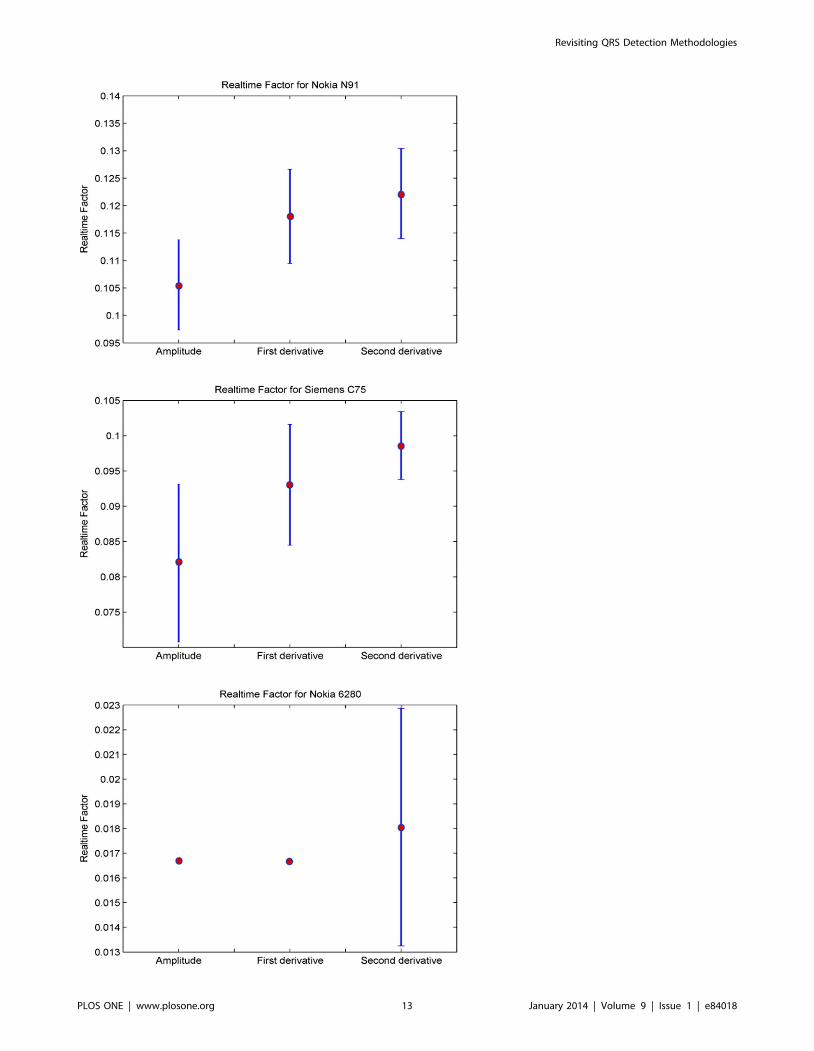
Figure 5. A showcase of realtime factors for three outdated mobile phones. Three QRS detection algorithms were tested, as reported bySufi et al. [63]. The QRS enhancement phase was based on amplitude, first-derivative, and second-derivative techniques, whilst the QRS detectionphase employed thresholding. Realtime factor is the processing time needed to run the QRS detection algorithm for an individual ECG entry withinone measurement window size of 60 seconds.doi:10.1371/journal.pone.0084018.g005
Figure 6. QRS enhancement stage in ECG signals. (a) ECG signal(top: from record 107, bottom: from record 108 of the MIT-BIHArrhythmia Database [62]), (b) amplitude from Eq.1 where b~0:3, (c)first derivative from Eq.4, (d) first derivative and second derivative fromEq.7, and (e) digital filter from Ref. [33]. Signal amplitudes have beenmanipulated to fit all signals in one figure. Here, a red asteriskrepresents the annotated R peak.doi:10.1371/journal.pone.0084018.g006
Revisiting QRS Detection Methodologies
PLOS ONE | www.plosone.org 14 January 2014 | Volume 9 | Issue 1 | e84018
recommended as the transmission can consume more power than
the ECG analysis itself [149]. There is no doubt that the essential
quality for any algorithm used for real-time analysis is its simplicity
(numerical efficiency), provided this does not decrease accuracy.
The simpler the algorithm (while retaining accuracy), the faster it
will be in processing large databases [35,150], and it will consume
less power for battery-operated devices [63,142,151]. Moreover, a
simple algorithm also offers low cost of hardware implementation
in both power and size for body sensor networks [152]. Sufi et al.
[163] investigated three simple QRS algorithms suitable for
mobile phones. The QRS enhancement phase of these algorithms
consisted of amplitude, first-derivative, and second-derivative
methods, while the QRS detection phase was threshold-based.
They used simple methodologies for QRS enhancement and
detection for implementation over mobile phones. This simplicity
has been confirmed in Table 3 where it is evident that the first
derivative and threshold are an efficient combination for detecting
QRS if developed properly.
Mobile Phone ApplicationsTo demonstrate the importance of processing time on a mobile
phone, a showcase is demonstrated in Figure 5 for three outdated
mobile phones [63]. It can be seen that the Nokia 6280 consumes
the least processing time, as shown in Fig. 5(c). As expected, the
amplitude-based QRS enhancement technique was faster than the
first-derivative and second derivative based techniques. In this
study [63], the quality of ECG signals was discussed and the data
used was relatively noise-free, as the ECG signal shown in Figure 2
illustrates. However, this does not mean that a simple (or faster)
algorithm will be more accurate. For example, Figure 6 shows that
a simple amplitude threshold or first derivative method does not
emphasize the QRS complex for the case of paced beats (record
107) and inverted QRS complexes (record 108). Nevertheless, the
Sufi et al. result is considered a foundational step for monitoring
ECG signals using mobile phones, but their algorithm exhibited
some limitations in terms of memory and processing time.
Nowadays, smartphones possess advanced processing and
storage capabilities, including a powerful CPU, more memory
and GPUs with high-speed data access via Wi-Fi or mobile
broadband [153]. Therefore, implementing a sophisticated QRS
detection algorithm on a smartphone is becoming more feasible.
Gradl et al. [8] implemented the Pan-Tompkins algorithm [33] on
three smartphones: Samsung GT-I9000, SamsungTM GT-N7000,
and HTCTM Wildfire S A510e. The authors showed that
processing of the wirelessly streamed ECG signal is feasible in
real-time on the mentioned devices; however, they stated that
battery lifetime was affected negatively by running the monitoring
application.
Certainly, the implementation of the Pan-Tompkins algorithm
is more resource-demanding, and therefore consumes more time
and power, than the three simple algorithms investigated by Sufi
et al. [63]. Nevertheless, recent wearable devices can easily fulfil
the real-time requirement. For example, the real-time factor for
processing record 100 of the MIT-BIH Arrhythmia Database [62]
using the Pan-Tompkins algorithm over three recent tablet
computers/smartphones: the Asus Transformer Prime, the
Samsung Galaxy S III, as well as the Samsung Galaxy S II was
0.14|, 0.13|, and 0.2|, respectively. In contrast, the real-time
factors for processing the same record using the first-derivative
algorithm on the outdated phones: the Nokia N91, the Siemens
C75, and the Nokia 6280 were 0.13|, 0.1|, 0.016|,
respectively.
Another aspect that has been ignored in the literature is the
clinical utility of the ECG algorithms. It is rare to find a study that
addresses the usefulness of the developed algorithm in a clinical
setting. As far as we are aware, there is no evidence that shows
whether the discussed algorithms are currently implemented and
tested in clinical settings.
Conclusions
In conclusion, we provide a summary of the required algorithms
for ECG detection based on the literature together with our own
investigations. The use of the first-derivative of the filtered ECG
with or without a moving-average filter is recommended, as this
approach is highly numerically efficient for the QRS enhancement
phase, but is sensitive to noise and arrhythmia; therefore, an
adaptive thresholding or integration-based approach is needed in
the detection phase. Both of these suggested methodologies are
simple and computationally efficient for the detection of QRS
complexes in mobile-phone applications. If more processing power
is available, as is the case on modern tablet computers and
smartphones, implementation of the classical Pan-Tompkins
algorithm [33] is also a feasible choice. Overall, simplicity and
efficiency are required in developing QRS detection algorithms for
processing long-term recordings and large databases, as well as for
expanding our telemedicine capabilities in the near future.
Acknowledgments
The authors would like to thank Patrick Kugler and Stefan Gradl for re-
evaluating the Pan-Tompkins algorithm [33] result on modern wearable
devices and the presentation of Fig. 4. Mohamed Elgendi would like to
thank Dr Gari Clifford for helpful discussions.
Author Contributions
Conceived and designed the experiments: ME. Performed the experiments:
ME BE. Analyzed the data: ME BE DA. Contributed reagents/materials/
analysis tools: ME BE SD DA. Wrote the paper: ME BE SD DA.
References
1. Alwan A (2011) Global status report on noncommunicable diseases 2010.
World Health Organization.
2. Goss J (2008) Projection of Australian health care expenditure by disease, 2003
to 2033. Australian Institute of Health and Welfare.
3. Bloom D, Cafiero E, Jane-Llopis E, Abrahams-Gessel S, Bloom L, et al. (2011)
The global economic burden of noncommunicable diseases. Technical report,
Geneva: World Economic Forum.
4. Dilaveris PE, Gialafos EJ, Sideris SK, Theopistou AM, Andrikopoulos GK,
et al. (1998) Simple electrocardiographic markers for the prediction of
paroxysmal idiopathic atrial fibrillation. American Heart Journal 135: 733–
738.
5. Ren-Guey L, Yih-Chien C, Chun-Chieh H, Chwan-Lu T (2007) A mobile care
system with alert mechanism. IEEE Transactions on Information Technology
in Biomedicine 11: 507–517.
6. Rasid MFA, Woodward B (2005) Bluetooth telemedicine processor for
multichannel biomedical signal transmission via mobile cellular networks.
IEEE Transactions on Information Technology in Biomedicine 9: 35–43.
7. Wen C, Yeh MF, Chang KC, Lee RG (2008) Real-time ECG telemonitoring
system design with mobile phone platform. Measurement 41: 463–470.
8. Gradl S, Kugler P, Lohmuller C, Eskofier B (2012) Real-time ECG monitoring
and arrhythmia detection using Android-based mobile devices. In: Proc. 2012
Ann Int. Conf. IEEE Engineering in Medicine and Biology Society (EMBC).
San Diego, CA, USA, pp. 2452–2455.
9. Scully C, Jinseok L, Meyer J, Gorbach AM, Granquist-Fraser D, et al. (2012)
Physiological parameter monitoring from optical recordings with a mobile
phone. IEEE Transactions on Biomedical Engineering 59: 303–306.
10. Oresko J (2010) Portable heart attack warning system by monitoring the ST
segment via smartphone electrocardiogram processing. Ph.D. thesis, University
of Pittsburgh.
Revisiting QRS Detection Methodologies
PLOS ONE | www.plosone.org 15 January 2014 | Volume 9 | Issue 1 | e84018
11. Hayn D, Jammerbund B, Schreier G (2011) ECG quality assessment for patient
empowerment in mHealth applications. In: Computing in Cardiology, 2011.
pp. 353–356.
12. Silva I, Moody GB, Celi L (2011) Improving the quality of ECGs collected
using mobile phones: The Physionet/Computing in Cardiology Challenge
2011. In: Computing in Cardiology, 2011. pp. 273–276.
13. Tsipouras MG, Fotiadis DI, Sideris D (2002) Arrhythmia classification using
the RR-interval duration signal. In: Proc. IEEE Computers in Cardiology. pp.
485–488.
14. Tran T, McNames J, Aboy M, Goldstein B (2004) Prediction of paroxysmal
atrial fibrillation by analysis of atrial premature complexes. IEEE Trans
Biomedical Engineering 51: 561–569.
15. Bashour C, Visinescu M, Gopakumaran B, Wazni O, Carangio F, et al. (2004)
Characterization of premature atrial contraction activity prior to the onset of
postoperative atrial fibrillation in cardiac surgery patients. Chest 126: 831S–
a-832S.
16. de Chazal P, O’Dwyer M, Reilly RB (2004) Automatic classification of
heartbeats using ECG morphology and heartbeat interval features. IEEE Trans
Biomedical Engineering 51: 1196–1206.
17. Krasteva VT, Jekova II, Christov II (2006) Automatic detection of premature
atrial contractions in the electrocardiogram. In: Electrotechniques
Electronics E & E. volume 9-10, pp. 49–55.
18. Scholz UJ, Bianchi AM, Cerutti S, Kubicki S (1997) Vegetative background of
sleep: spectral analysis of the heart rate variability. Physiol Behavior 62: 1037–
1043.
19. Trinder J, Kleiman J, Carrington M, Smith S, Breen S, et al. (2001) Autonomic
activity during human sleep as a function of time and sleep stage. J Sleep Res
10: 253–264.
20. Zapanta L, Poon C, White D, Marcus C, Katz E (2004) Heart rate chaos in
obstructive sleep apnea in children. In: Proc. 26th Annual International
Conference of the IEEE Engineering in Medicine and Biology Society (IEMBS
’04). pp. 3889–3892.
21. Shouldice R, O’Brien L, O’Brien C, de Chazal P, Gozal D, et al. (2004)
Detection of obstructive sleep apnea in pediatric subjects using surface lead
electrocardiogram features. Sleep 27: 784–792.
22. Goutas A, Ferdi Y, Herbeuval JP, Boudraa M, Boucheham B (2005) Digital
fractional order differentiation-based algorithm for P and T-waves detection
and delineation. ITBM-RBM Elsevier 26: 127–132.
23. Morizet-Mahoudeaux P, Moreau C, Moreau D, Quarante JJ (1981) Simple
microprocessorbased system for on-line e.c.g. arrhythmia analysis. Medical and
Biological Engineering and Computing 19: 497–500.
24. Fraden J, Neuman M (1980) QRS wave detection. Medical and Biological
Engineering and Computing 18: 125–132.
25. Gustafson D (1977) Automated VCG interpretation studies using signal
analysis techniques. Technical Report R-1044, Charles Stark Draper
Laboratory, Cambridge, MA, USA.
26. Balda R, Diller G, Deardorff E, Doue J, Hsieh P (1977) The HP ECG analysis
program. In: JH . van Bemmel and JL . Willems, Editors, Trends in Computer-
Processed Electrocardiograms: 197–205.
27. Ahlstrom ML, Tompkins WJ (1983) Automated high-speed analysis of Holter
tapes with microcomputers. IEEE Transactions on Biomedical Engineering 30:
651–657.
28. Engelse WAH, Zeelenberg C (1979) A single scan algorithm for QRS-detection
and feature extraction. Proc IEEE Computers in Cardiology 6: 37–42.
29. Friesen G, Jannett T, Jadallah M, Yates S, Quint S, et al. (1990) A comparison
of the noise sensitivity of nine QRS detection algorithms. IEEE Transactions
on Biomedical Engineering 37: 85–98.
30. Okada M (1979) A digital filter for the QRS complex detection. IEEE
Transactions on Biomedical Engineering 26: 700–703.
31. Menrad A (1981) Dual microprocessor system for cardiovascular data
acquisition, processing and recording. In: Proc. 1981 IEEE Int. Conf.
Industrial Elect. Contr. Instrument. pp. 64–69.
32. Holsinger W, Kempner K, Miller M (1971) QRS preprocessor based on digital
differentiation. IEEE Transactions on Biomedical Engineering 18: 212–217.
33. Pan J, Tompkins W (1985) A real-time QRS detection algorithm. IEEE
Transactions on Biomedical Engineering 32: 230–236.
34. Zhang F, Lian Y (2007) Electrocardiogram QRS detection using multiscale
filtering based on mathematical morphology. In: Proc. 29th Annual
International Conference of the IEEE Engineering in Medicine and Biology
Society. pp. 3196–3199.
35. Arzeno N, Deng Z, Poon C (2008) Analysis of first-derivative based QRS
detection algorithms. IEEE Transactions on Biomedical Engineering 55: 478–
484.
36. Benitez DS, Gaydecki PA, Zaidi A, Fitzpatrick AP (2000) A new QRS
detection algorithm based on the Hilbert transform. In: Proc. IEEE Computers
in Cardiology. pp. 379–382.
37. Arzeno N, Poon C, Deng Z (2006) Quantitative analysis of QRS detection
algorithms based on the first derivative of the ECG. In: Proc. 28th Annual
International Conference of the IEEE Engineering in Medicine and Biology
Society. pp. 1788–1791.
38. Zhang F, Lian Y (2007) Novel QRS detection by CWT for ECG sensor. In:
Proc. IEEE Biomedical Circuits and Systems Conference. pp. 211–214. doi:
10.1109/BIOCAS.2007.4463346.
39. Ulusar UD, Govindan RB, Wilson JD, Lowery CL, Preissl H, et al. (2009)
Adaptive rule based fetal QRS complex detection using Hilbert transform. In:
Proc. Ann. Int. Conf. IEEE Engineering in Medicine and Biology Society
(EMBC). pp. 4666–4669.
40. Lin CC, Hu WC, Chen CM, Weng CH (2008) Heart rate detection in highly
noisy handgrip electrocardiogram. In: Proc. IEEE Computers in Cardiology.
Bolognia, Italy, pp. 477–480.
41. Yongli C, Huilong D (2005) A QRS complex detection algorithm based on
mathematical morphology and envelope. In: Proc. 27th Annual International
Conference of the Engineering in Medicine and Biology Society. pp. 4654–
4657.
42. Jing-tian T, Xiao-li Y, Jun-chao X, Yan T, Qing Z, et al. (2008) The algorithm
of R peak detection in ECG based on empirical mode decomposition. In: Proc.
Fourth International Conference on Natural Computation. volume 5, pp. 624–
627.
43. Xing H, Huang M (2008) A new QRS detection algorithm based on empirical
mode decomposition. In: Proc. 2nd International Conference on Bioinfor-
matics and Biomedical Engineering. pp. 693–696.
44. Arafat A, Hasan K (2009) Automatic detection of ECG wave boundaries using
empirical mode decomposition. In: Proc. IEEE International Conference on
Acoustics, Speech and Signal Processing. pp. 461–464.
45. Zhang F, Lian Y (2009) Wavelet and Hilbert transforms based QRS complexes
detection algorithm for wearable ECG devices in wireless body sensor
networks. In: Proc. IEEE Biomedical Circuits and Systems Conference. pp.
225–228.
46. Zhou HY, Hou KM (2008) Embedded real-time QRS detection algorithm for
pervasive cardiac care system. In: Proc. 9th International Conference on Signal
Processing. pp. 2150–2153.
47. Afonso V, Tompkins W, Nguyen T, Luo S (1999) ECG beat detection using
filter banks. IEEE Transactions on Biomedical Engineering 2: 192–201.
48. Zhang F, Wei Y, Lian Y (2009) Frequency-response masking based filter bank
for QRS dection in wearable biomedical devices. In: Proc. IEEE International
Symposium on Circuits and Systems. pp. 1473–1476.
49. Vai MI, Li-Gao Z (2004) Beat-to-beat ECG ventricular late potentials variance
detection by filter bank and wavelet transform as beat-sequence filter. IEEE
Transactions on Biomedical Engineering 51: 1407–1413.
50. Afonso VX, Tompkins WJ, Nguyen TQ, Trautmann S, Luo S (1995) Filter
bank-based processing of the stress ecg. In: the 17th IEEE Annual Engineering
Conference in Medicine and Biology Society. volume 2, pp. 887–888.
51. Mengda L, Vinod AP, Samson SCM (2011) A new flexible filter bank for low
complexity spectrum sensing in cognitive radios. Journal of Signal Processing
Systems 62: 205–215.
52. Dinh HAN, Kumar DK, Pah ND, Burton P (2001) Wavelets for QRS
detection. In: the 23rd Annual International Conference of the IEEE
Engineering in Medicine and Biology Society. volume 2, pp. 1883–1887.
53. Szilagyi L (1999) Wavelet-transform-based QRS complex detection in on-line
Holter systems. In: Proc. First Joint 21st Annual Conference and the 1999
Annual Fall Meeting of the Biomedical Engineering Society (BMES/EMBS).
Atlanta, GA, USA, volume 1, p. 271.
54. Liang-Yu S, Ying-Hsuan W, Hu W (2004) Using wavelet transform and fuzzy
neural network for VPC detection from the Holter ECG. IEEE Transactions
on Biomedical Engineering 51: 1269–1273.
55. Zheng X, Li Z, Shen LL, Ji Z (2008) Detection of QRS complexes based on
biorthogonal spline wavelet. In: Proc. Int. Symp. Information Science and
Engineering (ISISE ’08), Shanghai, China. volume 2, pp. 502–506.
doi:10.1109/ISISE.2008.61.
56. Alesanco A, Olmos S, Istepanian R, Garcia J (2003) A novel real-time
multilead ECG compression and de-noising method based on the wavelet
transform. In: Proc. IEEE Computers in Cardiology. pp. 593–596.
57. Ahmed S, Al-Shrouf A, Abo-Zahhad M (2000) ECG data compression using
optimal nonorthogonal wavelet transform. Med Eng Phys 22: 39–46.
58. Szilagyi SM, Szilagyi L (2000) Wavelet transform and neural-network-based
adaptive filtering for QRS detection. In: Proc. 22nd Annual Int. Conf. IEEE
Engineering in Medicine and Biology Society, Chicago, Illinois, USA. volume
2, pp. 1267–1270.
59. Xiaomin X, Ying L (2005) Adaptive threshold for QRS complex detection
based on wavelet transform. In: Proc. 27th Annual International Conference of
the Engineering in Medicine and Biology Society. pp. 7281–7284.
60. Martinez JP, Almeida R, Olmos S, Rocha AP, Laguna P (2004) A wavelet-
based ECG delineator: evaluation on standard databases. IEEE Transactions
on Biomedical Engineering 51: 570–581.
61. Bothe HH (1997) Neuro-Fuzzy-Methoden. Berlin, Germany: Springer-Verlag.
62. Moody GB, Mark RG (2001) The impact of the MIT-BIH arrhythmia
database. IEEE Engineering in Medicine and Biology Magazine 20: 45–50.
63. Sufi F, Fang Q, Cosic I (2007) ECG R-R Peak detection on mobile phones. In:
Engineering in Medicine and Biology Society, 2007. EMBS 2007. 29th Annual
International Conference of the IEEE. pp. 3697–3700. doi:10.1109/
IEMBS.2007.4353134.
64. Ligtenberg A, Kunt M (1983) A robust-digital QRS detection algorithm for
arrhythmia monitoring. Computers and Biomed Res 16: 273–286.
65. Dokur Z, Olmez T, Yazgan E, Ersoy O (1997) Detection of ECG waveforms
by neural networks. Med Eng Phys 19: 738–741.
Revisiting QRS Detection Methodologies
PLOS ONE | www.plosone.org 16 January 2014 | Volume 9 | Issue 1 | e84018
66. Borjesson P, Palhm O, Sommo L, Nygards E (1982) Adaptive QRS detection
based on maximum a posteriori estimation. IEEE Transactions on Biomedical
Engineering 29: 341–351.
67. Fancott T, Wong D (1980) A minicomputer system for direct high speed
analysis of cardiac arrhythmias in 24 h ambulatory ECG tape recording. IEEE
Transactions on Biomedical Engineering 27: 685–693.
68. Keselbrener L, Keselbrener M, Akselrod S (1997) Nonlinear high pass filter for
R-wave detection in ECG signal. Medical Engineering & Physics 19: 481–484.
69. Leski J, Tkacz E (1992) A new parallel concept for QRS complex detector. In:
Proc. 14th Annual International Conference of the IEEE Engineering in
Medicine and Biology Society. Paris, France, pp. 555–556.
70. Nygards M, Hulting J (1979) An automated system for ECG monitoring.
Computers and Biomedical Research 12: 181–202.
71. Srnmo L, Pahlm O, Nygards M (1982) Adaptive QRS detection in ambulatory
ECG monitoring: A study of performance. In: Proc. IEEE Computers in
Cardiology. pp. 201–204.
72. Christov I, Dotsinsky I, Daskalov I (1992) High-pass filtering of ECG signals
using QRS elimination. Medical and Biological Engineering and Computing
30: 253–256.
73. Laguna P, Thakor N, Caminal P, Jane R (1990) Low-pass differentiators for
biological signals with known spectra: application to ECG signal processing.
IEEE Transactions on Biomedical Engineering 37: 420–425.
74. Thakor NV, Webster JG, Tompkins WJ (1984) Estimation of QRS complex
power spectra for design of a QRS filter. IEEE Transactions on Biomedical
Engineering 31: 702–6.
75. Thakor N, Zhu Y (1991) Applications of adaptive filtering to ECG analysis:
noise cancellation and arrhythmia detection. IEEE Transactions on Biomedical
Engineering 38: 785–794.
76. Chen H, Chen S (2003) A moving average based filtering system with its
application to real-time QRS detection. In: Proc. IEEE Computers in
Cardiology. pp. 585–588. doi: 10.1109/CIC.2003.1291223.
77. Sun Y, Suppappola S, Wrublewski T (1992) Microcontroller-based real-time
QRS detection. Biomedical Instrumentation and Technology 26: 477–484.
78. Suppappola S, Sun Y (1994) Nonlinear transforms of ECG signals for digital
QRS detection: a quantitative analysis. Biomedical Engineering, IEEE
Transactions on 41: 397–400.
79. Trahanias P (1993) An approach to QRS complex detection using
mathematical morphology. IEEE Transactions on Biomedical Engineering
40: 201–205.
80. Chu C, Delp E (1989) Impulsive noise suppression and background
normalization of electrocardiogram signals using morphological operators.
IEEE Transactions on Biomedical Engineering 36: 262–273.
81. Huang N, Shen Z, Long S, Wu M, Shih H, et al. (1998) The empirical mode
decomposition and hilbert spectrum for nonlinear and nonstationary time
series analysis. Proc Roy Soc Lond A: 903–995.
82. Oukhellou L, Aknin P, Delechelle E (2006) Railway infrastructure system
diagnosis using empirical mode decomposition and Hilbert transform. In: In:
Proc. IEEE Int. Conf. Acoustics, Speech and Signal Processing (ICASSP),
Toulouse, France. volume 3, p. III.
83. Damerval C, Meignen S, Perrier V (2005) A fast algorithm for bidimensional
EMD. Signal Processing Letters, IEEE 12: 701–704.
84. Zhou SK, Wang JT, Xu JR (1988) The real-time detection of QRS-complex
using the envelope of ECG. In: the Annual International Conference of the
IEEE Engineering in Medicine and Biology Society.
85. Nygards M, Sornmo L (1983) Delineation of the QRS complex using the
envelope of the ECG. Med Biol Eng Comput 21: 538–547.
86. Doyle TLA, Dugan EL, Humphries B, Newton RU (2004) Discriminating
between elderly and young using a fractal dimension analysis of centre of
pressure. International Journal of Medical Sciences 1: 11–20.
87. Burrus CS, Gopinath RA, Guo H (1998) Introduction to Wavelets and Wavelet
Transforms. New Jersey: Prentice Hall.
88. Strang G, Nguyen T (1997) Wavelets and Filter Banks. Wellesley, MA, USA:
Wellesley- Cambridge Press.
89. Elgendi M, Jonkman M, De Boer F (2009) R wave detection using Coiflets
wavelets. In: Proc. IEEE 35th Annual Northeast Bioengineering Conference,
Boston, MA, USA. pp. 1–2.
90. Krimi S, Ouni K, Ellouze N (2008) An approach combining wavelet transform
and hidden Markov models for ECG segmentation. In: Proc. 3rd IEEE Int.
Conf. Information and Communication Technologies: From Theory to
Applications, Damascus, Syria. pp. 1–6.
91. Xue Q, Hu Y, Tompkins W (1992) Neural-network-based adaptive matched
filtering for QRS detection. IEEE Transactions on Biomedical Engineering 39:
317–329.
92. Clifford GD, Azuaje F, McSharry P (2006) Advanced Methods And Tools for
ECG Data Analysis. Norwood, MA, USA: Artech House, Inc.
93. Garca-Berdons C, Narvez J, Fernndez U, Sandovalm F (1997) A new QRS
detector based on neural network. Springer-Verlag 1240: 1260–1269.
94. Dokur Z, lmez T (2001) ECG beat classification by a novel hybrid neural
network. Computer Methods and Programs in Biomedicine 66: 167–181.
95. Coast A, Cano G (1989) QRS detection based on hidden Markov modeling. In:
Proc. Annual International Conference of the IEEE Engineering in Medicine
and Biology Society, Seattle, WA, USA. pp. 34–35.
96. Coast D, Stern R, Cano G, Briller S (1990) An approach to cardiac arrhythmiaanalysis using hidden Markov models. IEEE Transactions on Biomedical
Engineering: 826–836.
97. Cheng W, Chan K (1998) Classification of electrocardiogram using hiddenMarkov models. In: Proc. 20th Annual Int. Conf. IEEE Engineering in
Medicine and Biology Society, Hong Kong. volume 1, pp. 143–146.
98. Coast DA (1993) Segmentation of high-resolution ECGs using hidden Markovmodels. In: Proc. IEEE Conf. Acoustics, Speech, and Signal Processing
(ICASSP-93), Minneapolis, MN, USA. volume 1, pp. 67–70.
99. Kaplan D (1990) Simultaneous QRS detection and feature extraction usingsimple matched filter basis functions. In: Proc. IEEE Computers in Cardiology.
pp. 503–506.
100. Ruha A, Sallinen S, Nissila S (1997) A real-time microprocessor QRS detectorsystem with a 1-ms timing accuracy for the measurement of ambulatory HRV.
IEEE Trans Biomedical Engineering 44: 159–167.
101. Hamilton PS, Tompkins WJ (1988) Adaptive matched filtering for QRSdetection. In: Proc. Annual Int. Conf. IEEE Engineering in Medicine and
Biology Society, New Orleans, LA, USA, Vol. 1, pp. 14–18.
102. Yaosheng L, Ying X, Jiongfeng C, Zeguang Z (2008) A comparative study toextract the diaphragmatic electromyogram signal. In: Proc. Int. Conf. IEEE
BioMedical Engineering and Informatics (BMEI 2008), Sanya, China, Vol. 2,pp. 315–319.
103. Eskofier B, Kornhuber J, Hornegger J (2008) Embedded QRS detection for
noisy ECG sensor data using a matched filter and directed graph search. In:Proc. 4th Russian-Bavarian Conference on Biomedical Engineering, Zeleno-
grad, Moscow, Russia, pp. 48–52.
104. Belforte G, De Mori R, Ferraris F (1979) A contribution to the automaticprocessing of electrocardiograms using syntactic methods. IEEE Transactions
on Biomedical Engineering 26: 125–136.
105. Ciaccio E, Dunn S, Akay M (1993) Biosignal pattern recognition andinterpretation systems. IEEE Engineering in Medicine and Biology Magazine
12: 106–113.
106. Trahanias P, Skordalakis E (1990) Syntactic pattern recognition of the ECG.
IEEE Transactions on Pattern Analysis and Machine Intelligence 12: 648–657.
107. Kohler B, Hennig C, Orglmeister R (2003) QRS detection using zero crossingcounts. Progress in Biomedical Research 8: 138–145.
108. Mallat S, Hwang W (1992) Singularity detection and processing with wavelets.
IEEE Transactions on Information Theory 38: 617–643.
109. Ayat M, Shamsollahi MB, Mozaffari B, Kharabian S (2009) ECG denoisingusing modulus maxima of wavelet transform. In: Proc. Annual Int. Conf. IEEE
Engineering in Medicine and Biology Society, Minneapolis, MN, USA, pp.416–419.
110. Moraes JCTB, Freitas MM, Vilani FN, Costa EV (2002) A QRS complex
detection algorithm using electrocardiogram leads. In: Proc. IEEE Computersin Cardiology. pp. 205–208. doi: 10.1109/CIC.2002.1166743.
111. Chouhan V, Mehta S (2008) Detection of QRS complexes in 12-lead ECG
using adaptive quantized threshold. International Journal of Computer Scienceand Network Security 8: 155–163.
112. Vijaya G, Kumar V, Verma H (1998) ANN-based QRS-complex analysis of
ECG. Journal of Medical Engineering and Technology 4: 160–167.
113. Hu Y, Tompkins W, Urrusti J, Afonso V (1993) Applications of artificial neural
networks for ECG signal detection and classification. Electrocardiology 26(Suppl.): 66–73.
114. Strintzis M, Stalidis G, Magnisalis X, Maglaveras N (1992) Use of neural
networks for electrocardiogram (ECG) feature extraction, recognition andclassification. Neural Network World 3: 313–327.
115. Dobbs S, Schmitt N, Ozemek H (1984) QRS detection by template matching
using real-time correlation on a microcomputer. Journal of ClinicalEngineering 9: 197–212.
116. Ebenezer D, Krishnamurthy V (1993) Wave digital matched filter for
electrocardiogram preprocessing. Journal of Biomedical Engineering 15:132–134.
117. Di Virgilio V, Francaiancia C, Lino S, Cerutti S (1995) ECG fiducial points
detection through wavelet transform. In: Proc. IEEE 17th Annual Conf.Engineering in Medicine and Biology Society, Montreal, Quebec, Canada,
Vol.2, pp. 1051–1052. doi: 10.1109/IEMBS.1995.579466.
118. Rao K (1997) Dwt based detection of R-peaks and data compression of ECGsignals. IETE Jouranl of Research 43: 345–349.
119. Kadambe S, Murray R, Boudreaux-Bartels G (1999)Wavelet transform-based
QRS complex detector. IEEE Transactions on Biomedical Engineering 46:838–848.
120. Chen HC S, Chan H (2006) A real-time QRS detection method based on
moving-averaging incorporating with wavelet denoising. Computer Methodsand Programs in Biomedicine 82: 187–195.
121. Ghaffari A, Golbayani H, Ghasemi M (2008) A new mathematical based QRSdetector using continuous wavelet transform. Computers & Electrical
Engineering 34: 81–91.
122. Zheng H, Wu J (2008) Real-time QRS detection method. In: Proc. IEEE 10thInt. Conf. Real-time QRS detection method, e-health Networking, Applica-
tions and Services (HealthCom 2008), Singapore, pp. 169–170. doi:10.1109/
HEALTH.2008.4600130.
123. Fard P, Moradi M, Tajvidi M (2007) A novel approach in R peak detection
using hybrid complex wavelet (HCW). International Journal of Cardiology 124:
250–253.
Revisiting QRS Detection Methodologies
PLOS ONE | www.plosone.org 17 January 2014 | Volume 9 | Issue 1 | e84018

124. Christov II (2004) Real time electrocardiogram QRS detection using combined
adaptive threshold. Biomedical Engineering Online 3: 28.125. Elgendi M, Mahalingam S, Jonkman M, De Boer F (2008) A robust QRS
complex detection algorithm using dynamic thresholds. In: Proc. IEEE Int.
Symp. Computer Science and its Applications (CSA’08), Hobart, Tasmania,Australia, pp. 153–158.
126. Elgendi M, Jonkman M, De Boer F (2009) Improved QRS detection algorithmusing dynamic thresholds. International Journal of Hybrid Information
Technology (IJHT) 2: 56–80.
127. Li C, Zheng C, Tai C (1995) Detection of ECG characteristic points usingwavelet transforms. IEEE Transactions on Biomedical Engineering 42: 21–28.
128. Sameni R, Shamsollahi MB, Jutten C, Clifford G (2007) A nonlinear Bayesianfiltering framework for ECG denoising. IEEE Transactions on Biomedical
Engineering 54: 2172–2185.129. Elgendi M, Jonkman M, De Boer F (2010) Frequency bands effects on QRS
detection. In: Proc. International Joint Conference on Biomedical Engineering
Systems and Technologies, BIOSIGNALS 2010, Valencia, Spain. pp. 428–431.
130. Elgendi M, Jonkman M, De Boer F (2009) P wave demarcation inelectrocardiogram. In: Proc. IEEE 35th Annual Northeast Bioengineering
Conference, Boston, MA, USA. pp. 1–2.
131. Elgendi M, Jonkman M, De Boer F (2009) Recognition of T waves in ECGsignals. In: Proc. IEEE 35th Annual Northeast Bioengineering Conference,
Boston, MA, USA. pp. 1–2.132. Widrow B, Glover J JR, McCool J, Kaunitz J, Williams C, et al. (1975)
Adaptive noise cancelling: Principles and applications. Proceedings of the IEEE63: 1692–1716.
133. Donoho D (1995) De-noising by soft-thresholding. IEEE Transactions on
Information Theory 41: 613–627.134. Messer SR, Agzarian J, Abbott D (2001) Optimal wavelet denoising for
phonocardiograms. Microelectronics Journal 32: 931–941.135. Sharma L, Dandapat S, Mahanta A (2013) Kurtosis-based noise estimation and
multiscale energy to denoise ECG signal. Signal, Image and Video Processing
7: 235–245.136. Chiarugi F, Sakkalis V, Emmanouilidou D, Krontiris T, Varanini M, et al.
(2007) Adaptive threshold qrs detector with best channel selection based on anoise rating system. In: Proc. IEEE Computers in Cardiology. pp. 157–160.
doi:10.1109/CIC.2007.4745445.137. Elgendi M (2013) Fast QRS detection with an optimized knowledge-based
method: Evaluation on 11 standard ECG databases. PLoS ONE 8: e73557.
138. Zidelmal Z, Amirou A, Adnane M, Belouchrani A (2012) QRS detection basedon wavelet coefficients. Computer Methods and Programs in Biomedicine 107:
490–496.139. Chouakri SA, Bereksi-Reguig F, Taleb-Ahmed A (2011) QRS complex
detection based on multi wavelet packet decomposition. Applied Mathematics
and Computation 217: 9508–9525.140. Lee J, Jeong K, Yoon J, Lee JH (1996) A simple real-time QRS detection
algorithm. In: Proc. 18th Annual International Conference of the IEEE
Engineering in Medicine and Biology Society, 1996. Bridging Disciplines for
Biomedicine. volume 4, pp. 1396–1398. doi: 10.1109/IEMBS.1996.647473.
141. Afonso VX, Tompkins WJ, Nguyen TQ, Luo S (1996) Filter bank-based ECG
beat detection. In: Proc. 18th Annual Int. Conf. IEEE Engineering in Medicine
and Biology Society; Bridging Disciplines for Biomedicine, Amsterdam,
Netherlands, Vol. 3, 1037–1038. doi:10.1109/IEMBS.1996.652698.
142. Hii PC, Chung WY (2011) A comprehensive ubiquitous healthcare solution on
an AndroidTMmobile device. Sensors 11: 6799–6815.
143. Solar H, Fernndez E, Tartarisco G, Pioggia G, Cvetkovi B, et al. (2012) A non
invasive, wearable sensor platform for multi-parametric remote monitoring in
CHF patients. In: Donnelly M, Paggetti C, Nugent C, Mokhtari M, editors,
Impact Analysis of Solutions for Chronic Disease Prevention and Management,
Publ: Springer, Berlin, Heidelberg, volume 7251 of Lecture Notes in Computer
Science. pp. 140–147.
144. Munoz Ramos O, Starostenko O, Alarcon-Aquino V, Cruz-Perez C (2013)
Real-time system for monitoring and analyzing electrocardiogram on cell
phone. In: Elleithy K, Sobh T, editors. Innovations and Advances in
Computer, Information, Systems Sciences, and Engineering, Publ: Springer,
New York, volume 152 of Lecture Notes in Electrical Engineering. pp. 327–338.
145. Hyejung K, Yazicioglu RF, Merken P, Van Hoof C, Hoi-Jun Y (2010) ECG
signal compression and classification algorithm with quad level vector for ECG
Holter system. IEEE Transactions on Information Technology in Biomedicine
14: 93–100.
146. Benitez D, Gaydecki PA, Zaidi A, Fitzpatrick AP (2001) The use of the Hilbert
transform in ECG signal analysis. Computers in Biology and Medicine 31:
399–406.
147. Jasemian Y, Arendt-Nielsen L (2005) Evaluation of a realtime, remote
monitoring telemedicine system using the bluetooth protocol and a mobile
phone network. Journal of Telemedicine and Telecare 11: 256–260.
148. Jurik AD, Weaver AC (2008) Remote medical monitoring. Computer 41: 96–
99.
149. Baig M, Gholamhosseini H, Connolly M (2013) A comprehensive survey of
wearable and wireless ECG monitoring systems for older adults. Medical &
Biological Engineering & Computing: 1–11.
150. Paoletti M, Marchesi C (2006) Discovering dangerous patterns in long-term
ambulatory ECG recordings using a fast QRS detection algorithm and
explorative data analysis. Computer Methods and Programs in Biomedicine 82:
20–30.
151. Martin-Clemente R, Camargo-Olivares JL, Hornillo-Mellado S, Elena M,
Roman I (2011) Fast technique for noninvasive fetal ECG extraction. IEEE
Transactions on Biomedical Engineering 58: 227–230.
152. Zhang CF, Tae-Wuk B (2012) VLSI friendly ECG QRS complex detector for
body sensor networks. IEEE Journal on Emerging and Selected Topics in
Circuits and Systems 2: 52–59.
153. Yan L, Shipeng L, Huifeng S (2011) Virtualized screen: A third element for
cloud-mobile convergence. IEEE Multimedia 18: 4–11.
Revisiting QRS Detection Methodologies
PLOS ONE | www.plosone.org 18 January 2014 | Volume 9 | Issue 1 | e84018