(revised) final land asset transfer for beneficial reuse …€¦ · · 2015-07-02government and...
TRANSCRIPT


i
TABLE OF CONTENTS
Section 1. Executive Summary ..................................................................................................................... 1
Section 2. Introduction and History of DOE Land Disposals ........................................................................ 2
Authorization ............................................................................................................................................ 3
Asset Reuse History and Community Reuse Organizations ...................................................................... 3
Authorities, Disposal Mechanisms, and the Land Transfer Process ......................................................... 5
Government and Taxpayer Cost Savings/Avoidance ................................................................................ 5
Section 3. Community Benefits/Beneficial Reuse ........................................................................................ 7
Commercial/Business ................................................................................................................................ 7
Historic Preservation ................................................................................................................................. 8
Naval Petroleum Reserves ........................................................................................................................ 8
Energy ....................................................................................................................................................... 9
Education ................................................................................................................................................ 10
Agriculture/Grazing ................................................................................................................................. 10
Wildlife Preservation/Timber ................................................................................................................. 10
Parks/Recreation ..................................................................................................................................... 11
Civic/Public Service ................................................................................................................................. 11
Commercial/Light Industrial ................................................................................................................... 13
Mixed Use (Commercial/Residential) ..................................................................................................... 14
Industrial ................................................................................................................................................. 14
Private Sale.............................................................................................................................................. 16
Section 4. Overview of Completed Transfers ............................................................................................. 17
Total Land Transfers by State .................................................................................................................. 20
Total Acres Transferred by State ............................................................................................................ 20
State‐by‐State Summaries ...................................................................................................................... 21
Section 5. Land Transfer Data Analysis ...................................................................................................... 36
Section 5.A DOE Historical Land Transfers .................................................................................................. 36
Historical Land Transfers by State ........................................................................................................... 36
Historical Land Transfers over Time ........................................................................................................ 38
Historical Acres Transferred per Year ..................................................................................................... 40
Historical Transfers by Reuse Category .................................................................................................. 41

ii
Historical Land Transfers by Authority .................................................................................................... 43
Authority Transfers by State ................................................................................................................... 45
Historical Land Transfers by Disposal Mechanism .................................................................................. 48
Disposal Mechanism Transfers by State ................................................................................................. 50
Section 5.B Naval Petroleum Reserves and Naval Oil Shale Reserves Transfers ........................................ 54
NPR and NOSR History ............................................................................................................................ 54
The NPR and NOSR Today ....................................................................................................................... 55
NPR and NOSR Disposals by State .......................................................................................................... 56
NPR and NOSR Authorities ...................................................................................................................... 57
NPR and NOSR Disposal Mechanisms ..................................................................................................... 58
Section 6. Conclusions................................................................................................................................ 59
Attachment A. DOE Historical Land Transfers .............................................................................................. i
Attachment B. NPR and NOSR Transfers ................................................................................................ xxvii
Attachment C. List of Acronyms ............................................................................................................... xxix
The Richland Manufacturing Mall Industrial Park was built on 760 acres of former DOE Hanford Site unneeded land that was transferred to the Port of Benton, Washington in 1998. Sixteen manufacturing and industrial tenants currently lease space in the mall, including American Rock/Eucon Corp. which operates a rock quarry on a portion of the site.

Section 1. Executive Summary
1
Section 1. Executive Summary
In fiscal year 2011, Congress passed the Ike Skelton National Defense Authorization Act for Fiscal Year 2011 [Section 3124, Public Law (P.L.) 111‐383)] that authorized the Department of Energy (DOE) to establish energy parks on former defense nuclear facility sites. Pursuant to this legislation, DOE established the Asset Revitalization Initiative (ARI) Task Force on February 2011 to address the Department’s portfolio of assets and opportunities that could be pursued by DOE. The ARI Task Force developed and issued, “The Asset Revitalization Initiative Report to Congress” on August 25, 2011 as required by legislation. The report defined ARI as a DOE‐wide effort to advance the beneficial reuse of its unique and diverse mix of assets; promotes a more efficient business environment within DOE; and encourages collaboration between the public and private sector and DOE sites. The report discussed the ARI Task Force’s follow‐on actions to continue DOE discussions with communities near DOE sites, nonprofit organizations, tribal organizations, the private sector, and other stakeholders and to explore opportunities to use DOE assets for beneficial purposes. The report also stated DOE’s intent to implement Asset Revitalization Initiative activities using its current authorities. Subsequent ARI Task Force reports, papers and activities that were not required by Congress were developed to provide a historical framework and assist DOE sites, programs, and the public pursue opportunities to use DOE’s diverse mix of assets to support DOE’s mission and encourage economic growth for neighboring communities and stakeholders. The reports, issue papers, fact sheets and other products are a collective work of the ARI Task Force members. The mission of ARI is to promote a more efficient business environment and encourage collaboration between the public and private sectors on and near DOE sites. One goal of ARI is to support the transfer or sale of unneeded DOE real property. Another goal is to remain open and transparent with our stakeholders about DOE activities in this area. As a result, the ARI Task Force has developed and is releasing its second report as an informational tool which documents DOE’s 209 transfers of more than 246,902 acres of land and real property assets completed by the Department over 57 years. This report provides information and context to DOE’s past efforts to dispose of unneeded real property. These transfers include sales, grants, and transfers (including at no‐cost) to other federal, state, regional, local, and tribal governments or non‐profit economic redevelopment organizations for beneficial reuse. This information demonstrates that DOE has a long‐standing history of success in transferring unneeded property back to communities. DOE will continue to collaborate with local communities, local and state elected officials, stakeholders, and Tribal Nations in identifying and transferring future land and assets.
Asset Revitalization Initiative (ARI) Mission
The Asset Revitalization Initiative is a DOE‐wide effort to advance the future use of its unique and diverse mix of assets, including land, facilities, infrastructure, equipment, technologies, natural resources, and a highly skilled workforce. ARI promotes a more efficient business environment to encourage collaboration between public and private entities. This will support DOE’s ability to achieve its mission and goals and stimulate and diversify regional economies.

Section 2. Introduction and History of DOE Land Disposals
2
The Heritage Center is located at the site of the former Oak Ridge Gaseous Diffusion Plant (K‐25), which is currently undergoing cleanup and revitalization efforts.
Section 2. Introduction and History of DOE Land Disposals
This report provides a historical perspective and summary of U.S. Department of Energy (DOE) actions over 57 years (through fiscal year [FY] 2013) on land and real property asset disposal. Throughout this report, the term “transfer” is used to include a broad range of land disposal actions and responsibilities as described in the DOE Real Property Desk Guide (2013 Update). This includes: sale of DOE real estate (at fair market value and less than fair market value); land grants; donations and no‐cost transfers; transfers for economic development purposes; disposal through the General Services Administration (GSA); transfers to other local, state, federal or tribal government agencies; relinquishment of withdrawn land; or other federal transfer actions like the Federal Lands‐to‐Parks Program, etc.
This is the second1 report developed by the ARI Task Force that is being issued to provide further information to interested parties regarding historical DOE land transfers, as well as additional data and details on historical reuse actions. Historical data spanning 57 years is presented to show DOE’s long history in turning over unneeded land and assets to other federal, state, or private entities for beneficial reuse. In some cases, this land had been part of previously existing communities and was acquired by the Atomic Energy Commission (the predecessor agency to DOE) to support nuclear weapons production activities as part of the Manhattan Project. Transfer of unneeded lands and assets supports the larger mission and goals of DOE’s asset reuse program and the Presidential Memorandum on disposition of unneeded federal real estate.
1 The first Report was titled, The Asset Revitalization Initiative Report to Congress, August 25, 2011.

Section 2. Introduction and History of DOE Land Disposals
3
Authorization
In 2010, the President signed a Presidential Memorandum, Disposing of Unneeded Federal Real Estate, June 10, 2010 addressing disposition of unneeded federal real estate. Per this memorandum, federal agencies were directed to identify and eliminate unneeded properties. In 2011, Section 3124 of the Ike Skelton National Defense Authorization Act for Fiscal Year 2011 (Public Law [P.L] 111‐383) was enacted and further authorized the Secretary of Energy to establish energy parks on former defense nuclear facility sites. This provision provided an additional basis for establishing a task force in February 2011 to address revitalization efforts in response to Congressional direction. However, prior to this effort, DOE has had a long history of transferring land and assets for reuse by local, state, federal, tribal, and other entities, beginning during the 1950s, as described below.
Asset Reuse History and Community Reuse Organizations
Starting in the late 1940s and early 1950s, the Atomic Energy Commission (AEC), a predecessor agency to DOE, transferred land, including large parcels transferred to the states of Washington (WA), New Mexico (NM), and Tennessee (TN), which formed the original sites in the cities of Richland, WA; Los Alamos, NM; and Oak Ridge, TN. Some of this land had been part of previously existing communities, while other parcels were vacant private or publicly owned land. Following those original transfers, the AEC (and later, DOE) continued to work with local communities to transfer unneeded land and assets for beneficial reuse. More than 209 transfers, conveying approximately 246,902 acres, have been completed through FY 2013.2 This includes more than 44,421 acres conveyed in 26 states and more than 202,481 acres of naval petroleum reserve 3 transfers in three states. A list of historical land and asset transfers is included in Attachment A, and a list of the naval petroleum reserve transfers is included in Attachment B to this report. The naval petroleum reserve transfers are presented separately due to the unique history and concentration of a large amount of total acreage in a small number of transfers in only a few states. These lists include data back to 1956; any prior‐year transfers are not
included because many historical land records for early land transfers in the late 1940s and early 1950s are no longer available for referencing today.
In the early 1990s, with the announcement of DOE’s plans to downsize and eventually close many of its facilities across the country in response to the end of the Cold War, the U.S. Congress authorized4 the Department to work with appropriate representatives of community groups to address and minimize the negative social and economic impacts of work force restructuring on communities surrounding DOE facilities. In response, DOE initiated a community transition program in 1993 that encouraged affected
communities to chart their own economic development future through the creation of Community
2 Data sources used to compile this information include DOE’s Facilities Information Management System for more recent transfers, as well as historical transfer data provided by DOE Site Real Property Offices; site reviews of historical land, deed, and title transfer documentation, some spanning back almost 50 years; and information provided by the CROs and the Energy Communities Alliance (ECA). 3 Petroleum reserves include the Naval Petroleum Reserves and Naval Oil Shale Reserves. 4 Congressional authorization came under Section 4604 of the Atomic Energy Defense Act (50 United States Code [U.S.C.] Section 2704; originally enacted as Section 3161 of the National Defense Authorization Act (NDAA) for FY 1993 [P.L. 102‐484]).
“To eliminate wasteful spending of taxpayer dollars, save energy and water, and further reduce greenhouse gas pollution, I hereby direct executive departments and agencies (agencies) to accelerate efforts to identify and eliminate excess properties…”
President Barack Obama June 10, 2010
Section 2. Introduction and History of DOE Land Disposals
4
Reuse Organizations (CROs). The primary purpose of the CROs was to reuse former defense nuclear facilities and other unneeded properties by accepting and reusing assets, land, and facilities for industrial, economic, commercial, or civic redevelopment or reuse. Additional information on the CROs can be found on the following DOE Office of Legacy Management websites:
http://energy.gov/lm/about‐us/contact‐us/community‐reuse‐organization
http://www.lm.doe.gov/default.aspx?id=80
Land and facilities have been leased or their titles transferred from DOE to the CROs or other entities for economic, business, or commercial redevelopment. Fifteen such CROs were originally formed across the country, and today there are eight active CROs at DOE sites, including the Hanford Tri‐Cities Industrial Development Council (TRIDEC); Savannah River Site (SRS) CRO; Idaho National Laboratory (INL) Regional Development Alliance; Community Reuse Organization of East Tennessee (CROET); Mound Development Corporation (MDC); Portsmouth Southern Ohio Diversification Initiative (SODI); Paducah Area Community Reuse Organization (PACRO); and Los Alamos National Laboratory (LANL) Regional Development Corporation.
In addition, the Energy Communities Alliance (ECA), an organization of local governments, has helped provide assistance to the general public interested in land and asset disposal5.
The land reuse efforts of DOE, economic development organizations, Tribal Nations, and local community and government organizations have yielded the following benefits:
Ninety sites that had a role in the Cold War have been cleaned up and closed, and many of these sites either have been transferred to economic development organizations or are available for beneficial reuse. Sites in reuse today include sites in Grand Junction, Colorado (CO); Oak Ridge, Tennessee (TN); Oxnard, California (CA); Los Alamos, New Mexico (NM); Mound, Ohio (OH); Cannonsburg, Pennsylvania (PA); Monticello, Utah (UT); Hanford, Washington (WA); Barnwell County, South Carolina (SC), and Salmon, Mississippi (MS), to cite just a few.
Former and current DOE defense nuclear sites benefit environmental and wildlife researchers through access to unique and untouched natural habitats such as at SRS, SC; Hanford, WA; Rocky Flats, CO; Oak Ridge, TN; and Grand Junction, CO.
DOE continues to work with local communities, state and tribal governments, and economic development organizations to identify new transfer opportunities and find the best reuse of unneeded DOE properties.
5 DOE does not endorse the CROs or ECA and reference to these organizations should not imply any endorsement on the part of DOE.
“Last year, we created our first manufacturing innovation institute in Youngstown, Ohio. A once‐shuttered warehouse is now a state‐of‐the art lab where new workers are mastering the 3D printing that has the potential to revolutionize the way we make almost everything. There's no reason this can't happen in other towns. So tonight, I'm announcing the launch of three more of these manufacturing hubs, where businesses will partner with the Departments of Defense and Energy to turn regions left behind by globalization into global centers of high‐tech jobs. And I ask this Congress to help create a network of fifteen of these hubs and guarantee that the next revolution in manufacturing is Made in America.”
President Barack Obama State of the Union Address
February 12, 2013
Section 2. Introduction and History of DOE Land Disposals
5
Authorities, Disposal Mechanisms, and the Land Transfer Process
Federal real property disposal has occurred historically under a number of authorities, including the Atomic Energy Act (AEA) of 1954, the Atomic Energy Community Act (AECA) of 1955, as amended (42 U.S.C. 2301 et seq.), or other special legislation that include provisions for land and property disposals. The special legislation provisions generally direct DOE to dispose of specific parcels of land and often specify the grantee and the terms of the transaction. Examples of such legislation are included in Section 5.A below.
In addition to the disposal authorities, there is a range of disposal mechanisms that provide DOE with alternatives for transferring assets. DOE can directly dispose real property where authorized, dispose for economic redevelopment purposes, transfer to GSA for disposal, or transfer to another federal agency for beneficial reuse. Furthermore DOE has discretionary authority to indemnify property at defense nuclear facilities under 50 U.S.C. 2811 (see regulations found in Title 10, Code of Federal Regulations, Part 770 [10 CFR Part 770]).
Brief descriptions of both authorities and disposal mechanisms are provided in Section 5 of this report. Full descriptions, including more‐detailed explanations of authorities, disposal mechanisms, and the process for conducting land transfers, can be found in DOE Order 430.1B, Real Property and Asset
Management and the Real Property Desk Guide (2013 Update). The DOE order and guide can be accessed on the following DOE websites and links:
DOE Order 430.1B, Real Property Asset Management: https://www.directives.doe.gov/directives/current‐directives/430.1‐BOrder‐bc2/view
DOE Real Estate Desk Guide (2013 Update) : http://energy.gov/management/downloads/real‐estate‐property‐guide‐2013‐0
Government and Taxpayer Cost Savings/Avoidance
Land and asset transfer for beneficial reuse makes significant fiscal sense in the current economic environment. Extending the useful life of many DOE unneeded facilities over several more generations increases the original return on investment. The sunk costs in the design and construction of many of these facilities can benefit local communities and businesses that can take advantage of existing and re‐purposed structures at generally lower costs than designing and constructing brand new facilities. DOE can eliminate the costs associated with facilities that are no longer needed to support its missions through transfer and beneficial reuse. Unneeded property disposition results in costs savings to DOE by reducing the costs associated with long‐term storage, maintenance, and security to keep these facilities safe and secure.6 Finally, cost avoidance can be achieved by eliminating the need to conduct expensive demolition and site restoration following cleanup for buildings and sites that can be reused. As just one example, at the Oak Ridge East Tennessee Technology Park (ETTP), the transfer of various buildings to CROET for beneficial reuse has allowed DOE to avoid $12.6 million in demolition costs (cumulative savings) because the facilities no longer needed to be demolished following cleanup. Transfers of ETTP land, facilities, and infrastructure have resulted in approximately $110 million in cumulative cost savings to date, including recurring savings (e.g., savings associated with utilities, fire protection and emergency
6 Memorandum for Distribution, DOE Office of Worker and Community Transition, January 22, 2003.
Section 2. Introduction and History of DOE Land Disposals
6
response services, and surveillance and maintenance costs). Ongoing/recurring savings currently amount to approximately $6 million annually.7
Another example of government and taxpayer savings includes the cleanup and reuse of the Rocky Flats Site. The clear end state for reuse as a public wildlife preserve that was developed collaboratively between the communities, state regulators, legislators, and DOE resulted in an accelerated cleanup and closure process that created life cycle savings and schedule acceleration to the Rocky Flats cleanup project of $20.5 billion and 49 years.8
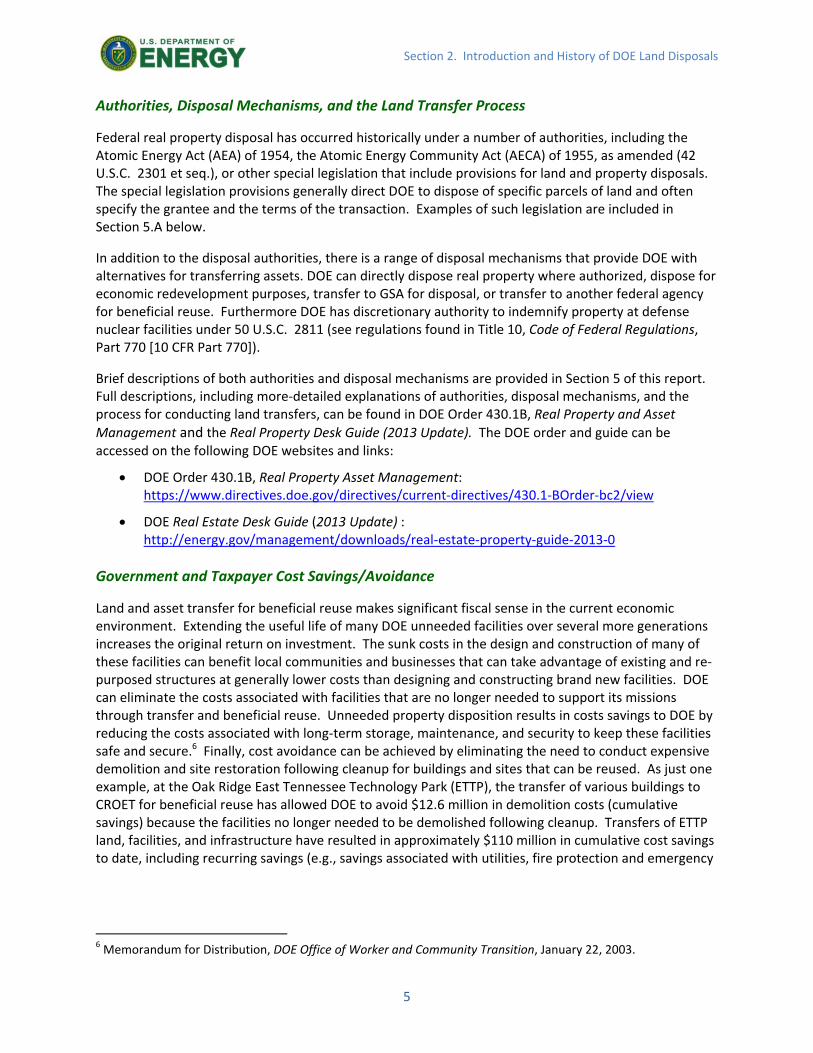
A commercial Gulfstream G‐550 Jet lands at the Los Alamos Airport, a former DOE owned airport built in 1947 by AEC and transferred to Los Alamos County in 2008. The Airport is now publicly owned and operated and provides private and
commercial air services.
7 U.S. DOE News Release (R‐05‐022), June 16, 2005, and information provided by the DOE Oak Ridge Operations Office, October 2013. 8 Savings were calculated based on the original Rocky Flats cleanup estimates found in the 1996 Baseline Environmental Management Report (BEMR) and the actual completion and closure costs and schedule as reported in the 2008 National Defense Authorization Act (NDAA) Report to Congress titled: Status of Environmental Management Initiatives to Accelerate the Reduction of Environmental Risks and Challenges Posed by the Legacy of the Cold War (Status Report), 2009. While cleanup was completed in 2005, regulatory closure did not occur until 2006 which accounts for the 1 year difference in schedule savings between the NDAA report and what is reported here.

Section 3. Community Benefits/Beneficial Reuse
7
Section 3. Community Benefits/Beneficial Reuse
Local communities around DOE sites, including local and state governments, Tribal Nations, businesses, non‐profit organizations or other regional economic development councils, have benefitted from receipt of 246,880 acres (roughly 1.25 times larger than the land area of New York City) for beneficial reuse over 57 years. The wide range of reuse includes development of vacant land into industrial parks and manufacturing hubs, public parks, and mixed‐use commercial and residential areas, as well as use for energy production, wildlife preservation, and agricultural purposes. Additionally, facilities can and have been renovated and converted into state‐of‐the‐art business offices or other commercial, light industrial, or manufacturing centers, as has occurred at sites such as Oak Ridge, Hanford, and LANL. DOE works with local communities, business development groups, economic development organizations, local and state governments, and/or Tribal Nations to identify other potential reuse opportunities for land, facilities, or assets based on site‐specific situations. Details of the long history of DOE land transfers are included in Attachment A, and the naval petroleum reserves (including the Naval Petroleum Reserves [NPR] and Naval Oil Shale Reserves [NOSR]) transfers are included in Attachment B. Below are some examples of the wide range of reuse opportunities and the communities that have taken advantage of these land and asset disposals. In each of these cases, unneeded, or underutilized federal property has been given a new lease on life and turned into thriving industrial, commercial, manufacturing, or mixed‐use commercial/residential centers. In a very limited number of cases (four of 209 transfers), successful land transfers have occurred, yet the land has not yet been redeveloped or reused. In each case, the land has been rezoned for future reuse, and those transfers are listed in Attachment A under a reuse category of vacant/rezoned.
Commercial/Business
LANL Tracts A‐7 and A‐5 were transferred to Los Alamos County, NM, for commercial redevelopment, and the area currently has an operating hotel (Holiday Inn Express) and other commercial businesses (2005).
DOE’s Oak Ridge Site has transferred six government office buildings to CROET for reuse as commercial office buildings. This transfer of approximately 200,000 square feet of office space created additional opportunities for private sector companies to utilize available office space on the reindustrialized ETTP site. CROET is one of the CROs (a nonprofit corporation) established to foster diversification of the regional economy by reutilizing DOE property for private sector investment and job creation. The transfer of the six buildings allowed DOE to avoid $6.9 million in planned demolition costs (2005).
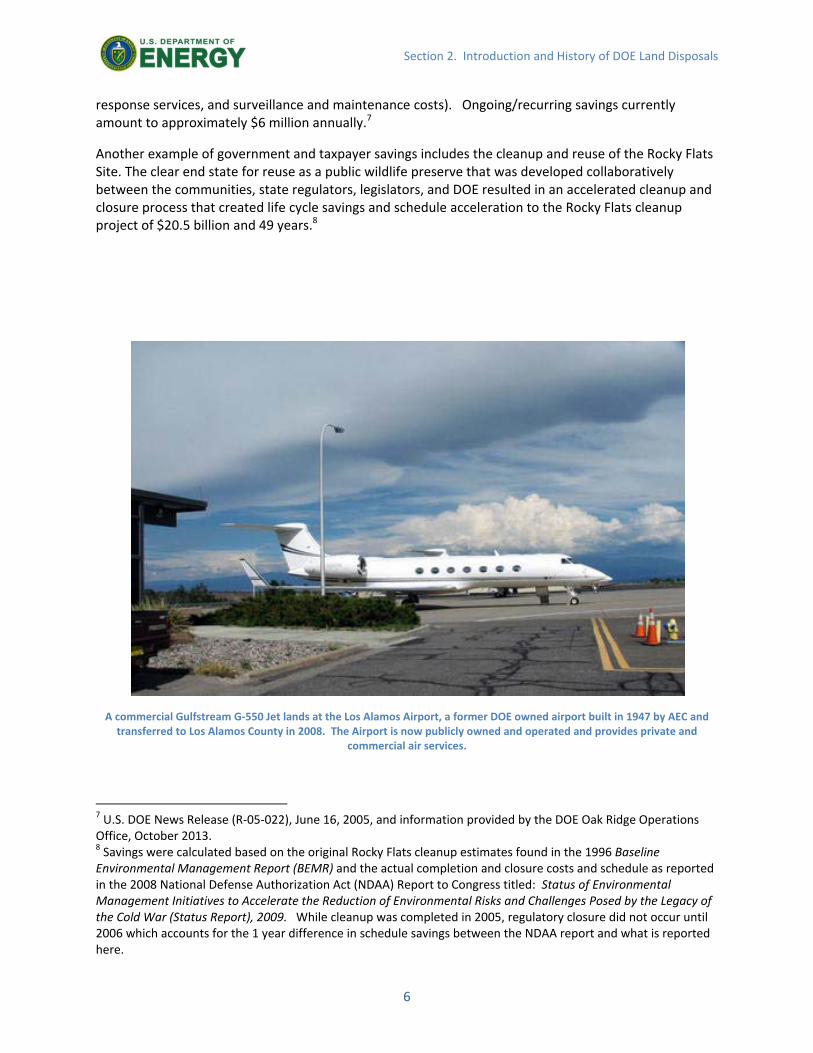
In 2005, DOE/NNSA transferred 7 acres in two parcels to the City of Oak Ridge Industrial Development Board. On these two parcels, the Board built two new state of the art facilities with private‐sector financing (New Hope Center and Jack Case Center). The facilities can house approximately 1,400 Y‐12 employees who were previously housed in more than 50 separate buildings on the Y‐12 Site. This allowed Y‐12 to tear down a large number of obsolete, inefficient 1940’s era facilities and significantly reduce the Y‐12 footprint. Energy conservation measures were designed into both facilities. The New Hope Center is a Leadership in Energy
Section 3. Community Benefits/Beneficial Reuse
8
and Environmental Design (LEED) certified facility and the Jack Case Center is a Federal Guiding Principle Building (2005).
Historic Preservation
DOE transferred LANL Tract A‐1, which holds a historical monument that commemorates significant Manhattan Project accomplishments, to Los Alamos County, NM (2002).
DOE transferred LANL Tracts B‐1, B‐2 and B‐3 to the Bureau of Indian Affairs in trust for the Pueblo de San Ildefonso. These transfers returned more than 2,000 acres of ancestral lands for cultural preservation (2002 and 2013).
A portion of the National Institute for Petroleum and Energy Research (NIPER) site in Bartlesville, OK, was transferred to the Bartlesville Economic Development Corporation and used by the Delaware Indian Tribe to set up their national headquarters offices (2001).
84,000 acres of ancestral lands on the undeveloped NOSR #2 Site in Utah were transferred back to the Northern Ute Indian Tribe in the largest transfer of federal property to Native Americans in the last century (2000).
Naval Petroleum Reserves
In 1996, Congress determined that the NPR and NOSR properties no longer served the national defense purpose envisioned in the early 1900s and authorized steps towards potential divestment or privatization of them. As a result, in 1996, the government's share of the Elk Hills field in California was offered for commercial sale. On February 5, 1998, DOE completed its sale to Occidental Petroleum Corporation for $3.65 billion in the largest privatization of federal property in the history of the United States. At its peak in July 1981, NPR‐1 produced 181,000 barrels of oil per day and would have ranked as one of the top ten largest oil fields in the lower 48 States in the production of oil and gas. In September 1992, the field produced its one billionth barrel of oil, becoming only the thirteenth field in the Nation's history to reach that milestone. Elk Hills is still operated as an oil field today by Occidental Petroleum (1998).
The New Hope Center is a privately financed office building built on former Y‐12 Land that was transferred to the City of Oak Ridge in 2005.

Section 3. Community Benefits/Beneficial Reuse
9
Energy
Throughout the years, DOE’s Power Marketing Administrations have transferred electrical grid substations, pole yards, communication sites, and other unneeded land to not‐for‐profit power companies, regional electric cooperatives, or local governments for continued use (various from 1980s to present).
The Secretary of Energy was authorized by Congress to sell two Alaska Power Marketing Administration hydroelectric power stations (Eklutna and Snettisham). These plants and surrounding lands were sold to local electric utilities and cooperatives. The 78,000 kW Snettisham Station serves Juneau and was sold to the Alaska Energy Authority. The 30,000 kW Eklutna Station serves the Anchorage and Matanuska Valley Areas and was sold to three local electric utility companies. Both plants continue to operate today, providing power to the local region (1997 and 1998).
The Eklutna Hydroelectric Power Plant in Alaska, formerly part of the Alaska Power Authority, was sold in 1998.
The Snettisham Hydroelectric Power Plant was sold in 1997.

Section 3. Community Benefits/Beneficial Reuse
10
Education
As part of the Camp Hanford transfer to the Port of Benton in 1996, part of the Richland Innovation Center land was subleased to Washington State University for construction and operation of the Engineering Laboratory for its Tri‐Cities campus (1995).
DOE transferred three acres of land to the State of Tennessee for construction of the Joint Institute for Biological Sciences (JIBS) and the Joint Institute for Neutron Sciences (JINS). Both JIBS and JINS were founded as collaborative efforts between Oak Ridge National Laboratory (ORNL), the State of Tennessee, and the University of Tennessee. JIBS performs world‐class research in systems biology and biotechnology, taking advantage of ORNL's user facilities and other tools. JINS promotes the use of neutron scattering in various fields of research, serving as a gateway for users of the Spallation Neutron Source and the recently upgraded High Flux Isotope Reactor at ORNL. Development of both institutes was fully funded by the State of Tennessee and the University of Tennessee (2006).
Agriculture/Grazing
At INL, DOE relinquished approximately 2,550 acres of withdrawn public domain land to the Bureau of Land Management (BLM), which transferred it to qualifying farmers under the Teton Flood Farmlands legislation (P.L. 94‐400 [90 Stat. 1211]). This legislation authorized the Secretary of the Interior to provide compensation for damage resulting from the Teton Dam flood of June 5, 1976 (1978).
Approximately 180 acres of land in Monticello, UT, was transferred to a private citizen who is using the land for hay production and cattle grazing (2011).
Wildlife Preservation/Timber
DOE transferred two parcels of the former Paducah Site buffer area to the Kentucky Department of Fish and Wildlife Resources to be used for wildlife preservation (1959 and 1962).
A portion of the former Rocky Flats Site in CO has been transferred to DOI for management by the U.S. Fish and Wildlife Service as part of the Rocky Flats National Wildlife Refuge. This transfer allowed for protection of the site’s important wildlife resources, including critical habitat for the federally threatened Preble’s meadow jumping mouse and hundreds of acres of rare xeric tall grass prairie. Elk have now returned to the site where cleanup was completed in 2005 after more than 50 years of nuclear weapons production (2007).
A portion of the former Paducah site buffer area is now used as a wildlife preserve in KY.

Section 3. Community Benefits/Beneficial Reuse
11
A portion of the Salmon Site, a former nuclear weapons test site, was transferred to the State of Mississippi and is being used by the Forestry Commission for timber production and as a wildlife refuge (2010).
Parks/Recreation
DOE transferred parcels of the former Monticello Uranium Mill Tailings Site to the City of Monticello, UT, under the Federal Lands‐to‐Parks Program. The city used the property for expansion of recreational facilities for the general public. Potential future plans include further development of the transferred land for picnic areas, walking trails, open space, and wetland restoration (2000).
Before and After: Monticello, UT, Mill tailings site – now used as park and recreation space.
Civic/Public Service
In the 1960s, AEC transferred the government airport at the Hanford Site and another 40 acres adjacent to the airport to the Port of Benton, WA. Today, the airport supports a large general aviation industry and is the base for approximately 173 aircraft, along with additional industries in a number of manufacturing and warehouse facilities (1962).
Elk have returned to the former Rocky Flats Site in CO.
Section 3. Community Benefits/Beneficial Reuse
12
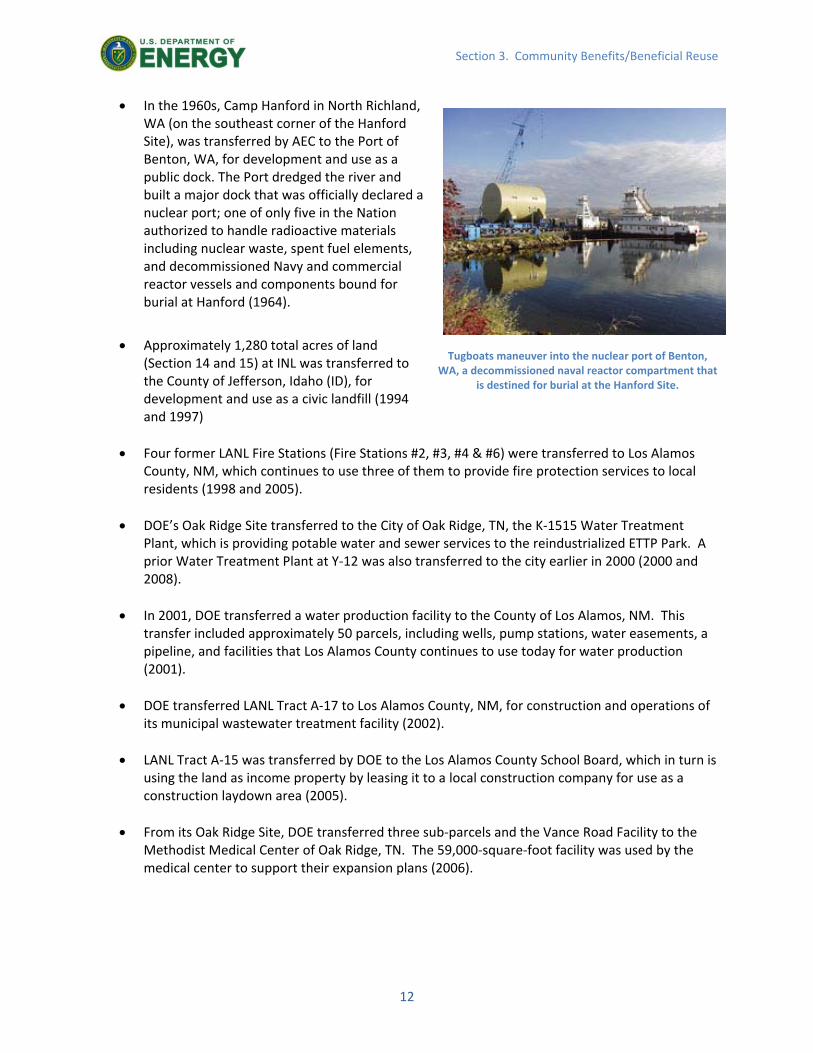
In the 1960s, Camp Hanford in North Richland, WA (on the southeast corner of the Hanford Site), was transferred by AEC to the Port of Benton, WA, for development and use as a public dock. The Port dredged the river and built a major dock that was officially declared a nuclear port; one of only five in the Nation authorized to handle radioactive materials including nuclear waste, spent fuel elements, and decommissioned Navy and commercial reactor vessels and components bound for burial at Hanford (1964).
Approximately 1,280 total acres of land (Section 14 and 15) at INL was transferred to the County of Jefferson, Idaho (ID), for development and use as a civic landfill (1994 and 1997)
Four former LANL Fire Stations (Fire Stations #2, #3, #4 & #6) were transferred to Los Alamos County, NM, which continues to use three of them to provide fire protection services to local residents (1998 and 2005).
DOE’s Oak Ridge Site transferred to the City of Oak Ridge, TN, the K‐1515 Water Treatment Plant, which is providing potable water and sewer services to the reindustrialized ETTP Park. A prior Water Treatment Plant at Y‐12 was also transferred to the city earlier in 2000 (2000 and 2008).
In 2001, DOE transferred a water production facility to the County of Los Alamos, NM. This transfer included approximately 50 parcels, including wells, pump stations, water easements, a pipeline, and facilities that Los Alamos County continues to use today for water production (2001).
DOE transferred LANL Tract A‐17 to Los Alamos County, NM, for construction and operations of its municipal wastewater treatment facility (2002).
LANL Tract A‐15 was transferred by DOE to the Los Alamos County School Board, which in turn is using the land as income property by leasing it to a local construction company for use as a construction laydown area (2005).
From its Oak Ridge Site, DOE transferred three sub‐parcels and the Vance Road Facility to the Methodist Medical Center of Oak Ridge, TN. The 59,000‐square‐foot facility was used by the medical center to support their expansion plans (2006).
Tugboats maneuver into the nuclear port of Benton, WA, a decommissioned naval reactor compartment that
is destined for burial at the Hanford Site.
Section 3. Community Benefits/Beneficial Reuse
13
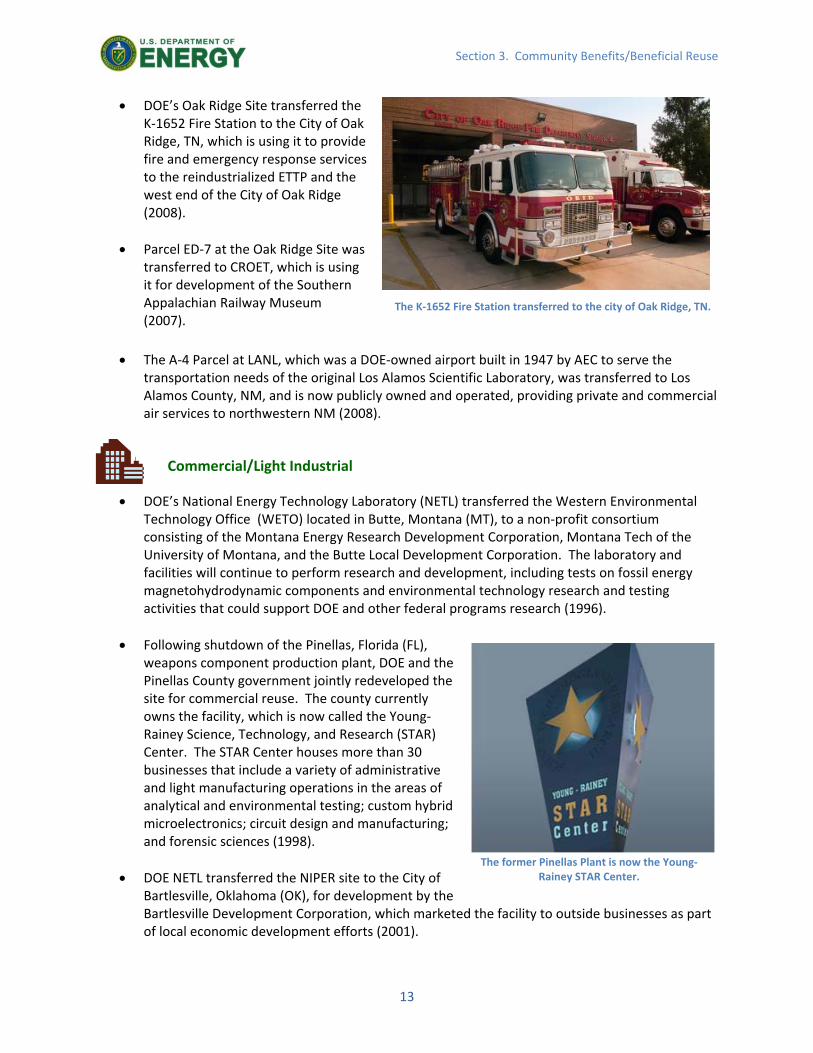
The K‐1652 Fire Station transferred to the city of Oak Ridge, TN.
DOE’s Oak Ridge Site transferred the K‐1652 Fire Station to the City of Oak Ridge, TN, which is using it to provide fire and emergency response services to the reindustrialized ETTP and the west end of the City of Oak Ridge (2008).
Parcel ED‐7 at the Oak Ridge Site was transferred to CROET, which is using it for development of the Southern Appalachian Railway Museum (2007).
The A‐4 Parcel at LANL, which was a DOE‐owned airport built in 1947 by AEC to serve the transportation needs of the original Los Alamos Scientific Laboratory, was transferred to Los Alamos County, NM, and is now publicly owned and operated, providing private and commercial air services to northwestern NM (2008).
Commercial/Light Industrial
DOE’s National Energy Technology Laboratory (NETL) transferred the Western Environmental Technology Office (WETO) located in Butte, Montana (MT), to a non‐profit consortium consisting of the Montana Energy Research Development Corporation, Montana Tech of the University of Montana, and the Butte Local Development Corporation. The laboratory and facilities will continue to perform research and development, including tests on fossil energy magnetohydrodynamic components and environmental technology research and testing activities that could support DOE and other federal programs research (1996).
Following shutdown of the Pinellas, Florida (FL), weapons component production plant, DOE and the Pinellas County government jointly redeveloped the site for commercial reuse. The county currently owns the facility, which is now called the Young‐Rainey Science, Technology, and Research (STAR) Center. The STAR Center houses more than 30 businesses that include a variety of administrative and light manufacturing operations in the areas of analytical and environmental testing; custom hybrid microelectronics; circuit design and manufacturing; and forensic sciences (1998).
DOE NETL transferred the NIPER site to the City of Bartlesville, Oklahoma (OK), for development by the Bartlesville Development Corporation, which marketed the facility to outside businesses as part of local economic development efforts (2001).
The former Pinellas Plant is now the Young‐Rainey STAR Center.
Section 3. Community Benefits/Beneficial Reuse
14
Mixed Use (Commercial/Residential)
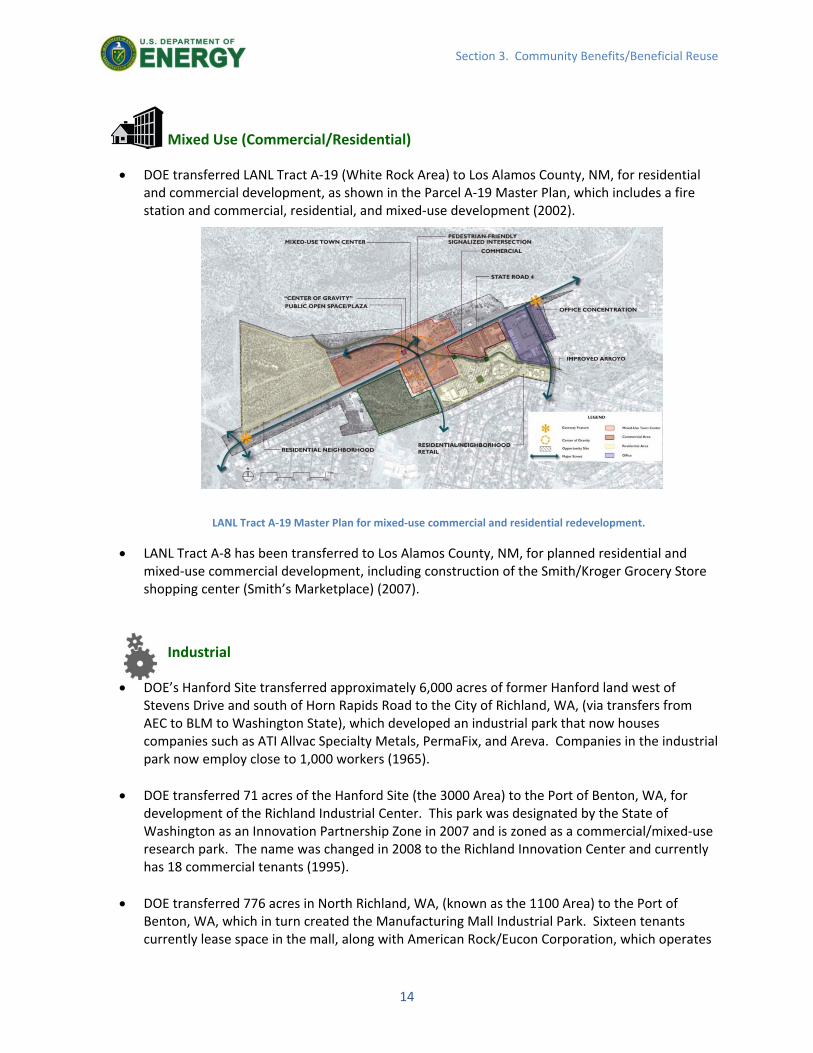
DOE transferred LANL Tract A‐19 (White Rock Area) to Los Alamos County, NM, for residential and commercial development, as shown in the Parcel A‐19 Master Plan, which includes a fire station and commercial, residential, and mixed‐use development (2002).
LANL Tract A‐19 Master Plan for mixed‐use commercial and residential redevelopment.
LANL Tract A‐8 has been transferred to Los Alamos County, NM, for planned residential and mixed‐use commercial development, including construction of the Smith/Kroger Grocery Store shopping center (Smith’s Marketplace) (2007).
Industrial
DOE’s Hanford Site transferred approximately 6,000 acres of former Hanford land west of Stevens Drive and south of Horn Rapids Road to the City of Richland, WA, (via transfers from AEC to BLM to Washington State), which developed an industrial park that now houses companies such as ATI Allvac Specialty Metals, PermaFix, and Areva. Companies in the industrial park now employ close to 1,000 workers (1965).
DOE transferred 71 acres of the Hanford Site (the 3000 Area) to the Port of Benton, WA, for development of the Richland Industrial Center. This park was designated by the State of Washington as an Innovation Partnership Zone in 2007 and is zoned as a commercial/mixed‐use research park. The name was changed in 2008 to the Richland Innovation Center and currently has 18 commercial tenants (1995).
DOE transferred 776 acres in North Richland, WA, (known as the 1100 Area) to the Port of Benton, WA, which in turn created the Manufacturing Mall Industrial Park. Sixteen tenants currently lease space in the mall, along with American Rock/Eucon Corporation, which operates

Section 3. Community Benefits/Beneficial Reuse
15
a rock quarry in a portion of the site. Overall Port of Benton operations support about 3,590 direct, secondary, and induced jobs within the Tri‐Cities regional economy (1998).
SRS transferred a total of 2,487 acres of DOE property to Barnwell County, SC, in 1970 to stimulate economic development in counties adjacent to SRS. Today, 1,607 acres of this land is owned by the Southern Carolina Alliance and is home to the South Carolina Advanced Technology Park. Several industries currently have operations at the park, including Krontex USA, Inc.; Unitech Services; Horsehead Corporation; and the Government Training Institute. These industries provide employment opportunities to the surrounding community. The technology park provides a full suite of infrastructure and services, including CSX rail, electric, natural gas, water, sewer, and fiber‐optic services. The park is conducive to future development and already has approved environmental and site preparation plans (1970).
As parcels of the former Mound Site in OH were cleaned up, they were transferred, starting in 1999, to the Miamisburg Mound Community Improvement Corporation, now the MDC, for reuse as a technology and industrial park. Currently transfers occur via a lease agreement with automatic title transfer of parcels in the future. A majority of the parcels have now been permanently transferred to MDC for development as the Mound Advanced Technology Center, a scientific, technology, and business park (1999).
DOE has completed Phase I of the Oak Ridge Science and Technology Park and two buildings totaling 155,000 square feet are now occupied by more than 15 companies. Future development phases will enable the Science and Technology Park to grow to nearly 30 acres of parcel configurations and up to 350,000 square feet of offices and laboratories to help meet DOE’s goals of successful technology transfer and commercialization (2006).
The ETTP Heritage Center (shown below) is located at the site of the former Oak Ridge Gaseous Diffusion Plant, which is currently undergoing cleanup. DOE’s goal is to maximize reuse of the site as cleanup progresses. The reuse of key facilities through transfer is part of the site’s closure plan. DOE has transferred ownership of several industrial facilities and land parcels, representing approximately 90,000 square feet of floor space and 195 acres of
The former Mound Site now houses the Mound Advanced Technology Center.
Future plans for the Oak Ridge Science and Technology Park.
Future plans for the Oak Ridge Science and Technology Park.
Section 3. Community Benefits/Beneficial Reuse
16
land, as well as 11 miles of railroad, to CROET for renovation and reuse. Commercial clients using these and other transferred facilities at Oak Ridge range from small local startups to Fortune 500 corporations, including Infrared Heating Technologies, LLC; Energy Solutions, LLC; Pall Corporation; Heritage Railroad Corporation; Safety & Ecology Corporation; and Worldwide Energy, Inc., to name just a few. Additionally, two speculative industrial facilities, representing a total of approximately 65,000 square feet of floor space, have been constructed at the Heritage Center through a partnership with CROET and the City of Oak Ridge Industrial Development Board in 2008 (2005 & 2008).
The ETTP Horizon Center is an approximately 500‐acre green‐field site that is located immediately east of the ETTP Heritage Center. The site is designed to provide new building sites, infrastructure, and amenities desired by high‐tech companies while still preserving the area's scenic beauty. A carbon fiber pilot scale manufacturing facility was constructed at the Horizon Center and began operations in 2012 (2012).
Private Sale
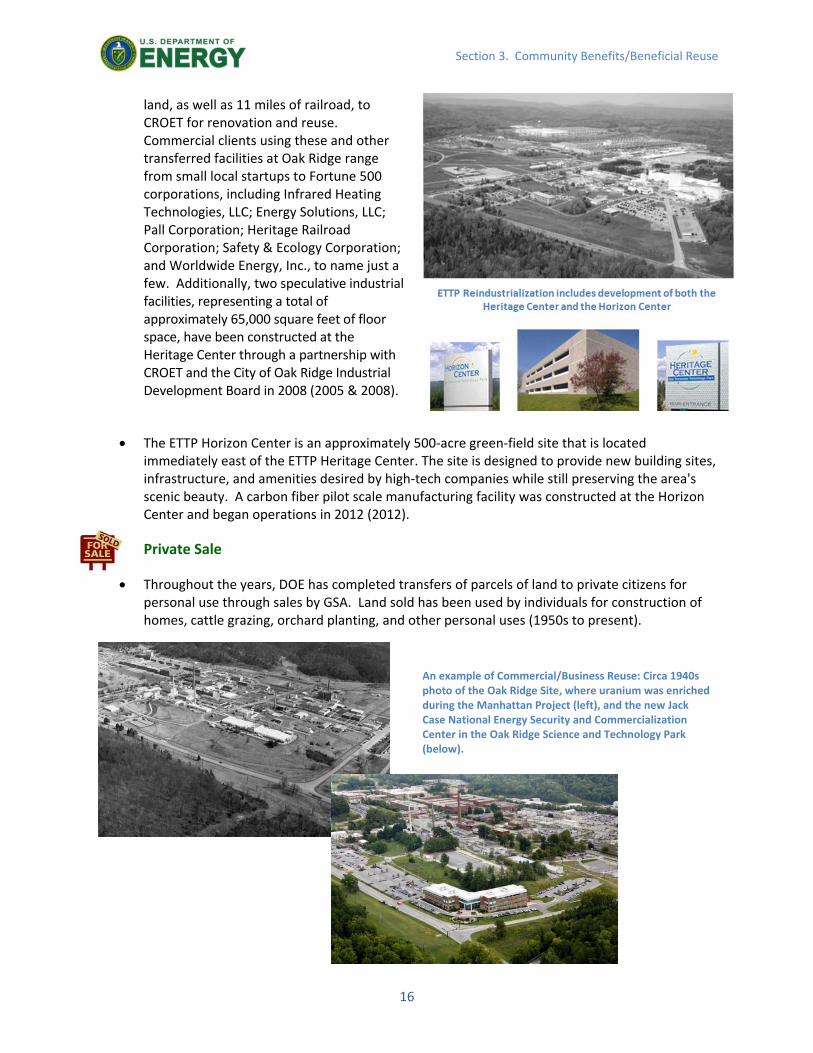
Throughout the years, DOE has completed transfers of parcels of land to private citizens for personal use through sales by GSA. Land sold has been used by individuals for construction of homes, cattle grazing, orchard planting, and other personal uses (1950s to present).
An example of Commercial/Business Reuse: Circa 1940s photo of the Oak Ridge Site, where uranium was enriched during the Manhattan Project (left), and the new Jack Case National Energy Security and Commercialization Center in the Oak Ridge Science and Technology Park (below).

Section 4. Overview of Completed Transfers
17
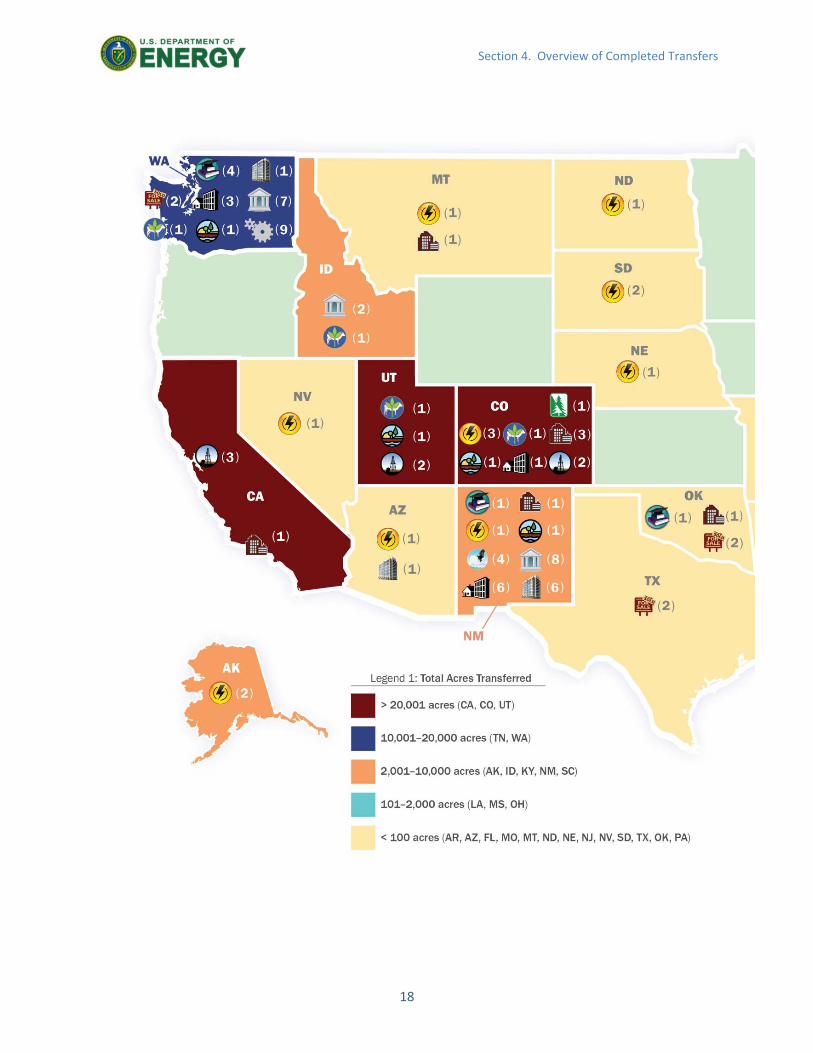
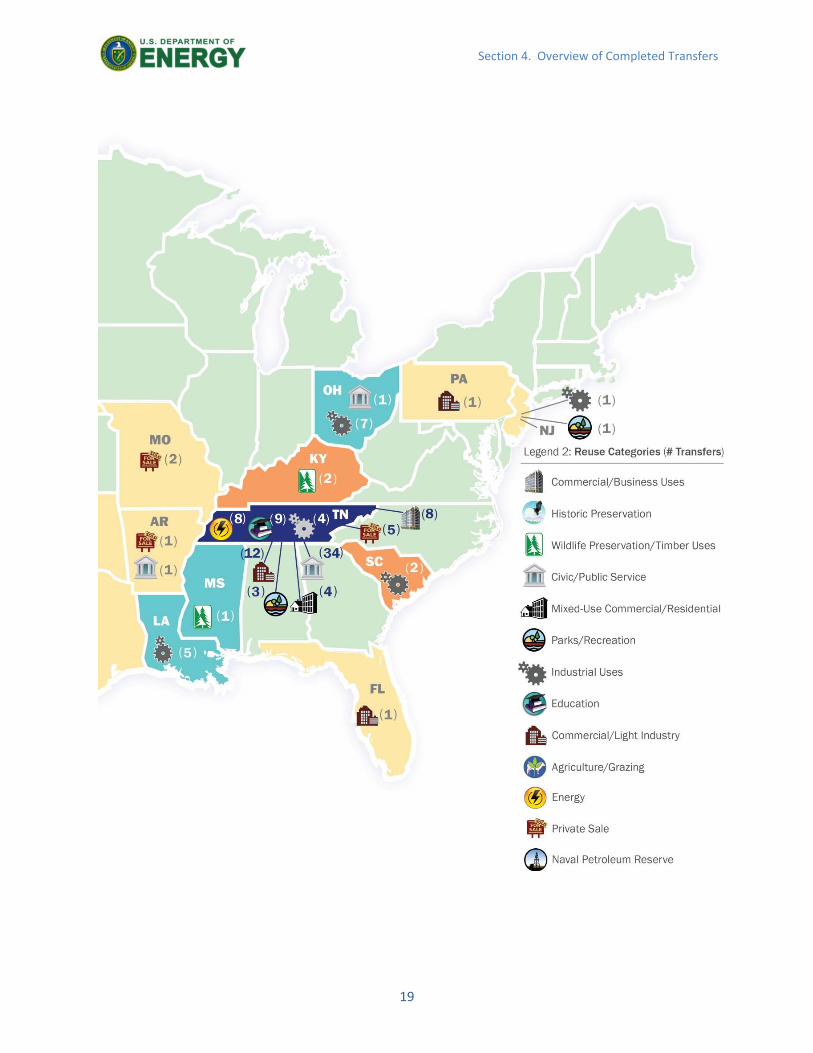
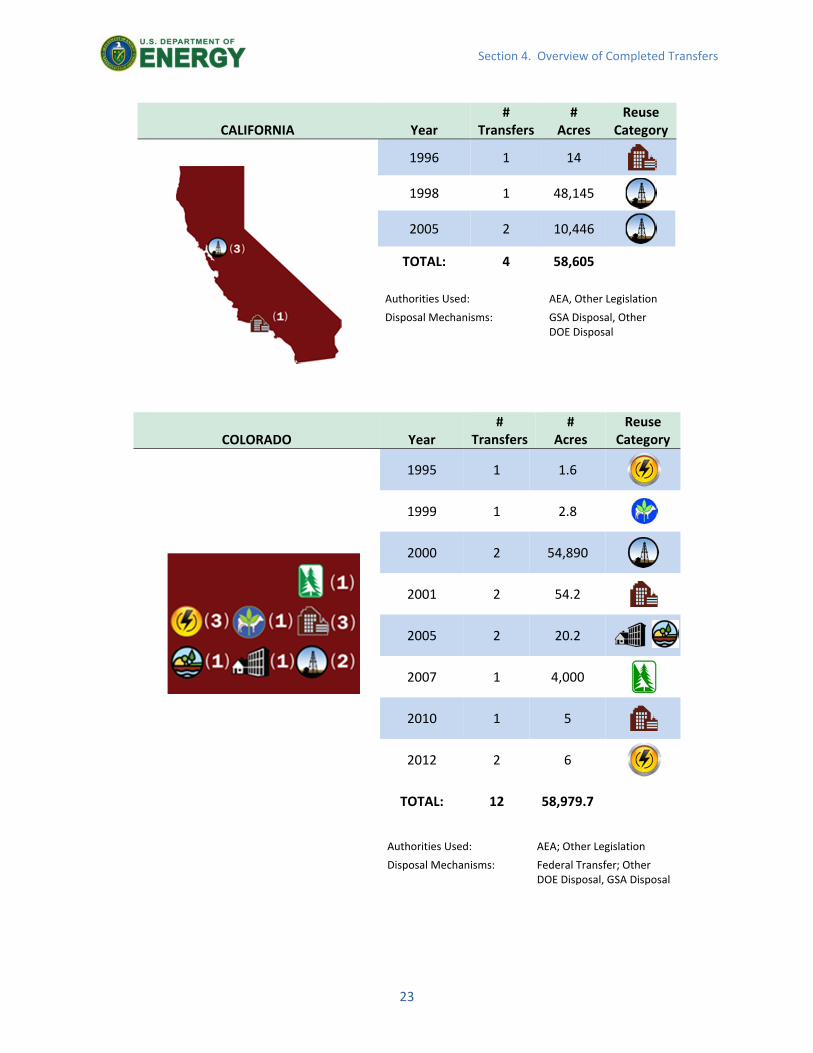
Section 4. Overview of Completed Transfers
The maps on the following pages show the distribution of DOE historical land transfers (by acreage and reuse category) and naval petroleum reserve (NPR and NOSR) transfers across the country over 57 years. States are color‐shaded to show the amounts of acreage transferred (see Legend 1 for specific quantities). Legend 2 shows each reuse category and demonstrates the wide range of opportunities and potential for reuse. The numbers in parentheses indicate the number of total transfers in each reuse category. In total, DOE has successfully partnered with local, state, federal, tribal, and/or economic development organizations and officials in 26 states to make more than 209 transfers of more than 246,902 acres of land and property for other economic, commercial, civic, or cultural uses. These lists include data back to 1956, but transfers prior to 1956 are not included because many historical land records for early land transfers in the late 1940s and early 1950s are no longer available for referencing today. DOE also has tentative plans or has identified the potential for additional transfers over the next 12 to 15 years.9 Following the map, summary data is presented by state for land transfers using the same map legends.
9 Sources of data for potential future transfers include the FIMS database, supplemented by reviews and projections made by DOE Site Real Property Offices and Headquarters’ program office projections of unneeded declarations of land and assets that are no longer needed to support ongoing or future DOE missions.
The Definition of Transfer*
Throughout this report, the term “transfer” is used to describe the entire range of land disposal actions, including the following:
Sale at fair market value
Sale at less than fair market value
Donations and no‐cost transfers
Disposal through GSA
Relinquishment of previously withdrawn federal land
Transfers to other entities, including local, state, federal government, Tribal Nations, economic development organizations and CROs, or other entities
Other federal transfer actions like the Federal Lands‐to‐Parks Program
*as described in the “Key Areas of Responsibility for Realty Specialists” in the DOE Real Property Desk Guide (2013 Update).
Before and After: 250 Acres of former Hanford Site land (above) were transferred in 1962 and now house the Port of
Benton Technology and Business Campus (below).
Section 4. Overview of Completed Transfers
18
Section 4. Overview of Completed Transfers
19
Section 4. Overview of Completed Transfers
20
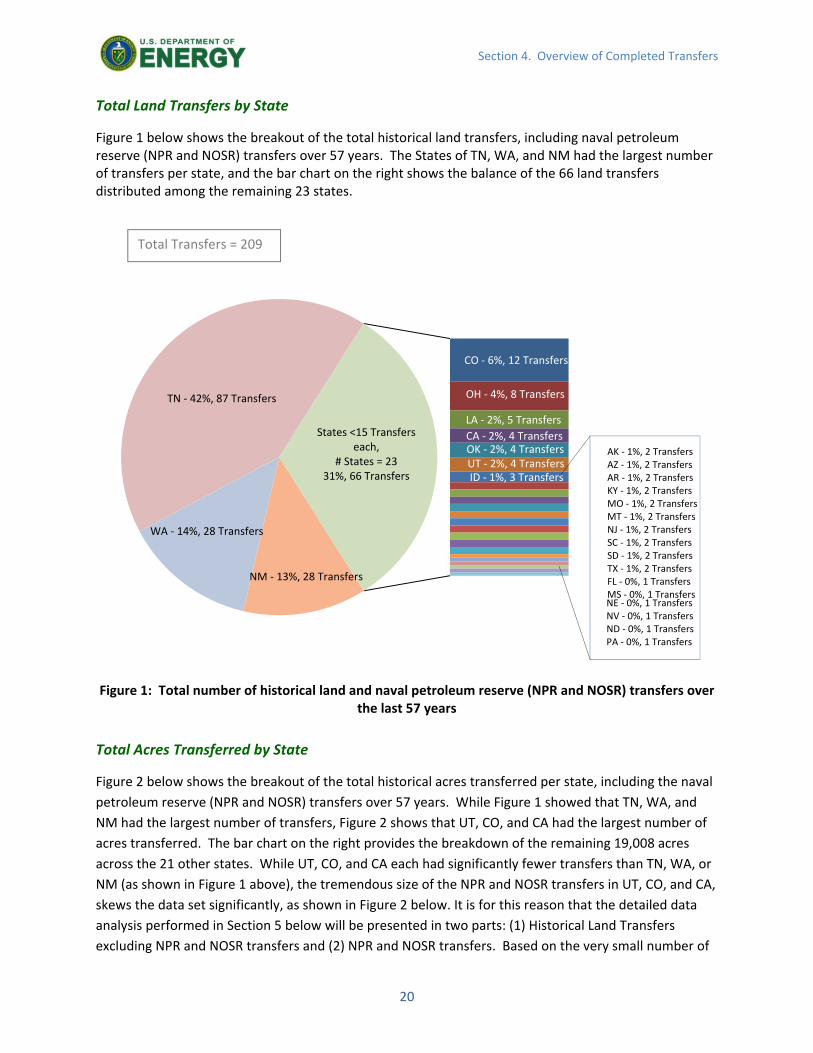
Total Land Transfers by State
Figure 1 below shows the breakout of the total historical land transfers, including naval petroleum reserve (NPR and NOSR) transfers over 57 years. The States of TN, WA, and NM had the largest number of transfers per state, and the bar chart on the right shows the balance of the 66 land transfers distributed among the remaining 23 states.
Figure 1: Total number of historical land and naval petroleum reserve (NPR and NOSR) transfers over
the last 57 years
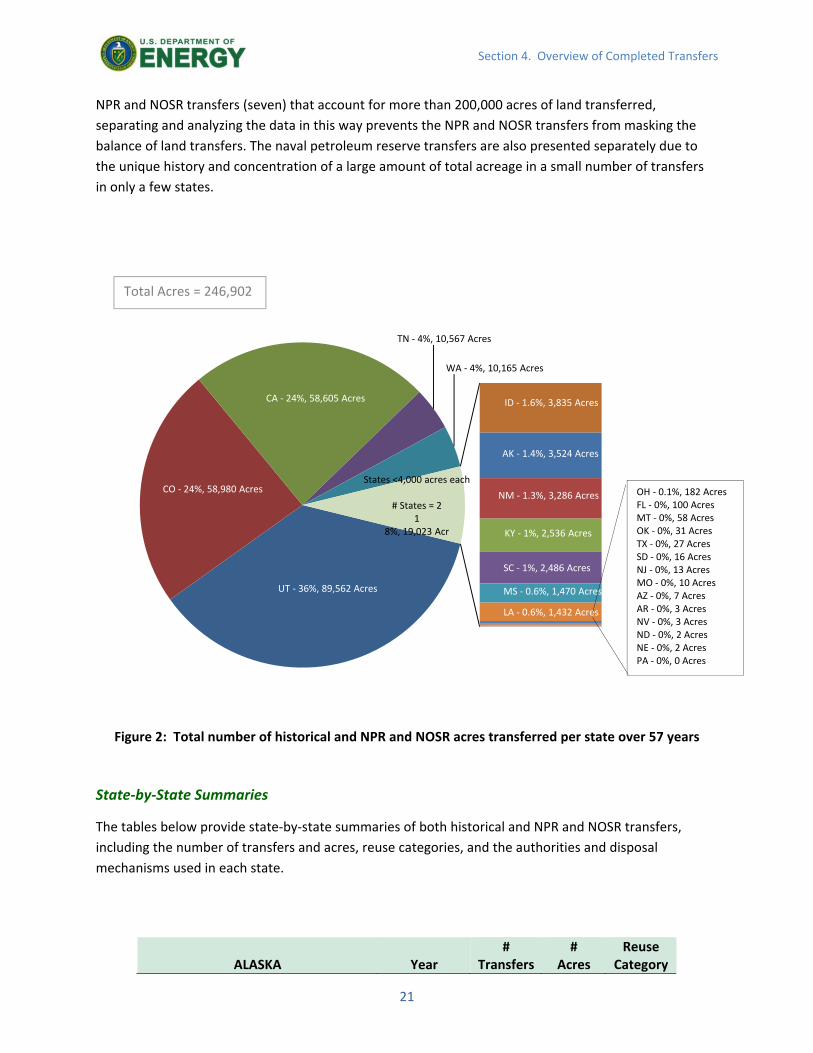
Total Acres Transferred by State
Figure 2 below shows the breakout of the total historical acres transferred per state, including the naval
petroleum reserve (NPR and NOSR) transfers over 57 years. While Figure 1 showed that TN, WA, and
NM had the largest number of transfers, Figure 2 shows that UT, CO, and CA had the largest number of
acres transferred. The bar chart on the right provides the breakdown of the remaining 19,008 acres
across the 21 other states. While UT, CO, and CA each had significantly fewer transfers than TN, WA, or
NM (as shown in Figure 1 above), the tremendous size of the NPR and NOSR transfers in UT, CO, and CA,
skews the data set significantly, as shown in Figure 2 below. It is for this reason that the detailed data
analysis performed in Section 5 below will be presented in two parts: (1) Historical Land Transfers
excluding NPR and NOSR transfers and (2) NPR and NOSR transfers. Based on the very small number of
CO ‐ 6%, 12 Transfers
OH ‐ 4%, 8 Transfers
LA ‐ 2%, 5 Transfers
CA ‐ 2%, 4 TransfersOK ‐ 2%, 4 TransfersUT ‐ 2%, 4 TransfersID ‐ 1%, 3 Transfers
NM ‐ 13%, 28 Transfers
WA ‐ 14%, 28 Transfers
TN ‐ 42%, 87 Transfers
States <15 Transfers each,
# States = 2331%, 66 Transfers
AK ‐ 1%, 2 TransfersAZ ‐ 1%, 2 TransfersAR ‐ 1%, 2 TransfersKY ‐ 1%, 2 TransfersMO ‐ 1%, 2 TransfersMT ‐ 1%, 2 TransfersNJ ‐ 1%, 2 TransfersSC ‐ 1%, 2 TransfersSD ‐ 1%, 2 TransfersTX ‐ 1%, 2 TransfersFL ‐ 0%, 1 TransfersMS ‐ 0%, 1 TransfersNE ‐ 0%, 1 TransfersNV ‐ 0%, 1 TransfersND ‐ 0%, 1 TransfersPA ‐ 0%, 1 Transfers
Total Transfers = 209
Section 4. Overview of Completed Transfers
21
NPR and NOSR transfers (seven) that account for more than 200,000 acres of land transferred,
separating and analyzing the data in this way prevents the NPR and NOSR transfers from masking the
balance of land transfers. The naval petroleum reserve transfers are also presented separately due to
the unique history and concentration of a large amount of total acreage in a small number of transfers
in only a few states.
Figure 2: Total number of historical and NPR and NOSR acres transferred per state over 57 years
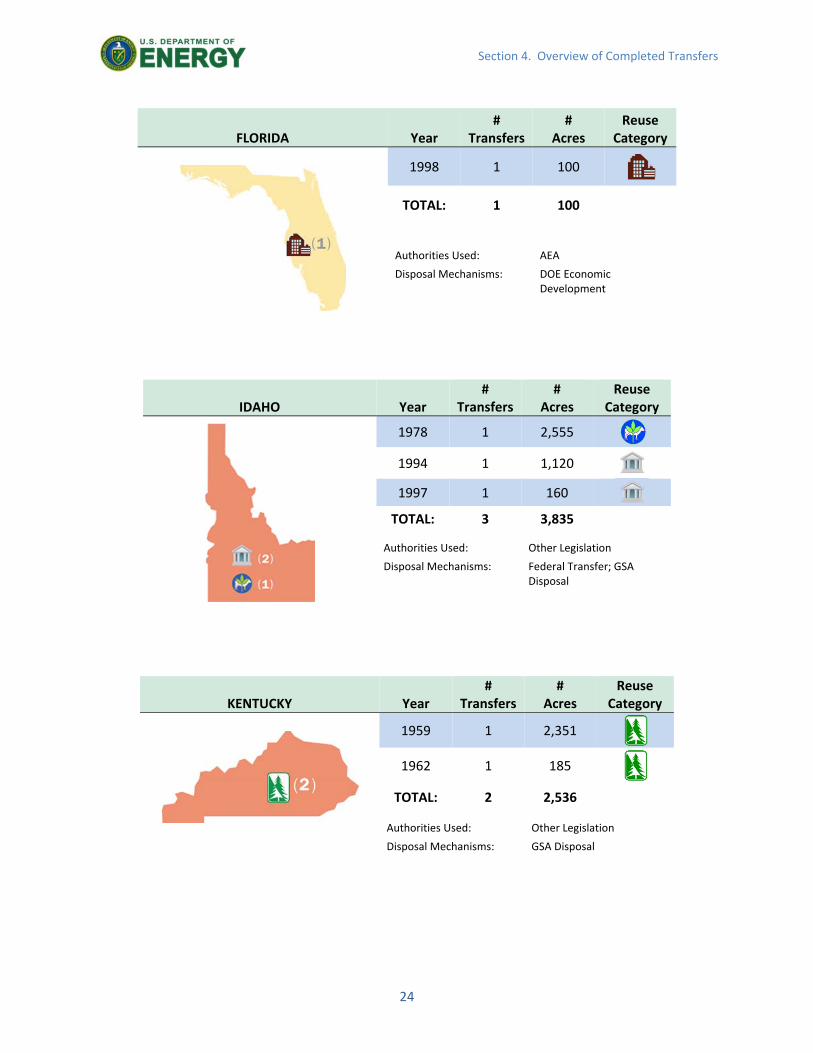
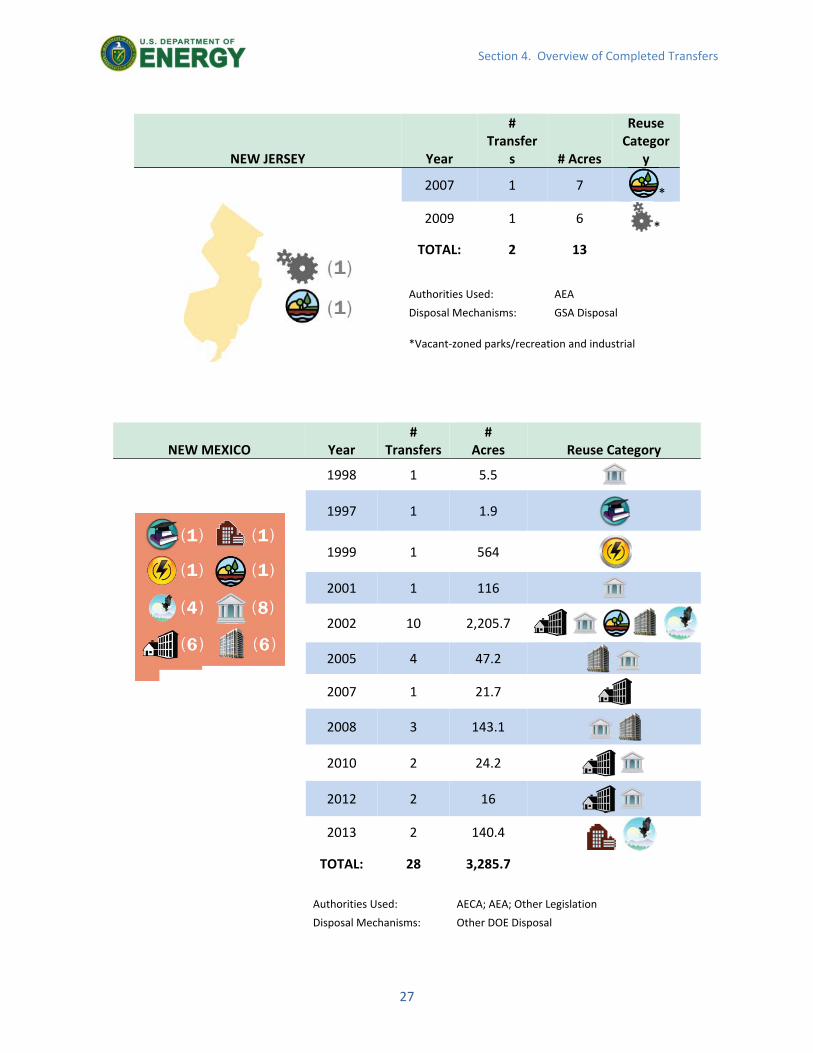
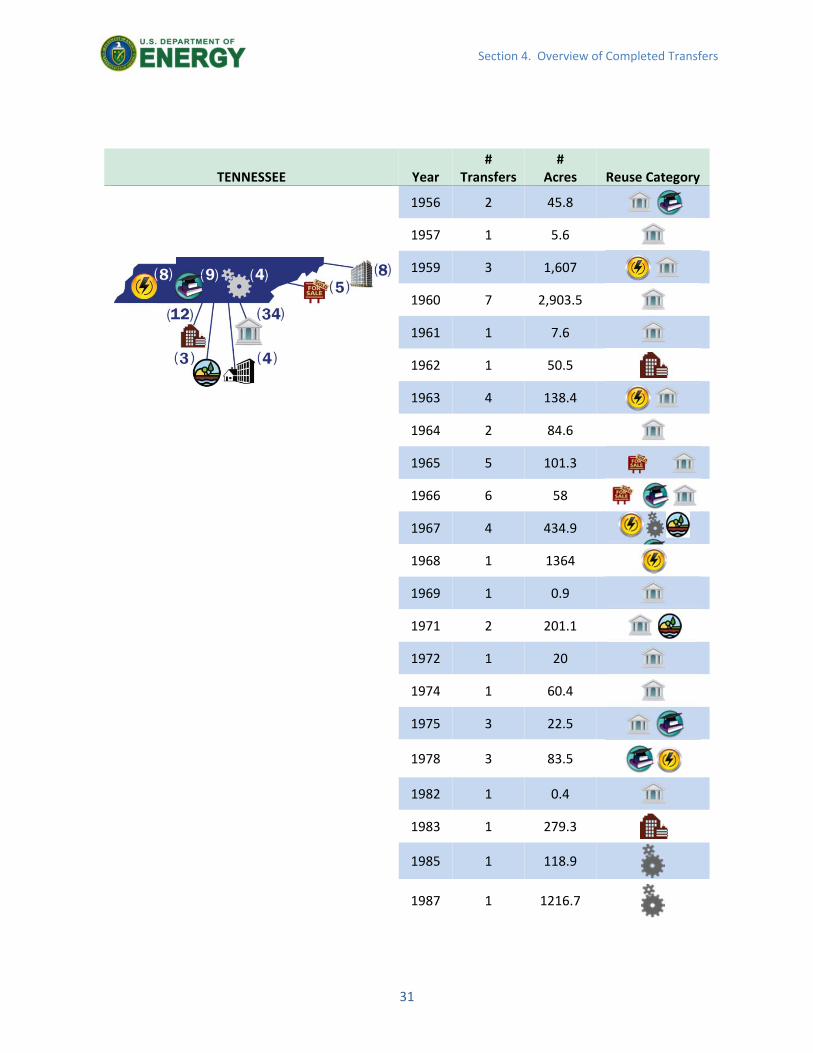
State‐by‐State Summaries
The tables below provide state‐by‐state summaries of both historical and NPR and NOSR transfers,
including the number of transfers and acres, reuse categories, and the authorities and disposal
mechanisms used in each state.
UT ‐ 36%, 89,562 Acres
CO ‐ 24%, 58,980 Acres
CA ‐ 24%, 58,605 Acres
TN ‐ 4%, 10,567 Acres
WA ‐ 4%, 10,165 Acres
ID ‐ 1.6%, 3,835 Acres
AK ‐ 1.4%, 3,524 Acres
NM ‐ 1.3%, 3,286 Acres
KY ‐ 1%, 2,536 Acres
SC ‐ 1%, 2,486 Acres
MS ‐ 0.6%, 1,470 Acres
LA ‐ 0.6%, 1,432 Acres
States <4,000 acres each
# States = 21
8%, 19,023 Acr
OH ‐ 0.1%, 182 AcresFL ‐ 0%, 100 AcresMT ‐ 0%, 58 AcresOK ‐ 0%, 31 AcresTX ‐ 0%, 27 AcresSD ‐ 0%, 16 AcresNJ ‐ 0%, 13 AcresMO ‐ 0%, 10 AcresAZ ‐ 0%, 7 AcresAR ‐ 0%, 3 AcresNV ‐ 0%, 3 AcresND ‐ 0%, 2 AcresNE ‐ 0%, 2 AcresPA ‐ 0%, 0 Acres
ALASKA Year #
Transfers #
Acres Reuse
Category
Total Acres = 246,902

Section 4. Overview of Completed Transfers
22
1997 1 853
1998 1 2,671
TOTAL: 2 3,524
Authorities Used: Other Legislation
Disposal Mechanisms: Other DOE Disposal
ARIZONA Year #
Transfers #
Acres Reuse
Category
1998 1 4
2005 1 3.1
TOTAL: 2 7.1
Authorities Used: Other Legislation
Disposal Mechanisms: Other DOE Disposal, GSA Disposal
ARKANSAS Year #
Transfers #
Acres Reuse
Category
2013 2 3.3
TOTAL: 2 3.3
Authorities Used: Other Legislation
Disposal Mechanisms: GSA Disposal, Other DOE Disposal
Section 4. Overview of Completed Transfers
23
CALIFORNIA Year #
Transfers #
Acres Reuse
Category
1996 1 14
1998 1 48,145
2005 2 10,446
TOTAL: 4 58,605
Authorities Used: AEA, Other Legislation
Disposal Mechanisms: GSA Disposal, Other DOE Disposal
COLORADO Year #
Transfers #
Acres Reuse
Category
1995 1 1.6
1999 1 2.8
2000 2 54,890
2001 2 54.2
2005 2 20.2
2007 1 4,000
2010 1 5
2012 2 6
TOTAL: 12 58,979.7
Authorities Used: AEA; Other Legislation
Disposal Mechanisms: Federal Transfer; Other DOE Disposal, GSA Disposal
Section 4. Overview of Completed Transfers
24
FLORIDA Year #
Transfers #
Acres Reuse
Category
1998 1 100
TOTAL: 1 100
Authorities Used: AEA
Disposal Mechanisms: DOE Economic Development
IDAHO Year #
Transfers #
Acres Reuse
Category
1978 1 2,555
1994 1 1,120
1997 1 160
TOTAL: 3 3,835
Authorities Used: Other Legislation
Disposal Mechanisms: Federal Transfer; GSA Disposal
KENTUCKY Year #
Transfers #
Acres Reuse
Category
1959 1 2,351
1962 1 185
TOTAL: 2 2,536
Authorities Used: Other Legislation
Disposal Mechanisms: GSA Disposal

Section 4. Overview of Completed Transfers
25
LOUISIANA Year #
Transfers #
Acres Reuse
Category
1993 2 567
1997 1 366
2001 1 68
2008 1 431
TOTAL: 5 1,432
Authorities Used: Other Legislation
Disposal Mechanisms: Other DOE Disposal, GSA Disposal
MISSISSIPPI Year #
Transfers #
Acres Reuse
Category
2010 1 1,470
TOTAL: 1 1,470
Authorities Used: AEA
Disposal Mechanisms: Other DOE Disposal
MISSOURI Year #
Transfers #
Acres Reuse
Category
2013 2 9.9
TOTAL: 2 9.9
Authorities Used: Other Legislation
Disposal Mechanisms: GSA Disposal

Section 4. Overview of Completed Transfers
26
MONTANA Year #
Transfers #
Acres Reuse
Category
1995 1 5.2
1996 1 53.2
TOTAL: 2 58.4
Authorities Used: Other Legislation
Disposal Mechanisms: GSA Disposal, Other DOE Disposal
NEBRASKA Year #
Transfers # Acres Reuse
Category
2004 1 1.6
TOTAL: 1 1.6
Authorities Used: Other Legislation
Disposal Mechanisms: Other DOE Disposal
NEVADA Year #
Transfers #
Acres Reuse
Category
2005 1 2.6
TOTAL: 1 2.6
Authorities Used: Other Legislation
Disposal Mechanisms: Federal Transfer
Section 4. Overview of Completed Transfers
27
NEW JERSEY Year
# Transfer
s # Acres
Reuse Categor
y
2007 1 7 *
2009 1 6 *
TOTAL: 2 13
Authorities Used: AEA
Disposal Mechanisms: GSA Disposal
*Vacant‐zoned parks/recreation and industrial
NEW MEXICO Year #
Transfers #
Acres Reuse Category
1998 1 5.5
1997 1 1.9
1999 1 564
2001 1 116
2002 10 2,205.7
2005 4 47.2
2007 1 21.7
2008 3 143.1
2010 2 24.2
2012 2 16
2013 2 140.4
TOTAL: 28 3,285.7
Authorities Used: AECA; AEA; Other Legislation
Disposal Mechanisms: Other DOE Disposal

Section 4. Overview of Completed Transfers
28
NORTH DAKOTA Year #
Transfers #
Acres Reuse
Category
2009 1 2.5
TOTAL: 1 2.5
Authorities Used: Other Legislation
Disposal Mechanisms: Other DOE Disposal
OHIO Year #
Transfers #
Acres Reuse
Category
1999 3 30.3
2001 1 94.8
2002 1 4.8
2009 3 52
TOTAL: 8 181.9
Authorities Used: AEA
Disposal Mechanisms: Other DOE Disposal

Section 4. Overview of Completed Transfers
29
OKLAHOMA Year #
Transfers #
Acres Reuse
Category
1990 1 2.9
2001 1 15.7 *
2006 1 7.7
2013 1 4.7
TOTAL: 4 31
Authorities Used: Other Legislation
Disposal Mechanisms: Other DOE Disposal, GSA Disposal
*Vacant‐zoned commercial/light industrial
PENNSYLVANIA Year # Transfers #
Acres Reuse
Category
2012 1 0.4 *
TOTAL: 1 0.4
Authorities Used: AEA
Disposal Mechanisms: GSA Disposal
*Vacant‐zoned commercial/light industrial

Section 4. Overview of Completed Transfers
30
SOUTH CAROLINA Year #
Transfers #
Acres Reuse
Category
1970 2 2,486
TOTAL: 2 2,486
Authorities Used: AEA
Disposal Mechanisms: Other DOE Disposal
SOUTH DAKOTA Year #
Transfers #
Acres Reuse
Category
1992 1 6.4
1994 1 9.4
TOTAL: 2 15.8
Authorities Used: Other Legislation
Disposal Mechanisms: GSA Disposal
Section 4. Overview of Completed Transfers
31
TENNESSEE Year #
Transfers #
Acres Reuse Category
1956 2 45.8
1957 1 5.6
1959 3 1,607
1960 7 2,903.5
1961 1 7.6
1962 1 50.5
1963 4 138.4
1964 2 84.6
1965 5 101.3
1966 6 58
1967 4 434.9
1968 1 1364
1969 1 0.9
1971 2 201.1
1972 1 20
1974 1 60.4
1975 3 22.5
1978 3 83.5
1982 1 0.4
1983 1 279.3
1985 1 118.9
1987 1 1216.7

Section 4. Overview of Completed Transfers
32
TENNESSEE (cont.) Year #
Transfers #
Acres Reuse Category
1988 1 52.7
1992 2 703.5
1995 1 0.4
1998 1 3.5
2000 1 89
2001 2 188.6
2002 1 1.7
2003 1 491.3
2005 6 12.1
2006 5 13.3
2007 2 22.6
2008 3 35.4
2009 4 14.5
2010 2 97.7
2011 2 25.7
2012 1 10.5
TOTAL 87 10,567.3
Authorities Used: AEA, Other Legislation
Disposal Mechanisms:
DOE Economic Development, Other DOE Disposal, GSA Disposal, Federal Transfer

Section 4. Overview of Completed Transfers
33
TEXAS Year # Transfers #
Acres Reuse
Category
1995 2 26.8
TOTAL: 2 26.8
Authorities Used: Other Legislation
Disposal Mechanisms: GSA Disposal
UTAH Year #
Transfers #
Acres Reuse Category
2000 3 89,383
2011 1 179.4
TOTAL: 4 89,562.4
Authorities Used: AEA; Other Legislation
Disposal Mechanisms: Federal Transfer; GSA Disposal; Other DOE Disposal
Section 4. Overview of Completed Transfers
34
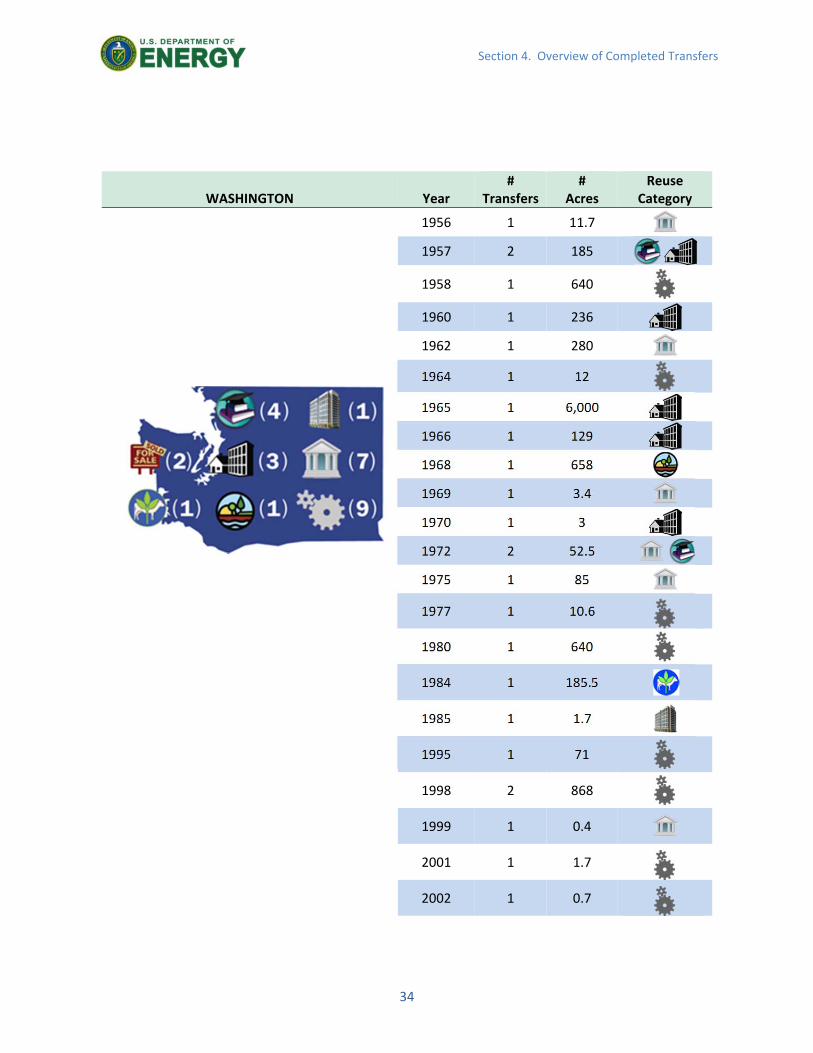
WASHINGTON Year #
Transfers #
Acres Reuse
Category
1956 1 11.7
1957 2 185
1958 1 640
1960 1 236
1962 1 280
1964 1 12
1965 1 6,000
1966 1 129
1968 1 658
1969 1 3.4
1970 1 3
1972 2 52.5
1975 1 85
1977 1 10.6
1980 1 640
1984 1 185.5
1985 1 1.7
1995 1 71
1998 2 868
1999 1 0.4
2001 1 1.7
2002 1 0.7

Section 4. Overview of Completed Transfers
35
WASHINGTON (cont.) Year #
Transfers #
Acres Reuse
Category
2005 2 80.8
2006 1 9.2
TOTAL: 28 10,165.1
Authorities Used: AECA; AEA; Other Legislation
Disposal Mechanisms: GSA Disposal; Other DOE Disposal
The Richland, WA Innovation Center was developed by the Port of Benton on 72 acres of unneeded DOE Hanford Site land that was transferred in 1996. The industrial and research park currently has 18 commercial tenants.
Section 5. Land Transfer Data Analysis
36
Section 5. Land Transfer Data Analysis
The following section of the report presents analysis of historical DOE land and asset transfers and provides data by year, state, reuse category, transfer authority, and disposal mechanism. The data are presented in two separate sections in Section 5: Section 5.A, DOE Historical Land Transfers; and Section 5.B, Naval Petroleum Reserves and Naval Oil Shale Reserves Transfers. The data are separated and presented this way due to the unique history and nature of the NPR and NOSR sites and the large amount of acreage concentrated in just seven transfers within only three states. In those particular transactions, more than 200,000 acres were transferred in only seven transactions, which would significantly skew the data presentation and analysis. In this way, the smaller but more numerous transfer data sets have visibility and don’t become lost amongst the large NPR and NOSR transfers.
This report also analyzes data by both the number of transfers and the amount of acreage transferred. Historically, different sites counted transfers in a variety of ways, some combining multiple parcels into a single transfer, others counting each parcel as a separate transfer. In addition, some sites tracked and counted transfers by regulatory cleanup areas called operable units. As a result, data are presented and analyzed here by the numbers of transfers and the numbers of acres transferred to give a better, more complete, and more accurate picture of the transfer activities that have taken place over 57 years.
DOE continues to work with local communities, state and tribal governments, and economic development organizations around DOE sites to evaluate future land and asset transfer options and potential reuse scenarios. Although opportunities potentially exist across the DOE complex, the size and type of transfer will be site‐dependent, and not all sites anticipate large land transfer opportunities in the near future.
Section 5.A DOE Historical Land Transfers (Excludes NPR and NOSR transfer data found in Section 5.B)
Historical Land Transfers by State
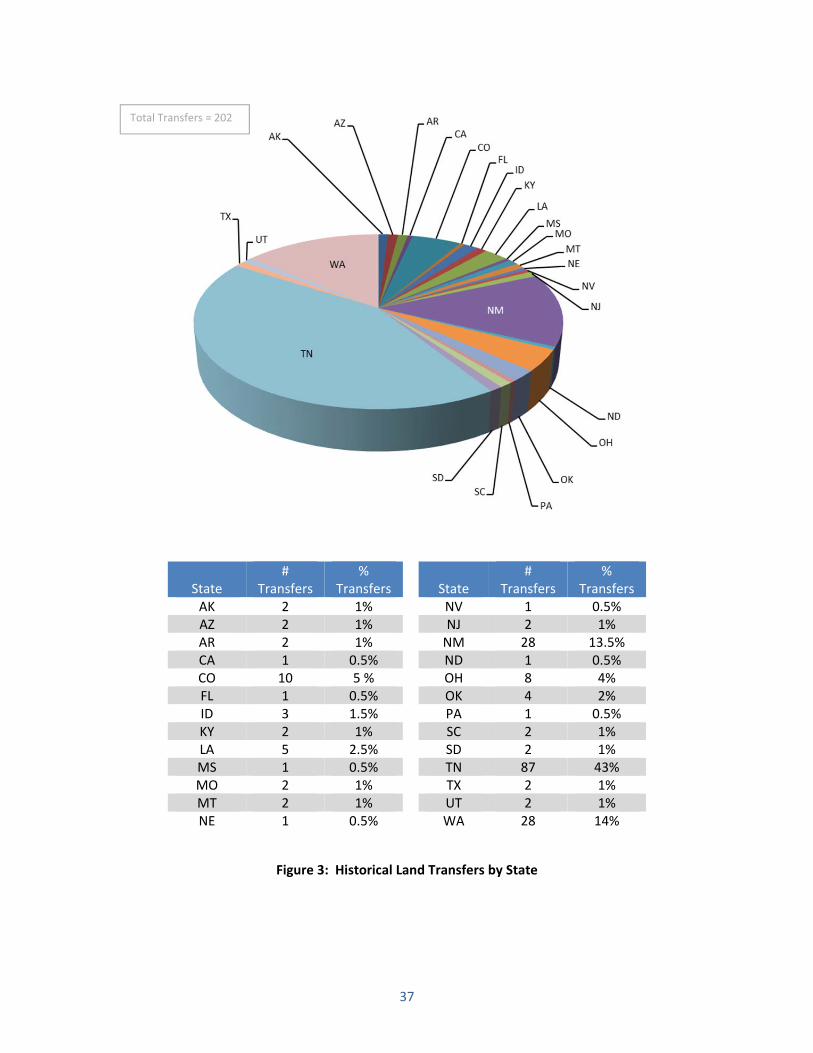
Figures 3 and 4 below show the numbers of transfers (202 transfers) and the numbers of acres (44,421 acres) transferred per state. While TN had significantly more transfers than any other state, Figure 2 shows that, by acreage, TN and WA had roughly the same number of acres transferred. Earlier land transfers in the late 1940s and early 1950s, which created the cities of Richland, WA; Los Alamos, NM; and Oak Ridge, TN, are not included in this data because reliable historical records and data for those particular transfers are not available today.
37
State #
Transfers %
Transfers
State #
Transfers %
Transfers AK 2 1% NV 1 0.5% AZ 2 1% NJ 2 1% AR 2 1% NM 28 13.5% CA 1 0.5% ND 1 0.5% CO 10 5 % OH 8 4% FL 1 0.5% OK 4 2% ID 3 1.5% PA 1 0.5% KY 2 1% SC 2 1% LA 5 2.5% SD 2 1% MS 1 0.5% TN 87 43% MO 2 1% TX 2 1% MT 2 1% UT 2 1% NE 1 0.5% WA 28 14%
Figure 3: Historical Land Transfers by State
Total Transfers = 202

38
State #
Acres %
Acres
State #
Acres %
Acres AK 3,524 7.9% NV 2.6 0% AZ 7 0% NJ 13 0% AR 3.3 0% NM 3,285.7 7.4% CA 14 0% ND 2.5 0% CO 4,089.7 9.2% OH 182 0.4% FL 100 0.2% OK 30.9 0.1% ID 3,835 8.6% PA 0.4 0% KY 2,536 5.7% SC 2,486 5.6% LA 1,432 3.2% SD 15.8 0% MS 1,470 3.3% TN 10,567.3 23.8% MO 9.9 0% TX 26.8 0.1% MT 58.4 0.1% UT 562.4 1.3% NE 1.6 0% WA 10,165.1 22.9%
Figure 4: Historical Acres Transferred by State
Historical Land Transfers over Time
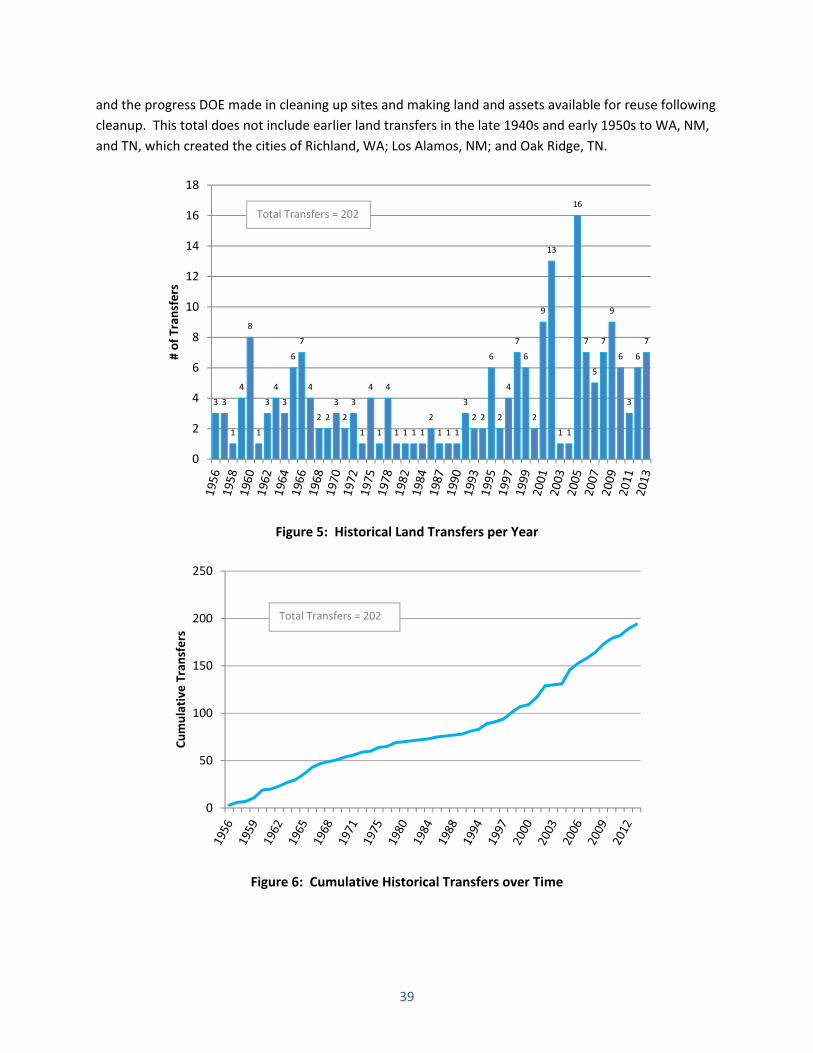
Figures 5 and 6 show the numbers of transfers per year and the cumulative number of transfers over
time, respectively. Over 57 years, DOE has conducted 202 transfers. The increase in transfer activity in
the mid‐to late 1990s reflects the work of economic development organizations, the local communities,
Total Acres = 44,421
39
and the progress DOE made in cleaning up sites and making land and assets available for reuse following
cleanup. This total does not include earlier land transfers in the late 1940s and early 1950s to WA, NM,
and TN, which created the cities of Richland, WA; Los Alamos, NM; and Oak Ridge, TN.
Figure 5: Historical Land Transfers per Year
Figure 6: Cumulative Historical Transfers over Time
3 3
1
4
8
1
3
4
3
6
7
4
2 2
3
2
3
1
4
1
4
1 1 1 1
2
1 1 1
3
2 2
6
2
4
7
6
2
9
13
1 1
16
7
5
7
9
6
3
6
7
0
2
4
6
8
10
12
14
16
18# of Tran
sfers
0
50
100
150
200
250
Cumulative Transfers
Total Transfers = 202
Total Transfers = 202
40
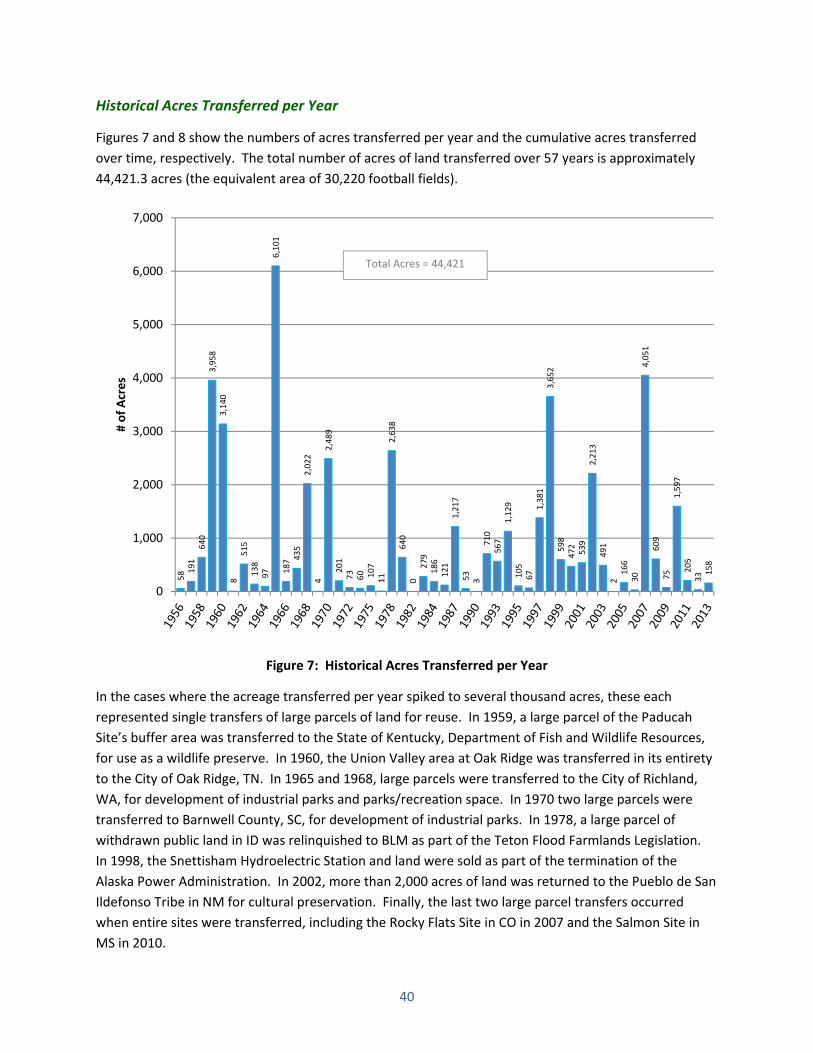
Historical Acres Transferred per Year
Figures 7 and 8 show the numbers of acres transferred per year and the cumulative acres transferred
over time, respectively. The total number of acres of land transferred over 57 years is approximately
44,421.3 acres (the equivalent area of 30,220 football fields).
Figure 7: Historical Acres Transferred per Year
In the cases where the acreage transferred per year spiked to several thousand acres, these each
represented single transfers of large parcels of land for reuse. In 1959, a large parcel of the Paducah
Site’s buffer area was transferred to the State of Kentucky, Department of Fish and Wildlife Resources,
for use as a wildlife preserve. In 1960, the Union Valley area at Oak Ridge was transferred in its entirety
to the City of Oak Ridge, TN. In 1965 and 1968, large parcels were transferred to the City of Richland,
WA, for development of industrial parks and parks/recreation space. In 1970 two large parcels were
transferred to Barnwell County, SC, for development of industrial parks. In 1978, a large parcel of
withdrawn public land in ID was relinquished to BLM as part of the Teton Flood Farmlands Legislation.
In 1998, the Snettisham Hydroelectric Station and land were sold as part of the termination of the
Alaska Power Administration. In 2002, more than 2,000 acres of land was returned to the Pueblo de San
Ildefonso Tribe in NM for cultural preservation. Finally, the last two large parcel transfers occurred
when entire sites were transferred, including the Rocky Flats Site in CO in 2007 and the Salmon Site in
MS in 2010.
58 191
640
3,958
3,140
8515
138
97
6,101
187 435
2,022
42,489
201
73
60 107
11
2,638
640
0279
186
121
1,217
53
3710
567
1,129
105
67
1,381
3,652
598
472
539
2,213
491
2166
30
4,051
609
75
1,597
205
33 158
0
1,000
2,000
3,000
4,000
5,000
6,000
7,000
# of Acres
Total Acres = 44,421

41
Figure 8: Cumulative Historical Acres Transferred Over Time
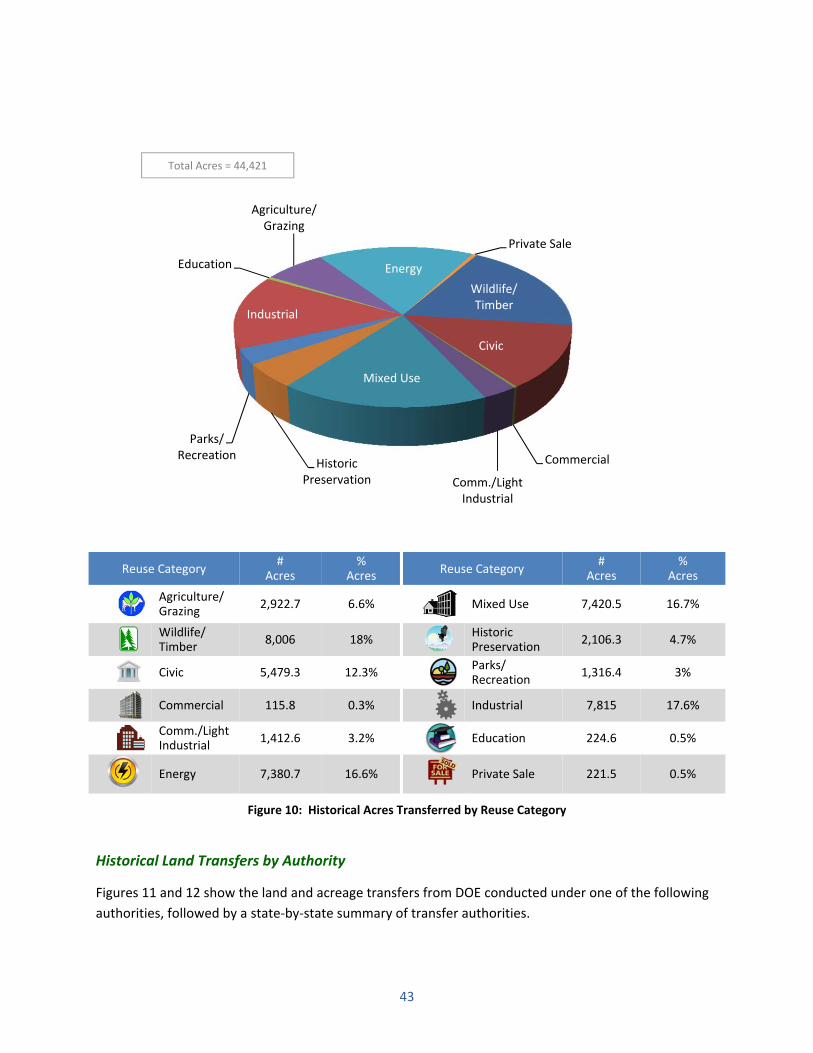
Historical Transfers by Reuse Category
Figures 9 and 10 demonstrate the wide range of reuse opportunities that former DOE land and assets
can provide to a community. From cultural and wildlife preservation to providing industrial,
commercial, and civic facilities like fire stations, airports, and water treatment plants, DOE continues to
partner with local communities, Tribal Nations, economic development organizations, and other entities
to identify and transfer assets that are no longer needed for its mission. In total, DOE has transferred
one port, two airports, five fire stations, two water treatment plants, and one water production plant to
local governments for beneficial reuse.
0
5,000
10,000
15,000
20,000
25,000
30,000
35,000
40,000
45,000
Cumulative Acres
Total Acres = 44,421

42
Reuse Category #
Transfers %
Transfers Reuse Category
# Transfers
% Transfers
Agriculture/ Grazing
4 2%
Mixed Use 14 6.9%
Wildlife/ Timber
4 2% Historic Preservation
4 2%
Civic 53 26.2%
Parks/ Recreation
8 4%
Commercial 16 7.9% Industrial 28 13.9%
Comm./Light Industrial
21 10.4% Education 15 7.4%
Energy 21 10.4% Private Sale 14 6.9%
Figure 9: Historical Land Transfers by Reuse Category
Wildlife/TImber
Civic
Commercial
Comm./Light IndustrialMixed Use
Comm./Resid.
Historic Preservation
Parks/Recreation
Industrial
Education
Agriculture/Grazing
Energy
Private Sale
Total Transfers = 202
43
Figure 10: Historical Acres Transferred by Reuse Category
Historical Land Transfers by Authority
Figures 11 and 12 show the land and acreage transfers from DOE conducted under one of the following
authorities, followed by a state‐by‐state summary of transfer authorities.
Wildlife/Timber
Civic
Commercial
Comm./Light Industrial
Mixed Use
Historic Preservation
Parks/Recreation
Industrial
Education
Agriculture/Grazing
Energy
Private Sale
Reuse Category #
Acres %
Acres Reuse Category
# Acres
% Acres
Agriculture/ Grazing
2,922.7 6.6%
Mixed Use 7,420.5 16.7%
Wildlife/ Timber
8,006 18% Historic Preservation
2,106.3 4.7%
Civic 5,479.3 12.3%
Parks/ Recreation
1,316.4 3%
Commercial 115.8 0.3% Industrial 7,815 17.6%
Comm./Light Industrial
1,412.6 3.2% Education 224.6 0.5%
Energy 7,380.7 16.6%
Private Sale 221.5 0.5%
Total Acres = 44,421

44
Atomic Energy Communities Act of 1955
The Atomic Energy Community Act of 1955 (AECA), (P.L. 84‐221) authorized the AEC to dispose of real
property at Oak Ridge, TN and Richland, WA through 1960. It was amended in 1962 (P.L. 87‐719) to
authorize AEC to include Los Alamos transfers under this legislation for the next five years (through
1968). Another amendment in 1996 extended the date for Los Alamos transfers to June 30, 1998 (P.L.
104‐106, section 3161).
Atomic Energy Act, Section 161g
The AEA of 1954 (P.L. 83‐703), Section 161g, codified at Title 42 U.S.C. 2201(g), authorized the Atomic
Energy Commission (AEC) to “sell, lease, grant and dispose of” real property. DOE is the successor
agency to AEC and may use this authority for disposal of property under the jurisdiction of the AEA.
Other Legislation
Several laws have been enacted that direct DOE to dispose of specific parcels of land and often specify
the grantee and the terms of the transaction. Examples include special legislation and public laws
including: Section 632 of P.L. 105‐119, Departments of Commerce, Justice, and State, the Judiciary and
Related Agencies Appropriations Act of 1998, directing conveyance of property at or in the vicinity of
the Los Alamos National Laboratory, NM and Santa Fe County, NM to the Pueblo de San Ildefonso Tribe;
and Subtitle F of P.L. 107‐107 div. C, title XXXI, the Rocky Flats National Wildlife Refuge Act (NWRA) of
2001, directing the transfer of portions of the Rocky Flats Site to the U.S. Department of Interior (DOI).
Land has also been transferred under additional public laws, including the Federal Property and
Administrative Services Act of 1949 (P.L. 81‐152); the Federal Land Policy and Management Act of 1976
(P.L. 94‐579, 43 U.S.C. Section 1701 et seq.); and the Department of Energy Act of 1978 – Civilian
Applications (P.L. 95‐238).
AEA
Other Legislation
AECA
Authority # Transfers % Transfers
AECA 10 5.0% AEA 74 36.6%
Other Legislation 118 58.4%
Figure 11: Historical Land Transfers by Authority
Total Transfers = 202
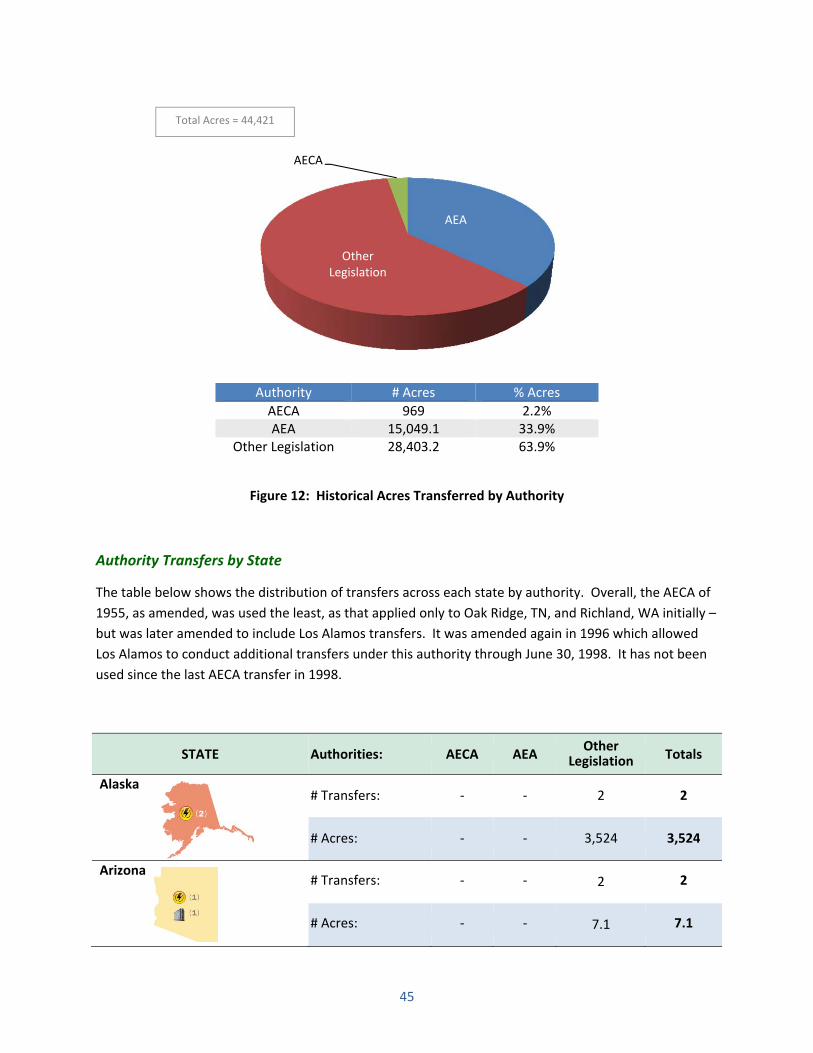
45
Authority # Acres % Acres
AECA 969 2.2% AEA 15,049.1 33.9%
Other Legislation 28,403.2 63.9%
Figure 12: Historical Acres Transferred by Authority
Authority Transfers by State
The table below shows the distribution of transfers across each state by authority. Overall, the AECA of
1955, as amended, was used the least, as that applied only to Oak Ridge, TN, and Richland, WA initially –
but was later amended to include Los Alamos transfers. It was amended again in 1996 which allowed
Los Alamos to conduct additional transfers under this authority through June 30, 1998. It has not been
used since the last AECA transfer in 1998.
STATE Authorities: AECA AEA Other
Legislation Totals
Alaska # Transfers: ‐ ‐ 2 2
# Acres: ‐ ‐ 3,524 3,524
Arizona # Transfers: ‐ ‐ 2 2
# Acres: ‐ ‐ 7.1 7.1
AEA
OtherLegislation
AECA
Total Acres = 44,421

46
STATE Authorities: AECA AEA Other
Legislation Totals
Arkansas # Transfers: ‐ ‐ 2 2
# Acres: ‐ ‐ 3.3 3.3
California* # Transfers: ‐ 1 ‐ 1
# Acres: ‐ 14 ‐ 14
# Transfers: ‐ 3 7 10
# Acres: ‐ 59.2 4,030.5 4,089.7
Florida # Transfers: ‐ 1 ‐ 1
# Acres: ‐ 100 ‐ 100
Idaho # Transfers: ‐ ‐ 3 3
# Acres: ‐ ‐ 3,835 3,835
Kentucky
# Transfers: ‐ ‐ 2 2
# Acres: ‐ ‐ 2,536 2,536
Louisiana # Transfers: ‐ ‐ 5 5
# Acres: ‐ ‐ 1,432 1,432
Mississippi # Transfers: ‐ 1 ‐ 1
# Acres: ‐ 1,470 ‐ 1,470
Missouri # Transfers: ‐ ‐ 2 2
# Acres: ‐ ‐ 9.9 9.9
Montana # Transfers: ‐ ‐ 2 2
# Acres: ‐ ‐ 58.4 58.4

47
STATE Authorities: AECA AEA Other
Legislation Totals
Nebraska # Transfers: ‐ ‐ 1 1
# Acres: ‐ ‐ 1.6 1.6
Nevada # Transfers: ‐ ‐ 1 1
# Acres: ‐ ‐ 2.6 2.6
New Jersey # Transfers: ‐ 2 ‐ 2
# Acres: ‐ 13 ‐ 13
New Mexico # Transfers: 2 2 24 28
# Acres: 7.4 117.6 3160.7 3,285.7
North Dakota # Transfers: ‐ ‐ 1 1
# Acres: ‐ ‐ 2.5 2.5
Ohio # Transfers: ‐ 8 ‐ 8
# Acres: ‐ 182 ‐ 182
Oklahoma # Transfers: ‐ ‐ 4 4
# Acres: ‐ ‐ 31 31
Pennsylvania # Transfers: ‐ 1 ‐ 1
# Acres: ‐ 0.4 ‐ 0.4
South Carolina # Transfers: ‐ 2 ‐ 2
# Acres: ‐ 2,486 ‐ 2,486
South Dakota # Transfers: ‐ ‐ 2 2
# Acres: ‐ ‐ 15.8 15.8
48
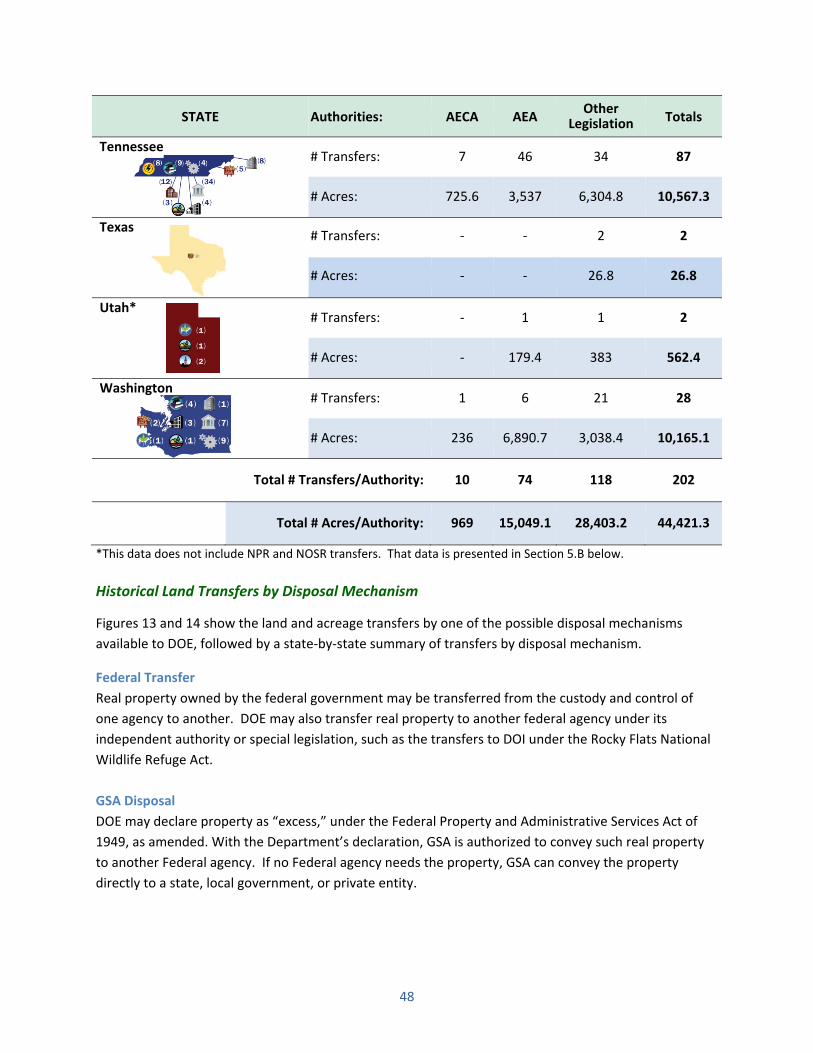
STATE Authorities: AECA AEA Other
Legislation Totals
Tennessee # Transfers: 7 46 34 87
# Acres: 725.6 3,537 6,304.8 10,567.3
Texas # Transfers: ‐ ‐ 2 2
# Acres: ‐ ‐ 26.8 26.8
Utah* # Transfers: ‐ 1 1 2
# Acres: ‐ 179.4 383 562.4
Washington # Transfers: 1 6 21 28
# Acres: 236 6,890.7 3,038.4 10,165.1
Total # Transfers/Authority: 10 74 118 202
Total # Acres/Authority: 969 15,049.1 28,403.2 44,421.3
*This data does not include NPR and NOSR transfers. That data is presented in Section 5.B below.
Historical Land Transfers by Disposal Mechanism
Figures 13 and 14 show the land and acreage transfers by one of the possible disposal mechanisms
available to DOE, followed by a state‐by‐state summary of transfers by disposal mechanism.
Federal Transfer
Real property owned by the federal government may be transferred from the custody and control of
one agency to another. DOE may also transfer real property to another federal agency under its
independent authority or special legislation, such as the transfers to DOI under the Rocky Flats National
Wildlife Refuge Act.
GSA Disposal
DOE may declare property as “excess,” under the Federal Property and Administrative Services Act of
1949, as amended. With the Department’s declaration, GSA is authorized to convey such real property
to another Federal agency. If no Federal agency needs the property, GSA can convey the property
directly to a state, local government, or private entity.

49
Other DOE Disposals
DOE may, under various authorities, convey real property directly to a state or local government agency,
tribal government, or private entity. The authorities under which DOE may directly convey real property
are the AEA and other legislation.
DOE Economic Development Transfers/Indemnification Authority Provisions
When DOE transfers property under its own authority, the Secretary has discretionary authority to offer
indemnification; indemnification cannot be provided under the GSA disposal process. The NDAA for FY
1998 (P.L. 105‐85), Section 3158, codified at 50 U.S.C. 2811, authorizes DOE to indemnify real property
at defense nuclear facilities that will be transferred for the purposes of economic development. The
associated regulations are in 10 CFR Part 770.
Figure 13: Historical Land Transfers by Disposal Mechanism
GSA
Other DOEDisposal
DOE Economic
Development
FederalTransfer
Disposal Mechanism # Transfers % Transfers
Federal Transfer 14 6.9% GSA Disposal 72 35.6% Other DOE Disposal 93 46% DOE Economic Development 23 11.4%
Total Transfers = 202

50
Disposal Mechanism # Acres % Acres
Federal Transfer 11,325.5 25.5% GSA Disposal 9,593.1 21.6% Other DOE Disposal 22,616.7 50.9% DOE Economic Development
886.1 2%
Figure 14: Historical Acres Transferred by Disposal Mechanism
Disposal Mechanism Transfers by State
The table below shows the distribution of transfers across each state by disposal mechanism. Overall,
GSA and other DOE Disposal mechanisms dominated the number of transfers, while other DOE Disposals
dominated solely by acreage.
STATE Disposal
Mechanisms:Federal Transfer
GSA Disposal
Other DOE
Disposal
DOE Economic
Development Totals
Alaska # Transfers: ‐ ‐ 2 ‐ 2
# Acres: ‐ ‐ 3,524 ‐ 3,524
Arizona # Transfers: ‐ 1 1 ‐ 2
# Acres: ‐ 4 3.1 ‐ 7.1
GSA
Other DOEDisposal
DOE Econ.Develop.
FederalTransfer
Total Acres = 44,421

51
STATE Disposal
Mechanisms:Federal Transfer
GSA Disposal
Other DOE
Disposal
DOE Economic
Development Totals
Arkansas # Transfers: ‐ 1 1 ‐ 2
# Acres: ‐ 0.8 2.5 ‐ 3.3
California* # Transfers: ‐ 1 ‐ ‐ 1
# Acres: ‐ 14 ‐ ‐ 14
Colorado* # Transfers: 1 2 7 ‐ 10
# Acres: 4,000 3.1 86.7 ‐ 4,089.8
Florida # Transfers: ‐ ‐ ‐ 1 1
# Acres: ‐ ‐ ‐ 100 100
Idaho # Transfers: 2 1 ‐ ‐ 3
# Acres: 3,675 160 ‐ ‐ 3,835
Kentucky
# Transfers: 2 2
# Acres: 2536 2,536
Louisiana # Transfers: 2 3 ‐ 5
# Acres: 499 933 ‐ 1432
Mississippi # Transfers: ‐ ‐ 1 ‐ 1
# Acres: ‐ ‐ 1,470 ‐ 1,470
Missouri # Transfers: ‐ 2 ‐ ‐ 2
# Acres: ‐ 9.9 ‐ ‐ 9.9
Montana # Transfers: ‐ 1 1 ‐ 2
# Acres: ‐ 5.2 53.2 ‐ 58.4
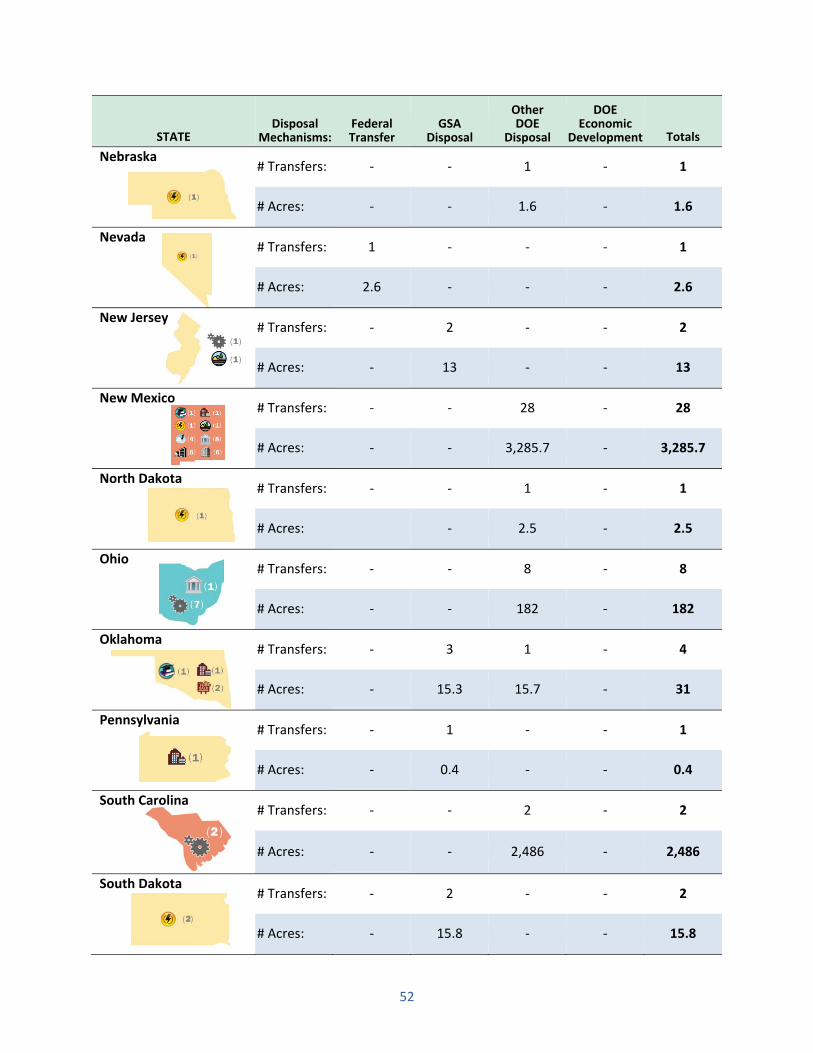
52
STATE Disposal
Mechanisms:Federal Transfer
GSA Disposal
Other DOE
Disposal
DOE Economic
Development Totals
Nebraska # Transfers: ‐ ‐ 1 ‐ 1
# Acres: ‐ ‐ 1.6 ‐ 1.6
Nevada # Transfers: 1 ‐ ‐ ‐ 1
# Acres: 2.6 ‐ ‐ ‐ 2.6
New Jersey # Transfers: ‐ 2 ‐ ‐ 2
# Acres: ‐ 13 ‐ ‐ 13
New Mexico # Transfers: ‐ ‐ 28 ‐ 28
# Acres: ‐ ‐ 3,285.7 ‐ 3,285.7
North Dakota # Transfers: ‐ ‐ 1 ‐ 1
# Acres: ‐ 2.5 ‐ 2.5
Ohio # Transfers: ‐ ‐ 8 ‐ 8
# Acres: ‐ ‐ 182 ‐ 182
Oklahoma # Transfers: ‐ 3 1 ‐ 4
# Acres: ‐ 15.3 15.7 ‐ 31
Pennsylvania # Transfers: ‐ 1 ‐ ‐ 1
# Acres: ‐ 0.4 ‐ ‐ 0.4
South Carolina # Transfers: ‐ ‐ 2 ‐ 2
# Acres: ‐ ‐ 2,486 ‐ 2,486
South Dakota # Transfers: ‐ 2 ‐ ‐ 2
# Acres: ‐ 15.8 ‐ ‐ 15.8

53
STATE Disposal
Mechanisms:Federal Transfer
GSA Disposal
Other DOE
Disposal
DOE Economic
Development Totals
Tennessee # Transfers: 9 27 29 22 87
# Acres: 3,264.8 3,083.3 3,432.6 786.2 10,566.9
Texas # Transfers: ‐ 2 ‐ ‐ 2
# Acres: ‐ 26.8 ‐ ‐ 26.8
Utah* # Transfers: 1 1 ‐ ‐ 2
# Acres: 383 179.4 ‐ ‐ 562.4
Washington # Transfers: ‐ 21 7 ‐ 28
# Acres: ‐ 3,026.8 7,138.3 ‐ 10,165.1
Total # Transfers/Disp. Mechanism: 14 72 93 23 202
Total # Acres/Disp. Mechanism: 11,325.5 9,593.1 22,616.7 886.1 44,421.3
*This data does not include NPR and NOSR transfers. That data is presented in Section 5.B below.
Above is a photo of a portion of the Salmon, MS Site, a former weapons testing site, that was transferred to the State of Mississippi Forestry Commission in 2010 for use as a wildlife refuge and for timber harvesting.
54
Section 5.B Naval Petroleum Reserves and Naval Oil Shale Reserves Transfers
NPR and NOSR History
For much of the 20th century, the NPR and NOSR served as contingency sources of fuel for the Nation's
military. Set aside in a series of Executive Orders in the early 1900s, the government‐owned petroleum
and oil shale properties were originally envisioned as a way to provide a reserve supply of crude oil to
fuel U.S. naval vessels in times of short supply or emergencies. These properties remained mostly
undeveloped until the 1970s, when the Nation began looking for ways to maximize its domestic oil
supplies. In 1976, Congress passed the Naval Petroleum Reserves Production Act (P.L. 94‐258),
authorizing full commercial development of the Reserves. The crude oil, natural gas, and liquid products
produced from the Reserves were sold by DOE at market rates, and revenues were deposited to the U.S.
Treasury.
One of the largest of the Federal properties, the Elk Hills field in California, opened for production in
1976 and became the largest (in terms of production) oil and natural gas field in the lower 48 states at
one point in its history. In September 1992, the field produced its one billionth barrel of oil, becoming
only the thirteenth field in the Nation's history to reach that milestone. While managed by DOE, Elk Hills
generated over $17 billion in profits for the U.S. Treasury. Details of the history of DOE naval petroleum
reserve transfers (including the Naval Petroleum Reserves [NPR] and Naval Oil Shale Reserves [NOSR])
are included in Attachment B
Divestment Activities
In 1996, however, Congress determined that the properties no longer served the national defense
purpose envisioned in the early 1900s and authorized DOE to take the following steps toward potential
divestment or privatization of them.
NPR‐1 (Elk Hills) ― In 1996, the government's share of the Elk Hills field in California was offered for
commercial sale. On February 5, 1998, DOE completed its sale to Occidental Petroleum Corporation for
$3.65 billion in the largest privatization of Federal property in the history of the United States.
NOSR‐1 and ‐3 ― Subsequently, DOE transferred two of the NOSRs, both in Colorado, to the DOI Bureau
of Land Management. Like many other federally owned lands, these properties were offered for
commercial mineral leasing, primarily for natural gas production and future petroleum exploration.
NOSR‐2 ― In 2000‐2001, DOE returned the undeveloped NOSR‐2 in Utah to the Northern Ute Indian
Tribe in the largest transfer of federal property to Native Americans in the last century.
NPR‐2 ‐ Enactment of the Energy Policy Act of 2005 effected the transfer of administrative jurisdiction
and land management of NPR‐2 to the DOI, with the exception of certain lands that were conveyed to
the City of Taft, CA, as well as some sites in Ford City, CA, that were disposed of by the Government
after environmental assessments were completed.

55
The NPR and NOSR Today
In addition to the sale of Elk Hills and the transfer of the oil shale reserves and NPR‐2, in January 2015,
DOE sold the last NPR property (NPR‐3) in Wyoming, known as Teapot Dome, and one oil field
technology testing center called the Rocky Mountain Oilfield Testing Center at NPR‐3. These properties
were transferred pursuant to Section 3404 of the NDAA for FY 1999. The table below shows the status
of each of the disposed NPR and NOSR properties, with the exception of the recent sale of NPR‐3. In
total, DOE has disposed of 202,481 acres of NPR and NOSR properties in seven transfers in three states.
State Name Year
Disposed # Acres
Oil Production
Additional Reuse
Categories
California
NPR‐1 1998 48,145 Active
NPR‐2 2005 10,446 Active
Colorado
NOSR‐1 1999 40,760 Inactive
NOSR‐3 1999 14,130 Inactive
Utah
NOSR‐2 2000‐2001 89,000 Inactive
Total Acres: 202,481
Reuse Category Legend:
Wildlife/Timber
Civic
Oil & Mineral Exploration
Alternative Energy Production
Historic Preservation

56
NPR and NOSR Disposals by State
Figures 15 and 16 show the NPR and NOSR disposals by both the numbers of transfers and the acres
transferred per state.
State # Transfers % Transfers CA 3 43% CO 2 28.6% UT 2 28.6%
Figure 15: NPR and NOSR Transfers by State
State # Acres % Acres CA 58,591 28.9% CO 54,890 27.1% UT 89,000 44%
Figure 16: NPR and NOSR Acres Transferred per State
Total Transfers = 7
Total Acres = 202,481

57
NPR and NOSR Authorities
As shown in the table below, all NPR and NOSR disposals were done under special legislation and/or
congressional direction.
STATE Authorities: AECA AEA Other
Legislation Totals
California # Transfers: ‐ ‐ 3 3
# Acres: ‐ ‐ 58,591 58,591
Colorado # Transfers: ‐ ‐ 2 2
# Acres: ‐ ‐ 54,890 54,890
Utah # Transfers: ‐ ‐ 2 2
# Acres: ‐ ‐ 89,000 89,000
Total # Transfers/Authority: ‐ ‐ 7 7
Total # Acres/Authority: ‐ ‐ 202,481 202,481
At right are active oil wells at the NPR 3 Teapot Dome Site in Wyoming, which have been transferred out of DOE ownership.

58
NPR and NOSR Disposal Mechanisms
The table below shows that three of the four disposal mechanisms were used for the disposal of the
NPR and NOSR properties.
STATE Disposal
Mechanisms:Federal Transfer
GSA Disposal
Other DOE
Disposal
DOE Economic
Development Totals
California # Transfers: 1 1 1 ‐ 3
# Acres: 10,430 16 48,145 ‐ 58,591
Colorado # Transfers: 2 ‐ ‐ ‐ 2
# Acres: 54,890 ‐ ‐ ‐ 54,890
Utah # Transfers: ‐ ‐ 2 ‐ 2
# Acres: ‐ ‐ 89,000 ‐ 89,000
Total # Transfers/Disp. Mechanism: 3 1 3 ‐ 7
Total # Acres/Disp. Mechanism: 65,320 16 137,145 ‐ 202,481
At left are three active oil wells at the NPR 1 Elk Hills Site in California which was sold in 1998 to Occidental Petroleum in the largest privatization of Federal property in U.S. history.

Section 6. Conclusions
59
Section 6. Conclusions
As the data in this report demonstrates, DOE has a long history of land transfers for beneficial reuse. In
some cases, this land had been part of previously existing communities before it was acquired by the
AEC to support nuclear weapons development during the Manhattan Project. From a single building
transfer that has been modernized and converted to a state‐of‐the‐art business center to the thousands
of acres of land that are now used for cultural preservation or industrial and manufacturing park
developments, there are a wide range of opportunities for reuse. Twenty‐six states, three Tribal
Nations, and numerous local communities and governments have benefited economically, socially, or
culturally from these transfers.
Over the next decade, DOE expects to see additional opportunities to make more land and assets
available for potential reuse by local, state, tribal, or other federal agencies or by commercial businesses
and industries. Sites will evaluate opportunities, partnerships, and specific reuse options based on their
circumstances, missions, goals, and planning objectives. Although opportunities exist across the DOE
complex, the size and type of transfers will be site‐dependent, and not all sites anticipate large land
transfer opportunities in the near future. DOE expects existing and future land disposals and asset
transfers to continue to promote a more efficient business environment that makes its unique and
diverse mix of unneeded assets, facilities, land, and workforce more accessible.
DOE will continue to collaborate with local communities, local and state elected officials, stakeholders,
and Tribal Nations to improve its efficiency and effectiveness in identifying and transferring land and
assets in a timely manner. DOE remains committed to follow all applicable laws and regulations in the
land transfer process, including the National Environmental Policy Act, Endangered Species Act,
Comprehensive Environmental Response, Compensation and Liability Act, and the Atomic Energy Act.
DOE will continue with appropriate tribal consultations early in the process in compliance with DOE
Order 144.1, Department of Energy American Indian Tribal Government Interactions and Policy (2009),
and consistent with tribal rights, treaties, and accords, as appropriate. DOE will continue to examine its
land, facilities, infrastructure, equipment, technologies, and natural resources to seek new opportunities
for economic growth as it consolidates infrastructure, continues environmental cleanup, and improves
operations at sites across the country.

i
Attachment A. DOE Historical Land Trasnfers
Attachment A. DOE Historical Land Transfers10
Attachment A includes a list of compiled DOE historical land transfers that was used to support the data analysis in this report. While this is an
exhaustive list of transfers, it is not 100 percent complete. Some historical land records, especially for transfers in the late 1940s and early
1950s, are no longer available for referencing today. A cutoff date of 1956 was used for collecting and reporting transfer data (the initiation of
transfers), as that appeared to be the best date where the earliest reliable records were found. All transfers that were initiated prior to 1956 are
excluded from this data set, which also excludes the original land transfers in the late 1940s and early 1950s that created the cities of Richland,
WA; Los Alamos, NM; and Oak Ridge, TN. Finally, this list does not include the NPR and NOSR transfers, as they are included in Attachment B.
The following definitions, taken from the report, apply to Appendix A and Appendix B:
Property Name
The property name encompasses a wide range of conventions used by various sites over the years which includes: Property name of record on
deeds, quick claim deeds, or other legal documents if available; Latitude and Longitude designations of land areas; parcel designations or parcel
names given to land areas by DOE sites, local planning commissions, or local planning boards; local or commonly referenced names of parcels
where no official name of record can be found; naming conventions based on who the parcel was transferred to; or names referenced by the
facilities located on the land parcels (i.e. Fire Station #2, etc.). Each site used their discretion in the naming conventions used in this report to
provide the most easily recognizable name for the parcel or land area transferred.
Zoned/Planned Reuse at Time of Transfer
This column represents the variety of zoned or planned reuses for land transfers at the time of the transfer. In some cases over the decades
since the original transfer, reuse has changed while in other cases the original planned reuse is still valid today. In a very limited number of
cases (four of 209 transfers), successful land transfers have occurred, yet the land has not yet been redeveloped or reused. In each case, the
land has been zoned for future reuse and is listed under a reuse category of vacant/zoned. Below lists the 12 categories of reuse used in this
report:
10 Data sources used to compile this information include DOE’s Facilities Information Management System for more‐recent transfers, as well as historical transfer data provided by DOE Site Real Property Offices; site reviews of historical land, deed, and title transfer documentation, some spanning back almost 57 years; and information provided by CROs and the ECA

ii
Attachment A. DOE Historical Land Trasnfers
Commercial/Business Agriculture/Grazing Commercial/Light Industrial
Historic Preservation (includes native and
cultural preservation)
Wildlife Preservation/Timber Mixed Use (Commercial/Residential)
Energy (includes oil/mineral exploration,
alternative energy production, and
electrical distribution sites)
Parks/Recreation Industrial
Education Civic/Public Service Private Sale
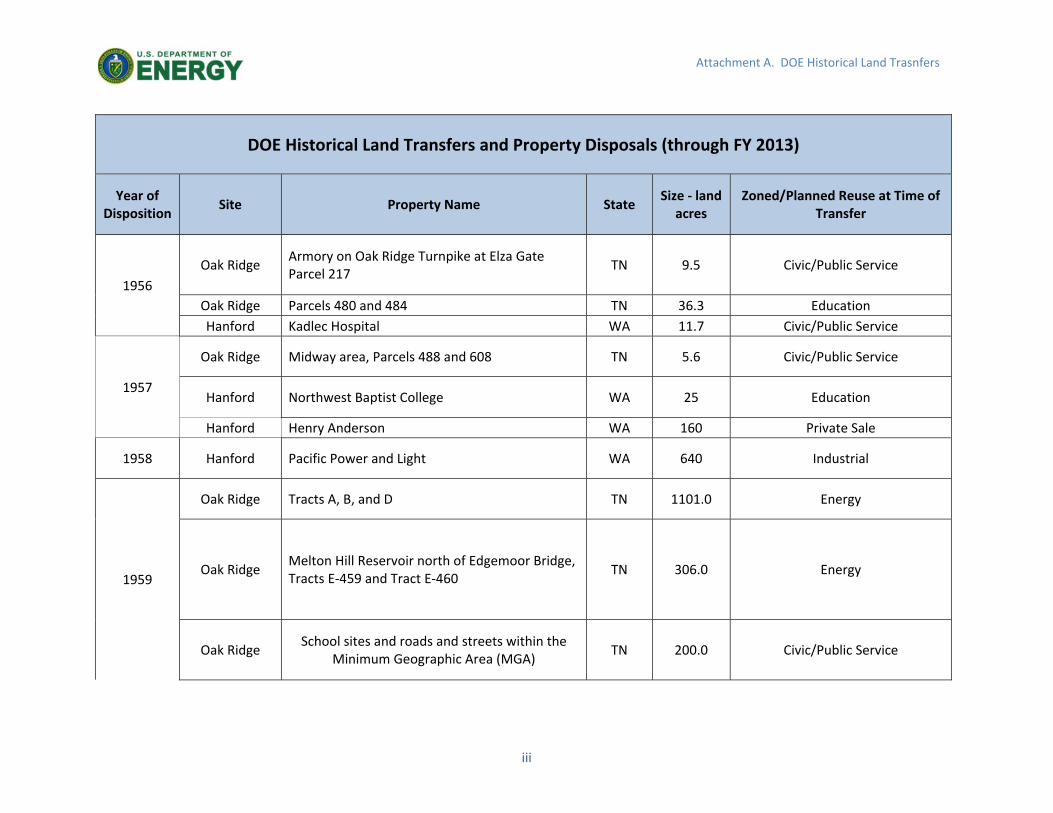
iii
Attachment A. DOE Historical Land Trasnfers
DOE Historical Land Transfers and Property Disposals (through FY 2013)
Year of Disposition
Site Property Name State Size ‐ land acres
Zoned/Planned Reuse at Time of Transfer
1956
Oak Ridge Armory on Oak Ridge Turnpike at Elza Gate Parcel 217
TN 9.5 Civic/Public Service
Oak Ridge Parcels 480 and 484 TN 36.3 Education
Hanford Kadlec Hospital WA 11.7 Civic/Public Service
1957
Oak Ridge Midway area, Parcels 488 and 608 TN 5.6 Civic/Public Service
Hanford Northwest Baptist College WA 25 Education
Hanford Henry Anderson WA 160 Private Sale
1958 Hanford Pacific Power and Light WA 640 Industrial
1959
Oak Ridge Tracts A, B, and D TN 1101.0 Energy
Oak Ridge Melton Hill Reservoir north of Edgemoor Bridge, Tracts E‐459 and Tract E‐460
TN 306.0 Energy
Oak Ridge School sites and roads and streets within the
Minimum Geographic Area (MGA) TN 200.0 Civic/Public Service
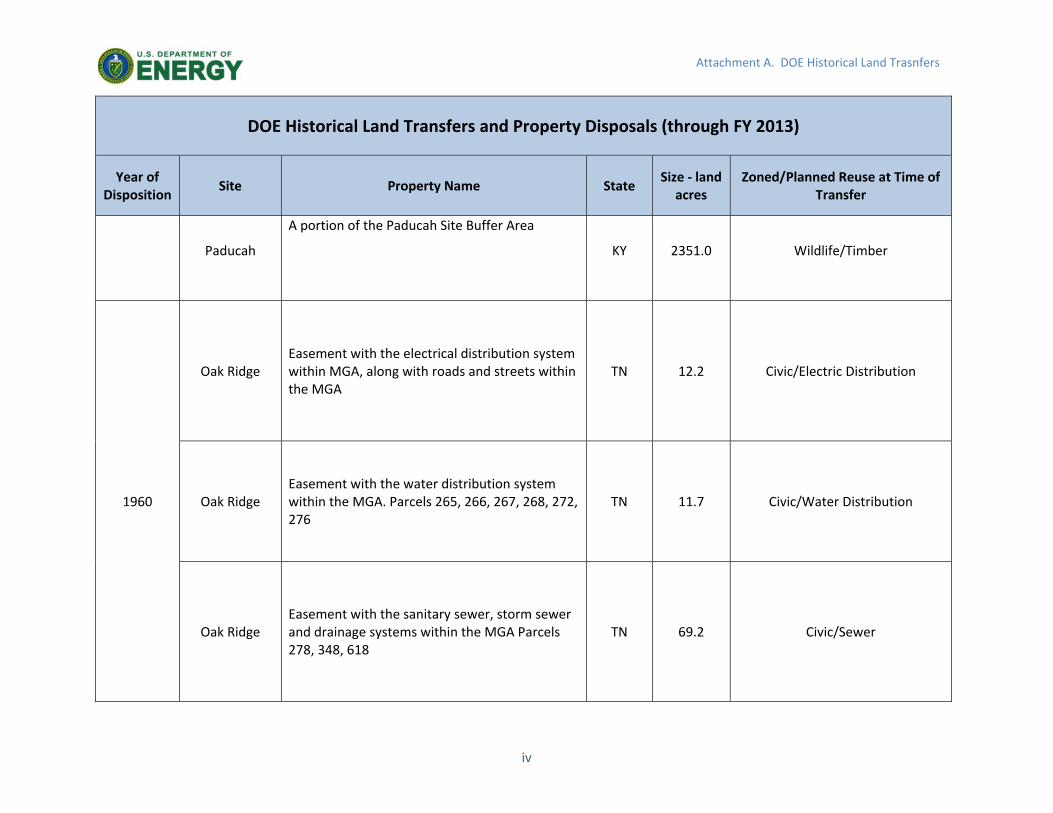
iv
Attachment A. DOE Historical Land Trasnfers
DOE Historical Land Transfers and Property Disposals (through FY 2013)
Year of Disposition
Site Property Name State Size ‐ land acres
Zoned/Planned Reuse at Time of Transfer
Paducah
A portion of the Paducah Site Buffer Area
KY 2351.0 Wildlife/Timber
1960
Oak Ridge Easement with the electrical distribution system within MGA, along with roads and streets within the MGA
TN 12.2 Civic/Electric Distribution
Oak Ridge Easement with the water distribution system within the MGA. Parcels 265, 266, 267, 268, 272, 276
TN 11.7 Civic/Water Distribution
Oak Ridge Easement with the sanitary sewer, storm sewer and drainage systems within the MGA Parcels 278, 348, 618
TN 69.2 Civic/Sewer

v
Attachment A. DOE Historical Land Trasnfers
DOE Historical Land Transfers and Property Disposals (through FY 2013)
Year of Disposition
Site Property Name State Size ‐ land acres
Zoned/Planned Reuse at Time of Transfer
Oak Ridge Municipal properties TN 400.0 Civic/Public Service
Oak Ridge Parcels 44, 66, 383, 384, 384A TN 13.6 Civic/ Hospital
Oak Ridge Union Valley Area TN 2377.9 Civic/Forestry and Agricultural
research, public park and recreation, line easement.
Oak Ridge Anderson County TN 18.9 Civic/Public Service
Hanford City Plat of Richland WA 236 Mixed‐Use Commercial/ Residential
1961 Oak Ridge Emory Valley School Site. TN 7.6 Civic/Hospital
1962
Oak Ridge Parcel 300 TN 50.5 Commercial/light industrial
Hanford Port of Benton / Airport WA 280 Civic/Airport
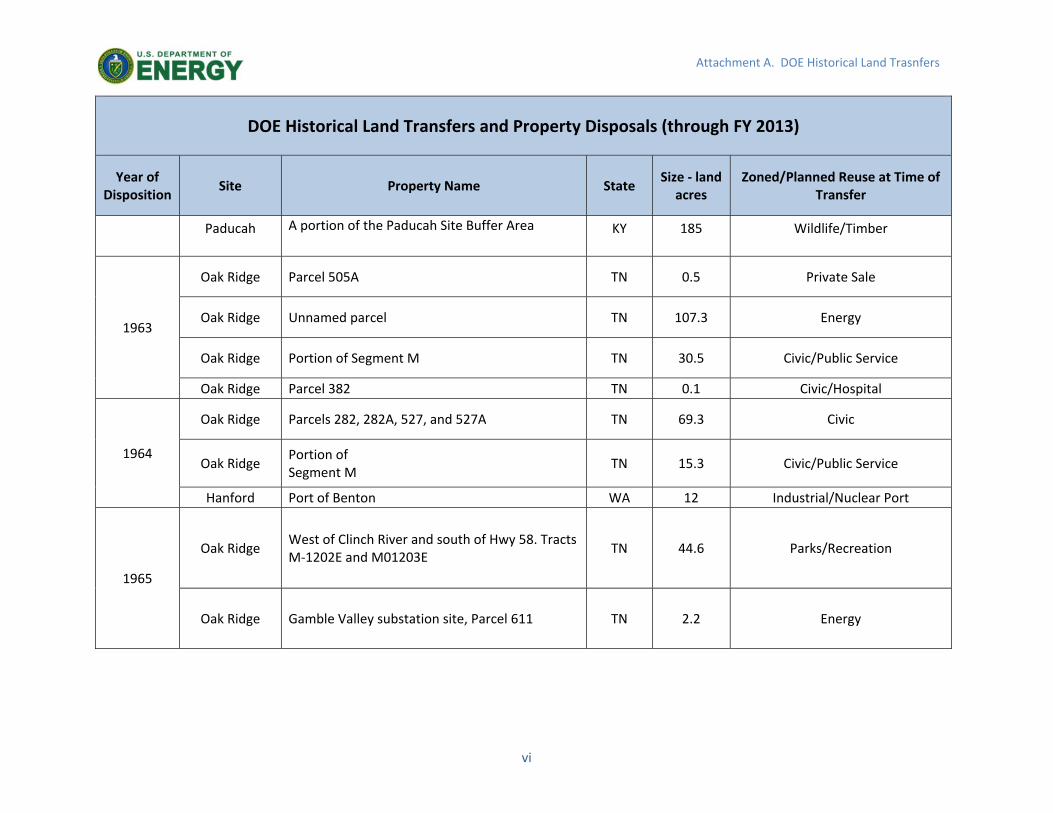
vi
Attachment A. DOE Historical Land Trasnfers
DOE Historical Land Transfers and Property Disposals (through FY 2013)
Year of Disposition
Site Property Name State Size ‐ land acres
Zoned/Planned Reuse at Time of Transfer
Paducah A portion of the Paducah Site Buffer Area KY 185 Wildlife/Timber
1963
Oak Ridge Parcel 505A TN 0.5 Private Sale
Oak Ridge Unnamed parcel TN 107.3 Energy
Oak Ridge Portion of Segment M TN 30.5 Civic/Public Service
Oak Ridge Parcel 382 TN 0.1 Civic/Hospital
1964
Oak Ridge Parcels 282, 282A, 527, and 527A TN 69.3 Civic
Oak Ridge Portion of Segment M
TN 15.3 Civic/Public Service
Hanford Port of Benton WA 12 Industrial/Nuclear Port
1965
Oak Ridge West of Clinch River and south of Hwy 58. Tracts M‐1202E and M01203E
TN 44.6 Parks/Recreation
Oak Ridge Gamble Valley substation site, Parcel 611 TN 2.2 Energy

vii
Attachment A. DOE Historical Land Trasnfers
DOE Historical Land Transfers and Property Disposals (through FY 2013)
Year of Disposition
Site Property Name State Size ‐ land acres
Zoned/Planned Reuse at Time of Transfer
Oak Ridge Parcel 234 to Ada R. Patchell, 232 to Carl L. Hagaman, Jr., 231 to Anco Supply Company
TN 1.6 Private Sale
Oak Ridge Blair railroad spur TN 28.8 Commercial/Light Industrial
Oak Ridge Federal office building, Parcel 279A TN 24.1 Civic/Public Service
Hanford City of Richland (west of Stevens Drive) WA 6,000 Mixed‐Use Commercial/ Residential
1966
Oak Ridge Midway Area, Parcel 490 TN 2.1 Civic/Public Service
Oak Ridge Parcel to Robert Tool, et al. TN 1.3 Private Sale
Oak Ridge UT Biomedical Graduate School TN 5.3 Education
Oak Ridge T.R. Lemons Parcel 4, and Claude Wilson Parcel 3
TN 7.5 Private Sale
Oak Ridge Junior High School Site TN 39.0 Education
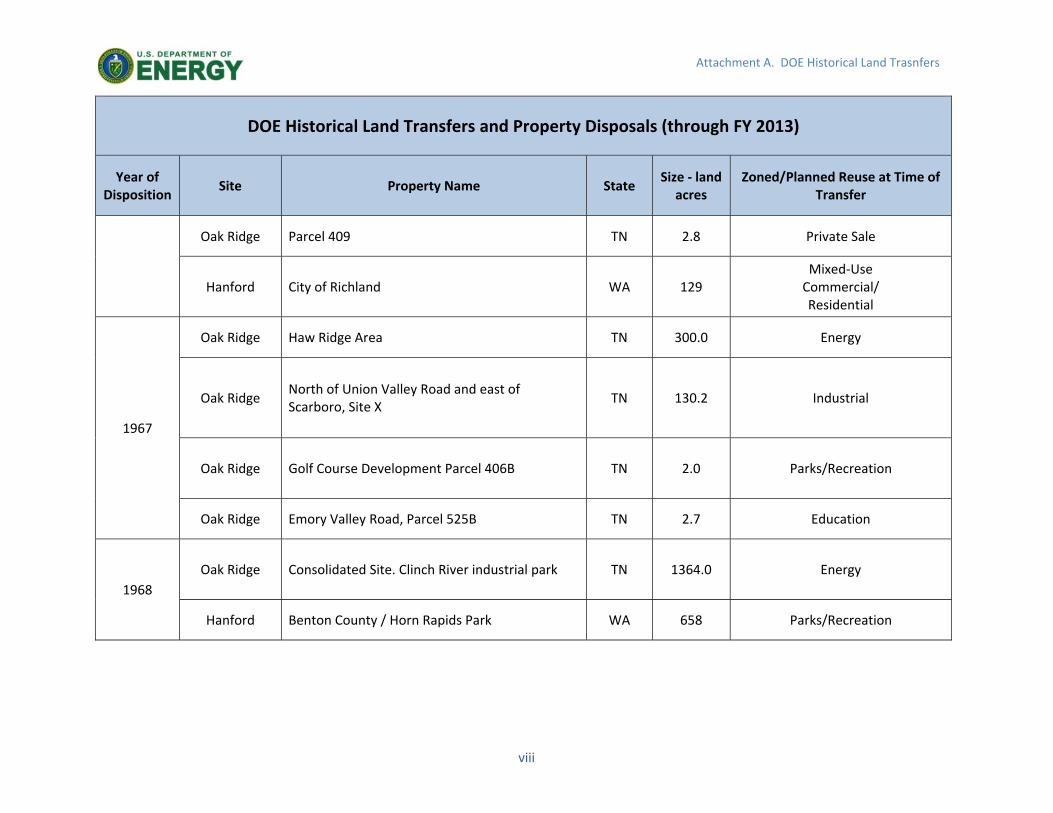
viii
Attachment A. DOE Historical Land Trasnfers
DOE Historical Land Transfers and Property Disposals (through FY 2013)
Year of Disposition
Site Property Name State Size ‐ land acres
Zoned/Planned Reuse at Time of Transfer
Oak Ridge Parcel 409 TN 2.8 Private Sale
Hanford City of Richland WA 129 Mixed‐Use Commercial/ Residential
1967
Oak Ridge Haw Ridge Area TN 300.0 Energy
Oak Ridge North of Union Valley Road and east of Scarboro, Site X
TN 130.2 Industrial
Oak Ridge Golf Course Development Parcel 406B TN 2.0 Parks/Recreation
Oak Ridge Emory Valley Road, Parcel 525B TN 2.7 Education
1968
Oak Ridge Consolidated Site. Clinch River industrial park TN 1364.0 Energy
Hanford Benton County / Horn Rapids Park WA 658 Parks/Recreation

ix
Attachment A. DOE Historical Land Trasnfers
DOE Historical Land Transfers and Property Disposals (through FY 2013)
Year of Disposition
Site Property Name State Size ‐ land acres
Zoned/Planned Reuse at Time of Transfer
1969
Oak Ridge Fire station between Laboratory and Fairbanks Roads. Parcel 584A
TN 0.9 Civic/Fire Station
Hanford City of Richland / library WA 3.4 Civic
1970
Savannah River Site
(Tract A) Eastern boundary of SRS, Barnwell County
SC 1586 Industrial
Savannah River Site
(Tract B) Eastern boundary of SRS, Barnwell County
SC 900 Industrial
Hanford Barker Family WA 3 Private Sale
1971 Oak Ridge Federal office building parking lot, Parcel 279 TN 3.4 Civic/Public Service
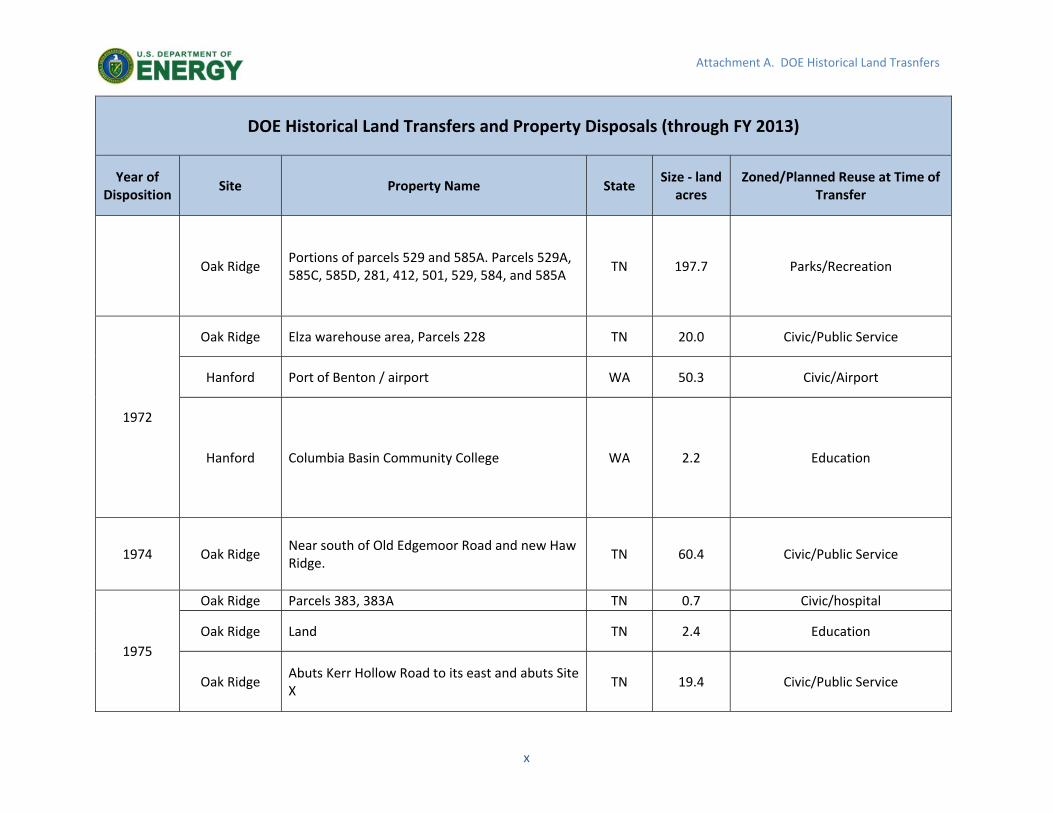
x
Attachment A. DOE Historical Land Trasnfers
DOE Historical Land Transfers and Property Disposals (through FY 2013)
Year of Disposition
Site Property Name State Size ‐ land acres
Zoned/Planned Reuse at Time of Transfer
Oak Ridge Portions of parcels 529 and 585A. Parcels 529A, 585C, 585D, 281, 412, 501, 529, 584, and 585A
TN 197.7 Parks/Recreation
1972
Oak Ridge Elza warehouse area, Parcels 228 TN 20.0 Civic/Public Service
Hanford Port of Benton / airport WA 50.3 Civic/Airport
Hanford Columbia Basin Community College WA 2.2 Education
1974 Oak Ridge Near south of Old Edgemoor Road and new Haw Ridge.
TN 60.4 Civic/Public Service
1975
Oak Ridge Parcels 383, 383A TN 0.7 Civic/hospital
Oak Ridge Land TN 2.4 Education
Oak Ridge Abuts Kerr Hollow Road to its east and abuts Site X
TN 19.4 Civic/Public Service

xi
Attachment A. DOE Historical Land Trasnfers
DOE Historical Land Transfers and Property Disposals (through FY 2013)
Year of Disposition
Site Property Name State Size ‐ land acres
Zoned/Planned Reuse at Time of Transfer
Hanford Port of Benton / Airport WA 85 Civic/Airport
1977 Hanford Port of Benton / Railroad WA 10.6 Industrial
1978
Idaho National
Engineering Laboratory (INEL)11
Eastern portion of INEL ID 2555 Agriculture/Grazing
Oak Ridge Land TN 9.7 Education
Oak Ridge Farm tract TN 18.5 Energy
Oak Ridge Roane substation site. Tract #RNSS‐1, ‐2 and ‐3 TN 55.3 Energy
1980 Hanford Washington State Department of Ecology WA 640 Industrial
1982 Oak Ridge Land TN 0.4 Civic/Hospital
11 Now INL
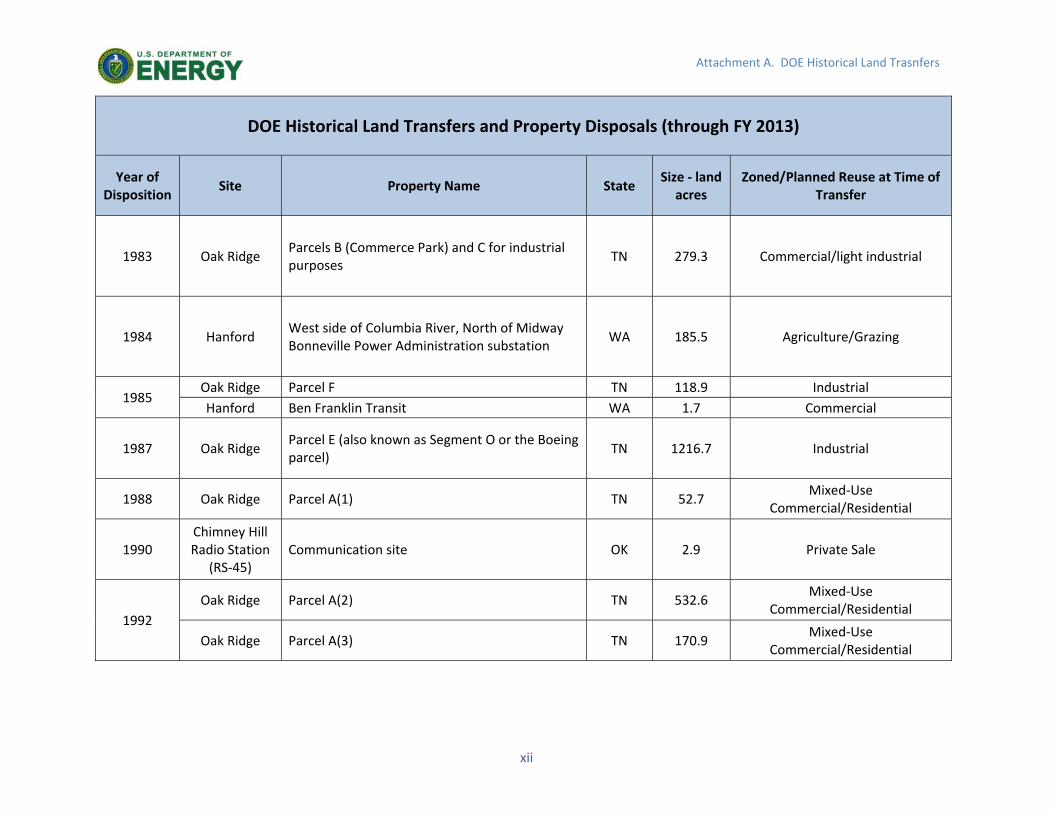
xii
Attachment A. DOE Historical Land Trasnfers
DOE Historical Land Transfers and Property Disposals (through FY 2013)
Year of Disposition
Site Property Name State Size ‐ land acres
Zoned/Planned Reuse at Time of Transfer
1983 Oak Ridge Parcels B (Commerce Park) and C for industrial purposes
TN 279.3 Commercial/light industrial
1984 Hanford West side of Columbia River, North of Midway Bonneville Power Administration substation
WA 185.5 Agriculture/Grazing
1985 Oak Ridge Parcel F TN 118.9 Industrial
Hanford Ben Franklin Transit WA 1.7 Commercial
1987 Oak Ridge Parcel E (also known as Segment O or the Boeing parcel)
TN 1216.7 Industrial
1988 Oak Ridge Parcel A(1) TN 52.7 Mixed‐Use
Commercial/Residential
1990 Chimney Hill Radio Station
(RS‐45) Communication site OK 2.9 Private Sale
1992
Oak Ridge Parcel A(2) TN 532.6 Mixed‐Use
Commercial/Residential
Oak Ridge Parcel A(3) TN 170.9 Mixed‐Use
Commercial/Residential
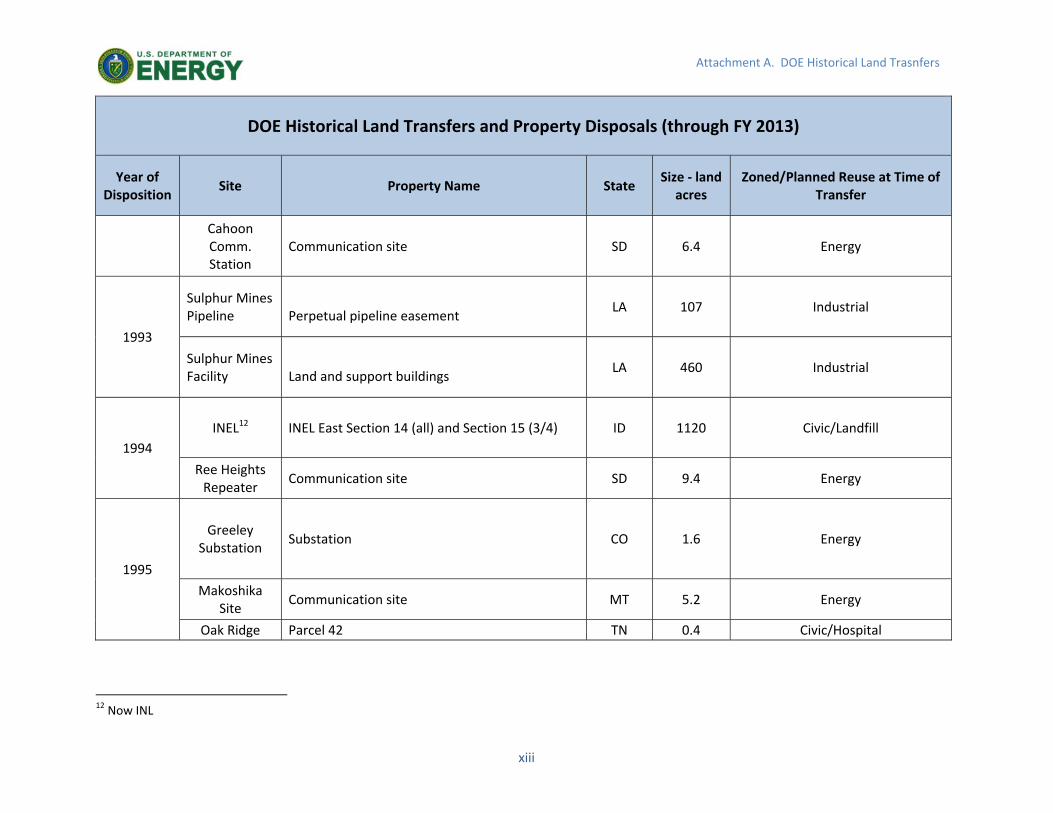
xiii
Attachment A. DOE Historical Land Trasnfers
DOE Historical Land Transfers and Property Disposals (through FY 2013)
Year of Disposition
Site Property Name State Size ‐ land acres
Zoned/Planned Reuse at Time of Transfer
Cahoon Comm. Station
Communication site SD 6.4 Energy
1993
Sulphur Mines Pipeline
Perpetual pipeline easement
LA 107 Industrial
Sulphur Mines Facility
Land and support buildings
LA 460 Industrial
1994
INEL12 INEL East Section 14 (all) and Section 15 (3/4) ID 1120 Civic/Landfill
Ree Heights Repeater
Communication site SD 9.4 Energy
1995
Greeley Substation
Substation CO 1.6 Energy
Makoshika Site
Communication site MT 5.2 Energy
Oak Ridge Parcel 42 TN 0.4 Civic/Hospital
12 Now INL

xiv
Attachment A. DOE Historical Land Trasnfers
DOE Historical Land Transfers and Property Disposals (through FY 2013)
Year of Disposition
Site Property Name State Size ‐ land acres
Zoned/Planned Reuse at Time of Transfer
Addison Road Addison Rd. property TX 0.8 Private Sale
Wheatland Road
Wheatland Rd. property TX 26.0 Private Sale
Hanford Port of Benton 3000 Area WA 71 Industrial
1996
Oxnard Forging Facility
Entire site CA 14 Commercial/Light Industrial
Western Technology
Office Land and Property MT 53.2 Commercial/Light Industrial
1997
Eklutna Hydroelectric
Plant Entire site and power plant AK 853 Energy
INEL INEL East Section 15 (remaining 1/4) ID 160 Civic/Landfill

xv
Attachment A. DOE Historical Land Trasnfers
DOE Historical Land Transfers and Property Disposals (through FY 2013)
Year of Disposition
Site Property Name State Size ‐ land acres
Zoned/Planned Reuse at Time of Transfer
Weeks Island Pipeline
Pipeline easement LA 366 Industrial
LANL 2 Apartment Bldgs NM 1.9 Educational
1998
Snettisham Hydroelectric
Plant Entire site and power plant AK 2,671 Energy
Mesa Substation
Substation AZ 4 Commercial/Shopping Center
Pinellas Entire site FL 100 Commercial/Light Industrial
LANL Fire Stations #3, 4, and 6 NM 5.5 Civic/Fire Station
Oak Ridge Oak Ridge Office Barracks, Parcels 287, 370, 380 TN 3.5 Civic/Hospital
Hanford 1100 Area Transfer at Hanford WA 776 Industrial
Hanford Railroad Right of Way Transfer – South Horn Rapids Road at Hanford
WA 92 Industrial
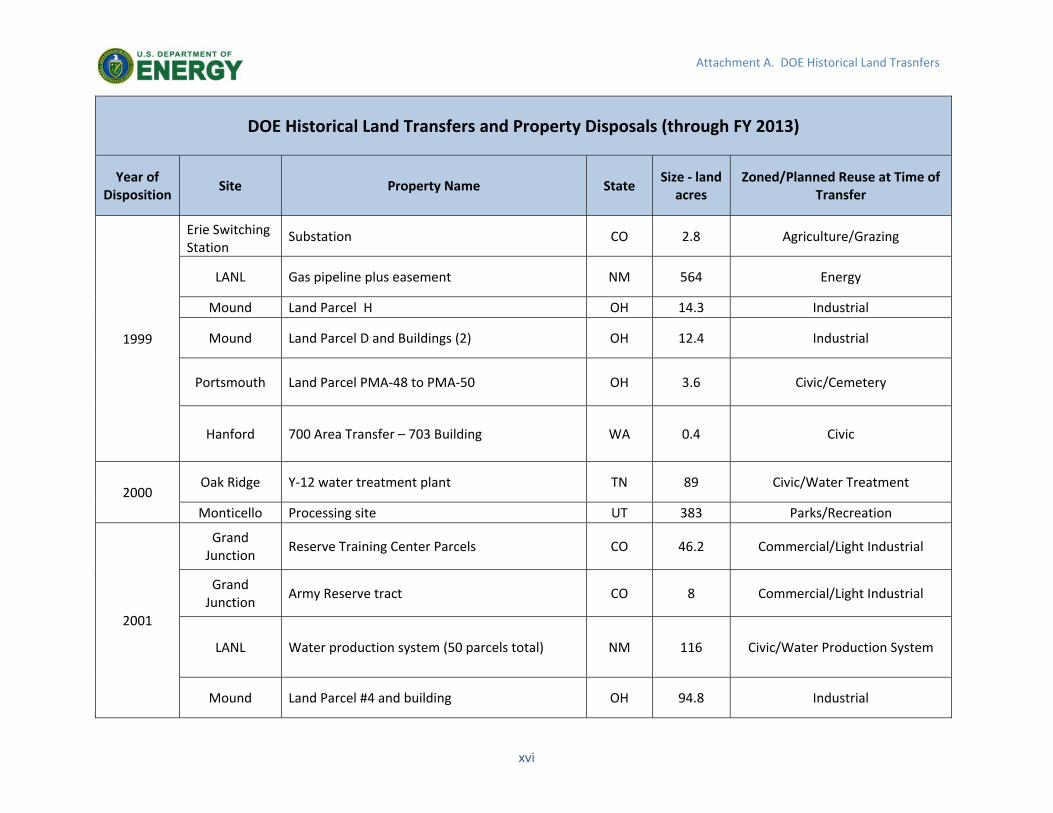
xvi
Attachment A. DOE Historical Land Trasnfers
DOE Historical Land Transfers and Property Disposals (through FY 2013)
Year of Disposition
Site Property Name State Size ‐ land acres
Zoned/Planned Reuse at Time of Transfer
1999
Erie Switching Station
Substation CO 2.8 Agriculture/Grazing
LANL Gas pipeline plus easement NM 564 Energy
Mound Land Parcel H OH 14.3 Industrial
Mound Land Parcel D and Buildings (2) OH 12.4 Industrial
Portsmouth Land Parcel PMA‐48 to PMA‐50 OH 3.6 Civic/Cemetery
Hanford 700 Area Transfer – 703 Building WA 0.4 Civic
2000 Oak Ridge Y‐12 water treatment plant TN 89 Civic/Water Treatment
Monticello Processing site UT 383 Parks/Recreation
2001
Grand Junction
Reserve Training Center Parcels CO 46.2 Commercial/Light Industrial
Grand Junction
Army Reserve tract CO 8 Commercial/Light Industrial
LANL Water production system (50 parcels total) NM 116 Civic/Water Production System
Mound Land Parcel #4 and building OH 94.8 Industrial

xvii
Attachment A. DOE Historical Land Trasnfers
DOE Historical Land Transfers and Property Disposals (through FY 2013)
Year of Disposition
Site Property Name State Size ‐ land acres
Zoned/Planned Reuse at Time of Transfer
Sulphur Mines Brine Disposal
Well Entire site LA 68 Industrial
NETL NIPER Entire site OK 15.7 Vacant/Zoned Commercial/Light
Industrial
Oak Ridge Oak Ridge Office Boeing Flood Plain TN 182.0 Mixed‐Use
Commercial/Residential
Oak Ridge Land TN 6.6 Education
Hanford 700 Area Partial Transfer – Building 747 and Parking Area
WA 1.7 Industrial
2002
LANL Land Conveyance and Transfer (LC&T) Tract A‐9 (DP Road‐2 (North))
NM 4.2 Mixed‐Use Commercial/ Residential
LANL LC&T Tract A‐19 (White Rock‐1) NM 74.9 Mixed‐Use Commercial/ Residential
LANL LC&T Tract A‐12 (LAAO‐1 (East)) NM 4.4 Mixed‐Use Commercial/ Residential
LANL Manhattan Monument (Tract A‐1)
NM 0.04 Historic Preservation

xviii
Attachment A. DOE Historical Land Trasnfers
DOE Historical Land Transfers and Property Disposals (through FY 2013)
Year of Disposition
Site Property Name State Size ‐ land acres
Zoned/Planned Reuse at Time of Transfer
LANL LC&T Tract A‐2 (Site 22) NM 0.2 Commercial/parking lot
LANL LC&T Tract A‐3 (Airport‐1 [East]) NM 9.4 Commercial/Entrada Business
Park
LANL LC&T Tract A‐17(TA‐74‐1 (West)) NM 5.5 Civic/
Wastewater Treatment Plant
LANL Tract B‐1 (Whiterock‐2) NM 14.9 Historic Preservation
LANL LC&T Tract B‐2 (TA‐74‐3 (North)) NM 2088 Historic Preservation
LANL LC&T Tract A‐6 (Airport‐4 (West)) NM 4.2 Parks/Recreation
Mound Land Parcel #3 and building OH 4.8 Industrial
Oak Ridge Land TN 1.7 Civic/Public Service
Hanford Excess to GSA – Vacated Railroad Right of Way in downtown Richland, Washington
WA 0.7 Industrial
2003 Oak Ridge ED‐1 Vacant land TN 491.3 Commercial/Light Industrial

xix
Attachment A. DOE Historical Land Trasnfers
DOE Historical Land Transfers and Property Disposals (through FY 2013)
Year of Disposition
Site Property Name State Size ‐ land acres
Zoned/Planned Reuse at Time of Transfer
2004 Belden
Substation Substation NE 1.6 Energy
2005
Maricopa Substation
Substation AZ 3.1 Energy
Pueblo West Substation
Substation CO 19.9 Parks/Recreation
Loveland Substation
Substation CO 0.3 Mixed‐Use Commercial/ Residential
Boulder City Substation #1
Substation NV 2.6 Energy
LANL LC&T Tract A‐7 (Airport‐5 (Central)) NM 5.8 Commercial
LANL LC&T Tract A‐5‐1 (Airport‐3 (South‐1)) NM 32.3 Commercial
LANL LC&T Tract A‐15‐1 (TA‐21 [West]) NM 7.5 Civic/
Income Property
LANL Fire Station #2 NM 1.6 Civic/Fire Station
Oak Ridge K‐1007, office building TN 2.3 Commercial/
Heritage Center
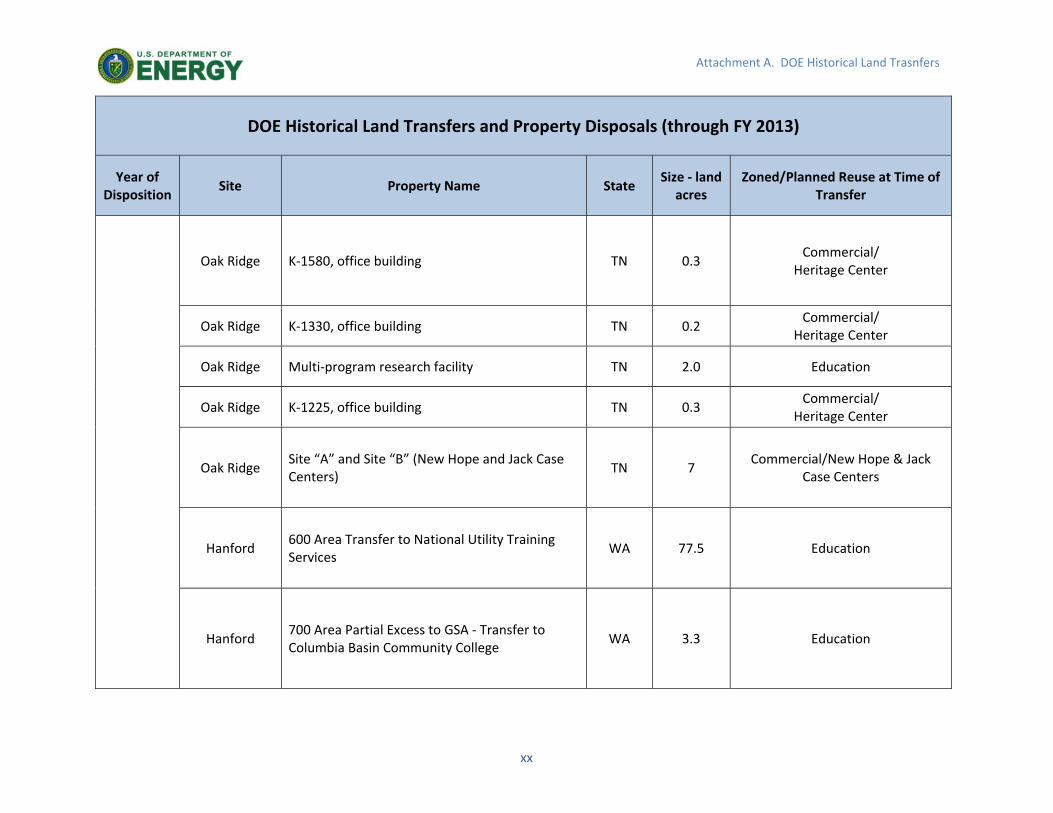
xx
Attachment A. DOE Historical Land Trasnfers
DOE Historical Land Transfers and Property Disposals (through FY 2013)
Year of Disposition
Site Property Name State Size ‐ land acres
Zoned/Planned Reuse at Time of Transfer
Oak Ridge K‐1580, office building TN 0.3 Commercial/
Heritage Center
Oak Ridge K‐1330, office building TN 0.2 Commercial/
Heritage Center
Oak Ridge Multi‐program research facility TN 2.0 Education
Oak Ridge K‐1225, office building TN 0.3 Commercial/
Heritage Center
Oak Ridge Site “A” and Site “B” (New Hope and Jack Case Centers)
TN 7 Commercial/New Hope & Jack
Case Centers
Hanford 600 Area Transfer to National Utility Training Services
WA 77.5 Education
Hanford 700 Area Partial Excess to GSA ‐ Transfer to Columbia Basin Community College
WA 3.3 Education

xxi
Attachment A. DOE Historical Land Trasnfers
DOE Historical Land Transfers and Property Disposals (through FY 2013)
Year of Disposition
Site Property Name State Size ‐ land acres
Zoned/Planned Reuse at Time of Transfer
2006
Tupelo Maintenance
Building Maintenance Building OK 7.7 Education
Oak Ridge Parcel 445/55 Jefferson Building TN 3.4 Civic/Boys Club
Oak Ridge Vance Road Facility TN 3.8 Civic/Hospital
Oak Ridge JIBS/JINS Sites TN 3 Education
Oak Ridge K‐1400, office building TN 0.2 Commercial/
Heritage Center
Oak Ridge K‐1036, Warehouse TN 2.9 Industrial/
Heritage Center
Hanford 700 Area Transfer to GSA WA 9.2 Civic/Federal Use
2007
Rocky Flats Environmental Technology Site CO 4000 Wildlife/Timber
Wayne Entire site NJ 7 Vacant/Zoned Parks/Recreation
LANL LC&T Tract A‐8a (DP Road‐1 [South]) NM 21.7 Mixed Use ‐ Commercial/ Residential
Oak Ridge ED‐5 East, Vacant land TN 17.7 Commercial/Light Industrial
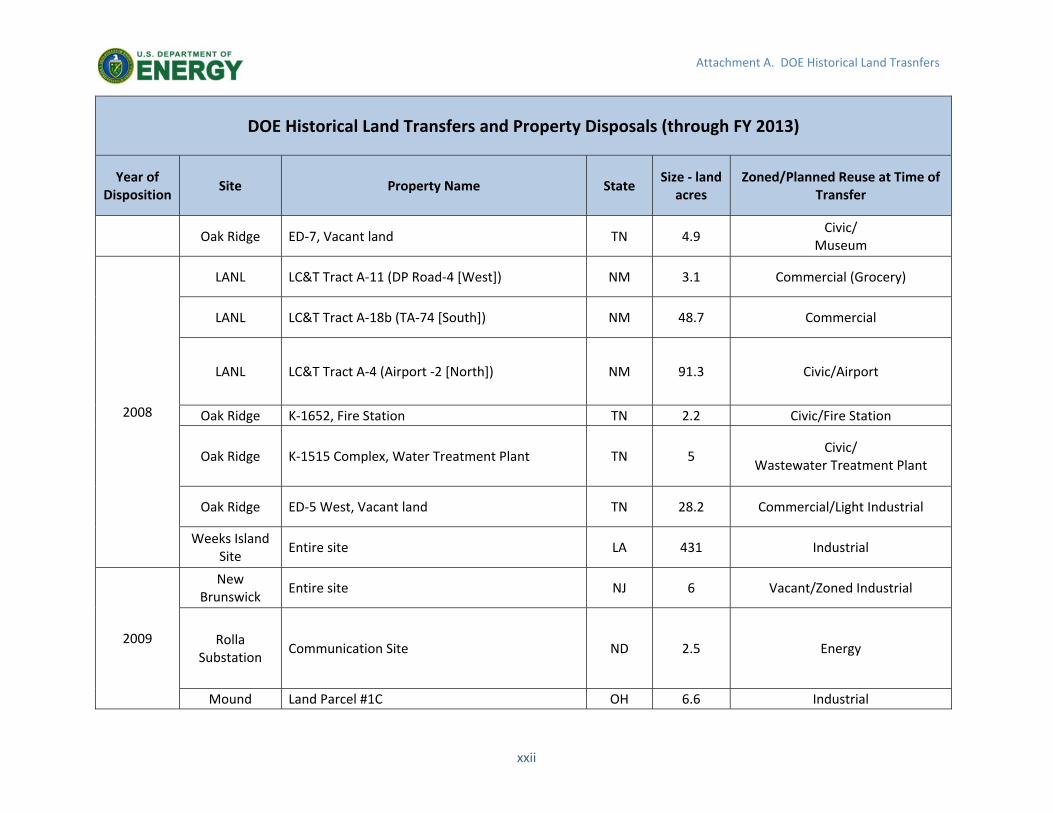
xxii
Attachment A. DOE Historical Land Trasnfers
DOE Historical Land Transfers and Property Disposals (through FY 2013)
Year of Disposition
Site Property Name State Size ‐ land acres
Zoned/Planned Reuse at Time of Transfer
Oak Ridge ED‐7, Vacant land TN 4.9 Civic/
Museum
2008
LANL LC&T Tract A‐11 (DP Road‐4 [West]) NM 3.1 Commercial (Grocery)
LANL LC&T Tract A‐18b (TA‐74 [South]) NM 48.7 Commercial
LANL LC&T Tract A‐4 (Airport ‐2 [North]) NM 91.3 Civic/Airport
Oak Ridge K‐1652, Fire Station TN 2.2 Civic/Fire Station
Oak Ridge K‐1515 Complex, Water Treatment Plant TN 5 Civic/
Wastewater Treatment Plant
Oak Ridge ED‐5 West, Vacant land TN 28.2 Commercial/Light Industrial
Weeks Island Site
Entire site LA 431 Industrial
2009
New Brunswick
Entire site NJ 6 Vacant/Zoned Industrial
Rolla Substation
Communication Site ND 2.5 Energy
Mound Land Parcel #1C OH 6.6 Industrial

xxiii
Attachment A. DOE Historical Land Trasnfers
DOE Historical Land Transfers and Property Disposals (through FY 2013)
Year of Disposition
Site Property Name State Size ‐ land acres
Zoned/Planned Reuse at Time of Transfer
Mound Land Parcel Phase #1A and building OH 2.5 Industrial
Mound Land Parcel Phase #1A and building OH 42.9 Industrial
Oak Ridge K‐1000, Visitor Center TN 0.1 Commercial/
Heritage Center
Oak Ridge K‐1501‐H+L, Maintenance Shop TN 0.1 Commercial/Light Industrial
Oak Ridge ED‐4, Vacant land TN 14 Commercial/Light Industrial
Oak Ridge K‐1008‐F, Office building TN 0.3 Commercial/ Heritage
2010
Grand Junction
Black Bridge Parcel CO 5 Commercial/Light Industrial
Salmon Entire site MS 1470 Wildlife/Timber
LANL LC&T Tract A‐13 LAAO‐2 (West) NM 8.8 Mixed Use ‐ Commercial/ Residential
LANL LC&T Tract C‐1 (White Rock) NM 15.4 Civic/Roadway
Oak Ridge ED‐8, Vacant land TN 77.8 Commercial/Light Industrial
Oak Ridge K‐792/791‐B/796‐A, Land and buildings TN 19.9 Commercial/Light Industrial
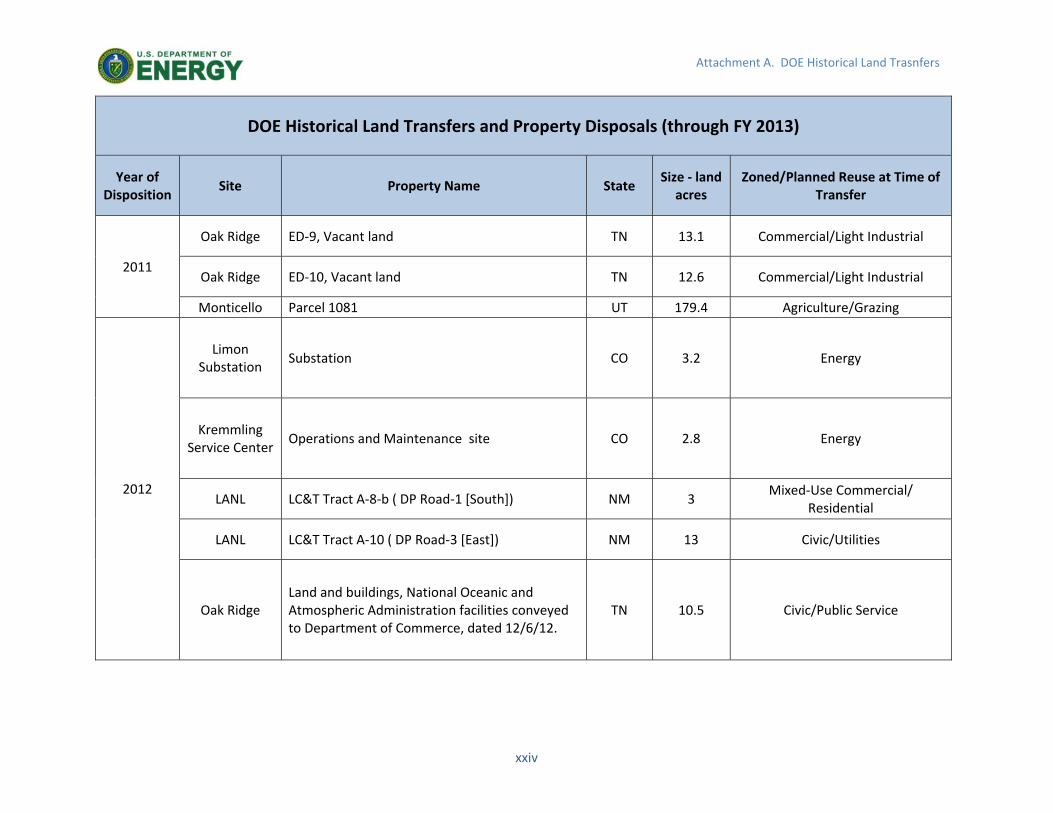
xxiv
Attachment A. DOE Historical Land Trasnfers
DOE Historical Land Transfers and Property Disposals (through FY 2013)
Year of Disposition
Site Property Name State Size ‐ land acres
Zoned/Planned Reuse at Time of Transfer
2011
Oak Ridge ED‐9, Vacant land TN 13.1 Commercial/Light Industrial
Oak Ridge ED‐10, Vacant land TN 12.6 Commercial/Light Industrial
Monticello Parcel 1081 UT 179.4 Agriculture/Grazing
2012
Limon Substation
Substation CO 3.2 Energy
Kremmling Service Center
Operations and Maintenance site CO 2.8 Energy
LANL LC&T Tract A‐8‐b ( DP Road‐1 [South]) NM 3 Mixed‐Use Commercial/
Residential
LANL LC&T Tract A‐10 ( DP Road‐3 [East]) NM 13 Civic/Utilities
Oak Ridge Land and buildings, National Oceanic and Atmospheric Administration facilities conveyed to Department of Commerce, dated 12/6/12.
TN 10.5 Civic/Public Service

xxv
Attachment A. DOE Historical Land Trasnfers
DOE Historical Land Transfers and Property Disposals (through FY 2013)
Year of Disposition
Site Property Name State Size ‐ land acres
Zoned/Planned Reuse at Time of Transfer
Cannonsburg Parcel 117 PA 0.4 Vacant/Zoned Commercial/Light
Industrial
2013
Winesburgh Radio Station
(RS‐58) Communication site AR 0.8 Private Sale
Sulphur Rock Radio Station
(RS‐57) Communication site AR 2.5 Civic/EMS Use
Crane Radio Station (RS‐
46) Communication site MO 4.7 Private Sale
Jenkins Radio Station (RS‐
47) Communication site MO 5.2 Private Sale
Inhalation Toxicology Lab
(Lovelace Respiratory Research Institute)
Laboratory and land NM 137 Commercial/Light Industrial
LANL LC&T Tract B‐3 (Little Otowi) NM 3.4 Historic Preservation

xxvi
Attachment A. DOE Historical Land Trasnfers
DOE Historical Land Transfers and Property Disposals (through FY 2013)
Year of Disposition
Site Property Name State Size ‐ land acres
Zoned/Planned Reuse at Time of Transfer
Lamar Radio Station (RS‐
RS‐52) Communication site OK 4.7 Private Sale
Total Transfers: 202 Total Acres: 44,421.3
* Excludes original land transfers in the late 1940s and early 1950s that created the cities of Richland, WA; Los Alamos, NM; and Oak Ridge, TN.
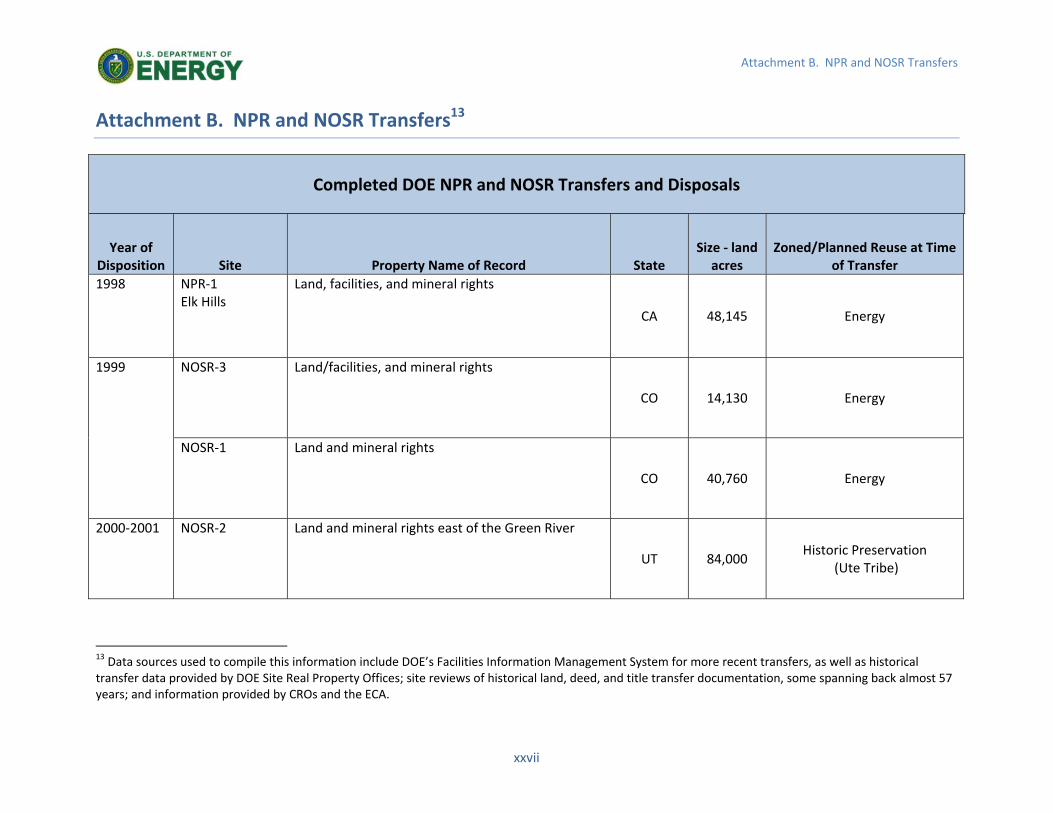
xxvii
Attachment B. NPR and NOSR Transfers
Attachment B. NPR and NOSR Transfers13
Completed DOE NPR and NOSR Transfers and Disposals
Year of Disposition Site Property Name of Record State
Size ‐ land acres
Zoned/Planned Reuse at Time of Transfer
1998 NPR‐1 Elk Hills
Land, facilities, and mineral rights
CA 48,145 Energy
1999 NOSR‐3 Land/facilities, and mineral rights
CO 14,130 Energy
NOSR‐1 Land and mineral rights
CO 40,760 Energy
2000‐2001 NOSR‐2 Land and mineral rights east of the Green River
UT 84,000 Historic Preservation
(Ute Tribe)
13 Data sources used to compile this information include DOE’s Facilities Information Management System for more recent transfers, as well as historical transfer data provided by DOE Site Real Property Offices; site reviews of historical land, deed, and title transfer documentation, some spanning back almost 57 years; and information provided by CROs and the ECA.
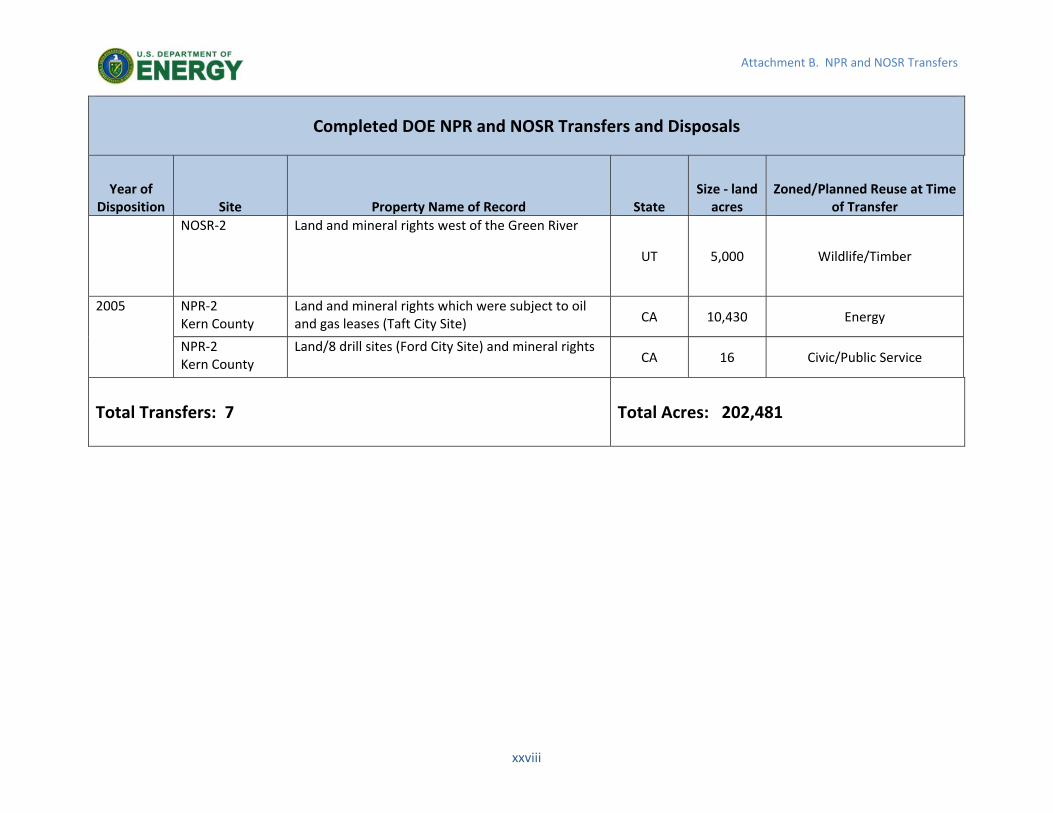
xxviii
Attachment B. NPR and NOSR Transfers
Completed DOE NPR and NOSR Transfers and Disposals
Year of Disposition Site Property Name of Record State
Size ‐ land acres
Zoned/Planned Reuse at Time of Transfer
NOSR‐2 Land and mineral rights west of the Green River
UT 5,000 Wildlife/Timber
2005 NPR‐2 Kern County
Land and mineral rights which were subject to oil and gas leases (Taft City Site) CA 10,430 Energy
NPR‐2 Kern County
Land/8 drill sites (Ford City Site) and mineral rights CA 16 Civic/Public Service
Total Transfers: 7
Total Acres: 202,481

xxix
Attachment C. List of Acronyms
Attachment C. List of Acronyms
AEA Atomic Energy Act of 1954 AEC Atomic Energy Commission AECA Atomic Energy Community Act BLM Bureau of Land Management CA California CFR Code of Federal Regulations CO Colorado CRO Community Reuse Organization CROET Community Reuse Organization of Eastern Tennessee DOE U.S. Department of Energy DOI U.S. Department of Interior ECA Energy Communities Alliance EM Office of Environmental Management ETTP East Tennessee Technology Park FY Fiscal Year FL Florida GSA General Services Administration INL Idaho National Laboratory JIBS Joint Institute for Biological Sciences JINS Joint Institute for Neutron Sciences LANL Los Alamos National Laboratory LC&T Land Conveyance and Transfer LEED Leadership in Energy and Environmental Design MDC Mound Development Corporation MGA Minimum Geographic Area MS Mississippi NETL National Energy Technology Laboratory NIPER National Institute for Petroleum and Energy Research NJ New Jersey NDAA National Defense Authorization Act NM New Mexico NWRA National Wildlife Refuge Act NNSA National Nuclear Security Administration NPR Naval Petroleum Reserves NOSR Naval Oil Shale Reserves OH Ohio OK Oklahoma PA Pennsylvania PACRO Paducah Community Reuse Organization P.L. Public Law SC South Carolina SPR Strategic Petroleum Reserve SRS Savannah River Site STAR Science, Technology, and Research TN Tennessee U.S.C. United States Code UT Utah
xxx
Attachment C. List of Acronyms
WA Washington Y‐12 Y‐12 National Security Complex
Asset Revitalization Initiative
For questions and comments, please email [email protected]
www.energy.gov/ari