reviewer #1 - atmos-chem-phys-discuss.net · reviewer #1: the authors would ... the science of the...
TRANSCRIPT
Reviewer #1: The authors would like to thank the reviewers for spending time and effort reviewing this manuscript. Their comments are deeply appreciated and have resulted in an improved version of the manuscript. Below we address point by point all the comments and recommendations of the reviewers, and at the end of the document there is the new version of the paper with the changes highlighted in blue. Summary: This paper assess the impact of heavy precipitation on GPS radio occultation measurements through comparison of RO profiles within the precipitation and without precipitation as indicated by the satellite radar observations. Systematic positive refractivity errors (or N-biases) above ~2.5 km are shown in GPS RO soundings in the presence of precipitation, when comparing to two analyses (ECMWF, GFS) and one reanalysis (ERA-I). The results is consistent with multiple previous studies by Lin et al. (2010), Yang and Zou (2012), Xou et al., (2012) and Yang and Zou (2016). However, these previous studies attribute such positive N-bias to the GPS RO sounding retrievals for neglecting the RO refractivity contribution from liquid and ice water contents. In contrast, this paper attributes the N-biases to the possible deficiency in global analyses/reanalysis under high specific humidity condition (including both rain and no-rain). The simulation studies were carried out to investigate the contribution of the liquid/ice water content by ray tracing through a 3-D atmosphere with realistic liquid/ice water content estimated from TRMM. The particle size distribution N(D) are adapted from the one used in TRMM radar precipitation retrieval. The simulation study of 65 cases confirms that the liquid/ice water content do not introduce significant bias to the RO retrieval. Further analysis of the N-bias with respect to the specific humidity shows good correlation with the high specific humidity instead of the precipitation. Overall, the paper is well written. The science of the paper is significant and it advances our understanding of the liquid/ice water content on the GPS RO measurements, which has puzzled the RO community for quite some time. The discovery of positive N-bias (i.e., negative temperature bias, and/or positive moisture bias) likely attributed to the global analyses/reanalysis in the high specific humidity condition will be worth further investigation. Note some more details related to the simulation of liquid/ice water content are needed in the manuscript, and some text and a few figures can be improved. I would recommend publication of the paper after “minor revision”. The comments are listed below: Major comments:
1. Section 4 missed some details of the ray-tracing simulation. a. The typical range of the liquid and ice water content (along the ray path) derived from
TRMM radar reflection measurement (e.g., at different altitude in Fig. 1) should be shown or at least discussed in the manuscript.
b. The size distribution of the particles, N(D) was not shown.
c. How typical are those precipitation cases observed by TRMM? For example, the size, rain rate, etc, should be discussed.
We have included some typical values about the ray tracing simulation. We provide an order of magnitude of the length of the rays below 15 km and the typical water content paths in the end of Sec 4, and we provide some typical numbers of the 65 TRMM cases in Sec 4.1 for representativeness.
2. The N-bias study (e.g., Fig. 6) focused on the high specific humidity based on COSMIC RO wet retrieval. Could the authors use the analyses/reanalysis specific humidity instead, and see whether the N-bias pattern will remain the same? Or is there any references that compare the RO specific humidity with the global analyses/reanalyses, which confirm the consistency?
One direct consequence of the positive difference between the RO and the analyses refractivity is that the specific humidity difference between RO and analyses is also positive. When the refractivity difference is negative, the specific humidity difference is also negative. The relationship between refractivity difference and specific humidity difference between RO and analyses has been checked, and the correlation is high. Since the positive bias is larger as q_RO increases (e.g. Fig 5), most points in high regions of q_RO will correspond to points not so high in the q_An (analyses). Most points in the lower values of q_RO would correspond to more similar values of q_An, because the overall bias is smaller. Therefore, the values that contribute the most to the positive bias will be diluted with much more values with less N-difference, reducing the overall bias as a function of q_An. We have checked this relationship, and we observe how the relationship of the bias with q_An is less obvious, specially in the no-rain cases. For the rain cases, the fact that there is an overpopulation in the high region of q_RO (due to the contribution of the tropical precipitation) with respect to the medium values of q makes the refractivity bias as a function of q_An less different than when it is plotted as a function q_RO, with the most obvious difference being that the maximum refractivity difference is reached at lower q_An values. In consequence, when we repeat Figure 6 using the q_An values the no rain and high specific humidity becomes less populated, and the bias is reduced being significant only for the ERA case. On the other hand, the overall bias in the rain and low specific humidity becomes stronger. The cases with no rain and low specific humidity and rain with high specific humidity keep the main characteristics shown in the q_RO case. We do not include this discussion in the paper, since we understand that can be explained as a direct consequence of the fact that positive refractivity bias is linked to positive specific humidity differences, which is stated in the discussion. However, we include a citation to Vergados, et al. 2015, which shows that ERA-interim is systematically drier than RO in the tropics in agreement with our reasoning.
3. Figure 3: a. Add latitude/longitude labels b. Add the title for each row with the precipitation rate “<R>” c. Maybe put side labels for “ERA-I, ECMWF_An, GFS”
Corrected
4. Figure 4: a. Why the impact height goes all the way down to 0 km, which will likely be ~2km
below the earth surface. Should that be “geometric height” instead, especially for the refractivity error plot? Please verify and make sure it is consistent with the manuscript description in L3 in Section 4.1.
It was a mistake. Now the bending angle is shown as a function of the impact height, and refractivity as a function of the geometric height.
5. Figure 6: a. Add latitude/longitude labels b. Add labels after each column title: “no rain low q (<0.5 g/kg)” etc. c. Maybe put side labels for “ERA-I, ECMWF_An, GFS”
Corrected Technical comments: The line numbers were messy and not consistent. The following is the best I can do to point to the text in the manuscript. “liquid and solid water content” -> liquid and ice water content Corrected Page-1 – Sec. 1 (right column) L20: remove “of the” Removed Page-3 – Sec.2.1 L01: change to “the global surface precipitation every 30 minutes with a horizontal resolution of 0.1° latitude x 0.1° longitude. Changed L10: “compared against” -> “collocated with” ; Changed L11: remove “looking for coincident … resulted from such comparison.” -> “A total of 16,881 COSMIC RO soundings are identified to be within the swath of the TRMM precipitation measurements (250 km), and within +/- 15 minutes.” Corrected
It’s confusing whether the collocation threshold “250 km” (i.e., swath size of TRMM) or “100km” as seen in L19 (Section 2.1)? Please clarify. There is a difference here between when an event is collocated, i.e. within TRMM swath, and when there is or there is not precipitation in the surroundings of an event, i.e. using information from the closest pixels (within 100 km). Page-3 – Sec.2.2 L03: spatial … between +/-60 deg and every 30 min -> every 30 minute with spatial coverage between 60°S and 60°N Changed L12: remove “(IMERG data is … 30 min)”, which is redundant. Removed Page-3 – Sec.3 L10: for the two analyses and one reanalysis Corrected L18: The hexagon with a diameter of ~30 deg is used in Figure 3. What is the sampling looks like? What the minimum/maximum and average sampling number of the collocation within the hexagon? If the sampling plot will not be shown, it needs to be mentioned/discussed in the text, to justify the choice of “30 deg”. I would expect it is primarily restricted by the sampling, but could it be possible to reduce the size of hexagon and show better spatial pattern? It has been added to the text. We have increased the total number of observations including also the 2015 collocated observations, and now the hexagons have a diameter of 20 deg. We have included in the text the minimum and maximum number of observations per bin, and we believe that now it is more clear. With the new diameter of the hexagons, the spatial patterns are clearly seen and can be easily associated to regions known to have heavy precipitation. L22: Revise sentence: “This figure shows the global distribution of the positive refractivity bias under heavy precipitation. The regional difference of the N-bias is evident and the difference among analyses and reanalysis is also shown.” Revised Page-4 Figure 2 caption: The compared profiles are …” -> The RO profiles are classified into no-rain (solid) and heavy rain (dashed) based on the collocated GPM IMERG precipitation measurements. Corrected The time range should be mentioned in the caption. Corrected

Page-4 – Sec.3 L10: “The results have shown no …” -> “The results (not shown) reveal no significant changes to the positive N-bias, and confirms that the RO observation geometry is not a contributing factor to the positive bias. Changed Page-4 – Sec.4 L21: For the case in this study Corrected L22: sum of the effects of all the raindrops Corrected L33: Reference needed for “Raindrops fall following gravity and are flattened … oblateshape”. Corrected L04: What is the subscript 1, 2 refer to? Simply corresponding to “h, and v”? Need to be explained. Corrected L06: that is complex -> that is a complex number Corrected Page-5 – Sec.4 L35: The REFERENCE is needed for “The N(D) is obtained … TRMM products…” The reference has been added L36: provide -> retrieve Corrected Page-6 – Sec.4 – Sec. 4.1 L20: It is a bit odd to see the sentence here. “In the left panel of Figure 4, …induced phase delay.” It should be moved and integrated into the discussion of Figure 4 in Section 4.1, possibly after L04. Corrected Figure 4: I would suggest to use (a, b, c) to identify the three panels, which make it easier to discuss in the manuscript. We have changed the figure to have a, b, and c labels on top of each panel. Figure 4 deserves more discussion on each panel, especially the Fig. 4a (SNR plot). For example, what is the precipitation rate of the selected case, where, when, and how big is the precipitation feature? How typical is that compare to the other 62 cases? A better description of figure 4 is included in Sec. 4.1. Could the author(s) also add the excess phase delay without rain to be compared to the result (blue shaded) under heavy precipitation?
We have provided the order of magnitude of the total excess phase to be compared with the precipitation induced phase delay. L08: effect into RO -> effect on RO Corrected L432: “The effect that liquid and solid water content has into the RO … is to induce small errors such as those .. Figure 4.” -> “the effect of liquid/ice water content on RO refractivity retrieval results in small errors (??%, need numbers), which does not introduce obvious biases in both bending angle and refractivity (Figure 4b, c). Corrected and errors provided L435: “Thus, the fact that …scenarios.” -> “Thus the scattering terms in Equation 1 should not be the cause for the positive N-bias in the presence of the heavy precipitation.” Corrected Page-6 – Sec.5 L439 – L457: The two paragraph were not well written and require some revision to improve the points. Note the author(s) like to use the first person in the manuscript. These two paragraphs have been rewritten. L449: “We have done it for the three analyses/reanalyses” -> the two analyses and one reanalysis. Corrected L458: “This classification allows us to further .. scenarios:” -> “We further classify the collocated COSMIC RO profiles into four different categories:” Corrected L462: the criteria -> the threshold Corrected Page-7 – Sec.5 L474: I assume that using coarse resolution of “45 deg” instead of “30 deg” was due to the limited sampling? Please offer the description of the map of sampling after separating into four categories. Will the possibly low and un-even sampling affect the results? Now the size of the bins is reduced due to the increment of the observations after including year 2015. We have included in the text the typical number of observations per bin at each category. Since the overall values for the bias and its global pattern have not changed significantly after incrementing the number observations, we are confident that the sampling is not affecting the results in a significant way. L502: “the bias is larger in the case of ERA-interim …but smaller in the case of ECMWF … analysis, showing the different performance of model in characterizing precipitation. Corrected

Last paragraph of Sec 5: Not sure that is a correct interpretation. The physical model used in ERA-I reanalysis and ECMWF analysis should be pretty much the same. The major difference is the spatial resolution as well as the data assimilated. I would argue the resolution might be the major reason behind the difference. Please discuss and justify your reasoning. We agree with the reviewer that spatial resolution definitely contributes to the differences among analyses. We mention that at the end of Sec 5 and we also add it to the discussion. In fact, here we are not addressing nor we want to reach any conclusion about why analyses and re-analyses perform the way they do. In this study we mainly want to point out that the refractivity bias between RO and analyses exist and, as opposed to previous studies conclusions, it might be due to the analyses and re-analysis information, which can be worth of future investigations.
Assessment of GNSS radio occultation refractivity under heavyprecipitationRamon Padullés1,2, Estel Cardellach2, Kuo-Nung Wang1, Chi O. Ao1, F. Joseph Turk1, and Manuel de la Torre-Juárez1
1Jet Propulsion Laboratory, California Institute of Technology, Pasadena, CA, USA.2Institut de Ciències de l’Espai (IEEC-CSIC), Barcelona, Spain
Correspondence: Ramon Padullés ([email protected])
Abstract. A positive bias at heights between 3 and 8 kmhas been observed when comparing the radio occultation re-trieved refractivity with that of meteorological analyses andre-analyses, in cases where heavy precipitation is present.The effect of precipitation in RO retrievals has been inves-5
tigated as a potential cause of the bias, using precipitationmeasurements interpolated into the actual three dimensionalRO raypaths to calculate the excess phase induced by precip-itation. The study consisted in comparing the retrievals whensuch extra delay is removed from the actual measurement10
and when it is not. The results show how precipitation itselfis not the cause of the positive bias. Instead, we show that thepositive bias is linked to high specific humidity conditionsregardless of precipitation. This study also shows a regionaldependence of the bias. Furthermore, different analyses and15
re-analyses show a disagreement under high specific humid-ity conditions and in consequence, heavy precipitation.
1 Introduction
Radio Occultation (RO) technique uses opportunistic GlobalNavigation Satellite System (GNSS) signals to sound the at-20
mosphere. The signal trajectory, travelling from GNSS satel-lites to Low Earth Orbiters (LEO), is bent due to the indexof refraction gradients of the atmosphere. Such bending canbe inferred using the phase derivative observable (Dopplershift) obtained by dedicated receivers in the LEOs. Under25
the assumption of a spherically symmetric atmosphere, thebending angle profile can be integrated to a vertical profileof the refractive index, n(h), through Abel inversion (e.g.Kursinski et al., 1997; Hajj et al., 2002).
Refractivity is defined to account for the deviations of the30
index of refraction from unity, and is related to geophysical
parameters by (e.g. Thayer, 1974; Kursinski et al., 1997):
N(h) =(n(h)− 1)× 106 = 77.6P
T+ 3.73× 10⁵ e
T 2−
40.3× 10⁶ ne
f2+O
(1
f3
)+ 1.4Ww + 0.6Wi
(1)
where P is the total pressure (mbar), T is temperature (K), eis the partial water vapour pressure (mbar), ne is the electron 35
density (m−3), f is the frequency (Hz), and Ww,i are theliquid and ice water contents (g ·m−3), respectively. Theseterms are classified as dry, wet, ionospheric and scatteringterms. The dry term is dominant below 60-90 km, while thewet term becomes significant in the lower troposphere. The 40
ionospheric term becomes dominant above 60-90 km, and itsleading contribution is removed by a combination of two ofthe frequencies used by GNSS satellites (L1 = 1.575 GHz;L2 = 1.228 GHz) (Vorob’ev and Krasil’nikova, 1994). Thescattering terms (i.e. Ww,i) are generally much smaller com- 45
pared to the other refractivity terms in the lower troposphere.Therefore, they are usually neglected in the retrieval of the at-mospheric variables, and when RO measurements are assim-ilated into the Numerical Weather Prediction (NWP) models.
A commonly used method to retrieve temperature, pres- 50
sure and water vapour from RO observations is the one di-mensional variational retrieval (1DVAR). It consists in ob-taining the most probable atmospheric variable combininga priori atmospheric information with the observations in astatistically optimal way (Healy and Eyre, 2000). Usually, 55
these a priori values are obtained from global meteorologicalanalyses or reanalyses. On the other hand, bending angle andrefractivity profiles are directly assimilated into NWP (e.g.Healy et al., 2005; Cucurull et al., 2007), with a high positiveimpact in the weather forecasts (Cardinali and Healy, 2014). 60
An unavoidable link exists between NWP models and ROretrieved temperature, pressure and moisture, due to the fact
2 Padullés et al.: RO refractivity under heavy precipitation
that RO products use a priori information from the models,and models assimilate RO observations. Yet, differences ex-ists between their products, and its understanding is impor-tant in order to detect weaknesses and potentially improvethe performance of models.5
In this study we compare RO refractivity observations withthe global weather analyses and re-analyses, in the presenceof precipitation. These analyses have coarse spatial resolu-tion, which has a direct impact in the treatment of heavy pre-cipitation. At these scales, convective processes need to be10
parametrized. In turn, convective parametrization (CP) hasbeen identified as one of the major source of errors in themodelling of heavy precipitation (e.g. Arakawa, 2004). ROtechnique offers unique potential to study the interaction be-tween heavy precipitation and vertical thermodynamic pro-15
cesses within the atmosphere, since their signals can pene-trate into thick clouds and their products have high verticalresolution. Recent investigations by Cardellach et al. (2014,2017) and Padullés et al. (2016) have shown potential toretrieve vertical precipitation information adapting RO re-20
ceivers to collect polarimetric observables (Pol-RO). There-fore, Pol-RO emerge as a technique that could provide rele-vant simultaneous information of precipitation and thermo-dynamics (e.g. moisture), to advance in the understanding ofthe processes linking vertical structure of moisture and heavy25
precipitation.While such products are not yet available, in this study
we investigate precipitation induced features in standard(non-polarimetric) RO products using collocations (i.e. spaceand time coincidences) between the COSMIC/FORMOSAT-30
3 mission (Anthes et al., 2008) and the Tropical RainfallMeasurement Mission (TRMM) (Kummerow et al., 2000)and Global Precipitation Measurement (GPM) (Hou et al.,2014) missions, and we compare such features with those ofanalyses and re-analyses. The refractivity from analyses and35
re-analyses is derived using the temperature, pressure andmoisture that they provide, and Equation 1.
A clear positive bias in the RO refractivity with respect tothat of some weather analyses and re-analyses is observedbetween 3 and 8 km height when precipitation is present in40
the surroundings of the observation. Previous studies havenoted similar biases, for example Lin et al. (2010); Yang andZou (2012); Zou et al. (2012); Yang and Zou (2016). Thesestudies linked the bias with the liquid and ice water contentpresent in the observation site, suggesting that the scattering45
term from Equation 1 should not be neglected, but used tocorrect RO refractivity observations instead. However, ourapproach in this study is different and takes into accountthe 3-D structure of precipitating medium. Here, the impactof precipitation is assessed directly in the Doppler shift ob-50
servable, using three dimensional collocations of precipita-tion structures and realistic RO ray trajectories, together withcomputational simulations of the effect of the scattering ofthe propagating signal by liquid and solid water particles.Afterwards, the causes of the observed bias are discussed55
with focus on the performance of the used analyses and re-analyses, especially under high specific humidity conditions.The reason to proceed this way is because solely comparingthe RO observations with data from analyses and re-analyses,one could not make a clear distinction on whether the bias is 60
due to the observation technique limitations or the weatheranalyses limitations.
This paper is structured in the following way. The detailsof the data and collocations used for this study are explainedin section 2. In section 3 the bias in the comparison between 65
RO observations and analyses and re-analyses is introduced.section 4 presents the results of the assessment of the precip-itation induced delay into the RO observables. And in sec-tion 5 the specific humidity is assessed as the source of therefractivity bias. Finally, section 6 contains a discussion on 70
the results.
2 RO, analyses, and precipitation data
The COSMIC/FORMOSAT-3 RO products are obtainedfrom the University Corporation for Atmospheric Re-search (UCAR) COSMIC Data Analysis and Archive Cen- 75
ter (CDAAC). The observed RO refractivity is obtained fromthe Level-2 wetPrf products, along with the retrieved tem-perature, pressure, and water vapour partial pressure at every0.1 km of altitude, between surface level and 20 km. The ob-served refractivity included in the wetPrf files is the same 80
product as in the atmPrf files, provided here at the sameheight levels as the other thermodynamic products. Theseobservations are collocated with the European Center forMedium range Weather Forecast (ECMWF) ERA Interim re-analysis (e.g. Dee et al., 2011), the ECMWF high resolution 85
operational analysis, and the National Centers for Environ-mental Prediction (NCEP) operational analysis, the GlobalForecast System (GFS) (NOAA/NCEP, 2003). These collo-cated profiles are obtained also at the CDAAC in the Level-2 eraPrf, echPrf and gfsPrf products, respectively. The RO 90
products are interpolated into the analyses height levels whenthe comparisons are performed.
Data from the TRMM and GPM precipitation missions areobtained from the NASA Goddard Earth Sciences Data andInformation Services Center (GES DISC). The TRMM data 95
used here is the Level-2 orbital 2B31 products, that providevertical structure information of precipitation and has a lim-ited swath coverage. The used GPM data is the final run ofthe Integrated Multi-satellitE Retrievals for GPM (IMERG)products (Huffman et al., 2017), that provide surface rain rate 100
for the region comprised between ±60 latitude. In order toassess the precipitation intensity and structural characteris-tics, data from the vertically profiling TRMM radar are used,while the GPM IMERG data is used to increase the statistics.The TRMM 2B31 products provide precipitation informa- 105
tion for the region sensed by the TRMM Precipitation Radar(PR), such as rain rate, with a swath of approximately 250
Padullés et al.: RO refractivity under heavy precipitation 3
km, a horizontal resolution of 5 × 5 km, and a vertical res-olution of 250 m. The IMERG product provides an estimateof the global surface precipitation with an
::::every
::30
:::::::minutes
::::with
:a horizontal resolution of 0.1
::::::latitude
:× 0.1 and every
30 minutes.::::::::longitude.5
:::For
:::this
::::::study,
:::the
::::::::::precipitation
::::::::::information
::::::comes
:::::solely
::::from
::::the
:::::::TRMM
::::and
:::::GPM
:::::::::retrieved
::::::::products,
::::and
:::no
::::::::::precipitation
:::::::::::information
::is:::::
used::::
nor::::::::assumed
:::::from
:::the
:::::::analyses
::::and
:::::::::::re-analyses.
::::::::::Therefore,
::::the
::::::::analyses
::::and
:::::::::re-analysis
::::::::products
:::::might
:::or
:::::might
::::not
:::be
:::::::::associated
::to10
:::::::different
:::::::::::precipitation
:::::::::conditions
:::::when
:::::their
::::::::products
:::are
::::::::generated.
:::::::::However,
:it::is:::not
:::the
::::aim
::of
::::this
:::::work
::to
:::::assess
::the
:::::::ability
::of
::::::::analyses
:::to
:::::::::reproduce
:::::::::::precipitation,
::::but
::to
:::::::evaluate
:::and
::::::::compare
:::the
:::RO
::::::::products
::::with
:::::their
:::::::provided
:::::::::::::thermodynamic
:::::fields
:::for
:a::::::
given:::::::location
:::and
:::::time
::in
:::the15
:::::actual
:::::::presence
::or
:::::::absence
::of
:::::::::::precipitation.
::::::::::::Nevertheless,
::we
:::::::consider
::::that
:::this
:::::could
:::::lead
::to
:::::minor
:::::::effects
:::::solely,
:::::since
::the
:::::water
::::::vapor
::::field
::is
::::::::::::::spatio-temporally
::::::::smoother
::::than
:::the
::::cloud
:::::water
:::::::content
::::field.
2.1 Collocations with the TRMM PR20
The COSMIC/FORMOSAT-3 RO products between 2006and 2015 were compared against
::::::::collocated
::::with
:TRMM
orbital productslooking for coincident observations in space(RO soundings .
::A:::::total
::of
::::::16,881
::::::::COSMIC
::::RO
::::::::soundings
::are
:::::::::identified
:::to
::::be
::::::within
::::the
::::::swath
:::of
::::the
:::::::TRMM25
::::::::::precipitation
::::::::::::measurements
:::::(250
:::::km),
:::and
:within TRMM
swath ) and time (both observations within ±::±
:15 min-
utes). After 2013, the number of COSMIC/FORMOSAT-3RO observations dropped significantly. However, the qual-ity and distribution of the observations was not affected.30
16,881 collocated events resulted from such comparison.These events were then classified depending on the pres-ence or not of precipitation and its intensity. Henceforth, eachevent is linked to the number of pixels of the TRMM radarwith a reflectivity (Z) larger than 30 dBZ, used as a proxy for35
heavy precipitation events, in the surroundings (100 km) ofthe occultation location within the radar swath.
For each event with evidences of precipitation in itssurroundings, the approximated RO ray trajectories havebeen simulated using ray-tracing techniques
:::and
:::::::::geo-located40
:::::::together
::::with
:::the
:::::radar
::::::::retrieved
:3:::::::::::
dimensional:::::::::reflectivity
::::::::::observations. Therefore, it has been
::is possible to interpo-
late the precipitation information into the set of RO ray tra-jectories. An example of such interpolation is shown in Fig-ure 1. We can therefore estimate the amount of precipitation45
crossed by each of the rays,:::::::estimate
::its
::::::effect, and compare
it with the:::::actual
:RO observables such as the excess phase
(or the Doppler shift), the Signal to Noise Ratio (SNR) orthe atmospheric vertical retrievals. We use this informationto assess the impact of precipitation into the RO signal prop-50
agation and its retrievals, as described in section 4.
:It:::
is:::::worth
::::::::::mentioning
::::that
:::in
::::this
:::::study
:::we
:::::focus
:::on
::the
::::::effect
::of
::::rain
:::and
::::::::::::hydrometeors
::::large
:::::::enough
::to
::::::exhibit
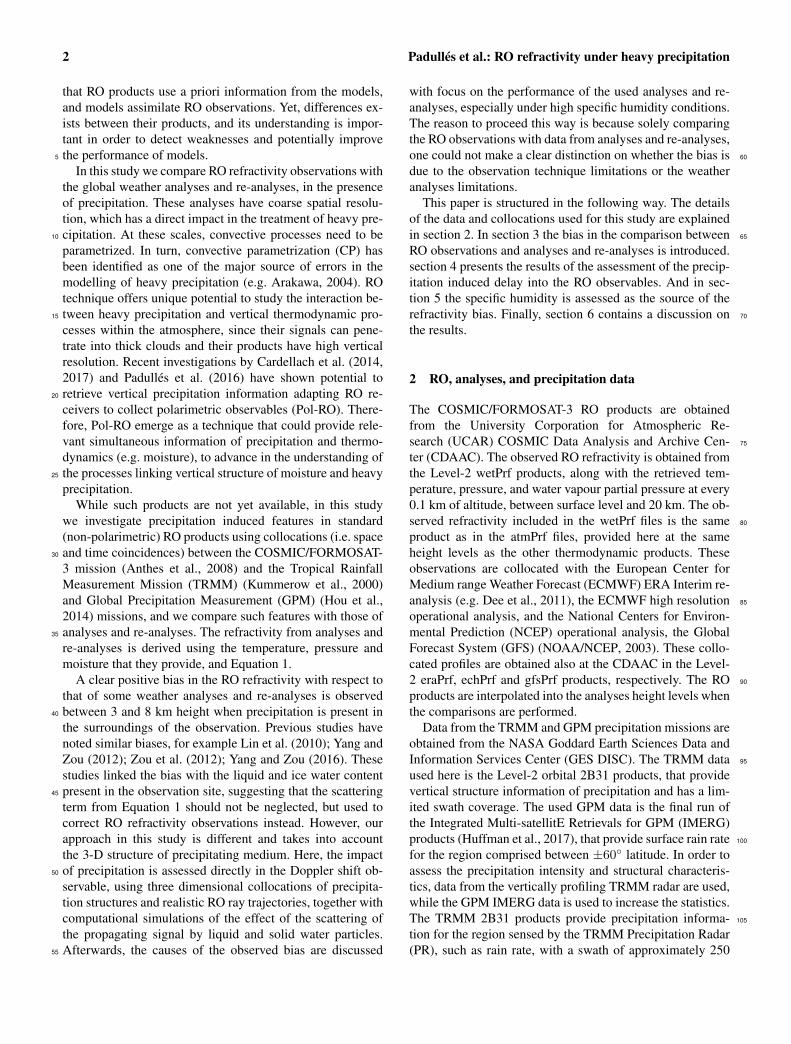
Figure 1. Three dimensional collocation of a RO event with aTRMM PR precipitation measurement. It corresponds to the coin-cidence between the C004.2006.329.22.20.G19 RO event and the2B31.20061125.51450 TRMM PR product. Here the precipitationstructure is shown in a 3 dimensional grid, along with the set of ROray trajectories (in gray). Black stars indicate the tangent point ofthe rays. Only a few rays are shown for illustration purposes. Theorange dashed lines indicate the edges of the TRMM PR swath.The interpolated precipitation information (rain rate) into the ROplane is shown in the 2-Dimensional projection in the latitude-height plane.
:a::::::::::
significant:::::::::reflectivity
:::::::::signature
:::in
::::the
:::::::TRMM
:::::radar
:::::::retrievals
:::::::::(working
::at
:::::::::Ku-band),
::::::which
::in
:::its
::::turn
:::are
:::the 55
::::ones
:::we
:::::expect
:::to
::::have
:::the
::::::largest
::::::impact
:::on
:::RO
::::::::retrievals.
:::The
:::::::::scattering
::::::effects
::of
:::::::smaller
::::::::particles,
::::::::specially
:::::above
::the
:::::::melting
:::::layer,
::::have
:::::larger
::::::::::uncertainty
:::and
::::must
::be
::::::treated
:::::::carefully.
:
2.2 Collocations with GPM IMERG 60
In order to improve the statistics of collocated profiles wehave performed a larger scale collocation using the GPMIMERG products (
::::every
:::30
::::::minute
::::with spatial coverage be-
tween ±60deg and every 30 min::°S
::::and
:::::60°N) and all the
COSMIC/FORMOSAT-3 RO products of::::2015
::::and
:2016. 65
We can greatly expand the number of collocations by con-sidering only the surface precipitation rate. For each ofthe COSMIC/FORMOSAT-3 RO events, the correspondingIMERG product has been identified, and the precipitationretrieval has been linked to the RO event. This results in 70
259,231:::::::481,252 RO events from which the surface precip-
itation in its surroundings has been identified, with a timeresolution of ±15min(IMERG data is provided for every 30min). For each event, the mean rain rate, the maximum rainrate and the number of pixels with non-zero rain rate, in a re- 75
gion of 2× 2, is stored along with the vertical RO profilesof refractivity, temperature, pressure, water vapour pressure,
4 Padullés et al.: RO refractivity under heavy precipitation
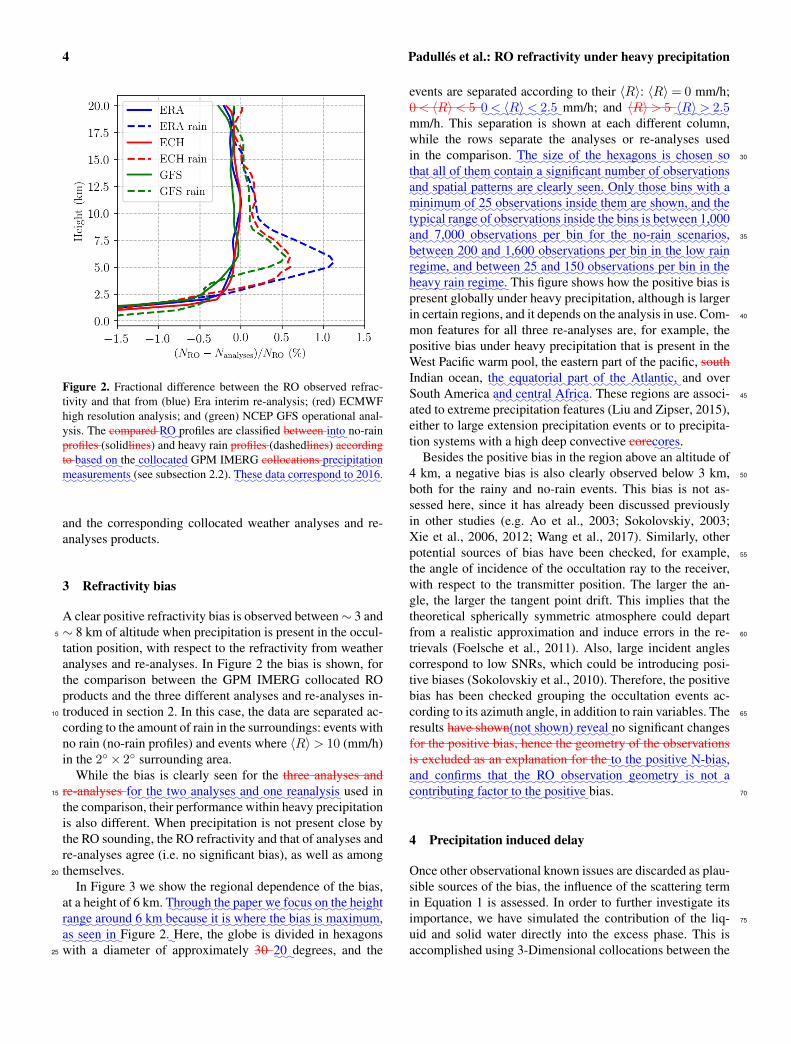
Figure 2. Fractional difference between the RO observed refrac-tivity and that from (blue) Era interim re-analysis; (red) ECMWFhigh resolution analysis; and (green) NCEP GFS operational anal-ysis. The compared
::RO
:profiles are classified between
:::into no-rain
profiles (solidlines) and heavy rain profiles (dashedlines) accordingto
::::based
::on
:the
::::::::collocated GPM IMERG collocations
:::::::::precipitation
::::::::::measurements
:(see subsection 2.2).
::::These
::::data
::::::::correspond
::to
::::2016.
and the corresponding collocated weather analyses and re-analyses products.
3 Refractivity bias
A clear positive refractivity bias is observed between∼ 3 and∼ 8 km of altitude when precipitation is present in the occul-5
tation position, with respect to the refractivity from weatheranalyses and re-analyses. In Figure 2 the bias is shown, forthe comparison between the GPM IMERG collocated ROproducts and the three different analyses and re-analyses in-troduced in section 2. In this case, the data are separated ac-10
cording to the amount of rain in the surroundings: events withno rain (no-rain profiles) and events where 〈R〉> 10 (mm/h)in the 2× 2 surrounding area.
While the bias is clearly seen for the three analyses andre-analyses
::for
:::the
::::two
:::::::analyses
::::and
:::one
:::::::::reanalysis used in15
the comparison, their performance within heavy precipitationis also different. When precipitation is not present close bythe RO sounding, the RO refractivity and that of analyses andre-analyses agree (i.e. no significant bias), as well as amongthemselves.20
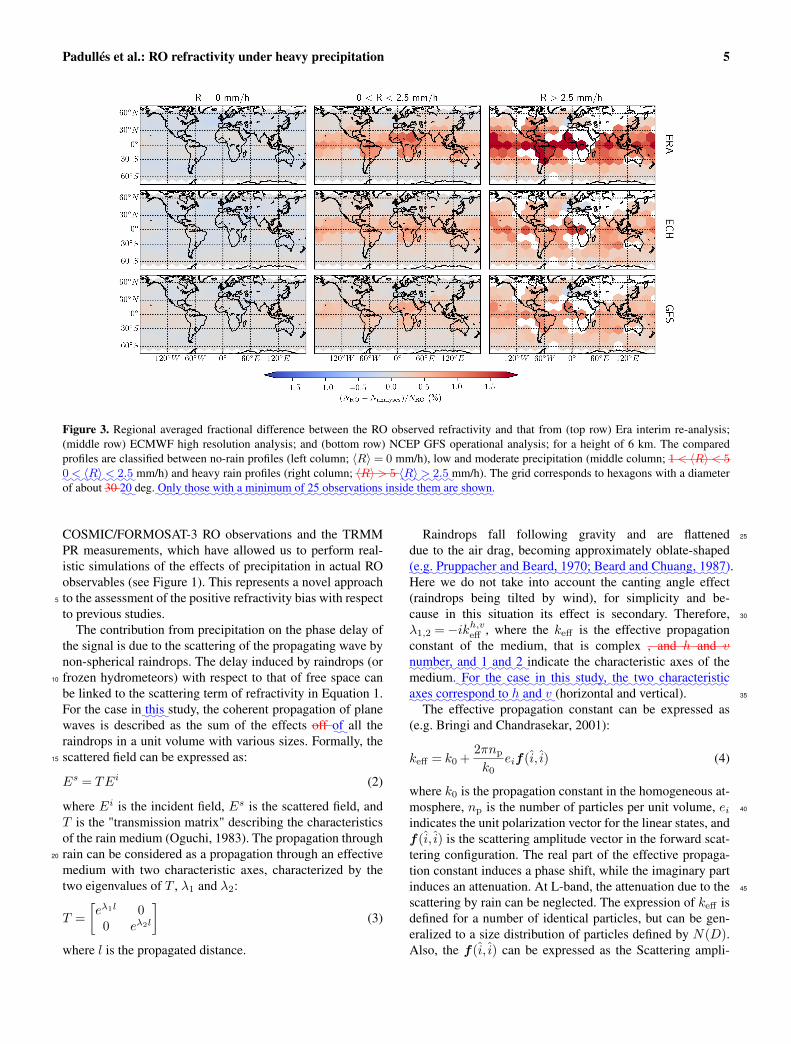
In Figure 3 we show the regional dependence of the bias,at a height of 6 km.
::::::Through
:::the
:::::paper
:::we
:::::focus
::on
:::the
:::::height
::::range
:::::::around
:6:::km
:::::::because
::it
:is::::::where
:::the
:::bias
::is:::::::::maximum,
::as
::::seen
::in
:Figure 2.
:Here, the globe is divided in hexagons
with a diameter of approximately 30::20
:degrees, and the25
events are separated according to their 〈R〉: 〈R〉= 0 mm/h;0< 〈R〉< 5
:::::::::::0< 〈R〉< 2.5
:mm/h; and 〈R〉> 5
::::::::〈R〉> 2.5
mm/h. This separation is shown at each different column,while the rows separate the analyses or re-analyses usedin the comparison.
:::The
::::size
:::of
:::the
::::::::hexagons
::is:::::::
chosen::so 30
:::that
:::all
::of
::::them
:::::::contain
:a:::::::::significant
:::::::number
::of
::::::::::observations
:::and
::::::spatial
:::::::patterns
:::are
::::::clearly
::::seen.
:::::Only
:::::those
::::bins
::::with
:a
::::::::minimum
::of
::25
:::::::::::observations
:::::inside
:::::them
:::are
::::::shown,
:::and
:::the
:::::typical
:::::range
::of
:::::::::::observations
:::::inside
:::the
::::bins
:is:::::::between
:::::1,000
:::and
:::::7,000
:::::::::::observations
::::per
:::bin
:::for
::::the
:::::::no-rain
::::::::scenarios, 35
:::::::between
:::200
::::and
:::::1,600
:::::::::::observations
:::per
:::bin
::in
:::the
::::low
:::rain
::::::regime,
:::and
::::::::between
::25
::::and
:::150
:::::::::::observations
:::per
:::bin
::in
:::the
:::::heavy
:::rain
:::::::regime. This figure shows how the positive bias is
present globally under heavy precipitation, although is largerin certain regions, and it depends on the analysis in use. Com- 40
mon features for all three re-analyses are, for example, thepositive bias under heavy precipitation that is present in theWest Pacific warm pool, the eastern part of the pacific, southIndian ocean,
::the
:::::::::equatorial
::::part
::of
::::the
:::::::Atlantic,
:and over
South America:::and
:::::central
::::::Africa. These regions are associ- 45
ated to extreme precipitation features (Liu and Zipser, 2015),either to large extension precipitation events or to precipita-tion systems with a high deep convective core
::::cores.
Besides the positive bias in the region above an altitude of4 km, a negative bias is also clearly observed below 3 km, 50
both for the rainy and no-rain events. This bias is not as-sessed here, since it has already been discussed previouslyin other studies (e.g. Ao et al., 2003; Sokolovskiy, 2003;Xie et al., 2006, 2012; Wang et al., 2017). Similarly, otherpotential sources of bias have been checked, for example, 55
the angle of incidence of the occultation ray to the receiver,with respect to the transmitter position. The larger the an-gle, the larger the tangent point drift. This implies that thetheoretical spherically symmetric atmosphere could departfrom a realistic approximation and induce errors in the re- 60
trievals (Foelsche et al., 2011). Also, large incident anglescorrespond to low SNRs, which could be introducing posi-tive biases (Sokolovskiy et al., 2010). Therefore, the positivebias has been checked grouping the occultation events ac-cording to its azimuth angle, in addition to rain variables. The 65
results have shown:::(not
:::::::shown)
:::::reveal
:no significant changes
for the positive bias, hence the geometry of the observationsis excluded as an explanation for the
::to
:::the
:::::::positive
::::::N-bias,
:::and
::::::::confirms
::::that
:::the
::::RO
::::::::::observation
:::::::::geometry
::is
::::not
:a
::::::::::contributing
:::::factor
::to
:::the
:::::::positive bias. 70
4 Precipitation induced delay
Once other observational known issues are discarded as plau-sible sources of the bias, the influence of the scattering termin Equation 1 is assessed. In order to further investigate itsimportance, we have simulated the contribution of the liq- 75
uid and solid water directly into the excess phase. This isaccomplished using 3-Dimensional collocations between the
Padullés et al.: RO refractivity under heavy precipitation 5
Figure 3. Regional averaged fractional difference between the RO observed refractivity and that from (top row) Era interim re-analysis;(middle row) ECMWF high resolution analysis; and (bottom row) NCEP GFS operational analysis; for a height of 6 km. The comparedprofiles are classified between no-rain profiles (left column; 〈R〉= 0 mm/h), low and moderate precipitation (middle column; 1< 〈R〉< 5
:::::::::::0< 〈R〉< 2.5 mm/h) and heavy rain profiles (right column; 〈R〉> 5
:::::::〈R〉> 2.5
:mm/h). The grid corresponds to hexagons with a diameter
of about 30:20
:deg.
::::Only
::::those
::::with
:a::::::::minimum
::of
::25
:::::::::observations
:::::inside
::::them
:::are
:::::shown.
COSMIC/FORMOSAT-3 RO observations and the TRMMPR measurements, which have allowed us to perform real-istic simulations of the effects of precipitation in actual ROobservables (see Figure 1). This represents a novel approachto the assessment of the positive refractivity bias with respect5
to previous studies.The contribution from precipitation on the phase delay of
the signal is due to the scattering of the propagating wave bynon-spherical raindrops. The delay induced by raindrops (orfrozen hydrometeors) with respect to that of free space can10
be linked to the scattering term of refractivity in Equation 1.For the case in
:::this
:study, the coherent propagation of plane
waves is described as the sum of the effects off:of
:all the
raindrops in a unit volume with various sizes. Formally, thescattered field can be expressed as:15
Es = TEi (2)
where Ei is the incident field, Es is the scattered field, andT is the "transmission matrix" describing the characteristicsof the rain medium (Oguchi, 1983). The propagation throughrain can be considered as a propagation through an effective20
medium with two characteristic axes, characterized by thetwo eigenvalues of T , λ1 and λ2:
T =
[eλ1l 0
0 eλ2l
](3)
where l is the propagated distance.
Raindrops fall following gravity and are flattened 25
due to the air drag, becoming approximately oblate-shaped
::::::::::::::::::::::::::::::::::::::::::::::::(e.g. Pruppacher and Beard, 1970; Beard and Chuang, 1987).Here we do not take into account the canting angle effect(raindrops being tilted by wind), for simplicity and be-cause in this situation its effect is secondary. Therefore, 30
λ1,2 =−ikh,veff , where the keff is the effective propagationconstant of the medium, that is complex , and h and v
:::::::number,
:::and
::1:::and
::2:indicate the characteristic axes of the
medium.::::For
:::the
::::case
:::in
:::this
::::::study,
:::the
::::two
:::::::::::characteristic
::::axes
:::::::::correspond
::to
::h
:::and
::v (horizontal and vertical). 35
The effective propagation constant can be expressed as(e.g. Bringi and Chandrasekar, 2001):
keff = k0 +2πnp
k0eif (i, i) (4)
where k0 is the propagation constant in the homogeneous at-mosphere, np is the number of particles per unit volume, ei 40
indicates the unit polarization vector for the linear states, andf (i, i) is the scattering amplitude vector in the forward scat-tering configuration. The real part of the effective propaga-tion constant induces a phase shift, while the imaginary partinduces an attenuation. At L-band, the attenuation due to the 45
scattering by rain can be neglected. The expression of keff isdefined for a number of identical particles, but can be gen-eralized to a size distribution of particles defined by N(D).Also, the f (i, i) can be expressed as the Scattering ampli-
6 Padullés et al.: RO refractivity under heavy precipitation
tude matrix, S, using the Jones notation (Jones, 1941). Thescattering amplitude matrix (2× 2) relates the scattered fieldcomponents to the incident field components in the far fieldapproximation. For a right hand circularly polarized (RHCP)propagating field, as it correspond to GNSS transmitted sig-5
nals, a mean effective propagation constant can be definedby:
kmeaneff =
(kheff + kveff
2
), (5)
hence, the specific phase shift induced only by the raindropsto a circularly polarized incident wave is:10
∆Φrain =
(λ
2π
)2π
k0
∫<Shh(D) +Svv(D)
2
N(D)dD
(6)
in units of mm · km−1, where λ is the wavelength (mm),Shh,vv are the co-polar components of the forward scatter-ing amplitude matrix in a linear base of polarization, N(D)is the particle size distribution (mm−1m−3), and D is the15
diameter of the particles (mm). The forward scattering am-plitude matrix is computed for each scatterer, and depends onthe scatterer’s size, composition, orientation, and shape (seeBringi and Chandrasekar (2001) for a detailed explanation).For this study, the T-matrix code is used in order to com-20
pute S for raindrops of all sizes between 0.1 and 8 mm ofdiameter (Mishchenko et al., 1996). For the particle shapes,the Beard and Chuang (1987) model is used, which relatesthe diameter of the each particle with the relationship be-tween its two characteristic dimensions (i.e. its axis ratio).25
The complex permittivity for liquid water is obtained fromLiebe et al. (1991). The N(D) is obtained at each point fromthe TRMM products , using the same one used to provide
::::::retrieve
:rain rate from the TRMM PR reflectivity measure-
ments,::::::which
::is
::::::usually
::::::::::::approximated
::::with
:a:::::::gamma
:::::model30
::::::::::::::::::(e.g. Kozu et al., 2009).
Using the three dimensional collocations we can thereforecompute the phase delay that is solely due to precipitation, inthe following way:
– For each collocated event, we have the precipitation in-35
formation interpolated into the set of RO ray trajecto-ries. The precipitation information (for example, rainrate, water content, etc.), directly or indirectly, is usedto infer the N(D) at each point of these trajectories.
– With the N(D), we can compute the specific dΦrain40
::::::∆Φrain
:along each ray using Equation 6, and integrate
this quantity along each ray path:
Φrain =
∫L
∆Φrain(l)dl (7)
in units of mm, where L is the ray-path length in km.
For each occultation event that has been 3-d collocated 45
with the TRMM PR, we can have the approximate verti-cal profiles of precipitation induced delay along with allthe currently provided information, such as the total excessphase delay, the strength of the signal, and the retrievedvertical thermodynamic products. In the left panel of we 50
show an example of an occultation actual SNR together withthe precipitation induced phase delay.
::To
::::give
:::the
::::::reader
:a
::::::context,
::::the
::::::::ray-paths
::::::length
::::::below
:::15
:::km
::::can
::be
:::of
:::the
::::order
:::of
::::::::hundreds
::of
::::::::::kilometers,
:::and
::::::::therefore
::::the
::::::amount
::of
:::::liquid
::::::water
:::::::content
::::that
::is:::::::
crossed:::
is::::::::::significant.
::In 55
:::big
::::::::::precipitating
::::::::systems,
:::the
:::::total
:::::::::integrated
:::::liquid
:::::water
::::::content
:::::along
:::the
::::::::ray-paths
:::can
::::::exceed
:::50
::::::::kg ·m−2.
4.1 Precipitation induced phase delay impact
In this section we want to assess the impact that the precipi-tation induced phase delay has on RO retrievals. To do so we 60
have designed a study that consists in retrieving the bend-ing angle (Phase Matching method (Jensen et al., 2003)) andrefractivity (inverse Abel transform (Fjeldbo et al., 1971))profiles from the total excess phase delay to compare it withthe retrieval results when the precipitation induced delays are 65
removed from the original total excess phase. Therefore, theprecipitation induced delays obtained in the previous sectionare removed from the actually observed phase delays, obtain-ing two profiles called the rain (original) and the rain-free(where the precipitation induced delay has been removed). 70
The bending angle and refractivity retrieval were at-tempted on both rain and rain-free excess phases from a totalof 65 cases collocated with heavy precipitation events. Thebending angle profiles calculated by Phase Matching weresmoothed with 200m windows and compared in the same im- 75
pact height (corresponding impact parameter minus the col-located radius of Earth).
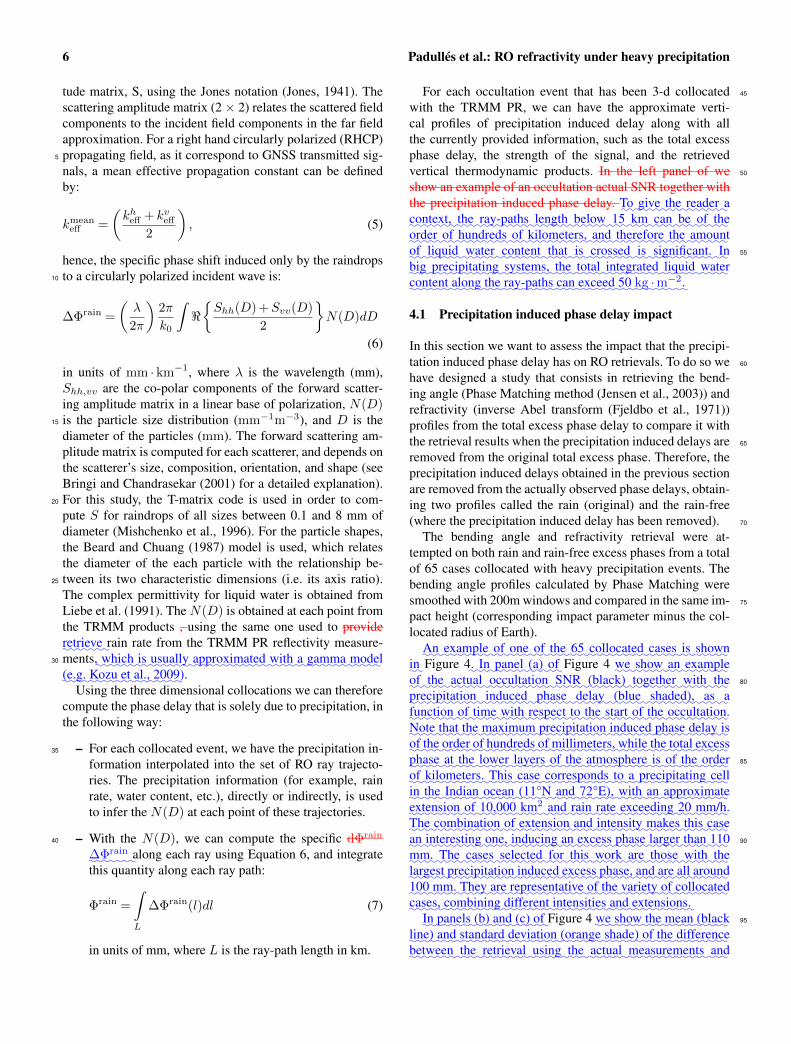
::An
::::::::example
::of
::::one
::of
::::the
::65
:::::::::collocated
:::::cases
::is::::::
shown
::in Figure 4
:.::In
:::::panel
:::(a)
:::of Figure 4
::we
:::::show
:::an
:::::::example
::of
:::the
::::::actual
::::::::::occultation
:::::SNR
:::::::(black)
:::::::together
:::::with
:::the 80
::::::::::precipitation
::::::::induced
::::::phase
:::::delay
::::::(blue
::::::::shaded),
:::as
::a
:::::::function
::of
::::time
::::with
:::::::respect
::to
:::the
::::start
::of
:::the
::::::::::occultation.
::::Note
:::that
:::the
:::::::::maximum
:::::::::::precipitation
:::::::induced
:::::phase
:::::delay
:is
::of
:::the
::::order
::of
::::::::hundreds
::of
::::::::::millimeters,
:::::while
:::the
::::total
:::::excess
:::::phase
::at
:::the
:::::lower
::::::layers
::of
:::the
::::::::::atmosphere
::is
::of
:::the
:::::order 85
::of
:::::::::kilometers.
:::::This
::::case
::::::::::corresponds
::to::
a:::::::::::precipitating
:::cell
::in
:::the
:::::Indian
::::::ocean
:::::(11°N
::::and
::::::72°E),
::::with
:::an
::::::::::approximate
::::::::extension
::of
::::::10,000
::::km2
::::and
::::rain
:::rate
:::::::::exceeding
:::20
:::::mm/h.
:::The
:::::::::::combination
::of
::::::::extension
::::and
:::::::intensity
::::::makes
:::this
::::case
::an
:::::::::interesting
::::one,
:::::::inducing
:::an
::::::excess
:::::phase
:::::larger
::::than
:::110 90
::::mm.
::::The
:::::cases
:::::::selected
:::for
::::this
:::::work
:::are
::::::those
::::with
:::the
:::::largest
:::::::::::precipitation
:::::::induced
:::::excess
::::::phase,
:::and
:::are
::all
::::::around
:::100
::::mm.
:::::They
:::are
:::::::::::representative
::of:::
the::::::variety
:::of
::::::::collocated
:::::cases,
:::::::::combining
:::::::different
:::::::::intensities
:::and
::::::::::extensions.
::In
:::::panels
:::(b)
:::and
:::(c)
::of
:Figure 4
::we
:::::show
:::the
:::::mean
:::::(black 95
::::line)
:::and
:::::::standard
::::::::deviation
:::::::(orange
::::::shade)
::of
:::the
::::::::difference
:::::::between
:::the
::::::::retrieval
:::::using
:::the
::::::actual
:::::::::::::measurements
:::and
Padullés et al.: RO refractivity under heavy precipitation 7
Figure 4. (left) Actual SNR (black) corresponding to the RO event C001.2008.345.00.43.G03 (UCAR id), along with the simulated precip-itation induced phase delay (blue) as a function of time; (right) Fractional bending angle and refractivity differences between the outputsfrom the retrieval using the rain-affected profiles and the rain-removed ones, as a function of the impact height
:::::::(bending
:::::angle)
:::and
::of
:::the
:::::::geometric
:::::height
::::::::::(refractivity). Black lines represent the mean of the 65 cases, while orange shade is the standard deviation.
::::those
::::after
:::::::::removing
:::the
::::::::::precipitation
:::::::induced
::::::excess
:::::phase,
::::both
::for
:::::::bending
:::::angle
::::::(panel
::b)
::as
::a:::::::function
::of
:::the
::::::impact
:::::height
::::and
:::::::::refractivity
::::::(panel
::c)
::as
::a:::::::function
:::of
::::::::geometric
::::::height.
:Because of the integration nature of inverse Abel
transform, the standard deviation (orange shade in right5
panels:::::panels
:::(b)
::::and
:::(c)
:of Figure 4) in the retrieved re-
fractivity is much smoother than the one in bending angleprofiles. If precipitation had a systematic effect into
::on
:RO
phase delays, a positive bias would be observed in the rain-affected bending angle and refractivity when compared with10
the rain free bending and refractivity for the same case. How-ever, this effect is absent in the right panels of Figure 4.
The results of nonexistent mean positive bias shown in theright panels of Figure 4 suggest that the positive bias foundin the retrieved refractivity compared to the weather analy-15
ses and re-analyses is not due to the neglect of the scatteringterm in the refractivity. Furthermore, it can be seen how onaverage, the impact of taking / not taking into account theprecipitation induced delays when assessing the retrieval in-creases the variability, implying that the changes of removing20
precipitation contribution from the signal propagation can beboth positive and negative, rather than only negative. Sincethe bending angle and refractivity retrieval process dependsmostly on the vertical gradient of the excess phase, the pre-cipitation induced excess Doppler, which can be positive or25
negative, will on average lead to unbiased retrieval results.This extra excess Doppler can be seen as the result of localhorizontal inhomogeneity in the refractivity field.
Differently from temperature and pressure, the liquid andice water content is localized in a small region (compared30
to the ray travel distance), and might not be contributingalong the whole propagation ray-path of an occultation. Fur-thermore, the region where liquid and ice water is presentmight be far from the tangent point. Yet, the refractivity re-trieved from a RO observation is located around the RO tan-35
gent point, and considered to have an horizontal resolution ofabout 200 km (e.g. Kursinski et al., 1997). Even though theRO observations are integral quantities, most of the contribu-tion from dry and wet air in the bending angle comes fromnear the tangent point. 40
In addition, the RO retrievals rely on the sphericalsymmetric atmosphere approximation. While it has beenproven to work properly for the standard RO thermody-namic products, liquid and solid
::ice
:water content contri-
butions to the excess phase cannot be well captured under 45
such assumption. In consequence, the effect that liquidandsolid water content has into the RO retrieved refractivityprofiles is to induce small errors such as those characterizedin the right panel of
::of
::::::::liquid/ice
::::::water
:::::::content
:::on
:::RO
:::::::::refractivity
:::::::retrieval
::::::results
::in
:::::small
:::::errors
::::(e.g.
:::less
::::than
:::1% 50
::in
:::::::::refractivity
:::::::standard
:::::::::deviation),
::::::which
::::does
:::not
::::::::introduce
::::::obvious
::::::biases
::in
:::::both
:::::::bending
:::::angle
::::and
:::::::::refractivity
:Fig-
ure 4. Thus , the fact that the::the
:scattering terms in Equa-
tion 1 are not taken into account is not::::::should
:::not
:::be
the cause for the positive refractivity bias observed under 55
heavy precipitationscenarios:::::N-bias
::in
:::the
::::::::presence
::of
:::::heavy
::::::::::precipitation.
5 Specific humidity as a source of refractivity bias
Once the:In
:::the
:::::::previous
::::::section
:::we
::::have
::::::shown
:::that
:::the
:scat-
tering term in Equation 1 has been discarded as the main 60
source:::::should
:::not
:::be
:::the
::::main
:::::cause for the refractivity bias,
another hypothesis is tested in this section . That is,:.::In
:::this
::::::section
:::we
:::test
:::::::another
::::::::::hypothesis:
:::the
:::bias
::::::comes
::::from
::the
:::::::::problems
::of
:large scale analyses and re-analyses have
problems representing the thermodynamic variables linked to 65
heavy precipitation scenes, in particular::in
::::::::::representing
:::the
:::::::::::::thermodynamics
:::of
:::::::::::precipitation
::::::::scenarios,
::::::::specially
:::::under
high specific humidity conditions.
8 Padullés et al.: RO refractivity under heavy precipitation
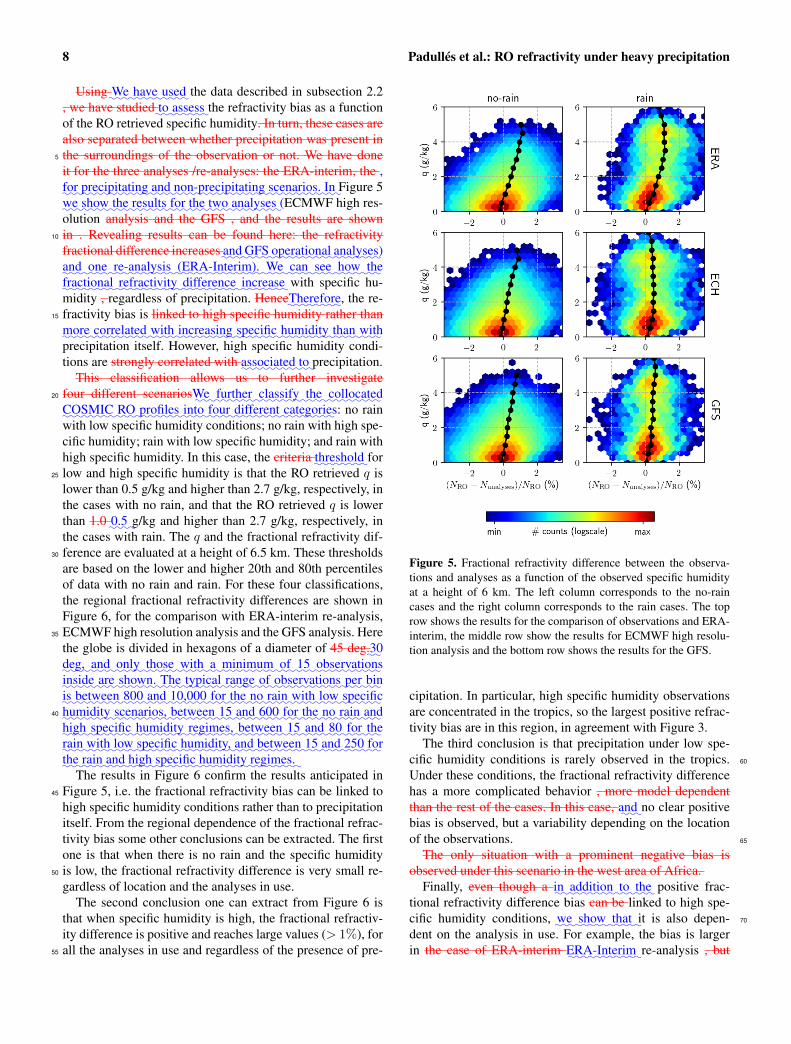
Using:::We
::::have
:::::used the data described in subsection 2.2
, we have studied::to
:::::assess
:the refractivity bias as a function
of the RO retrieved specific humidity. In turn, these cases arealso separated between whether precipitation was present inthe surroundings of the observation or not. We have done5
it for the three analyses /re-analyses: the ERA-interim, the ,
::for
:::::::::::precipitating
:::and
:::::::::::::::non-precipitating
::::::::scenarios.
::In
:Figure 5
::we
:::::show
:::the
::::::results
:::for
:::the
:::two
:::::::analyses
:(ECMWF high res-
olution analysis and the GFS , and the results are shownin . Revealing results can be found here: the refractivity10
fractional difference increases:::and
::::GFS
::::::::::operational
:::::::analyses)
:::and
::::one
:::::::::re-analysis
::::::::::::::(ERA-Interim).
:::We
::::can
::::see
::::how
:::the
::::::::fractional
:::::::::refractivity
:::::::::difference
::::::::increase with specific hu-
midity , regardless of precipitation. Hence::::::::Therefore, the re-
fractivity bias is linked to high specific humidity rather than15
::::more
:::::::::correlated
::::with
:::::::::increasing
::::::specific
::::::::humidity
::::than
::::with
precipitation itself. However, high specific humidity condi-tions are strongly correlated with
::::::::associated
::to
:precipitation.
This classification allows us to further investigatefour different scenarios
::We
:::::::further
:::::::classify
:::the
:::::::::collocated20
::::::::COSMIC
:::RO
:::::::profiles
:::into
::::four
::::::::different
::::::::categories: no rain
with low specific humidity conditions; no rain with high spe-cific humidity; rain with low specific humidity; and rain withhigh specific humidity. In this case, the criteria
::::::::threshold for
low and high specific humidity is that the RO retrieved q is25
lower than 0.5 g/kg and higher than 2.7 g/kg, respectively, inthe cases with no rain, and that the RO retrieved q is lowerthan 1.0
:::0.5
:g/kg and higher than 2.7 g/kg, respectively, in
the cases with rain. The q and the fractional refractivity dif-ference are evaluated at a height of 6.5 km. These thresholds30
are based on the lower and higher 20th and 80th percentilesof data with no rain and rain. For these four classifications,the regional fractional refractivity differences are shown inFigure 6, for the comparison with ERA-interim re-analysis,ECMWF high resolution analysis and the GFS analysis. Here35
the globe is divided in hexagons of a diameter of 45 deg.::30
:::deg,
::::and
:::::only
:::::those
::::with
::a:::::::::
minimum::of
:::15
:::::::::::observations
:::::inside
:::are
::::::shown.
::::The
::::::typical
:::::range
::of
:::::::::::observations
:::per
:::bin
:is::::::::between
:::800
::::and
::::::10,000
:::for
:::the
::no
::::rain
::::with
::::low
::::::specific
:::::::humidity
:::::::::scenarios,
:::::::between
:::15
:::and
::::600
:::for
:::the
::no
::::rain
:::and40
::::high
::::::specific
::::::::humidity
::::::::regimes,
:::::::between
:::15
:::and
:::80
:::for
:::the
:::rain
::::with
::::low
::::::specific
::::::::humidity,
::::and
:::::::between
:::15
:::and
::::250
::for
::the
::::rain
:::and
::::high
:::::::specific
::::::::humidity
:::::::regimes.
:
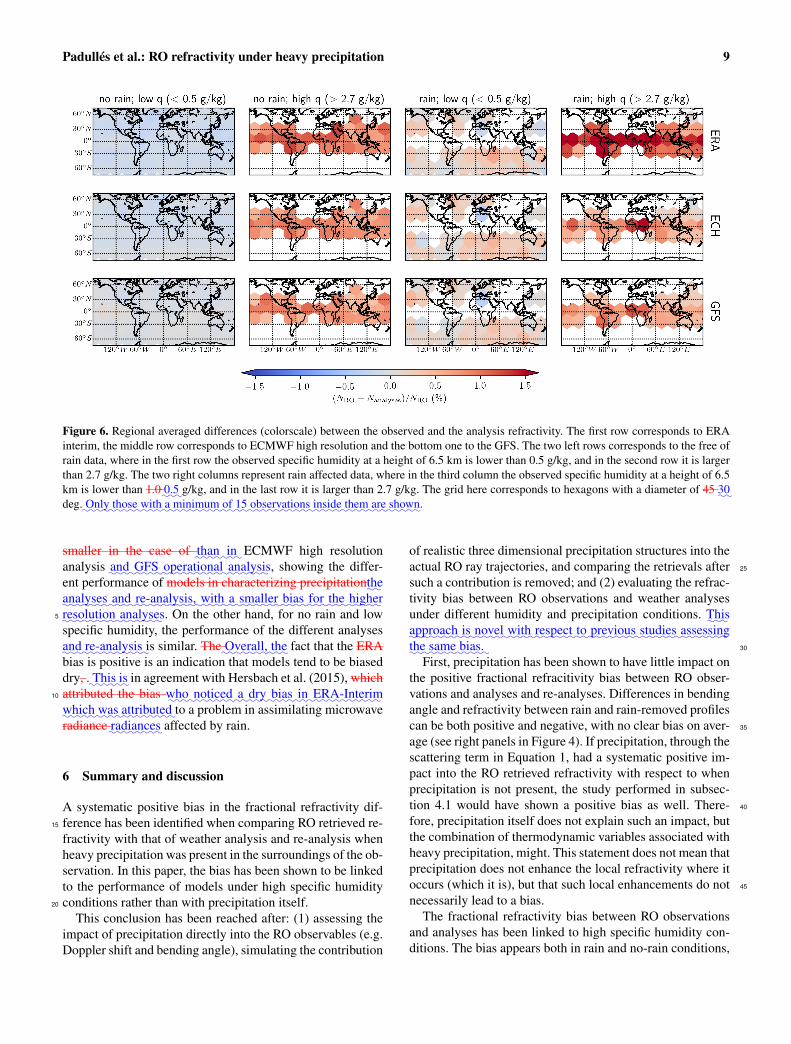
The results in Figure 6 confirm the results anticipated inFigure 5, i.e. the fractional refractivity bias can be linked to45
high specific humidity conditions rather than to precipitationitself. From the regional dependence of the fractional refrac-tivity bias some other conclusions can be extracted. The firstone is that when there is no rain and the specific humidityis low, the fractional refractivity difference is very small re-50
gardless of location and the analyses in use.The second conclusion one can extract from Figure 6 is
that when specific humidity is high, the fractional refractiv-ity difference is positive and reaches large values (> 1%), forall the analyses in use and regardless of the presence of pre-55
Figure 5. Fractional refractivity difference between the observa-tions and analyses as a function of the observed specific humidityat a height of 6 km. The left column corresponds to the no-raincases and the right column corresponds to the rain cases. The toprow shows the results for the comparison of observations and ERA-interim, the middle row show the results for ECMWF high resolu-tion analysis and the bottom row shows the results for the GFS.
cipitation. In particular, high specific humidity observationsare concentrated in the tropics, so the largest positive refrac-tivity bias are in this region, in agreement with Figure 3.
The third conclusion is that precipitation under low spe-cific humidity conditions is rarely observed in the tropics. 60
Under these conditions, the fractional refractivity differencehas a more complicated behavior , more model dependentthan the rest of the cases. In this case,
::and
:no clear positive
bias is observed, but a variability depending on the locationof the observations. 65
The only situation with a prominent negative bias isobserved under this scenario in the west area of Africa.
Finally, even though a:in
::::::::addition
::to
::::the positive frac-
tional refractivity difference bias can be linked to high spe-cific humidity conditions,
:::we
:::::show
::::that
:it is also depen- 70
dent on the analysis in use. For example, the bias is largerin the case of ERA-interim
::::::::::ERA-Interim
:re-analysis , but
Padullés et al.: RO refractivity under heavy precipitation 9
Figure 6. Regional averaged differences (colorscale) between the observed and the analysis refractivity. The first row corresponds to ERAinterim, the middle row corresponds to ECMWF high resolution and the bottom one to the GFS. The two left rows corresponds to the free ofrain data, where in the first row the observed specific humidity at a height of 6.5 km is lower than 0.5 g/kg, and in the second row it is largerthan 2.7 g/kg. The two right columns represent rain affected data, where in the third column the observed specific humidity at a height of 6.5km is lower than 1.0
:::0.5 g/kg, and in the last row it is larger than 2.7 g/kg. The grid here corresponds to hexagons with a diameter of 45
::30
deg.::::Only
::::those
::::with
:a::::::::minimum
::of
::15
:::::::::observations
:::::inside
::::them
:::are
:::::shown.
smaller in the case of::::than
::in
:ECMWF high resolution
analysis:::and
::::GFS
::::::::::operational
:::::::analysis, showing the differ-
ent performance of models in characterizing precipitation::the
:::::::analyses
:::and
::::::::::re-analysis,
::::with
::a:::::::smaller
:::bias
:::for
::::the
:::::higher
::::::::resolution
:::::::analyses. On the other hand, for no rain and low5
specific humidity, the performance of the different analyses
:::and
:::::::::re-analysis
:is similar. The
:::::::Overall,
:::the fact that the ERA
bias is positive is an indication that models tend to be biaseddry, .
::::This
::is in agreement with Hersbach et al. (2015), which
attributed the bias:::who
:::::::noticed
:a::::
dry::::bias
::in
:::::::::::ERA-Interim10
:::::which
:::was
:::::::::attributed to a problem in assimilating microwave
radiance::::::::radiances affected by rain.
6 Summary and discussion
A systematic positive bias in the fractional refractivity dif-ference has been identified when comparing RO retrieved re-15
fractivity with that of weather analysis and re-analysis whenheavy precipitation was present in the surroundings of the ob-servation. In this paper, the bias has been shown to be linkedto the performance of models under high specific humidityconditions rather than with precipitation itself.20
This conclusion has been reached after: (1) assessing theimpact of precipitation directly into the RO observables (e.g.Doppler shift and bending angle), simulating the contribution
of realistic three dimensional precipitation structures into theactual RO ray trajectories, and comparing the retrievals after 25
such a contribution is removed; and (2) evaluating the refrac-tivity bias between RO observations and weather analysesunder different humidity and precipitation conditions.
:::This
:::::::approach
::is:::::novel
::::with
:::::::respect
::to
:::::::previous
::::::studies
::::::::assessing
::the
:::::same
::::bias.
:30
First, precipitation has been shown to have little impact onthe positive fractional refracitivity bias between RO obser-vations and analyses and re-analyses. Differences in bendingangle and refractivity between rain and rain-removed profilescan be both positive and negative, with no clear bias on aver- 35
age (see right panels in Figure 4). If precipitation, through thescattering term in Equation 1, had a systematic positive im-pact into the RO retrieved refractivity with respect to whenprecipitation is not present, the study performed in subsec-tion 4.1 would have shown a positive bias as well. There- 40
fore, precipitation itself does not explain such an impact, butthe combination of thermodynamic variables associated withheavy precipitation, might. This statement does not mean thatprecipitation does not enhance the local refractivity where itoccurs (which it is), but that such local enhancements do not 45
necessarily lead to a bias.The fractional refractivity bias between RO observations
and analyses has been linked to high specific humidity con-ditions. The bias appears both in rain and no-rain conditions,
10 Padullés et al.: RO refractivity under heavy precipitation
and it depends on the analysis:::::::analyses and on the geographic
region.The:::::spatial
:::::::::resolution
::of
:::the
:::::::analyses
::::and
:::::::::re-analyses
:::may
:::::also
::be
::a::::::
factor,:::::
since::::::::::::
ERA-Interim::::::shows
::a:::::larger
:::bias
::::than
:::::::::ECMWF
::::high
:::::::::resolution
:::::::analysis,
::::::::although
::::they
:::::should
:::be
:::::based
::on
:::the
:::::same
:::::::physical
::::::model.
::::::::However,
::::both5
:::::::ECMWF
::::high
:::::::::resolution
::::and
::::GFS
:::::::::operational
::::::::analyses
:::still
::::::exhibit
:a:::::::::
significant:::::::
N-bias::::with
:::::::::increasing
::::::::humidity.
::::The
fact that the bias is not seen in Figure 2 for the no-rain casesis because most of the no-rain cases have low specific hu-midity conditions, and they weight much more for the mean10
value of the fractional refractivity difference. On the otherhand, the rain cases have a larger contribution in the highspecific humidity region (see Figure 5), contributed mostlyby tropical precipitation. This is also seen in the right pan-els in Figure 6, where precipitation with very high specific15
humidity conditions is mostly observed around the equator.The bias in fractional refractivity between observations
and analyses implies that the retrieved temperature and mois-ture will be also biased with respect to models. The positiverefractivity bias is associated with a combination of colder20
retrieved temperature with respect to analyses, and a higherretrieved specific humidity than the one in the analyses.
:::This
:is:::::::::
consistent:::::with
::::::::::::::::::Vergados et al. (2015),
:::::who
::::::::showed
:::that
::::::::::ERA-interim
::is:::::::::::::
systematically::::drier
::::than
:::RO
:::in
:::the
::::::tropics.
Also, the fact that a difference exists between the different25
analyses used for this study, and that RO thermodynamic re-trievals depend on the model
:::::::analyses
::or
:::::::::re-analysis
:in use,
imply that a difference between the retrievals obtained by dif-ferent processing centers will exist under such conditions ifthey use different models
:::::::analyses
::or
::::::::::re-analyses.30
These results stress the need for a better thermodynamiccharacterization of high specific humidity scenarios, likely tobe associated to heavy precipitation. Large scale models
:::The
::::::heights
::at
:::::which
:::the
::::bias
::is
::::::::maximum
::is
::::also
::::::::consistent
::::with
::the
:::::::findings
:::of,
::::e.g.
:::::::::::::::::::::::Holloway and Neelin (2009),
::::who
:::::argue35
:::that
:::::heavy
:::::::::::precipitation
::is
::::::::controlled
::by
:::the
::::free
::::::::::tropospheric
::::water
::::::vapor,
:::and
:::this
::::::::::dependence
::is
:::not
::::well
:::::::captured
::in
::::large
::::scale
:::::::models.
:::::These
:::::::models
:are known to have issues with
the parameterization of convective processes, hence furtherinvestigation in this direction is required. This is the aim40
of polarimetric radio occultations, which will provide jointproducts of temperature, pressure, moisture and an indicationof the amount of precipitation (mostly sensitive to the heav-iest) at each vertical level (Cardellach et al., 2017) with theobjective to advance in the understanding of heavy precipita-45
tion events, closely linked with high specific humidity con-ditions. Alternatively, further investigations are being con-ducted with the aim to make the RO retrievals less dependenton models, which would improve the retrievals itself and pro-vide more independent information of such scenarios.50
Competing interests. The authors declare that they have no conflictof interest.
Acknowledgements. Ramon Padulles and K. N. Wang’s researchwas supported by an appointment to the NASA Postdoctoral Pro-gram at the Jet Propulsion Laboratory, administered by Universities 55
Space Research Association under contract with NASA. The workconducted at ICE-CSIC/IEEC was supported by the Spanish grantESP2015-70014-C2-2-R. Part of Cardellach’s contribution has beensupported by the Radio Occultation Meteorology Satellite Appli-cation Facility (ROM SAF) which is a decentralised operational 60
RO processing centre under EUMETSAT. The JPL co-authors ac-knowledge support from the NASA US Participating Investigator(USPI) program. TRMM and GPM data were obtained courtesy ofthe NASA Precipitation Processing System (PPS). Part of this workwas carried out at the Jet Propulsion Laboratory, California Institute 65
of Technology, under a contract with the National Aeronautics andSpace Administration. ©2017.
::::2018.
:All rights reserved.
References
Anthes, R. A., Bernhardt, P. A., Chen, Y., Cucurull, L., Dymond,K. F., Ector, D., Healy, S. B., Ho, S. P., Hunt, D. C., Kuo, Y. H., 70
Liu, H., Manning, K., McCormick, C., Meehan, T. K., Randel,W. J., Rocken, C., Schreiner, W. S., Sokolovskiy, S. V., Synder-gaard, S., Thompson, D. C., Trenberth, K. E., Wee, T. K., Yen,N. L., and Zeng, Z.: The COSMIC/Formosat-3 mission: Early re-sults, Bulletin of the American Meteorological Society, 89, 313– 75
333, https://doi.org/10.1175/BAMS-89-3-313, 2008.Ao, C. O., Meehan, T. K., Hajj, G. A., and Mannucci,
A. J.: Lower troposphere refractivity bias in GPS occulta-tion retrievals, Journal of Geophysical Research, 108, 1–16,https://doi.org/10.1029/2002JD003216, 2003. 80
Arakawa, A.: The cumulus parameterization prob-lem: Past, present, and future, Journal of Cli-mate, 17, 2493–2525, https://doi.org/10.1175/1520-0442(2004)017<2493:RATCPP>2.0.CO;2, 2004.
Beard, K. V. and Chuang, C.: A new model for the equi- 85
librium shape of raindrops, Journal of the Atmospheric sci-ences, 44, 1509–1524, https://doi.org/dx.doi.org/10.1175/1520-0469(1987)044<1509:ANMFTE>2.0.CO;2, 1987.
Bringi, V. N. and Chandrasekar, V.: Polarimetric doppler weatherradar; principles and applications, Cambridge University Press, 90
2001.Cardellach, E., Tomás, S., Oliveras, S., Padullés, R., Rius, A.,
de la Torre-Juárez, M., Turk, F. J., Ao, C. O., Kursin-ski, E. R., Schreiner, W. S., Ector, D., and Cucurull,L.: Sensitivity of PAZ LEO Polarimetric GNSS Radio- 95
Occultation Experiment to Precipitation Events, IEEE Trans-actions on Geoscience and Remote Sensing, 53, 190–206,https://doi.org/10.1109/TGRS.2014.2320309, 2014.
Cardellach, E., Padullés, R., Tomás, S., Turk, F. J., de la Torre-Juárez, M., and Ao, C. O.: Probability of intense precip- 100
itation from polarimetric GNSS radio occultation observa-tions, Quarterly Journal of the Royal Meteorological Society,https://doi.org/10.1002/qj.3161, 2017.
Cardinali, C. and Healy, S. B.: Impact of GPS radio occultationmeasurements in the ECMWF system using adjoint-based diag- 105
nostics, Quarterly Journal of the Royal Meteorological Society,140, 2315–2320, https://doi.org/10.1002/qj.2300, 2014.
Cucurull, L., Derber, J. C., Treadon, R., and Purser, R. J.:Assimilation of Global Positioning System Radio Occul-
Padullés et al.: RO refractivity under heavy precipitation 11
tation Observations into NCEP’s Global Data Assimila-tion System, Monthly Weather Review, 135, 3174–3193,https://doi.org/10.1175/MWR3461.1, 2007.
Dee, D. P., Uppala, S. M., Simmons, A. J., Berrisford, P., Poli,P., Kobayashi, S., Andrae, U., Balmaseda, M. A., Balsamo, G.,5
Bauer, P., Bechtold, P., Beljaars, A. C. M., van de Berg, L., Bid-lot, J., Bormann, N., Delsol, C., Dragani, R., Fuentes, M., Geer,A. J., Haimberger, L., Healy, S. B., Hersbach, H., Hólm, E. V.,Isaksen, L., Kallberg, P. W., Köhler, M., Matricardi, M., Mcnally,A. P., Monge-Sanz, B. M., Morcrette, J. J., Park, B. K., Peubey,10
C., de Rosnay, P., Tavolato, C., Thépaut, J. N., and Vitart, F.: TheERA-Interim reanalysis: Configuration and performance of thedata assimilation system, Quarterly Journal of the Royal Meteo-rological Society, 137, 553–597, https://doi.org/10.1002/qj.828,2011.15
Fjeldbo, G., Kliore, A., and Eshleman, V. R.: The NeutralAtmosphere of Venus as Studied with the Mariner V Ra-dio Occultation Experiments, The Astronomical Journal, 76,https://doi.org/10.1086/111096, 1971.
Foelsche, U., Syndergaard, S., Fritzer, J., and Kirchengast, G.: Er-20
rors in GNSS radio occultation data: Relevance of the mea-surement geometry and obliquity of profiles, Atmospheric Mea-surement Techniques, 4, 189–199, https://doi.org/10.5194/amt-4-189-2011, 2011.
Hajj, G. A., Kursinski, E. R., Romans, L. J., Bertiger, W. I., and25
Leroy, S. S.: A Technical Description of Atmospheric Sound-ing By Gps occultation, Journal of Atmospheric and solar-terrestrial physics, 64, 451–469, https://doi.org/10.1016/S1364-6826(01)00114-6, 2002.
Healy, S. B. and Eyre, J. R.: Retrieving temperature, water vapour30
and surface pressure information from refractive index pro-files derived by radio occultation: A simulation study, QuarterlyJournal of the Royal Meteorological Society, 126, 1661–1683,https://doi.org/10.1002/qj.49712656606, 2000.
Healy, S. B., Jupp, A. M., and Marquardt, C.: Forecast35
impact experiment with GPS radio occultation mea-surements, Geophysical Research Letters, 32, L03 804,https://doi.org/10.1029/2004GL020806, 2005.
Hersbach, H., Peubey, C., Simmons, A. J., Berrisford, P., Poli,P., and Dee, D.: ERA-20CM: A twentieth-century atmospheric40
model ensemble, Quarterly Journal of the Royal MeteorologicalSociety, 141, 2350–2375, https://doi.org/10.1002/qj.2528, 2015.
Holloway, C. E. and Neelin, J. D.: Moisture Vertical Struc-ture, Column Water Vapor, and Tropical Deep Convec-tion, Journal of the Atmospheric Sciences, 66, 1665–45
1683, https://doi.org/10.1175/2008JAS2806.1, http://dx.doi.org/10.1175/2008JAS2806.1, 2009.
Hou, A. Y., Kakar, R. K., Neeck, S., Azarbarzin, A. A., Kum-merow, C. D., Kojima, M., Oki, R., Nakamura, K., andIguchi, T.: The global precipitation measurement mission, Bul-50
letin of the American Meteorological Society, 95, 701–722,https://doi.org/10.1175/BAMS-D-13-00164.1, 2014.
Huffman, G. J., Bolvin, D., Braithwaite, D., Hsu, K., Joyce, R.,Kidd, C., Nelkin, E. J., Sorooshian, S., Tan, J., and Xie, P.: Algo-rithm Theoretical Basis Document (ATBD) of Integrated Multi-55
satellitE Retrievals for GPM (IMERG), version 4.6, Tech. Rep.March, ftp://arthurhou.pps.eosdis.nasa.gov/gpmdata/, 2017.
Jensen, A. S., Lohmann, M. S., Benzon, H. H., and Nielsen, A. S.:Full spectrum inversion of radio occultation signals, Radio Sci-ence, 38, 1–15, https://doi.org/10.1029/2002RS002763, 2003. 60
Jones, R. C.: A new calculus for the treatment ofoptical systems, J. Opt. Soc. Am., 31, 488–493,https://doi.org/10.1364/JOSA.31.000488, 1941.
Kozu, T., Iguchi, T., Shimomai, T., and Kashiwagi, N.: Raindropsize distribution modeling from a statistical rain parameter re- 65
lation and its application to the TRMM precipitation radar rainretrieval algorithm, Journal of Applied Meteorology and Clima-tology, 48, 716–724, https://doi.org/10.1175/2008JAMC1998.1,2009.
Kummerow, C. D., Simpson, J., Thiele, O., Barnes, W., Chang, 70
A. T. C., Stocker, E., Adler, R. F., Hou, A., Kakar, R.,Wentz, F., Ashcroft, P., Kozu, T., Hong, Y., Okamoto, K.,Iguchi, T., Kuroiwa, H., Im, E., Haddad, Z., Huffman, G.,Ferrier, B., Olson, W. S., Zipser, E. J., Smith, E. A., Wil-heit, T. T., North, G., Krishnamurti, T., and Nakamura, 75
K.: The Status of the Tropical Rainfall Measuring Mis-sion (TRMM) after Two Years in Orbit, Journal of AppliedMeteorology, 39, 1965–1982, https://doi.org/10.1175/1520-0450(2001)040<1965:TSOTTR>2.0.CO;2,http://journals.ametsoc.org/doi/abs/10.1175/ 80
1520-0450%282001%29040%3C1965%3ATSOTTR%3E2.0.CO%3B2, 2000.
Kursinski, E. R., Hajj, G. A., Schofield, J. T., Linfield, R. P.,and Hardy, K. R.: Observing Earth’s atmosphere with radiooccultation measurements using the Global Positioning Sys- 85
tem, Journal of Geophysical Research, 102, 23 429–23 465,https://doi.org/10.1029/97JD01569, 1997.
Liebe, H. J., Hufford, G. A., and Manabe, T.: A model for the com-plex permittivity of water at frequencies below 1 THz, Interna-tional Journal of Infrared and Millimeter Waves, 12, 659–675, 90
https://doi.org/10.1007/BF01008897, 1991.Lin, L., Zou, X., Anthes, R. A., and Kuo, Y. H.: COS-
MIC GPS Radio Occultation Temperature Profiles inClouds, Monthly Weather Review, 138, 1104–1118,https://doi.org/10.1175/2009MWR2986.1, 2010. 95
Liu, C. and Zipser, E. J.: The global distribution of largest, deepest,and most intense precipitation systems, Geophysical ResearchLetters, 42, 3591–3595, https://doi.org/10.1002/2015GL063776,2015.
Mishchenko, M. I., Travis, L. D., and Mackowski, D. W.: T-matrix 100
computations of light scattering by nonspherical particles: A re-view, Journal of Quantitative Spectroscopy and Radiative Trans-fer, 55, 535–575, http://www.sciencedirect.com/science/article/pii/0022407396000027, 1996.
NOAA/NCEP, C. E. M.: The GFS Atmospheric Model, 105
NOAA/NCEP/Environmental Modeling Center Office Note,442, 14, 2003.
Oguchi, T.: Electromagnetic wave propagation and scattering in rainand other hydrometeors, Proceedings of the IEEE, 71, 1029–1078, https://doi.org/10.1109/PROC.1983.12724, 1983. 110
Padullés, R., Cardellach, E., de la Torre-Juárez, M., Tomás, S., Turk,F. J., Oliveras, S., Ao, C. O., and Rius, A.: Atmospheric po-larimetric effects on GNSS Radio Occultations: the ROHP-PAZfield campaign, Atmospheric Chemistry and Physics, 2, 635–649, https://doi.org/10.5194/acp-16-635-2016, 2016. 115
12 Padullés et al.: RO refractivity under heavy precipitation
Pruppacher, H. R. and Beard, K. V.: A wind tunnel investigation ofthe internal circulation and shape of water drops falling at termi-nal velocity in air, Quarterly Journal of the Royal MeteorologicalSociety, 96, 247–256, https://doi.org/10.1002/qj.49709640807,1970.5
Sokolovskiy, S. V.: Effect of superrefraction on inversions of radiooccultation signals in the lower troposphere, Radio Science, 38,1–14, https://doi.org/10.1029/2002RS002728, 2003.
Sokolovskiy, S. V., Rocken, C., Schreiner, W. S., and Hunt, D. C.:On the uncertainty of radio occultation inversions in the lower10
troposphere, Journal of Geophysical Research Atmospheres,115, 1–19, https://doi.org/10.1029/2010JD014058, 2010.
Thayer, G. D.: An improved equation for the radio re-fractive index of air, Radio Science, 9, 803–807,https://doi.org/10.1029/RS009i010p00803, 1974.15
Vergados, P., Mannucci, A. J., Ao, C. O., Jiang, J. H., and Su, H.:On the comparisons of tropical relative humidity in the lowerand middle troposphere among COSMIC radio occultations andMERRA and ECMWF data sets, Atmospheric MeasurementTechniques, 8, 1789–1797, https://doi.org/10.5194/amt-8-1789-20
2015, http://www.atmos-meas-tech.net/8/1789/2015/, 2015.Vorob’ev, V. V. and Krasil’nikova, T. G.: Estimation of the accu-
racy of the atmospheric refractive index recovery from Dopplershift measurements at frequencies used in the NAVSTAR system,Physics of Atmosphere an Ocean, 23, 602–609, 1994.25
Wang, K.-N., de la Torre Juarez, M., Ao, C. O., and Xie, F.: Cor-recting negatively-biased refractivity below ducts in GNSS ra-dio occultation: An optimal estimation approach towards im-proving planetary boundary layer (PBL) characterization, Atmo-spheric Measurement Techniques, https://doi.org/10.5194/amt-30
2017-105, 2017.Xie, F., Syndergaard, S., Kursinski, E. R., and Herman, B. M.: An
approach for retrieving marine boundary layer refractivity fromGPS occultation data in the presence of superrefraction, Jour-nal of Atmospheric and Oceanic Technology, 23, 1629–1644,35
https://doi.org/10.1175/JTECH1996.1, 2006.Xie, F., Wu, D. L., Ao, C. O., Mannucci, A. J., and Kursin-
ski, E. R.: Advances and limitations of atmospheric bound-ary layer observations with GPS occultation over southeast Pa-cific Ocean, Atmospheric Chemistry and Physics, 12, 903–918,40
https://doi.org/10.5194/acp-12-903-2012, 2012.Yang, S. and Zou, X.: Assessments of cloud liquid water
contributions to GPS radio occultation refractivity us-ing measurements from COSMIC and CloudSat, Jour-nal of Geophysical Research: Atmospheres, 117, 1–11,45
https://doi.org/10.1029/2011JD016452, 2012.Yang, S. and Zou, X.: Dependence of positive refractivity bias
of GPS RO cloudy profiles on cloud fraction along GPS ROlimb tracks, GPS Solutions, https://doi.org/10.1007/s10291-016-0541-1, 2016.50
Zou, X., Yang, S., and Ray, P. S.: Impacts of Ice Clouds on GPS ROMeasurements, Journal of the Atmospheric Sciences, 69, 3670–3682, https://doi.org/10.1175/JAS-D-11-0199.1, 2012.