review of physicochemical characterization of biomass ... · using lignocellulosic biom ass derived...
TRANSCRIPT
1
Review of Physicochemical Properties and Analytical Characterization of
Lignocellulosic Biomass
(to be submitted to Renewable and Sustainable Energy Reviews)
Junmeng Cai *,a, Yifeng He a, Xi Yu b, Scott W. Banks b, Yang Yang b, Xingguang Zhang c,
Yang Yu a, Ronghou Liu a, Anthony V. Bridgwater b
a Biomass Energy Engineering Research Center, Key Laboratory of Urban Agriculture (South)
of Ministry of Agriculture, School of Agriculture and Biology, Shanghai Jiao Tong University,
800 Dongchuan Road, Shanghai 200240, People’s Republic of China
b Bioenergy Research Group, European Bioenergy Research Institute, Aston University,
Birmingham, B4 7ET, United Kingdom
c Department of Chemical Engineering, Nanjing Forestry University, 159 Longpan Road,
Nanjing 210037, People’s Republic of China
* Corresponding author: Junmeng Cai. Tel.: +86-21-34206624; Email: [email protected].
Graphical abstract ............................................................................................................................................ 2
Abstract ........................................................................................................................................................... 2
1 Introduction .................................................................................................................................................. 3
2 Basis of analysis ........................................................................................................................................... 7
3 Physical properties ....................................................................................................................................... 9
3.1 Particle size ....................................................................................................................................... 9
3.2 Grindability ..................................................................................................................................... 12
3.3 Density ............................................................................................................................................ 13
3.3.1 Particle density ..................................................................................................................... 13
3.3.2 Bulk density .......................................................................................................................... 14
3.4 Flowability ...................................................................................................................................... 15
3.5 Moisture sorption ............................................................................................................................ 16
3.6 Thermal properties .......................................................................................................................... 18
3.6.1 Thermal conductivity............................................................................................................ 19
3.6.2 Specific heat ......................................................................................................................... 19
4 Chemical properties .................................................................................................................................... 20
4.1 Proximate analysis ........................................................................................................................... 20
4.1.1 General introduction ............................................................................................................. 20
© 2017, Elsevier. Licensed under the Creative Commons Attribution-NonCommercial-NoDerivatives 4.0 Internationalhttp://creativecommons.org/licenses/by-nc-nd/4.0/
2
4.1.2 ASTM standard method ........................................................................................................ 21
4.1.3 Thermogravimetric analysis method .................................................................................... 21
4.1.4 Typical results ....................................................................................................................... 24
4.2 Ultimate analysis ............................................................................................................................. 25
4.3 Energy content ................................................................................................................................. 29
4.4 Compositional analysis ................................................................................................................... 30
4.4.1 General introduction ............................................................................................................. 30
4.4.2 Sulfuric acid hydrolysis method ........................................................................................... 31
4.4.3 NIRS method ........................................................................................................................ 32
4.4.4 Kinetic method ..................................................................................................................... 33
4.4.5 Typical results ....................................................................................................................... 34
5 Summaries .................................................................................................................................................. 35
Acknowledgements ....................................................................................................................................... 40
References ..................................................................................................................................................... 40
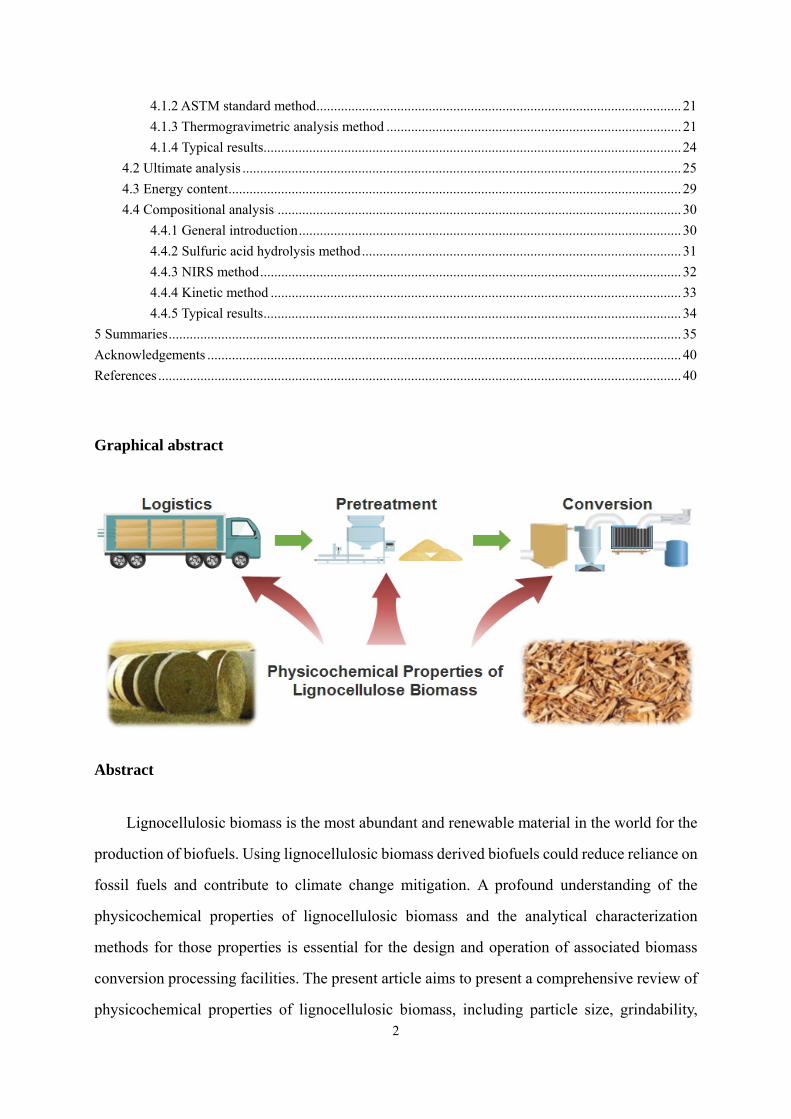
Graphical abstract
Abstract
Lignocellulosic biomass is the most abundant and renewable material in the world for the
production of biofuels. Using lignocellulosic biomass derived biofuels could reduce reliance on
fossil fuels and contribute to climate change mitigation. A profound understanding of the
physicochemical properties of lignocellulosic biomass and the analytical characterization
methods for those properties is essential for the design and operation of associated biomass
conversion processing facilities. The present article aims to present a comprehensive review of
physicochemical properties of lignocellulosic biomass, including particle size, grindability,
3
density, flowability, moisture sorption, thermal properties, proximate analysis properties,
elemental composition, energy content and chemical composition. The corresponding
characterization techniques for these properties and their recent development are also presented.
This review is intended to provide the readers systematic knowledge in the physicochemical
properties of lignocellulosic biomass and characterization techniques for the conversion of
biomass and the application of biofuels.
Key words: lignocellulosic biomass; physicochemical properties; biofuel; biomass conversion;
analytical characterization
1 Introduction
Biofuels offer the prospective to reduce the reliance on use of fossil fuels, address the fuel
security and environment issues, and favor some socioeconomic benefits such as sustainable
development and creating jobs [1]. According to International Energy Agency, biomass energy
accounts for about 14% of the world’s total primary energy supply [2]. Lignocellulosic biomass
is the most abundant and renewable material in the world for the production of biofuels [3],
which can be used as a fuel resource alternative to fossil resources.
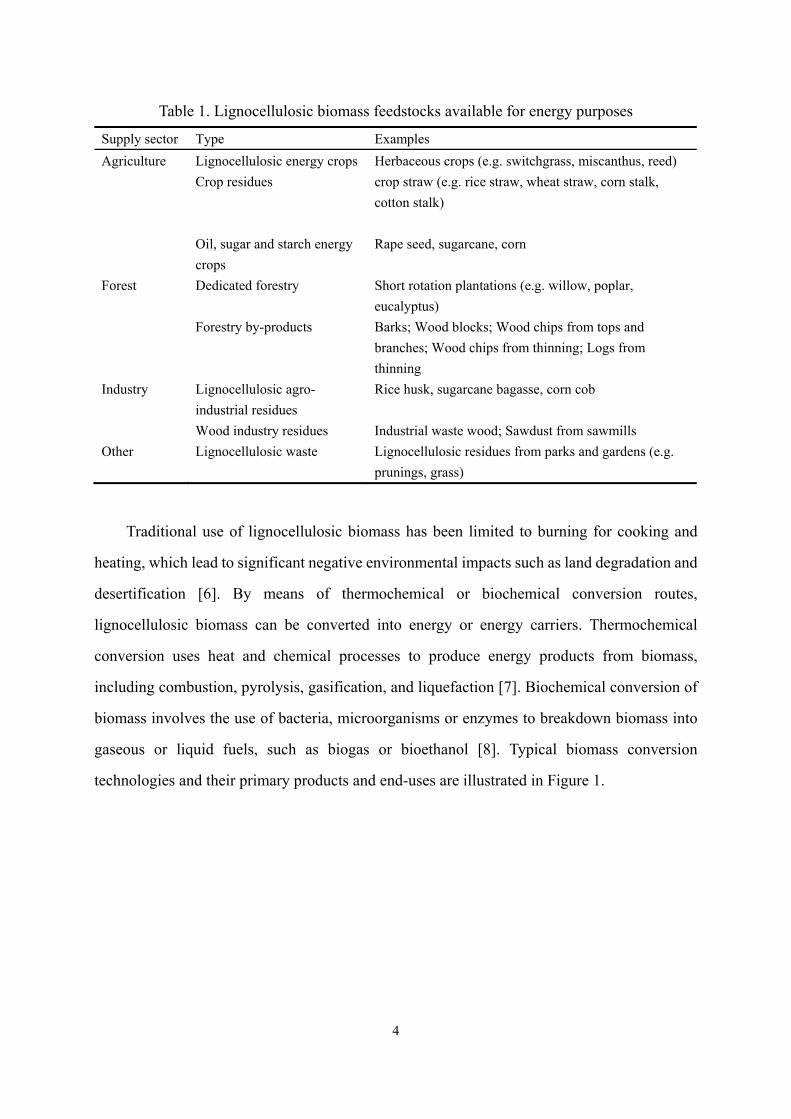
Lignocellulosic biomass refers to plant dry matter, which is mainly composed of cellulose,
hemicellulose and lignin [4]. The lignocellulosic biomass feedstocks available for energy
purpose are mainly from the following sectors: agriculture, forest, and industry. Table 1 lists
various types of lignocellulosic biomass with some examples. Agricultural wastes and forest
residues are the most promising biomass feedstocks for their abundance and relatively low cost
[5].
4
Table 1. Lignocellulosic biomass feedstocks available for energy purposes
Supply sector Type Examples
Agriculture Lignocellulosic energy crops Herbaceous crops (e.g. switchgrass, miscanthus, reed)
Crop residues crop straw (e.g. rice straw, wheat straw, corn stalk,
cotton stalk)
Oil, sugar and starch energy
crops
Rape seed, sugarcane, corn
Forest Dedicated forestry Short rotation plantations (e.g. willow, poplar,
eucalyptus)
Forestry by-products Barks; Wood blocks; Wood chips from tops and
branches; Wood chips from thinning; Logs from
thinning
Industry Lignocellulosic agro-
industrial residues
Rice husk, sugarcane bagasse, corn cob
Wood industry residues Industrial waste wood; Sawdust from sawmills
Other Lignocellulosic waste Lignocellulosic residues from parks and gardens (e.g.
prunings, grass)
Traditional use of lignocellulosic biomass has been limited to burning for cooking and
heating, which lead to significant negative environmental impacts such as land degradation and
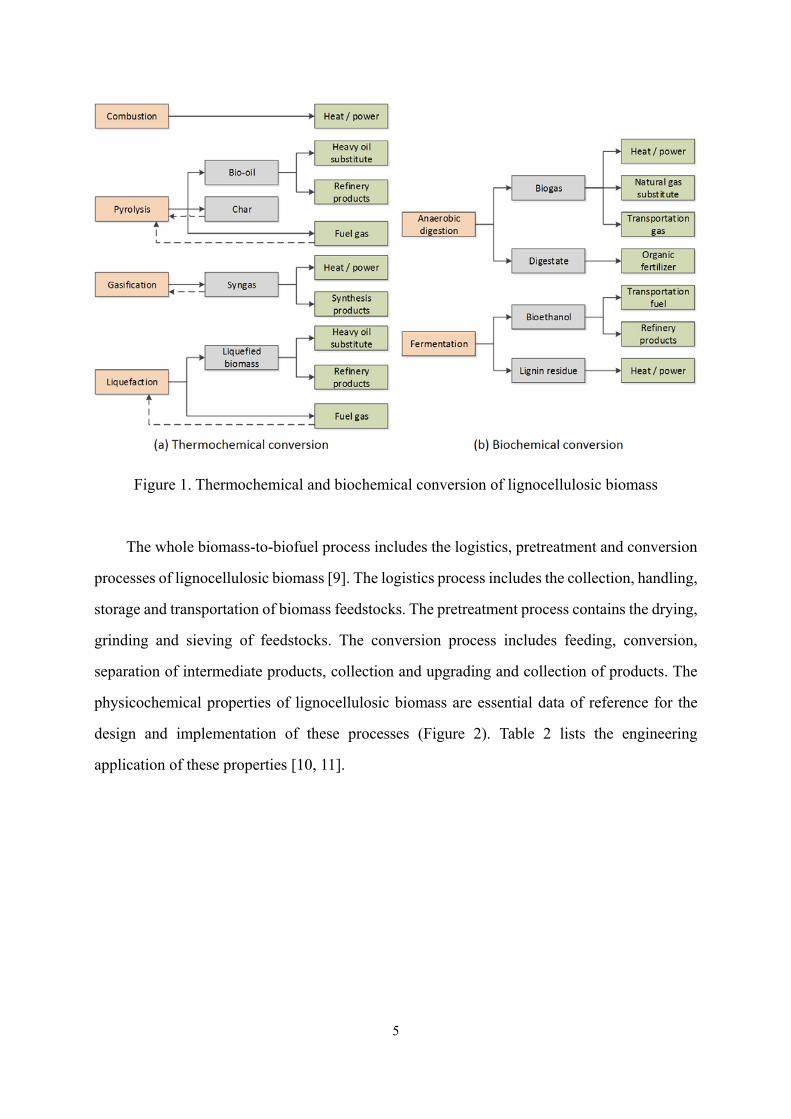
desertification [6]. By means of thermochemical or biochemical conversion routes,
lignocellulosic biomass can be converted into energy or energy carriers. Thermochemical
conversion uses heat and chemical processes to produce energy products from biomass,
including combustion, pyrolysis, gasification, and liquefaction [7]. Biochemical conversion of
biomass involves the use of bacteria, microorganisms or enzymes to breakdown biomass into
gaseous or liquid fuels, such as biogas or bioethanol [8]. Typical biomass conversion
technologies and their primary products and end-uses are illustrated in Figure 1.
5
Figure 1. Thermochemical and biochemical conversion of lignocellulosic biomass
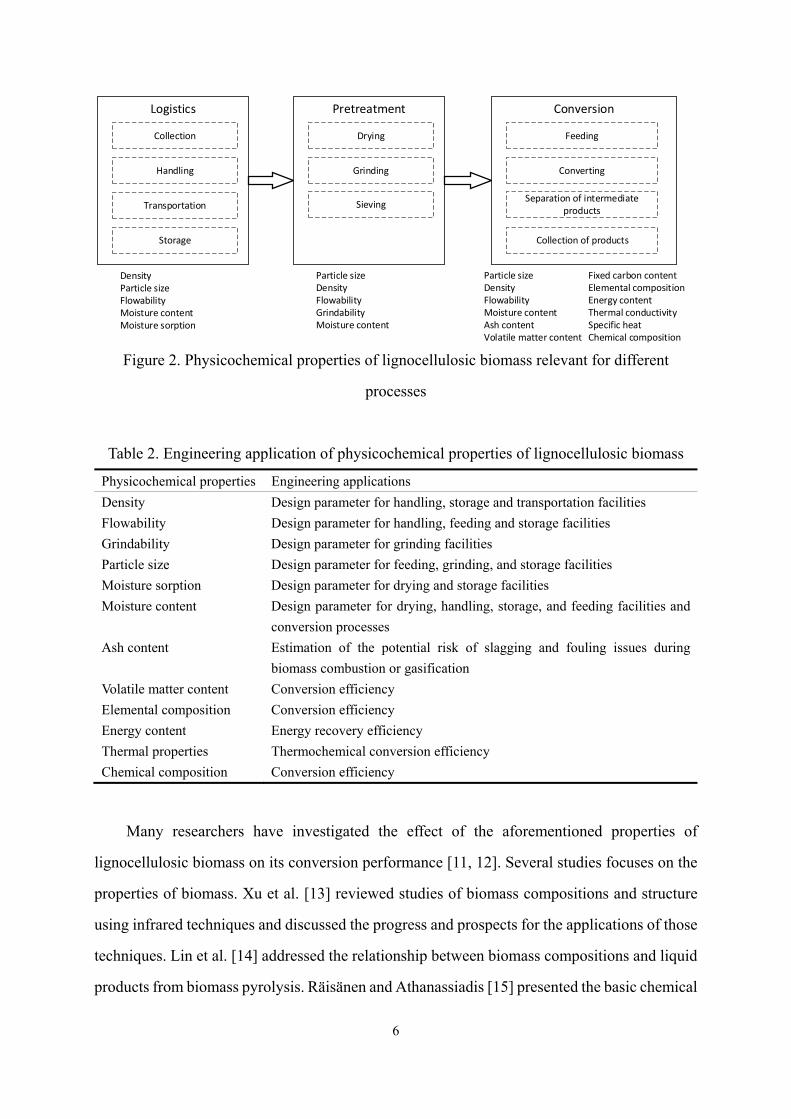
The whole biomass-to-biofuel process includes the logistics, pretreatment and conversion
processes of lignocellulosic biomass [9]. The logistics process includes the collection, handling,
storage and transportation of biomass feedstocks. The pretreatment process contains the drying,
grinding and sieving of feedstocks. The conversion process includes feeding, conversion,
separation of intermediate products, collection and upgrading and collection of products. The
physicochemical properties of lignocellulosic biomass are essential data of reference for the
design and implementation of these processes (Figure 2). Table 2 lists the engineering
application of these properties [10, 11].
6
Logistics
DensityParticle sizeFlowabilityMoisture contentMoisture sorption
Collection
Handling
Transportation
Storage
Pretreatment
Drying
Grinding
Sieving
Conversion
Feeding
Converting
Separation of intermediate products
Collection of products
Particle sizeDensityFlowabilityGrindabilityMoisture content
Particle sizeDensityFlowabilityMoisture contentAsh contentVolatile matter content
Fixed carbon contentElemental compositionEnergy contentThermal conductivitySpecific heatChemical composition
Figure 2. Physicochemical properties of lignocellulosic biomass relevant for different
processes
Table 2. Engineering application of physicochemical properties of lignocellulosic biomass
Physicochemical properties Engineering applications
Density Design parameter for handling, storage and transportation facilities
Flowability Design parameter for handling, feeding and storage facilities
Grindability Design parameter for grinding facilities
Particle size Design parameter for feeding, grinding, and storage facilities
Moisture sorption Design parameter for drying and storage facilities
Moisture content Design parameter for drying, handling, storage, and feeding facilities and
conversion processes
Ash content Estimation of the potential risk of slagging and fouling issues during
biomass combustion or gasification
Volatile matter content Conversion efficiency
Elemental composition Conversion efficiency
Energy content Energy recovery efficiency
Thermal properties Thermochemical conversion efficiency
Chemical composition Conversion efficiency
Many researchers have investigated the effect of the aforementioned properties of
lignocellulosic biomass on its conversion performance [11, 12]. Several studies focuses on the
properties of biomass. Xu et al. [13] reviewed studies of biomass compositions and structure
using infrared techniques and discussed the progress and prospects for the applications of those
techniques. Lin et al. [14] addressed the relationship between biomass compositions and liquid
products from biomass pyrolysis. Räisänen and Athanassiadis [15] presented the basic chemical
7
compositions of three forest biomasses (pine, spruce and birch). Arnoult et al. [16] gave a
review on miscanthus biomass production and composition for bioenergy use. Isikgor and
Becer [17] summarized the cellulose, hemicellulose and lignin contents of various biomasses
including hardwood, softwood, agricultural residues and grasses. Vassilev et al. [18] focused
on the elemental compositions of biomass including the contents of C, O, H, N, Ca, K, Si, Mg,
Al, S, Fe, P, Cl, Na, Mn, and Ti. Vassilev et al. [19] compared the advantages and disadvantages
of compositions of biomass and coal and obtained that the disadvantages of biomass for biofuel
prevail over the advantages, but the environmental, economic and social benefits appear to
compensate the technological and other barriers. However, there remains no comprehensive
compilation of various physicochemical properties of lignocellulosic biomass and the analytical
characterization methods for those properties in literature. This review concentrates on the
physicochemical properties of lignocellulosic biomass, the analytical characterization methods
for those properties, and recent progress in understanding those physicochemical properties.
2 Basis of analysis
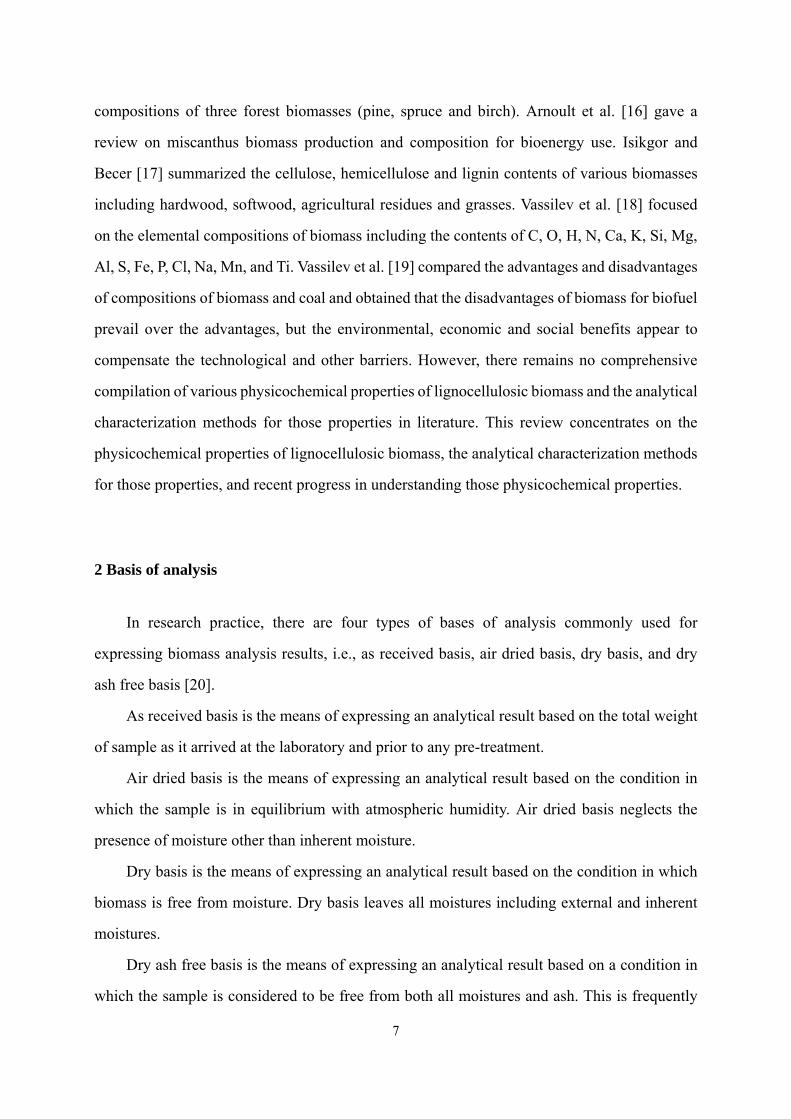
In research practice, there are four types of bases of analysis commonly used for
expressing biomass analysis results, i.e., as received basis, air dried basis, dry basis, and dry
ash free basis [20].
As received basis is the means of expressing an analytical result based on the total weight
of sample as it arrived at the laboratory and prior to any pre-treatment.
Air dried basis is the means of expressing an analytical result based on the condition in
which the sample is in equilibrium with atmospheric humidity. Air dried basis neglects the
presence of moisture other than inherent moisture.
Dry basis is the means of expressing an analytical result based on the condition in which
biomass is free from moisture. Dry basis leaves all moistures including external and inherent
moistures.
Dry ash free basis is the means of expressing an analytical result based on a condition in
which the sample is considered to be free from both all moistures and ash. This is frequently
8
used in ultimate analysis to show the contents of elements in the organic fractions of the biomass
sample.
Figure 3 shows the components of biomass reporting to different bases of analysis.
Total moistures
Ash
Volatile matter
Fixed carbonD
ry a
sh fr
ee b
asis
Dry
basis
Air d
ried
basi
s
As re
ceiv
ed b
asis
External moisture
Inherent moisture
Figure 3. Components of biomass reporting to different bases
In converting some properties from one basis to another, the following general formula
can be used [21]:
wanted given cP P f (1)
where wantedP is the property based on a wanted basis, givenP is the property based on a given
basis, and fc is the conversion factor. Table 3 lists the conversion factors between different bases
of analysis, where M represents the moisture content, A represents the ash content, the
subscripts ARB, ADB and DB represent the values related on as received basis, air dried basis
and dry basis.
9
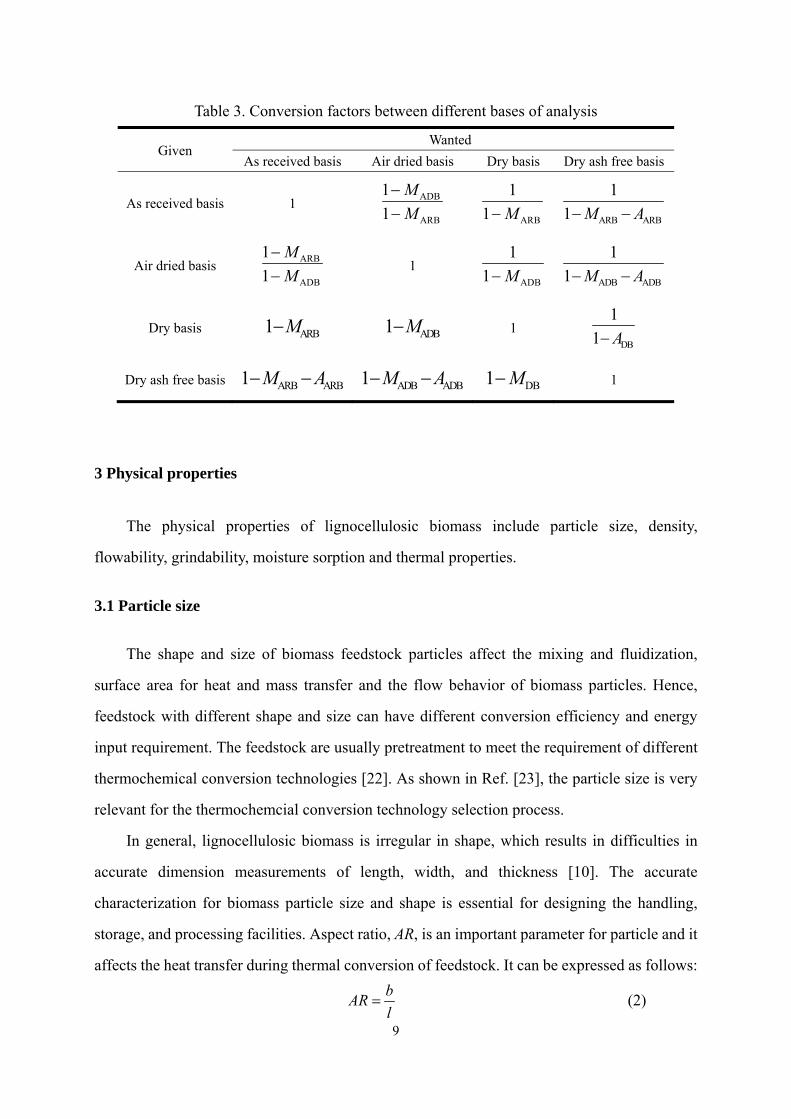
Table 3. Conversion factors between different bases of analysis
Given Wanted
As received basis Air dried basis Dry basis Dry ash free basis
As received basis 1 ADB
ARB
1
1
M
M
ARB
1
1 M
ARB ARB
1
1 M A
Air dried basis ARB
ADB
1
1
M
M
1 ADB
1
1 M
ADB ADB
1
1 M A
Dry basis ARB1 M ADB1 M 1 DB
1
1 A
Dry ash free basis ARB ARB1 M A ADB ADB1 M A DB1 M 1
3 Physical properties
The physical properties of lignocellulosic biomass include particle size, density,
flowability, grindability, moisture sorption and thermal properties.
3.1 Particle size
The shape and size of biomass feedstock particles affect the mixing and fluidization,
surface area for heat and mass transfer and the flow behavior of biomass particles. Hence,
feedstock with different shape and size can have different conversion efficiency and energy
input requirement. The feedstock are usually pretreatment to meet the requirement of different
thermochemical conversion technologies [22]. As shown in Ref. [23], the particle size is very
relevant for the thermochemcial conversion technology selection process.
In general, lignocellulosic biomass is irregular in shape, which results in difficulties in
accurate dimension measurements of length, width, and thickness [10]. The accurate
characterization for biomass particle size and shape is essential for designing the handling,
storage, and processing facilities. Aspect ratio, AR, is an important parameter for particle and it
affects the heat transfer during thermal conversion of feedstock. It can be expressed as follows:
b
ARl
(2)
10
where AR is aspect ratio, b is the width which is the minimum distance between two parallel
lines tangential to the projected outline of the particle, l is the length which is the maximum
distance between two parallel lines perpendicular to the tangents for the width. According to
Ref. [24], the aspect ratio of biomass particles affects the heat transfer during their thermal
conversion.
Sieving analysis and imaging particle analysis are two major particle size characterization
methods [10].
In sieving analysis, a set of sieves with different opening sizes and a suitable screen shaker
are required. The sieves are arranged horizontally in a stack with gradually reduced opening
size from top to bottom. The determination of the size distribution of particulate biomass
feedstocks by sieving analysis can follow the American National Standards Institute / American
Society of Agricultural Engineerings (ANSI/ASAE) standard S424.1 [25] or the British
Standard / European Standard / International Organization for Standardization (BS EN ISO)
standard 17827-1:2016 [26]. The sieve stack is placed in the shaker, which requires the sieve
stack mounted on top of a shaker with fixed shaking time. The materials remained on each sieve
are weighed after the shaking. The geometric mean diameter of the measured samples dgm can
be calculated as follows:
11
loglog
i i i
gmi
M d dd
M
(3)
where di is the diagonal of screen apertures of the ith screen, di-1 is the diagonal of screen
apertures in the next larger screen (just above in the set), and Mi is the mass on the ith screen.
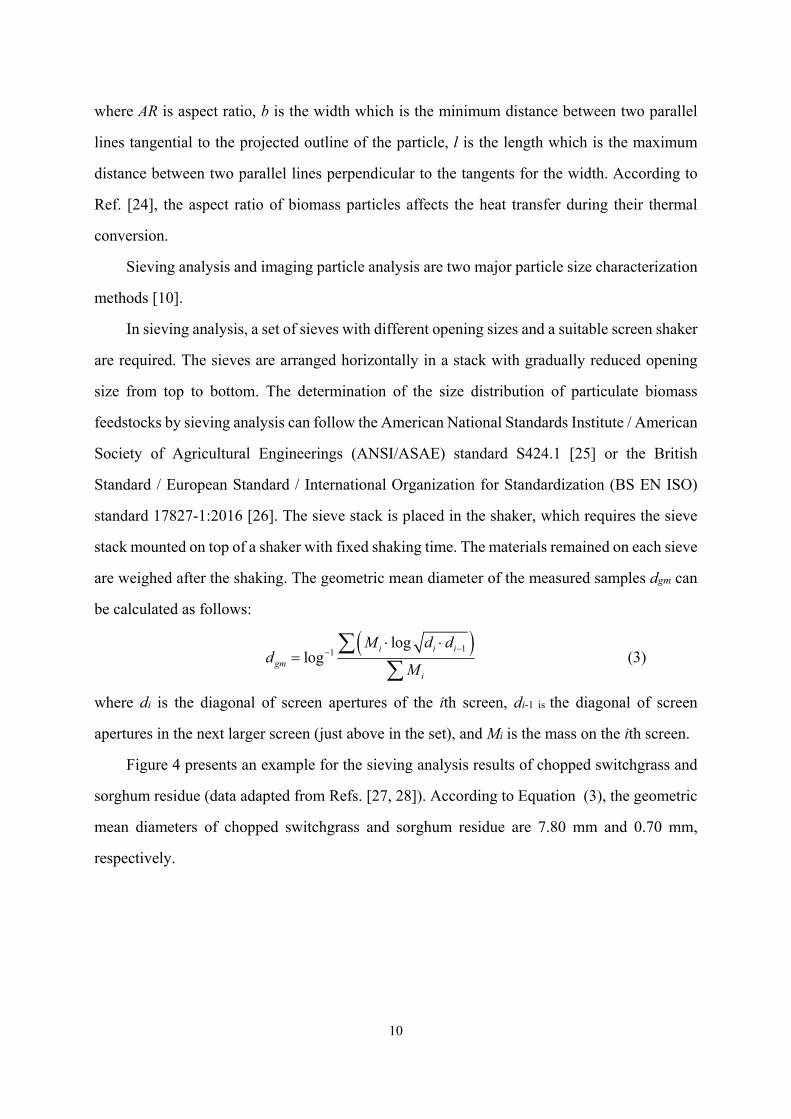
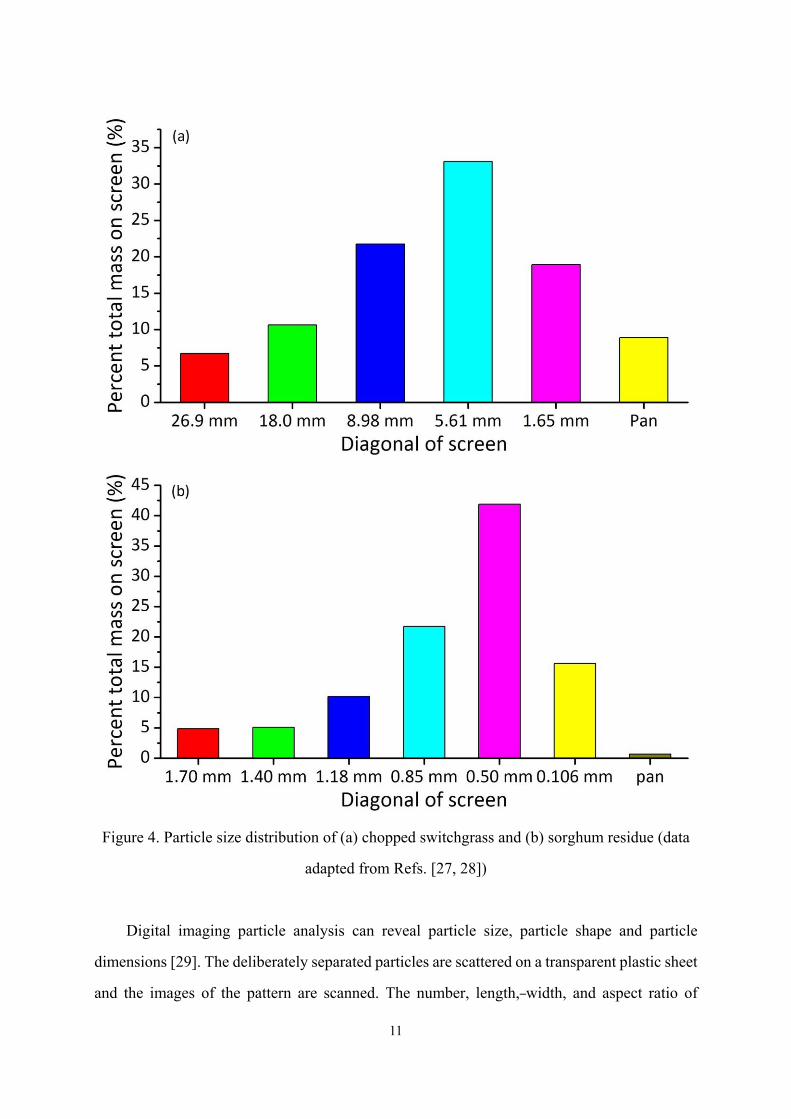
Figure 4 presents an example for the sieving analysis results of chopped switchgrass and
sorghum residue (data adapted from Refs. [27, 28]). According to Equation (3), the geometric
mean diameters of chopped switchgrass and sorghum residue are 7.80 mm and 0.70 mm,
respectively.
11
Figure 4. Particle size distribution of (a) chopped switchgrass and (b) sorghum residue (data
adapted from Refs. [27, 28])
Digital imaging particle analysis can reveal particle size, particle shape and particle
dimensions [29]. The deliberately separated particles are scattered on a transparent plastic sheet
and the images of the pattern are scanned. The number, length, width, and aspect ratio of
12
particles can be obtained by analyzing the images.
In general, biomass feedstock should be comminuted to make it from its as received
condition to the final particle size specification required by the end user [30]. The feedstock
commination is dependent on many factors including biomass material properties and process
variables of the grinding system [31]. In general, particle sizes of ground biomass have a log-
normal distribution, which indicates that the number of smaller biomass particles are
considerably greater than that of larger particles.
3.2 Grindability
Biomass pretreatment includes particle size reduction, which is related on another physical
property: grindability. The grindability of a material is a measure of its resistance to grind. The
lignocellulosic components of biomass, especially cellulose and lignin, are very fibrous and
difficult to grind [32].
Standard grindability tests have been developed for coal [33] and petroleum coke [34],
which use the Hardgrove Grindability Index (HGI) test [35]. Currently, there is no standard
grindability test for biomass. Several studies used the HGI test for coal on biomass [36-41]. The
HGI of a material can be determined empirically using a sample mill according to the following
procedure [33]: 1) a small mass of prepared sample is filled into the sample mill; 2) after a
standard number of rounds, the grinded material is sieved; 3) the quantity less than a specified
size is recorded and converted into a HGI value. The lower the HGI, the harder and less
grindable the material. Typical HGI values lie between 30 and 100.
The above classical HGI method is inadequate for characterizing the grindabilities of
biomass as it involves pregrinding to obtain a sample with a particle size in the range of 0.6 –
1.2 mm prior to the HGI test [42]. And the grinding energy is not considered by the HGI method.
Thus, an alternative Bond Work Index (BWI) method was proposed for the estimation of the
grindability of biomass [43]. The BWI is defined as the calculated specific energy applied in
reducing material of infinite particle size to 80% passing 100 μm. The higher the BWI value,
the more energy is required to grind a material in a ball mill. The BWI test is widely used in the
13
mining industry for determining the resistance of the material to ball milling and for estimating
the energy consumption for grinding [44]. Williams et al. [43] obtained the BWI values of some
biomass pellets, which ranged from 15 to 420 kWh t-1. The grindability of torrefied pellet is the
best, and that of wood pellet is the worst.
The grindability of biomass can be greatly improved due to increased brittleness and a
reduction of the cellulose fiber length through torrefaction [39, 45].
Grinding biomass is an energy-intensive process. Energy consumption for grinding
depends on the initial and final biomass particle size, moisture content, material properties,
mass feed rate and machine variables such as screen size and type of grinding equipment [46].
Mani et al. [47] correlated the grinder screen size and the energy requirement for a hammer
mill. The results showed that the energy consumption for grinding biomass from a mean chop
size of 7.15 mm to between 3.5 and 0.5 mm could be approximated by the following equation:
2 = 5.31 * 30.86* + 55.45g p pE d d (4)
where Eg is the energy consumption for grinding (kWh t-1), and dp is the particle size (mm).
3.3 Density
Biomass can be characterized using two densities: the particle density and the bulk density
[48].
3.3.1 Particle density
For a group of biomass particles, the particle density is the mass of all particles divided by
the volume which the particles occupy excluding the pore space volume [10]:
pp
p
m
V (5)
where p is the particle density, pm is the particle mass, and pV is the particle true volume.
For biomass particles that cannot be defined geometrically, their true volume can be determined
by the pressure difference with a known quantity of pressurized gas flowing from a reference
14
volume into a cell containing biomass particles [10].
1
2
1p c R
PV V V
P
(6)
where cV is the sample cell volume, RV is the reference volume, 1P is the pressure after
pressurizing the reference volume, and 2P is the pressure after including cV .
The particle density of biomass is usually used in the computational fluid dynamics
simulation of biomass thermochemical conversion reactors [49].
3.3.2 Bulk density
The bulk density is the ratio of the mass of biomass particles to the total volume of biomass
particles including the pore space volume between and within the biomass particles. It is a key
physical property in designing the logistic system for biomass handling and transport. It
depends on the biomass particle size and shape, moisture content, particle density, and surface
characteristics [50].
The measurement of the bulk density of a biomass sample can be performed in accordance
with the American Society for Testing and Materials (ASTM) standard E873 - 82 [51]. The
standard involves pouring the biomass sample into a standard-size box (305 mm × 305 mm ×
305 mm) from a height of 610 mm. The excess material is removed by striking a straight edge
across the top of the container. The net mass of the sample is obtained and the bulk density can
be determined.
Bulk densities of different biomass feedstocks show extreme variation, from lows of 15 –
200 kg m-3 for cereal grain straws to highs of 280 – 480 kg m-3 for hardwood chips [52].
Generally, the bulk density of lignocellulosic biomass is relatively low compared with the bulk
density of coal (about 900 kg m-3) [53]. The bulk density of biomass is also dependent on the
degree of fill tightness. Lam et al. [54] pointed out that the bulk density of switchgrass ranged
from 50 to 264 kg m-3 for loose fill and from 68 to 325 kg m-3 for packed fill after tapping.
The pore spaces in bulk samples can be described by the porosity, which is defined by the
following formula:
15
0 1 b
p
(7)
where 0 is the porosity of bulk biomass, b is the bulk density, and p is the particle
density.
3.4 Flowability
The flow properties of biomass feedstocks play an important role in the transportation,
storage, and handling [55]. Bridging of biomass particles usually occurs in the feeding
subsystem of biomass conversion systems [56, 57]. Flowability, as a foremost flow property, is
a measure of how well biomass flows from one point to another point [58].
Several parameters are commonly reported to characterize the flowability of biomass: the
angle of repose, cohesion coefficient, compressibility index, and flow index [59].
The angle of repose is the steepest angle at which a heap of biomass particles can remain
stable without slumping [60]. It can range from 0° to 90°. There are numerous methods for
measuring angle of repose, for example, the titling box method, the fixed funnel method, and
the revolving cylinder method [61].
The fixed funnel method presented in the ASTM standard C144 [62] is introduced here.
Sieved biomass particles are slowly poured through a funnel to form a cone. Stop pouring
biomass particles when the pile reaches a predetermined height or the base a predetermined
width. The angle of repose can be calculated:
1tanH
R
(8)
where is the angle of repose, H and R are the height and radius of the piling cone.
Different angles of repose correspond to different flowability grades. The flowability of
biomass can be generally classified as high flowing, medium flowing, low flowing, cohesive,
and very cohesive [10]. Mani [63] gave the flowability grades under different ranges of angle
of repose (Table 4).
16
Table 4. Classification of biomass flowability by angle of repose and flow index
Angle of repose Flow index Flowability grade
55°< FI < 1 Very cohesive 45°<<55° 1< FI < 2 Cohesive 38°<<45° 2 < FI < 4 Low flowing 30°<<38° 4 < FI < 10 Medium flowing
<30° FI > 10 High flowing
The cohesion coefficient between the particles is a function of the diameter of the particles
and the angle of repose [64]:
21 4sincos cos
2C d
d
(9)
where C is the cohesion coefficient and d is the diameter of the particles.
With certain consolidating pressure, the bulk density of biomass increases. Then the
compressibility index of biomass can be obtained [65]:
1 bib
bf
C
(10)
where Cb is the compressibility, bi is the initial bulk density before consolidation, bf is
the final bulk density at the given consolidation pressure.
The shear tester can be used to quantify the flow behavior of biomass particles. The method
is well-defined in the ASTM standard D6128-16 [66]. The unconfined yield stress ( c ) and the
major consolidating stress ( 1 ) can be recorded. The flow function for biomass particles can
be then obtained from the slope of the linear fit of c versus 1 plot. The inverse of the flow
function is the flow index. Jenike [67] used the flow index to categorize the flowability of
particles (Table 4).
3.5 Moisture sorption
The study on the moisture sorption of biomass is important for biomass harvest, handling,
transport and storage. Therefore, proper drying and storage operations are required to preserve
17
the quality of biomass feedstocks.
The Equilibrium Moisture Content (EMC) is a key parameter to characterize the water
sorption behavior of biomass, and it is defined as the moisture content of a material in
equilibrium in a particular environment with respect to temperature and relative humidity [68].
The EMC of biomass depends on its composition, porosity, microstructure and specific surface
area [69]. There are static and dynamic methods to determine the equilibrium moisture content.
The various relative humidities are obtained from saturated salt solution of acids of different
concentrations in the static method and by mixing fully dried air and fully saturated air at
required proportions in the dynamic method. The sample reaches equilibrium more rapidly with
the dynamic method than with the static one.
Moisture sorption isotherm is usually used to describe the relationship between water
content and equilibrium humidity at equilibrium [70]. For each humidity value, a sorption
isotherm indicates the corresponding water content value at a given constant temperature [71].
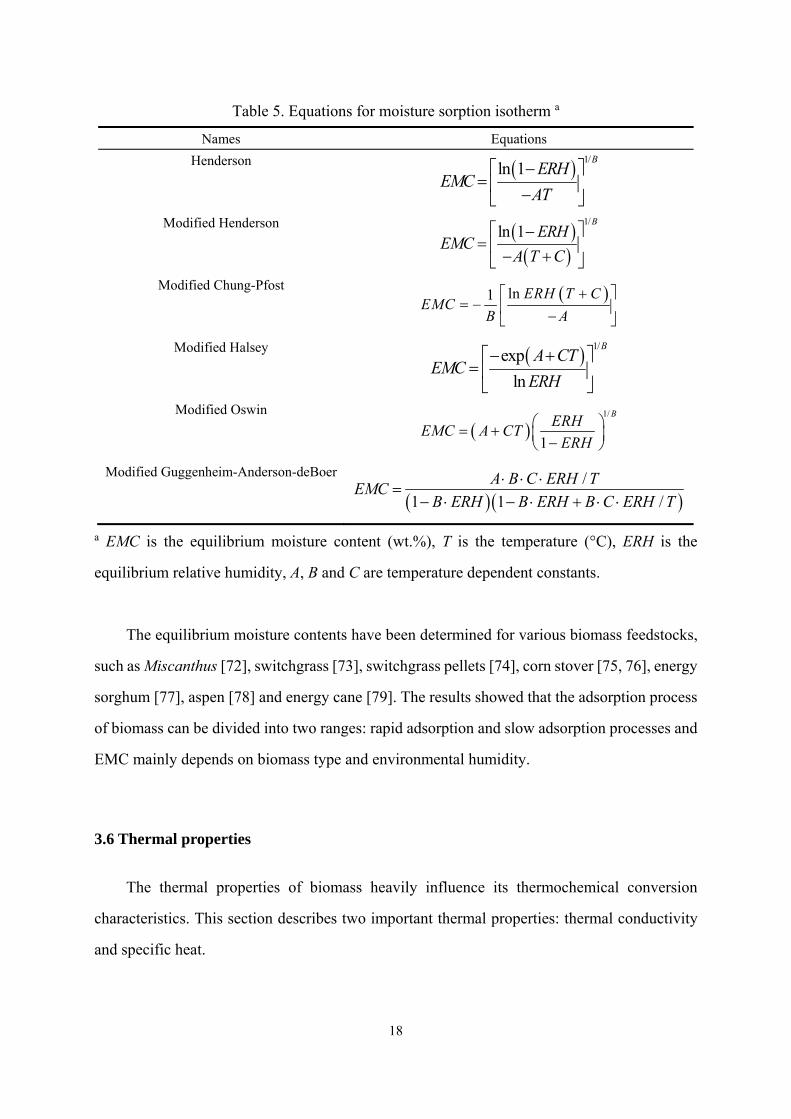
Several equations have been proposed to describe the relationship between EMC, equilibrium
humidity and temperature. They are shown in Table 5.
18
Table 5. Equations for moisture sorption isotherm a
Names Equations
Henderson 1/ln 1
BERH
EMCAT
Modified Henderson
1/ln 1
BERH
EMCA T C
Modified Chung-Pfost ln1 ERH T CEMC
B A
Modified Halsey 1/exp
ln
BA CT
EMCERH
Modified Oswin
1/
1
BERH
EMC A CTERH
Modified Guggenheim-Anderson-deBoer
/
1 1 /
A B C ERH TEMC
B ERH B ERH B C ERH T
a EMC is the equilibrium moisture content (wt.%), T is the temperature (°C), ERH is the
equilibrium relative humidity, A, B and C are temperature dependent constants.
The equilibrium moisture contents have been determined for various biomass feedstocks,
such as Miscanthus [72], switchgrass [73], switchgrass pellets [74], corn stover [75, 76], energy
sorghum [77], aspen [78] and energy cane [79]. The results showed that the adsorption process
of biomass can be divided into two ranges: rapid adsorption and slow adsorption processes and
EMC mainly depends on biomass type and environmental humidity.
3.6 Thermal properties
The thermal properties of biomass heavily influence its thermochemical conversion
characteristics. This section describes two important thermal properties: thermal conductivity
and specific heat.
19
3.6.1 Thermal conductivity
When biomass is heated in thermochemical conversion processes, biomass particles are
subject to heat conduction along and across their fiber, which in turn influences their
thermochemical conversion behavior [80]. Mason et al. [81] developed a method for
determining the thermal conductivities of biomass particles using a custom built test apparatus.
They found that the thermal conductivities of dried wood pellets, miscanthus and willow are
between 0.10 to 0.12 w m-1 K-1, while agricultural residues (such as wheat and rape straws)
have a relatively low thermal conductivity value of 0.05 w m-1 K-1. Biomass is an anisotropic
material. Its thermal conductivity depends on heating direction, moisture, porosity, density and
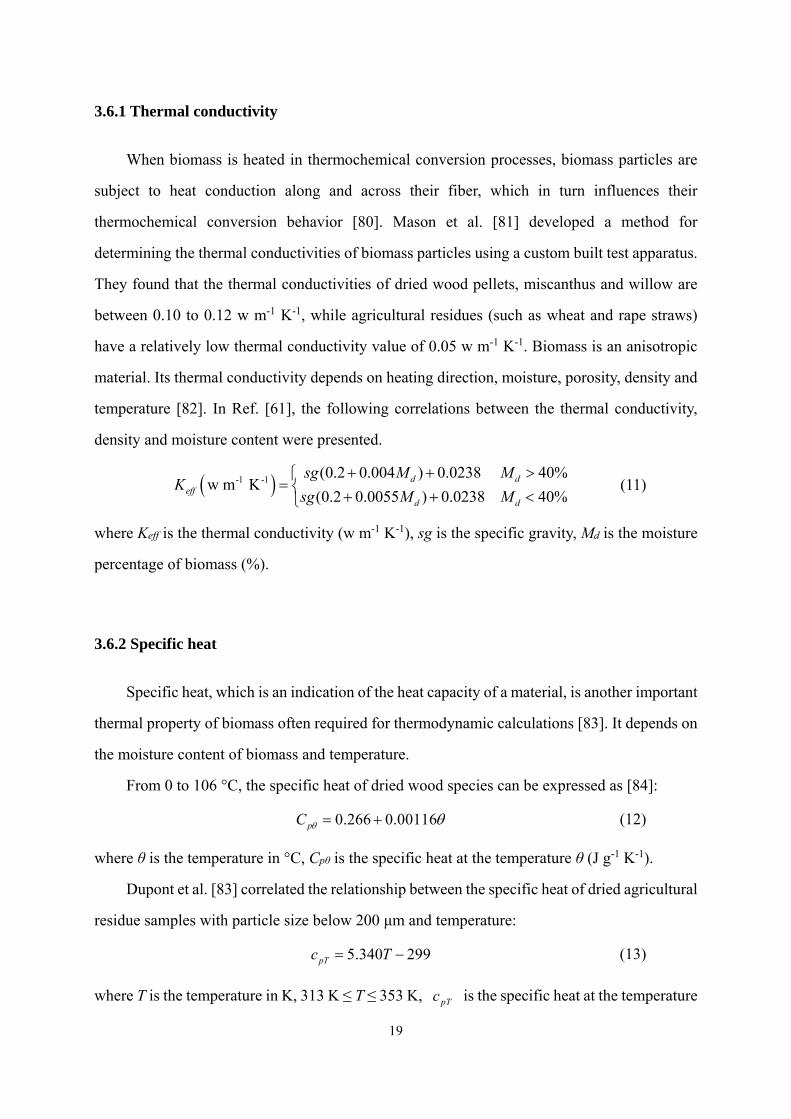
temperature [82]. In Ref. [61], the following correlations between the thermal conductivity,
density and moisture content were presented.
-1 -1 (0.2 0.004 ) 0.0238 40%w m K
(0.2 0.0055 ) 0.0238 40%d d
effd d
sg M MK
sg M M
(11)
where Keff is the thermal conductivity (w m-1 K-1), sg is the specific gravity, Md is the moisture
percentage of biomass (%).
3.6.2 Specific heat
Specific heat, which is an indication of the heat capacity of a material, is another important
thermal property of biomass often required for thermodynamic calculations [83]. It depends on
the moisture content of biomass and temperature.
From 0 to 106 °C, the specific heat of dried wood species can be expressed as [84]:
0.266 0.00116pC (12)
where θ is the temperature in °C, Cpθ is the specific heat at the temperature θ (J g-1 K-1).
Dupont et al. [83] correlated the relationship between the specific heat of dried agricultural
residue samples with particle size below 200 μm and temperature:
5.340 299pTc T (13)
where T is the temperature in K, 313 K ≤ T ≤ 353 K, pTc is the specific heat at the temperature
20
T (J kg-1 K-1).
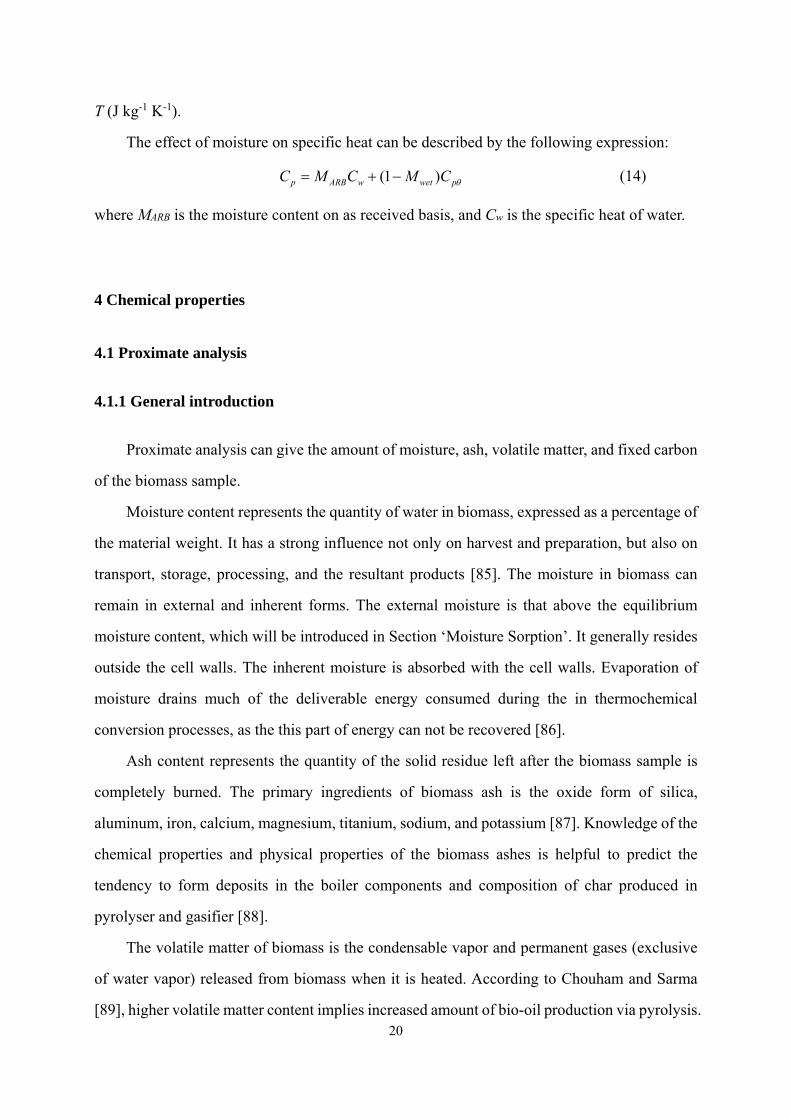
The effect of moisture on specific heat can be described by the following expression:
(1 )p ARB w wet pC M C M C (14)
where MARB is the moisture content on as received basis, and Cw is the specific heat of water.
4 Chemical properties
4.1 Proximate analysis
4.1.1 General introduction
Proximate analysis can give the amount of moisture, ash, volatile matter, and fixed carbon
of the biomass sample.
Moisture content represents the quantity of water in biomass, expressed as a percentage of
the material weight. It has a strong influence not only on harvest and preparation, but also on
transport, storage, processing, and the resultant products [85]. The moisture in biomass can
remain in external and inherent forms. The external moisture is that above the equilibrium
moisture content, which will be introduced in Section ‘Moisture Sorption’. It generally resides
outside the cell walls. The inherent moisture is absorbed with the cell walls. Evaporation of
moisture drains much of the deliverable energy consumed during the in thermochemical
conversion processes, as the this part of energy can not be recovered [86].
Ash content represents the quantity of the solid residue left after the biomass sample is
completely burned. The primary ingredients of biomass ash is the oxide form of silica,
aluminum, iron, calcium, magnesium, titanium, sodium, and potassium [87]. Knowledge of the
chemical properties and physical properties of the biomass ashes is helpful to predict the
tendency to form deposits in the boiler components and composition of char produced in
pyrolyser and gasifier [88].
The volatile matter of biomass is the condensable vapor and permanent gases (exclusive
of water vapor) released from biomass when it is heated. According to Chouham and Sarma
[89], higher volatile matter content implies increased amount of bio-oil production via pyrolysis.
21
Its amount depends on the heating conditions including the heating rate, temperature, and
residence time. For the determination of the volatile matter content of biomass’s proximate
analysis, the biomass sample is heated to a standard temperature and at a standard rate in a
controlled environment.
Fixed carbon is the solid combustible residue that remains after biomass is heated and the
volatile matter is expelled. Fixed carbon content in biomass is calculated value, which is
determined from the following equation:
1FC M A VM (15)
where FC, M, A and VM are the fixed carbon, moisture, ash and volatile matter contents in
biomass on the same basis of analysis.
4.1.2 ASTM standard method
The moisture content of biomass is determined by the test approach given in the ASTM
standard E1756 – 08 [90]. In the standard, a weighed sample is heated at 105±3 °C in a muffle
for at least 3 h but not longer than 72 h and weighed after cooling. To ensure complete drying
of the sample, the process is repeated until its weight remains unchanged.
The ash content of biomass can be measured by combusting the dried biomass sample in
a muffle furnace at 575±25 °C for 3 h, cooled and weighed, followed by a further 1 h at
575±25 °C until sample mass varies by less than 0.3 mg from previous weighing in accordance
with the ASTM standard E1755 − 01 [91].
For the determination of the volatile matter content, the ASTM standard E872 – 82 [92]
specifies that the dried biomass sample is put in a covered crucial so as to avoid contact with
air during devolatilization and then the covered crucible is placed in a furnace at 950 °C and
heated for 7 min. Then, the crucible is taken out, cooled in a desiccator, and weighed. The
weight loss due to devolatilization is the volatile matter content.
4.1.3 Thermogravimetric analysis method
For saving time and expense involved in proximate analysis using ASTM standards, Klass
22
[93] proposed an alternative method using thermogravimetry. For proximate analysis of coal
and coke, the ASTM standard D7582 – 15 [94] covers the determination of moisture, volatile
matter, and ash by thermogravimetric analysis (TGA), which can give a continuous record of
the weight loss of the sample during being heated. Several researchers also used the TGA
method to perform the proximate analysis of biomass samples [95, 96].
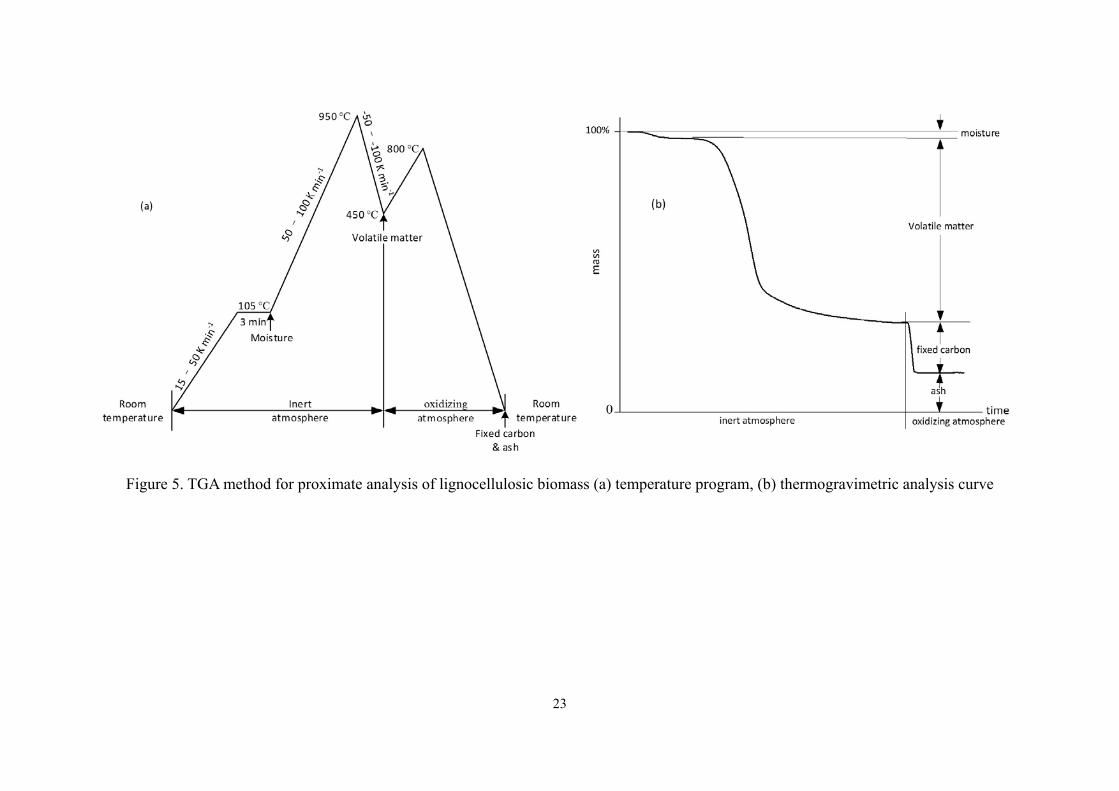
The TGA method for proximate analysis is described as follows:
(1) Moisture determination. The weighted samples in crucibles without the covers are
heated with a heating rate (15 to 50 K min-1) from room temperature to 105 °C, followed by a
105 °C isothermal hold for 3 min under inert atmosphere (nitrogen, argon or helium). The
moisture content is calculated by the following formula:
W B
MW
(16)
where W is the mass of the sample used, B is the mass of the sample after drying in moisture
test.
(2) Volatile matter determination. Then a heating ramp (50 – 100 K min-1) is programmed
until 950 °C, and a cooling process starts with a cooling rate (-50 – -100 K min-1) until 450 °C.
The volatile matter content is calculated by the following formula:
B C
VMW
(17)
where C is the mass of the sample after heating in volatile matter test.
(3) Ash determination. The flow gas is changed to oxidizing gas (oxygen or air), then a
heating ramp begins until 800 °C, followed by an 800 °C isothermal hold for 3 min. The ash
content is calculated by the following formula:
D
AW
(18)
where D is the mass of the residue remaining after the ash test.
(4) Fixed carbon determination. The fixed carbon content is calculated according to
Equation (15).
From the measured weight loss versus time graphs (Figure 5), the biomass sample’s
moisture, volatile matter, and ash contents can be determined.
23
Figure 5. TGA method for proximate analysis of lignocellulosic biomass (a) temperature program, (b) thermogravimetric analysis curve
24
Klass [93] compared the proximate analysis results of some biomass samples from the
ASTM standard and TGA methods and obtained that the differences between the results from
the ASTM standard and TGA methods were small.
4.1.4 Typical results
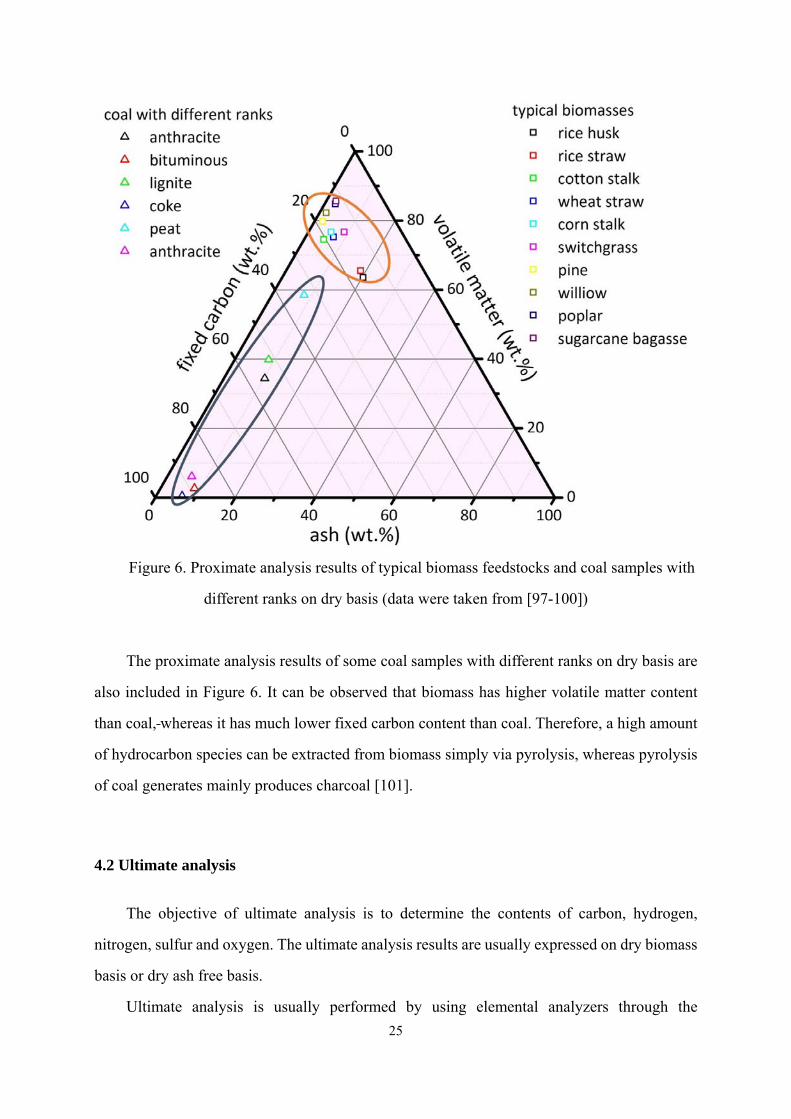
The proximate analysis results of biomass on dry basis can be illustrated using a ternary
graph. It is a barycentric plots on three variables which sum to a constant and graphically depict
the ratios of the three variables as positions in an equilateral triangle [24]. Figure 6 shows the
proximate analysis results of typical biomass feedstocks on dry basis. These feedstocks include
woody biomasses (pine, willow and poplar), crop straws (rice straw, cotton stalk, wheat straw
and corn stalk), agro-industrial by-products (rice husk and sugarcane bagasse) and switchgrass.
Figure 6 indicates that woody biomass feedstocks and sugarcane bagasse contain higher plenty
of volatile matter than other biomass feedstocks. In addition, rice husk and straw contain higher
ash content than other biomass feedstocks.
25
Figure 6. Proximate analysis results of typical biomass feedstocks and coal samples with
different ranks on dry basis (data were taken from [97-100])
The proximate analysis results of some coal samples with different ranks on dry basis are
also included in Figure 6. It can be observed that biomass has higher volatile matter content
than coal, whereas it has much lower fixed carbon content than coal. Therefore, a high amount
of hydrocarbon species can be extracted from biomass simply via pyrolysis, whereas pyrolysis
of coal generates mainly produces charcoal [101].
4.2 Ultimate analysis
The objective of ultimate analysis is to determine the contents of carbon, hydrogen,
nitrogen, sulfur and oxygen. The ultimate analysis results are usually expressed on dry biomass
basis or dry ash free basis.
Ultimate analysis is usually performed by using elemental analyzers through the
26
combustion of a weighed biomass sample in a controlled atmosphere and subsequent analysis
of its gas products [102]. In the combustion process, carbon is converted to CO2; hydrogen to
H2O; nitrogen to NOx and sulfur to SO2. The combustion products are swept out of the
combustion chamber and passed over heated high purity copper, which can remove any oxygen
and convert any NOx to N2. The contents of carbon, hydrogen, nitrogen, and sulfur can be
determined through the detection of released CO2, H2O, N2, and SO2 [31].
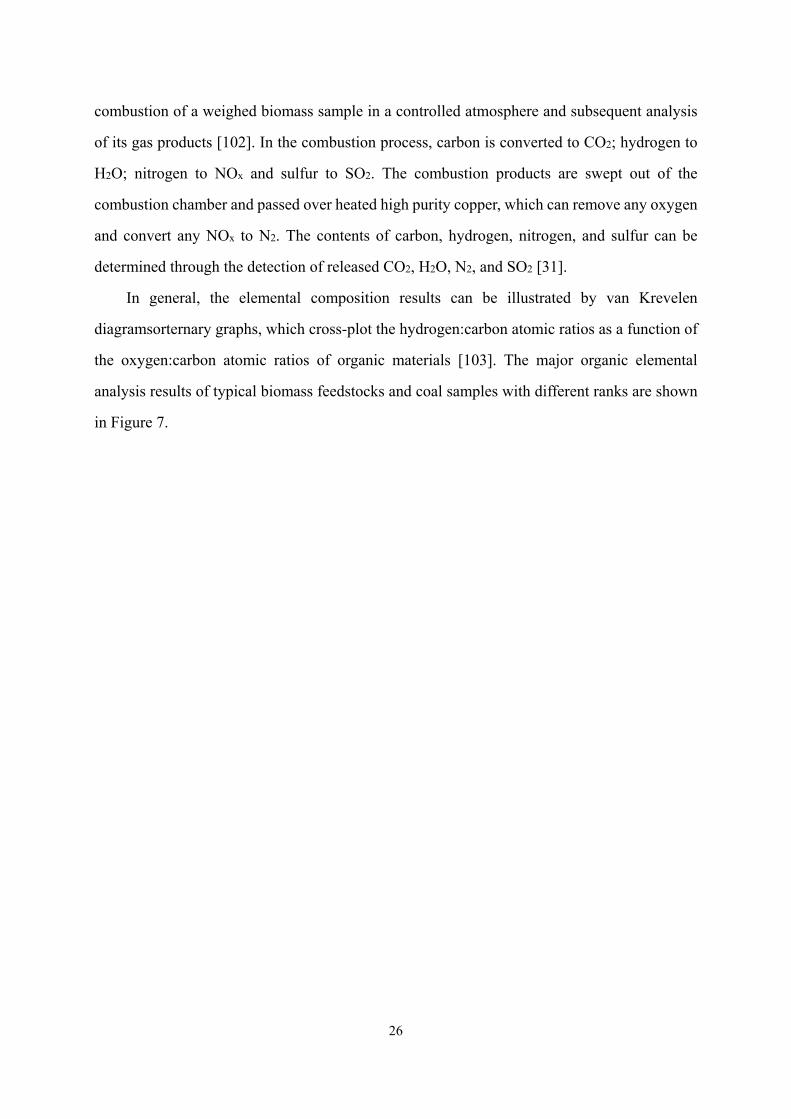
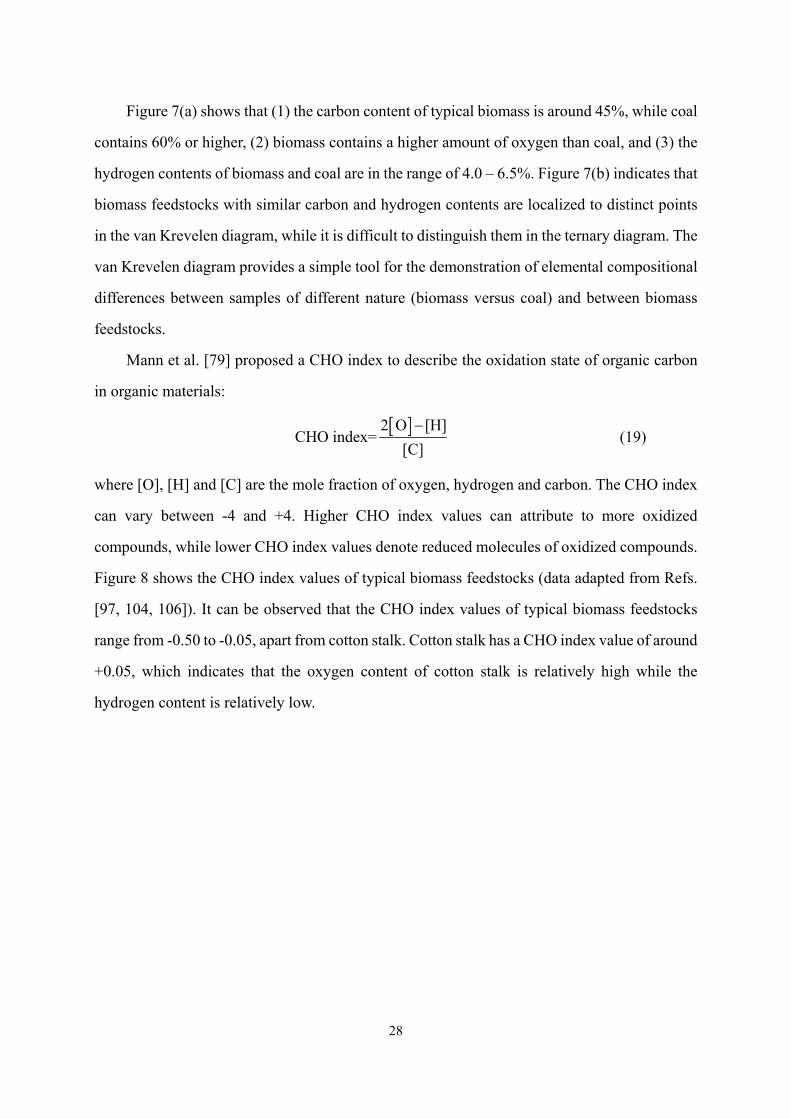
In general, the elemental composition results can be illustrated by van Krevelen
diagramsorternary graphs, which cross-plot the hydrogen:carbon atomic ratios as a function of
the oxygen:carbon atomic ratios of organic materials [103]. The major organic elemental
analysis results of typical biomass feedstocks and coal samples with different ranks are shown
in Figure 7.
27
Figure 7. Ultimate analysis results of typical biomass feedstocks and coal samples with different ranks on dry ash free basis: (a) ternary diagram,
(b) van Krevelen diagram (data Refs. [97, 104-106]).
28
Figure 7(a) shows that (1) the carbon content of typical biomass is around 45%, while coal
contains 60% or higher, (2) biomass contains a higher amount of oxygen than coal, and (3) the
hydrogen contents of biomass and coal are in the range of 4.0 – 6.5%. Figure 7(b) indicates that
biomass feedstocks with similar carbon and hydrogen contents are localized to distinct points
in the van Krevelen diagram, while it is difficult to distinguish them in the ternary diagram. The
van Krevelen diagram provides a simple tool for the demonstration of elemental compositional
differences between samples of different nature (biomass versus coal) and between biomass
feedstocks.
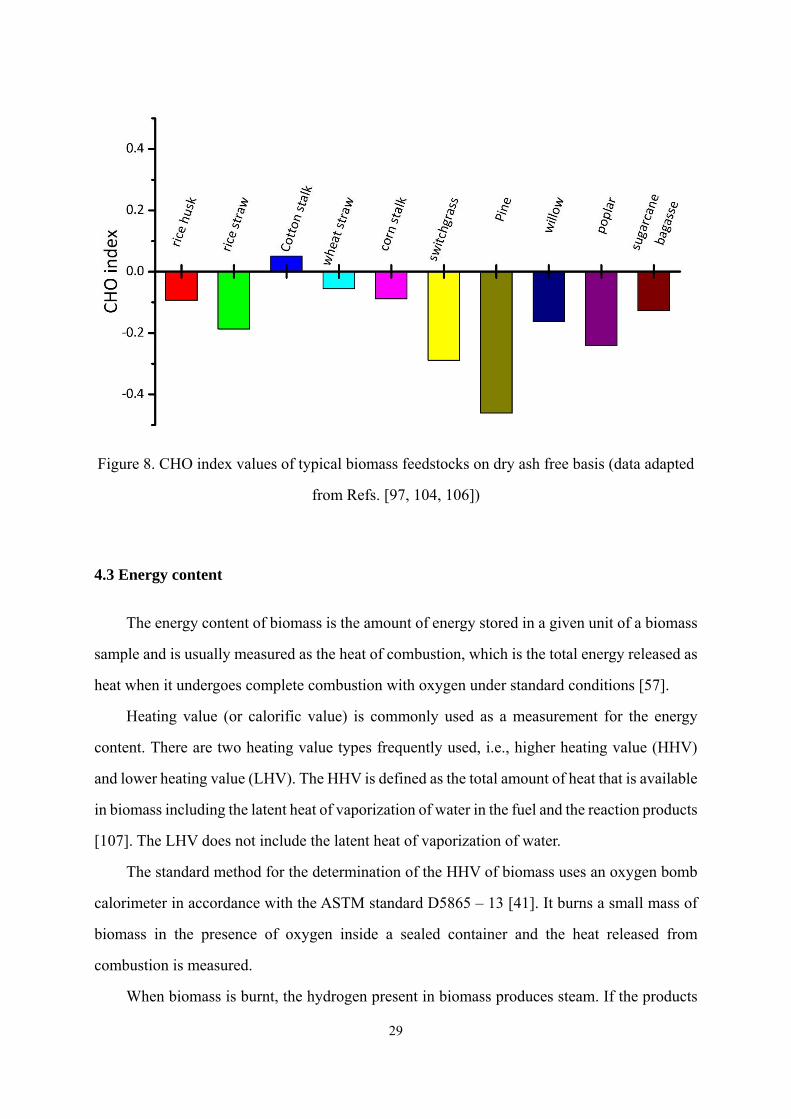
Mann et al. [79] proposed a CHO index to describe the oxidation state of organic carbon
in organic materials:
2 O [H]
CHO index=[C]
(19)
where [O], [H] and [C] are the mole fraction of oxygen, hydrogen and carbon. The CHO index
can vary between -4 and +4. Higher CHO index values can attribute to more oxidized
compounds, while lower CHO index values denote reduced molecules of oxidized compounds.
Figure 8 shows the CHO index values of typical biomass feedstocks (data adapted from Refs.
[97, 104, 106]). It can be observed that the CHO index values of typical biomass feedstocks
range from -0.50 to -0.05, apart from cotton stalk. Cotton stalk has a CHO index value of around
+0.05, which indicates that the oxygen content of cotton stalk is relatively high while the
hydrogen content is relatively low.
29
Figure 8. CHO index values of typical biomass feedstocks on dry ash free basis (data adapted
from Refs. [97, 104, 106])
4.3 Energy content
The energy content of biomass is the amount of energy stored in a given unit of a biomass
sample and is usually measured as the heat of combustion, which is the total energy released as
heat when it undergoes complete combustion with oxygen under standard conditions [57].
Heating value (or calorific value) is commonly used as a measurement for the energy
content. There are two heating value types frequently used, i.e., higher heating value (HHV)
and lower heating value (LHV). The HHV is defined as the total amount of heat that is available
in biomass including the latent heat of vaporization of water in the fuel and the reaction products
[107]. The LHV does not include the latent heat of vaporization of water.
The standard method for the determination of the HHV of biomass uses an oxygen bomb
calorimeter in accordance with the ASTM standard D5865 – 13 [41]. It burns a small mass of
biomass in the presence of oxygen inside a sealed container and the heat released from
combustion is measured.
When biomass is burnt, the hydrogen present in biomass produces steam. If the products
30
of combustion are condensed, the latent heat of condensation of steam also counted in the
measured heat [108]. Thus, the HHV and LHV of biomass on as received basis can be calculated
based on the HHV of biomass on dry basis according to Equations (20) and (21) [109]:
ARB DB ARB1HHV HHV M (20)
ARB DB H,DB H,DBLHV HHV 1 2.447 22.023 1ARB ARBM M EC EC (21)
where ARBM is the moisture content on as received basis, H,DBEC is H content on dry basis,
ARBLHV is the LHV on as received basis (MJ kg-1) and DBHHV is the HHV on dry basis (MJ
kg-1). Demirbaş [110] gave the LHV values of poplar and corn stalk as a function of the moisture
content and found that the LHVs of biomass samples decreased linearly with the increase of
moisture contents.
The HHV of biomass on dry basis can be estimated from the contents of C, H, S, N, O and
ash in biomass according to the following empirical equation from the International Energy
Agency [23]:
C,DB H.DB S,DB N,DB
O,DB DB
0.3491 1.1783 0.1005 0.0151
0.1034 0.0211DBHHV EC EC EC EC
EC A
(22)
The heating value of a lignocellulosic biomass type can vary significantly with the climate
and soil conditions. Consequently, the HHV of a biomass type should be presented as a range
rather than a fixed value [111]. The typical HHV ranges of some common lignocellulosic
biomass types were reported in Ref. [112]. Woody biomasses have slightly higher values than
herbaceous biomasses. The HHV values of most woody biomasses fall in the range of 18.5 –
22.5 kJ mol-1, whereas the HHV values for most herbaceous biomasses are about 15.5-19.5 kJ
mol-1.
4.4 Compositional analysis
4.4.1 General introduction
Lignocellulosic biomass is composed primarily of cellulose, hemicellulose, and lignin.
Cellulose is a polymer of β-D-glucopyranose moieties linked via β-(1,4) glycosidic bonds with

31
well documented polymorphs [113]. Hemicellulose is a polymer consisting of short branched
chains of sugars. Lignin is a complex, large molecular structure containing cross-linked
phenolic polymers [114]. These components are associated with each other and vary depending
on the type of lignocellulosic biomass [17]. In biochemical or thermochemical conversion
processes, the performances of cellulose, hemicellulose and lignin are different [115, 116]. For
example, compared to cellulose and hemicellulose, lignin has been considered a hindrance in
cellulosic bioethanol production [117]. Accurate compositional analysis of lignocellulosic
biomass enables evaluation of conversion yields and process economics, particularly in
bioethanol conversion processes [118].
For compositional analysis, the lignocellulosic biomass samples should be prepared in a
procedure in accordance with the ASTM standard E1757-01 [119], which can convert the
samples into a uniform material suitable for analysis. The standard specifies a method for the
preparation of samples with a specific particle size range and moisture content. The preparation
procedure is described as follows: (1) dry the sample at 45±3 °C for 24 to 48 h; (2) mill the dry
sample to ensure the particles passing through a 2 mm screen; (3) sieve the milled sample; (4)
choose -20/+80 mesh fraction for further analysis.
There are three categories of compositional analysis methods: sulfuric acid hydrolysis
methods [118, 120], near infrared spectroscopy (NIRS) methods [13], and kinetic analysis
methods [121].
4.4.2 Sulfuric acid hydrolysis method
The most common methods are based on a two-step sulfuric acid hydrolysis, which has
been used for over a century and modified for different objects and conditions [118]. Sluiter et
al. [118] and Templeton et al. [120] reviewed the compositional analysis methods on the basis
of sulfuric acid hydrolysis and their uncertainties. Many analogous versions of sulfuric acid
hydrolysis methods have been reported [118]. The Laboratory Analytical Procedure (LAP)
‘Determination of Structural Carbohydrates and Lignin in Biomass’ published by the National
Renewable Energy Laboratory (NREL) is the most updated version [122]. The procedure

32
describes the quantification of carbohydrates and lignin, which is shown in Figure 9. This
method begins with an ethanol extraction step. It can interfere with the accurate quantification
of polysaccharide sugars, Klason lignin, and acid soluble lignin, which can be separated and
quantified. The extracted components then undergoes typically a strong sulfuric acid hydrolysis
step at room temperature and then a dilute sulfuric acid hydrolysis step at high temperature to
break down to their monomeric forms, High Performance Anion Exchange Chromatography
with Pulsed Amperometric Detection (HPAEC-PAD). The acid soluble lignin samples can be
quantified using ultraviolet spectroscopy. The Klason lignin content can be gravimetrically
obtained from the acid insoluble residue.
Pretreated sampleMoisture content determination
Removal of 95% ethanol soluble components (extractives)
Extractives Extractives‐free material
Mass determination via evaporation of solvent
Acid hydrolysis
Acid insoluble residueHydrolysate containing
free sugars
Klason ligninAcid‐insoluble ash
Dilution of hydrolysate analysis
Acid soluble lignin determination
UV‐spectroscopy
UA determinationVis‐spectroscopy
Ash content determination
Moisture content determination
Ethanol‐insoluble ash
Figure 9. Flowchart of Laboratory Analytical Procedure (LAP) ‘Determination of Structural
Carbohydrates and Lignin in Biomass’ by National Renewable Energy Laboratory (NREL)
4.4.3 NIRS method
The sulfuric acid hydrolysis methods can provide reliable results about biomass
composition; however, they are labor-intensive, time-consuming and high-cost, and require pre-
33
conditioning to remove extractives [123]. The NIRS methods can provide a reliable and low-
cost solution for determination of biomass composition. The main advantages of the NIRS
technique are (1) the procedure is relatively less complicated, (2) the analysis process is fast
and precise, (3) no hazardous chemicals are used in analysis [13]. The spectral features can be
used for biomass compositional analysis, as different functional groups in the structural
components of biomass can correspond to different infrared spectrums. However, infrared
spectra contains information about chemical bonds but does not provide compositional
information; consequently, some statistical models which establish a relationship between
spectra features and chemical bonds are required [13]. Principle component analysis (PCA),
partial least squares (PLS), artificial neural networks (ANN), and support vector machines
(SVM) are usually used for qualitative analysis [124]. After calibration, another external
validation set of samples is prepared for validation to compare the predicted values from the
calibration model and those from the reference method. Jin and Chen [125] successfully
obtained a prediction of the total ash, insoluble ash, moisture, cellulose, hemicellulose, and
Klason in a rice straw sample using NIRS.
4.4.4 Kinetic method
Carrier et al. [126] developed a kinetic method to calculate the contents of cellulose and
hemicelluloses, using thermogravimetric analysis; however, the method cannot be applied to
determine lignin content of biomass. Cai et al. [121] presented different kinetic analysis method
to determine the contents of cellulose, hemicellulose and lignin by using a distributed activation
energy model: (1) The pyrolysis of lignocellulosic biomass is performed in a thermogravimetric
analyzer under an inert atmosphere; (2) Three individual distributed activation energy models
are used to describe the pyrolysis kinetic behaviors of cellulose, hemicellulose, and lignin,
3
1
dd
d dj
jj
Tc
T T
(23)
2
0,0, 0,
20 0
d 1exp exp d d
d 22
Tjj j j
jj
E ET k kE ET E
T RT RT
(24)
34
In the above equations, α is the conversion degree of lignocellulosic biomass, T is the absolute
temperature, j T (j = 1, 2, 3) are the conversion degree of cellulose, hemicellulose, and
lignin, respectively, R is the universal gas constant, E0 is the mean value of the activation energy
distribution, k0 is the frequency factor, cj (j = 1, 2, 3) are the fractions of cellulose, hemicellulose,
and lignin; (3) A pattern search method is used to determine the parameters of the distributed
activation energy model by minimizing the sum of squared residuals between the experimental
data and the calculated data from the distributed activation energy model; (4) The contents of
cellulose, hemicellulose and lignin can be calculated based on the parameter cj values.
4.4.5 Typical results
The relative contents of cellulose and lignin are key factors to identify the suitability of
lignocellulosic biomass for processing, particularly the biochemical conversion processes [127].
The biodegradation of cellulose is greater than that of lignin; therefore, the overall conversion
of biomass with a higher content of cellulose is greater than biomass with a higher content of
lignin [128]. Forest and agricultural residues are suitable for combustion, gasification, and
pyrolysis, while other feedstocks such as sugar crops are suitable to bioethanol fermentation.
Table 6 gives the contents of cellulose, hemicellulose and lignin of some common
lignocellulosic biomass feedstocks.

35
Table 6. Compositional analysis results of typical lignocellulosic biomasses (data adapted
from Refs. [17, 129, 130])
Biomass Cellulose / wt.% Hemicellulose / wt.% Lignin / wt.%
Hardwood (Poplar) 50.8–53.3 26.2–28.7 15.5–16.3
Softwood (Pine) 45.0-50.0 25.0-35.0 25.0-35.0
Wheat straw 35.0–39.0 23.0–30.0 12.0–16.0
Corn Cob 33.7–41.2 31.9–36.0 6.1–15.9
Corn Stalk 35.0–39.6 16.8–35.0 7.0–18.4
Rice Straw 29.2–34.7 23.0–25.9 17.0–19.0
Rice Husks 28.7–35.6 12.0–29.3 15.4–20.0
Sugarcane Bagasse 25.0–45.0 28.0–32.0 15.0–25.0
Sorghum Straw 32.0–35.0 24.0–27.0 15.0–21.0
Barley Straw 36.0–43.0 24.0–33.0 6.3–9.8
Grasses 25.0–40.0 25.0–50.0 10.0–30.0
Switchgrass 35.0–40.0 25.0–30.0 15.0–20.0
5 Summaries
Lignocellulosic biomass can be converted into bioenergy, biofuels and biochemical by
various routes. The physicochemical properties of biomass are key parameters to understand
prior to designing any thermochemical or biochemical processing method as they significantly
influence the process conversion performance and associated supply chain network for material
handing and transport. However, the profound understanding of the physicochemical properties
of lignocellulosic biomass and the analytical characterization methods for these properties are
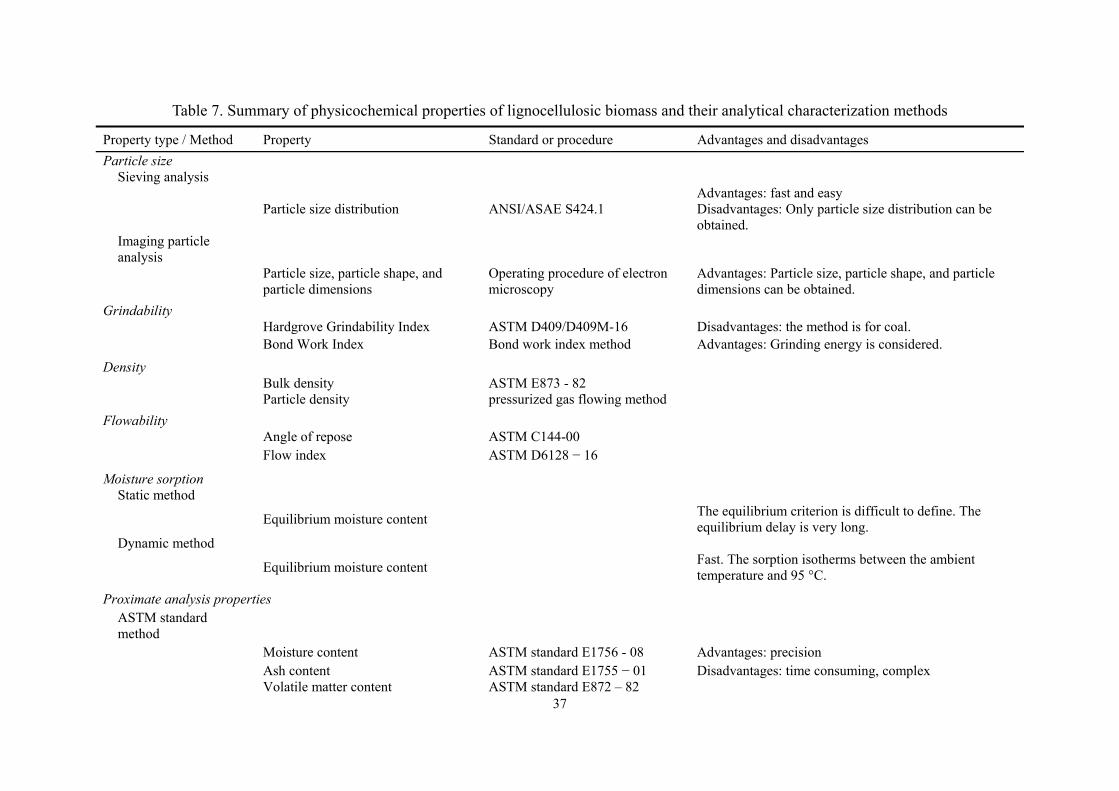
required. All properties and their characterization techniques reviewed in this paper are listed
in Table 7. The summaries of this review are given below.
Sieving analysis is a fast and easy approach to measure particle size, while imaging
particle analysis can be used if particle shape and dimensions are required.
Bond work index is an approach to measure grindability as grinding energy is
considered.
Bulk density of particle is measured following the ASTM standard E873-82, and
particle density is measured using the pressurized gas flowing method.
Flowability is quantified as angle of response and flow index, which can be measured
36
according to the ASTM standards C144-00 and D6128-16, respectively.
Dynamic method is a fast approach to measure sorption compared to static method.
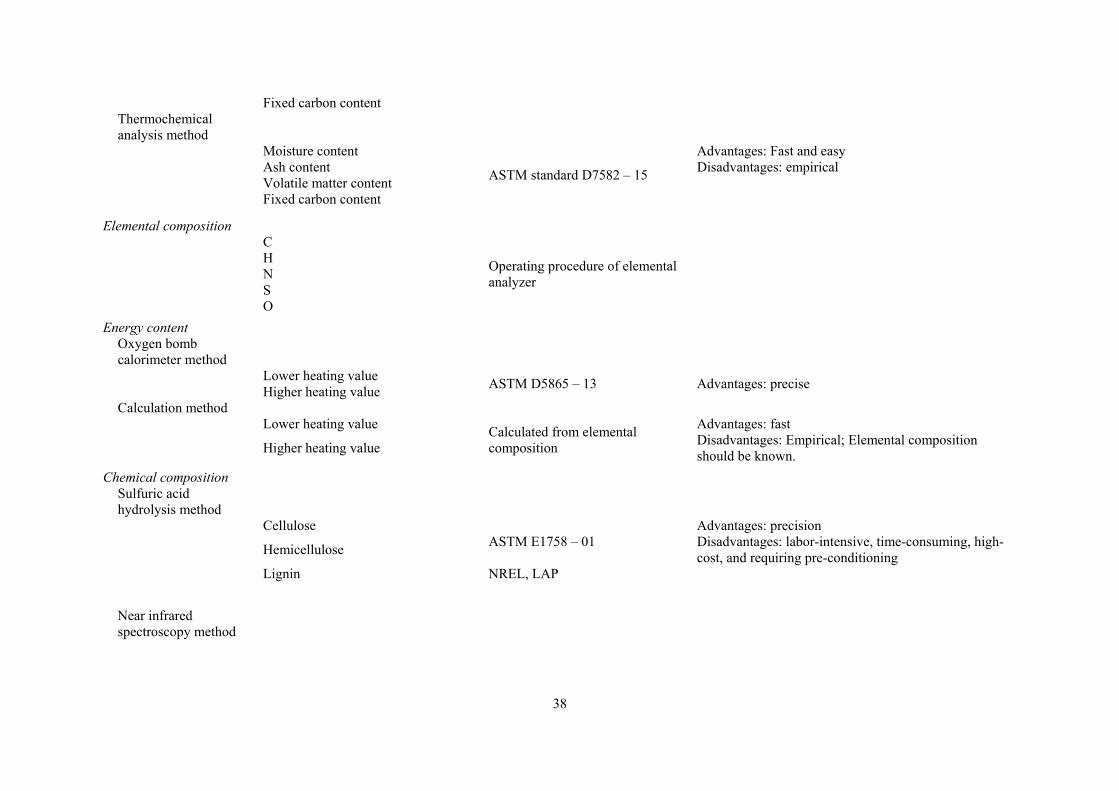
To measure proximate analysis properties (e.g. moisture, ash, volatile and fixed carbon
contents), the researcher can either choose a fast and easy thermogravimetric analysis
method while sacrificing some precision, or select a precise ASTM standard approach
while consuming long time.
Elemental analyzer is commonly used to perform ultimate analysis (e.g. C, H, N, S and
O contents) of biomass.
To measure energy content (e.g. higher or lower heating values), the researcher can
either choose a fast and empirical calculation method while elemental composition is
required, or select a precise oxygen bomb calorimeter method.
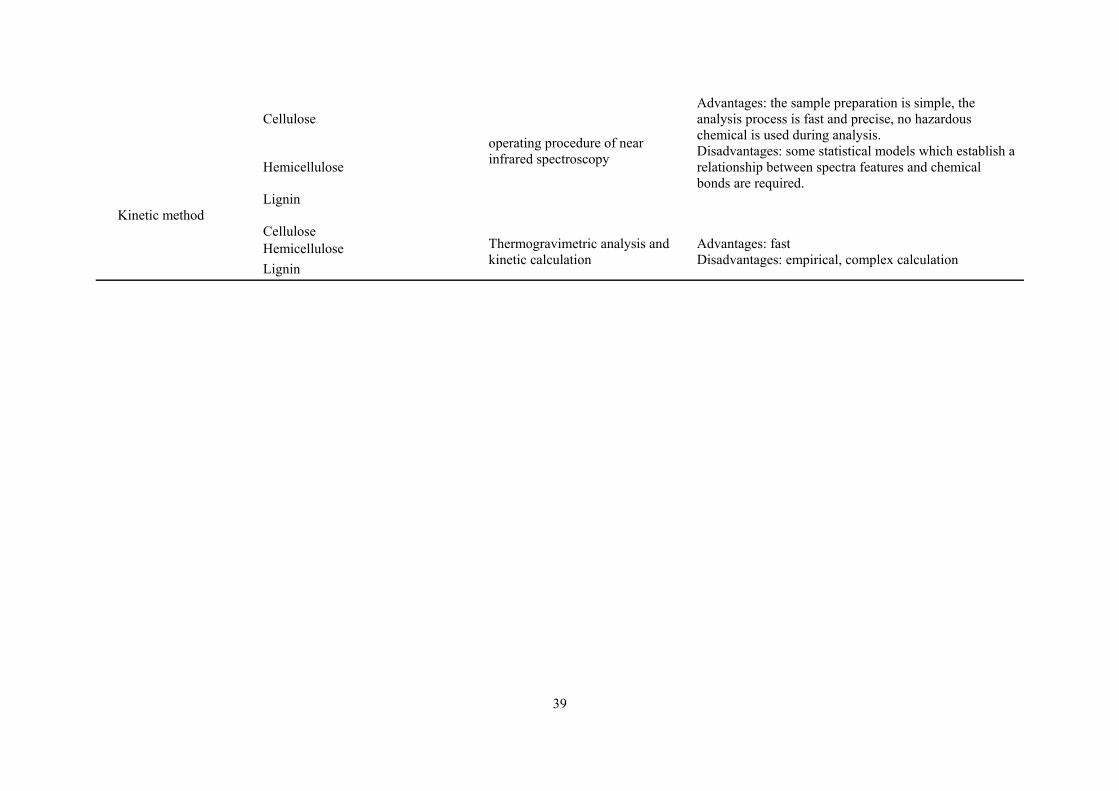
To measure chemical composition (e.g. cellulose, hemicellulose and lignin contents),
the researcher can choose (1) a fast and empirical kinetic method while complex
calculation is required, or (2) a fast and precise near infrared spectroscopy method while
some statistical models are required, or (3) a precise sulfuric acid hydrolysis method
while the disadvantages (e.g. labor-intensive and time-consuming) exits.
37
Table 7. Summary of physicochemical properties of lignocellulosic biomass and their analytical characterization methods
Property type / Method Property Standard or procedure Advantages and disadvantages
Particle size Sieving analysis
Particle size distribution ANSI/ASAE S424.1 Advantages: fast and easy Disadvantages: Only particle size distribution can be obtained.
Imaging particle analysis
Particle size, particle shape, and particle dimensions
Operating procedure of electron microscopy
Advantages: Particle size, particle shape, and particle dimensions can be obtained.
Grindability Hardgrove Grindability Index ASTM D409/D409M-16 Disadvantages: the method is for coal. Bond Work Index Bond work index method Advantages: Grinding energy is considered. Density Bulk density ASTM E873 - 82 Particle density pressurized gas flowing method Flowability Angle of repose ASTM C144-00 Flow index ASTM D6128 − 16 Moisture sorption Static method
Equilibrium moisture content The equilibrium criterion is difficult to define. The equilibrium delay is very long.
Dynamic method
Equilibrium moisture content Fast. The sorption isotherms between the ambient temperature and 95 °C.
Proximate analysis properties
ASTM standard method
Moisture content ASTM standard E1756 - 08 Advantages: precision Ash content ASTM standard E1755 − 01 Disadvantages: time consuming, complex Volatile matter content ASTM standard E872 – 82
38
Fixed carbon content Thermochemical
analysis method
Moisture content
ASTM standard D7582 – 15
Advantages: Fast and easy Ash content Disadvantages: empirical Volatile matter content Fixed carbon content Elemental composition C
Operating procedure of elemental analyzer
H N S O Energy content Oxygen bomb
calorimeter method
Lower heating value ASTM D5865 – 13 Advantages: precise Higher heating value
Calculation method Lower heating value
Calculated from elemental composition
Advantages: fast Higher heating value
Disadvantages: Empirical; Elemental composition should be known.
Chemical composition Sulfuric acid
hydrolysis method
Cellulose ASTM E1758 – 01
Advantages: precision Hemicellulose
Disadvantages: labor-intensive, time-consuming, high-cost, and requiring pre-conditioning
Lignin NREL, LAP
Near infrared spectroscopy method
39
Cellulose
operating procedure of near infrared spectroscopy
Advantages: the sample preparation is simple, the analysis process is fast and precise, no hazardous chemical is used during analysis.
Hemicellulose Disadvantages: some statistical models which establish a relationship between spectra features and chemical bonds are required.
Lignin Kinetic method Cellulose
Thermogravimetric analysis and kinetic calculation
Advantages: fast Disadvantages: empirical, complex calculation
Hemicellulose
Lignin
40
Acknowledgements
Financial support from the International Research Staff Exchange Scheme (IRSES)
ECOFUEL Program (FP7-PEOPLE-2009-IRSES Grant 246772) is greatly acknowledged.
Ronghou Liu appreciated the financial support from National Natural Science Foundation of
China (51376121). Xi Yu and Anthony V. Bridgwater gratefully acknowledge the research grant from
EPSRC (EP/M01343X/1). The authors appreciate Mr. Wenfei Cai, a Ph.D. candidate from
Shanghai Jiao Tong University for his help in the graphical abstract.
References
[1] Sanna A. Advanced biofuels from thermochemical processing of sustainable biomass in
Europe. BioEnergy Research. 2014;7:36-47.
[2] International Energy Agency, Key World Energy Statistics 2015. Retrieved at
https://www.iea.org/publications/freepublications/publication/KeyWorld_Statistics_2015.pdf,
9th September 2016.
[3] Nanda S, Kozinski JA, Dalai AK. Biomass-an overview on classification, composition and
characterization. Biomass Processing, Conversion and Biorefinery2013. p. 1-35.
[4] Collard F-X, Blin J. A review on pyrolysis of biomass constituents: Mechanisms and
composition of the products obtained from the conversion of cellulose, hemicelluloses and
lignin. Renewable and Sustainable Energy Reviews. 2014;38:594-608.
[5] Vertes AA, Qureshi N, Yukawa H, Blaschek HP. Biomass to Biofuels: Strategies for Global
Industries: Wiley; 2011.
[6] Lynd LR, Sow M, Chimphango AF, Cortez LA, Cruz CHB, Elmissiry M, et al. Bioenergy
and African transformation. Biotechnology for Biofuels. 2015;8:1.
[7] Goyal H, Seal D, Saxena R. Bio-fuels from thermochemical conversion of renewable
resources: a review. Renewable and Sustainable Energy Reviews. 2008;12:504-17.
[8] Brethauer S, Studer MH. Biochemical conversion processes of lignocellulosic biomass to
fuels and chemicals - A review. Chimia. 2015;69:572-81.
41
[9] Yue D, You F, Snyder SW. Biomass-to-bioenergy and biofuel supply chain optimization:
overview, key issues and challenges. Computers & Chemical Engineering. 2014;66:36-56.
[10] Lam PS, Sokhansanj S. Engineering Properties of Biomass. In: Shastri Y, Hansen A,
Rodríguez L, Ting KC, editors. Engineering and Science of Biomass Feedstock Production and
Provision. New York, NY: Springer New York; 2014. p. 17-35.
[11] Kan T, Strezov V, Evans TJ. Lignocellulosic biomass pyrolysis: A review of product
properties and effects of pyrolysis parameters. Renewable and Sustainable Energy Reviews.
2016;57:1126-40.
[12] Richter F, Fricke T, Wachendorf M. Utilization of semi‐natural grassland through
integrated generation of solid fuel and biogas from biomass. III. Effects of hydrothermal
conditioning and mechanical dehydration on solid fuel properties and on energy and greenhouse
gas balances. Grass and Forage Science. 2010;65:185-99.
[13] Xu F, Yu J, Tesso T, Dowell F, Wang D. Qualitative and quantitative analysis of
lignocellulosic biomass using infrared techniques: a mini-review. Applied Energy.
2013;104:801-9.
[14] Lin F, Waters CL, Mallinson RG, Lobban LL, Bartley LE. Relationships between biomass
composition and liquid products formed via pyrolysis. Frontiers in Energy Research. 2015;3.
[15] Räisänen T, Athanassiadis D. Basic chemical composition of the biomass components of
pine, spruce and birch.
2013:http://www.biofuelregion.se/UserFiles/file/Forest%20Refine/1_2_IS_2013-01-
31_Basic_chemical_composition.pdf.
[16] Arnoult S, Brancourt-Hulmel M. A Review on miscanthus biomass production and
composition for bioenergy use: genotypic and environmental variability and implications for
breeding. BioEnergy Research. 2015;8:502-26.
[17] Isikgor FH, Becer CR. Lignocellulosic biomass: a sustainable platform for the production
of bio-based chemicals and polymers. Polymer Chemistry. 2015;6:4497-559.
[18] Vassilev SV, Baxter D, Andersen LK, Vassileva CG. An overview of the chemical
composition of biomass. Fuel. 2010;89:913-33.
[19] Vassilev SV, Vassileva CG, Vassilev VS. Advantages and disadvantages of composition
and properties of biomass in comparison with coal: An overview. Fuel. 2015;158:330-50.
42
[20] Dahlquist E. Technologies for Converting Biomass to Useful Energy: Combustion,
Gasification, Pyrolysis, Torrefaction and Fermentation: CRC Press; 2013.
[21] Riley JT. Routine Coal and Coke Analysis: Collection, Interpretation, and Use of
Analytical Data. West Conshohocken, PA: ASTM International; 2007.
[22] Vidal BC, Dien BS, Ting KC, Singh V. Influence of feedstock particle size on
lignocellulose conversion—A review. Applied Biochemistry and Biotechnology.
2011;164:1405-21.
[23] Van Loo S, Koppejan J. The Handbook of Biomass Combustion and Co-firing: Earthscan;
2008.
[24] Gera D, Mathur MP, Freeman MC, Robinson A. Effect of large aspect ratio of biomass
particles on carbon burnout in a utility boiler. Energy & Fuels. 2002;16:1523-32.
[25] ANSI/ASAE S424.1, Method of Determining and Expressing Particle Size of Chopped
Forage Materials by Screening. St. Joseph, Michigan: American Society of Agricultural and
Biological Engineers; 1992.
[26] BS EN ISO 17827-1:2016, Solid biofuels. Determination of particle size distribution for
uncompressed fuels. Oscillating screen method using sieves with apertures of 3, 15 mm and
above. Geneva, Switzerland: International Organization for Standardization; 2016.
[27] Yang Y. Image and sieve analysis of biomass particle sizes and separation after size
reduction: University of Tennessee - Knoxville; 2007.
[28] Wang L, Weller CL, Hwang KT. Extraction of lipids from grain sorghum DDG.
Transactions of the American Society of Agricultural Engineers. 2005;48:1883-8.
[29] Yang WC. Handbook of Fluidization and Fluid-Particle Systems: Taylor & Francis; 2003.
[30] Holm-Nielsen J, Ehimen EA. Biomass Supply Chains for Bioenergy and Biorefining:
Elsevier Science; 2016.
[31] de Jong W, van Ommen JR. Biomass as a Sustainable Energy Source for the Future:
Fundamentals of Conversion Processes: Wiley; 2014.
[32] Capareda S. Introduction to Biomass Energy Conversions: CRC Press; 2013.
[33] ASTM D409/D409M-12e1, Standard Test Method for Grindability of Coal by the
Hardgrove-Machine Method. West Conshohocken, PA: ASTM International; 2012.
[34] ASTM D5003-06a, Standard Test Method for Hardgrove Grindability Index (HGI) of
43
Petroleum Coke. West Conshohocken, PA: ASTM International; 2011.
[35] ASTM D409/D409M-16, Standard Test Method for Grindability of Coal by the
Hardgrove-Machine Method. West Conshohocken, PA: ASTM International; 2016.
[36] Gil MV, García R, Pevida C, Rubiera F. Grindability and combustion behavior of coal and
torrefied biomass blends. Bioresource Technology. 2015;191:205-12.
[37] Commandré JM, Leboeuf A. Volatile yields and solid grindability after torrefaction of
various biomass types. Environmental Progress and Sustainable Energy. 2015;34:1180-6.
[38] Arias B, Pevida C, Fermoso J, Plaza MG, Rubiera F, Pis J. Influence of torrefaction on the
grindability and reactivity of woody biomass. Fuel Processing Technology. 2008;89:169-75.
[39] Phanphanich M, Mani S. Impact of torrefaction on the grindability and fuel characteristics
of forest biomass. Bioresource Technology. 2011;102:1246-53.
[40] Bridgeman T, Jones J, Williams A, Waldron D. An investigation of the grindability of two
torrefied energy crops. Fuel. 2010;89:3911-8.
[41] Ohliger A, Förster M, Kneer R. Torrefaction of beechwood: A parametric study including
heat of reaction and grindability. Fuel. 2013;104:607-13.
[42] van Swaaij WPM, Kersten SRA, Palz W. Biomass Power for the World: Pan Stanford
Publishing; 2015.
[43] Williams O, Eastwick C, Kingman S, Giddings D, Lormor S, Lester E. Investigation into
the applicability of Bond Work Index (BWI) and Hardgrove Grindability Index (HGI) tests for
several biomasses compared to Colombian La Loma coal. Fuel. 2015;158:379-87.
[44] Ahmadi R, Shahsavari S. Procedure for determination of ball Bond work index in the
commercial operations. Minerals Engineering. 2009;22:104-6.
[45] Van der Stelt M, Gerhauser H, Kiel J, Ptasinski K. Biomass upgrading by torrefaction for
the production of biofuels: A review. Biomass and Bioenergy. 2011;35:3748-62.
[46] Oginni OJ. Contribution of particle size and moisture content to flowability of fractionated
ground loblolly pine: Auburn University; 2014.
[47] Mani S, Tabil LG, Sokhansanj S. Grinding performance and physical properties of wheat
and barley straws, corn stover and switchgrass. Biomass and Bioenergy. 2004;27:339-52.
[48] Wang L. Sustainable Bioenergy Production: Taylor & Francis; 2014.
[49] Xue Q, Fox RO. Computational modeling of biomass thermochemical conversion in
44
fluidized beds: particle density variation and size distribution. Industrial & Engineering
Chemistry Research. 2014;54:4084-94.
[50] Bhagwanrao SV, Singaravelu M. Bulk density of biomass and particle density of their
briquettes. International Journal of Agricultural Engineering. 2014;7:221-4.
[51] ASTM E873 - 82, Standard Test Method for Bulk Density of Densified Particulate Biomass
Fuels. West Conshohocken, PA: ASTM International; 2006.
[52] Cheng J. Biomass to Renewable Energy Processes: CRC Press; 2009.
[53] Jose S, Bhaskar T. Biomass and Biofuels: Advanced Biorefineries for Sustainable
Production and Distribution: CRC Press; 2015.
[54] Lam PS, Sokhansanj S, Bi X, Mani S, Lim CJ, Womac AR, et al. Physical characterization
of wet and dry wheat straw and switchgrass - Bulk and specific density. ASABE Meeting.
Minneapolis Convention Center, Minneapolis, Minnesota, USA2007. p. Paper Number: 076058.
[55] Miao Z, Grift TE, Hansen AC, Ting K. Flow performance of ground biomass in a
commercial auger. Powder Technology. 2014;267:354-61.
[56] Ueki Y, Torigoe T, Ono H, Yoshiie R, Kihedu JH, Naruse I. Gasification characteristics of
woody biomass in the packed bed reactor. Proceedings of the Combustion Institute.
2011;33:1795-800.
[57] Dahlquist E. Biomass as Energy Source: Resources, Systems and Applications: CRC Press;
2013.
[58] Miccio F, Silvestri N, Barletta D, Poletto M. Characterization of woody biomass
flowability. Chemical Engineering Transactions. 2011;24:643-8.
[59] Lumay G, Boschini F, Traina K, Bontempi S, Remy J-C, Cloots R, et al. Measuring the
flowing properties of powders and grains. Powder Technology. 2012;224:19-27.
[60] Pascale CR. Comparison of methods for the measurement of the angle of repose of granular
materials. Geotechnical Testing Journal. 2014;37:1-5.
[61] Kitani O, Hall CW. Biomass Handbook: Gordon and Breach Science Publishers; 1989.
[62] ASTM C144-00, Standard Test Method for Measuring the Angle of Repose of Free-
Flowing Mold Powders. West Conshohocken, PA: ASTM International; 2000.
[63] Sudhagar M. Fuel and bulk flow properties of coal and torrefied wood mixtures for co-
firing applications. 2015 TAPPI - International Bioenergy & Bioproducts Conference. Atlanta,
45
GA2015.
[64] Szalay A, Kelemen A, Pintye-Hódi K. The influence of the cohesion coefficient (C) on the
flowability of different sorbitol types. Chemical Engineering Research and Design.
2015;93:349-54.
[65] Fasina OO. Flow Properties of Biomass Feedstocks. 2006 ASAE Annual Meeting:
American Society of Agricultural and Biological Engineers; 2006. p. 1.
[66] ASTM D6128-16, Standard Test Method for Shear Testing of Bulk Solids Using the Jenike
Shear Tester. West Conshohocken, PA: ASTM International; 2016.
[67] Jenike AW. Storage and flow of solids, bulletin no. 123. Bulletin of the University of Utah.
1964;53.
[68] Bridgwater AV, Boocock DGB. Developments in Thermochemical Biomass Conversion:
Volume 1: Springer Netherlands; 2013.
[69] Lin G, Yang H, Wang X, Mei Y, Li P, Shao J, et al. The moisture sorption characteristics
and modelling of agricultural biomass. Biosystems Engineering. 2016;150:191-200.
[70] Labuza TP. Moisture Sorption: Practical Aspects of Isotherm Measurement and Use:
American Association of Cereal Chemists; 1984.
[71] Kaur M. Medical Foods from Natural Sources: Springer New York; 2008.
[72] Arabhosseini A, Huisman W, Müller J. Modeling of the equilibrium moisture content
(EMC) of Miscanthus (Miscanthus× giganteus). Biomass and Bioenergy. 2010;34:411-6.
[73] Godbolt C, Danao M-GC, Eckhoff SR. Modeling of the equilibrium moisture content
(EMC) of switchgrass. Transactions of the ASABE. 2013;56:1495-501.
[74] Colley Z, Fasina O, Bransby D, Lee Y. Moisture effect on the physical characteristics of
switchgrass pellets. Transactions of the ASABE. 2006;49:1845-51.
[75] Igathinathane C, Womac A, Sokhansanj S, Pordesimo L. Sorption equilibrium moisture
characteristics of selected corn stover components. Transactions of the ASAE. 2005;48:1449-
60.
[76] Igathinathane C, Pordesimo L, Womac A, Sokhansanj S. Hygroscopic moisture sorption
kinetics modeling of corn stover and its fractions. Applied Engineering in Agriculture.
2009;25:65-73.
[77] Bonner IJ, Kenney KL. Moisture sorption characteristics and modeling of energy sorghum
46
(Sorghum bicolor (L.) Moench). Journal of Stored Products Research. 2013;52:128-36.
[78] He X, Lau AK, Sokhansanj S, Lim CJ, Bi XT, Melin S, et al. Moisture sorption isotherms
and drying characteristics of aspen (Populus tremuloides). Biomass and Bioenergy.
2013;57:161-7.
[79] Mann BF, Chen H, Herndon EM, Chu RK, Tolic N, Portier EF, et al. Indexing permafrost
soil organic matter degradation using high-resolution mass spectrometry. PLoS ONE.
2015;10:e0130557.
[80] Yu X, Makkawi Y, Ocone R, Huard M, Briens C, Berruti F. A CFD study of biomass
pyrolysis in a downer reactor equipped with a novel gas–solid separator — I: Hydrodynamic
performance. Fuel Processing Technology. 2014;126:366-82.
[81] Mason PE, Darvell LI, Jones JM, Williams A. Comparative study of the thermal
conductivity of solid biomass fuels. Energy & Fuels. 2016;30:2158-63.
[82] Dahlquist E. Technologies for Converting Biomass to Useful Energy: Combustion,
Gasification, Pyrolysis, Torrefaction and Fermentation: Taylor & Francis; 2013.
[83] Dupont C, Chiriac R, Gauthier G, Toche F. Heat capacity measurements of various biomass
types and pyrolysis residues. Fuel. 2014;115:644-51.
[84] Basu P. Biomass Gasification, Pyrolysis and Torrefaction: Practical Design and Theory:
Elsevier Science; 2013.
[85] Karunanithy C, Muthukumarappan K, Donepudi A. Moisture sorption characteristics of
corn stover and big bluestem. Journal of Renewable Energy. 2013;2013:Article ID 939504.
[86] Basu P. Chapter 3 - Biomass Characteristics. Biomass Gasification, Pyrolysis and
Torrefaction (Second Edition). Boston: Academic Press; 2013. p. 47-86.
[87] Vassilev SV, Baxter D, Andersen LK, Vassileva CG. An overview of the composition and
application of biomass ash. Part 1. Phase–mineral and chemical composition and classification.
Fuel. 2013;105:40-76.
[88] Nunes LJR, Matias JCO, Catalão JPS. Biomass combustion systems: A review on the
physical and chemical properties of the ashes. Renewable and Sustainable Energy Reviews.
2016;53:235-42.
[89] P Singh Chouhan A, K Sarma A. Critical analysis of process parameters for bio-oil
production via pyrolysis of biomass: A review. Recent Patents on Engineering. 2013;7:98-114.
47
[90] ASTM E1756 - 08, Standard Test Method for Determination of Total Solids in Biomass.
West Conshohocken, PA: ASTM International; 2015.
[91] ASTM E17551 - 01, Standard Test Method for Ash in Biomass. West Conshohocken, PA:
ASTM International; 2015.
[92] ASTM E872 - 82, Standard Test Method for Volatile Matter in the Analysis of Particulate
Wood Fuels. West Conshohocken, PA: ASTM International; 2013.
[93] Klass DL. Biomass for Renewable Energy, Fuels, and Chemicals: Elsevier Science; 1998.
[94] ASTM D7582-15, Standard Test Methods for Proximate Analysis of Coal and Coke by
Macro Thermogravimetric Analysis. West Conshohocken, PA: ASTM International; 2015.
[95] García R, Pizarro C, Lavín AG, Bueno JL. Biomass proximate analysis using
thermogravimetry. Bioresource Technology. 2013;139:1-4.
[96] Cantrell K, Martin J, Ro K. Application of thermogravimetric analysis for the proximate
analysis of livestock wastes. Journal of ASTM International. 2011;7:Paper ID JAI102583.
[97] Jenkins B, Baxter L, Miles T. Combustion properties of biomass. Fuel Processing
Technology. 1998;54:17-46.
[98] Umesh D, Sarsavadiya P, Vaja K, Mahadeo K. Physiochemical properties of cotton stalk
biomass from aricultural residues. Current World Environment. 2015;10:343-9.
[99] Guo M, Bi J. Pyrolysis Characteristics of Corn Stalk with Solid Heat Carrier. BioResources.
2015;10:3839-51.
[100] Donahue CJ, Rais EA. Proximate analysis of coal. Journal of Chemical Education.
2009;86:222.
[101] Lee S, Speight JG, Loyalka SK. Handbook of Alternative Fuel Technologies, Second
Edition: CRC Press; 2014.
[102] Kirmse W. Organic Elemental Analysis: Ultramicro, Micro, and Trace Methods: Elsevier
Science; 2012.
[103] Van Krevelen D. Graphical-statistical method for the study of structure and reaction
processes of coal. Fuel. 1950;29:269-84.
[104] Lv P, Xiong Z, Chang J, Wu C, Chen Y, Zhu J. An experimental study on biomass air–
steam gasification in a fluidized bed. Bioresource Technology. 2004;95:95-101.
[105] Vassilev SV, Kitano K, Vassileva CG. Some relationships between coal rank and chemical
48
and mineral composition. Fuel. 1996;75:1537-42.
[106] Chen Z, Zhang S, Chen Z, Ding D. An integrated process for hydrogen-rich gas
production from cotton stalks: The simultaneous gasification of pyrolysis gases and char in an
entrained flow bed reactor. Bioresource Technology. 2015;198:586-92.
[107] Miller FP, Vandome AF, John MB. Higher Heating Value: VDM Publishing; 2010.
[108] Demirbas A. Effects of moisture and hydrogen content on the heating value of fuels.
Energy Sources, Part A: Recovery, Utilization, and Environmental Effects. 2007;29:649-55.
[109] THEK G, OBERNBERGER I. An integrated European market for densified biomass
fuels (INDEBIF). Austrian Country Report (final Report), EU-ALTENER-Projekt AL/98/520,
BIOS BIOENERGIESYSTEME GmbH (Ed), Graz, Austria. 2002.
[110] Demirbaş A. Relationships between lignin contents and heating values of biomass.
Energy Conversion and Management. 2001;42:183-8.
[111] Williams CL, Westover TL, Emerson RM, Tumuluru JS, Li C. Sources of biomass
feedstock variability and the potential impact on biofuels production. BioEnergy Research.
2016;9:1-14.
[112] Boundy RG, Diegel SW, Wright LL, Davis SC. Biomass Energy Data Book: Department
of Energy, United States; 2011.
[113] Wu W, Mei Y, Zhang L, Liu R, Cai J. Kinetics and reaction chemistry of pyrolysis and
combustion of tobacco waste. Fuel. 2015;156:71-80.
[114] Lebo SE, Gargulak JD, McNally TJ. Lignin. Kirk-Othmer Encyclopedia of Chemical
Technology: John Wiley & Sons, Inc.; 2000.
[115] Yang H, Yan R, Chen H, Lee DH, Zheng C. Characteristics of hemicellulose, cellulose
and lignin pyrolysis. Fuel. 2007;86:1781-8.
[116] Pérez J, Munoz-Dorado J, de la Rubia T, Martinez J. Biodegradation and biological
treatments of cellulose, hemicellulose and lignin: an overview. International Microbiology.
2002;5:53-63.
[117] Welker C, Balasubramanian V, Petti C, Rai K, DeBolt S, Mendu V. Engineering plant
biomass lignin content and composition for biofuels and bioproducts. Energies. 2015;8:7654.
[118] Sluiter JB, Ruiz RO, Scarlata CJ, Sluiter AD, Templeton DW. Compositional analysis of
lignocellulosic feedstocks. 1. Review and description of methods. Journal of Agricultural and
49
Food Chemistry. 2010;58:9043-53.
[119] ASTM E1757 - 01, Standard Practice for Preparation of Biomass for Compositional
Analysis. West Conshohocken, PA: ASTM International; 2015.
[120] Templeton DW, Scarlata CJ, Sluiter JB, Wolfrum EJ. Compositional analysis of
lignocellulosic feedstocks. 2. Method uncertainties. Journal of Agricultural and Food Chemistry.
2010;58:9054-62.
[121] Cai J, Wu W, Liu R, Huber GW. A distributed activation energy model for the pyrolysis
of lignocellulosic biomass. Green Chemistry. 2013;15:1331-40.
[122] Sluiter A, Hames B, Ruiz R, Scarlata C, Sluiter J, Templeton D, et al. Determination of
structural carbohydrates and lignin in biomass. Laboratory Analytical Procedure: National
Renewable Energy Laboratory; 2012. p. 18.
[123] Pandey A, Negi S, Binod P, Larroche C. Pretreatment of Biomass: Processes and
Technologies: Elsevier Science; 2014.
[124] Roggo Y, Chalus P, Maurer L, Lema-Martinez C, Edmond A, Jent N. A review of near
infrared spectroscopy and chemometrics in pharmaceutical technologies. Journal of
Pharmaceutical and Biomedical Analysis. 2007;44:683-700.
[125] Jin S, Chen H. Near-infrared analysis of the chemical composition of rice straw. Industrial
Crops and Products. 2007;26:207-11.
[126] Carrier M, Loppinet-Serani A, Denux D, Lasnier J-M, Ham-Pichavant F, Cansell F, et al.
Thermogravimetric analysis as a new method to determine the lignocellulosic composition of
biomass. Biomass and Bioenergy. 2011;35:298-307.
[127] McKendry P. Energy production from biomass (part 1): overview of biomass. Bioresource
Technology. 2002;83:37-46.
[128] Mahalaxmi S, Williford C. Biochemical Conversion of Biomass to Fuels. In: Chen W-Y,
Suzuki T, Lackner M, editors. Handbook of Climate Change Mitigation and Adaptation. New
York, NY: Springer New York; 2014. p. 1-28.
[129] Jørgensen H, Kristensen JB, Felby C. Enzymatic conversion of lignocellulose into
fermentable sugars: challenges and opportunities. Biofuels, Bioproducts and Biorefining.
2007;1:119-34.
[130] Bajpai P. Pretreatment of Lignocellulosic Biomass for Biofuel Production: Springer

50
Singapore; 2016.