review of nitrogen and stocking rate experiments for milk production in ireland
TRANSCRIPT
Review of Nitrogen and Stocking Rate Experiments for Milk Production in IrelandAuthor(s): T. F. Gately, W. F. O'Keeffe and J. ConnollySource: Irish Journal of Agricultural Research, Vol. 23, No. 1 (1984), pp. 11-26Published by: TEAGASC-Agriculture and Food Development AuthorityStable URL: http://www.jstor.org/stable/25556071 .
Accessed: 12/06/2014 22:15
Your use of the JSTOR archive indicates your acceptance of the Terms & Conditions of Use, available at .http://www.jstor.org/page/info/about/policies/terms.jsp
.JSTOR is a not-for-profit service that helps scholars, researchers, and students discover, use, and build upon a wide range ofcontent in a trusted digital archive. We use information technology and tools to increase productivity and facilitate new formsof scholarship. For more information about JSTOR, please contact [email protected].
.
TEAGASC-Agriculture and Food Development Authority is collaborating with JSTOR to digitize, preserve andextend access to Irish Journal of Agricultural Research.
http://www.jstor.org
This content downloaded from 195.78.108.60 on Thu, 12 Jun 2014 22:15:45 PMAll use subject to JSTOR Terms and Conditions
Ir. J. agric. Res. 23: 11-26, 1984
Review of Nitrogen and Stocking Rate Experiments for Milk Production in Ireland
T. F. Gately, and W. F. O'Keeffe An Foras Taluntais, Johnstown Castle Research Centre, Wexford
J. Connolly An Foras Taluntais, Statistics Department, 19 Sandy mount Avenue, Dublin 4
Abstract
This paper reviews the milk production results obtained from six large-scale grazing
experiments in the Republic of Ireland. In these experiments, levels of nitrogen varying
from 51 to 495 kg N ha"1 and stocking rates varying from 1.54 to 3.90 cows ha"1 on a
whole-farm basis were evaluated on four freely drained and two imperfectly drained soils.
The effects of the nitrogen treatments were measured as the percentage change in
stock-carrying capacity at a given level of output animal"1. Twenty-four data points were
included in a model which had the form
Y= 100 [K/ (1 + A exp (B)) ?
1]
where A was a constant and B was a function ofthe variables N, site and time relative to the
start ofthe experiment. Using this model, three curves were derived, for the freely and
imperfectly drained sites, which showed the predicted change to a range ofN levels for the
first, second and third or later years.
The predicted rate of N which gave the maximum percentage change in carrying
capacity was about 300 kg N ha"1 on the freely and imperfectly drained sites. On the freely drained sites, the predicted response to N, at 300 kg ha1 was 28, 77 and 89% change in
carrying capacity in the first, second and third or later years. The corresponding predicted
increase on the imperfectly drained sites was 16, 44 and 52%, respectively. The small
increase in percentage change in carrying capacity in the first relative to later experimental
years was probably due to the presence of more clover in the first year of these experiments.
Introduction
Many experiments have been carried out in
Ireland, especially since the establishment
of an Foras Taluntais in 1958, to determine
the optimum rate of nitrogen to apply to
pastures for grazing cows. Since these
relatively large-scale nitrogen experiments
under grazing tie up research resources in
terms of staff, land, animals and equipment,
it was considered that the time was oppor
tune to review the results to date and to
examine the need for future work in this
field. This paper examines the milk production
11
This content downloaded from 195.78.108.60 on Thu, 12 Jun 2014 22:15:45 PMAll use subject to JSTOR Terms and Conditions
12 IRISH JOURNAL OF AGRICULTURAL RESEARCH, VOL. 23, NO. 1, 1984
results obtained using dairy cows where
several levels of nitrogen and of stocking
rates were tested. Our findings are also
related to results from similar experiments
carried out in other countries.
Nitrogen use in Ireland
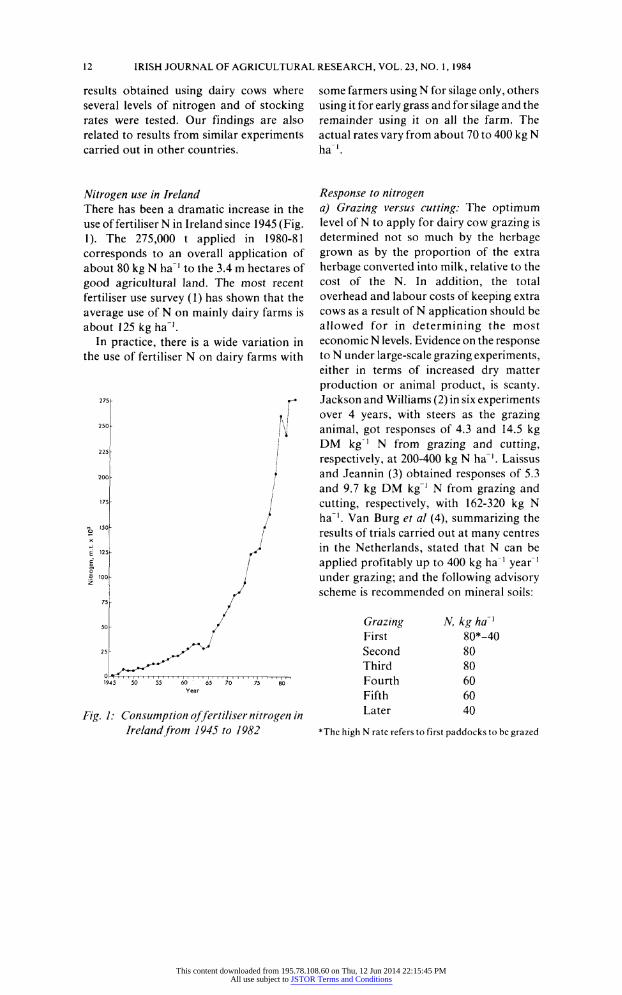
There has been a dramatic increase in the
use of fertiliser N in Ireland since 1945 (Fig. 1). The 275,000 t applied in 1980-81
corresponds to an overall application of
about 80 kg N ha"1 to the 3.4 m hectares of
good agricultural land. The most recent
fertiliser use survey (1) has shown that the
average use of N on mainly dairy farms is
about 125 kg ha"J.
In practice, there is a wide variation in
the use of fertiliser N on dairy farms with
275)- j
H
225- I
200- r
/ ? H / E 125- V
I / S. 100- / z i
75- /
50- /
1945 50 55 60 65 70 75 80 Year
Fig. 1: Consumption of fertiliser nitrogen in Ireland from 1945 to 1982
some farmers using N for silage only, others
using it for early grass and for silage and the
remainder using it on all the farm. The
actual rates vary from about 70 to 400 kg N ha"'.
Response to nitrogen
a) Grazing versus cutting: The optimum level of N to apply for dairy cow grazing is
determined not so much by the herbage
grown as by the proportion of the extra
herbage converted into milk, relative to the
cost of the N. In addition, the total
overhead and labour costs of keeping extra
cows as a result of N application should be
allowed for in determining the most
economic N levels. Evidence on the response
to N under large-scale grazing experiments,
either in terms of increased dry matter
production or animal product, is scanty.
Jackson and Williams (2) in six experiments over 4 years, with steers as the grazing
animal, got responses of 4.3 and 14.5 kg
DM kg !
N from grazing and cutting,
respectively, at 200-400 kg N ha"1. Laissus
and Jeannin (3) obtained responses of 5.3
and 9.7 kg DM kg"1 N from grazing and
cutting, respectively, with 162-320 kg N ha"1. Van Burg et al (4), summarizing the
results of trials carried out at many centres
in the Netherlands, stated that N can be
applied profitably up to 400 kg ha"1 year1 under grazing; and the following advisory
scheme is recommended on mineral soils:
Grazing N, kg ha'1
First 80*-40
Second 80 Third 80 Fourth 60 Fifth 60 Later 40
*Thc high N rate refers to first paddocks to be grazed
This content downloaded from 195.78.108.60 on Thu, 12 Jun 2014 22:15:45 PMAll use subject to JSTOR Terms and Conditions
GATELY ETAL: NITROGEN FOR MILK PRODUCTION 13
In Northern Ireland, Gordon (5) obtained
426, 623 and 763 cow grazing days ha"1 from the application of 150,300 and 450 kg
N ha"1, respectively.
b) White clover (Trifolium repens): Swards
containing clover respond less to fertiliser
N than do all-grass swards as the clover
supplies some N to the companion grass.
Brockman (6), in a summary of 29 site years
of grazed experiments in England, found
that clover supplied the equivalent of 139
kg N ha"1 with a range of 40 to 220 kg N
ha"1. Ennik (7), using results of research in
the Netherlands and data reported in the
literature, found that "with increasing
application of N, the gain of grass DM is
somewhat higher than the loss of clover
DM in the same mixture, while total DM
yield increases slightly".
c) Stocking rate: Researchers have adopted
different grazing techniques in attempting
to maximise efficiency of conversion of
pasture to animal product and to ascertain
the optimum rate of N that should be
recommended for grazing. With dairy cows
the approach, reported by McMeekan (8),
of using several stocking rates at each level
of N was followed in Ireland by Browne (9, 11) and McFeely (10). It is not practical to
vary the stocking rate during the grazing season with milch cows, apart from bringing in areas that have been used for silage or
hay production. The importance of choos
ing the correct range in stocking rates at the
start of each grazing season is therefore
very critical. The experimental methods for
grazing trials proposed by Conniffe (12) and Connolly (13) have been used in recent
trials by McCarthy and Flynn (14), by Gately (15) and Stakelum (16).
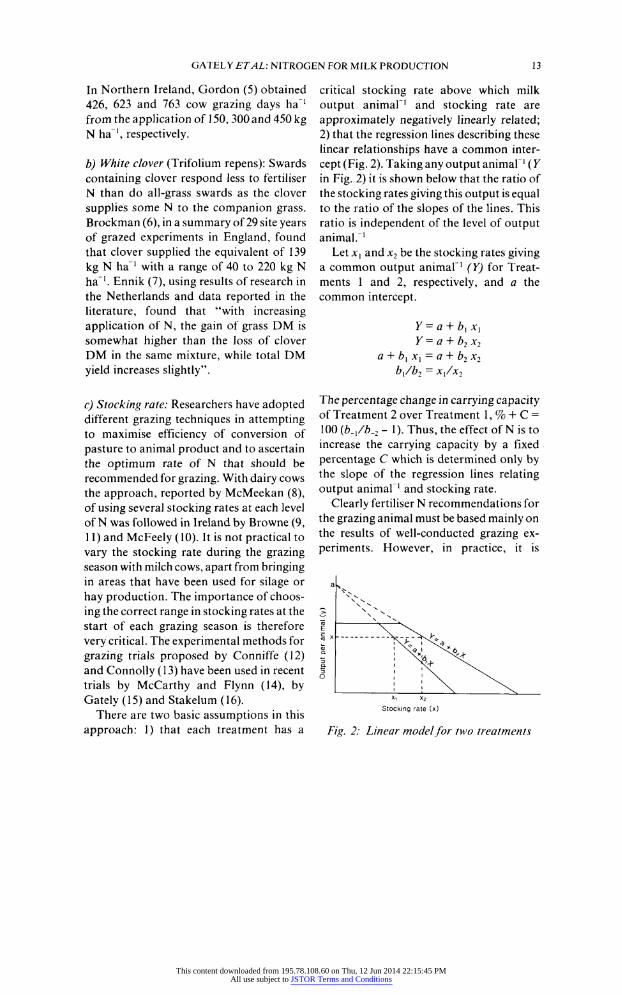
There are two basic assumptions in this
approach: 1) that each treatment has a
critical stocking rate above which milk
output animal1 and stocking rate are
approximately negatively linearly related;
2) that the regression lines describing these linear relationships have a common inter
cept (Fig. 2). Taking any output animal"1 (Y
in Fig. 2) it is shown below that the ratio of the stocking rates giving this output is equal to the ratio of the slopes of the lines. This
ratio is independent of the level of output animal."1
Let X] and x2 be the stocking rates giving a common output animal"1 (Y) for Treat
ments 1 and 2, respectively, and a the
common intercept.
r = #+ _>, *!
Y=a + b2x2 a + bx x}
= a + b2x2
b\/b2 =
xx/x2
The percentage change in carrying capacity of Treatment 2 over Treatment 1, % + C =
100 (_j_,/Z>_2 -
1). Thus, the effect of N is to
increase the carrying capacity by a fixed
percentage C which is determined only by the slope of the regression lines relating
output animal1 and stocking rate.
Clearly fertiliser N recommendations for
the grazing animal must be based mainly on
the results of well-conducted grazing ex
periments. However, in practice, it is
N\x
_ \ *, ro - * -\. E X X. C y _ ,__\ X. L, _ \a TXx
I i\\ a i vr X^^ o , ' \ \
Stocking rate Cx)
Fig. 2: Linear model for two treatments
This content downloaded from 195.78.108.60 on Thu, 12 Jun 2014 22:15:45 PMAll use subject to JSTOR Terms and Conditions
14 IRISH JOURNAL OF AGRICULTURAL RESEARCH, VOL. 23, NO. 1, 1984
difficult to design good nitrogen response
trials under grazing which are manageable
due to the number of treatments necessary,
the extent of the land area involved and the
number of animals required. Even when the
results from large-scale grazing trials which
measure N responses are available, great
discretion must be exercised in "generalis
ing" the findings to commercial farming.
Table 1 shows many of the large number of
factors which must be taken into account
when interpreting nitrogen response trials
under grazing. It is obvious that there can
be large variations in the optimum amount
of N required under grazing.
Experimental Six large-scale N X stocking rate grazing
experiments have been conducted in the
Republic of Ireland which used milk pro duction as a measure of the effect of
incremental rates of fertiliser N applied (9, 10, 11, 14, 15, 16). Some details of the soil
groups, texture, drainage characteristics
and sward composition of the sites and
pastures used are shown in Table 2. Three
of the sites (9, 10, 15) were re-seeded
pastures, two (11,14) were old pastures and
one (16) had half of its area sown to a new
pasture and the remainder was an old
pasture. Two of the sites were imperfectly
drained (11, 15) and the remainder were
freely drained.
Clover content
The white clover content of the pastures
varied considerably depending on the site,
year and nitrogen treatment. Table 3 shows
the estimated clover content of the pastures
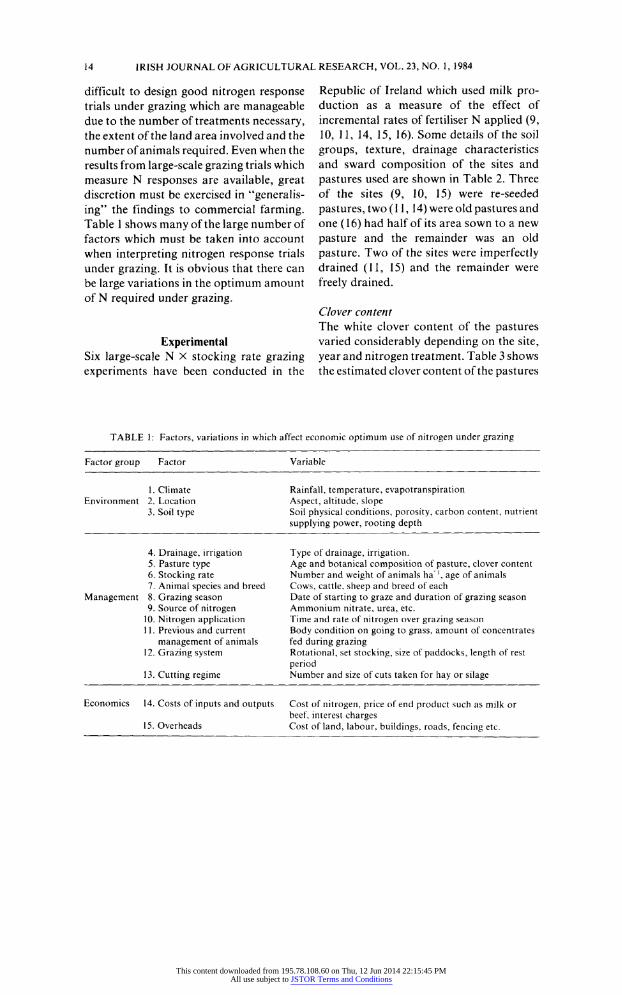
TABLE 1: Factors, variations in which affect economic optimum use of nitrogen under grazing
Factor group Factor Variable
1. Climate Rainfall, temperature, evapotranspiration Environment 2. Location Aspect, altitude, slope
3. Soil type Soil physical conditions, porosity, carbon content, nutrient
supplying power, rooting depth
4. Drainage, irrigation Type of drainage, irrigation. 5. Pasture type Age and botanical composition of pasture, clover content 6. Stocking rate Number and weight of animals ha"1, age of animals 7. Animal species and breed Cows, cattle, sheep and breed of each
Management 8. Grazing season Date of starting to graze and duration of grazing season 9. Source of nitrogen Ammonium nitrate, urea, etc.
10. Nitrogen application Time and rate of nitrogen over grazing season
11. Previous and current Body condition on going to grass, amount of concentrates
management of animals fed during grazing 12. Grazing system Rotational, set stocking, size of paddocks, length of rest
period 13. Cutting regime Number and size of cuts taken for hay or silage
Economics 14. Costs of inputs and outputs Cost of nitrogen, price of end product such as milk or
beef, interest charges 15. Overheads Cost of land, labour, buildings, roads, fencing etc.
This content downloaded from 195.78.108.60 on Thu, 12 Jun 2014 22:15:45 PMAll use subject to JSTOR Terms and Conditions
GATELY ETAL: NITROGEN FOR MILK PRODUCTION 15
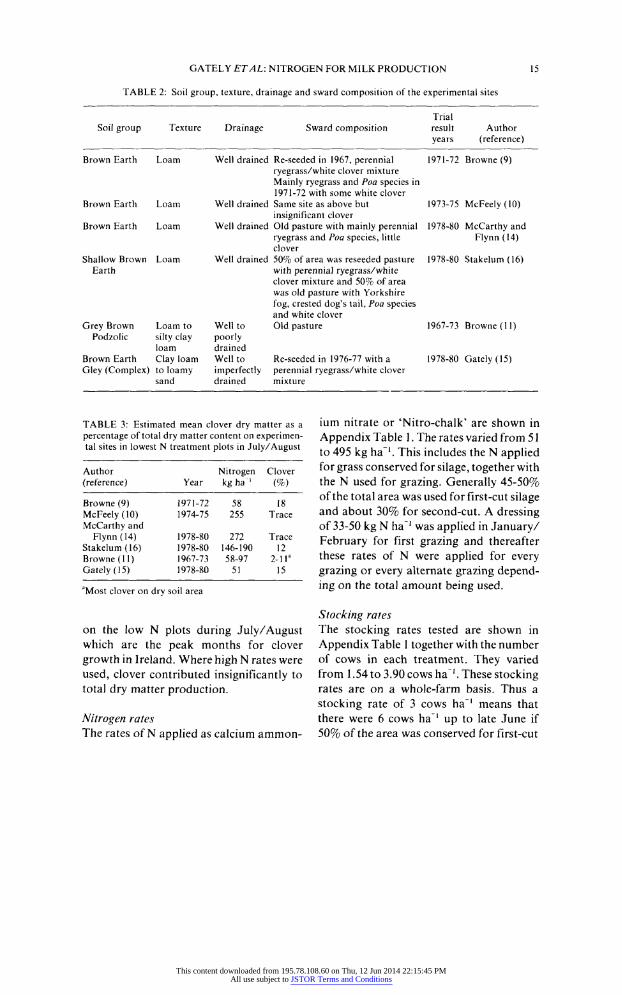
TABLE 2: Soil group, texture, drainage and sward composition of the experimental sites
Trial Soil group Texture Drainage Sward composition result Author
years (reference)
Brown Earth Loam Well drained Re-seeded in 1967, perennial 1971-72 Browne (9)
ryegrass/white clover mixture
Mainly ryegrass and Poa species in 1971-72 with some white clover
Brown Earth Loam Well drained Same site as above but 1973-75 McFeely (10) insignificant clover
Brown Earth Loam Well drained Old pasture with mainly perennial 1978-80 McCarthy and
ryegrass and Poa species, little Flynn (14) clover
Shallow Brown Loam Well drained 50% of area was reseeded pasture 1978-80 Stakelum (16) Earth with perennial ryegrass/white
clover mixture and 50% of area was old pasture with Yorkshire
fog, crested dog's tail, Poa species and white clover
Grey Brown Loam to Well to Old pasture 1967-73 Browne (11) Podzolic silty clay poorly
loam drained Brown Earth Clay loam Well to Re-seeded in 1976-77 with a 1978-80 Gately (15)
Gley (Complex) to loamy imperfectly perennial ryegrass/white clover sand drained mixture
TABLE 3: Estimated mean clover dry matter as a
percentage of total dry matter content on experimen tal sites in lowest N treatment plots in July/August
Author Nitrogen Clover
(reference) Year kg ha ' (%)
Browne (9) 1971-72 58 18
McFeely (10) 1974-75 255 Trace
McCarthy and
Flynn (14) 1978-80 272 Trace
Stakelum(16) 1978-80 146-190 12 Browne (11) 1967-73 58-97 2-1 la
Gately (15) 1978-80 51 15
"Most clover on dry soil area
on the low N plots during July/August which are the peak months for clover
growth in Ireland. Where high N rates were
used, clover contributed insignificantly to
total dry matter production.
Nitrogen rates
The rates ofN applied as calcium ammon
ium nitrate or 'Nitro-chalk' are shown in
Appendix Table 1. The rates varied from 51 to 495 kg ha"1. This includes the N applied for grass conserved for silage, together with
the N used for grazing. Generally 45-50% of the total area was used for first-cut silage and about 30% for second-cut. A dressing of 33-50 kg N ha"1 was applied in January/ February for first grazing and thereafter
these rates of N were applied for every
grazing or every alternate grazing depend
ing on the total amount being used.
Stocking rates
The stocking rates tested are shown in
Appendix Table 1 together with the number of cows in each treatment. They varied
from 1.54 to 3.90 cows ha"1. These stocking rates are on a whole-farm basis. Thus a
stocking rate of 3 cows ha"1 means that
there were 6 cows ha"1 up to late June if
50% of the area was conserved for first-cut
This content downloaded from 195.78.108.60 on Thu, 12 Jun 2014 22:15:45 PMAll use subject to JSTOR Terms and Conditions
16 IRISH JOURNAL OF AGRICULTURAL RESEARCH, VOL. 23, NO. 1, 1984
silage, 4.5 cows ha"1 up to early August if
33% ofthe area was conserved for second
cut silage, and 3 cows ha"1 until the end of
grazing in November. Rotational grazing was practised in all experiments with a
grazing period of 3.5 to 2 days and a rest
period of 17.5 to 22 days.
Milk yields The cows calved from January to April
inclusive and the grazing season ranged
from late March to the end of November.
Over 80% of the milk yields shown in
Appendix Table 1 were produced during the grazing season and the remainder from
silage harvested from the experimental area
plus concentrates, except in Gately's experi ment (15) where the milk yields shown were
produced during the grazing season only. Concentrates inputs varied from 0.25 to 0.5
t cow1 and were fed almost entirely while
cows were indoors. Milk yields were re
corded twice daily on at least 5 days per week.
Statistical analysis The percentage changes in carrying capacity were calculated from the results of each
experimental year using the common inter
cept model. This enables sites of obviously
different potentials to be compared on a
common basis. It is the objective of this
study to analyse these percentage changes
and relate them to a number of variables.
Change in carrying capacity may be affected
by a number of factors, e.g. level of applied
N, year of measurement relative to the start
of the experiment, clover content, location
and weather. Because of the relatively low
number of data points it was not possible to
provide a comprehensive analysis for the
effects of all these factors. The effects of
applied N, year within experiment and site
were the variables included in the analysis.
The objective is to develop a model which will be helpful in the analysis of these data.
It must be emphasised that a model
developed and fitted with so few data points and so many possible explanatory variables
must not be interpreted too exactly and can
at best give only a broad picture.
The variables used in the model are:
TVl = lower level of N applied Nu =
higher level of N applied Z =
percentage change in carrying capac
ity observed in an experimental year
in an experiment with N levels Nl and
/Vh.
Y = percentage change in carrying capac
ity in an experimental year with N
levels 0 and N, i.e., the change relative
to zero N.
T = time relative to the start of the
experiment, with the first year being
1. Years 3 and later are given the value
3.
S = site of the experiment. The analysis relies on the following con
siderations. Let
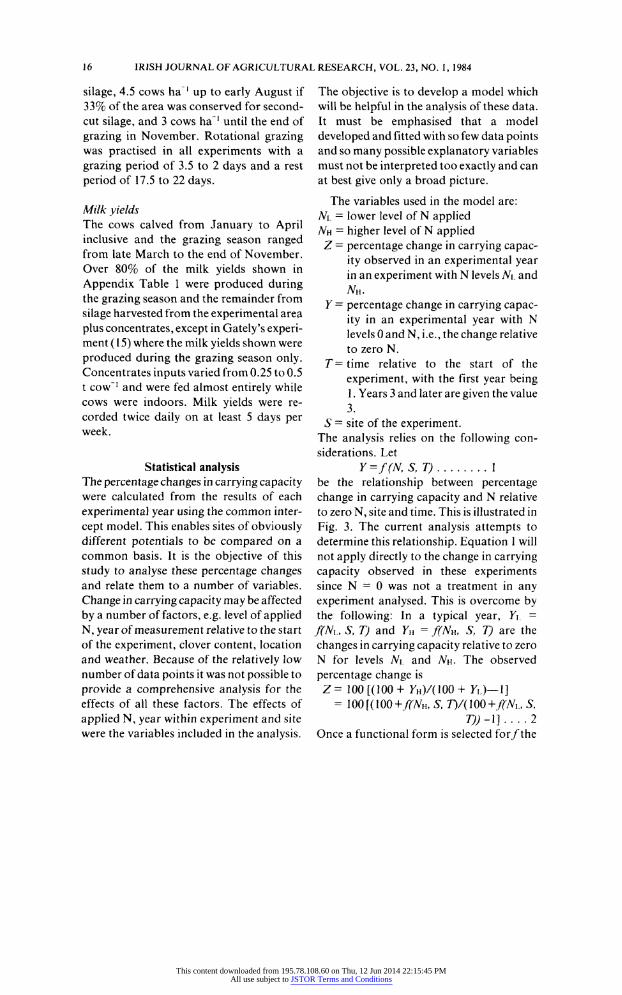
Y=f(N, S,T).1 be the relationship between percentage
change in carrying capacity and N relative
to zero N, site and time. This is illustrated in
Fig. 3. The current analysis attempts to
determine this relationship. Equation 1 will
not apply directly to the change in carrying capacity observed in these experiments
since N -
0 was not a treatment in any
experiment analysed. This is overcome by
the following: In a typical year, Y\ -
f(NL, S, T) and Yn = f(Nu, Sf T) arc the
changes in carrying capacity relative to zero
N for levels Ni and Nn. The observed
percentage change is
z= ioo [(100+ yH)/(ioo+ ro?i] = 100 [(100 +f(Nu, S, T)/( 100 +f(NL, S,
T))-\]....2
Once a functional form is selected for/the
This content downloaded from 195.78.108.60 on Thu, 12 Jun 2014 22:15:45 PMAll use subject to JSTOR Terms and Conditions
GATELY ETAL: NITROGEN FOR MILK PRODUCTION 17
100 +Y
-100+yh-?^r^ 140 - ^? !
o _^**^ I CO_ i
a _^^ CO / I o 130- ^S^
, a, -100+Yl-rrf
I C
yST , |
? 12?" / : z=ioor^?^L-ii
s no- / t ! C / i ? / I
/ '150 1350 100 ^-1-1-L_J-1-1_I_U_L
50 100 NL 200 250 300 NH 400
N level,kg ha-1
Fig. 3: Representation of relationship between % change in carrying capacity (Y) and N
level relative to zero N for a given site and time within experiment
parameters are determined by fitting the
observed values of Z using Equation 2. As
regards the form of/ two conditions must
be considered. First, the response to N
(measured as percentage change in carrying
capacity relative to zero N) would be
expected to be strictly increasing, perhaps after some initial adjustment, and relatively
smooth, starting at the value 0 and rising to
some (perhaps asymptotically attained) upper level. Second, the response and the
upper level may be affected by other factors such as site and time relative to the start of
the experiment.
The curves defined by the form
Y = 100 [K/(\ + A exp (B))?\] .... 3 where A and B are functions of N, site (S) and time (T) were considered. (K would be defined by the boundary condition Y - 0 when N =
0). For certain functional forms
of A and B, this family of curves gives
functions satisfying both conditions out
lined above. However, it must be recognised
that forcing a particular form on the data
for theoretical reasons may result in a fit
that is not quite as good as would be yielded
by a completely empirical approach. On the
other hand, a model may result in fewer,
more readily interpretable parameters.
After a certain amount of preliminary
fitting it seemed best for the purposes of
obtaining functions satisfying both the above conditions to restrict the forms for A
and B as follows:
A = a, a constant, and
B = g (N,S, T) where g is a function of the
three variables in brackets, allowing for
powers and crossproduct terms in these
variables. A number of models of this form
were fitted to the data in Appendix Table 1,
ranging in number of parameters from 4 to
8. The model chosen is shown in Equation 4
This content downloaded from 195.78.108.60 on Thu, 12 Jun 2014 22:15:45 PMAll use subject to JSTOR Terms and Conditions
18 IRISH JOURNAL OF AGRICULTURAL RESEARCH, VOL. 23, NO. 1, 1984
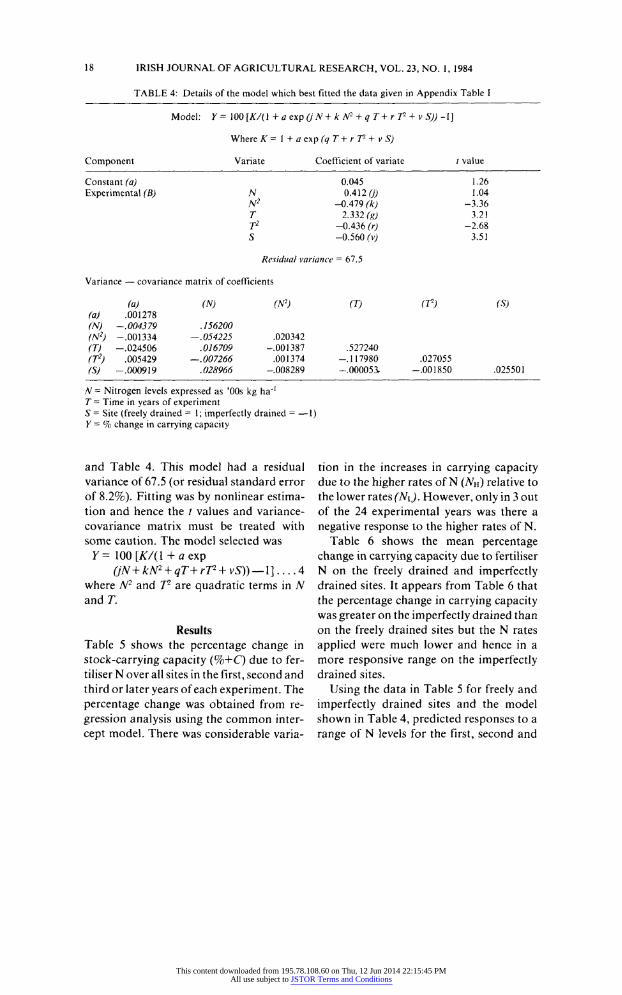
TABLE 4: Details of the model which best fitted the data given in Appendix Table I
Model: Y= 100[tf/(l + a exp (jN + k N2 + q T+ r T + v S)) -I]
Where K = 1 + a exp (q T + r T + v Sj
Component Variate Coefficient of variate / value
Constant fo) 0.045 1.26
Experimental (B) N 0.412 0) L04
TV2 -0.479 (k) -3.36 _T 2.332 ra> 3.21
T2 -0.436 <V) -2.68 S -0.560 rv> 3.51
Residual variance = 67.5
Variance ? covariance matrix of coefficients
(a) (N) (N2) (T) (T2) (S) (a) .001278
(N) -.004379 ,156200
(N2) -.001334 ?.054225 .020342
(T) -.024506 .016709 -.001387 .527240
(T2) .005429 ?.007266 .001374 -.117980 .027055
(S) -.000919 .028966 -.008289 -.000053, -.001850 .025501
jV = Nitrogen levels expressed as '00s kg ha'1
T= Time in years of experiment S = Site (freely drained =
1; imperfectly drained = ?1)
Y = % change in carrying capacity
and Table 4. This model had a residual
variance of 67.5 (or residual standard error
of 8.2%). Fitting was by nonlinear estima
tion and hence the / values and variance
covariance matrix must be treated with
some caution. The model selected was
Y = 100[tf/(l + aexp
(jN+krf + qT+rF + vS)) ?1]....4 where N2 and T2 are quadratic terms in N
and T.
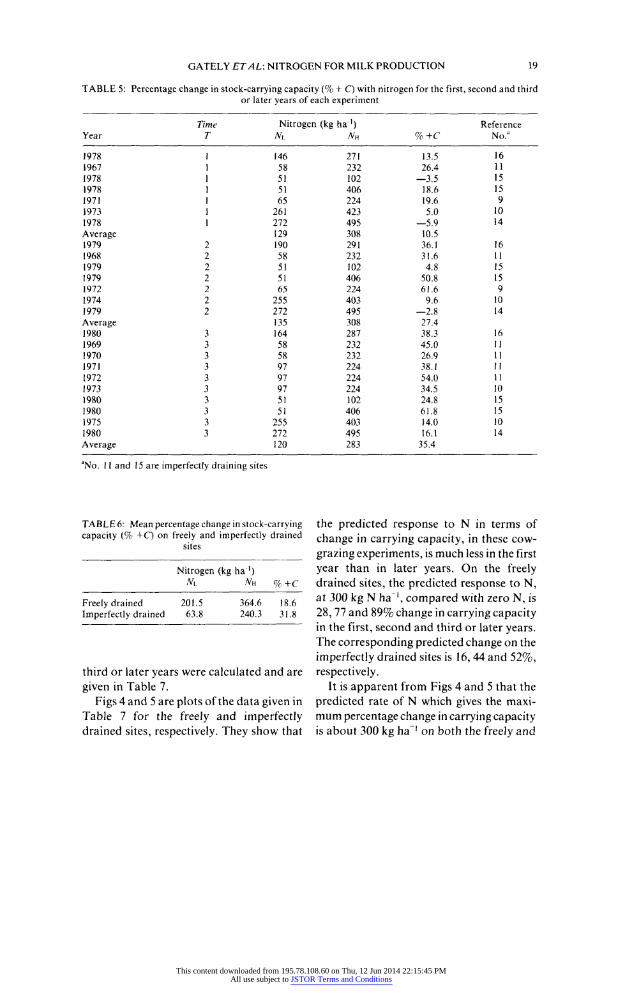
Results Table 5 shows the percentage change in
stock-carrying capacity (%+C) due to fer
tiliser N over all sites in the first, second and
third or later years of each experiment. The
percentage change was obtained from re
gression analysis using the common inter
cept model. There was considerable varia
tion in the increases in carrying capacity
due to the higher rates ofN (MO relative to the lower rates (Ni). However, only in 3 out
of the 24 experimental years was there a
negative response to the higher rates of N.
Table 6 shows the mean percentage
change in carrying capacity due to fertiliser
N on the freely drained and imperfectly drained sites. It appears from Table 6 that the percentage change in carrying capacity
was greater on the imperfectly drained than
on the freely drained sites but the N rates
applied were much lower and hence in a
more responsive range on the imperfectly drained sites.
Using the data in Table 5 for freely and
imperfectly drained sites and the model shown in Table 4, predicted responses to a
range of N levels for the first, second and
This content downloaded from 195.78.108.60 on Thu, 12 Jun 2014 22:15:45 PMAll use subject to JSTOR Terms and Conditions
GATELY ETAL: NITROGEN FOR MILK PRODUCTION 19
TABLE 5: Percentage change in stock-carrying capacity (% + C) with nitrogen for the first, second and third or later years of each experiment
Time Nitrogen (kg ha1) Reference Year T M_ Ah %+C No.a
1978 1 146 271 13.5 16
1967 1 58 232 26.4 11
1978 1 51 102 ?3.5 15
1978 1 51 406 18.6 15
1971 1 65 224 19.6 9
1973 1 261 423 5.0 10
1978 1 272 495 ?5.9 14
Average 129 308 10.5 1979 2 190 291 36.1 16
1968 2 58 232 31.6 11 1979 2 51 102 4.8 15
1979 2 51 406 50.8 15 1972 2 65 224 61.6 9
1974 2 255 403 9.6 10
1979 2 272 495 ?2.8 14
Average 135 308 27.4 1980 3 164 287 38.3 16
1969 3 58 232 45.0 U
1970 3 58 232 26.9 11 1971 3 97 224 38.1 II
1972 3 97 224 54.0 11
1973 3 97 224 34.5 10
1980 3 51 102 24.8 15
1980 3 51 406 61.8 15 1975 3 255 403 14.0 10
1980 3 272 495 16.1 14
Average 120 283 35.4
aNo. ll and 15 are imperfectly draining sites
TABLE 6: Mean percentage change in stock-carrying capacity (% +C) on freely and imperfectly drained
sites
Nitrogen (kg ha1) M. Mi % +c
Freely drained 201.5 364.6 18.6
Imperfectly drained 63.8 240.3 31.8
third or later years were calculated and are
given in Table 7.
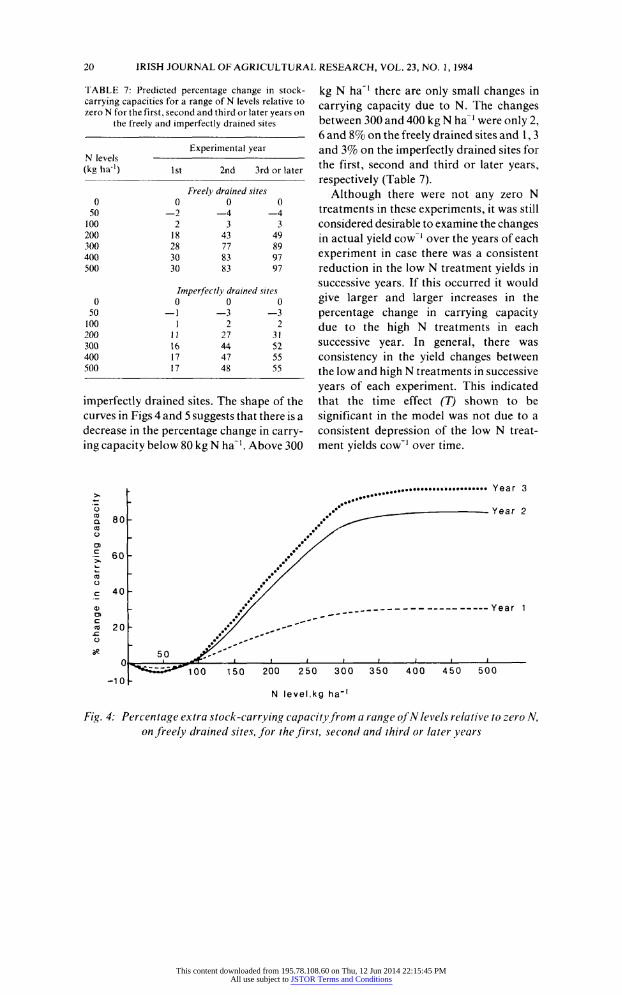
Figs 4 and 5 are plots ofthe data given in Table 7 for the freely and imperfectly drained sites, respectively. They show that
the predicted response to N in terms of
change in carrying capacity, in these cow
grazing experiments, is much less in the first
year than in later years. On the freely
drained sites, the predicted response to N,
at 300 kg N ha ', compared with zero N, is
28,77 and 89% change in carrying capacity in the first, second and third or later years.
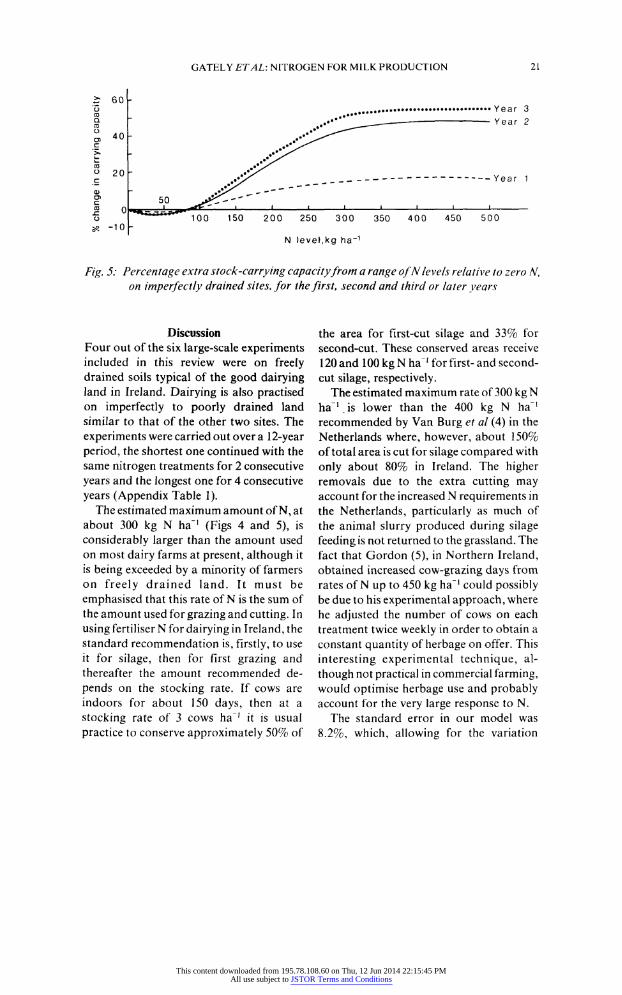
The corresponding predicted change on the
imperfectly drained sites is 16, 44 and 52%,
respectively.
It is apparent from Figs 4 and 5 that the
predicted rate of N which gives the maxi
mum percentage change in carrying capacity is about 300 kg ha"1 on both the freely and
This content downloaded from 195.78.108.60 on Thu, 12 Jun 2014 22:15:45 PMAll use subject to JSTOR Terms and Conditions
20 IRISH JOURNAL OF AGRICULTURAL RESEARCH, VOL. 23, NO. 1, 1984
TABLE 7: Predicted percentage change in stock
carrying capacities for a range of N levels relative to zero N for the first, second and third or later years on
the freely and imperfectly drained sites
Experimental year N levels -
(kg ha"1) 1st 2nd 3rd or later
Freely drained sites 0 0 0 0
50 ?2 ?4 ?4 100 2 3 3
200 18 43 49 300 28 77 89 400 30 83 97
500 30 83 97
Imperfectly drained sites 0 0 0 0
50 ?1 ?3 ?3 100 12 2
200 11 27 31 300 16 44 52 400 17 47 55 500 17 48 55
imperfectly drained sites. The shape of the curves in Figs 4 and 5 suggests that there is a decrease in the percentage change in carry
ing capacity below 80 kg N ha"1. Above 300
kg N ha"1 there are only small changes in
carrying capacity due to N. The changes
between 300 and 400 kg N ha1 were only 2, 6 and 8% on the freely drained sites and 1, 3 and 3% on the imperfectly drained sites for the first, second and third or later years,
respectively (Table 7). Although there were not any zero N
treatments in these experiments, it was still
considered desirable to examine the changes
in actual yield cow1 over the years of each
experiment in case there was a consistent
reduction in the low N treatment yields in successive years. If this occurred it would
give larger and larger increases in the
percentage change in carrying capacity due to the high N treatments in each successive year. In general, there was
consistency in the yield changes between
the low and high N treatments in successive
years of each experiment. This indicated
that the time effect (T) shown to be
significant in the model was not due to a
consistent depression of the low N treat
ment yields cow-1 over time.
l . . Year 3 >* ?
g S'*_ -Year 2
S 80- . ^~?? CO ..* y^ ? - S
I 60- // 5 - SY
c 40 - */
a) - // _Year 1
* 20- X/ ,,-''"""' " -
&^~""
0^_ jm^j^_'_i_*_'_i_'_'-1 ^5?^i*'l00 150 200 250 300 350 400 450 500
-10 -
N level,kg ha"'
Fig. 4: Percentage extra stock-carrying capacity from a range of N levels relative to zero N,
on freely drained sites, for the first, second and third or later years
This content downloaded from 195.78.108.60 on Thu, 12 Jun 2014 22:15:45 PMAll use subject to JSTOR Terms and Conditions
GATELY ETAL: NITROGEN FOR MILK PRODUCTION 21
^ 60 -
5 .Year
3
I *
. "-!!1-??-Year 2
? 40 X^^ \ ,<f^ co .?*X^ ? 20
- ..^X c
!x^ -_ ear
| 50 ^^"C' _t _t _< _
o "*^SS^ TsO 200 250 300 350 400 450 500 5? -10 -
N level,kg ha~1
Fig. 5: Percentage extra stock-carrying capacity from a range of N levels relative to zero N,
on imperfectly drained sites, for the first, second and third or later years
Discussion
Four out of the six large-scale experiments included in this review were on freely
drained soils typical of the good dairying land in Ireland. Dairying is also practised on imperfectly to poorly drained land similar to that of the other two sites. The
experiments were carried out over a 12-year
period, the shortest one continued with the
same nitrogen treatments for 2 consecutive
years and the longest one for 4 consecutive
years (Appendix Table 1). The estimated maximum amount of N, at
about 300 kg N ha"1 (Figs 4 and 5), is
considerably larger than the amount used
on most dairy farms at present, although it
is being exceeded by a minority of farmers
on freely drained land. It must be
emphasised that this rate of N is the sum of the amount used for grazing and cutting. In
using fertiliser N for dairying in Ireland, the standard recommendation is, firstly, to use
it for silage, then for first grazing and
thereafter the amount recommended de
pends on the stocking rate. If cows are
indoors for about 150 days, then at a
stocking rate of 3 cows ha"1 it is usual
practice to conserve approximately 50% of
the area for first-cut silage and 33% for
second-cut. These conserved areas receive
120 and 100 kg N ha"1 for first- and second
cut silage, respectively.
The estimated maximum rate of 300 kg N
ha-1 is lower than the 400 kg N ha"1
recommended by Van Burg et al (4) in the
Netherlands where, however, about 150%
of total area is cut for silage compared with
only about 80% in Ireland. The higher removals due to the extra cutting may
account for the increased N requirements in
the Netherlands, particularly as much of
the animal slurry produced during silage
feeding is not returned to the grassland. The
fact that Gordon (5), in Northern Ireland, obtained increased cow-grazing days from
rates ofN up to 450 kg ha"1 could possibly be due to his experimental approach, where
he adjusted the number of cows on each
treatment twice weekly in order to obtain a
constant quantity of herbage on offer. This
interesting experimental technique, al
though not practical in commercial farming,
would optimise herbage use and probably
account for the very large response to N.
The standard error in our model was
8.2%, which, allowing for the variation
This content downloaded from 195.78.108.60 on Thu, 12 Jun 2014 22:15:45 PMAll use subject to JSTOR Terms and Conditions
22 IRISH JOURNAL OF AGRICULTURAL RESEARCH, VOL. 23, NO. 1, 1984
introduced by the variation in the parameter
estimates, would lead to 95% confidence
intervals for predicted percentage change
considerably in excess of 17%. This rein
forces earlier comments about the care that
should be taken not to attach too precise an
interpretation to these results.
Effect of clover The parameter of time (T) is not in itself
biologically meaningful and is a surrogate
for perhaps a large number of time-related
processes. Direct measurement of these
processes might explain still further the
unexplained variation in the model. It is
possible that part of this variation could be
accounted for if a more precise measure
ment of the clover content had been
undertaken at each site. Thus, Table 3 gives
only the clover content in July/August
whereas it should have been determined for
each grazing cycle.
The small increase in percentage change
in carrying capacity in the first relative to
the second or subsequent experimental
years from fertiliser N may be due to the
presence of more clover in the first year of
these experiments. There would be a
decrease in clover content with time result
ing from the cumulative effect of N. This
decrease in clover content in the higher N
treatments would be compensated for by
the effect ofthe N on dry matter production
leading to a greater increase in percentage
change in carrying capacity in the second
and subsequent years. This agrees with
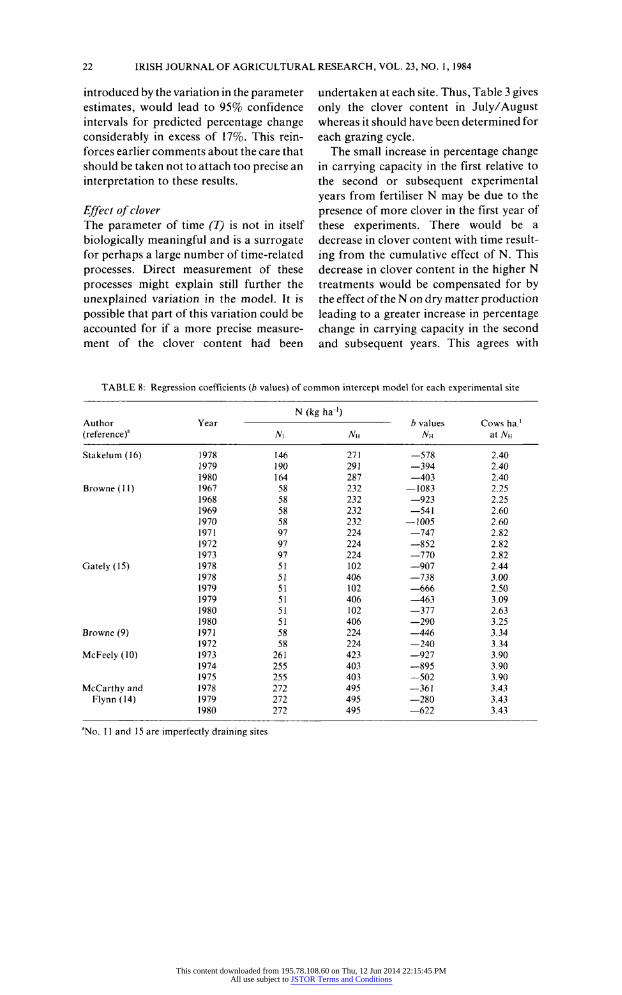
TABLE 8: Regression coefficients (b values) of common intercept model for each experimental site
N (kg ha1) Author Year
- lvalues Cows ha.'
(reference)3 NL NH NH at jVh
Stakelum (16) 1978 146 271 ?578 2.40 1979 190 291 ?394 2.40 1980 164 287 ?403 2.40
Browne (11) 1967 58 232 ?1083 2.25 1968 58 232 ?923 2.25 1969 58 232 ?541 2.60 1970 58 232 ?1005 2.60
1971 97 224 ?747 2.82 1972 97 224 ?852 2.82 1973 97 224 ?770 2.82
Gately(15) 1978 51 102 ?907 2.44 1978 51 406 ?738 3.00 1979 51 102 ?666 2.50 1979 51 406 ?463 3.09 1980 51 102 ?377 2.63 1980 51 406 ?290 3.25
Browne (9) 1973 58 224 ?446 3.34 1972 58 224 ?240 3.34
McFeely (10) 1973 261 423 ?927 3.90 1974 255 403 ?895 3.90 1975 255 403 ?502 3.90
McCarthy and 1978 272 495 ?361 3.43
Flynn (14) 1979 272 495 ?280 3.43 1980 272 495 ?622 3.43
aNo. 11 and 15 are imperfectly draining sites
This content downloaded from 195.78.108.60 on Thu, 12 Jun 2014 22:15:45 PMAll use subject to JSTOR Terms and Conditions
GATELY ETAL: NITROGEN FOR MILK PRODUCTION 23
Ennick's (7) conclusions that with increas
ing N usage there is a somewhat greater
gain in grass DM than loss of clover DM.
The suggested decrease in percentage
change in carrying capacity with rates of
fertiliser N up to 80 kg ha"1 (Figs 3 and 4)
agrees with other reports that low levels of
N decrease total production due to its
adverse effect on clover without a com
pensatory increase in grass output (18).
Masterson (19) found that an application of
only 51 kg N ha"1 in spring adversely affected the amount of N fixed by clover in one of these experiments (15).
Effect of soils
Although approximately the same predicted
maximum rate of 300 kg N ha"1 is required for the freely and imperfectly drained sites,
the percentage change in carrying capacity,
due to N, is significantly lower on the wetter
sites (Table 7). In addition Table 8 shows that production animal"1 falls off more
rapidly with increasing stocking rate at the
two wetter sites (11, 15). In practice,
stocking rates are usually considerably
lower on wetter soils due to the shorter
grazing season and the consequent need to
conserve a greater area of the farm for
silage. There is also the risk of more
poaching with increasing stocking rates on
wetter soils.
Overall the results of this review indicate
that dairy farmers in Ireland should not use more than 300 kg N ha"1 on a whole-farm
basis. Because the optimum rate ofN to use
is influenced by so many factors (Table 1) it is probably better in practice to recommend
a range of fertiliser N levels rather than a
single amount. Since our model is based on
the percentage change in stock-carrying
capacity due to N, extra animals would
have overhead costs and this is likely to
affect the rate of N which should be used.
This is particularly so on the wetter soils
where overhead costs are larger than on
drier soils.
Acknowledgments The authors express their sincere thanks to
the research, technician and farm staff who
conducted the experiments reviewed in this
publication at various An Foras Taluntais
Centres. Without their input this review
could not have been undertaken.
We would also like to thank Professor E.
P. Cunningham, Deputy Director, An
Foras Taluntais who suggested this review
and Dr. A. Conway, Head, Johnstown
Castle Research Centre, who encouraged us in this work.
References
1. Murphy, W. E. and O'Keeffe, W. F. "Fertilise use
survey". The Fertiliser Association of Ireland, Dublin, p. 1-15, 1983.
2. Jackson, M. V. and Williams, T. E. Response of
grass swards to fertiliser N under cutting or
grazing,/ agric. Sci., Camb. 92: 549, 1979. 3. Laissus, R. and Jeannin, B. Evolution of grassland
under grazing. Proc. 7th Gen. Meeting Eur.
Grassld Fed., Ghent, p. 5, 35, 1978. 4. Van Burg, P. F. J., Prins, W. E., den Boer, P. J.
and Sluiman, W. J. Nitrogen and intensification of livestock farming in EEC countries. The Fertiliser Society, Proceedings No. 199, 1981.
5. Gordon, F. J. Level of nitrogen fertiliser applied to grassland for dairy cows. European Grassland
Federation, Reading (summaries of papers), 1982. 6. Brockman, J. Quantity and timing of fertilizer
nitrogen for grass and grass clover swards. The Fertiliser Society, Proceedings No. 142, 1974.
7. Ennik, G. C. Grass ? clover interaction especially in relation to N fertilisation. In: "Plant physiology
and herbage production", (edited by C. E.
Wright). Occasional Symposium No. 13, British Grassland Society, 1981.
8. McMeekan, C. P. Grazing management and animal production. Proc. 7th Int. Grassld Congr., Palmerston North, New Zealand, p. 146, 1956.
9. Browne, D. Dairy farming systems. 5th Richards
Orpen Memorial Lecture. Supplement to Ir. Grassld Anim. Prod. Assoc. J. 9: 1, 1974.
10. McFeely, P. Study of nitrogen use for milk
production on free draining land. Anim. Prod.
This content downloaded from 195.78.108.60 on Thu, 12 Jun 2014 22:15:45 PMAll use subject to JSTOR Terms and Conditions
24 IRISH JOURNAL OF AGRICULTURAL RESEARCH, VOL. 23, NO. 1, 1984
Res. Rep., An Foras Taluntais, Dublin, p. 95, 1973; p. 108, 1974; p. 109, 1975.
11. Browne, D. Study of nitrogen use for milk
production on permanent pasture at Mullinahone. Soils Res. Rep., An Foras Taluntais, Dublin, p. 94,
1967; p. 85, 1968; p. 59, 1969; p. 62, 1970. Anim. Prod. Res. Rep.r An Foras Taluntais, Dublin, p. 72, 1971; p. 90, 1972, p. 95, 1973.
12. Conniffe, D. Within-herd variance and choice of herd size in grazing experiments. Ir. J. agric. Res. 15: 349, 1976.
13. Connolly, J. The design of grazing experiments. 2. A simple linear model for the gain-stocking rate
relationship. Ir. J. agric. Res. 15: 365, 1976. 14. McCarthy, D. D. and Flynn, F. The effect of
nitrogen and stocking rate on milk production. Proc. Int. Symposium European GrasslandFedera
tion, Wageningen, Pudoc on The role of nitrogen in intensive grassland production, p. 166, 1980.
15. Gately, T. F. Unpublished results. An Foras
Taluntais, Johnstown Castle, Wexford, 1978-80. 16. Stakelum, G. Unpublished results. An Foras
Taluntais, Moorepark Research Centre, 1978-80. 17. Anon. "Monthly Weather Reports". Department
of Transport and Power, Meteorological Service, Dublin, 1931-1960.
18. Maloney, D. and Murphy, W. E. The effect of different levels of nitrogen on a grass clover sward under grazing conditions. Animal output. Ir. J.
agric. Res. 2: I, 1963. 19. Masterson, C. L, and Turner, S. Nitrogen Fixation
in a grazed sward. Soils Res. Rep., An Foras
Taluntais, Dublin, p. 37, 1981.
Received November J I, 1983
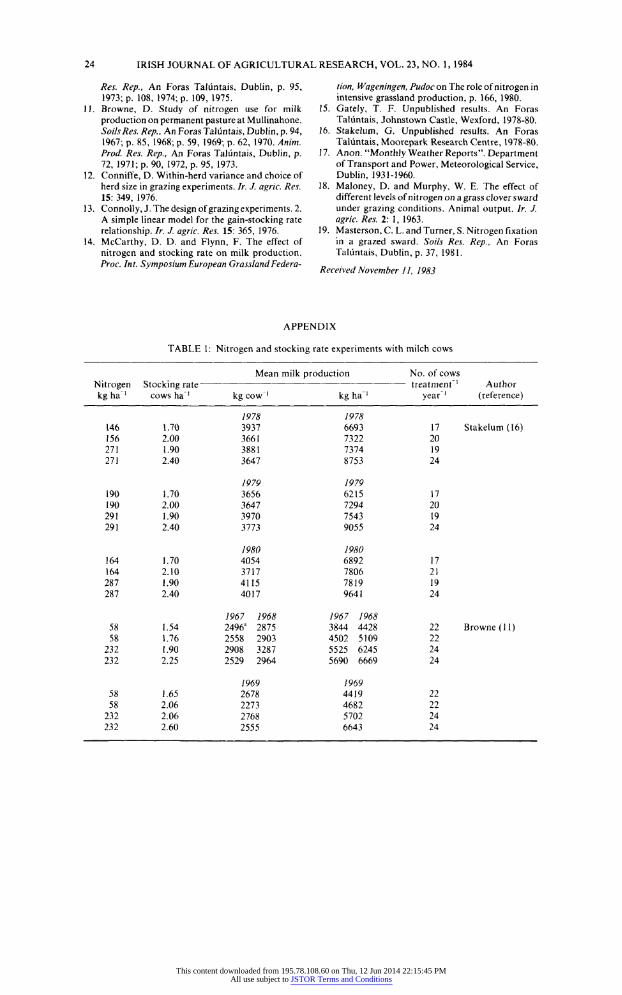
APPENDIX
TABLE 1: Nitrogen and stocking rate experiments with milch cows
Mean milk production No. of cows
Nitrogen Stocking rate- treatment"1 Author
kg ha ' cows ha"1 kg cow l kg ha"1 year"1 (reference)
1978 1978 146 1.70 3937 6693 17 Stakelum (16) 156 2.00 3661 7322 20
271 1.90 3881 7374 19 271 2.40 3647 8753 24
1979 1979 190 1.70 3656 6215 17 190 2.00 3647 7294 20
291 1.90 3970 7543 19 291 2.40 3773 9055 24
1980 1980 164 1.70 4054 6892 17 164 2.10 3717 7806 21
287 1.90 4115 7819 19 287 2.40 4017 9641 24
1967 1968 1967 1968 58 1.54 2496a 2875 3844 4428 22 Browne (11) 58 1.76 2558 2903 4502 5109 22
232 1.90 2908 3287 5525 6245 24 232 2.25 2529 2964 5690 6669 24
1969 1969 58 1.65 2678 4419 22 58 2.06 2273 4682 22
232 2.06 2768 5702 24 232 2.60 2555 6643 24
This content downloaded from 195.78.108.60 on Thu, 12 Jun 2014 22:15:45 PMAll use subject to JSTOR Terms and Conditions
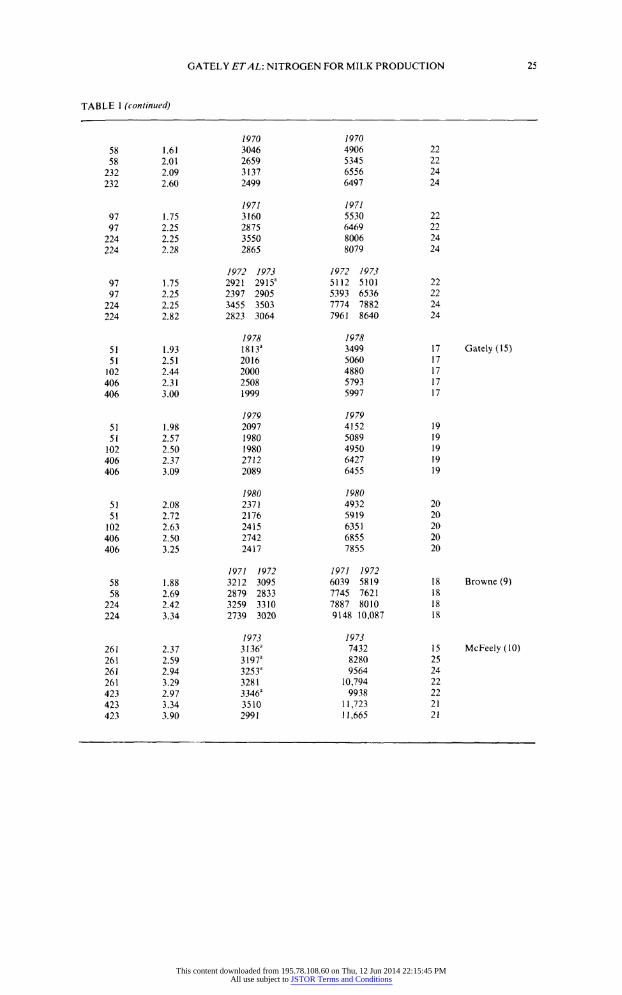
GATELY ETAL: NITROGEN FOR MILK PRODUCTION 25
TABLE 1 (continued)
1970 1970
58 1.61 3046 4906 22
58 2.01 2659 5345 22
232 2.09 3137 6556 24
232 2.60 2499 6497 24
1971 1971 97 1.75 3160 5530 22
97 2.25 2875 6469 22
224 2.25 3550 8006 24
224 2.28 2865 8079 24
1972 1973 1972 1973
97 1.75 2921 2915a 5112 5101 22
97 2.25 2397 2905 5393 6536 22
224 2.25 3455 3503 7774 7882 24
224 2.82 2823 3064 7961 8640 24
1978 1978
51 L93 1813a 3499 17 Gately (15) 51 2.51 2016 5060 17
102 2.44 2000 4880 17
406 2.31 2508 5793 17
406 3.00 1999 5997 17
1979 1979
51 1.98 2097 4152 19
51 2.57 1980 5089 19
102 2.50 1980 4950 19
406 2.37 2712 6427 19
406 3.09 2089 6455 19
1980 1980 51 2.08 2371 4932 20
51 2.72 2176 5919 20
102 2.63 2415 6351 20
406 2.50 2742 6855 20
406 3.25 2417 7855 20
1971 1972 1971 1972
58 1.88 3212 3095 6039 5819 18 Browne (9) 58 2.69 2879 2833 7745 7621 18
224 2.42 3259 3310 7887 8010 18
224 3.34 2739 3020 9148 10,087 18
1973 1973
261 2.37 3136a 7432 15 McFeely (10) 261 2.59 3197a 8280 25
261 2.94 3253a 9564 24
261 3.29 3281 10,794 22
423 2.97 3346" 9938 22
423 3.34 3510 11,723 21
423 3.90 2991 11,665 21
This content downloaded from 195.78.108.60 on Thu, 12 Jun 2014 22:15:45 PMAll use subject to JSTOR Terms and Conditions
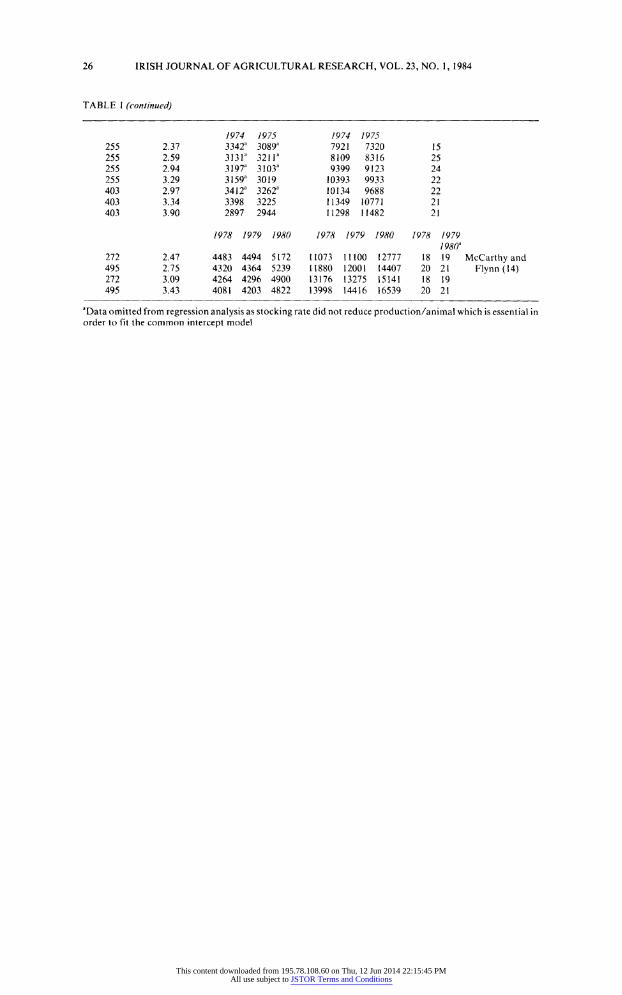
26 IRISH JOURNAL OF AGRICULTURAL RESEARCH, VOL. 23, NO. 1, 1984
TABLE 1 (continued)
1974 1975 1974 1975 255 2.37 3342a 3089a 7921 7320 15 255 2.59 3131" 3211a 8109 8316 25
255 2.94 3197a 3103a 9399 9123 24 255 3.29 3159a 3019 10393 9933 22 403 2.97 34i2a 3262a 10134 9688 22
403 3.34 3398 3225 11349 10771 21 403 3.90 2897 2944 11298 11482 21
1978 1979 1980 1978 1979 1980 1978 1979 1980a
272 2.47 4483 4494 5172 11073 11100 12777 18 19 McCarthy and 495 2.75 4320 4364 5239 II880 12001 14407 20 21 Flynn (14) 272 3.09 4264 4296 4900 13176 13275 15141 18 19 495 3.43 4081 4203 4822 13998 14416 16539 20 21
aData omitted from regression analysis as stocking rate did not reduce production/animal which is essential in order to Fit the common intercept model
This content downloaded from 195.78.108.60 on Thu, 12 Jun 2014 22:15:45 PMAll use subject to JSTOR Terms and Conditions